The Biomechanics of the Baseball Swing
|
|
|
- Gary Charles
- 5 years ago
- Views:
Transcription
1 University of Miami Scholarly Repository Open Access Dissertations Electronic Theses and Dissertations The Biomechanics of the Baseball Swing David Fortenbaugh University of Miami, Follow this and additional works at: Recommended Citation Fortenbaugh, David, "The Biomechanics of the Baseball Swing" (211). Open Access Dissertations This Open access is brought to you for free and open access by the Electronic Theses and Dissertations at Scholarly Repository. It has been accepted for inclusion in Open Access Dissertations by an authorized administrator of Scholarly Repository. For more information, please contact
2 UNIVERSITY OF MIAMI THE BIOMECHANICS OF THE BASEBALL SWING By David M. Fortenbaugh A DISSERTATION Submitted to the Faculty of the University of Miami in partial fulfillment of the requirements for the degree of Doctor of Philosophy Coral Gables, Florida May 211
3 211 David M. Fortenbaugh All Rights Reserved
4 UNIVERSITY OF MIAMI A dissertation submitted in partial fulfillment of the requirements for the degree of Doctor of Philosophy THE BIOMECHANICS OF THE BASEBALL SWING David M. Fortenbaugh Approved: Shihab Asfour, Ph.D. Professor of Industrial Engineering Terri A. Scandura, Ph.D. Dean of the Graduate School Khaled Abdelrahman, Ph.D. Assistant Scientist, Industrial Engineering Loren Latta, Ph.D. Professor of Orthopaedics Arzu Onar-Thomas, Ph.D. Associate Member Department of Biostatistics St. Jude Children s Research Hospital Memphis, Tennessee Glenn S. Fleisig, Ph.D. Research Director American Sports Medicine Institute Birmingham, Alabama
5 FORTENBAUGH, DAVID M. (Ph.D., Industrial Engineering) The Biomechanics of the Baseball Swing (May 211) Abstract of a dissertation at the University of Miami. Dissertation supervised by Professor Shihab Asfour. No. of pages in text. (235) Success in baseball batting is fundamental to the sport, however it remains one of, if not the most, challenging skills in sports to master. Batters utilize the kinetic chain to transfer energy from the lower body to the upper body to the bat, hoping to impart the maximum amount of energy into the ball. Scientists and coaches have researched the swing and developed theories on the keys for successful batting, but most of this research has been inadequate in attempting to fully describe the biomechanics of batting. The purposes of this study were to improve upon the methodology of previous researchers, provide a full biomechanical description of the swing, and compare swings against pitches thrown to different locations and at different speeds. AA-level Minor League Baseball players (n=43) took extended rounds of batting practice in an indoor laboratory against a pitcher throwing a mixture of fastballs and changeups. An eight camera motion analysis system and two force plates recording at 3 Hz captured the biomechanical data. The swing was divided into six phases (stance, stride, coiling, swing initiation, swing acceleration, and follow-through) by five key events (lead foot off, lead foot down, weight shift commitment, maximum front foot vertical ground reaction force, and batball contact). Twenty-eight kinematic measurements and six ground reaction force
6 measurements were computed based on the marker and force plate data, and all were assessed throughout the phases. First, a comprehensive description of a composite of the batters swings against fastballs down the middle was provided. Second, successful swings against fastballs thrown to one of five pitch locations (HIGH IN, HIGH OUT, LOW IN, LOW OUT, MIDDLE) were compared in terms of selected kinematics at the instant of bat-ball contact, timing and magnitude of peak kinematic velocities, and timing and magnitude of peak ground reaction forces. Third, these variables were once again compared for swings against fastballs and changeups. A large number of biomechanical differences were seen among the swings against various pitch locations. More fully rotated positions, particularly of the pelvis and bat were critical to the batters successes on inside pitches while less rotated positions keyed successes against outside pitches. The trail and lead arms worked together as part of a closed chain to drive the hand path. Successful swings had the trail elbow extended more for HIGH IN and flexed more for LOW OUT, though batters often struggled to execute this movement properly. A distinct pattern among successful swings against fastballs, successful swings against changeups, and unsuccessful swings against changeups was witnessed; namely a progressive delay in which the batter prematurely initiated the events of the kinetic chain, especially when unsuccessful in hitting a changeup. It was believed that this study was much more effective in capturing the essence of baseball batting than previous scientific works. Some recommendations to batting coaches would be to get batters to take a consistent approach in the early phases of every swing (particularly for the lower body), identify both pitch type and location as early as possible, use the rotation of the pelvis to
7 propagate the energy transfer of the kinetic chain from the group to the upper body, and use the pelvis, and subsequently, the upper body, to orient the trunk and hands to an optimal position to drive the ball to the desired field. Limitations of the current study and ideas for future work were also presented to better interpret the findings of this research and further connect science and sport.
8 TABLE OF CONTENTS Page LIST OF FIGURES... LIST OF TABLES... vi viii Chapter 1 INTRODUCTION Background Statement of the problem Purpose and significance of the study REVIEW OF LITERATURE Biomechanical studies of the baseball swing Kinematic studies of the baseball swing Primitive technology Kinematic studies of the baseball swing Modern technology Kinetic studies of the baseball swing Electromyographic (EMG) studies of the baseball swing Coaching and teaching the baseball swing Charley Lau s coaching philosophy Ted Williams coaching philosophy Coop DeRenne s coaching philosophy Teaching adjustments to pitch speed Teaching adjustments to pitch location Vision and cognition in batting Physical tools and training of baseball batters Strength, flexibility, and physical variables Training programs Weighted bats and warm-up swings Bat properties and the bat-ball collision METHODS Participants Instruments Procedures Data processing Statistical analysis RESULTS Biomechanical description of the swing Stance iii
9 4.1.2 Stride Coiling Swing Initiation Swing Acceleration Follow-Through Analysis of swing biomechanics with changes in pitch location Comparison of swings by pitch location Relationships between biomechanical parameters and BEV Lead knee flexion at BC Pelvis rotation at BC Upper trunk rotation with respect to the pelvis at BC Lead shoulder elevation at BC Lead shoulder azimuth at BC Trail elbow flexion at BC Bat lag at BC Bat elevation at BC Bat azimuth at BC Head rotation at BC Time of peak lead knee extension velocity Time of peak pelvis rotation velocity Time of peak upper trunk rotation velocity Time of peak lead shoulder azimuth velocity Time of peak trail elbow extension velocity Time of peak bat azimuth velocity Peak lead knee extension velocity Peak pelvis rotation velocity Peak upper trunk rotation velocity Peak lead shoulder azimuth velocity Peak trail elbow extension velocity Peak bat azimuth velocity Time of peak trail foot GRFx Time of peak trail foot GRFy Time of peak trail foot GRFz Time of peak lead foot GRFx Time of peak lead foot GRFy Time of peak lead foot GRFz Peak trail foot GRFx Peak trail foot GRFy Peak trail foot GRFz Peak lead foot GRFx Peak lead foot GRFy Peak lead foot GRFz Comparison of swings by pitch type iv
10 5 DISCUSSION Description of swing Modulation of swing to changes in pitch location Modulation of swing to changes in pitch type Limitations to previous and current research Conclusions Ideas for future work REFERENCES APPENDIX A: Informed Consent APPENDIX B: Diagrams of Kinematic Variables APPENDIX C: Motion Analysis Corporation Sky Scripts APPENDIX D: MATLAB Programming Codes APPENDIX E: Graphs of biomechanical data for the typical professional batter v
11 List of Figures Figure 1 American Sports Medicine Institute biomechanics lab setup Figure 2a Anterior view of marker placement... 5 Figure 2b Posterior view of marker placement... 5 Figure 3 Lead knee flexion angle at BC across BEV (raw data) Figure 4 Pelvis rotation angle at BC across BEV (raw data) Figure 5 Model estimate of average BEV across values of pelvis rotation angle at BC Figure 6 Upper trunk rotation angle at BC across BEV (raw data) Figure 7 Model estimate of average BEV across values of upper trunk rotation angle with respect to pelvis at BC Figure 8 Lead shoulder elevation angle at BC across BEV (raw data) Figure 9 Lead shoulder azimuth at BC across BEV (raw data) Figure 1 Model estimate of average BEV across values of lead shoulder azimuth at BC Figure 11 Trail elbow flexion angle at BC across BEV (raw data) Figure 12 Model estimate of average BEV across values of trail elbow flexion angle at BC... 8 Figure 13 Bat lag angle at BC across BEV (raw data) Figure 14 Model estimate of average BEV across values of bat lag angle at BC. 82 Figure 15 Bat elevation angle at BC across BEV (raw data) Figure 16 Bat azimuth at BC across BEV (raw data) Figure 17 Model estimate of average BEV across values of bat azimuth at BC Figure 18 Head rotation angle at BC across BEV (raw data) Figure 19 Model estimate of average BEV across values of head rotation angle at BC Figure 2 Time of peak lead knee extension velocity across BEV (raw data) Figure 21 Time of peak pelvis rotation velocity across BEV (raw data) Figure 22 Time of peak upper trunk rotation velocity across BEV (raw data)... 9 Figure 23 Model estimate of average BEV across values of time of peak upper trunk rotation velocity Figure 24 Time of peak lead shoulder azimuth velocity across BEV (raw data).. 92 Figure 25 Model estimate of average BEV across values of time of peak lead shoulder azimuth velocity at low PS Figure 26 Model estimate of average BEV across values of time of peak lead shoulder azimuth velocity at medium PS Figure 27 Model estimate of average BEV across values of time of peak lead shoulder azimuth velocity at high PS Figure 28 Time of peak trail elbow extension velocity across BEV (raw data) Figure 29 Model estimate of average BEV across values of time of peak trail elbow extension velocity Figure 3 Time of peak bat azimuth velocity across BEV (raw data) Figure 31 Model estimate of average BEV across values of time of peak bat azimuth velocity Figure 32 Peak lead knee extension velocity across BEV (raw data) vi
12 Figure 33 Peak pelvis rotation velocity across BEV (raw data)... 1 Figure 34 Model estimate of average BEV across values of peak pelvis rotation velocity Figure 35 Peak upper trunk rotation velocity across BEV (raw data) Figure 36 Peak lead shoulder azimuth velocity across BEV (raw data) Figure 37 Model estimate of average BEV across values of peak lead shoulder. azimuth velocity at low PS Figure 38 Model estimate of average BEV across values of peak lead shoulder. azimuth velocity at medium PS Figure 39 Model estimate of average BEV across values of peak lead shoulder. azimuth velocity at high PS Figure 4 Peak trail elbow extension velocity across BEV (raw data) Figure 41 Peak bat azimuth velocity across BEV (raw data) Figure 42 Model estimate of average BEV across values of peak bat azimuth velocity Figure 43 Time of peak trail foot GRFx across BEV (raw data) Figure 44 Time of peak trail foot GRFy across BEV (raw data) Figure 45 Time of peak trail foot GRFz across BEV (raw data) Figure 46 Time of peak lead foot GRFx across BEV (raw data) Figure 47 Model estimate of average BEV across values of time of peak lead foot GRFx Figure 48 Time of peak lead foot GRFy across BEV (raw data) Figure 49 Time of peak lead foot GRFz across BEV (raw data) Figure 5 Model estimate of average BEV across values of time of peak lead foot GRFz Figure 51 Peak trail foot GRFx across BEV (raw data) Figure 52 Peak trail foot GRFy across BEV (raw data) Figure 53 Model estimate of average BEV across values of peak trail foot GRFy 119 Figure 54 Peak trail foot GRFz across BEV (raw data) Figure 55 Model estimate of average BEV across values of peak trail foot GRFz 121 Figure 56 Peak lead foot GRFx across BEV (raw data) Figure 57 Peak lead foot GRFy across BEV (raw data) Figure 58 Model estimate of average BEV across values of peak lead foot GRFy 124 Figure 59 Peak lead foot GRFz across BEV (raw data) vii
13 List of Tables Table 1 Mean ± SD of kinematic angles at BC among the pitch locations Table 2 Mean ± SD of timing of peak kinematic velocities among the pitch locations Table 3 Mean ± SD of magnitude of peak kinematic velocities among the pitch locations Table 4 Mean ± SD of timing of peak GRF among the pitch locations Table 5 Mean ± SD of magnitude of peak GRF among the pitch locations Table 6 Analysis of variance for lead knee flexion angle at BC Table 7 Analysis of variance for pelvis rotation angle at BC Table 8 Analysis of variance for upper trunk rotation angle at BC Table 9 Analysis of variance for lead shoulder elevation angle at BC Table 1 Analysis of variance for lead shoulder azimuth at BC Table 11 Analysis of variance for trail elbow flexion angle at BC Table 12 Analysis of variance for bat lag angle at BC Table 13 Analysis of variance for bat elevation angle at BC Table 14 Analysis of variance for bat azimuth at BC Table 15 Analysis of variance for head rotation angle at BC Table 16 Analysis of variance for time of peak lead knee extension velocity Table 17 Analysis of variance for time of peak pelvis rotation velocity Table 18 Analysis of variance for time of peak upper trunk rotation velocity... 9 Table 19 Analysis of variance for time of peak lead shoulder azimuth velocity Table 2 Analysis of variance for time of peak trail elbow extension velocity Table 21 Analysis of variance for time of peak bat azimuth velocity Table 22 Analysis of variance for peak lead knee extension velocity Table 23 Analysis of variance for peak pelvis rotation velocity... 1 Table 24 Analysis of variance for peak upper trunk rotation velocity Table 25 Analysis of variance for peak lead shoulder azimuth velocity Table 26 Analysis of variance for peak trail elbow extension velocity Table 27 Analysis of variance for peak bat azimuth velocity Table 28 Analysis of variance for time of peak trail foot GRFx Table 29 Analysis of variance for time of peak trail foot GRFy Table 3 Analysis of variance for time of peak trail foot GRFz Table 31 Analysis of variance for time of peak lead foot GRFx Table 32 Analysis of variance for time of peak lead foot GRFy Table 33 Analysis of variance for time of peak lead foot GRFz Table 34 Analysis of variance for peak trail foot GRFx Table 35 Analysis of variance for peak trail foot GRFy Table 36 Analysis of variance for peak trail foot GRFz Table 37 Analysis of variance for peak lead foot GRFx Table 38 Analysis of variance for peak lead foot GRFy Table 39 Analysis of variance for peak lead foot GRFz Table 4 Mean ± SD of kinematic angles at BC among the three trial types Table 41 Mean ± SD of timing of peak kinematic velocity among the three trial types viii
14 Table 42 Mean ± SD of peak kinematic velocity magnitudes among the three trial types Table 43 Mean ± SD of timing of peak GRF among the three trial types Table 44 Mean ± SD of peak GRF magnitudes among the three trial types ix
15 CHAPTER 1 INTRODUCTION 1.1 Background As in most racquet/bat/stick sports, a baseball batter s objective is to deliver the maximum amount of energy possible at impact. This energy is then transferred to the ball, accelerating it to a high velocity (Adair, 22). The trajectory and velocity of the batted ball are the primary contributing factors to the result of the hit. A batted ball with high velocity can result in one of at least two successful outcomes, depending on the ball s trajectory. With a lower trajectory, the result is a hard ground ball or line drive; these types of hits can more easily pass by the infielders or at least significantly decrease the chance of them being successfully fielded. If the trajectory of the ball is higher, the ball can land deep in the outfield for an extra-base hit or possibly go over the fence for a homerun. All of these results are quite favorable for the batter. Energy is created by the batter through his utilization of the kinetic chain (Race, 1961; DeRenne, 1993). Linear and angular momentum are transferred from the ground up through the lower limbs, trunk, and upper limbs (i.e. the chain s links ) of the body. Each proximal segment passes its momentum to the connecting distal segment (e.g. upper arm to forearm to hand). To increase the resultant momentum, the muscles of the proximal segment provide an additional unique momentum before passing it to the next segment. In batting, the bat is gripped firmly at the hands, and the bat, in essence, becomes the final link of the kinetic chain. While the ultimate goal remains to maximize the linear and angular bat velocity, the kinetic chain theory clearly shows that each segment must do its part to contribute to the resultant bat velocity (DeRenne, 1993). 1
16 2 An essential component of the kinetic chain is the coordination, or timing pattern, of each of the links of the chain. Maximizing the velocity of each of the body segments is critical, but the transfer of momentum and energy can only be optimized if it is passed along at the right time (Feltner & Dapena, 1989). By transferring the energy too early or too late, the proximal segment is not travelling at its maximum velocity, reducing the total energy available to impart on the ball at contact. Further complicating the task for hitters is that incoming pitches are thrown by the pitcher with varying arm angles and speeds, creating a multitude of different potential planes of movement (Williams & Underwood, 1986). Hall of Fame pitcher Warren Spahn has famously been quoted as saying, Hitting is timing. Pitching is upsetting timing. In fact, the goal of an off-speed pitch, such as a changeup, is to fool the hitter by initially looking like a fastball, therefore upsetting his balance and timing when it arrives much later than anticipated (Baker, Mercer, & Bittinger, 1993; DeRenne, 1993). Adjusting the timing of the swing to the parameters affecting each pitch can often determine the result of the swing. Literature involving baseball batting has generally fallen into one of two categories: coaching and scientific. One goal of this dissertation is to stretch the findings across both worlds, linking what coaches believe and teach with what scientists should measure and evaluate and vice-versa. Coaches have developed a prolific number of materials describing their philosophies on hitting (Baker, Mercer & Bittinger, 1993; DeRenne, 1993; Gola & Monteleone, 21; Gwynn, 1998; Lau & Glossbrenner, 1984; Robson, 23; Williams & Underwood, 1986). Unfortunately, this massive amount of information is often overwhelming, and it takes a keen eye to decipher the commonalities among the varying philosophies. The perfect example of this is seen between the ideas of
17 3 two of the most respected hitting teachers, Ted Williams and Charlie Lau. Williams preached the importance of rotation in hitting (Williams & Underwood, 1986), while Lau emphasized weight shift and the linearity of hitting (Lau & Glossbrenner, 1984). Ironically, both mentioned linear and rotational components of the swing in their books, signifying that successful hitters indeed must incorporate both linear and rotational movements. This irony indicates that scientific research is needed to confirm what these or any other coaches teach. However, biomechanical data on hitting are somewhat limited. Early baseball swing analyses focused on simply defining the swing (Garhammer, 1983; Hirano, 1986). Welch et al. (1995) provided the first comprehensive biomechanical analysis of the baseball swing, though it was done with just seven hitters and all were right-handed and hit off of a tee. Newer studies have examined changes in swing mechanics off of a tee with variations in ball location (Tago et al., 26a; Tago et al., 26b). Other research has focused on a variety of specific subtopics such as the effect of grip strength on bat velocity (Hughes, Lyons & Mayo, 24; Hirano & Murata, 23), directional hitting (McIntyre & Pfautsch, 1982; Gelinas & Hoshizaki, 1988), and muscle activity during batting (Shaffer et al. 1993). Katsumata (27) identified modulations in GRF patterns when batters swung at fast and slow pitches in a randomized order (similar to a game). 1.2 Statement of the problem Batting is both a fundamental skill in the sport of baseball and yet one of its most challenging skills to develop. It is a complex, highly-coordinated multi-joint movement that requires an athlete to accurately strike a ball that can be thrown at different speeds
18 4 and to different locations with varying trajectories. Thousands of coaches have attempted to teach hitters how to develop this skill based on their own experiences and intuition (Baker, Mercer & Bittinger, 1993; DeRenne, 1993; Gola & Monteleone, 21; Gwynn, 1998; Lau & Glossbrenner, 1984; Robson, 23; Williams & Underwood, 1986). Very little scientific research has explored the mechanics of the swing to assess how the most successful athletes are able to execute this skill. The majority of previous biomechanical research on the baseball swing has also had limitations in methodology. These limitations have confounded the results and threatened both internal and external validity. The most notable limitation has been that no biomechanical studies have observed the kinematics and kinetics of swings against live pitching. Instead, researchers have analyzed hitting off of a tee (Escamilla et al., 29a,b; Hughes, Lyons, & Mayo, 24; McLean & Reeder, 2; Noble & Harms, 24; Tago et al., 26a; Tago et al., 26b; Welch et al., 1995), against soft-toss (Hirano & Murata, 23), and against pitching machines (Katsumata, 27; McIntyre & Pfautsch, 1982) for convenience of testing. Coaching literature emphasizes that hitting against live pitching is ideal because it most accurately represents game situations (Robson, 23). The methods used in the previous research disrupt or negate many of the temporal components of the swing that make successfully hitting a baseball the single most difficult thing to do in sport (Mihoces, 23; Williams & Underwood, 1986). While tee and soft toss drills are noticeably different than live pitching, some may contend that the pitching machine is similar enough. However, coaches tend to disagree (Robson, 23) and Jinji & Sakurai (26) confirmed differences in incoming ball flight patterns between pitched baseballs and those fed through a pitching machine. Furthermore, testing of a
19 5 modified pitching machine that more closely simulated real-life pitching resulted in significantly better batting performance than a traditional pitching machine (Liu et al., 25). The researchers of that study noted how batters are often confused by the unnatural timing of the ball s release by traditional pitching machines. Other deficiencies in methodology from the aforementioned biomechanical studies include the lack of variability in pitches (location, speed, and type) and in participants (anthropometrics, age and/or skill level, and handedness). One final limitation is that while the Welch et al. (1995) study collected threedimensional motion capture at 2 Hz, no other study has collected similar data at faster than 12 Hz. To illustrate how variability in frame rates affects data collection, one may notice that with distal-end linear bat velocities of at least 35 m/s (Nicholls et al., 23), 2 Hz equates to at least 18 cm of distance travelled per frame, and 12 Hz equates to over 29 cm per frame. Higher frame rates can capture the hidden data that are lost in between frames or estimated when captured at lower rates. Baseball batting is such a dynamic and explosive movement that frame rates of 2 Hz should be the minimum capture frame rate. It is understandable that not all parameters can be included without exponentially complicating the data collection and analysis, but a more accurate and well-defined database needs to be developed to in order to model the baseball swing biomechanically. Understanding how batters adjust their swings to changes in pitch speed and location will give coaches and athletes insights on how to correct flaws and improve performance.
20 6 1.3 Purpose and significance of the study The purposes of this study were to thoroughly describe the baseball swing biomechanically and subsequently analyze changes in batting mechanics with changes in pitch location and speed. A single protocol in which pitch speed and location were both manipulated by a batting practice pitcher was followed in order to independently address each of these two variations while more accurately representing a game situation. The development of an elite database of biomechanical data on professional hitters swings against fastballs down the middle (the most common pitch type and location) will set the foundation for how to interpret flaws in less skilled hitters. Understanding the variability in swing mechanics with changes in pitch location will give insights on how batters must manipulate their standard mechanics when pitchers keep fastballs away from the middle of the plate and near waist level. Lastly, a comparison of successful swings against fastballs and changeups will showcase the adjustments batters make when correctly identifying the type of pitch thrown. Analysis of unsuccessful swings will be able to show the mechanical breakdowns that occur when batters identify the pitch too late and/or are unable to properly adjust their swing.
21 CHAPTER 2 REVIEW OF LITERATURE This study was the first comprehensive attempt to biomechanically analyze baseball batters taking swings against live pitching. The first section of this literature review ( ) will summarize previous biomechanical research studies of the baseball swing. While this first section is seemingly the most relevant to the current study, it is important to incorporate other approaches to studying baseball players and the skills required to hit a baseball. The second section (2.2) will review the philosophies of some well-known hitting coaches and discuss how they teach the fundamentals of hitting. The third section (2.3) will focus on scientific research studies of visual acuity and mental preparation of hitters. The fourth section (2.4) will explore the science behind the strength, conditioning, and physical make-up of baseball batters. The fifth and final section (2.5) will briefly examine some of the relevant research on bat properties and the physics involved in the collision between the bat and ball. Together, these five sections should encompass all of the critical aspects for being a successful hitter. 2.1 Biomechanical studies of the baseball swing Three of the major subdivisions of the field of biomechanics are kinematics, kinetics, and electromyography. As Winter (199) defines it, kinematics simply describes human movement without regard to forces. These commonly include linear and angular displacements, velocities, and accelerations. The study of the forces that cause movement and the resultant energy is kinetics (Winter, 199). Using a full kinematic description, anthropometric measurements, and external forces, joint reaction 7
22 8 forces and muscle moments can be estimated. To track muscle activity, one must study electromyograms (EMGs). These are the electrical signals associated with muscle contractions, and their study is referred to as electromyography (Winter, 199). These three components of biomechanics have all been explored, to different extents, with baseball swings. The following subsections will review the findings in these three areas Kinematic studies of the baseball swing Primitive technology The earliest biomechanical studies of the baseball swing were done as twodimensional analyses of cinematographic film. Despite the limitations of using such technologies, some of the fundamentals of the swing were established scientifically. Race (1961) introduced the biomechanical principle of the kinetic chain to baseball batting and gave a general quantitative and qualitative analysis of the swing. Swimley (1964) found that the swing of a power hitter, who typically pulls the ball to the same side of the field as his batter s box (left field for a right-handed hitter) had greater pelvis angular velocity than that of a hitter who tries to hit to all fields. Breen (1967) found five commonalities among outstanding Major League hitters: the center of gravity remains on a fairly level plane, head movements are adjusted from pitch to pitch to maximize ball tracking time, the leading elbow straightens at the beginning of the swing to increase bat velocity, the stride length is constant for all pitches, and after ball contact the upper body is pointed in the same direction as the hit with the weight shifted to the front foot. In one of the first prospective biomechanical analyses, Hirano (1986) attempted to differentiate skilled hitters from unskilled hitters. Hitters were pitched balls while a 16 mm camera filming at 2 Hz placed approximately 1 m overhead recorded movements
23 9 in the horizontal plane. The skilled hitters demonstrated a rapid increase of linear bat velocity just before ball contact while the unskilled hitters bat acceleration was more gradual. The skilled hitters were more efficient than the unskilled hitters, creating more mechanical energy (274 J to 228 J). This was further explained because the unskilled hitters had lower maximum pelvis angular velocity and extended their elbows and wrists earlier, which created a greater moment of inertia and slowed their bodies down more. This study was limited not only by the data collection method (one 16 mm camera filming at 2 Hz in the horizontal plane), but there were also only five skilled hitters and two unskilled hitters in this analysis. Following Swimley s (1964) work, a pair of studies prospectively compared swings of same-field and opposite-field hitting. McIntyre & Pfautsch (1982) filmed 2 current or former college-level right-handed hitters. A college coach divided the two groups into effective and ineffective opposite-field hitters, and a pitching machine delivered balls to the hitters. Also filming in a horizontal plane, x- and y-coordinates of the bat, wrist, elbow, shoulder and ball were obtained, and displacement from the rear corner of home plate and angular orientations of the segments and joints of interest were calculated. Significant differences were found neither between effective and ineffective opposite-field hitters (i.e. skill level) nor in the interaction of skill level and field hit direction. However, significant differences were found between same-field and oppositefield hits. Same-field hits had significantly more movement time from initiation to ball contact, significantly more angular displacement of the bat, lead hand, and lead forearm at the instant prior to ball contact, and significantly less maximum angular velocity of the bat, lead hand, and lead upper arm. The researchers concluded that the batters adjusted
24 1 the amount of lead elbow extension and altered the orientation of the left wrist joint so that the bat was at an appropriate orientation at the instant of ball contact. Gelinas and Hoshizaki (1988) analyzed one Major League hitter rated as an effective opposite-field hitter. Balls were delivered at 12 km/h from a pitching machine while a camera filming at 2 Hz hung approximately 5m over the participant s head as he hit. Results were calculated at the instant of ball contact. Supporting the findings of McIntyre & Pfautsch (1982), same-field hits required significantly more angular displacement of the bat (approximately 3 more), pelvis (approximately 14 more), upper trunk (approximately 11 more), and the angle between the bat and lead forearm (approximately 2 more). No differences were seen in the angles of the lead shoulder and elbow. Again, these studies were limited because of the use of 2-D cinematography and a pitching machine. Timing and hand-eye coordination are a critical component to the success of a batter, especially because of the ability of the pitcher to change the speed and location of the ball. Matsuo, Kasai, & Asami (1993) did some preliminary investigations on the compensations hitters made when given a simulated hitting task randomized at two different velocities (13 km/h and 1 km/h). Using a series of LEDs aligned along a 15.5 m rail to simulate a pitched baseball, batters (n=9) swung while photocells captured the timing of the bat. Since no real ball was contacted, players were given feedback after every swing as to whether they were early or late and approximately how much. Baseline measurements were compared to data taken after a month of regular exposure to the testing procedure. Results between pre- and post-training sessions showed that the practice did lead to better performance, though no control group was assessed. It was
25 11 also noted that there was a faster adaptation to successfully time the slower velocity than the faster velocity. Beginning the swing earlier and then adjusting the movement time to the pitch speed seemed to be the best way to improve. Using the same simulated hitting task, Matsuo & Kasai (1994) further discovered that the first movement did not occur at different times despite changes in the simulated ball s velocity and that the movement time varied among trials of the same velocity of simulated balls. These researchers also confirmed that while there was some variability in the timing of early body and bat movements based on personal preference and style, the movements that occurred near impact that accelerated the bat to its maximum velocity were similar across all participants. Although these studies were limited because they were not studying actual batting, their findings also supported an anecdotal theory that all hitters, especially good hitters, have some unified underlying mechanism that enables them to successfully hit the ball despite a variety of stances and approaches. Many variables can influence the bat s maximum velocity, and a few other studies using early biomechanics technology isolated a few of these factors for comparison: handedness, batting stance, and experience. McLean & Reeder (2) studied 11 collegiate switch-hitters with one overhead camera recording swings off of a tee at 6 Hz in the transverse plane. Hand dominance was determined from a validated survey. No significant differences were found in bat speed or segment rotational velocities between dominant and non-dominant sides. LaBranche (1994) tracked the two-dimensional motions of the bat and the response times of 17 college hitters as they took swings off of a batting tee with their feet aligned in a closed, even, and open stance. No significant differences were found in bat velocity, but the response times for the closed and even
26 12 stances were significantly less, indicating that these stances produced faster swings than the open stance. As with previous research, both of these studies were also limited because of the video technology and the protocol of hitting off of a tee Kinematics studies of the baseball swing Modern technology A landmark study in the biomechanics of baseball batting was conducted in 1995 when Welch and colleagues were the first to use a three-dimensional motion analysis system to analyze the baseball swing. Collecting at 2 Hz, they tracked 23 markers placed on the body, bat, and ball of seven professional, right-handed hitters as they swung off of a batting tee. The X axis was in line with home plate and the pitching rubber while the Z axis was vertical, and the Y axis was their cross-product. Three line drives up the middle were analyzed for each participant, and the batting events of lead foot off, lead foot down, and ball contact were used as temporal markers. The kinematic variables measured were stride length and direction, flexion and extension at the elbows and knees, rotation of the pelvis, upper trunk, arms (a vector from the mid-shoulders to the mid-wrists), and a bat lag angle defined as the absolute angle between the longitudinal axis of the bat and the arms vector. A sequence of events was delineated to describe the rotational and linear loading and acceleration components of the swing starting with lead foot off ( 57 ms relative to ball contact). The loading phase contained maximum pelvis rotation (18 degrees off the X axis at 35 ms), maximum upper trunk rotation (3 at 265 ms), and maximum arm rotation (15 at 23 ms). After the lead foot came back down ( 175 ms) with a slightly closed (12 ) stride of approximately 85 cm in length, there was a maximum pelvis rotation velocity (714 /s at 75 ms),
27 13 maximum upper trunk and arm rotational velocities (937º/s and 116º/s at 65 ms, respectively), maximum Y and Z components of bat linear velocity (19 m/s and 16 m/s at 4 ms, respectively), maximum bat lag rotational velocity (1588 /s at 2 ms), and finally maximum bat linear velocity and maximum lead elbow extension velocity (31 m/s and 948 /s, respectively, at 15 ms). The X component of maximum bat linear velocity was achieved at 5 ms while the maximum back elbow extension velocity was achieved at +5 ms. This series of events gave solid evidence as to the existence of the kinetic chain in the baseball swing, as the summation of rotational components done in coordination generated the acceleration necessary to drive the bat through the hitting zone. While the reseachers noted that the swings were performed off of a tee to eliminate variables such as the hitter s ability to recognize, react and adjust to pitched baseball, it is likely that this lack of realism, along with fairly low sample size, were the major limitations of the study. The research by Dragoo (24) advanced the knowledge of changes in biomechanics and neuromusclar control at different stages of development. Five cameras collecting at 6 Hz tracked reflective markers to calculate, among other variables, maximum pelvis rotation velocity (MPRV), maximum upper trunk rotation velocity (MUTRV), linear bat velocity (LBV), and ball exit velocity after contact (BEV) of hitters at one of three levels of experience: college, high school, and youth. The fastest bat and ball speeds were executed by the college group (MPRV = 42º/s; MUTRV = 539º/s; LBV = 2 m/s; BEV = 57 m/s). The high school group had slightly faster body segment rotational velocities but lower bat and ball speeds (MPRV = 47º/s; MUTRV = 581º/s; LBV = 19 m/s; BEV = 48 m/s). The youth group was significantly slower in all
28 14 velocities (MPRV = 32º/s; MUTRV = 42º/s; LBV = 15 m/s; BEV = 4 m/s). There were no significant differences reported in maximum bat angular velocities among college (1199º/s), high school (1233º/s), and youth (1151º/s) hitters. In a separate test, a non-significant trend of faster reaction time was seen from youth (315 ms) to high school (288 ms) to college (278 ms). The results of this study were limited by the capture frame rate since 6 Hz is fairly slow for such a dynamic movement as baseball batting. A group of studies done in the mid 2s (Tago, Ae, & Koike, 25; Tago et al., 26a; Tago et al., 26b) focused on the biomechanical changes brought about by placing the ball in various pitch locations. Three-dimensional kinematics of 1 righthanded college hitters were calculated with a nine-camera motion analysis system collecting at 12 Hz. The ball was placed on a tee at random in one of the nine locations of the strike zone (low, middle or high crossed with inside, middle, or outside). At least five trials per locations were collected, with the best trial for each location selected for analysis. The researchers classified the phases of the swing, noting seven specific events: take-back start ( 12 ms to 113 ms relative to impact), toe-off ( 94 ms to 82 ms), knee high ( 63 ms to 56 ms), toe-on ( 24 ms to 21 ms), swing start ( 22 ms to 18 ms), left upper arm parallel ( 11 ms to 7 ms), and impact. There were no significant differences in ball exit velocity among inside, middle, and outside hits. At the instant of left upper arm parallel, inside pitches had significantly more back hip flexion, back knee flexion, and lead ankle extension. At impact, inside pitches had significantly less back hip abduction and more lead knee extension and lead ankle extension. There were significantly larger pelvis and upper trunk orientation angles (more open) on inside hits from the toe-on event through impact. Low balls had
29 15 significantly greater ball exit velocity than middle and high balls. From toe-on through impact high balls had significantly less back hip flexion than low balls. From swing start to impact high balls had significantly less lead hip flexion than low balls. Compared to low balls, at left upper arm parallel and impact high balls also had significantly more back shoulder flexion, less lead shoulder horizontal adduction, and less lead elbow extension. A significantly larger upper trunk orientation angle was also seen at impact on high balls compared to low balls. Unfortunately, no exact kinematic values were published in these studies (only graphs were presented). The studies were also limited by a low frame rate and use of only a batting tee. Two studies published in 29 (Escamilla et al., 29a; Escamilla et al., 29b) compared a group of right-handed adult hitters in two respects: once as a within-subjects test between normal and choke-up grips, and once as a between-subjects test against a group of youth hitters. Using two cameras recording at 12 Hz, machine-pitched balls were delivered to the batters from approximately 13.7 m at a speed of 32.6 m/s to 33.5 m/s (reduced to 28.2 m/s to 29.1 m/s for youths) for ten full-effort swings that had to have produced at least three hits that travelled at least 68.6 m towards left-center field. In the comparison of bat grips, the choke-up grip had a quicker stride and swing, a more open upper trunk and closed pelvis, and greater trail elbow extension velocity but significantly less linear bat velocity. When comparing youth and adult hitters, some notable differences were that the adults had significantly longer stride and swing phases, greater velocities of lead knee flexion (386 /s to 33 /s), lead elbow extension (752 /s to 598 /s) and upper trunk rotation (857 /s to 717 /s), and greater linear bat velocity (3 m/s
30 16 to 25 m/s). The researchers concluded that adults and youths had significantly different swing mechanics Kinetic studies of the baseball swing The first known study of the GRFs experienced in baseball batting was done by Mason (1985), who tested the senior Men s Australian baseball team (exact number of participants not reported in study). The swing was divided into four phases: waiting, preparative hitting, swing, and follow-through. Force plates sampling at 1 Hz recorded swings against live pitching. In the waiting phase, it was reported that significantly more weight was placed on the front foot than the back foot (approximately 65% BW to 35% BW). Some batters (approximately 3%) remained fairly motionless while the rest (approximately 7%) had a distinctive sway, or constant transfer of weight back and forth between the feet. The preparative hitting phase began at 8 ms to 4 ms relative to ball contact, with the front foot staying in the air for 15 ms to 3 ms and landing back on the ground at 3 ms to 2 ms before contact. During the swing phase, the back foot generated a maximum horizontal force of 3% to 5% BW, while the front foot generated 6% to 12% BW of horizontal force. A peak vertical force of two to two and a half times body weight was also generated by the front foot at 1 ms. This study had a number of limitations, though the most notable was a lack of synchronicity in kinematic and kinetic data to allow for accurate interpretation of the timing of events. The descriptive biomechanical study by Welch and colleagues (1995) also included analysis of the ground reaction forces (GRFs), centers of pressure (COP) and
31 17 mass (COM) in baseball batting. With force plates under each foot sampling at 1 Hz, component (X, Y, and Z axis) and resultant forces were measured at three points (foot off, foot down, and ball contact) during swings off of a tee. The X axis pointed from home plate towards the pitching rubber, the Z axis pointed up, and the Y axis was the cross product, Z x X. As the front foot lifted off the ground, the batter shifted his weight to the back foot to about 862 N of total force, or 12% of body weight (BW). This was applied as 146 N of shear force in the negative X direction, 26 N in the positive Y direction, and 848 N in the negative Z direction. At this time the COP had shifted towards the right foot to a point 2 cm behind the COM. The front foot subsequently returned to the ground with a total force of 17 N (123% BW), with 292 N of shear force in the positive X direction, 28 N in the negative Y direction, and 917 N in the negative Z direction. The back foot now supplied 497 N (58% BW) of total force (-8 N in X, +184 N in Y, and -438 N in Z), about half as much total force as the front foot. This weight transfer was also seen in a dramatic forward shift of the COP to a point 2 cm ahead of the COM. At ball contact, the front foot applied 79 N (84% BW) of total force (+153 N in X, +28 N in Y, and -672 N in Z) and the back foot applied 147 N (16% BW) of total force (+16 N in X, -1 N in Y, and -139 N in Z). The COP moved a bit more forward to be 24 cm ahead of the COM. A later study by Yanai (27) also showed the GRF contributions from the legs, particularly the resistance provided by the front leg in order for the body to powerfully rotate against it. Dragoo (24) used force plate data collecting at 12 Hz to track the COP and neuromechanics of batters during swings against a pitching machine. Graphing XY scatter plots of COP to calculate distance travelled and velocity, response time was
32 18 recorded as the first spike in velocity after ball release. The number of spikes of acceleration (SOA) and the temporal location of the last spike (LOLS) were measured. Data were collected on youth, high school, and college hitters, and group comparisons were made. There were significant differences in response time and total excursion of COP in the X and Y directions (the X axis pointed from home plate to the pitching rubber), but not in the number of SOAs or the LOLS. College hitters had the longest delay in response time (198 ms), while high school hitters had an earlier initial reaction (19 ms), and the youth hitters were earlier still (177 ms). This longer viewing time purportedly gave college hitters more time to decide how to approach the ball. College hitters, compared to high school and youth, respectively, also had the greatest total COPx excursion (5 mm, 39 mm, 28 mm) and total COPy excursion (189 mm, 17 mm, 81 mm), indicating more weight transfer. This supports Welch and colleagues (1995) work of a pronounced weight shift in order to generate bat speed and ball exit velocity. Katsumata (27) also used vertical GRFs to describe the coordinative structure in baseball batting. Right-handed college hitters (n=6) stood atop two force plates and swung at machine-pitched balls of two different speeds in three sessions. The first session delivered only fast pitches (approximately 32.2 m/s), the second session delivered only slow pitches (approximately 2.3 m/s), and the third session randomly delivered fast and slow pitches. The first two sessions were referred to as Monopitch conditions and the third was called Mix-pitch condition. Four events were defined by the researcher as stepping, landing, swing and impact. The results showed that temporal patterns of GRFs were similar across until task conditions except in between the time of landing and weighting, or shifting the weight to the front foot. The
33 19 time from landing to weighting was significantly longer in the Mix-slow condition (4 ms) and followed by Mono-slow (27 s), with no difference between the Mix-fast (6 ms) and Mono-fast (7 ms) conditions. This difference was identified as the control mechanism for adjustments made to pitch speed. Results also indicated that the time from swing to impact was significantly shorter on fast pitches, but that the swing time could still be modulated after the initiation of the swing. The researchers were also interested in determining the differences in successful and unsuccessful hits, but technological difficulties restricted them to analysis of successful swings only. Only one study to date has looked at changes in GRFs with changes in pitch location (Fortenbaugh & Fleisig, 28). College batters (n=9) took five swings each off of a tee from the nine subzones of the strike zone previously discussed by Tago and colleagues (26a; 26b). With a force plate under each foot at sampling at 125 Hz, the X axis pointed from home plate towards the pitching rubber, the Z axis was vertical, and the Y axis was their cross-product, Z x X. Some statistically significant differences among pitch locations were reported, but the researchers concluded that since the magnitude of the changes was no more than 5% BW (roughly 5 N), the findings were clinically insignificant. An average timeline of the GRFs was reported. The front foot initially generated a push of 18% BW along in the negative X direction 115 ms relative to impact to load more weight onto the back foot. This weight then began to be transferred forward at 41 ms with a back foot push in the positive X direction of 16% BW. Around 12 ms, the feet stabilized the body in the Y axis with opposing forces (front foot -32% BW; back foot +24% BW). The initiation of the power to be transmitted through the kinetic chain came around 8 ms from a peak front foot vertical force of
34 2 126% BW and GRFs in the X direction from both feet (front foot -39% BW; back foot +13% BW). This study, like others, was limited by its collection of data from swings off of a tee Electromyographic (EMG) studies of the baseball swing There are only a handful of known EMG studies on baseball swings. The first was carried out by Kitzman in He tracked the bilateral function of the pectoralis major, triceps brachii, and latissimus dorsi muscles in two professional players versus two novices. Limited results showed qualitatively that these muscles were engaged in the early part of the swing while other muscles (not measured) took over in the later part of the swing to drive the bat through the hitting zone. Another qualitative analysis of one unskilled batter by Broer and Houtz (1967) noted the importance of the abdominal muscles in stabilizing the trunk during the swing. A study by Kauffman & Greenisen (1973) on comparing muscle activity when using weighted and unweighted bats found no evidence that swinging weighted bats before at-bats in games was beneficial. Shaffer and colleagues (1993) provided the most comprehensive and quantitative view of muscle activity during the swing. Fine wire electrodes recorded EMG signals of the lower gluteus maximus of the back leg and the supraspinatus, triceps, posterior deltoid, and middle serratus anterior of the lead arm during the live swings of 18 professional hitters. Surface electrodes were concurrently placed on the erector spinae and abdominal obliques, and vastus medialis obliques (VMOs), semimembranosus and biceps femoris of the back leg. As with many of the kinematic and kinetic studies, the researchers divided the swing into four phases: windup, pre-swing, swing (later
35 21 classified as early swing, middle swing, and late swing), and follow-through. The hamstring and gluteal muscles had high activity (as compared to values of a maximum muscle test, or MMT) during pre-swing and the early part of the swing phases, with values between 1% and 15% MMT. The VMOs contracted at roughly 95% to 11% MMT during the swing and follow-through. In the trunk, erector spinae activity ranged from approximately 85% to 185% MMT during the pre-swing and swing phases, while the abdominal obliques were over 1% MMT during the pre-swing, swing, and followthrough phases. In the upper body, the supraspinatus and serratus anterior muscles showed low activity (less than 4% MMT), while the posterior deltoid was most active (8% to 1% MMT) in the pre-swing and swing phases and the triceps was most active (over 9% MMT) in just the early part of the swing phase. It was concluded that the hamstring and gluteal muscles contribute to a stable base and drive the power thrust that uncoils the torso during the swing, while the sustained high activity of the trunk muscles suggested that they should be the focus of exercise and conditioning programs for hitters. It was believed that, contrary to popular beliefs, the upper extremity muscles were important for positioning the arms and hands rather than generating power with them. 2.2 Coaching and teaching the baseball swing While little scientific research has been done on swing mechanics, there have literally been millions of coaches over the course of the 15+ years of baseball s existence, and they have generated countless ways to teach the mechanics of the swing. It is foreseeable that a significant amount of overlap exists in the concepts that coaches teach, and that different terminologies are used to describe these concepts. It is useful for
36 22 researchers to understand the language of coaches in order to interpret them into biomechanical terms and develop practical studies. The following is a brief summary of the key points of a few of the more legendary coaches of the last 5 years. Specific instructional points are also gathered and reported on the adjustments to pitch speed and location that coaches teach Charley Lau s coaching philosophy Though never a successful professional player himself, many people respected Charley Lau as one of, if not the best, hitting coach of the second half of the 2 th century. He published numerous materials advocating his teachings, and among them are his 1 Absolutes of hitting (Lau & Glossbrenner, 1984). These are the concepts that Lau believes all good hitters share and need to continue to be successful. The first two Absolutes are to have a balanced, workable stance with rhythm and movement. The feet are parallel and shoulder-width apart, and the weight is distributed in such a way so that the hitter can move without falling over and can easily overcome the body s inertia. The third Absolute is to shift the weight forward from a firm, rigid back side to a firm, rigid front side, and the fourth is to have the hitter think about keeping his front toe closed, rather than opening it up to point towards the pitcher. These two Absolutes help create a solid stable base during the acceleration phase of the swing. After looking at thousands of hours of videotapes of the game s best hitters, Lau sees the fifth Absolute of hitting as getting the bat into the launching position when the front foot touches down. This means the top hand is at upper chest level and just off the rear tip of the back shoulder, and the bat is held at a 45 angle. The sixth and seventh Absolutes are more mental than
37 23 physical: a confident, focused, and aggressive attack when the pitch is delivered and a tension-free swing. These two concepts put the hitter in the proper frame of mind and give him a good attitude as he approaches each pitch in each at-bat. Lau believes the eighth Absolute, keeping the head down during the swing, is the most important of all of the Absolutes. By tracking the ball for as long as possible, the hitter is able to concentrate on exactly where to direct his swing. While Lau admits that what he really wants is for the head to stay stationary rather than actually moving down, he believes this cue seems to accomplish the goal more effectively. The ninth Absolute, using the whole field rather than trying to pull the ball over the fence every time, can quickly break down a hitter s mechanics if not executed consistently. The tenth and final Absolute, a signature coaching tip of Lau, is to hit through the ball and finish high, that is to let go of the bat with the top hand after contact and have the bottom hand follow through up near head height. He teaches this to allow the lead arm to fully extend and to prevent the top hand from rolling over the bottom hand too soon Ted Williams coaching philosophy While Charlie Lau was really known only as a batting coach, Ted Williams transitioned from one of the greatest hitters of all-time into a highly-respected hitting coach. In his book, The Science of Hitting (Williams & Underwood, 1986), Williams blended his experiences as a coach and player with the fundamentals that he would teach to other hitters. Williams preached self-education, recognizing that a hitter needs to learn from each at-bat, knowing situations, and knowing his own strengths and weaknesses. Williams saw himself as a very hands-off type of coach, only
38 24 occasionally making small suggestions on mechanics while mostly letting the hitters make their own adjustments. He believed each hitter had to naturally adapt his swing to his body size and strength. Most of Williams corrections were about the mental approach: what pitches to swing at and when; and how to recognize different pitches. His three rules were to get a good pitch to hit, think properly prior to an at-bat using the information learned from previous experiences with the current pitcher and similar ones, and to be quick with the bat. As for mechanics, Williams was not opposed to variability in just about every facet of the swing, from different stances with the feet, to hand, arm, and bat position. However, the most important mechanical detail he preached was to have a slight backward hip-cock followed by a powerful forward hip rotation into the ball. This, he said, is where the real power is generated, while the wrists, forearms, and hands then contribute very little, and merely passing the energy along through the bat Coop DeRenne s coaching philosophy Unlike Lau and Williams, Coop DeRenne s background has been rooted more in academia, and he has used science to study and teach hitting mechanics. One very important thing that DeRenne noted in his famous text High Tech Hitting: Science vs. Tradition (1993), is the issue of semantics: each coach may have unique vocabulary, so two can describe the same thing quite differently, often leading to misinterpretations by the hitters. As well, coaches often tend to emphasize one component of the swing and neglect others, and DeRenne insisted on treating all parts of the swing as equally important. While DeRenne noted that most people know Charlie Lau as a proponent of
39 25 weight transfer (linear motion) and Williams as a proponent of rotation, DeRenne s research consistently showed that hitting is a fluid sequential motion involving two movements working in tandem straight forward or linear and then angular or rotation. DeRenne s research also led to the development of his four biomechanical absolutes: dynamic balance, the kinetic link (i.e. kinetic chain), bat lag, and rotation. Good dynamic balance means having the body s center of gravity between the feet, not entirely on one foot or the other, throughout the whole swing. Hitters should end their weight shift as the front foot lands and begin rotating against a firm front side. By not continuing to drift forward, the hitter can better keep his head focused on tracking the incoming pitch. As the pitch comes in, an ideal kinetic chain will produce high bat velocity by transferring energy from the strong body segments (the legs and trunk) to the proportionally smaller and faster moving arms and to the bat. While he believed that the hands are important for initiating the swing and stabilizing the bat, DeRenne asserted that the hands and forearms simply cannot contract fast enough during the ballistic movement of the swing to contribute much unique energy to the kinetic chain. As the bat moves from the launching position to ball contact, the hitters hands should take the knob of the bat directly towards the ball, which pushes the hands ahead of the barrel of the bat and creates bat lag. Once the hands are in this forward linear position, the wrists should snap the bat through a 9 degree arc to the contact area. While the hands are coming through, the body should turn about the axis of rotation. This is an imaginary vertical line that, when balanced, passes through the head, center of gravity, and equidistant between the feet.
40 Teaching adjustments to pitch speed Hitters must constantly be aware of the full repertoire of pitches that an opposing pitcher may deliver and make adjustments to their swing accordingly. The most common way to teach hitters how to adapt their swing to different pitch types is to prepare for a fastball and then react to an off-speed pitch (Baker, Mercer, & Bittinger, 1993; Gwynn, 1998). Discerning the direction of the spin on the ball can help identify the pitch, as different pitch types have unique spin (Baker, Mercer, & Bittinger, 1993; DeRenne, 1993). If an off-speed pitch is detected, the hitter needs to consider how that pitch will move and anticipate the ball s horizontal and vertical location when it passes through the hitting zone, not its location when it is first identified (Baker, Mercer, & Bittinger, 1993; DeRenne, 1993). It is also highly recommended for hitters to watch the pitcher during warm-ups before the game and in between innings to gain a better understanding of that pitcher s repertoire. Hitters should try to think along with the pitchers as to what pitch is coming rather than purely guessing (Baker, Mercer, & Bittinger, 1993). Coupling the knowledge of the pitcher s strongest and weakest pitches with pitching tendencies based on counts should prepare the hitter well for each pitch of his at-bat (Williams & Underwood, 1986) Teaching adjustments to pitch location Just as with changes in pitch speed, pitchers like to throw the ball inside and outside and high and low to further challenge hitters, and hitters must also make adjustments to these pitch locations. Coaches universally agree that it is ideal to hit the ball where it s pitched, or pull the inside pitches to the same field and hit the outside
41 27 pitches to the opposite field. To properly align the bat angle and create the most powerful swing, coaches suggest hitting inside pitches a few feet out in front of the plate, while outside pitches should be hit as the ball crosses the back half of the plate (Gola & Monteleone, 21; Lau & Glossbrenner, 1984). Hitters are told to pull the knob of the bat towards the ball so that the appropriate changes are made to the bat angle at contact (Robson, 23). This brings the hands closer to the body on inside pitches and further away on outside pitches (DeRenne, 1993). On inside pitches, the elbows will usually not lock out though they are still in a powerful position (Baker, Mercer, & Bittinger, 1993). Since most hitters struggle much more with outside pitches, some coaches even recommend looking for the outside pitch and allowing the body to naturally react to the inside pitch (Gwynn, 1998). Regardless of pitch location, coaches agree that hitters should stride directly towards the pitcher on every swing since they must commit this action before recognizing where the pitch will end up (DeRenne, 1993; Williams, 1986). When looking at high and low pitches, Robson (23) advises to keep the same posture throughout the swing and make as few changes as necessary to get the bat to the ball. Bending the knees on low pitches and chopping down on high pitches are not recommended. 2.3 Vision and cognition in batting While some sports, such as weightlifting, swimming, and running, do not require much sensory perception, evaluation, and reaction during their movements, hitting a baseball is considered by many to be more challenging mentally than physically. One of the witticisms attributed to baseball legend Yogi Berra contends that 9% of hitting is
42 28 mental; the other half is physical (Berra, 1998). Some truth to this appeared in an ESPN expert panel ranking of 6 sports across 1 categories to determine the most difficult (Page 2 - Sports skills difficulty rankings). While baseball was ranked highly in a number of physical categories (9 th in power, 9 th in agility, and 15 th in speed ), it was ranked 1 st overall in hand-eye coordination and 15 th in analytical aptitude. Before examining how baseball players react in various batting tasks and training programs, it may be wise to discover the mental approach hitters have before they even step into the batter s box. McPherson (1993) allowed college baseball players ( experts ) and regular college students ( novices ) to view a half-inning of a college baseball game. When placed in a simulated environment of being the fourth batter up that inning and asked to think aloud, there was no difference in the amount of information given by the expert and novice participants, but there was a significant difference in the quality and type of information given. The experts gave much more detailed analyses of the pitcher and the previous batters, including pitch counts and pitch types. While the novices were aware of certain situations, they were often unable to explain what specific information was needed in order to achieve a goal. McPherson and MacMahon (28) later focused their research on the tactical knowledge required for successful batting. Similar results were seen of the experts focusing attention to specific details that would aid them during their own at-bat, specifically information about the pitcher s strengths and weaknesses, velocity, and pitch tendencies. However, it was also discovered that by instructing the participants to recall as much information as possible, irrelevant information about game conditions was often recalled while relevant information about intended actions and goals was not mentioned. The researchers recognized the
43 29 importance of concurrently developing tactical batting skills along with motor batting skills for success in baseball batting. While these previous studies have laid some groundwork into a batter s psyche, the results of simulated batting tasks, controlled laboratory experiments, and observations of game participation give a more complete understanding of vision, perception, motor learning and control, and the overall mental approach hitters have during batting. Hubbard & Seng (1954) first observed that batters tracked pitched baseballs using pursuit movements of the eyes with the head fixated, though the tracking stopped while the ball was still 2 m to 5 m from home plate. It was unclear, however, whether the cessation was voluntary (information no longer useful) or involuntary (eyes incapable of tracking high velocity at close distance). It was long thought that batters, especially adept ones, could decide whether to swing and how to approach an incoming pitch just a few feet before the pitch arrived at home plate. Slater-Hammel & Stumpner (195) first quantified the simple reaction time (average = 21 ms) and movement time (average = 27 ms) of experienced recreational batters. Since the flight of a ball from the pitcher s hand to home plate takes roughly 4 ms, this was evidence that batters need to move earlier than was previously thought. Realizing that batting involves choice reaction and movement time rather than simple reaction time, the researchers repeated their experiments (Slater- Hammel & Stumpner, 1951) to incorporate the element of choice and observed even slower times (29 ms and 34 ms, respectively). Factoring in the time it takes to move the bat through the hitting zone, it was purported that hitters must start their movements much earlier, perhaps even before the ball is released.
44 3 The work of Paull & Glencross (1997) used a pair of experiments to target what information elite batters use and when during the skill the information is acquired. In the first experiment, expert and novice batters were placed in a simulated batting environment and viewed tapes of pitches. A strain gauge was wrapped around a baseball bat, and batters squeezed the handle as soon as they believed they knew where the pitch would cross home plate. They were also asked to point out exactly where it would cross in relation to a gridded strike zone. Results showed that experts decided on pitches significantly earlier than novices (46 ms to 57 ms, respectively) and were significantly more accurate in their estimation of the pitch s ultimate location. For half of the trials, they were given a game scenario in order to provide context and facilitate their decisionmaking process, as it was hypothesized that experts would benefit more from this due to their knowledge and experience. Knowing the game scenario beforehand significantly improved the ability of the batters to guess earlier and more accurately, though the trend was seen in both experts and novices rather than just in experts. In the second experiment, the video clips were edited so that the pitcher was occluded from one of five different points during the pitch (8 ms before ball release, ball release, 8 ms after ball release, 16 after ball release, and 24 ms after ball release) through the end of the pitch. Results of this experiment were inconclusive, but it was noted that the amount of location guessing errors early in the pitch was higher in curveballs compared to fastballs. This supports that anecdotal theory that the flight of a curveball is more unpredictable. To further differentiate skilled and unskilled hitters, Castaneda & Gray (27) tested batters in a simulated batting environment with one of four dual-task conditions that directed attention at skill execution (hand movement and bat movement) and the
45 31 environment (auditory tones and the ball leaving the bat). The skilled batters performed significantly better when focused on the environment than on the skill, while the unskilled batters had the exact opposite result. This led the researchers to conclude that while skilled batters have internalized knowledge of the skill of hitting that performs best when uninterrupted, unskilled hitters need to focus on step-by-step execution of the swing in order to be successful. Using the Markov mathematical model to analyze batting cognition as a stochastic process, Gray (22a) attempted to numerically capture some of the phenomena involved the thought processes in hitting. It was assumed that since batting requires the perception of such a large amount of information in such a short amount of time, it would behoove batters to try and find patterns of pitching and base decisions about when and where to swing on pitch history. In the experiment, pitches were shown on a screen as an incoming ball, and the batters (n=6) swung a bat with an affixed motion tracking sensor to detect contact. Pitch counts changed with the result of each pitch, and incoming pitch speed and location was varied to match the real-life probabilities associated with the given pitch counts. The results of this model supported anecdotal theories that high level hitters typically expect fastballs and adjust to off-speed pitches rather than purely guessing pitch types. The model also reflected things such as hitters being fooled by an off-speed pitch following a series of fastballs and the shift in advantage between the pitcher and hitter depending on the count. There were also significant differences among playing levels, suggesting the use of the model as a comparative tool when assessing hitters.
46 32 Gray (22b) also conducted a series of experiments in a virtual hitting environment to study how the different elements of a pitch (speed, location, ball rotation, and sequence/history) are perceived and how they influence a batter s swing. Temporal and spatial swing accuracies were used as the measures of batting success. The first experiment tested batting against a wide variety of pitch speeds. Results showed that when pitches are thrown completely at random (i.e. without regard to pitch count or pitch history), batters struggled to make contact. They had particularly low spatial accuracy, which the author attributed to an inability to estimate pitch height at ball contact. In the second experiment, only fastballs and changeups were thrown. The hitters fared significantly better against two pitch types than when facing a random assortment of pitch speeds, emphasizing the fact that most pitchers need to throw at least three distinct pitches (e.g. fastball, curveball, and changeup) in order to disrupt the hitters timing. Still, batters in this experiment struggled with a change in speed after seeing the same speed for multiple pitches and occasionally had large spatial and temporal errors. The large errors were typically appropriate swings for the opposite pitch type (e.g. a fastball swing for a changeup). The third experiment adjusted the probability of a fastball or changeup depending on the pitch count, with fastballs coming more frequently when the hitter was ahead in the count and changeups when the hitter was behind in the count. Consequently, hitters had significantly better temporal and spatial accuracy when adjusting pitch type expectations based on pitch count. The fourth and final experiment analyzed the ability of hitters to interpret the direction of the spin on the ball, as fastballs have backspin and curveballs have topspin. Some hitters performed better when able to pick up rotation direction cues as was first suggested by Hyllegard (1991), though
47 33 there was a limitation because the frame rate of the video pitch simulation was slower than a real-life baseball spinning. In general, this study scientifically backed several theories proposed by hitters and coaches over the years, though it was also quite limited because the testing involved simulated batting tasks rather than batters facing real live pitching. Scott & Gray (27) made a very interesting finding when studying different batting practice regimens. In one of three different 45-pitch practice conditions, experienced hitters had simulated pitches delivered at the same speed but at different heights (one df - spatial), the same height but at different speeds (one df - temporal), and different speeds and heights (two df). Spatial and temporal swing accuracies were used as measures of performance. Following the practice conditions, all batters completed a two df 45-pitch condition to simulate game conditions. Batters who practiced in the one df - spatial condition did significantly worse in the test condition than those who practiced in the two df condition, while there was no significant difference during the test condition between batters who practiced in the one df temporal and two df conditions. These results go against the common technique of holding pitch speed constant during pre-game batting practice, suggesting that this may actually hinder performance in games. However, interpretation of these results is also limited because of the use of a batting simulator rather than live pitching. A few studies have advanced past simply testing hitters to understand their weaknesses and strengths in vision and cognition and tried to implement training programs to improve batting performance. Burroughs (1984) incorporated a training tool known as the Visual Interruption System (VIS) in a pair of training experiments. The
48 34 VIS device blocked the vision of the hitter after viewing approximately 4 to 6 m of ball flight. Training groups watched films of learning trial pitches with feedback, as these were designed to help batters recognize a variety of pitch types, speeds, and locations. All participants (control and training) were then post-tested with the VIS and asked to identify the location (and/or type, if necessary) of the pitch, and their responses were cross-referenced with official umpires for accuracy. In general, participants had difficulty in determining the location of a pitch after such a short viewing time (4-5% accuracy), though they were very good at distinguishing fastballs from breaking balls in that time (9% accuracy). The training groups scored significantly better than the control groups (55% to 43%). It was also discovered that the gains made in visual simulation training could be maintained six weeks after training. Cassidy & Wade (1998) tested the effects of a week-long video training session on choice reaction time (CRT) in novice baseball batters. A test group and training group were each given a pre-test of viewing 1 live pitches while standing in the batter s box and were asked to press one of two buttons to indicate, as soon as possible, whether a fastball or curveball was being delivered. Training involved discussions on the general pitching kinematics of fastballs and curveballs, common visual search strategies of expert batters, and several videotapes of practice trials. The same 1-pitch protocol was repeated in the post-test, and results indicated that while there was a slight, yet statistically insignificant improvement in the number of correct answers, the participants in the video training group had significantly faster CRTs following their training. The researchers cautioned, however, that the results were probably not clinically significant, improvement was not as uniform as expected, and that a general training effect, rather
49 35 than one specific to video training, had occurred. Researchers were also unclear as to the potential effect of video training on expert batters. 2.4 Physical tools and training of baseball batters It is evident that baseball players need the proper mental approach, good coaching, and efficient biomechanics in order to excel as a hitter, but the physical condition of a player is the basis for his ability to generate a powerful swing. As in nearly all sports, there is a balance between technique and raw physical ability, and a number of research studies have examined the latter from several different points of view. The following subsections will summarize research on the anthropometric characteristics and physical assessments of baseball players and various training programs designed to improve hitters strength and conditioning. A special focus will also review articles written on the effects of differently weighted bats and warm-up swings taken before atbats Strength, flexibility, and physical variables Physical characteristics such as height, mass, body composition, and somatotype of 132 college baseball players were evaluated by Carda & Looney (1994) to determine if differences existed among baseball positions at that level. With regard only to position players, there were no significant differences between infielders and outfielders in any of the measured parameters, including height (18 cm to 179 cm, respectively), mass (79 kg to 78 kg), and body fat (13% to 12%). When differentiating by individual infield positions, first basemen were significantly taller than third basemen and second basemen
50 36 (185 to 178 and 175 cm, respectively), and shortstops were also significantly taller than second basemen (182 to 175 cm). First basemen and catchers had significantly more mass than second basemen (85 kg and 81 kg to 71 kg, respectively). The researchers were unsure whether their findings were because coaches specifically recruit players at a given position to match these body types or because the players best suited to play these positions naturally had such body types. Another comparison among baseball positions was made by Coleman & Lasky (1992) when they assessed running speed and body composition in 21 professional baseball players. All position players had relatively the same average height (179 to 183 cm) and body fat (8% to 1%), but catchers were found to be significantly heavier than infielders and outfielders (91 to 83 and 85 kg, respectively). In a 55 m (6 yard) sprint, a common testing distance for baseball, catchers were significantly slower (7.19 s) than infielders (6.97 s) and outfielders (6.89 s). The researchers intimated that catchers would benefit from an explosive training program that brought them closer to the infielders and outfielders in body composition and running speed. Since baseball players usually only need to make a few quick forward and lateral steps, it was also recommended that alternatives to the long sprint be used when assessing running speed, acceleration, and explosiveness. While a number of studies looked at overall characteristics, Hills (25) specifically measured the hip range of motion (ROM) in 41 high school and college hitters to verify any asymmetries in ROM due to the unilateral motion of batting. There were no significant differences in hip internal rotation between the back and lead hip, but hip external rotation and total ROM was significantly greater in the back hip. It was
51 37 believed that this imbalance was due to the motion of batting, but a biomechanical analysis of the swing was not performed in order to corroborate this belief. In addition to flexibility, functional strength is important in athletes because it translates their ability to apply raw strength towards a specific goal. In the case of baseball players, this can be measured as how certain strength parameters affect joint kinematics and bat velocity. Thwaites (25) noticed that left elbow flexion isometric strength of right-handed batters significantly correlated with linear horizontal bat velocity. Weimer, Halet & Anderson (27), however, found no correlations in college baseball players between bat velocity and one repetition maximum strength measurements of hand grip, trunk rotation, triceps push downs, biceps curls, and bench press. The researchers then suggested implementing exercises that would be more baseball-specific and incorporate the power and explosiveness seen in batting. A battery of physical fitness tests was conducted by Kohmura et al. (28) to see how they correlated to playing performance evaluations in batting, fielding, and running. College baseball players (n=43) were tested on throwing distance, back strength, medicine ball overhead throwing, standing long jump, T-test of agility, and baserunning. When controlling for fielding and running ability, significant partial correlations were seen between batting ability and medicine ball throwing (r =.57), and back strength (.5). These two physical tests require good core muscular strength and power, and the researchers concluded that these tests would be good both for assessment and training.
52 Training programs A survey of all 3 Major League strength and conditioning (S&C) coaches (Ebben, Hintz, & Simenz, 25) provided solid background information on the elements of a professional baseball player s workout program. Off-season strength/power development workout programs were typically four days a week for 45-6 minutes, while in-season strength power development workout programs were typically two days a week for 15-3 minutes. All 21 coaches who responded to the survey reported incorporating some kind of flexibility training. This included exercises in dynamic flexibility (81%), proprioceptive neuromuscular facilitation (71%), and ballistic stretching (19%). Plyometric exercises were part of the routine for 95% of S&C coaches, with 81% using it to increase lower body power and 48% using it to increase upper body power. Only 14% of S&C coaches employed Olympic-style weightlifting exercises. Overall, squats and lunges were identified as the most important exercises used in training. Though S&C practices generally appear to be as cyclical in nature as fashion, a focus on the development of lower body strength and power for baseball batters is evident from the results of the previous study, as well as other research that has looked specifically at lower body training regimens. Rhea and colleagues (28) trained two groups of college baseball players, one with cardiovascular endurance training and one with speed/speed endurance training, and compared them using validated vertical jump tests for power before and after their competitive seasons. There was a significant difference between groups; the endurance training group showed a 3% decrease in power output, while the speed group showed a 15% increase in power output. Dodd & Alvar (27) attempted to further explore lower body power training by comparing a
53 39 counterbalanced rotation of four week programs of resistance training, plyometrics, and complex training, which combined the two modalities. Pre- and post-training measures of short sprinting, vertical jumps, standing broad jumps, and a T-test of agility were performed after every four week session, with a week of active rest in between each four week block. Positive changes were reported for all three types of training. However, no significant differences among groups were detected. To analyze the effect of medicine ball training on high school baseball players, Szymanski and colleagues (27a) added rotational and full-body medicine ball exercises to a periodized resistance training program to one of two groups over a 12-week period. Both the control and training groups showed significant increases over the 12 weeks in dominant and non-dominant torso rotational strength, medicine ball hitter s throw, parallel squats, and bench press, but the training group improved significantly more than the control group in torso rotation strength and hitter s throws. The transfer effect was also studied (Szymanski et al., 27b) by measuring linear bat-end velocity (BEV), pelvis angular velocity, upper torso angular velocity, and linear hand velocity. Again, both groups showed improvement, but a significant interaction of group and time demonstrated the beneficial effects of medicine ball training as the training group improved more than the control group in BEV and pelvis and upper torso angular velocity. Besides core strength, many pundits also believe that hitting success requires strong forearms and wrists. Szymanski et al. (24) showed that additional wrist and forearm training did result in increased wrist and forearm strength for high school baseball players after implementing a 12-week program. Hughes, Lyons, & Mayo (24)
54 4 further tested this by establishing a baseline relationship between grip strength and bat velocity and then determining whether a grip strengthening program would affect bat velocity. College baseball players (n=23) were divided into two groups, control and experimental. Both groups completed resistance training exercises as part of a normal training regimen, but only the experimental group did additional forearm and grip strengthening exercises during a 6 week period. No significant correlations were seen between grip strength and bat velocity, and while there were significant increases in bat velocity, the increases were similar for both groups. The researchers concluded that additional training of the forearms and wrists to improve bat velocity may not be necessary. Szymanski and colleagues (26) had a very similar finding in a 12-week training study that incorporated wrist and forearm exercises. Bat velocity improved, but there was no difference between groups, indicating no specific effect of the wrist and forearm exercises on performance Weighted bats and warm-up swings It is still very common to see batters standing in the on-deck circle warming up by swinging a weighted implement, but the scientific merit of such activity has been disputed. DeRenne (1992) was one of the first to measure the effects of warming up with weighted implements on bat velocity. High school baseball players (n=6) swung 13 different warm-up implements on separate days. The warm-up implements that led to the greatest bat swing velocity during testing were within 1% of the game bat weight. Surprisingly, warming up by swinging a bat with a donut, one of the most common methods of warm-up, resulted in the lowest bat velocity during testing. Otsuji, Abe, &
55 41 Kinoshita (22) also found a significant decrease in bat velocity when warming up with a bat donut. Southard & Groomer (23) tested the use of warm-up bat donuts on 1 experienced baseball players, and again confirmed significantly lower bat velocities and joint linear velocities when warming up with a bat donut compared to warming up with a normal bat only. Ironically, a study by Otsuji, Abe & Kinoshita (22) also measured perceived swing velocity and heaviness, and the batters actually thought the normal bat felt lighter and was swung faster following warm-ups with a bat donut. It is evident that there is no biomechanical advantage to warming up with at weighted implement, but it is possible that there is a beneficial psychological effect. A pair of studies looked at the effectiveness of a training protocol using weighted bats to improve bat swing velocity. Sergo & Boatwright (1993) assigned college baseball players (n=24) to one of three groups to take 1 dry swings three times a week for six weeks: a control group that used only a legal game bat, a heavy bat group that trained with a bat twice as heavy as a legal game bat, and an alternating group that switched back and forth every five swings between the heavy bat and a lightweight fungo bat. Within each group there was a significant increase in bat speed of around 8.5% after six weeks, but there was no difference among groups. This indicated to the researchers that using the documented protocol and swinging a bat of any weight would significantly improve bat swing velocity. DeRenne and colleagues (1995) later divided 6 college baseball players into live batting practice (BP), dry swing (DS), and control groups. The BP and DS alternated in a progression from heavy (.88 to.94 kg) to light (.77 to.82 kg) to standard (.85 kg) bats every 1 swings for 15 swings four days a week for 12 weeks, while the control took an equal number of swings with only a standard bat. A significant
56 42 increase was again seen within each group after the 12 week period. However, there was also a significant effect between groups, showing that the BP group benefited significantly more than the DS group, and the DS group benefited significantly more than the control group. This result concurred with the previous research (DeRenne, 1992) that postulated the beneficial effects of using a weighted bat as long as its weight is kept close to the standard game bat weight. 2.5 Bat properties and the bat-ball collision A number of biomechanical studies have investigated various characteristics of the ball, the bat, and the interaction between the two. This section will focus only on the bat properties that may affect the biomechanics of a batter s swing. One aspect which will not be addressed is the material properties of bats. While this may be an intriguing and controversial topic, particularly regarding the discussion of metal versus wood bats, it is beyond the scope of this project because professional batters only use wood bats. Many of the underlying physical principles regarding batting, pitching, fielding, and running in baseball are detailed in a famous book entitled The Physics of Baseball (Adair, 22). With respect to the current research, the book describes a general biomechanical model of the baseball swing, the bat-ball collision, conditional changes that effect batted ball flight, and the effects of bat properties on the swing and ball flight. Adair said that for a well-hit ball, the collision between bat and ball takes place in a region known as the sweet spot, an area very close to the bat s center of percussion (a vibrational node on the bat where no momentum is transferred to the handle and thus the batter does not feel a sting in his hands after contact). The terminology of sweet spot
57 43 and center of percussion are often (inappropriately) used interchangeably, since most reputable scientists distinguish the center of percussion and the point on the bat that maximizes ball exit velocity as two distinctly different points. The collision between bat and ball lasts for just 1 ms and more than 4, N of force is transmitted from the bat to the ball to redirect a 4 m/s pitch as a 5 m/s batted ball. This massive force compresses the ball to 5% of its diameter, though the wood bat is only compressed to 98% of its diameter. This collision is fairly inelastic, since much of the energy is lost due to frictional heat. This inelasticity is measured as the coefficient of restitution (COR), which is a ratio of the velocity before and after impact of two colliding objects. Another issue of contention is the batter s grip, which many believe to be vital to the success of the batter. By physical law, though, Adair contends that the batter s grip is completely irrelevant because the duration of BC is not long enough for a wave to propagate the length of the bat and shake loose the batter s grip on the bat. Ultimately, bat velocity and impact point are the two primary variables that determine ball flight (excluding bat mass). While there is a direct relationship between bat velocity and total ball flight distance, a number of extrinsic factors can also somewhat affect the ball s total flight distance. These include altitude, air pressure, wind, humidity, pitch speed, and bat properties. They can each alter the distance of a 12 m hit up to 3 m either way. Adair went on to describe the effects of changing dimensions of the bat including length, diameter, and particularly bat mass on batting outcomes. Typically, longer bats are heavier than shorter bats. As for diameter, the bats of players in the early days through the 196s or 197s were closer to 7 mm whereas the current players have a diameter of about 65 mm, which reduces the bat mass, but also reduces the bat s contact
58 44 area. In the simplest theoretical model, for a given amount of total energy produced by the batter, the ball can be hit the furthest against a faster pitch with a heavier bat while a slower pitched ball would optimally be hit with a lighter (faster) bat. It is also suggested that the optimal bat mass is proportional to the batter s body mass. As Adair quickly pointed out, though, while these ideals may hold true in theory, they certainly do not hold true in practice because they assume that the batter is only trying to maximize ball flight distance and not necessarily frequency and/or quality of contact. In this case, batters often choose lighter bats to more skillfully guide the bat through the hitting zone, a choice that Adair pointed out may not diminish the ball flight distance that considerably. He estimated that a change from a 1.8 kg bat to a.91 kg bat would afford the batter about 13 ms more time to react to a pitch travelling 4 m/s. While many of these theoretical considerations analyze perfectly struck balls, one must also realize that most balls are contacted imperfectly, and that analysis of those swings is much more practical and relevant to the study of the baseball swing. Assuming a ball hit solidly to centerfield for a base hit with a level swing, swinging the bat 5 mm below the ball s center will result in a ball fouled high and straight back over the catcher s head and out of play, swinging the bat 25 mm below the ball will be a routine flyout, but swinging the bat 19 mm below the ball s center will maximize the ball s flight distance, partially by creating backspin to further propel the ball. Conversely, it is suggested that an effective ground ball hit should not make contact more than 1 mm above the ball s center. On an 864 mm bat, the sweet spot (node of the fundamental vibration 17 Hz) is approximately 178 mm from the barrel end of the bat. The sweet spot is located about 25 mm from the point on the bat that maximizes ball flight distance,
59 45 so most batters equate well-hit balls with this spot, though they are actually two distinctly different points along the bat s axis. Still, the parabolic shape of a graph illustrating the relationship between the ball s flight distance and the distance between the bat s sweet spot and the BC point along the bat s axis demonstrates the exponentially bad effect a mishit can have on a batting outcome. Quite a few scientists in various fields of research have also reported on bat mass properties and their effects on bat performance. Sherwood, Mustone, and Fallon (2), representing the facility currently responsible for testing Major League Baseball (MLB) equipment, presented its method for independently testing the ball and bat, and then using a finite element model to study the bat-ball collision. Their model concluded a maximum BEV of 4 to 42 m/s for wood bats. Nathan (23) laid out a few models for testing bat efficacy, ultimately determining that collision efficiency, or the closely related variable of Ball Exit Speed Ratio (BESR), the metric on which high school and colleges currently rely for certification of bats for performance and safety, are the most effective in determining bat performance. Nicholls, Miller & Elliot (26), when testing maximum ball exit velocity (BEV) of bats, however, saw that wood bats could produce a BEV of 51 m/s, exceeding the regulatory threshold of 43 m/s that governed bat production. They determined that this excess was due to a limitation in the certification process that did not include the bat s linear velocity as well as its angular velocity when calculating the threshold. Smith (21) also commented that bat testing must be conducted at pitch speeds and bat swing speeds closer to actual game conditions, since many researchers conduct tests performed at relatively low speeds. Penrose & Hose (1999) used finite element modeling to show that flexural and vibrational properties should also be
60 46 important considerations along with center of mass and moment of inertia when shaping and weighting the bat during its design phase. Fleisig et al. (22) and Bahill (24) both concluded that the bat s moment of inertia is crucial both in regulating bats for safety and performance as well as for individual bat selection for maximum performance. Other researchers have focused more on the mechanics of the baseball swing as they relate to the bat more than the batter. Sawicki, Hubbard, and Stronge (23) furthered Adair s assumptions on optimizing swing parameters to maximize ball flight distance. Increased pitch speed and bat speed were of course listed as two essential components for a maximum distance hit. They claimed the batter should swing with an upward bat trajectory of about 9º and contact the ball 27 mm below its center line for maximum distance. They further asserted that an optimally hit curveball would travel further than an optimally hit fastball because the spin direction of the curve would help create additional backspin to propel the ball. Cross (28) measured the forces and torques acting on the bat to develop a bat swing model, citing a small positive couple followed by a large negative couple. All of these studies have aimed at measuring the true effect of varying bat properties on BEV, though they recognize that the batter s physiological contributions to the swing override most bat contributions to batting.
61 CHAPTER 3 METHODS The baseball swing is a complex movement that requires a unique combination of explosive power and hand-eye coordination. Good swing mechanics are essential for successful hitting. Coaches have proffered numerous theories on what good swing mechanics are, but little scientific research exists to support any theory. The purposes of this study were to define proper swing mechanics for fastballs down the middle and then compare swings at pitches thrown to various locations and at different speeds with a range of batting outcomes. 3.1 Participants Healthy professional baseball players (n=43) were recruited from the Southern League, a class AA league. All players were position players. After obtaining internal review board (IRB) approval from St. Vincent s Hospital in Birmingham, AL, all available players were informed of the study and individually asked to participate. All participants were asked to read and sign an informed consent form detailing the study s procedures, as well as all risks and consequences of the study (See Appendix A). Ultimately, data for 33 of the players were available. These players were 25 ± 2 years old, with a height of 184 ± 6 cm and a mass of 92 ± 9 kg. 3.2 Instruments All data collection took place at the American Sports Medicine Institute s biomechanics research laboratory. This facility contained a protective batting cage net 47
 and 2 force platforms (Advanced Medical Technology Inc., Watertown, MA) for collecting biomechanical data.")
62 48 with approximate dimensions 2m long x 5m wide x 5m high. At one end were eight Eagle motion capture cameras (Motion Analysis Corp., Santa Rosa, CA) and 2 force platforms (Advanced Medical Technology Inc., Watertown, MA) for collecting biomechanical data. Four cameras each were mounted on two opposing walls in a ringlike pattern to capture reflective markers from eight distinct angles. A picture taken during data collection, visualizing the orientation of the lab, the location of the batter, and the batting practice pitcher, is shown in Figure 1. The force platforms (approximately 46 cm x 51 cm) were flush with the ground and were oriented so that a batter, when facing the pitcher, could place his trail foot on one platform and his lead foot on the other. The batters swung self-selected wood baseball bats during testing. The pitcher throwing to the hitters was protected by an L-screen. Standard white baseballs were entirely covered in reflective tape so the cameras could track their location in space. Figure 1. American Sports Medicine Institute biomechanics lab setup.
63 Procedures The study was conducted during the middle of the baseball season so that players were in baseball-playing shape and regularly practicing their batting skills. Each participant reported to the biomechanics laboratory for testing at a previously assigned time. After reading and signing the informed consent form, hitters were asked to change into snug fitting shorts, socks, and non-reflective indoor turf shoes. A hat was provided. Before data were recorded, each participant was given time to familiarize himself with the laboratory setting. The hitter was also allowed to perform any calisthenics or warmup drills to prepare him for the testing procedure. Reflective markers were placed on the seventh cervical vertebra and right scapula and bilaterally on the clavicles (collarbones), acromion processes (shoulders), the medial and lateral epicondyles (elbows), the forearms, the radial and ulnar styloid processes (wrists), the third metacarpals (hands), anterior and posterior superior iliac spines (pelvis), the greater trochanters (thighs), the lateral and medial femoral condyles (knees), the lateral and medial malleoli (ankles), and on the shoes directly behind the calcanei (heels) and over the third metatarsals (toes). For batters who wore batting gloves, markers were placed on the gloves directly over the wrist and hand landmarks. The batting gloves were worn tight on the hands so there was little concern for additional artifact created by movement of the markers on the gloves. The baseball hat given to the players to wear for testing was adorned with four markers on the front, top, rear, and side. Finally, three markers were placed on the bat cap, knob, and just below the bat s trademark. The bat cap marker was a 4 x 4 cm piece of reflective tape secured to the cap. Two pictures, shown as Figures 2a and 2b, display anterior and posterior views of
 Anterior view and (b) posterior view of marker placement.")

64 5 the marker placement on the batter and bat. After the markers were placed on the participant, any additional time needed to adjust to performing while wearing them was given. Any warm-up swings to prepare for the batting session were also allowed. Figure 2a and 2b. (a) Anterior view and (b) posterior view of marker placement. The hitter took his stance in the middle of the cameras capture volume with one foot on each force plate. The positive X axis pointed from home plate towards the pitcher, the positive Z axis was vertical, and the positive Y axis was their cross-product, Z x X. An experienced batting practice pitcher threw the reflective-markered baseballs to the hitter from a distance of approximately 13 m. The pitcher varied the pitches by speed and location. While the data analysis was designed to compare changes in hitting mechanics due to pitch speed and location separately, the protocols for testing these variations were combined into one protocol to more accurately simulate the
65 51 unpredictability of batting in game situations. Fastballs were thrown to one of five different locations within the strike zone (high and inside, high and outside, low and inside, low and outside, and down the middle ), while the majority of changeups were thrown down the middle. Occasionally, changeups were thrown to different locations to prevent the hitter from recognizing any pattern in the pitching sequence. The overall ratio of fastballs to changeups was roughly four to one. This ratio is based on recommendations given by pitching coaches to pitchers (House, 2). For each pitch, the motion capture system tracked the three dimensional locations of the body, bat, and ball markers at a rate of 3 Hz and the force plates recorded the ground reaction forces also at a rate of 3 Hz. To monitor the data collection and ensure that enough of the proper types of trials were collected, a member of the research team noted the location (HIGH IN, HIGH OUT, LOW IN, LOW OUT, or MIDDLE) and speed (fastball or changeup) of the pitch and informed the pitcher. From the motion data, pitch speed (PS) was computed as 25. ±.6 m/s for fastballs and 21.3 ±.6 m/s for changeups. Each hitter took approximately 4 swings, depending on the number of useful trials collected. All useful trials were retained for analysis, though this inevitably created an unequal number of trials (i.e. unbalanced design) for each trial type. This issue is addressed further in Section 3.5 Statistical Analysis. 3.4 Data processing Kinematic and kinetic data were automatically synchronized and manually cropped from a few frames before the hitter s initial movement until a few frames past follow-through. First, the raw XYZ positions of the markers were passed through a 12
66 52 Hz Butterworth filter within the motion analysis software to smooth out any artifacts created from digitizing errors or skin movement. The force plate data were left unfiltered to avoid oversmoothing and subsequent underestimation of peak GRF. Next, the data were processed through Sky scripts designed to work with the Skeleton Builder and KinTools application softwares (Motion Analysis Corporation, Santa Rosa, CA) which were programmed to calculate all of the kinematic, kinetic, and temporal variables analyzed in this study. These programming codes are located in Appendix C, one code for kinematics and one code for kinetics. The global ball location was tracked as its path approximately 5 m before and after contact with the bat. All swings with a quantifiable ball exit velocity (BEV) were also denoted as a successful result, while foul tips and misses were marked as failures. The kinematic position variables included in the current analyses were global rotation of the head, pelvis (including tilt, obliquity, and transverse rotation), and upper trunk; flexion, lateral flexion, and rotation of the upper trunk with respect to the pelvis; rotation of the shoulders with respect to the upper trunk (in polar coordinates and termed elevation and azimuth ); flexion of the elbows; flexion of the knees; stride length and direction; global angle of the lead foot with respect to the X axis; global bat rotation (in polar coordinates and termed elevation and azimuth ); and bat lag (similar definition to Welch et al. (1995)). All of these variables were measured in degrees, except for stride length (% of participant s total height) and stride direction (centimeters). Diagrams of these variables are featured in Appendix B. A three-point central difference method was used to calculate global velocities for the pelvis, upper trunk, and bat azimuth and local velocities for the lead shoulder azimuth, trail elbow, and lead knee (all in degrees per second). The kinetic variables included ground reaction
67 53 forces (GRF) in the global X, Y, and Z planes (Fx, Fy, and Fz), and these were measured as a percentage of the participant s total body weight (%BW). All GRF values were generally positive except for lead foot GRFx and GRFy, which were negative to reflect the opposing direction of the force. A few adjustments were made in the programming codes to make data interpretation easier. These customized programming codes were adapted to produce equivalent values for left- and right-handed batters according to the global orientation of the testing facility described earlier. Several definitions of variables were oriented to mimic the batter s initial stance. The batter looking at the pitcher was approximately º of head rotation while the batter looking at home plate was approximately 9º of head rotation. The pelvis pointing towards home plate was approximately º of rotation while the pelvis pointing towards the pitcher was approximately 9º of rotation. Total extension of the elbows and knees was towards º while total flexion was towards 18º. An open stride direction was negative while a closed stride direction was positive. The initial bat azimuth was equivalent to 18º while the bat azimuth near contact was equivalent to º. The rest of the orientations are described as needed throughout the relevant results sub-sections. A number of programs were written in MATLAB (MathWorks, Natick, MA) to help process the data outputted from the Motion Analysis software and re-arrange the data into spreadsheets in preparation for statistical analysis. The three main programs can be seen in Appendix D. The primary goals of the first program ( complete_baseball.m ) were to combine the kinematic and GRF data of a given trial, extract data from key events, and determine maxima and minima of selected kinematic and GRF data. The
68 54 goal of the second program ( graph_constructor.m ) was to group together and average trials of the same pitch location, pitch type, and/or batting outcome for a given participant. The goal of the third program ( graph_compiler.m ) was to compile the averaged data by trial type for plotting graphs. Eventually, five key events were identified: lead foot off (the instant when the front foot GRFz fell below 1% BW), lead foot down (the instant when the front foot GRFz rose back above 1% BW), weight shift commitment (the instant when the front foot GRFz passed beyond 5% BW), maximum GRFz (the instant of maximum front foot GRFz), and bat-ball contact (BC) (the instant when the incoming pitch deviated from its initial trajectory). The frame of BC of misses had to be estimated based the position of the ball at BC of successful swings against the same pitch type/location. These events demarcated six operationally defined phases of the swing: stance, stride, coiling, swing initiation, swing acceleration, and follow-through. 3.5 Statistical analysis A number of statistical techniques were employed to analyze the data. For the biomechanical description of the swing, only successful swings against fastballs down the middle were considered. Fastballs are the most common pitch thrown in games and pitches down the middle are the most neutral and usually the most desirable for batters. All kinematic and GRF variables were separately plotted against time (relative to BC) with each participant s averaged trials. Those plots were then averaged together to create a single curve (including plus or minus one standard deviation) to represent the typical professional batter. The plots were carefully reviewed and then described collectively phase by phase from stance through follow-through. To remain concise while still
69 55 conveying as much relevant data as possible, the stance phase began at 1 ms and the follow-through phase terminated at +2 ms. Before 1 ms the batter was rather still, and around +2 ms, in the context of a real game, the batter was assumed to have begun his transition from batter to runner. To compare successful swings against fastballs thrown to one of five locations (HIGH IN, HIGH OUT, LOW IN, LOW OUT, or MIDDLE), two different techniques were utilized. First, to simply compare the values among the pitch locations, general linear models (GLM) with repeated measures were constructed for each dependent variable. These models provided an advantage over ANOVA since they allowed for the incorporation of an unequal number of trials per person by adjusting the sums of squares for each of the terms in the model. Two terms were entered into each model: the pitch location (LOC) was a within-subjects factor with fixed effect; and a subject variable (µ) was a factor with random effect used to account for between- and within-subjects variability as well as the fact that the batters were a sample from a larger population (i.e. all professional hitters). The parameters used as dependent variables in this procedure were selected kinematic angles at the instant of BC (lead knee flexion, pelvis rotation, upper trunk rotation with respect to the pelvis, lead shoulder elevation and azimuth, trail elbow flexion, bat lag, bat elevation and azimuth, and head rotation), selected magnitude and timing of peak kinematic angular velocities (lead knee extension, pelvis rotation, upper trunk rotation, lead shoulder azimuth, lead elbow extension, and bat azimuth), and magnitude and timing of all peak GRF in the X, Y, and Z directions. When appropriate, a Tukey post-hoc comparison test with α=.5 was administered to determine the exact differences among the five pitch locations to aid in thoroughly describing the effect of
70 56 LOC on the biomechanical parameters. Grouping some of the pitch locations together (e.g. HIGH IN + LOW IN = inside) to generalize some of the findings was also considered when interpreting the outcomes of the statistical tests. The second statistical technique used to compare swing biomechanics against fastballs thrown to different pitch locations involved the relationship of the biomechanical parameters to BEV. For each parameter, a separate GLM was constructed such that BEV was on the left side of the equation while ten parameters were entered on the right side. Initially, those on the right side were the four main terms (the biomechanical parameter, µ, LOC, and PS) and all six possible two-way interactions between the main terms. Using backwards elimination, the least significant term was removed from each model until only statistically significant terms (i.e. p<.5) remained. If the biomechanical parameter was ultimately retained in the model, the coefficients derived from each GLM were used to create an equation relating BEV to the significant terms. This equation was then reduced to produce average plots of an estimated BEV over the range of measured values of the biomechanical parameter. Since µ is inherently zero when looking at the entire group, terms including this subject variable were dropped from the equation when forming the plots and the mean PS (25. m/s) was plugged in when the PS term was present in the equation. A graph containing the plots of the data for all pitch locations was compiled for each variable. A brief analytical summary based on all available results addressed any relationships between BEV and the given biomechanical parameter, particularly those that would be of practical significance. The final analysis compared swings against fastballs and changeups with successful and failed results. The analysis was ultimately reduced to three operationally
71 57 defined trial types : successful results against fastballs thrown down the middle (Fast Success), successful results against changeups (Change Success), and failed results against changeups (Change Fail). Failed results against fastballs thrown down the middle occurred very rarely, and the reason for their occurrence was believed to be beyond the scope of this analysis. The technique employed for this analysis was nearly identical to the first technique used for the pitch location comparison. All of the same dependent variables were again used in this pitch type comparison, with a GLM again constructed for each dependent variable. Two parameters were again entered into the GLM to model these dependent variables: trial type (within-subjects factor with fixed effect) and the subject variable (factor with random effect used to account for within- and between-subjects variability and aid in external validity). Whenever trial type was a significant term in the GLM, a Tukey post-hoc comparison test with α=.5 was administered to determine the exact differences among the three trial types.
72 CHAPTER 4 RESULTS 4.1 Biomechanical description of the swing This section used average graphs of all of the measured biomechanical variables over time to represent the typical professional batter. The majority of these graphs are featured separately in Appendix E. The following section presents a phase by phase summary of these graphs. All magnitudes correspond to the value as seen in the graph of that variable (i.e. the thick curve representing the average). All time values are with respect to the instant of BC Stance The lead foot bore less of the body s weight throughout this initial phase, with GRFx dropping from 12% BW to 5% BW and GRFz dropping from 37% BW to 17% BW (a slightly misleading value due to the averaging effect). Contrastingly, the trail foot accepted more of the body s weight with its GRFx rising from 11% BW to 18% BW and its GRFz rising from 57% BW to 86% BW. Both knees also flexed, with the lead knee bending from 36º to 48º and the trail knee bending from 51º to its maximum value of 56º. During these pre-stride movements, the pelvis drifted back in the negative X direction approximately 6 cm. The average time of the lead foot off event was 621 ms Stride Throughout the stride, the trail foot pushed with a constant GRFx of 21% BW while the GRFz gradually rose from 86% BW to a peak value of 92% BW around 5 58
73 59 ms and then began to fall back down to 83% BW. The average stride length was 42% of the subjects height, and the lead foot went from an even stance (lead and trail foot even on Y axis) to a position of 11 cm closed while the foot angle (with respect to the X axis) opened from 69º to 63º. As the leg rose up off the ground, the lead knee bent to a maximum flexion angle of 52º around 483 ms. As the batter strode out, the trail knee extended from 56º to 5º and the pelvis moved forward 7 cm in the positive X direction (towards the pitcher). The pelvis s orientation also changed slightly, posteriorly tilting from 15º to 2º and reverse rotating in the transverse plane from 1º to 18º along with the upper trunk ( 9º to 16º). The rest of the upper body initiated some movement, too, with the reverse rotation of both shoulders (lead azimuth: 16º to 25º; trail azimuth: 65º to 81º), and the extension of the lead elbow from 89º to 78º. By the end of the stride phase, the bat had elevated to a maximum of 44º and had continued to be wrapped behind the batter s head, rotating from an azimuth of 198º to 226º. The stride phase terminated when the lead foot returned to the ground (i.e. GRFz > 1% BW) at approximately 34 ms Coiling For all participants, while the lead foot GRFz may have oscillated above and below 1% BW following the lead foot down event, batters never fell below the 5% BW threshold that terminated the coiling phase once past that value until after the event of maximum GRFz. As the lead foot GRFz increased, the trail foot GRFz decreased from 83% BW to 47% BW during the phase. The batter s weight began to shift forward; the lead foot GRFx and GRFy braking forces increased from 2% BW to 11% BW and 1%
74 6 to 23% BW), respectively, along with the trail GRFy propulsive force (% BW to 2% BW), while the trail foot GRFx propulsive force declined from 21% BW to 11% BW. The trail knee straightened to its maximum extended position of 44º around 22 ms, while the pelvis moved forward 11 cm more towards the pitcher in the positive X direction and the lead foot continued to open (63º to 56º). The pelvis also achieved a maximum posterior pelvic tilt of 26º at the very end of the coiling phase and a maximum counter-rotated position of 21º around 25 ms. By the end of the phase, the pelvis began to rotate forward to 14, accelerating to an angular velocity of 239 /s. The upper trunk lagged behind the pelvis, not achieving its maximum counter-rotated global position of 22º until 186 ms. The upper body became more active during coiling. With respect to the pelvis, the upper trunk counter-rotated, going from +2º to 9º. Following this coiling pattern, both shoulders also counter-rotated, with the lead shoulder reaching a minimum azimuth of 3º at the very end of the phase while the trail shoulder reached a minimum azimuth of 84º around 2 ms. Throughout the phase, the lead shoulder elevated from 81º to 88º while the trail shoulder depressed from 8º to 71º. The lead elbow extended further from 78º to 72º and the bat reached its minimum azimuth of 232º around 243 ms. The head also began to rotate, moving from 28º to 34º. The coiling phase ended with the lead foot accepting 5% BW in GRFz at approximately 17 ms Swing Initiation This phase was marked by major movements in the lower body and moderate movements in the upper body. The lead foot GRFx increased rapidly from 11% BW to
75 61 its maximum value of 5% BW while GRFy peaked at 28% BW around 123 ms. By definition, the lead foot GRFz rose quickly during the swing initiation phase from 5% BW to its maximum value of 13% BW. The trail foot GRFy also peaked during this phase (24% BW) around 127 ms, while the trail foot GRFz waned from 47% BW to 34% BW. The lead knee began to extend, going from 48º to 4º, while the trail knee flexed from 47º to 54º. The pelvis continued moving forward a further 5 cm in the positive X direction and also began anteriorly tilting from 26º to 19º, obliquely tilting from 1º to 14º (trail hip towards the ground), and rotating rapidly from 13º to 2º. The pelvis rotated with great acceleration, rising up close to its maximum with a speed of 558º/s by the end of the phase. The upper trunk flexed forward slightly (8º to 13º) throughout the phase and began to rotate forward like the pelvis from 22º to 2º, accelerating to an angular velocity of 61º/s. However, the upper trunk continued to lag behind the pelvis, reaching a maximum separation (i.e. upper trunk rotation angle with respect to pelvis) of 18º at 13 ms. The lead upper arm began to move down and forward, as the shoulder reached a peak elevation of 89º at 146 ms before depressing to 8º by the end of the phase, while the azimuth increased from its minimum value of 3º to 23º, an acceleration resulting in a velocity of 171º/s. The lead elbow extended only slightly (72º to 68º). The trail upper arm dropped and moved forward substantially during this phase (shoulder elevation: 71º to 49º; shoulder azimuth: 78º to 42º), while the trail elbow remained quite flexed throughout (128º to 126º). As expected by the name of the phase, the bat finally began to rotate forward, uncoiling from an azimuth of 225º to 175º. This involved a large acceleration, with a rise in velocity from 236º/s to 1247º/s. The lag
76 62 between the body and bat increased, however, from 121º to 131º. The head peered down from 12º to 18º, laterally flexed toward the trail shoulder from 9º to 15º, and continued rotating away from the pitcher (34º to 41º). The swing initiation phase ended with maximum lead foot GRFz at 93 ms Swing Acceleration The lower body was still very active during the beginning of the swing acceleration phases, while very rapid movements in the upper body occurred just before BC at the end of phase. All of the GRF dissipated during this phase, both in the lead foot (Fx: 5% BW to 13% BW; Fy: 24% BW to 5% BW; Fz: 13% BW to 64% BW) and the trail foot (Fx: 1% BW to 3% BW; Fy: 2% BW to 1% BW; Fz: 34% BW to 15% BW). The lead knee rapidly extended from 4 to 18 throughout the phase, reaching a peak extension velocity of 263 /s at 4 ms. The pelvis also rose in the Z direction 5 cm, while anteriorly tilting from 2 to 8, obliquely tilting from 14 to 27, and rotating nearly 6, approximately facing the pitcher (19 to 77 ). The batter s maximum pelvis rotation velocity was achieved early in the swing acceleration phase, rising to a peak of 581 /s by 7 ms, later slowing to 287 /s by BC. As the batter rotated his entire body during swing acceleration, the lag between the pelvis and the upper trunk decreased from 18 to 2 (global upper trunk angle: 2 to 75 ), and this was facilitated by a maximum upper trunk rotation velocity of 766 /s achieved at 57 ms. This value gradually fell to 43 /s by BC. The upper trunk also laterally flexed slightly toward the trail hip (9 to 4 ).
77 63 The lead upper arm continued as it did in the swing initiation phase by dropping down and forward (shoulder elevation: 81 to 7 ; shoulder azimuth 24 to 1 ), reaching a local peak shoulder azimuth velocity of 342 /s at 43 ms. The lead elbow also extended from 68 to 56. The trail upper arm followed a similar path, dipping down to a minimum just before BC (shoulder elevation: 35 at 23 ms) and continued to rotate forward ( 42 to 9 ), while the trail elbow extended rapidly from 126 to 81, accelerating first to a local maximum peak velocity of 476 /s at 47 ms (trail elbow angle: 19 at 47 ms), briefly decelerating, and then accelerating again to 752 /s by BC. The bat s elevation dropped below parallel, falling from 39º to 3º at BC. The lag between the body and bat increased to a maximum of 133º at 8 ms, but then the bat began to catch up to the body as the lag decreased to 66º by BC. In doing so, the bat moved through an arc of nearly 17º during this phase ( 175º to 7º), accelerating at a tremendous rate to the maximum bat azimuth velocity (2435º/s) at 1 ms. The head continued to laterally flex toward the trail shoulder ( 15º to 31º) throughout the swing acceleration phase and rotated from 41º to a maximum of 49º at 33 ms before beginning to rotate back towards the pitcher (47º at BC) Follow-Through The final phase of the swing was highlighted by some actions that occurred just after BC as well as some decelerating movements. Many of the variables reached a minimum or maximum value at some point during the phase and then slowly began to return in the opposite direction while the body stabilized. The lead foot GRFx and GRFz continued to dissipate, reaching local minimums around +35 ms (Fx: 5% BW; Fz: 51%
78 64 BW) before experiencing an increase to a local maximum around +11 ms (Fx: 23% BW; Fz: 68% BW). Changes in trail foot GRFx and GRFy were minimal, but the trail foot GRFz gradually increased from 13% BW to 41% BW by the end of the phase. The lead foot continued to open up and point towards the pitcher, moving from 49 at BC to 36 around +6 ms, holding steady at that value until around +15 ms before opening further through the end of the phase. The lead knee moved from 18 into its most extended position (11 at +73 ms) before beginning to stabilize to a more flexed position. The pelvis continued to move in all three planes: anteriorly tilting from 8 to a maximum of 16 by +6 ms, obliquely tilting to a maximum of 3 by +93 ms, and rotating from 77 to a local maximum of 85 at +43, counter-rotating a few degrees and then rotating forward to 95 by the end of the phase. The upper trunk reached its maximum forward flexion (16 ) at +3 ms and then extended to a more erect 7 by the end of the phase while the segment rotated forward throughout the phase ( 2 to 4 with respect to pelvis; 75 to 135 globally). The lead upper arm continued its down and forward path, as the shoulder elevation angle lowered from 7 at BC to a minimum of 42 at +14 ms and the azimuth, except for a brief retreat of a few degrees following contact, increased from 3 at +2 ms to 35 by the end of the phase. The lead elbow reached its maximum extension (42 ) at +43 ms and then flexed back up to a local maximum of 73 by the end of follow-through. The trail upper arm moved forward as well, though unlike the lead arm, it rose during followthrough. The trail shoulder elevated from 37º to 77º while the azimuth increased from 9º to 27º. The trail elbow achieved its maximum extension velocity just after BC (868º/s at +17 ms), reached a minimum angle of 37º at +83 ms, and then gradually flexed
79 65 back to 5º by the end of the follow-through phase. The bat followed through by gradually rising back up from 3º to 28º at +15 ms and continuously rotating forward (bat azimuth: 7º to 239º), decelerating from an azimuth velocity of 2233º/s to 827º/s. This quickness in the bat rotation temporarily led to the decrease in the lag between the bat and body, resulting in a minimum bat lag value of 26º at +67 ms that then increased to 68º by the end of the phase. The batter s head straightened and began to move back toward the field; after tilting to its furthest point towards the trail shoulder ( 32º at +3 ms) the head moved back more upright to 11º, all the while rotating from 47º to 11º. 4.2 Analysis of swing biomechanics with changes in pitch location This analysis employed two separate techniques to measure how swing mechanics were modulated when fastballs were thrown to one of five locations (HIGH IN, HIGH OUT, LOW IN, LOW OUT, MIDDLE). The first technique compared swings against pitches to the five location on 34 biomechanical parameters. The second technique used linear regression to identify relationships between those biomechanical parameters and ball exit velocity (BEV) Comparison of swings by pitch location In this section, a table is presented for the weighted mean and standard deviations of the raw data for each of the five subgroups of variables. Each table also denotes any significant post-hoc test results. The tables are followed by a summary of these findings.
80 66 Table 1. Mean ± SD of kinematic angles at BC among the pitch locations (in degrees) Variable HIGH IN HIGH OUT LOW IN LOW OUT MIDDLE Lead Knee Flexion b, e-i 17 ± 4 17 ± 4 15 ± 5 18 ± 4 18 ± 4 Pelvis Rotation a-h, j 79 ± 5 69 ± 8 76 ± 7 61 ± 1 77 ± 6 Upper Trunk Rotation a-j 1 ± 3 ± 5-5 ± 4-8 ± 4-2 ± 4 Lead Shoulder Elevation a-c, e-j 7 ± 4 78 ± 4 63 ± 4 72 ± 4 7 ± 4 Lead Shoulder Azimuth a-h, j 14 ± 8-6 ± 7 ± 1-15 ± 4-1 ± 8 Trail Elbow Flexion a-d, f-j 89 ± 8 77 ± 9 77 ± 1 66 ± 8 81 ± 8 Bat Lag a-f, h-j 79 ± ± ± 1 51 ± 7 65 ± 1 Bat Elevation a-j -24 ± 5-21 ± 4-39 ± 4-33 ± 5-3 ± 5 Bat Azimuth a-c, e, g-j -7 ± ± 12 2 ± ± 1-8 ± 12 Head Rotation a-d, f, h, j 38 ± 5 48 ± 7 48 ± 5 55 ± 4 47 ± 5 a) Significant difference between HIGH IN and HIGH OUT (p<.5) b) Significant difference between HIGH IN and LOW IN (p<.5) c) Significant difference between HIGH IN and LOW OUT (p<.5) d) Significant difference between HIGH IN and MIDDLE (p<.5) e) Significant difference between HIGH OUT and LOW IN (p<.5) f) Significant difference between HIGH OUT and LOW OUT (p<.5) g) Significant difference between HIGH OUT and MIDDLE (p<.5) h) Significant difference between LOW IN and LOW OUT (p<.5) i) Significant difference between LOW IN and MIDDLE (p<.5) j) Significant difference between LOW OUT and MIDDLE (p<.5) Table 2. Mean ± SD of timing of peak kinematic velocities among the pitch locations (in milliseconds relative to BC) Variable HIGH IN HIGH OUT LOW IN LOW OUT MIDDLE Lead Knee Extension a, c, g, i-j -31 ± ± ± ± 21-3 ± 25 Pelvis Rotation a-d, f, h, j -64 ± ± ± ± ± 15 Upper Trunk Rotation c, e, g-h, j -58 ± ± ± ± ± 15 Lead Shoulder Azimuth b-f, i-j -41 ± ± ± ± ± 13 Trail Elbow Extension a-f, i-j 25 ± 2 17 ± 12 3 ± 21 7 ± ± 18 Bat Azimuth a-b, e-i -11 ± 4-14 ± 4-8 ± 4-1 ± 4-1 ± 4 a) Significant difference between HIGH IN and HIGH OUT (p<.5) b) Significant difference between HIGH IN and LOW IN (p<.5) c) Significant difference between HIGH IN and LOW OUT (p<.5) d) Significant difference between HIGH IN and MIDDLE (p<.5) e) Significant difference between HIGH OUT and LOW IN (p<.5) f) Significant difference between HIGH OUT and LOW OUT (p<.5) g) Significant difference between HIGH OUT and MIDDLE (p<.5) h) Significant difference between LOW IN and LOW OUT (p<.5) i) Significant difference between LOW IN and MIDDLE (p<.5) j) Significant difference between LOW OUT and MIDDLE (p<.5)
81 67 Table 3. Mean ± SD of magnitude of peak kinematic velocities among the pitch locations (in degrees per second) Variable HIGH IN HIGH OUT LOW IN LOW OUT MIDDLE Lead Knee Extension a-c, e, g-j 38 ± ± ± ± ± 41 Pelvis Rotation a-j 645 ± ± ± ± ± 38 Upper Trunk Rotation a-j 837 ± ± 8 76 ± ± ± 71 Lead Shoulder Azimuth a-j 489 ± ± ± ± ± 92 Trail Elbow Extension a, c-e, g-j 894 ± ± ± ± ± 169 Bat Azimuth a-c, e-j 243 ± ± ± ± ± 152 a) Significant difference between HIGH IN and HIGH OUT (p<.5) b) Significant difference between HIGH IN and LOW IN (p<.5) c) Significant difference between HIGH IN and LOW OUT (p<.5) d) Significant difference between HIGH IN and MIDDLE (p<.5) e) Significant difference between HIGH OUT and LOW IN (p<.5) f) Significant difference between HIGH OUT and LOW OUT (p<.5) g) Significant difference between HIGH OUT and MIDDLE (p<.5) h) Significant difference between LOW IN and LOW OUT (p<.5) i) Significant difference between LOW IN and MIDDLE (p<.5) j) Significant difference between LOW OUT and MIDDLE (p<.5) Table 4. Mean ± SD of timing of peak GRF among the pitch locations (in milliseconds relative to BC) Variable HIGH IN HIGH OUT LOW IN LOW OUT MIDDLE Trail Foot GRFx b -392 ± 66-4 ± ± ± ± 81 Trail Foot GRFy b, e-f -134 ± ± ± ± ± 15 Trail Foot GRFz -517 ± ± 5-51 ± ± ± 55 Lead Foot GRFx a, c, e, g-h, j -87 ± ± 2-87 ± ± 19-9 ± 17 Lead Foot GRFy -137 ± ± ± ± ± 16 Lead Foot GRFz a, c, g, j -92 ± ± ± ± ± 19 a) Significant difference between HIGH IN and HIGH OUT (p<.5) b) Significant difference between HIGH IN and LOW IN (p<.5) c) Significant difference between HIGH IN and LOW OUT (p<.5) d) Significant difference between HIGH IN and MIDDLE (p<.5) e) Significant difference between HIGH OUT and LOW IN (p<.5) f) Significant difference between HIGH OUT and LOW OUT (p<.5) g) Significant difference between HIGH OUT and MIDDLE (p<.5) h) Significant difference between LOW IN and LOW OUT (p<.5) i) Significant difference between LOW IN and MIDDLE (p<.5) j) Significant difference between LOW OUT and MIDDLE (p<.5)
82 68 Table 5. Mean ± SD of magnitude of peak GRF among the pitch locations (in milliseconds relative to BC) Variable HIGH IN HIGH OUT LOW IN LOW OUT MIDDLE Trail Foot GRFx 25 ± 2 25 ± 2 26 ± 2 25 ± 2 25 ± 2 Trail Foot GRFy a-b, e-i 27 ± 2 29 ± 3 24 ± 3 28 ± 3 28 ± 2 Trail Foot GRFz 97 ± 2 97 ± 3 96 ± 2 94 ± 2 93 ± 2 Lead Foot GRFx a, c, g-j -54 ± 6-53 ± 6-55 ± 5-52 ± 5-56 ± 5 Lead Foot GRFy a, f-g -36 ± 4-34 ± 4-35 ± 3-36 ± 3-36 ± 3 Lead Foot GRFz a, c, e, g-h, j 143 ± ± ± ± ± 12 a) Significant difference between HIGH IN and HIGH OUT (p<.5) b) Significant difference between HIGH IN and LOW IN (p<.5) c) Significant difference between HIGH IN and LOW OUT (p<.5) d) Significant difference between HIGH IN and MIDDLE (p<.5) e) Significant difference between HIGH OUT and LOW IN (p<.5) f) Significant difference between HIGH OUT and LOW OUT (p<.5) g) Significant difference between HIGH OUT and MIDDLE (p<.5) h) Significant difference between LOW IN and LOW OUT (p<.5) i) Significant difference between LOW IN and MIDDLE (p<.5) j) Significant difference between LOW OUT and MIDDLE (p<.5) Variables in this particular analysis can be classified based on the patterning of differences amongst pitch locations. Many of the GRF variables either had no statistically significant findings among the pitch locations or a few results that were, in all practicality, insignificant. Other variables, such as the lead knee flexion angle at BC and the instants of peak upper trunk rotation velocity and peak bat azimuth velocity, also had statistically significant differences among pitch locations that, in all practicality, were rather small. On the other hand, some variables showed a trend for relatively large differences between inside (HIGH IN or LOW IN) and outside (HIGH OUT or LOW OUT) pitches while others showed a trend for relatively large differences between high (HIGH IN or HIGH OUT) and low (LOW IN or LOW OUT) pitches. At BC, the pelvis and lead shoulder and azimuths were rotated more open/forward on inside pitches compared to outside pitches. Peak velocities of lead knee extension, pelvis rotation, lead shoulder azimuth, and bat azimuth were also all greater for inside pitches than outside
83 69 pitches, but the trail elbow extension velocity was greater for outside pitches than inside pitches. The timing of peak lead foot GRFx occurred closer to BC for inside pitches than outside pitches, and the magnitude of the peak lead foot GRFz was greater on inside pitches compared to outside pitches. Looking at the effect of high versus low pitches, the upper trunk position with respect to the pelvis at BC, as well as the peak global upper trunk rotational velocity, were both greater for high pitches compared to low pitches. Also, the bat was elevated more for high pitches and less for low pitches. The instants of peak lead shoulder azimuth velocity and trail elbow extension velocity occurred earlier in the swing (relative to the time of BC) for low pitches compared to high pitches. A few variables showed large differences between HIGH IN and LOW OUT without necessarily demonstrating the more generalized relationship of inside versus outside pitches or high versus low pitches as other variables did, while the remaining variables that had statistically significant findings of practical importance had slightly more complex patterns. The trail elbow flexion angle at BC was 23º more bent for HIGH IN than LOW OUT pitches. At BC, the bat lagged behind the body approximately 25º more for HIGH IN than LOW OUT pitches, but the values for the other three locations were in between the bat lag of HIGH IN and LOW OUT with much smaller differences among them. The head s position at BC was rotated in to track the ball approximately 17º more for LOW OUT than HIGH IN pitches, while the values for the other three locations were in between those values and had no statistically significant differences. The instant of peak pelvis rotation velocity also displayed this pattern, with the pelvis maximally rotating approximately 19 ms earlier (relative to the time of BC) for LOW OUT compared to HIGH IN, with no statistically significant differences among MIDDLE,
84 7 LOW IN, and HIGH OUT pitches, all with values in between those of HIGH IN and LOW OUT. The time of peak lead knee extension velocity was 15 ms earlier for LOW OUT than HIGH IN and effectively represented the largest significant difference, though there was no pattern among the values at the other pitch locations. The shoulder was elevated 15º more at BC for HIGH OUT than LOW IN, but swings against the LOW OUT, MIDDLE, and HIGH IN pitches had similar shoulder elevations that were all in between the values for HIGH OUT and LOW IN. Lastly, no recognizable pattern was seen in the time of peak lead foot GRFz, HIGH IN and MIDDLE occurring closer to BC and LOW IN, LOW OUT, and HIGH OUT occurring earlier Relationships between biomechanical parameters and BEV In this second section, each biomechanical parameter is systematically presented in the following manner: a scatterplot of the raw data displaying the parameter against BEV, an analysis of variance table showcasing the significant parameters associated with BEV, an equation derived from that GLM and all of its coefficients for the biomechanical parameter, subject (µ), pitch location (LOC), pitch speed (PS), and the relevant interaction terms among these parameters (when applicable), an interpretive description of the data based on all available data, and a subsequent plot of the subject-independent model estimates of the BEV over the measured range of the biomechanical parameter (when applicable). Apart from statistically significant findings, results that are of practical significance are also discussed. As a guide, any effect that led to a BEV difference of greater than ±2. m/s was considered practically significant.
85 Lead knee flexion at BC Lead Knee Flexion at BC HIGH IN HIGH OUT LOW IN BEV (m/s) 5 4 LOW OUT MIDDLE Lead Knee Flexion (deg) Figure 3. Lead knee flexion angle at BC across BEV (raw data) Table 6. Analysis of variance for lead knee flexion angle at BC Source DF Seq SS Adj SS Adj MS F P Lead Knee Flexion Subject Location PS Subject*PS Error Total As seen in Table 6, there was not a significant relationship between lead knee flexion at BC and BEV. Thus, no equation or graph of estimated BEV versus lead knee flexion at BC was developed.
86 Pelvis rotation at BC Pelvis Rotation at BC HIGH IN HIGH OUT LOW IN BEV (m/s) 5 4 LOW OUT MIDDLE Pelvis Rotation (deg) Figure 4. Pelvis rotation angle at BC across BEV (raw data) Table 7. Analysis of variance for pelvis rotation angle at BC Source DF Seq SS Adj SS Adj MS F P Pelvis Rotation Subject Location PS Subject*Pelvis Rotation Subject*PS Error Total Eq. 1: BEV = *Pelvis Rotation BC + A*μ + B*LOC *PS + C*μ*Pelvis Rotation BC + D*μ*PS In Eq. 1, the coefficients were A: [ 15. to 15.4], B: [HIGH IN = 2.26, HIGH OUT =.32, LOW IN =.3, LOW OUT =.81], C: [.25 TO.2], and D: [ 4.3 to 4.6]. In practicality, increases in BEV were associated with increased (i.e.
87 73 more open) pelvis rotation angle at BC for all pitch locations. According to the model, the difference between the minimum and maximum measured values of pelvis rotation (24.79º to 17.48º, respectively) would lead to a BEV difference of +4.4 m/s. Figure 5 below visualizes the model-estimated BEV based on the range of measured values of pelvis rotation angle at BC. Figure 5. Model estimate of average BEV across values of pelvis rotation angle at BC.
88 Upper trunk rotation with respect to the pelvis at BC Upper Trunk Rotation at BC HIGH IN HIGH OUT LOW IN BEV (m/s) 5 4 LOW OUT MIDDLE Upper Trunk Rotation (deg) Figure 6. Upper trunk rotation angle at BC across BEV (raw data) Table 8. Analysis of variance for upper trunk rotation angle at BC Source DF Seq SS Adj SS Adj MS F P Upper Trunk Rotation Subject Location PS Subject*Upper Trunk Rotation Subject*PS Error Total Eq. 2: BEV = *Upper Trunk Rotation BC + A*µ + B*LOC +.86*PS + C*µ*Upper Trunk Rotation BC + D*µ*PS In Eq. 2, the ranges for the coefficients were A: [ 97.2 to ], B: [HIGH IN = 1.63, HIGH OUT =.1, LOW IN =.3, LOW OUT =.11], C: [.57 to.53], and D: [ 4.91 to 3.95]. In practicality, increases in BEV were associated with a
89 75 decreased (i.e. more closed) upper trunk rotation angle at BC for all pitch locations. According to the model, the difference between the minimum and maximum measured values of upper trunk rotation ( 27.55º to 29.28º, respectively) would lead to a BEV difference of 3.23 m/s. Figure 7 below visualizes the model-estimated BEV based on the range of measured values of upper trunk rotation angle with respect to pelvis at BC. Figure 7. Model estimate of average BEV across values of upper trunk rotation angle with respect to pelvis at BC.
90 Lead shoulder elevation at BC Lead Shoulder Elevation at BC HIGH IN HIGH OUT LOW IN BEV (m/s) 5 4 LOW OUT MIDDLE Lead Shoulder Elevation (deg) Figure 8. Lead shoulder elevation angle at BC across BEV (raw data) Table 9. Analysis of variance for lead shoulder elevation angle at BC Source DF Seq SS Adj SS Adj MS F P Lead Shoulder Elevation Subject Location PS Subject*PS Error Total As seen in Table 9, there was not a significant relationship between lead shoulder elevation angle at BC and BEV. Thus, no equation or graph of estimated BEV versus lead shoulder elevation angle at BC was developed.
91 Lead shoulder azimuth at BC Lead Shoulder Azimuth at BC HIGH IN HIGH OUT LOW IN BEV (m/s) 5 4 LOW OUT MIDDLE Lead Shoulder Azimuth (deg) Figure 9. Lead shoulder azimuth at BC across BEV (raw data) Table 1. Analysis of variance for lead shoulder azimuth at BC Source DF Seq SS Adj SS Adj MS F P Lead Shoulder Azimuth Subject Location PS Location*Lead Shoulder Azimuth Subject*PS Error Total Eq. 3: BEV = *Lead Shoulder Azimuth BC + A*µ + B*LOC +.1*PS + C*LOC*Lead Shoulder Azimuth BC + D*µ*PS In Eq. 3, the ranges for the coefficients were A: [ 113. to 93.1], B: [HIGH IN =.51, HIGH OUT =.5, LOW IN =.2, LOW OUT =.38], C: [HIGH IN =.8, HIGH OUT =.2, LOW IN =.1, LOW OUT =.9], and D: [ to
92 ]. In practicality, increases in BEV were associated with decreased lead shoulder azimuth at BC (i.e. less horizontal abduction) for HIGH IN, LOW IN, MIDDLE, and HIGH OUT and increased lead shoulder azimuth at BC (i.e. more horizontal abduction) for LOW OUT. According to the model, the difference between the minimum and maximum measured values of lead shoulder azimuth ( 29.5º to 4.23º, respectively) would lead to a BEV difference of 9.82 m/s for HIGH IN, 4.82 m/s for LOW IN, 3.92 m/s for MIDDLE, and 2.69 m/s for HIGH OUT, but m/s for LOW OUT. Figure 1 below visualizes the model-estimated BEV based on the range of measured values of lead shoulder azimuth at BC. Figure 1. Model estimate of average BEV across values of lead shoulder azimuth at BC.
93 Trail elbow flexion at BC Trail Elbow Flexion at BC HIGH IN HIGH OUT LOW IN BEV (m/s) 5 4 LOW OUT MIDDLE Trail Elbow Flexion (deg) Figure 11. Trail elbow flexion angle at BC across BEV (raw data) Table 11. Analysis of variance for trail elbow flexion angle at BC Source DF Seq SS Adj SS Adj MS F P Trail Elbow Flexion Subject Location PS Subject*Trail Elbow Flexion Location*Trail Elbow Flexion Error Total Eq. 4: BEV = *Trail Elbow Flexion BC + A*µ + B*LOC +.78*PS + C*µ*Trail Elbow Flexion BC + D*LOC*Trail Elbow Flexion BC In Eq. 4, the ranges for the coefficients were A: [ 13.1 to 13.23], B: [HIGH IN = 7.6, HIGH OUT = 4.6, LOW IN =.33, LOW OUT = 6.9], C: [.29 to.3], and D: [HIGH IN =.1, HIGH OUT =.5, LOW IN =.1, LOW OUT =.9]. In
94 8 practicality, increases in BEV were associated with decreased trail elbow flexion at BC (i.e. more extended) for HIGH IN, LOW IN, and MIDDLE. According to the model, the difference between the minimum and maximum measured values of trail elbow flexion (33.92º to º, respectively) would lead to a BEV difference of m/s for HIGH IN, 6.26 m/s for LOW IN, 5.35 m/s for MIDDLE, and 1.69 m/s for HIGH OUT, but m/s for LOW OUT. Figure 12 below visualizes the model-estimated BEV based on the range of measured values of trail elbow flexion at BC. Figure 12. Model estimate of average BEV across values of trail elbow flexion at BC.
95 Bat lag at BC Bat Lag at BC HIGH IN HIGH OUT LOW IN BEV (m/s) 5 4 LOW OUT MIDDLE Bat Lag (deg) Figure 13. Bat lag angle at BC across BEV (raw data) Table 12. Analysis of variance for bat lag angle at BC Source DF Seq SS Adj SS Adj MS F P Bat Lag Subject Location PS Location*Bat Lag Error Total Eq. 5: BEV = *Bat Lag BC + A*µ + B*LOC +.94*PS + C*LOC*Bat Lag BC In Eq. 5, the ranges for the coefficients were A: [ 3.68 to 4.79], B: [HIGH IN = 7.52, HIGH OUT =.71, LOW IN = 2.42, LOW OUT = 8.29], and C: [HIGH IN =.12, HIGH OUT = 1.13e 3, LOW IN =.3, LOW OUT =.15]. In practicality, increases in BEV were associated with decreased bat lag at BC for HIGH IN and
96 82 increased bat lag at BC for LOW OUT. According to the model, the difference between the minimum and maximum values of bat lag would lead to a BEV difference of m/s for HIGH IN, 1.51 m/s for HIGH OUT, 1.41 m/s for MIDDLE, +1. m/s for LOW IN, and m/s for LOW OUT. Figure 14 below visualizes the modelestimated BEV based on the range of measured values of bat lag at BC (25.64 to ). Figure 14. Model estimate of average BEV across values of bat lag angle at BC.
97 Bat elevation at BC Bat Elevation at BC HIGH IN HIGH OUT LOW IN BEV (m/s) 5 4 LOW OUT MIDDLE Bat Elevation (deg) Figure 15. Bat elevation angle at BC across BEV (raw data) Table 13. Analysis of variance for bat elevation angle at BC Source DF Seq SS Adj SS Adj MS F P Bat Elevation Subject Location PS Subject*PS Error Total As seen in Table 13, there was not a significant relationship between bat elevation angle at BC and BEV. Thus, no equation or graph of estimated BEV versus lead shoulder elevation angle at BC was developed.
98 Bat azimuth Bat Azimuth at BC HIGH IN HIGH OUT LOW IN BEV (m/s) 5 4 LOW OUT MIDDLE Bat Azimuth (deg) Figure 16. Bat azimuth at BC across BEV (raw data) Table 14. Analysis of variance for bat azimuth at BC Source DF Seq SS Adj SS Adj MS F P Bat Azimuth Subject Location PS Location*Bat Azimuth Error Total Eq. 6: BEV = *Bat Azimuth BC + A*µ + B*LOC +.85*PS + C*LOC*Bat Azimuth BC In Eq. 6, the ranges for the coefficients were A: [ 3.61 to 3.89], B: [HIGH IN = 1.7, HIGH OUT =.13, LOW IN =.2, LOW OUT =.68], and C: [HIGH IN =.11, HIGH OUT = 2.23e 3, LOW IN =.7, LOW OUT =.8]. In practicality, increases in BEV were associated with decreased bat azimuth at BC for LOW IN and
99 85 LOW OUT and with increased bat azimuth at BC for HIGH IN. According to the model, the difference between the minimum and maximum measured values of bat azimuth ( 44.3 and 38.7, respectively) would lead to a BEV difference of 4.95 m/s for LOW OUT, 3.97 m/s for LOW IN, m/s for HIGH OUT, for MIDDLE, and m/s for HIGH IN. Figure 17 below visualizes the model-estimated BEV based on the range of measured values of bat azimuth at BC. Figure 17. Model estimate of average BEV across values of bat azimuth at BC.
100 Head rotation at BC Head Rotation at BC HIGH IN HIGH OUT LOW IN BEV (m/s) 5 4 LOW OUT MIDDLE Head Rotation (deg) Figure 18. Head rotation angle at BC across BEV (raw data) Table 15. Analysis of variance for head rotation angle at BC Source DF Seq SS Adj SS Adj MS F P Head Rotation Subject Location PS Subject*Head Rotation Subject*PS Error Total Eq. 7: BEV = *Head Rotation BC + A*μ + B*LOC + 1.1*PS + C*µ*Head Rotation BC + D*µ*PS In Eq. 7, the ranges for the coefficients were A: [ to 15.41], B: [HIGH IN = 1.68, HIGH OUT =.17, LOW IN =.2, LOW OUT =.6], C: [.26 to.25], and D: [ 4. to 4.57]. In practicality, there was no significant group-wise association between head rotation at BC and BEV. According to the model, the difference between
101 87 the minimum and maximum measured values of head rotation (17.64º and 79.21º, respectively) would lead to a BEV difference of +.64 m/s. Figure 19 below visualizes the model-estimate BEV based on the range of measured values of head rotation at BC. Figure 19. Model estimate of average BEV across values of head rotation angle at BC.
102 Time of peak lead knee extension velocity Time of peak lead knee extension velocity HIGH IN HIGH OUT LOW IN BEV (m/s) 5 4 LOW OUT MIDDLE Time (ms relative to BC) Figure 2. Time of peak lead knee extension velocity across BEV (raw data) Table 16. Analysis of variance for time of peak lead knee extension velocity Source DF Seq SS Adj SS Adj MS F P Knee time Subject Location PS Subject*PS Error Total As seen in Table 16, there was not a significant relationship between the time of peak lead knee extension velocity and BEV. Thus no equation or graph of estimated BEV versus time of peak lead knee extension velocity was developed.
103 Time of peak pelvis rotation velocity Time of Peak Pelvis Rotation Velocity HIGH IN HIGH OUT LOW IN BEV (m/s) 5 4 LOW OUT MIDDLE Time (ms relative to BC) Figure 21. Time of peak pelvis rotation velocity across BEV (raw data) Table 17. Analysis of variance for time of peak pelvis rotation velocity Source DF Seq SS Adj SS Adj MS F P Pelvis time Subject Location PS Subject*PS Error Total As seen in Table 17, there was not a significant relationship between the time of peak pelvis rotation velocity and BEV. Thus no equation or graph of estimated BEV versus time of peak pelvis rotation velocity was developed.
104 Time of peak upper trunk rotation velocity Time of Peak Upper Trunk Rotation Velocity HIGH IN HIGH OUT LOW IN BEV (m/s) 5 4 LOW OUT MIDDLE Time (ms relative to BC) Figure 22. Time of peak upper trunk rotation velocity across BEV (raw data) Table 18. Analysis of variance for time of peak upper trunk rotation velocity Source DF Seq SS Adj SS Adj MS F P Upper Trunk time Subject Location PS Location*Upper Trunk time Subject*PS Error Total Eq. 8: BEV = e-3*Upper Trunk Rotation Velocity time + A*µ + B*LOC +.94*PS + C*LOC*Upper Trunk Rotation Velocity time +D*µ*PS In Eq. 8, the ranges for the coefficients were A: [ to 8.6], B: [HIGH IN = 5.1, HIGH OUT = 1.4, LOW IN =.42, LOW OUT = 4.3], and C: [HIGH IN =.5, HIGH OUT =.1, LOW IN =.1, LOW OUT =.6]. In practicality,
105 91 increases in BEV were associated with an earlier (relative to the time of BC) peak upper trunk rotation velocity for HIGH IN and with a later peak upper trunk rotation velocity for HIGH OUT and LOW OUT. According to the model, the difference between the minimum and maximum measured of values of the time of peak upper trunk rotation velocity ( ms and. ms, respectively) would lead to a BEV difference of 7.11 m/s for HIGH IN, +.76 m/s for MIDDLE, m/s for LOW IN, m/s for HIGH OUT, m/s for LOW OUT. Figure 23 below visualizes the model-estimated BEV based on the range of measured values of the time of peak upper trunk rotation velocity. Figure 23. Model estimate of average BEV across values of time of peak upper trunk rotation velocity.
106 Time of peak lead shoulder azimuth velocity Time of Peak Lead Shoulder Azimuth Velocity HIGH IN HIGH OUT LOW IN BEV (m/s) 5 4 LOW OUT MIDDLE Time (ms relative to BC) Figure 24. Time of peak lead shoulder azimuth velocity across BEV (raw data) Table 19. Analysis of variance for time of peak lead shoulder azimuth velocity Source DF Seq SS Adj SS Adj MS F P Lead Shoulder Azimuth time Subject Location PS PS*Lead Shoulder Azimuth time Error Total Eq. 9: BEV = *Lead Shoulder Azimuth Velocity time + A*µ + B*LOC *PS +.3*PS*Lead Shoulder Azimuth Velocity time In Eq. 9, the ranges for the coefficients were A: [ 4.17 to 3.98] and B: [HIGH IN = 1.74, HIGH OUT =.28, LOW IN =.2, LOW OUT =.23]. In practicality, increases in BEV were associated an earlier (relative to the time of BC) peak lead shoulder azimuth velocity for all pitch locations, but this effect was only true at low and
107 93 medium PS. According to the model, the difference between the minimum and maximum measured values of the time of peak lead shoulder azimuth velocity ( ms and ms, respectively) would lead to a BEV difference of m/s at three standard deviations below the mean PS (23.2 m/s), 5.98 m/s at the mean PS (25. m/s), and +.3 m/s at three standard deviations above the mean PS (26.8 m/s) for all pitch locations. Figures below visualize the model-estimated BEV based on the range of measured values of the time of peak lead shoulder azimuth velocity for low (i.e. mean 3 SD) PS, medium (i.e. mean) PS, and high (i.e. mean + 3 SD) PS. Figure 25. Model estimate of average BEV across values of time of peak lead shoulder azimuth velocity at low PS.
108 94 Figure 26. Model estimate of average BEV across values of time of peak lead shoulder azimuth velocity at medium PS. Figure 27. Model estimate of average BEV across values of time of peak lead shoulder azimuth velocity at high PS.
109 Time of peak trail elbow extension velocity Time of Peak Trail Elbow Extension Velocity HIGH IN HIGH OUT LOW IN BEV (m/s) 5 4 LOW OUT MIDDLE Time (ms relative to BC) Figure 28. Time of peak trail elbow extension velocity across BEV (raw data). Table 2. Analysis of variance for time of peak trail elbow extension velocity Source DF Seq SS Adj SS Adj MS F P Trail Elbow Ext time Subject Location PS Location*Trail Elbow Ext time Error Total Eq. 1: BEV = *Trail Elbow Extension Velocity time + A*μ + B*LOC +.71*PS + C*LOC*Trail Elbow Extension Velocity time In Eq. 1, the ranges for the coefficients were A: [ 4.24 to 4.64], B: [HIGH IN = 1.57, HIGH OUT =.3, LOW IN =.1, LOW OUT =.35], and C: [HIGH IN =.1, HIGH OUT =.2, LOW IN = 3.6e 4, LOW OUT =.6]. In practicality, increases in BEV were associated with earlier (relative to the time of BC) peak trail
110 96 elbow extension velocity for HIGH IN and HIGH OUT and later peak trail elbow extension velocity for LOW OUT. According to the model, the difference between the minimum and maximum measured values of the time of peak trail elbow extension velocity ( ms and ms, respectively) would lead to a BEV difference of 4.64 m/s for HIGH OUT, 3.19 m/s for HIGH IN,.88 m/s for LOW IN,.82 m/s for MIDDLE, and m/s for LOW OUT. Figure 29 below visualizes the modelestimated BEV based on the range of measured values of the time of peak trail elbow extension velocity. Figure 29. Model estimate of average BEV across values of time of peak trail elbow extension velocity.
111 Time of peak lead bat azimuth velocity Time of Peak Bat Azimuth Velocity HIGH IN HIGH OUT LOW IN BEV (m/s) 5 4 LOW OUT MIDDLE Time (ms relative to BC) Figure 3. Time of peak bat azimuth velocity across BEV (raw data) Table 21. Analysis of variance for time of peak bat azimuth velocity Source DF Seq SS Adj SS Adj MS F P Bat Azimuth time Subject Location PS Location*Bat Azimuth time Error Total Eq. 11: BEV = *Bat Azimuth Velocity time + A*μ + B*LOC + 1.2*PS + C*LOC*Bat Azimuth Velocity time In Eq. 11, the ranges for the coefficients were A: [ 4.34 to 5.4], B: [HIGH IN = 4.94, HIGH OUT =.39, LOW IN = 1.21, LOW OUT = 2.84], and C: [HIGH IN =.3, HIGH OUT =.4, LOW IN =.3, LOW OUT =.24]. In practicality, increases in BEV were associated with earlier (relative to the time of BC) peak bat
112 98 azimuth velocity for all pitch locations, though to different extents. According to the model, the difference between the minimum and maximum measured values of the time of peak bat azimuth velocity ( ms to ms, respectively) would leave to a BEV difference of m/s for HIGH IN, 11.8 m/s for MIDDLE, 1.49 m/s for LOW IN, 1.12 m/s for HIGH OUT, and 2.12 m/s for LOW OUT. Figure 31 below visualizes the model-estimated BEV based on the range of measured values of the time of peak bat azimuth velocity. Figure 31. Model estimate of average BEV across values of time of peak bat azimuth velocity.
113 Peak lead knee extension velocity Peak Lead Knee Extension Velocity HIGH IN HIGH OUT LOW IN BEV (m/s) 5 4 LOW OUT MIDDLE Lead Knee Extension Velocity (deg/s) Figure 32. Peak lead knee extension velocity across BEV (raw data) Table 22. Analysis of variance for peak lead knee extension velocity Source DF Seq SS Adj SS Adj MS F P Lead Knee Speed Subject Location PS Subject*PS Error Total As seen in Table 22, there was not a significant relationship between the peak lead knee extension velocity and BEV. Thus no equation or graph of estimated BEV versus peak lead knee extension velocity was developed.
114 Peak pelvis rotation velocity Peak Pelvis Rotation Velocity HIGH IN HIGH OUT LOW IN BEV (m/s) 5 4 LOW OUT MIDDLE Pelvis Rotation Velocity (deg/s) Figure 33. Peak pelvis rotation velocity across BEV (raw data) Table 23. Analysis of variance for peak pelvis rotation velocity Source DF Seq SS Adj SS Adj MS F P Pelvis speed Subject Location PS Subject*Pelvis speed Subject*PS Error Total Eq. 12: BEV = e 3*Pelvis Rotation Velocity + A*µ + B*LOC +.9*PS + C*µ*Pelvis Rotation Velocity + D*µ*PS In Eq. 12, the ranges for the coefficients were A: [ to 11.94], B: [HIGH IN = 1.84, HIGH OUT =.23, LOW IN =.2, LOW OUT =.26], C: [.5 to.5], and D: [ 3.96 to 4.3]. In practicality, there was no significant group-wise association
115 11 between peak pelvis rotation velocity and BEV. According to the model, the difference between the minimum and maximum measured values of pelvis rotation velocity (273.16º/s and º/s, respectively) would lead to a BEV difference of +.91 m/s. Figure 34 below visualizes the model-estimated BEV based on the range of measured values of peak pelvis rotation velocity. Figure 34. Model estimate of average BEV acroos values of peak pelvis rotation velocity.
116 Peak upper trunk rotation velocity Peak Upper Trunk Rotation Velocity HIGH IN HIGH OUT LOW IN BEV (m/s) 5 4 LOW OUT MIDDLE Upper Trunk Rotation Velocity (deg/s) Figure 35. Peak upper trunk rotation velocity across BEV (raw data) Table 24. Analysis of variance for peak upper trunk rotation velocity Source DF Seq SS Adj SS Adj MS F P Upper Trunk speed Subject Location PS Subject*PS Error Total As seen in Table 24, there was not a significant relationship between the peak upper trunk velocity and BEV. Thus no equation or graph of estimated BEV versus peak upper trunk velocity was developed.
117 Peak lead shoulder azimuth velocity Peak Lead Shoulder Azimuth Velocity HIGH IN HIGH OUT LOW IN BEV (m/s) 5 4 LOW OUT MIDDLE Lead Shoulder Azimuth Velocity (deg/s) Figure 36. Peak lead shoulder azimuth velocity across BEV (raw data) Table 25. Analysis of variance for peak lead shoulder azimuth velocity Source DF Seq SS Adj SS Adj MS F P Lead Shoulder Azim speed Subject Location PS Subject*Lead Shoulder Azim speed Location*Lead Shoulder Azim speed PS*Lead Shoulder Azim speed Subject*PS Error Total Eq. 13: BEV = *Lead Shoulder Azimuth Velocity + A*µ + B*LOC.77*PS + C*µ*Lead Shoulder Azimuth Velocity + D*LOC*Lead Shoulder Azimuth Velocity e 3*PS*Lead Shoulder Azimuth Velocity + E*µ*PS In Eq. 13, the ranges for the coefficients were A: [ to 12.46], B: [HIGH IN = 3.2, HIGH OUT = 1.36, LOW IN = 1.1, LOW OUT =.77], C: [.2 to.2], D: [HIGH IN =.1, HIGH OUT = 2.73e 3, LOW IN = 3.38e 3, LOW OUT =
118 14.1], and E: [ 4.57 to 4.16]. Increases in BEV were associated with changes in peak lead shoulder azimuth velocity, but the effects varied based both on LOC and PS. According to the model, the difference between the minimum and maximum measured values of lead shoulder azimuth velocity (59.11º/s and 86.1, respectively) at low PS (23.2 m/s) would lead to a BEV difference of m/s for HIGH IN, 14.8 m/s for LOW IN, m/s for MIDDLE, 9.52 m/s for HIGH OUT, and 4.73 m/s for LOW OUT. At medium PS (25. m/s), the effect on BEV would be m/s for HIGH IN, 7.39 m/s for LOW IN, 4.87 m/s for MIDDLE, 2.83 m/s for HIGH OUT, and m/s for LOW OUT. At high PS (26.8 m/s), the effect on BEV would be 5.98 m/s for HIGH IN,.7 m/s for LOW IN, for MIDDLE, m/s for HIGH OUT, and m/s for LOW OUT. Figures below visualize the model-estimated BEV based on the range of measured values of peak lead shoulder azimuth velocity for low (i.e. mean 3 SD), medium (i.e. mean), and high PS (i.e. mean + 3 SD). Figure 37. Model estimate of average BEV across values of peak lead shoulder azimuth velocity at low PS.
119 15 Figure 38. Model estimate of average BEV across values of peak lead shoulder azimuth velocity at medium PS. Figure 39. Model estimate of average BEV across values of peak lead shoulder azimuth velocity at high PS.
120 Peak trail elbow extension velocity Peak Trail Elbow Extension Velocity HIGH IN HIGH OUT LOW IN BEV (m/s) 5 4 LOW OUT MIDDLE Trail Elbow Extension Velocity (deg/s) Figure 4. Peak trail elbow extension velocity across BEV (raw data) Table 26. Analysis of variance for peak trail elbow extension velocity Source DF Seq SS Adj SS Adj MS F P Trail Elbow Ext speed Subject Location PS Subject*PS Error Total As seen in Table 26, there was not a significant relationship between the peak trail elbow extension velocity and BEV. Thus no equation or graph of estimated BEV versus peak trail elbow extension velocity was developed.
121 Peak bat azimuth velocity Peak Bat Azimuth Velocity HIGH IN HIGH OUT LOW IN BEV (m/s) 5 4 LOW OUT MIDDLE Bat Azimuth Velocity (deg/s) Figure 41. Peak bat azimuth velocity across BEV (raw data) Table 27. Analysis of variance for peak bat azimuth velocity Source DF Seq SS Adj SS Adj MS F P Bat Azimuth speed Subject Location PS Location*Bat Azimuth speed Error Total Eq. 14: BEV = e 4*Bat Azimuth Velocity + A*μ + B*LOC +.83*PS + C*LOC*Bat Azimuth Velocity In Eq. 14, the ranges for the coefficients were A: [ 3.94 to 3.94], B: [HIGH IN = 9.91, HIGH OUT = 4.5, LOW IN = 11.34, LOW OUT = 5.62], and C: [HIGH IN = 3.22e 3, HIGH OUT = 1.73e 3, LOW IN = 4.18e 3, LOW OUT = 2.38e 3]. In practicality, increases in BEV were associated with decreased (i.e. slower) peak bat
122 18 azimuth velocity for LOW IN and LOW OUT and increased (i.e. faster) peak bat azimuth velocity for HIGH IN and HIGH OUT. According to the model, the difference between the minimum and maximum measured values of bat azimuth velocity (1768.2º/s and º/s, respectively) would lead to a BEV difference of 6.89 m/s for LOW IN, 3.51 m/s for LOW OUT, +.95 m/s for MIDDLE, m/s for HIGH OUT, and m/s for HIGH IN. Figure 42 below visualizes the model-estimated BEV based on the range of measured values of peak bat azimuth velocity. Figure 42. Model estimate of average BEV across values of peak bat azimuth velocity.
123 Time of peak trail foot GRFx Time of Peak Trail Foot GRFx HIGH IN HIGH OUT LOW IN BEV (m/s) 5 4 LOW OUT MIDDLE Time (ms relative to BC) Figure 43. Time of peak trail foot GRFx across BEV (raw data) Table 28. Analysis of variance for time of peak trail foot GRFx Source DF Seq SS Adj SS Adj MS F P TF GRFx time Subject Location PS Error Total As seen in Table 28, there was not a significant relationship between time of peak trail foot GRFx and BEV. Thus no equation or graph of estimated BEV versus time of peak trail foot GRFx was developed.
124 Time of peak trail foot GRFy Time of Peak Trail Foot GRFy HIGH IN HIGH OUT LOW IN BEV (m/s) 5 4 LOW OUT MIDDLE Time (ms relative to BC) Figure 44. Time of peak trail foot GRFy across BEV (raw data) Table 29. Analysis of variance for time of peak trail foot GRFy Source DF Seq SS Adj SS Adj MS F P TF GRFy time Subject Location PS Error Total As seen in Table 29, there was not a significant relationship between time of peak trail foot GRFy and BEV. Thus no equation or graph of estimated BEV versus time of peak trail foot GRFy was developed.
125 Time of peak trail foot GRFz Time of Peak Trail Foot GRFz HIGH IN HIGH OUT LOW IN BEV (m/s) 5 4 LOW OUT MIDDLE Time (ms relative to BC) Figure 45. Time of peak trail foot GRFz across BEV (raw data) Table 3. Analysis of variance of time of peak trail foot GRFz Source DF Seq SS Adj SS Adj MS F P TF GRFz time Subject Location PS Error Total As seen in Table 3, there was not a significant relationship between time of peak trail foot GRFz and BEV. Thus no equation or graph of estimated BEV versus time of peak trail foot GRFz was developed.
126 Time of peak lead foot GRFx Time of Peak Lead Foot GRFx HIGH IN HIGH OUT LOW IN BEV (m/s) 5 4 LOW OUT MIDDLE Time (ms relative to BC) Figure 46. Time of peak lead foot GRFx across BEV (raw data) Table 31. Analysis of variance for time of peak lead foot GRFx Source DF Seq SS Adj SS Adj MS F P LF GRFx time Subject Location PS Error Total Eq. 15: BEV = *Lead Foot GRFx time + A*μ + B*LOC +.7*PS In Eq. 15, the ranges for the coefficients were A: [ 3.74 to 4.25] and B: [HIGH IN = 1.92, HIGH OUT =.2, LOW IN =.2, LOW OUT =.56]. In practicality, increases in BEV were associated with later (relative to the time of BC) peak lead foot GRFx for all pitch locations. According to the model, the difference between the
127 113 minimum and maximum measured values of the time of peak lead foot GRFx ( ms and 1. ms, respectively) would lead to a BEV difference of m/s. Figure 47 below visualizes the model-estimated BEV based on the range of measured values of the time of peak lead foot GRFx. Figure 47. Model estimate of average BEV across values of time of peak lead foot GRFx.
128 Time of peak lead foot GRFy Time of Peak Lead Foot GRFy HIGH IN HIGH OUT LOW IN BEV (m/s) 5 4 LOW OUT MIDDLE Time (ms relative to BC) Figure 48. Time of peak lead foot GRFy across BEV (raw data) Table 32. Analysis of variance for time of peak lead foot GRFy Source DF Seq SS Adj SS Adj MS F P LF GRFy time Subject Location PS Error Total As seen in Table 32, there was not a significant relationship between time of peak lead foot GRFy and BEV. Thus no equation or graph of estimated BEV versus time of peak lead foot GRFy was developed.
129 Time of peak lead foot GRFz Time of Peak Lead Foot GRFz HIGH IN HIGH OUT LOW IN BEV (m/s) 5 4 LOW OUT MIDDLE Time (ms relative to BC) Figure 49. Time of peak lead foot GRFz across BEV (raw data) Table 33. Analysis of variance for time of peak lead foot GRFz Source DF Seq SS Adj SS Adj MS F P LF GRFz time Subject Location PS Error Total Eq. 16: BEV = *Lead Foot GRFz time + A*μ + B*LOC +.79*PS In Eq. 16, the ranges for the coefficients were A: [ 4.26 to 4.9] and B: [HIGH IN = 1.99, HIGH OUT =.21, LOW IN =.1, LOW OUT =.56]. In practicality, increases in BEV were associated with later (relative to the time of BC) peak lead foot GRFz. According to the model, the difference between the minimum and maximum measured values of the time of peak lead foot GRFz ( and 1. ms,
130 116 respectively) would lead to a BEV difference of m/s. Figure 5 below visualizes the model-estimated BEV based on the range of measured values of the time of peak lead foot GRFz. Figure 5. Model estimate of average BEV across values of time of peak lead foot GRFz.
131 Peak trail foot GRFx Peak Trail Foot GRFx HIGH IN HIGH OUT LOW IN BEV (m/s) 5 4 LOW OUT MIDDLE GRF (%BW) Figure 51. Peak trail foot GRFx across BEV (raw data) Table 34. Analysis of variance for peak trail foot GRFx Source DF Seq SS Adj SS Adj MS F P TF GRFx Subject Location PS Error Total As seen in Table 3, there was not a significant relationship between the peak trail foot GRFx and BEV. Thus no equation or graph of estimated BEV versus the peak trail foot GRFx was developed.
132 Peak trail foot GRFy Peak Trail Foot GRFy HIGH IN HIGH OUT LOW IN BEV (m/s) 5 4 LOW OUT MIDDLE GRF (%BW) Figure 52. Peak trail foot GRFy across BEV (raw data) Table 35. Analysis of variance for peak trail foot GRFy Source DF Seq SS Adj SS Adj MS F P TF GRFy Subject Location PS Subject*TF GRFy Subject*PS Error Total Eq. 17: BEV = *Trail Foot GRFy + A*µ + B*LOC *PS + C*µ*Trail Foot GRFy + D*µ*PS In Eq. 17, the ranges for the coefficients were A: [ to 91.64], B: [HIGH IN = 1.92, HIGH OUT =.1, LOW IN =.28, LOW OUT =.31], C: [ 1.7 to.95], and D: [ 3.63 to 4.56]. In practicality, there was no significant group-wise association between peak trail foot GRFy and BEV. According to the model, the difference between
133 119 the minimum and maximum measured values of peak trail foot GRFy (13.59% BW and 4.22% BW) would lead to a BEV difference of.17 m/s. Figure 53 below visualizes the model-estimated BEV based on the range of measured values of peak trail foot GRFy. Figure 53. Model estimate of average BEV across value of peak trail foot GRFy.
134 Peak trail foot GRFz Peak Trail Foot GRFz HIGH IN HIGH OUT LOW IN BEV (m/s) 5 4 LOW OUT MIDDLE GRF (%BW) Figure 54. Peak trail foot GRFz across BEV (raw data) Table 36. Analysis of variance for peak trail foot GRFz Source DF Seq SS Adj SS Adj MS F P TF GRFz Subject Location PS Error Total Eq. 18: BEV = *Trail Foot GRFz + A*µ + B*LOC +.74*PS In Eq. 18, the ranges for the coefficients were A: [ 5.78 to 2.6] and B: [HIGH IN = 1.84, HIGH OUT =.2, LOW IN =.15, LOW OUT =.41]. In practicality, increases in BEV were associated with decreased peak trail foot GRFz for all pitch locations. According to the model, the difference between the minimum and maximum
135 121 values of peak trail foot GRFz (78.13% BW and % BW, respectively) would lead to a BEV difference of 5.36 m/s. Figure 55 below visualizes the model-estimated BEV based on the range of measured values of peak trail foot GRFz. Figure 55. Model estimate of average BEV across value of peak trail foot GRFz.
136 Peak lead foot GRFx Peak Lead Foot GRFx HIGH IN HIGH OUT LOW IN BEV (m/s) 5 4 LOW OUT MIDDLE GRF (%BW) Figure 56. Peak lead foot GRFx across BEV (raw data) Table 37. Analysis of variance for peak lead foot GRFx Source DF Seq SS Adj SS Adj MS F P LF GRFx Subject Location PS Error Total As seen in Table 37, there was not a significant relationship between the peak lead foot GRFx and BEV. Thus no equation or graph of estimated BEV versus the peak lead foot GRFx was developed.
137 Peak lead foot GRFy Peak Lead Foot GRFy HIGH IN HIGH OUT LOW IN BEV (m/s) 5 4 LOW OUT MIDDLE GRF (%BW) Figure 57. Peak lead foot GRFy across BEV (raw data) Table 38. Analysis of variance for peak lead foot GRFy Source DF Seq SS Adj SS Adj MS F P LF GRFy Subject Location PS Subject*LF GRFy Subject*PS Error Total Eq. 19: BEV = *Lead Foot GRFy + A*µ + B*LOC +1.15*PS + C*µ*Lead Foot GRFy + D*µ*PS In Eq. 19, the ranges for the coefficients were A: [ to 13.56], B: [HIGH IN = 1.92, HIGH OUT =.6, LOW IN =.18, LOW OUT =.55], C: [ 1.22 to.82], and D: [ 3.73 to 4.62]. In practicality, there was no significant group-wise association between peak lead foot GRFy and BEV. According to the model, the difference between
138 124 the minimum and maximum measured values of peak lead foot GRFy ( 57.36% BW and 14.53% BW, respectively) would lead to a BEV difference of.34 m/s. Figure 58 below visualizes the model-estimated BEV based on the range of measured values of peak lead foot GRFy. Figure 58. Model estimate of average BEV across values of peak lead foot GRFy.
139 Peak lead foot GRFz Peak Lead Foot GRFz HIGH IN HIGH OUT LOW IN BEV (m/s) 5 4 LOW OUT MIDDLE GRF (%BW) Figure 59. Peak lead foot GRFz across BEV (raw data) Table 39. Analysis of variance for peak lead foot GRFz Source DF Seq SS Adj SS Adj MS F P LF GRFz Subject Location PS Error Total As seen in Table 39, there was not a significant relationship between the peak lead foot GRFz and BEV. Thus no equation or graph of estimated BEV versus the peak lead foot GRFz was developed.
140 Comparison of swings by pitch type Tables 4-44 display the mean and standard deviation values for the three trial types. For variables that had a significant difference among the trial types, the significant post-hoc pairwise comparisons are also noted. Three of the dependent variables (bat lag at BC, time of peak shoulder azimuth velocity, and time of peak trail foot GRFy) had to be transformed using the natural logarithm of the raw data in order to assume data normality. The GLM showed that all dependent variables had a significant subject effect, and in fact, those p-values were all less than.1. In these GLM, almost all dependent variables also showed a significant main effect for trial type as well. Only three variables, pelvis rotation angle at BC and peak trail foot GRFx and GRFz magnitude, were not statistically significant among the three trial types. Table 4. Mean ± SD of kinematic angles at BC among the three trial types (in degrees). Variable Change Fail Change Success Fast Success Lead Knee Flexion c 19 ± 1 2 ± 5 18 ± 4 Pelvis Rotation 76 ± ± ± 6 UT local Rotation b,c -4 ± 1-4 ± 6-2 ± 4 Lead Shoulder Elevation a,c 71 ± ± 5 7 ± 4 Lead Shoulder Azimuth a,b,c -14 ± 1-9 ± 9-1 ± 8 Trail Elbow Flexion a,b,c 51 ± ± ± 8 Bat Lag a,b,c 34 ± ± 3 65 ± 3 Bat Elevation a,b,c -18 ± ± 8-3 ± 5 Bat Azimuth a,b,c 46 ± 34 9 ± 14-8 ± 12 Head Rotation a,b 43 ± ± 7 47 ± 5 a) Significant difference between Change Fail and Change Success (p<.5) b) Significant difference between Change Fail and Fast Success (p<.5) c) Significant difference between Change Success and Fast Success (p<.5)
141 127 Table 41. Mean ± SD of timing of peak kinematic velocity among the three trial types (in milliseconds relative to time of BC). Variable Change Fail Change Success Fast Success Lead Knee Extension a,b,c -67 ± ± 3-3 ± 25 Pelvis Rotation a,b,c -19 ± ± 2-71 ± 15 UT global Rotation a,b,c -86 ± ± ± 14 Lead Shoulder Azimuth a,b,c -73 ± ± 4-46 ± 3 Trail Elbow Extension a,b,c -8 ± 23 1 ± 3 16 ± 4 Bat Azimuth a,b,c -24 ± ± 2-1 ± 2 a) Significant difference between Change Fail and Change Success (p<.5) b) Significant difference between Change Fail and Fast Success (p<.5) c) Significant difference between Change Success and Fast Success (p<.5) Table 42. Mean ± SD of peak kinematic velocity magnitudes among the three trial types (in degrees per second). Variable Change Fail Change Success Fast Success Lead Knee Extension a,b,c 276 ± ± ± 41 Pelvis Rotation b,c 552 ± ± ± 38 UT global Rotation a,b,c 714 ± ± ± 71 Lead Shoulder Azimuth b,c 28 ± 1 3 ± ± 92 Trail Elbow Extension b,c 1149 ± ± ± 13 Bat Azimuth a,b 272 ± ± ± 152 a) Significant difference between Change Fail and Change Success (p<.5) b) Significant difference between Change Fail and Fast Success (p<.5) c) Significant difference between Change Success and Fast Success (p<.5) Table 43. Mean ± SD of timing of peak GRF among the three trial types (in milliseconds relative to time of BC). Variable Change Fail Change Success Fast Success Trail Foot GRFx b,c -489 ± ± ± 74 Trail Foot GRFy a,b,c -166 ± ± ± 15 Trail Foot GRFz b.c -614 ± ± ± 52 Lead Foot GRFx a,b,c -115 ± 26-1 ± 19-9 ± 16 Lead Foot GRFy a,b,c -169 ± ± ± 16 Lead Foot GRFz a,b,c -126 ± ± ± 19 a) Significant difference between Change Fail and Change Success (p<.5) b) Significant difference between Change Fail and Fast Success (p<.5) c) Significant difference between Change Success and Fast Success (p<.5)
142 128 Table 44. Mean ± SD of peak GRF magnitudes among the three trial types (in % BW). Variable Change Fail Change Success Fast Success Trail Foot GRFx 25 ± 5 25 ± 2 26 ± 2 Trail Foot GRFy a,b,c 23 ± 4 24 ± 3 28 ± 2 Trail Foot GRFz 98 ± 6 97 ± 2 97 ± 2 Lead Foot GRFx b,c -53 ± 14-5 ± 7-56 ± 5 Lead Foot GRFy b,c -32 ± 6-32 ± 4-36 ± 3 Lead Foot GRFz b,c 135 ± ± ± 12 a) Significant difference between Change Fail and Change Success (p<.5) b) Significant difference between Change Fail and Fast Success (p<.5) c) Significant difference between Change Success and Fast Success (p<.5) While there were few practically relevant statistical differences in the lower body and trunk at BC among the three trial types, there were a number of statistically significant and practically relevant differences in the upper body and bat kinematics at BC (See Table 4). The lead shoulder was less horizontally adducted, the trail elbow was more extended, and the bat had rotated forward and was more elevated by BC for Change Fail compared to Change Success. The same pattern continued when comparing Change Success to Fast Success. The timing of all peak kinematic velocities was earlier for Change Success than Fast Success and earlier still for Change Fail (See Table 41). The magnitudes of all peak kinematic velocities were generally the greatest in the Fast Success, less in the Change Success, and even less in Change Fail, though there were a few exceptions (See Table 42). There was no difference in peak pelvis rotation velocity between Fast Success and Change Success. The peak trail elbow extension velocity was similar for Change Success and Change Fail, but it was significantly less for Fast Success. Lastly, the peak bat azimuth velocity was significantly greater in Change Fail than Change Success or Fast Success, with no difference between Change Success and Fast Success.
143 129 For the trail foot, there were no significant differences among trial types in the magnitude of GRFx or GRFz (See Table 44). There were also no differences between Change Success and Fast Success in the timing of the trail foot GRFx or GRFz, although Fast Success occurred significantly closer to BC for both GRFx and GRFz (See Table 43). The pattern for trail foot GRFy was such that there were no differences between Change Success and Change Fail in the force magnitude though a peak GRFy was achieved significantly closer to BC for Change Success than for Change Fail (See Tables 43 and 44). The trail foot GRFy for Fast Success occurred even closer to BC and with greater peak force. A similar pattern to trail foot GRFy was also manifested throughout the lead foot peak GRF data (See Tables 43 and 44). There were no significant differences in any of the peak GRF magnitudes between Change Success and Change Fail, but all of the peak GRF magnitudes were significantly greater for Fast Success. For each of these GRF, the timing of their peaks was closest to BC for Fast Success, earlier for Change Success, and earlier still for Change Fail.
144 CHAPTER 5 DISCUSSION The skill of batting in baseball is essential for success in the sport, but nevertheless it has been labelled as the most difficult thing to do in sports (Mihoces, 23). A wide variety of scientific and coaching literature on batting exists, describing basic biomechanical priniciples of the swing, exploring common coaching techniques and strategies, assessing the effects of factors such as vision, mental preparation, anthropometry, and strength and conditioning, and even quantifying changes in batting performance due to the physical properties of the bats and balls themselves. Using the data and insights provided in this library and simultaneously attempting to build on some of the limitations of previous research, the purpose of the current study was to comprehensively measure the biomechanics of the baseball swing. It was hoped that by advancing the scientific base of knowledge on batting, this information could help bridge the gaps among scientists, coaches, players, doctors, trainers, and fans curious to learn more and communicate more effectively about the fundamentals of the baseball swing. 5.1 Description of swing The first task of this study was to thoroughly describe the swing in biomechanical terms. This was done by averaging the successful results against fastballs down the middle for each batter, and then averaging all of the batters together to create the typical professional batter. Six phases were operationally defined: stance, stride, coiling, swing initiation, swing acceleration, and follow-through. These phases were derived from five key events (lead foot off, lead foot down, lead foot commitment, lead 13
145 131 foot maximum GRFz, and bat-ball contact), most of which had been documented by the majority of the previous biomechanical research discussed during the literature review. During the stance phase, the upper body showed almost no movement at all, and the lower body only very slightly rocked back as the lead foot GRFx gently shifted the body s weight from the front foot towards the back foot. To help accept this extra body weight, the back knee flexed. With an average pitch speed (PS) of 25 m/s over a distance of approximately 13 m, the average flight time of the ball could be estimated at 52 ms. Since the event of lead foot off (which separates the stance and stride phases) occurred, on average, at 621 ms, it is likely that batters executed this first part of the swing before the ball had even been released from the pitcher s hand. The time of lead foot off in the current study correlates well with the batting tee studies of Welch et al. (1995) and Escamilla et al. (29a,b), which reported average times of 57 ms, 586 ms, and 61 ms, respectively, but not as well with the batting tee study of Tago et al. (26a,b), which had times of about 94 ms to 82 ms. The pitching machine study of Katsumata (27) found a time of approximately 8 ms (based on graph estimates), while the live batting study of Mason (1987) had the lead foot off event occurring anywhere from 8 ms to 4 ms. When looking at the graphs of trail foot GRF in the current study, the stride appears to be a rather controlled fall or drift forward rather than a violent, aggressive push. The trail foot GRFx, which would eventually propel the batter forward, held fairly constant around 21% BW throughout the phase. After accepting nearly all the body s weight (trail foot GRFz of 92 ± 9% BW) near 5 ms, the trail knee began to slowly extend throughout the phase, though it did not reach a point of maximum extension until
146 132 halfway through the following phase (coiling). Welch and colleagues (1995) did not report the time of maximum trail foot GRFz, but their reported magnitude was slightly higher (12 ± 3% BW), as was Katsumata s (approximately 1% BW at 75 ms). Many of the batter s body segments (pelvis, upper trunk, trail and lead shoulders, and bat) began to slightly counter-rotate during the stride phase, though these countermovements would not peak until the following phase (coiling). The stride length was measured as 42% of the batter s height and approximately 11 cm closed. These are slightly different than the stride values of Welch, which, when converted from their reported values, equated to roughly 46% of the batter s height and 17 cm closed. The lead foot returned to the ground around 34 ms in the current study, slightly later than the time of Katsumata (about 4 ms based on graph estimates) and just a bit earlier than Mason (1987), who found a time between 3 ms and 2 ms. The batting tee studies (Welch; Tago et al., 26a,b; Escamilla et al., 29a,b) all had the event of lead foot down occurring much closer to BC, ranging from 24 ms to 175 ms. It is logical to assume that these discrepencacies in the event times are a direct effect of the methodologies employed by each of the studies. Not only could they be due to how the ball was delivered to the batter, but also the very definitions of the events. For example, Welch defined lead foot down as the instant when the foot made full contact with the ground, whereas the current study used a threshold of 1% BW lead foot GRFz. The coiling phase was marked by the body coiling in a series of countermovements initiated during the stride phase. This coiling mechanism, which is commonly taught by coaches (Baker, Mercer & Bittinger, 1993; Gola and Monteleone, 21; Williams & Underwood, 1986), helps to activate the stretch-shortening cycle found
147 133 in most dynamic movements, including baseball batting (Szymanski et al., 27a). During coiling, the angles of pelvis tilt and rotation, upper trunk rotation, trail and lead shoulder azimuth, and bat azimuth all achieved maximum values in the opposite direction of the forward motion of the swing. Welch et al. (1995) saw a maximum counter-rotated pelvis position of 28 at 35 ms and maximum counter-rotated upper trunk position (with respect to global) of 52 at 265 ms, while the current study had those two segment positions occurring closer to BC and not quite as extreme in magnitude (pelvis: 21 at 25 ms; upper trunk: 22 at 186 ms). Again, it is suspected that these differences are primarily due to batters hitting balls off of a tee versus live pitching. Interestingly, while the coiling phase saw a number of these rotational movements, in the spirit of Ted Williams coaching philosophy, the pelvis also moved linearly forward 11 cm in the X direction (towards the pitcher) during this phase, just as Charley Lau s philosophy emphasized. This again demonstrates that the batter must employ both rotational and linear movements, often simultaneously, to successfully execute his swing. In terms of GRF, batters seemed to have a fairly soft landing, as the lead foot GRFx and GRFz remained very low right after the lead foot returned the ground and only began to spike up towards the end of the phase, with a more rapid increase beginning around 2 ms. This gentle landing is in keeping with a common coaching cue of striding as if stepping on thin ice (Baker, Mercer & Bittinger, 1993). The lead and trail foot GRFy, which oppose each other and occur at nearly the same time, intuitively seeming to serve as stabilizing forces during the swing, rose to over 8% of their eventual maximum values during this phase, helping to provide a steady base for the rotations further up the kinetic chain. The coiling phase terminated when the batter s lead foot GRFz reached
148 134 5% BW, which occurred at approximately 17 ms. Though this weight shift commitment event is unique to this study, it is somewhat comparable to the weighting concept presented by Katsumata (27). During the swing initiation phase, most of the maximum GRF were produced, as the trail and lead foot GRFy peaked to fully stabilize the lower body, the lead foot GRFx acted as a brake to prevent further forward linear movement of the body s weight and assisted in creating a strong front side (Gola & Monteleone, 21; Robson, 23), and the lead foot GRFz crescendoed to its peak value at the end of the phase to provide the initial energy that would be transmitted through the kinetic chain (DeRenne, 1993; Robson, 23). The peak GRFy timing and magnitudes were very similar to those seen in Fortenbaugh & Fleisig (28). Facilitating the increase in lead foot GRFz and the redirection of that force into the kinetic chain was the extension of lead knee from 48 to 4, which reached about two-thirds of its peak extension velocity during the swing initation phase. The current study saw a maximum lead foot GRFx of 5% BW at 83 ms (technically just after the end of the swing initiation phase) and a maximum lead foot GRFz of 13% BW at 93 ms (the defined end of the swing initiation phase). Unfortunately, it is difficult to compare most of the other known studies of the GRF of the baseball swing to this instant in the swing. Welch et al. (1995) reported a total lead foot force of 123% BW, with X component 292 N and Z component 917 N at 175 ms, though those numbers are relating the batter s GRF at that research group s definition of lead foot down. Mason (1987) found lead foot maximum GRFx of anywhere between 6% BW and 12% BW (time of occurrence not provided) and lead foot maximum GRFz of 2% BW to 25% BW at approximately 1 ms. Katsumata s (27) data can only
149 135 be estimated from a graph, where it seems the maximum GRFz is approximately 13% BW at 15 ms. Fortenbaugh & Fleisig (28), though analyzing swings off of a tee, did at least have comparable data, reporting a lead foot maximum GRFx and GRFz of 126% BW and 39% BW, respectively, with both occurring at 81 ms. The swing initiation phase, much like the name suggests, is when many of the body segments began to move noticeably in the direction of the swing. Though the pelvis actually began to rotate during coiling, it moved much more rapidly during swing initiation, quickly opening up from 13 to 2, reaching over 95% of its peak velocity by the end of the phase. The upper trunk, meanwhile, had just begun to open in this phase, creating a bit of a lag, or separation, between the pelvis and upper trunk. This separation is what allowed for the stretch reflex to be activated in the trunk musculature, though the separation difference (measured as the upper trunk rotation with respect to the pelvis) peaked at 18 at around 13 ms, much less than what is seen in other rotational movements, such as baseball pitching (Stodden et al., 21), golf swings (Cole & Grimshaw, 29), and discus throws (Leigh & Yu, 27). The only quasi-comparable value among the previous batting studies was the trunk twist angle the batting tee studies of Escamilla et al. (29a,b) reported at the time when the batter s hands started to move forward (roughly 13 ms), and that was only 6 to 9 of separation, though higher values of up to 15 were reported in the studies at earlier points in the swing. During swing initiation, the batter s arms finally began to move significantly, with the trail elbow tucking down and into the side of the body while the lead elbow also moved forward and down, though not as much. The elbows, however, remained fairly flexed, particularly the trail elbow. Failure to properly execute this early hand and arm
150 136 path leads to one of the most common hitting faults, casting the hands (Gola & Monteleone), so named because of its similarity to a fisherman casting a line by first extending his hands out and away from his body. Though the bat did begin to become unwrapped from behind the batter s head during swing initiation, it still lagged far behind the body, as coaches often instruct their players (Robson, 23). In fact, the bat lag angle actually increased to 131 during this phase, close to its maximum value. Due to the conservation of angular momentum, the change in bat azimuth while the hands were kept in close to the body allowed the bat rotate very quickly. Studying the graph of bat azimuth velocity, there were two distinct accelerations in bat azimuth: this first one during swing initiation which propelled the bat to nearly 125 /s; and the second, which propelled it to its maximum speed and occurred during the following phase of swing acceleration. The most dynamic movements in the swing occurred between the time of lead foot maximum GRFz (around 93 ms) and BC, aptly named the swing acceleration phase. During this time, the lead knee extended rapidly from 4 to 18, peaking at a rate of 263 /s at 4 ms, though this was markedly less than previous studies, which had reported 35 /s at approximately 199 ms (Escamilla et al., 29a) and 386 /s at 112 ms (Escamilla et al., 29b). The lead knee extension angles at BC of other studies, however, were quite similar, ranging from about 11 to 2 (Escamilla; Tago et al., 26a,b; Welch et al., 1995). The pelvis moved through a substantial range of motion, not only rotating forward to face the pitcher, but also anteriorly tilting. The maximum pelvis rotation of 581 /s at 7 ms in the current study was a bit less than Welch s value of 714 /s though it occurred nearly at the same time ( 75 ms). One other study
151 137 (Escamilla, 29b) reasonably matched these numbers with 678 /s at approximately 91 ms, while another (Escamilla, 29a) had a similar velocity of 681 /s but had it occurring much earlier at 234 ms. The pelvis rotation angle at BC of 77 in the current study was right within the range of 6 to 83 seen in the other kinematic studies (Escamilla; Tago; Welch). The stretch that had been activated across the torso by the separation between pelvis and upper trunk rotation released during swing acceleration as the difference between the two angles nearly disappeared. Instants after the pelvis reached its peak velocity, the upper trunk followed suit, rotating even faster at a maximum speed of 766 /s at 57 ms. Again, this was less in magnitude and similar in timing compared to Welch (937 /s at 65 ms) and Escamilla (29b) (857 /s at approximately 61 ms), and different in magnitude and timing to Escamilla (29a) (85 /s at approximately 25 ms). The global upper trunk angle at BC of 75 in the current study, however, was more open than the range of values of 48 to 7 previously reported (Escamilla, Tago, Welch). Just after turning the pelvis and upper trunk through to face towards the pitcher, the batter continued to pass that rotational energy into the arms and bat. The lead shoulder continued to horizontally abduct, bringing the hands and knob of the bat across the chest as the elbows remained fairly flexed. By the time that the lead shoulder had reached its peak pre-contact azimuth velocity of 342 /s at 43 ms, the lead elbow was flexed 6 and the trail elbow was flexed even more at 17, though the trail elbow extension velocity had risen to over half of its maximum value. After reaching a peak, the lead shoulder azimuth velocity slowed while the trail elbow extension velocity continued to accelerate through BC, peaking at 868 /s at +17 ms. Conserving angular momentum by keeping the hands close to the body as long as possible allowed the bat to
152 138 continue to accelerate, reaching its maximum azimuth velocity of 2435 /s just 1 ms before BC. While no previous biomechanical studies had measured the shoulder movements as the current study did, others had shown slightly greater trail elbow extension velocity, and had it occurring before BC. Welch et al. (1995) and Escamilla et al. (29b) reported similar magnitudes and times to one another of 948 /s at 15 ms and 936 /s at 2 ms, respectively, while Escamilla et al. (29a) had an elbow velocity of 928 /s, but at 123 ms. Slower capture frame rates may have lead to erroneous estimates of the time of BC. As for the bat, Nicholls et al. (23) and Nicholls et al. (26) measured peak bat angular velocities of approximately 23 /s to 235 /s. While the bat s azimuth changed dramatically, the bat s elevation also changed noticeably during swing acceleration, dropping down nearly 7 to an orientation of 3 below parallel, leaving the bat barrel below the hands at BC, a goal that coaches look for hitters to achieve (Robson, 23). The follow-through phase, which encompassed all of the movements after BC, mainly saw the body s segments continuing to rotate forward as they had been in the swing, but in a decelerating manner to slow the body down as the batter theoretically transitioned from swinging into running towards first base. The one accelerating movement was a second horizontal adduction thrust by the lead shoulder. Though the lead shoulder movement that occurred during swing acceleration contributed more directly to the batter s swing velocity, the lead shoulder movement that occurred after BC may actually have implications for injury (Phillips, Andrews & Fleisig, 2). A phenomenon known as the batter s shoulder is a posterior instability of the lead shoulder believed to be caused by excessive horizontal adduction of the lead shoulder
153 139 following contact. As seen in the graph in Appendix E, the large standard deviation surrounding the second peak in lead shoulder azimuth velocity indicates that there is quite a bit of variability among subjects, making some more likely to develop the batter s shoulder syndrome than others. 5.2 Modulation of swing to changes in pitch location The effects of changes in pitch location on the biomechanics of the baseball swing were evaluated in two distinct ways. This particular analysis used only successful swings (i.e. balls hit in fair territory ) against fastballs. First, 34 biomechanical parameters were separately compared to simply determine how these parameters varied with pitch location. The purpose of this first analysis was to see to what extent batters changed their swings when pitches were thrown in different parts of the strike zone. Second, since there was some variability in the ball exit velocity (BEV) of the batters swings, these same 34 parameters were again individually assessed to identify if a given parameter had a significant relationship with BEV. The purpose of this second analysis was to help identify how batters modulated their swing biomechanics in order to optimize their results. The GLM, in essence, was a way to individually correlate the biomechanical parameters to BEV while still controlling for other pertinent factors. Before continuing with the breakdown of these results, it should be noted that there were a few limitations that directly affect the interpretation of these data. Both limitations are borne out of the maxim that models only apply to the data from which they were constructed. The batters faced PS below typical game speeds, though similar kinematic and kinetic timing and magnitudes were likely preserved because a shortened pitching distance kept the batters
154 14 reaction times similar. Still, one cannot plug in real game-like PS (e.g. 4 m/s) and expect the models to be accurate. A second limitation is that the model-estimated BEV was computed based on the minimum and maximum measured values of the given biomechanical parameter and applied to all pitch locations, though the range of measured values varied from location to location. For example, the peak pelvis rotation velocity for HIGH IN ranged from /s to 832. /s while the range for LOW OUT was /s to /s. Again, this limitation affects how broad of a range certain variables can be interpreted through the model. Tracking the changes in swing biomechanics due to the effect of pitch location through the links of the kinetic chain, it is logical to begin such an investigation with the lower body s contributions. Most of the timing and magnitude of the peak GRF of both feet were practically, if not also statistically, insignificant. All of the trail foot GRF parameters, for all and intents and purposes, were the same for all pitch locations. The results did indicate, however, that having less peak trail foot GRFz led to increased BEV. Unfortunately, this effect is difficult to corroborate because there were no changes in BEV associated with changes in lead foot GRF magnitudes. The only peak lead foot GRF findings of note were that MIDDLE, HIGH IN, and LOW IN had significantly greater peak GRFz than LOW OUT and HIGH OUT and that peak GRFx and GRFz that occurred closer to the time of BC for all pitch locations were associated with increased BEV. The lead knee flexion angle at BC was similar among pitch locations, but there was significantly more peak lead knee extension velocity on inside pitches than outside pitches and the extension did occur significantly closer to BC. However, none of these knee parameters showed an association with BEV, indicating that the changes in knee
155 141 extension velocity with pitch location may just be the natural state of things rather than something that can be manipulated to improve performance. The pelvis and upper trunk motions clearly showed the significant role they play in batting biomechanics. Ted Williams was a big proponent of the role of the pelvis and based a good portion of his hitting philosophy on its contribution to the swing (Williams & Underwood, 1986). In the current study, the pelvis rotated significantly faster and had a more open angle at BC on inside pitches than outside pitches. A more open pelvis rotation angle at BC was also associated with increased BEV, illustrating its importance. Gola & Monteleone (21) also articulated this point, believing that hitters, particularly young hitters, can become overly concerned with missing the ball and will use only their arms to simply make contact at the expense of the power the pelvis can provide. Passing that energy up the chain, the current study found that the upper trunk rotated significantly faster for high pitches compared to low pitches. Since gravity can facilitate the bat s path to hitting low pitches much more so than high pitches, one may speculate that the batters in this study attempted to overcome that obstacle by rotating their upper trunk faster on the high pitches to ensure they could get the arms and bat in the proper position at BC. Though there was no significant association of peak upper trunk rotation velocity with BEV, the proposed theory of the batters strategy is still supported by the fact that an earlier time of peak upper trunk rotation velocity for HIGH IN and a later time of peak upper trunk rotation velocity for LOW OUT were associated with increased BEV. These adjustments would logically put the batter in a more optimal position to direct the ball as desired (i.e. pull inside pitches and hit outside pitches to the opposite field) for a given pitch location.
156 142 The next link in the kinetic chain is the arms, and for this study, that meant focusing on the actions of the lead shoulder and the trail elbow. Since both of the arms are gripping the bat, the swing is a closed chain movement, meaning that both arms have to work together to move the hands along an efficient path. There is a great deal of irony in the findings of the two different statistical tests on the swing data of fastballs thrown to different locations. Looking at the comparative data, inside pitches had significantly greater shoulder azimuth at BC (i.e. more horizontal abduction), greater peak shoulder azimuth velocity, and less peak trail elbow extension velocity than outside pitches. The trail elbow was also flexed more at BC and had a later peak extension velocity for HIGH IN and a more extended position at BC with an earlier peak extension velocity for LOW OUT. However, the optimal shoulder and elbow kinematics revealed from the associations of these variables with BEV indicated that for HIGH IN, the lead shoulder should be less horizontally abducted and the trail elbow should be more extended at BC with the peak lead shoulder azimuth velocity and trail elbow extension velocity occurring earlier (relative to the time of BC), while for LOW OUT the lead shoulder should be more horizontally abducted at BC and the trail elbow should reach its peak extension velocity later (relative to the time of BC). The easiest explanation for these completely different hand paths is that as a group, the batters in this study simply struggled somewhat to successfully hit these two pitches. Especially for HIGH IN, the batters tended to pull in their hands in too close to the body, appearing to fight off the pitch rather than firing the hands out to meet the ball out in front of the plate as coaches suggest (Gola & Monteleone, 21). It is very common for pitchers to routinely throw to these two opposing locations to challenge the batters, and the results of this study indicate
157 143 that this can be a good strategy for pitchers. Yet while the batters, as a group, did have significantly less BEV for HIGH IN than other locations (as seen in the results for biomechanical parameters that had a significant main effect with no LOC interaction), the significant associations of these biomechanical parameters with BEV demonstrate that there were also quite a few successful trials, meaning that the batters were able to demonstrate some proficiency, albeit not necessarily on a consistent basis. The final link in the kinetic chain of batting is, of course, the bat itself. Not surprisingly, the bat elevation angle at BC was significantly greater on high pitches than low pitches. The bat azimuth at BC and peak bat azimuth velocity were greater on inside than outside pitches, meaning the batters likely snapped their wrist to get the barrel of the bat out in front of the plate on inside pitches but held back on outside pitches so as to position the bat in line with the opposite field (e.g. right field for right-handed batters). Though not as generalizable, greater bat azimuth at BC was associated with increased BEV for HIGH IN and less bat azimuth at BC was associated with increased BEV for LOW OUT. Similar to peak upper trunk rotation velocity, there was also a significant association of increased BEV with increased peak bat azimuth velocity on high pitches and decreased peak bat azimuth velocity on low pitches. A likely supposition is that the batters allowed gravity to accelerate the bat on low pitches but had to more forcibly rotate the bat to successfully hit high pitches. The time of peak bat azimuth velocity occurred, on average, before BC for all pitch locations. As well, earlier time of peak bat azimuth velocity was associated with increased BEV. These facts both point to the well-known motor control concept of the speed-accuracy tradeoff since the batters apparently were accelerating the bat to its peak rotational velocity before the time of contact and then
158 144 slowing it down just enough to optimize the quality of contact. Adair (22) extensively describes the importance of making solid contact with the ball to maximize BEV. Lastly, while the batters adjusted the bat s orientation to optimize contact, they also rotated their heads accordingly to track the ball, turning less to hit HIGH IN and more to hit LOW OUT. These results are evidence that batters do attempt to keep their eye on the ball as coaches routinely preach (Baker, Mercer & Bittinger, 1993; Gola & Monteleone, 21) 5.3 Modulation of swing to changes in pitch type The ultimate goal of the pitcher is to get the batter out, and perhaps the most common strategy to achieve this is to throw a ball in the strike zone that the batter cannot hit. Many pitchers, particularly young and inexperienced ones, simply try to throw the ball extremely fast and rely on the pure physical challenge of the batter identifying the location of the pitch and appropriately timing his swing with reduced reaction time (due to pitch speed). More advanced pitchers tend use their guile to intermittently change the velocity, location, movement, and even the mere delivery of their pitches, trying to fool the batter by forcing him to constantly alter the timing and rhythm of his swing to match the pitch. In the current study, the comparison among successful swings fastballs (Fast Success), successful swings against changeups (Change Success), and unsuccessful swings against changeups (Change Fail) revealed differences in 29 of the 32 biomechanical measurements (all but pelvis rotation at BC and peak magnitude of trail foot GRFx and GRFz), indicating very clearly that pitch type can affect batting mechanics and outcomes. As expected, the largest and most obvious differences were between the different pitches with opposing results, Fast Success and Change Fail. It is
159 145 even more intriguing to delve inside the numbers and discover to what extent the different pitch types affected batters swings. One way to break down the three trial types is to scan the post-hoc comparisons to see what variables were not statistically different between Fast Success and Change Success but were different for Change Fail (marked in Tables 4-44 as a and b ), what variables were not statistically different between Change Success and Change Fail but were different for Fast Success (marked in Tables 4-44 as b and c ), and finally, what made the three trial types unique (marked in Tables 4-44 as a, b, and c ). Two variables were significantly different between successful swings (Fast Success or Change Success) and Change Fail: head rotation at BC and peak bat azimuth velocity. The batters rotated their heads about 1 to 5 more towards the catcher and maximally rotated the bat about 15 /s to 275 /s slower for successful swings. Looking at these variables together, the logical assumption is that when the batter tracked the ball longer and took a more controlled swing (i.e. did not overswing ) he was more successful in hitting the ball whether it was a fastball or a changeup. Whether the faster bat azimuth velocity of Change Fail was a planned movement or a late, reactionary movement is unknown. Just as with the changes in pitch location, the concept of keeping one s eye on the ball by tracking for as long as possible, however, is well-established throughout the coaching literature (Baker, Mercer & Bittinger, 1993; Gola & Monteleone, 21). A number of variables separated the Fast Success from the Change Success and Change Fail, and many of these would logically be due to the pitch speed difference in fastballs and changeups. Differences in the timing of peak trail foot GRFx and GRFz can
160 146 very easily be explained by realizing that the batter likely took the exact same initial approach in his mechanics for all swings, and only after identifying a pitch type other than a fastball would he then begin to modify his swing (Gwynn, 1998). Since the peak trail foot GRFx and GRFz typically occurred very near the time at which the pitcher released the ball ( 6 ms to 4 ms), the batter obviously had not yet identified the pitch type. A second difference was that all of the peak magnitudes of the lead foot GRF were reduced for swings against changeups as compared to fastballs. A plausible explanation for this difference is that the batter, after recognizing the pitch as a changeup, hesitated somewhat to commit his body weight to his lead foot as he normally would for a fastball. Three peak kinematic velocities were also significantly different for swings against fastballs and changeups. Fast Success had around 3 /s to 7 /s more pelvis rotation velocity and roughly 5 /s to 1 /s more lead shoulder azimuth velocity than Change Success or Change Fail, but they also had 1 /s to 2 /s less trail elbow extension velocity than Change Success or Change Fail. Though all three trial types were statistically significant from one another for upper trunk rotation velocity, it was very nearly the case that the upper trunk displayed the same tendency as the pelvis and lead shoulder azimuth. To explain all of this, consider the theory of hesitation used to explain the reduced lead foot GRF magnitudes. Assuming there was a hesitation by the batter upon recognizing a changeup, this delay may have triggered a chain reaction of more passive, rather than aggressive, movements, including slower pelvis, upper trunk, and shoulder rotations. However, as the batter would have wanted to reach the bat out so as not to miss the ball completely, the latter links of the kinetic chain, including extension of the trail elbow, may have had to been sped up to try and get the bat in position.
161 147 The three trial types differed for a large number of biomechanical variables, though a distinct timing pattern typified their relationships. Using Fast Success as a reference, the common pattern was that Change Success had peak velocities and GRF occur a bit earlier and Change Fail had them occur even earlier, though the precise amount of time varied a bit from variable to variable. This pattern was seen in the timing of all six peak kinematic velocities, the timing of peak trail foot GRFy, and the timing of all three peak lead foot GRF. The earlier occurrences of these movements can be assumed to mean that the batter, originally anticipating the ball to be coming at him with a fastball velocity and thus coordinating his movements for a swing against a fastball, simply prepared too early. In fact, while not studied in depth, a brief review of the data suggests that the sequence of movements of the kinetic chain and the time in between each movement remained fairly similar, just that the entire sequence was started prematurely. From another perspective, the timing differences between Fast Success and Change Success were about 5 ms to 15 ms for the GRF, 1 ms to 2 ms for lead knee extension and the pelvis and upper trunk rotational velocities, and 5 ms to 1 ms for the lead shoulder azimuth, trail elbow extension and bat azimuth velocities. The timing differences between Change Success and Change Fail had larger intervals, likely due to the fact that batters, if fooled substantially, could mistime the ball by quite a bit. These differences were roughly 1 ms to 3 ms for GRF and pelvis rotation velocities, 1 ms to 2 ms for upper trunk rotation, lead shoulder azimuth, and trail elbow extension velocities, and 5 ms to 1 ms for bat azimuth velocities. It was as if the batter was still fooled a little bit even for Change Success, and then fooled bad enough to miss the ball entirely for Change Fail. Other key variables that had distinct values for the three trial
162 148 types were lead shoulder azimuth, trail elbow flexion, bat lag, bat elevation, and bat azimuth at BC and lead knee extension velocity. All of these variables also exhibited a progression from Fast Success to Change Success to Change Fail. Following that order, the progressions were to have less peak lead knee extension velocity and at BC to have less bat lag, greater lead shoulder azimuth, less trail elbow flexion, more bat elevation, and a greater bat azimuth. Amalgamating all of this data, one can quickly draw up a mental image of the rough, uncoordinated swing that a batter may take when unsuccessful in hitting a changeup compared to the smooth, graceful swing when successful against a fastball. 5.4 Limitations to previous and current research While the selected previous biomechanical studies of batting are helpful in validating some of the data of the current study, the number of differences that exist amongst the data suggest that the current study has produced rather unique results. As was proposed in the statement of the problem in the biomechanics of batting, scrutiny of the methodologies used by previous researchers shows woeful inadequacies in nearly every aspect of data collection, processing, analysis, and interpretation, though not every study is lacking in each of these areas. The main consequence of using such methodologies is that they do not replicate batting as it occurs in a game. A second consequence is that with a limited number of dependent variables collected and inferior methodology, the swing cannot be fully described. Complicating the issue is the very fact that some of the data are similar across most testing procedures, leading one to question what measurements are constant and what is variable amongst the protocols. As
163 149 stated, one of the aims of the current study was to improve the data collection methods to most accurately represent what batters do in a game. The researchers believe that they achieved this goal of more accurately representing the true game-like baseball swing through improvements in data collection, processing, and interpretation. Still, the current study was saddled with a number of its own limitations, and some of these may have threatened the data s external validity to some extent when comparing it to the ideal situation of biomechanically assessing in-game actions. The first, and most obvious, limitation is that this study was collected in an indoor laboratory and not out on a baseball field. Players routinely take batting practice, as they did in the current study, in indoor facilities, without batting helmets, and wearing footwear other than baseball cleats, and the participants frequently commented to the researchers that they were fairly comfortable with the lab set-up. Still, hitting with minimal clothing and nearly 5 reflective markers attached to the body and bat does not seem preferable for the batters. Also, the caged environment with indoor lighting may have taken away some comfort provided in the typical sunny, open air feeling of hitting on a real field. Two other procedural limitations in the current study were the baseballs used and the pitching distance. The baseballs were covered entirely in reflective tape, converting a white ball with red seams, which batters can use to aid in pitch identification, into a solid grey ball. During testing, batters commented that they were reasonably comfortable with hitting the covered balls, but admitted that hitting regular baseballs with visible seams may aid them in pitch recognition. While pitching at a slower speed from a shorter distance than an actual game is standard for batting practice, this may not ideally reflect the reaction time of the batters during an at-bat, especially with reference to identifying off-speed pitches
164 15 like the changeup. A larger effect, as mentioned earlier in Section 5.2, is that the GLM developed to relate biomechanical parameters to BEV only holds true for the PS and conditions provided in this study and cannot be generalized to swings against a pitcher throwing the full pitching distance at game-like PS. One final, albeit minor, procedural limitation, is the difference between the overall rhythms of batting practice versus game at-bats. In the current study, each batter viewed between 4 and 7 pitches consecutively, swinging at the overwhelming majority of them, as they had been instructed. In a game, batters often see only a handful of pitches, perhaps only swing at one or two (depending on what offerings appeal to them), and then must wait their turn to bat again, anywhere from 1 minutes to 45 minutes later. Again, since they were accustomed to the style of batting practice implemented, the swings were probably similar to the game at-bats, but further studies could confirm this. A few other limitations in the data capture and processing could have had some effect on the data as well. The current study captured the motions of batters considerably faster (3 Hz) than any previous study (2 Hz by Welch et al., 1995) and was likely more than sufficient for most of the body kinematics, but this was still probably not fast enough to precisely capture the instant that the bat contacted the ball. Some of the differences in timing, particularly regarding the bat, were only a few milliseconds. With the quantity of data assessed, a few milliseconds are probably both meaningful and believable, but still reflects only a frame or two worth of data. Adair (22) claims the contact between bat and ball lasts just one millisecond, so a capture rate of up to 1 Hz may be needed to guarantee accurate identification of the instant of BC and assist in defining the bat s motions. A second limitation stemmed from using the protective
165 151 batting cage. The netting of the cage, which provided a good deal of safety for the lab, also had the tendency to partially block some of the reflective markers, potentially leading to some small digitizing errors. While most of these errors were likely corrected by filtering the data, the use of larger markers, an alternative to the batting cage, and/or more cameras may have improved the accuracy of the motion capture. A third, very minor limitation is that defining a discrete pitch location for every trial even though pitches operate on a continuum may lead to some inaccuracies in the data s interpretation. However, the sheer wealth of data collected for this study should have evened out the few instances when a pitch location may have been categorized improperly. 5.5 Conclusions This was the most comprehensive study on the biomechanics of baseball batting to date. Analyzing nearly 13 trials from a fairly large sample of professional batters (N=33) facing a live batting practice pitcher throwing an assortment of fastballs and changeups to different locations, dozens of kinematic, kinetic, and temporal parameters were collected on each of the batters. Establishing a large database of biomechanical parameters on successful baseball swings against fastballs thrown down the middle was an important step in creating a reference source for those seeking to understand what values to expect for these parameters and also for those wishing to compare any individual batter against this database. The investigation of changes in swing mechanics against fastballs with changes in pitch location revealed a wealth of significant differences amongst the locations and how certain biomechanical parameters could influence BEV. While the lower body (i.e. GRF and lead knee) was fairly consistent for
166 152 all trials, the pelvis and upper trunk rotations were critical for increasing BEV. Batters were more successful when opening up the trunk more for inside pitches and less for outside pitches. The arms, operating in a closed chain with the both hands gripping the bat, worked in tandem to drive the hands to the optimal destination. For the best results, batters limited their shoulder horizontal abduction and extended the trail elbow for HIGH IN and alternatively increased shoulder abduction and flexed the trail elbow more for LOW OUT. However, the data revealed that batters did tend to struggle to execute these hand paths consistently. Successful swings also required batters to get the bat rotated around more at BC on inside pitches and less for outside pitches. A plethora of significant differences were also observed among successful swings against fastballs (Fast Success), successful swings against changeups (Change Success), and unsuccessful swings against changeups (Change Fail). The pattern witnessed amongst these differences was that, compared to Fast Success, the batter seemed to be fooled a little bit when successfully hitting a changeup and fooled a lot when unsuccessful in hitting a changeup. Batters all tended to have a similar approach during the stance, stride, and coiling phases, but began to differ more in the latter phases of the swing. A progressive delay among the three conditions demonstrated that the batters tended to prematurely initiate the events of the kinetic chain since hitters are generally taught to anticipate a fastball and then react to an off-speed pitch. Another pattern observed among these three conditions was that the batters appeared to use their lower body and trunk to generate more of the energy for Fast Success, but they used their upper body more, particularly extension of the trail elbow, for Change Success and Change Fail.
167 153 While this study was primarily focused on generating data for biomechanists and other scientists, bridging the gap between those who work off the field and those who work on the field is paramount for any sports research. Based on the review of literature in batting, it is apparent that the skill of batting requires athletic development in biomechanics and motor control, vision and cognition, and strength and conditioning. Adjusting one s swing to various pitch locations and/or pitch speeds may involve, for example, increasing pelvis rotation or initiating the kinetic chain at the appropriate time, but it may also involve vision training for better and earlier pitch identification and improved strength, power, and flexibility to accommodate the necessary swing biomechanics. From a purely biomechanical standpoint, some preliminary advice to give to coaches based on this study are to have batters: (a) develop a strong, consistent approach for every swing in the early phases, particularly with the lower body; (b) anticipate a fastball for every pitch, but be able to recognize an off-speed pitch as early as possible; (c) use the powerful rotation of the pelvis to transfer the GRF and help direct the body according to the location of the incoming pitch; and (d) use the upper body to guide the hands along the appropriate path, putting the bat in a strong, properly angled position to direct the ball from its impact location to its desired destination on the field. 5.6 Ideas for future work Some things that may be considered limitations to the current study could also be construed as project ideas for the future. Any projects that could rectify any of the previously listed limitations of the current study would certainly be advantageous, particularly those that could address the issues of indoor batting (including lighting and
168 154 clothing), reflective tape covered baseballs, and pitching distance. One idea for the future is to use Major League Baseball players, rather than AA-level Minor League Baseball players, to try and capture the biomechanics of the true elites in the game. While many of the batters involved in the current study were considered top prospects, some differences between the two groups may exist. For that matter, future studies could also further explore college, high school, and youth batters and compare their results to these professionals. Another idea for the future would be to have a professional pitcher throw a simulated game, that is pitch to batters just as they would in a normal game, but without any fielders or baserunners. This would allow pitchers to mix in a variety of pitches and constantly rotate through a sequence of batters, maintaining the flow of a regular baseball game. A third idea, which would likely necessitate a higher capture rate, is to identify the location on the bat, and perhaps on the ball, where contact is made. The quality of contact assuredly affects the BEV, and therefore the outcome of the hit. Lastly, by collecting data on even more subjects for more trials, a greater possibility would exist for using that data for predictive purposes, as well as reducing any within-subject and between-subject variability. The current study basically used univariate models to relate each of the biomechanical parameters to BEV separately, but an influx of data could allow for more sensitive and robust multivariate models to predict BEV from full body swing biomechanics. An increase in data could also be processed through a discriminant analysis to determine the characteristics of successful and unsuccessful swings.
169 REFERENCES Adair, R. (22). The physics of baseball. New York: Harper. Bahill, A.T. (24). The ideal moment of inertia for a baseball or softball bat. IEEE Transactions on Systems, Man, and Cybernetics Part A: Systems and Humans, 34(2), Baker, D., Mercer, J., & Bittinger, M. (1993). You can teach hitting. Carmel: Bittinger Books. Berra, Y. (1998). The Yogi book: "I really didn't say everything I said". New York: Workman. Breen, J. L. (1967). What makes a good hitter? Journal of Health, Physical Education, Recreation, 38, Broer, M. R., & Houtz, S. J. (1967). Patterns of muscular activity in selected sport skills: an electromyographic study. Springfield: Charles C. Thomas. Burroughs, W. A. (1984). Visual simulation training of baseball batters. International Journal of Sports Psychology, 15(2), Carda, R.D. & Looney, M.A. (1994). Differences in physical characteristics in collegiate baseball players: a descriptive position by position analysis. Journal of Sports Medicine & Physical Fitness, 34(4), Cassidy, P. E., & Wade, M. G. (1998). Improving novice baseball batters' choice reaction times through video training. International Journal of Sports Vision, 5(1), Castaneda, B., & Gray, R. (27). Effects of focus of attention on baseball batting performance in players of differing skill levels. Journal of Sport & Exercise Psychology, 29(1), Cole, M.H. & Grimshaw, P.N. (29). The X-factor and its relationship to golf performance. Journal of Quantitative Analysis in Sports, 5(1), Coleman, A.E. & Lasky, L.M. Assessing running speed and body composition in professional baseball players. Journal of Applied Sport Science Research, 6(4), Cross, R. (29). Mechanics of swinging a bat. American Journal of Physics, 77(1), DeRenne, C. (1993). High-tech hitting: science vs. tradition. St. Paul: West. 155
170 156 DeRenne, C., Buxton, B.P., Hetzler, R.K. & Ho, K.W. (1995). Effects of weighted bat implement training on bat swing velocity. Journal of Strength and Conditioning Research, 9(4), DeRenne, C., Ho, K.W., Hetzler, R.K. & Chai, D.X. (1992). Effects of warm up with various weighted implements on baseball bat swing velocity. Journal of Applied Sport Science Research, 6(4), Dodd, D.J. & Alvar, B.A. (27). Analysis of acutve explosive training modalities to improve lower-body power in baseball players. Journal of Strength and Conditioning Research, 21(4), Dragoo, B.A. (23). Neuromotor control variables and their impact on select biomechanical parameters of the baseball swing. Ph.D. dissertation, Texas Woman's University, United States -- Texas. Retrieved June 1, 29, from Dissertations & Theses: A&I database. (Publication No. AAT ) Ebben, W.P., Hintz, M.J. & Simenz, C.J. (25). Strength and conditioning practices of Major League Baseball strength and conditioning coaches. Journal of Strength and Conditioning Research, 19(3), Escamilla, R.F., Fleisig, G.F., DeRenne, C., Taylor, M.K., Moorman, III, C.T., Imamura, R., Barakatt, E., Andrews, J.R. (29). Effects of bat grip on baseball hitting kinematics. Journal of Applied Biomechanics, 25(3), Escamilla, R.F., Fleisig, G.F., DeRenne, C., Taylor, M.K., Moorman, III, C.T., Imamura, R., Barakatt, E., Andrews, J.R. (29). A comparison of age level on baseball hitting kinematics. Journal of Applied Biomechanics, 25(3), Feltner, M. & Dapena, J. (1989). Three-dimensional interactions in a two-segment kinetic chain. Part I: general model. International Journal of Sport Biomechanics, 5(4), Fleisig, G.S., Zheng, N., Stodden, D.F. & Andrews, J.R. (22). Relationship between bat mass properties and bat velocity. Sports Engineering, 5, 1-8. Fortenbaugh, D., & Fleisig, G. (28). Ballpark forces: Ground reaction forces during batting. Poster session presented at the International Symposium on Biomechanics in Sports, Seoul, South Korea. Garhammer, J. (1983). Kinesiological analysis of hitting for baseball. National Strength & Conditioning Association Journal, 5(2), 6-7,7-71. Gelinas, M., & Hoshizaki, T.B. (1988). Kinematic characteristics of opposite-field hitting. Paper presented at the International Symposium on Biomechanics in Sports, Bozeman, MT.
171 157 Gola, M., & Monteleone, J. (21). The complete book of hitting faults and fixes. New York: McGraw-Hill. Gray, R. (22). Behavior of college baseball players in a virtual batting task. Journal of Experimental Psychology, 28(5), Gray, R. (22). Markov at the bat: A model of cognitive processing in baseball batters. Psychological Science, 13(6), Gwynn, T. (1998). The art of hitting. New York: GT. Hills, J. (25). Hip range of motion asymmetries in baseball hitters. Unpublished master s thesis, University of Toledo, Toledo, OH. Hirano, Y. (1986). Biomechanical analysis of baseball hitting. Paper presented at the International Symposium on Biomechanics in Sports, Halifax, Nova Scotia, Canada. Hirano, Y., & Murata, M. (23). Effects of ball movement and position at impact on grip firmness in baseball batting. Paper presented at the International Society of Biomechanics XIXth Congress, Dunedin, New Zealand. Hubbard, A.W., & Seng, C.N. (1954). Visual movements of batters. Research Quarterly, 25(1), Hughes, S. S., Lyons, B. C., & Mayo, J. J. (24). Effect of grip strength and grip strengthening exercises on instantaneous bat velocity of collegiate baseball players. Journal of Strength and Conditioning Research, 18(2), Hyllegard, R. (1991). The role of baseball seam pattern in pitch recognition. Journal of Sport & Exercise Psychology, 13(1), Jinji, T., & Sakurai, S. (26). Direction of spin axis and spin rate of the pitched baseball. Sports Biomechanics, 5(2), Katsumata, H. (27). A functional modulation for timing a movement: a coordinative structure in baseball hitting. Human Movement Science, 26(1), Kauffman, I. B., & Greenisen, M. C. (1973). Analysis of the validity of warm up with a weighted baseball bat. Paper presented at the annual meeting of the American Society of Mechanical Engineers, Detroit, MI. Kitzman, E. W. (1964). Baseball: electromyographic study of batting swing. Research Quarterly, 35(2),
172 158 Kohmura, Y., Aoki, K., Yoshigi, H., Sakuraba, K. & Yanagiya, T. (28). Development of a baseball-specific battery of tests and a testing protocol for college baseball players. Journal of Strength and Conditioning Research, 22(4), LaBranche, M. J. (1994). Effect of batting stance on ground reaction forces, bat velocity, and response time. Unpublished master s thesis, Springfield College, Springfield, MA. Lau, C., & Glossbrenner, A. (1984). The winning hitter: How to play championship baseball. New York: Hearst. Leigh, S., & Yu, B. (27). The associations of selected technical parameters with discus throwing performance: a cross-sectional study. Sports Biomechanics, 6(3), Liu, C., Tseng, K.-G., Chung, C.-W., Kao, Y.-C., & Shiang, T.-Y. (25). Design of simulative pitching machine and its effect. Poster session presented at International Symposium of Biomechanics in Sports, Beijing, China. Mason, B. (1985). Ground reaction forces of elite Australian baseball batters. Presented at International Symposium for Biomechanics in Sports, Greeley, CO. Matsuo, T., & Kasai, T. (1994). Timing strategy of baseball-batting. Journal of Human Movement Studies, 27(6), Matsuo, T., Kasai, T., & Asami, T. (1993). The improvement of coincidence anticipation timing task with bat-swing. Journal of Human Movement Studies, 25(3), Mihoces, G. (23, March 3) 1 hardest things to do in sports: Part III. USA Today, p. 3C. McIntyre, D. R., & Pfautsch, E. W. (1982). A kinematic analysis of the baseball batting swings involved in opposite-field and same field hitting. Research Quarterly for Exercise and Sport, 53(3), McLean, S. P., & Reeder, M. S. (2). Upper extremity kinematics of dominant and non-dominant side batting. Journal of Human Movement Studies, 38(4), McPherson, S. L. (1993). The influence of player experience on problem solving during batting preparation in baseball. Journal of Sport & Exercise Psychology, 15(3), McPherson, S. L., & MacMahon, C. (28). How baseball players prepare to bat: tactical knowledge as a mediator of expert performance in baseball. Journal of Sport and Exercise Psychology, 3(6), Nathan, A. (23). Characterizing the performance of baseball bats. American Journal of Physics, 71(2),
173 159 Nicholls, R.L., Elliott, B.C., Miller, K., & Koh, M. (23). Bat kinematics in baseball: implications for ball exit velocity and player safety. Journal of Applied Biomechanics, 19(4), Nicholls, R.L., Miller, K. & Elliot, B.C. (26). Numerical analysis of maximal bat performance in baseball. Journal of Biomechanics, 39(6), Noble, L., & Harms, N. (24). Relative effects of warm-up with underweight, overweight, and standard weight bats on bat velocity and segmental movement. Poster session presented at International Symposium for Biomechanics in Sports, Ottawa, Ontario, Canada. Otsuji, T., Abe, M. & Kinoshita, H. (22). After-effects of using a weighted bat on subsequent swing velocity and batters perceptions of swing velocity and heaviness. Perceptual & Motor Skills, 94(1), Page 2 - Sports skills difficulty rankings. (n.d.). Retrieved April 23, 29, from espn.com: Paull, G., & Glencross, D. (1997). Expert perception and decision making in baseball. International Journal of Sport Psychology, 28(1), Penrose, J.M.T. & Hose, D.R. (1999). An impact analysis of a flexible bat using an iterative solver. Journal of Sports Sciences, 17(8), Phillips, B.B., Andrews, J.R. & Fleisig, G.S. (2). Batter s shoulder: posterior instability of the lead shoulder, a biomechanical evaluation. Birmingham: Alabama Sports Medicine and Orthopaedic Center. Race, D.M. (1961). A cinematographic and mechanical analysis of the external movements involved in hitting a baseball effectively. Research Quarterly, 32(3), Rhea, M.R., Oliverson, J.R., Marshall, G., Peterson, M.D., Kenn, J.G. & Ayllon, F.N. (28). Noncompatibility of power and endurance training among college baseball players. Journal of Strength and Conditioning Research, 22(1), Robson, T. (23). The hitting edge. Champaign: Human Kinetics. Sawicki, G.S., Hubbard, M. & Stronge, W.J. (23). How to hit home runs: optimum baseball bat swing parameters for maximum range trajectories. American Journal of Physics, 71(11), Scott, S. A., & Gray, R. D. (27). Specificity of practice in baseball batting. Poster session presented at the annual meeting for the North American Society for Pyschology of Sport and Physical Activity, San Diego, CA.
174 16 Sergo, C. & Boatwright, D. (1993). Training methods using various weighted bats and the effects on bat velocity. Journal of Srength and Conditioning Research, 7(2), Shaffer, B., Jobe, F. W., Pink, M., & Perry, J. (1993). Baseball batting: an electromyographic study. Clinical Orthopaedics and Related Research, 292, Sherwood, J.A., Mustone, T.J. & Fallon, L.P. (2). Characterizing the performance of baseball bats using experimental and finite element methods. Presented at the 3 rd International Conference on the Engineering of Sport, Sydney, Australia. Slater-Hammel, A. T., & Stumpner, R. L. (195). Batting reaction-time. Research Quarterly, 21(4), Slater-Hammel, A. T., & Stumpner, R. L. (1951). Choice batting reaction-time. Research Quarterly, 22, Smith, L.V. (21). Evaluating baseball bat performance. Sports Engineering, 4, Southard, D. & Groomer, L. (23). Warm-up with baseball bats of varying moments of inertia: effect on bat velocity and swing pattern. Research Quarterly for Exercise & Sport, 74(3), Stodden, D.F., Fleisig, G.S., McLean, S.P., Lyman, S.L. & Andrews, J.R. (21). Relationship of pelvis and upper torso kinematics to pitched baseball velocity. Journal of Applied Biomechanics, 17(2), Swimley, P. S. (1964). A cinematographic analysis of two selected baseball swings. Unpublished master s thesis, Sacramento State College, Sacramento, CA. Szymanski, D.J., McIntyre, J.S., Szymanski, J.M., Bradford, T.J., Schade, R.L., Madsen, N.H. & Pascoe, D.D. (27). Effect of torso rotational strength on angular hip, angular shoulder, and linear bat velocities of high school baseball players. Journal of Strength and Conditioning Research, 21(4), Szymanski, D.J., McIntyre, J.S., Szymanski, J.M., Molloy, J.M., Madsen, N.H. & Pascoe, D.D. (26). Effect of wrist and forearm training on linear bat-end, center of percussion, and hand velocities and on time to ball contact of high school baseball players. Journal of Strength and Conditioning Research, 2(1), Szymanski, D.J., Szymanski, J.M., Bradford, T.J., Schade, R.L. & Pascoe, D.D. (27). Effect of twelve weeks of medicine ball training on high school baseball players. Journal of Strength and Conditioning Research, 21(3),
175 161 Szymanski, D.J., Szymanski, J.M., Molloy, J.M. & Pascoe, D.D. (24). Effect of 12 weeks of wrist and forearm training on high school baseball players. Journal of Strength and Conditioning Research, 18(3), Tago, T., Ae, M., & Koike, S. (25). The trunk twist angle during baseball batting at the different hitting points. Poster session presented at International Society for Biomechanics XXth Congress, Cleveland, OH. Tago, T., Ae, M., Fujii, N., Koike, S., Takahashi, K., & Kawamura, T. (26). Effects of height of hitting point on joint angular kinematics in baseball batting. Japanese Journal of Biomechanics, 1(1), Tago, T., Ae, M., Fujii, N., Koike, S., & Kawamura, T. (26). Effects of inside and outside hitting point on joint angular kinematics in baseball batting. Japanese Journal of Biomechanics, 1(4), Thwaites, R. (25). The effects of isometric strength and bat moment of inertia on bat velocity in baseball hitters. Unpublished master s thesis, Queensland University of Technology, Brisbane, Australia. Weimer, B., Halet, K. & Anderson, T. (27). Relationship of strength variables to bat velocity in college baseball and softball players. Missouri Journal of Health, Physical Education, Recreation & Dance, 17, Welch, C. M., Banks, S. A., Cook, F. F., & Draovitch, P. (1995). Hitting a baseball: a biomechanical description. Journal of Orthopaedic & Sports Physical Therapy, 22(5), Williams, T., & Underwood, J. (1986). The science of hitting. New York: Simon & Schuster. Winter, D. A. (199). Biomechanics and motor control of human movement, 2nd Ed. New York: Wiley. Yanai, T. (27). A mechanical cause of body rotation about the vertical axis in baseball batting. Poster session presented at the annual meeting of the American Society of Biomechanics, Cleveland, OH.
176 APPENDIX A: Informed Consent 162
177 163 AMERICAN SPORTS MEDICINE INSTITUTE JAMES R. ANDREWS, M.D. BIOMECHANICS LABORATORY Consent Form - Hitting Analysis I,, having attained my nineteenth birthday and otherwise having full capacity to consent, do hereby volunteer to participate in a study titled Biomechanical Analysis of Batting, under the direction of Glenn Fleisig, Ph.D. and Dave Fortenbaugh, MS. ASMI and St. Vincent s Fitness Center accept no responsibility for any injury I incur while batting or exercising. The implications of my voluntary participation, the nature, duration, and purpose; the methods and means by which the study is to be conducted; and the inconveniences and hazards to be expected have been thoroughly explained to me. I have been given an opportunity to ask questions concerning this investigation and these questions have been answered to my complete satisfaction. Any data generated from this test including photographs and video taken during the test may be used for future research studies, the ASMI website, and/or presentations. I understand that I may, at any time during the course of this investigation, revoke my consent and withdraw from the study without prejudice. Signature Date
178 APPENDIX B: Diagrams of Kinematic Variables 164


179 165 Stride length Stride direction


180 166 Lead foot Trail knee flexion

181 167 Lead knee flexion Pelvis rotation

182 168 Pelvis obliquity Pelvis tilt


183 169 Upper trunk rotation Upper trunk lateral flexion


184 17 Upper trunk flexion Head rotation


185 171 Lead shoulder azimuth Lead shoulder elevation


186 172 Trail shoulder azimuth Trail shoulder elevation


187 173 Lead elbow flexion Trail elbow flexion


188 174 Bat azimuth Bat elevation

189 Bat lag 175
190 APPENDIX C: Motion Analysis Corporation Sky Scripts 176
191 177 'TOTAL CALCULATIONS.sky 'Compiles all kinematic calculations and displays one page. For exporting to Excel only. Sub SkyMain HeadAngle() PelvisJointAngle() TrunkAngle() PelvisAngularVelocity() PolarShoulder() ElbowAngle() KneeJointAngle() FootCalculations() BatLag() End Sub '****************************************** '****************************************** Sub HeadAngle() Dim isegmenthead as Integer Dim HPcenter as Integer Dim Position(2) as Single Dim spos(2) as Single Dim Angles(5) as Single Dim Value as Single Dim EMPTY as Integer Dim RHeelMarker as Integer Dim LHeelMarker as Integer Dim RHeelMarkerX as Single Dim LHeelMarkerX as Single Dim spt(2) as Single isegmenthead = swmodel_getsegmentindex("head") HPcenter = swmodel_getmarkerindex("v_home plate") RHeelMarker = swmodel_getmarkerindex("right heel") LHeelMarker = swmodel_getmarkerindex("left heel") if (isegmenthead >= ) then swgetdata_segmentposition(isegmenthead, Position) swgetdata_segmentangles(isegmenthead, swcortex.rotationorder.zxy, Angles) swgetdata_marker(hpcenter, spos)
192 178 Position() = (Position() - spos())*.39 Position(1) = (Position(1) - spos(1))*.39 Position(2) = (Position(2) - spos(2))*.39 end if 'Check to see if batter is right-handed or left-handed and plot accordingly. swgetdata_marker(rheelmarker,spt) RHeelMarkerX = spt() swgetdata_marker(lheelmarker,spt) LHeelMarkerX = spt() if (LHeelMarkerX > RHeelMarkerX) then 'Right-handed batter else if (Position() = EMPTY) then swusergraphs_setvalue(, EMPTY) swusergraphs_setvalue(1, EMPTY) swusergraphs_setvalue(2, EMPTY) swusergraphs_setvalue(3, EMPTY) swusergraphs_setvalue(4, EMPTY) swusergraphs_setvalue(5, EMPTY) else swusergraphs_setvalue(, Angles()*-1) swusergraphs_setvalue(1, Angles(1)*-1) swusergraphs_setvalue(2, Angles(2)*-1) swusergraphs_setvalue(3, Position()) swusergraphs_setvalue(4, Position(1)) swusergraphs_setvalue(5, Position(2)) end if 'Left-handed batter if (Position() = EMPTY) then swusergraphs_setvalue(, EMPTY) swusergraphs_setvalue(1, EMPTY) swusergraphs_setvalue(2, EMPTY) swusergraphs_setvalue(3, EMPTY) swusergraphs_setvalue(4, EMPTY)
193 179 else swusergraphs_setvalue(5, EMPTY) swusergraphs_setvalue(, Angles()) swusergraphs_setvalue(1, Angles(1)*-1) swusergraphs_setvalue(2, Angles(2)) swusergraphs_setvalue(3, Position()) swusergraphs_setvalue(4, Position(1)*-1) swusergraphs_setvalue(5, Position(2)) end if end if End Sub '************************************************ '************************************************ Sub PelvisJointAngle() Dim isegmentpelvis as Integer Dim sangles(2) as Single Dim Position(2) as Single Dim spos(2) as Single Dim RHeelMarker as Integer Dim LHeelMarker as Integer Dim RHeelMarkerX as Single Dim LHeelMarkerX as Single Dim spt(2) as Single Dim EMPTY as Integer isegmentpelvis = swmodel_getsegmentindex("pelvis") HPcenter = swmodel_getmarkerindex("v_home plate") RHeelMarker = swmodel_getmarkerindex("right heel") LHeelMarker = swmodel_getmarkerindex("left heel") if (isegmentpelvis >= ) then
194 18 swgetdata_segmentangles(isegmentpelvis, swcortex.rotationorder.zyx, sangles) swgetdata_segmentposition(isegmentpelvis, Position) end if swgetdata_marker(hpcenter,spos) Position() = (Position() - spos())*.39 Position(1) = (Position(1) - spos(1))*.39 Position(2) = (Position(2) - spos(2))*.39 'Determine X coordinate of right and left heel markers swgetdata_marker(rheelmarker, spt) RHeelMarkerX = spt() swgetdata_marker(lheelmarker, spt) LHeelMarkerX = spt() if (LHeelMarkerX > RHeelMarkerX) then 'Right-handed batter if (sangles() = ) then swusergraphs_setvalue(6, ) swusergraphs_setvalue(7, ) swusergraphs_setvalue(8, ) swusergraphs_setvalue(9, EMPTY) swusergraphs_setvalue(1, EMPTY) swusergraphs_setvalue(11, EMPTY) else swusergraphs_setvalue(6, -1*sAngles()) swusergraphs_setvalue(7, -1*sAngles(1)) swusergraphs_setvalue(8, sangles(2)) swusergraphs_setvalue(9, Position()) swusergraphs_setvalue(1, Position(1)) swusergraphs_setvalue(11, Position(2)) end if else 'Left-handed batter
195 181 if (sangles() = ) then swusergraphs_setvalue(6, ) swusergraphs_setvalue(7, ) swusergraphs_setvalue(8, ) swusergraphs_setvalue(9, EMPTY) swusergraphs_setvalue(1, EMPTY) swusergraphs_setvalue(11, EMPTY) else swusergraphs_setvalue(6, -1*sAngles()) swusergraphs_setvalue(7, sangles(1)) swusergraphs_setvalue(8, -1*(sAngles(2)+18)) swusergraphs_setvalue(9, Position()) swusergraphs_setvalue(1, Position(1)*-1) swusergraphs_setvalue(11, Position(2)) end if end if end Sub '**************************************** '**************************************** Sub TrunkAngle() Dim isegmenttrunk as Integer Dim isegmentpelvis as Integer Dim GCS as Integer Dim gangles(2) as Single Dim langles(2) as Single Dim Value as Single Dim EMPTY as Integer Dim RHeelMarker as Integer Dim LHeelMarker as Integer Dim RHeelMarkerX as Single Dim LHeelMarkerX as Single Dim spt(2) as Single EMPTY = isegmenttrunk = swmodel_getsegmentindex("uppertrunk") isegmentpelvis = swmodel_getsegmentindex("pelvis")
196 182 RHeelMarker = swmodel_getmarkerindex("right heel") LHeelMarker = swmodel_getmarkerindex("left heel") GCS = -1 if (isegmenttrunk >= ) then swgetdata_segmentangles2(isegmenttrunk, GCS, swcortex.rotationorder.zyx, gangles) swgetdata_segmentangles(isegmenttrunk, swcortex.rotationorder.zyx, langles) end if 'Determine if batter was left- or right-handed and plot accordingly swgetdata_marker(rheelmarker,spt) RHeelMarkerX = spt() swgetdata_marker(lheelmarker,spt) LHeelMarkerX = spt() if (LHeelMarkerX > RHeelMarkerX) then 'Right-handed batter else if (gangles() = EMPTY) then swusergraphs_setvalue(12, EMPTY) swusergraphs_setvalue(13, EMPTY) swusergraphs_setvalue(14, EMPTY) else swusergraphs_setvalue(12, langles()) swusergraphs_setvalue(13, langles(1)*-1) swusergraphs_setvalue(14, langles(2)) end if 'Left-handed batter if (gangles() = EMPTY) then else swusergraphs_setvalue(12, EMPTY) swusergraphs_setvalue(13, EMPTY) swusergraphs_setvalue(14, EMPTY) swusergraphs_setvalue(12, langles())
197 183 end if swusergraphs_setvalue(13, langles(1)) swusergraphs_setvalue(14, langles(2)*-1) end if End Sub '********************************************************** '********************************************************** Sub PelvisAngularVelocity() Dim ipelvis as Integer = swmodel_getsegmentindex("pelvis") Dim iuppertrunk as Integer = swmodel_getsegmentindex("uppertrunk") Dim ilheelmarker as Integer = swmodel_getmarkerindex("left heel") Dim irheelmarker as Integer = swmodel_getmarkerindex("right heel") Dim spangularvelocity(2) as Single Dim sutangularvelocity(2) as Single Dim sputangularvelocity(2) as Single Dim Value as Single Dim LHeelMarkerX as Single Dim RHeelMarkerX as Single Dim spt(2) as Single Dim PelvisZAngVel as Single Dim UpperTrunkZAngVel as Single Dim PelvisUpperTrunkZAngVel as Single swgetdata_segmentangularvelocity(ipelvis, spangularvelocity) swgetdata_segmentangularvelocity(iuppertrunk, sutangularvelocity) swgetdata_segmentangularvelocity2(iuppertrunk, ipelvis, sputangularvelocity) swgetdata_marker(irheelmarker,spt) RHeelMarkerX = spt()
198 184 swgetdata_marker(ilheelmarker,spt) LHeelMarkerX = spt() if (LHeelMarkerX > RHeelMarkerX) then else end if PelvisZAngVel = spangularvelocity(2) UpperTrunkZAngVel = sutangularvelocity(2) PelvisUpperTrunkZAngVel = sputangularvelocity(2) PelvisZAngVel = spangularvelocity(2)*-1 UpperTrunkZAngVel = sutangularvelocity(2)*-1 PelvisUpperTrunkZAngVel = sputangularvelocity(2)*-1 swusergraphs_setvalue(15, PelvisZAngVel) swusergraphs_setvalue(16, UpperTrunkZAngVel) end Sub '************************************************ '************************************************ Sub PolarShoulder() Dim spt(2) as Single Dim slangles(2) as Single Dim srangles(2) as Single Dim LeftShoulderX as Single Dim LeftShoulderY as Single Dim LeftShoulderZ as Single Dim LeftElbowX as Single Dim LeftElbowY as Single Dim LeftElbowZ as Single Dim RightShoulderX as Single Dim RightShoulderY as Single Dim RightShoulderZ as Single Dim RightElbowX as Single Dim RightElbowY as Single Dim RightElbowZ as Single
199 185 Dim UpperTrunkX as Single Dim UpperTrunkY as Single Dim UpperTrunkZ as Single Dim LeftUpperArmX as Single Dim LeftUpperArmY as Single Dim LeftUpperArmZ as Single Dim RightUpperArmX as Single Dim RightUpperArmY as Single Dim RightUpperArmZ as Single Dim Lrho as Single Dim Ltheta as Single Dim Lphi as Single Dim Rrho as Single Dim Rtheta as Single Dim Rphi as Single Dim LHeelMarkerX as Single Dim RHeelMarkerX as Single Dim iuppertrunk as Integer = swmodel_getmarkerindex("v_upper trunk") Dim ileftshoulder as Integer = swmodel_getmarkerindex("v_l_shoulder_jc_trunk") Dim ileftelbow as Integer = swmodel_getmarkerindex("v_l_elbow_jc_trunk") Dim irightshoulder as Integer = swmodel_getmarkerindex("v_r_shoulder_jc_trunk") Dim irightelbow as Integer = swmodel_getmarkerindex("v_r_elbow_jc_trunk") Dim ilheelmarker as Integer = swmodel_getmarkerindex("left heel") Dim irheelmarker as Integer = swmodel_getmarkerindex("right heel") 'Get XYZ coordinates for Shoulder and Elbow joint centers if iuppertrunk >= then end if swgetdata_marker(iuppertrunk, spt) UpperTrunkX = spt() UpperTrunkY = spt(1) UpperTrunkZ = spt(2)
200 186 if ileftshoulder >= then swgetdata_marker(ileftshoulder, spt) LeftShoulderX = spt() LeftShoulderY = spt(1) LeftShoulderZ = spt(2) end if 'Calculate Left Elbow JC position w.r.t. Upper Trunk VM if ileftelbow >= then swgetdata_marker(ileftelbow, spt) LeftElbowX = spt() LeftElbowY = spt(1) LeftElbowZ = spt(2) end if if irightshoulder >= then swgetdata_marker(irightshoulder, spt) RightShoulderX = spt() RightShoulderY = spt(1) RightShoulderZ = spt(2) end if 'Calculate Right Elbow JC position w.r.t. Upper Trunk VM if irightelbow >= then swgetdata_marker(irightelbow, spt) RightElbowX = spt() RightElbowY = spt(1) RightElbowZ = spt(2) end if 'Calculate UpperArm segment lengths LeftUpperArmX = LeftShoulderX - LeftElbowX LeftUpperArmY = LeftShoulderY - LeftElbowY LeftUpperArmZ = LeftShoulderZ - LeftElbowZ RightUpperArmX = RightShoulderX - RightElbowX RightUpperArmY = RightShoulderY - RightElbowY RightUpperArmZ = RightShoulderZ - RightElbowZ 'Calculate Polar coordinates of UpperArm segments 'Given(x1,y1,z1) and (x2,y2,z2) as shoulder and elbow JC's, respectively 'corresponding (p,o,w) are: 'p = sqrt((x2-x1)^2 + (y2-y1)^2 + (z2-z1)^2)) 'o = arctan((y2-y1)/(x2-x1)) 'w = arctan(sqrt((x2-x1)^2 + (y2-y1)^2) / (z2-z1))
201 187 'Left UpperArm Lrho = (Math.Sqrt(LeftUpperArmX ^ 2 + LeftUpperArmY ^ 2 + LeftUpperArmZ ^ 2)) / 1 Ltheta = (Math.ACos(LeftUpperArmZ / (Math.Sqrt(LeftUpperArmX ^ 2 + LeftUpperArmY ^ 2 + LeftUpperArmZ ^ 2)))) * (18/Pi) Lphi = (Math.ATan2(LeftUpperArmY, LeftUpperArmX)) * (18/Pi) 'Right UpperArm Rrho = (Math.Sqrt(RightUpperArmX ^ 2 + RightUpperArmY ^ 2 + RightUpperArmZ ^ 2)) / 1 Rtheta = (Math.ACos(RightUpperArmZ / (Math.Sqrt(RightUpperArmX ^ 2 + RightUpperArmY ^ 2 + RightUpperArmZ ^ 2)))) * (18/Pi) Rphi = (Math.ATan2(RightUpperArmY, RightUpperArmX)) * (18/Pi) 'Determine if batter is left-handed or right-handed and graph accordingly. swgetdata_marker(irheelmarker,spt) RHeelMarkerX = spt() swgetdata_marker(ilheelmarker,spt) LHeelMarkerX = spt() if (LHeelMarkerX > RHeelMarkerX) then 'Right-handed swusergraphs_setvalue(17, Ltheta) swusergraphs_setvalue(18, Lphi-9) swusergraphs_setvalue(19, Rtheta) swusergraphs_setvalue(2, Rphi-9) else end if 'Left-handed swusergraphs_setvalue(17, Rtheta) swusergraphs_setvalue(18, -1*Rphi+9) swusergraphs_setvalue(19, Ltheta) swusergraphs_setvalue(2, -1*Lphi+9) End Sub '***********************************************************
202 188 '*********************************************************** Sub ElbowAngle() Dim isegmentleftforearm as Integer Dim isegmentrightforearm as Integer Dim isegmentleftupperarm as Integer Dim isegmentrightupperarm as Integer Dim Angles(2) as Single Dim AngularVelocity(2) as Single Dim Value as Single Dim EMPTY as Integer Dim LeftXElbowAngle as Single Dim LeftYElbowAngle as Single Dim LeftZElbowAngle as Single Dim RightXElbowAngle as Single Dim RightYElbowAngle as Single Dim RightZElbowAngle as Single Dim LeftElbowVelocity as Single Dim RightElbowVelocity as Single Dim RHeelMarker as Integer Dim LHeelMarker as Integer Dim RHeelMarkerX as Single Dim LHeelMarkerX as Single Dim spt(2) as Single EMPTY = isegmentleftforearm = swmodel_getsegmentindex("left Forearm") isegmentrightforearm = swmodel_getsegmentindex("right Forearm") isegmentleftupperarm = swmodel_getsegmentindex("left Upper Arm") isegmentrightupperarm = swmodel_getsegmentindex("rightupperarm") RHeelMarker = swmodel_getmarkerindex("right heel") LHeelMarker = swmodel_getmarkerindex("left heel") if (isegmentleftforearm >= ) then swgetdata_segmentangles(isegmentleftforearm, swcortex.rotationorder.xyz, Angles) LeftXElbowAngle = Angles() * -1 swgetdata_segmentangularvelocity2(isegmentleftforearm, isegmentleftupperarm, AngularVelocity) LeftElbowVelocity = AngularVelocity()
203 189 end if if (isegmentrightforearm >= ) then swgetdata_segmentangles(isegmentrightforearm, swcortex.rotationorder.xyz, Angles) RightXElbowAngle = Angles() * -1 swgetdata_segmentangularvelocity2(isegmentrightforearm, isegmentrightupperarm, AngularVelocity) RightElbowVelocity = AngularVelocity() end if 'Determine X coordinate of right and left heel markers swgetdata_marker(rheelmarker, spt) RHeelMarkerX = spt() swgetdata_marker(lheelmarker, spt) LHeelMarkerX = spt() 'Conditional statement to determine whether subject is right- or left-handed batter 'Data will be graphed depending on handedness of subject if (LHeelMarkerX > RHeelMarkerX) then 'Right-handed batter else if (LeftXElbowAngle = EMPTY) then swusergraphs_setvalue(21, EMPTY) swusergraphs_setvalue(23, EMPTY) else swusergraphs_setvalue(21, LeftXElbowAngle) swusergraphs_setvalue(23, LeftElbowVelocity) end if if (RightXElbowAngle = EMPTY) then swusergraphs_setvalue(22, EMPTY) swusergraphs_setvalue(24, EMPTY) else swusergraphs_setvalue(22, RightXElbowAngle) swusergraphs_setvalue(24, RightElbowVelocity) end if 'Left-handed batter
204 19 if (LeftXElbowAngle = EMPTY) then swusergraphs_setvalue(22, EMPTY) swusergraphs_setvalue(24, EMPTY) else swusergraphs_setvalue(22, LeftXElbowAngle) swusergraphs_setvalue(24, LeftElbowVelocity) end if if (RightXElbowAngle = EMPTY) then swusergraphs_setvalue(21, EMPTY) swusergraphs_setvalue(23, EMPTY) else swusergraphs_setvalue(21, RightXElbowAngle) swusergraphs_setvalue(23, RightElbowVelocity) end if End Sub end if '************************************************** '************************************************** Sub KneeJointAngle() Dim isegmentleftshank as Integer Dim isegmentrightshank as Integer Dim isegmentleftthigh as Integer Dim isegmentrightthigh as Integer Dim Angles(2) as Single Dim AngularVelocity(2) as Single Dim Value as Single Dim EMPTY as Integer Dim LeftKneeXAngle as Single Dim RightKneeXAngle as Single Dim LeftKneeVelocity as Single Dim RightKneeVelocity as Single Dim RHeelMarker as Integer Dim LHeelMarker as Integer Dim RHeelMarkerX as Integer Dim LHeelMarkerX as Integer Dim spt(2) as Single
205 191 isegmentrightshank = swmodel_getsegmentindex("right Shank") isegmentleftshank = swmodel_getsegmentindex("left Shank") isegmentleftthigh = swmodel_getsegmentindex("left Thigh") isegmentrightthigh = swmodel_getsegmentindex("right Thigh") RHeelMarker = swmodel_getmarkerindex("right heel") LHeelMarker = swmodel_getmarkerindex("left heel") EMPTY = 'Calculate joint angles if (isegmentleftshank >= ) then swgetdata_segmentangles(isegmentleftshank, swcortex.rotationorder.xyz, Angles) LeftKneeXAngle = Angles() swgetdata_segmentangularvelocity2(isegmentleftshank, isegmentleftthigh, AngularVelocity) LeftKneeVelocity = AngularVelocity()*-1 end if if (isegmentrightshank >= ) then swgetdata_segmentangles(isegmentrightshank, swcortex.rotationorder.xyz, Angles) RightKneeXAngle = Angles() swgetdata_segmentangularvelocity2(isegmentrightshank, isegmentrightthigh, AngularVelocity) RightKneeVelocity = AngularVelocity()*-1 end if 'Determine X coordinate of right and left heel markers swgetdata_marker(rheelmarker, spt) RHeelMarkerX = spt() swgetdata_marker(lheelmarker, spt) LHeelMarkerX = spt() 'Conditional statement to determine whether subject is right- or left-handed batter 'Data will be graphed depending on handediness of subject if LHeelMarkerX > RHeelMarkerX 'Right-handed batter
206 192 if LeftKneeXAngle = EMPTY then swusergraphs_setvalue(25, EMPTY) swusergraphs_setvalue(27, EMPTY) else swusergraphs_setvalue(25, LeftKneeXAngle) swusergraphs_setvalue(27, LeftKneeVelocity) end if if RightKneeXAngle = EMPTY then swusergraphs_setvalue(26, EMPTY) else swusergraphs_setvalue(26, RightKneeXAngle) end if else 'Left-handed batter if LeftKneeXAngle = EMPTY then swusergraphs_setvalue(26, EMPTY) else swusergraphs_setvalue(26, LeftKneeXAngle) end if if RightKneeXAngle = EMPTY then swusergraphs_setvalue(25, EMPTY) swusergraphs_setvalue(27, EMPTY) else swusergraphs_setvalue(25, RightKneeXAngle) swusergraphs_setvalue(27, RightKneeVelocity) end if End Sub end if '********************************************************************* '********************************************************************* Sub FootCalculations() Dim imarkerrightankle as Single
207 193 Dim imarkerleftankle as Single Dim spt(5) as Single Dim Value as Single Dim RightAnkleX as Single Dim RightAnkleY as Single Dim RightAnkleZ as Single Dim LeftAnkleX as Single Dim LeftAnkleY as Single Dim LeftAnkleZ as Single Dim AnkleDistance as Single Dim imarkerrighttoe as Single Dim imarkerlefttoe as Single Dim imarkerrightheel as Single Dim imarkerleftheel as Single Dim isubjectheight as Single imarkerrightankle = swmodel_getmarkerindex("v_right ankle") imarkerleftankle = swmodel_getmarkerindex("v_left ankle") imarkerrighttoe = swmodel_getmarkerindex("right toe") imarkerlefttoe = swmodel_getmarkerindex("left toe") imarkerrightheel = swmodel_getmarkerindex("right heel") imarkerleftheel = swmodel_getmarkerindex("left heel") isubjectheight = swgetpersonheight() '''''''''''''''''''' ' STRIDE LENGTH '''''''''''''''''''' ' Calculate distance between Right and Left Ankle Joint Centers ' Get position of Right Ankle VM in XYZ directions if imarkerrightankle >= then end if swgetdata_marker(imarkerrightankle, spt) RightAnkleX = spt() RightAnkleY = spt(1) ' Get position of Left Ankle VM in XYZ directions if imarkerleftankle >= then swgetdata_marker(imarkerleftankle, spt) LeftAnkleX = spt() LeftAnkleY = spt(1)
208 194 end if ' Convert isubjectheight from Centimeters to Inches isubjectheight = isubjectheight *.394 ' Calculate distance between Right and Left Ankle VM AnkleDistance = Math.Sqrt((RightAnkleX - LeftAnkleX) ^ 2 + (RightAnkleY - LeftAnkleY) ^ 2) ' Convert distance in Millimeters to distance in Inches AnkleDistance = AnkleDistance *.39 ' Normalize Stride Distance (in inches) to Subject Height (in inches) AnkleDistance = 1* AnkleDistance / isubjectheight ' Graph Stride Length swusergraphs_setvalue(28, AnkleDistance) '''''''''''''''''''' 'STRIDE DIRECTION (in inches) '''''''''''''''''''' ' Lead Ankle JC wrt Rear Ankle JC in Y Axis Dim LHeelMarker as Single = swmodel_getmarkerindex("left heel") Dim RHeelMarker as Single = swmodel_getmarkerindex("right heel") Dim RightAnkleYInitialPosition as Single = swmodel_getmarkerindex("v_right ankle") Dim LeftAnkleYInitialPosition as Single = swmodel_getmarkerindex("v_left ankle") 'Find position of Right and Left Heel markers on mocap frame 1 swgetdata_marker(lheelmarker, spt, 9) LHeelMarkerX = spt() swgetdata_marker(rheelmarker, spt, 9) RHeelMarkerX = spt() if (LHeelMarkerX > RHeelMarkerX) then 'Right-handed batter if RightAnkleYInitialPosition >= then swgetdata_marker(rightankleyinitialposition, spt, ) RightAnkleYInitialPosition = spt(1)
209 195 end if 'Calculate Stride Direction of Lead Ankle w.r.t. Rear Ankle StrideDirectionY = RightAnkleYInitialPosition - LeftAnkleY StrideDirectionY = StrideDirectionY *.39 swusergraphs_setvalue(29, StrideDirectionY) else 'Left-handed batter end if if LeftAnkleYInitialPosition >= end if swgetdata_marker(leftankleyinitialposition, spt, ) LeftAnkleYInitialPosition = spt(1) 'Calculate Stride Direction of Lead Ankle w.r.t. Rear Ankle StrideDirectionY = LeftAnkleYInitialPosition - RightAnkleY StrideDirectionY = StrideDirectionY *.39 swusergraphs_setvalue(29, -1*StrideDirectionY) '''''''''''''''''''' 'LEAD FOOT ANGLE '''''''''''''''''''' ' Calculate relationship of lead toe to lead ankle w.r.t. X-axis Dim LengthLeftFoot as Single Dim LengthLeftHeel as Single Dim LengthLeftToe as Single Dim LengthRightFoot as Single Dim LengthRightHeel as Single Dim LengthRightToe as Single Dim LeftToeX as Single Dim LeftToeY as Single Dim RightToeX as Single Dim RightToeY as Single Dim LeftHeelX as Single Dim LeftHeelY as Single Dim RightHeelX as Single Dim RightHeelY as Single
210 196 Dim DotLeadHeel as Single Dim DotLeadToe as Single Dim AngleLeadHeel as Single Dim AngleLeadToe as Single Dim LeadFootAngle as Single Dim DotLeftFoot as Single Dim AngleLeftFoot as Single Dim DotRightFoot as Single Dim AngleRightFoot as Single Dim XAxisLine as Integer XAxisLine = 1 '***Need to put in check to auto calculate right and left batters ' Get position of Left Toe in XYZ directions if imarkerrighttoe >= then swgetdata_marker(imarkerrighttoe, spt) RightToeX = spt() RightToeY = spt(1) end if if imarkerlefttoe >= then swgetdata_marker(imarkerlefttoe, spt) LeftToeX = spt() LeftToeY = spt(1) end if if imarkerrightheel >= then swgetdata_marker(imarkerrightheel, spt) RightHeelX = spt() RightHeelY = spt(1) end if if imarkerleftheel >= then swgetdata_marker(imarkerleftheel, spt) LeftHeelX = spt() LeftHeelY = spt(1) end if if (LHeelMarkerX > RHeelMarkerX) then 'Right-handed batter ' Find length of Lead Foot (Ankle JC -> Toe) ' Vector = <x2 - x1, y2 - y1> ' LengthVector = <x, y> = sqrt(x*x + y*y) LengthLeftFoot = Math.Sqrt((LeftHeelX - LeftToeX) ^ 2 + (LeftHeelY - LeftToeY) ^ 2) LengthXAxis = Math.Sqrt((Origin - XAxisLine) ^ 2)
211 197 ' Find dot of lead foot (X-axis) DotLeftFoot = (LeftHeelX - LeftToeX) * (Origin - XAxisLine) ' Find angle of lead foot w.r.t. XAxis (in degrees) AngleLeftFoot = (Math.ACos(DotLeftFoot / (LengthLeftFoot * LengthXAxis))) * (18 / Pi) else ' Graph foot angle w.r.t. X-axis (in degrees) swusergraphs_setvalue(3, AngleLeftFoot) 'Left-handed batter LengthRightFoot = Math.Sqrt((RightHeelX - RightToeX) ^ 2 + (RightHeelY - RightToeY) ^ 2) LengthXAxis = Math.Sqrt((Origin - XAxisLine) ^ 2) DotRightFoot = (RightHeelX - RightToeX) * (Origin - XAxisLine) AngleRightFoot = (Math.ACos(DotRightFoot / (LengthRightFoot * LengthXAxis))) * (18 / Pi) End Sub end if swusergraphs_setvalue(3, AngleRightFoot) '****************************************************** '****************************************************** Sub BatLag() Dim ibatknob as Integer Dim ibatcap as Integer Dim iwrist as Integer Dim iclavicle as Integer Dim BatKnob as Single Dim BatCap as Single Dim BatTheta as Single Dim BatPhi as Single Dim Wrist as Single
212 198 Dim Clavicle as Single Dim spt(2) as Single Dim BatKnobX as Single Dim BatKnobY as Single Dim BatKnobZ as Single Dim BatCapX as Single Dim BatCapY as Single Dim BatCapZ as Single Dim WristX as Single Dim WristY as Single Dim WristZ as Single Dim ClavicleX as Single Dim ClavicleY as Single Dim ClavicleZ as Single Dim LengthBat as Single Dim LengthBatX as Single Dim LengthBatY as Single Dim LengthBatZ as Single Dim LengthWristClavicle as Single Dim LengthWristClavicleX as Single Dim LengthWristClavicleY as Single Dim LengthWristClavicleZ as Single Dim DotBat as Single Dim AngleBatWristClavicle as Single Dim LengthBatIN as Single Dim LengthWristClavicleIN as Single Dim XEMPTY as Single = 'Get marker and segment indices ibatknob = swmodel_getmarkerindex("bat knob") ibatcap = swmodel_getmarkerindex("bat cap") ibatbarrel = swmodel_getmarkerindex("v_bat barrel") iwrist = swmodel_getmarkerindex("v_mid_wrist") iclavicle = swmodel_getmarkerindex("v_clavicle") 'Get marker XYZ coordinates w.r.t. GCS if (ibatknob >= ) then swgetdata_marker(ibatknob, spt) BatKnobX = spt() BatKnobY = spt(1) BatKnobZ = spt(2) end if if (ibatcap >= ) then
213 199 swgetdata_marker(ibatcap, spt) BatCapX = spt() BatCapY = spt(1) BatCapZ = spt(2) end if if (iwrist >= ) then swgetdata_marker(iwrist, spt) WristX = spt() WristY = spt(1) WristZ = spt(2) end if if (iclavicle >= ) then swgetdata_marker(iclavicle, spt) ClavicleX = spt() ClavicleY = spt(1) ClavicleZ = spt(2) end if 'Calculate distances in each of three axes LengthBatX = BatCapX - BatKnobX LengthBatY = BatCapY - BatKnobY LengthBatZ = BatCapZ - BatKnobZ LengthWristClavicleX = ClavicleX - WristX LengthWristClavicleY = ClavicleY - WristY LengthWristClavicleZ = ClavicleZ - WristZ 'Find the length of the two vectors used for analysis 'Vector = <x2 - x1, y2 - y1, z2 - z1> 'LengthVector = <x,y,z> = sqrt(x*x + y*y + z*z) LengthBat = Math.Sqrt(LengthBatX ^ 2 + LengthBatY ^ 2 + LengthBatZ ^ 2) LengthWristClavicle = Math.Sqrt(LengthWristClavicleX ^ 2 + LengthWristClavicleY ^ 2 + LengthWristClavicleZ ^ 2) 'Find the dot of the bat/angle between vectors 'DotProduct = Ax * Bx + Ay * By + Az * Bz 'Angle between vectors (in degrees) = (ACos(DotProduct / (LengthA * LengthB))) * (18/Pi) DotProduct = LengthBatX * LengthWristClavicleX + LengthBatY * LengthWristClavicleY + LengthBatZ * LengthWristClavicleZ AngleBatWristClavicle = (Math.ACos(DotProduct / (LengthBat * LengthWristClavicle))) * (18/Pi) 'Convert LengthBat / LengthWristClavicle to inches
214 2 '1mm =.39in LengthBatIN = LengthBat *.39 'LengthWristClavicleIN = LengthWristClavicle *.39 'Calculate theta (elevation) and phi (azimuth) of bat in global space BatTheta = (Math.Acos(LengthBatZ / (Math.Sqrt(LengthBatX ^ 2 + LengthBatY ^ 2 + LengthBatZ ^ 2)))) * (18/Pi) BatPhi = (Math.ATan2(LengthBatY, LengthBatX)) * (18/Pi) 'We need to use the old graph values to make the angles continuous. Dim lastframe As Integer = swgetdata_framenumber() - 1 Dim oldangle as Single = swgetdata_usergraphs(3,, lastframe) 'If(lastFrame >= ) Then 'Do 18 degree adjustments until we are close enough 'Dim delta As Single = BatPhi - oldangle 'While(Math.Abs(delta) > 1) '1 degrees is a semi arbitrary threshold for determining an angle flip 'BatPhi = BatPhi + Math.Sign(delta) * -18 'move the angle 18 degrees closer 'delta = BatPhi - oldangle 'End While 'End If 'Determine if batter is left-handed or right-handed and plot accordingly Dim RHeelMarker as Integer Dim LHeelMarker as Integer Dim RHeelMarkerX as Single Dim LHeelMarkerX as Single RHeelMarker = swmodel_getmarkerindex("right heel") LHeelMarker = swmodel_getmarkerindex("left heel") swgetdata_marker(rheelmarker, spt) RHeelMarkerX = spt() swgetdata_marker(lheelmarker, spt) LHeelMarkerX = spt()
215 21 End Sub if (LHeelMarkerX > RHeelMarkerX) then 'Right-handed swusergraphs_setvalue(31, LengthBatIN) swusergraphs_setvalue(32, -1*AngleBatWristClavicle+18) swusergraphs_setvalue(33, -1*BatTheta+9) swusergraphs_setvalue(34, BatPhi-27) else 'Left-handed swusergraphs_setvalue(31, LengthBatIN) swusergraphs_setvalue(32, -1*AngleBatWristClavicle+18) swusergraphs_setvalue(33, -1*BatTheta+9) swusergraphs_setvalue(34, -1*BatPhi-27) end if
216 22 'ForcePlateInfo.sky Sub SkyMain ForcePlateInfo() End Sub Sub ForcePlateInfo() 'Force Platform 1 = swgetdata_forceplateforces(,grf) 'Force Platform 2 = swgetdata_forceplateforces(1,grf) Dim lfgrf(4) as Single Dim tfgrf(4) as Single Dim EMPTY as Integer Dim SubjectWeight as Single Dim LHeelMarker as Integer Dim RHeelMarker as Integer Dim LHeelMarkerX as Single Dim RHeelMarkerX as Single Dim spt(2) as Single RHeelMarker = swmodel_getmarkerindex("right heel") LHeelMarker = swmodel_getmarkerindex("left heel") EMPTY = SubjectWeight = swgetpersonweight() SubjectWeight = SubjectWeight * 'Force Platform 1 (Lead Foot) swgetdata_forceplateforces(,lfgrf) 'Force Platform 2 (Trail Foot) swgetdata_forceplateforces(1,tfgrf) lfgrf() = 1* lfgrf() / SubjectWeight lfgrf(1) = 1* lfgrf(1) / SubjectWeight lfgrf(2) = 1* lfgrf(2) / SubjectWeight tfgrf() = 1* tfgrf() / SubjectWeight tfgrf(1) = 1* tfgrf(1) / SubjectWeight tfgrf(2) = 1* tfgrf(2) / SubjectWeight
217 23 'Determine if batter is left- or right-handed and plot accordingly swgetdata_marker(rheelmarker, spt) RHeelMarkerX = spt() swgetdata_marker(lheelmarker, spt) LHeelMarkerX = spt() if (LHeelMarkerX > RHeelMarkerX) then 'Right-handed batter if (tfgrf() = EMPTY) then swusergraphs_setvalue(, EMPTY) swusergraphs_setvalue(1, EMPTY) swusergraphs_setvalue(2, EMPTY) swusergraphs_setvalue(3, EMPTY) swusergraphs_setvalue(4, EMPTY) swusergraphs_setvalue(5, EMPTY) swusergraphs_setvalue(6, EMPTY) swusergraphs_setvalue(7, EMPTY) swusergraphs_setvalue(8, EMPTY) swusergraphs_setvalue(9, EMPTY) else swusergraphs_setvalue(, tfgrf()) swusergraphs_setvalue(1, -1*tfGRF(1)) swusergraphs_setvalue(2, tfgrf(2)) swusergraphs_setvalue(3, tfgrf(3)) swusergraphs_setvalue(4, tfgrf(4)) swusergraphs_setvalue(5, lfgrf()) swusergraphs_setvalue(6, -1*lfGRF(1)) swusergraphs_setvalue(7, lfgrf(2)) swusergraphs_setvalue(8, lfgrf(3)) swusergraphs_setvalue(9, lfgrf(4)) end if else 'Left-handed batter if (tfgrf() = EMPTY) then swusergraphs_setvalue(, EMPTY) swusergraphs_setvalue(1, EMPTY) swusergraphs_setvalue(2, EMPTY)
218 24 else end if swusergraphs_setvalue(3, EMPTY) swusergraphs_setvalue(4, EMPTY) swusergraphs_setvalue(5, EMPTY) swusergraphs_setvalue(6, EMPTY) swusergraphs_setvalue(7, EMPTY) swusergraphs_setvalue(8, EMPTY) swusergraphs_setvalue(9, EMPTY) swusergraphs_setvalue(, tfgrf()) swusergraphs_setvalue(1, tfgrf(1)) swusergraphs_setvalue(2, tfgrf(2)) swusergraphs_setvalue(3, tfgrf(3)) swusergraphs_setvalue(4, tfgrf(4)) swusergraphs_setvalue(5, lfgrf()) swusergraphs_setvalue(6, lfgrf(1)) swusergraphs_setvalue(7, lfgrf(2)) swusergraphs_setvalue(8, lfgrf(3)) swusergraphs_setvalue(9, lfgrf(4)) end if End Sub
219 APPENDIX D: MATLAB Programming Codes 25
220 26 %complete_baseball.m %This MATLAB program is used to concatenate kinematic and force plate data %files, calculate lead shoulder and bat azimuth velocities, extract data %from 4 key events (Lead Foot Off, Lead Foot Down, Lead Foot Commit, Ball %Contact) and maximum values of selected variables %A file of the combined kinematic and force plate data for each trial, and %a subject file is created/appended with one row for each trial clear; clc prompt1 = {'Please enter the 6-digit subject ID'}; subjectid = inputdlg(prompt1); prompt2 = {'Please enter trial number (9999 to exit)'}; dg_title = 'tn'; num_lines = 1; default = {'9999'}; trial_num = inputdlg(prompt2,dg_title,num_lines,default); trial_nmbr = str2double(trial_num{1,1}); while trial_nmbr~=9999 %Read in kinematic data file and assigns trial number variable battingfile = strcat(subjectid, '-',trial_num,'.data'); batfile = cell2mat(battingfile); c=dlmread(batfile, '\t',3,); %Read in force plate data file forcesfile = strcat(subjectid, '-',trial_num,'-forces','.data'); forcefile = cell2mat(forcesfile); f=dlmread(forcefile, '\t',3,1); %Read in speed file speedfile = strcat(subjectid,'-',trial_num,'-speed','.ts'); spdfile = cell2mat(speedfile); aa = dlmread(spdfile, '\t', 6, 19); %Read in subject and trial info from Ball Tracking file subjectid_string = cell2mat(subjectid); [num text raw] = xlsread('ball tracking.xlsx', subjectid_string); trial_index = trial_nmbr+8; ballcontact = raw(trial_index, 4);
221 27 ballcontact = cell2mat(ballcontact); balllocation = raw(trial_index, 3); balllocation = cell2mat(balllocation); bcf = {ballcontact, balllocation}; ball_vel_in = raw(trial_index, 2); ball_vel_out = raw(trial_index, 5); if (strcmp(ball_vel_out,'miss') strcmp(ball_vel_out,'foul')) hit_result = cell2mat(ball_vel_out); else hit_result = 'HIT'; end; %Create data arrays index=c(:,1); data=c(:,2:end); forcedata=f(:,1:end); matarray=[index data]; %Ask user for frame of ball contact and pitch type / location prompt = {'Lead Foot Off (<1% BW):', 'Lead Foot Down (>1% BW):', 'Lead Foot Commit (>=5% BW):'}; dlg_title = 'Trial Info'; def = {'Y', 'Y', 'Y'}; answer = inputdlg(prompt,dlg_title,num_lines,def); FootOff=answer{1,1}; FootDown=answer{2,1}; FootCommit=answer{3,1}; %Concatenate trial number, ball location, and hit result trialinfo = {trial_nmbr balllocation hit_result}; %Create time column timecol=zeros(size(matarray,1),1); x=find(matarray(:,1)==ballcontact); n=x; framespeed=; framecounter=1/3; for n=n:size(timecol) timecol(n)=timecol(n)+framespeed; framespeed=framespeed+framecounter; n=n+1; end; y=x;
222 28 framespeed=; while y> timecol(y)=timecol(y)-framespeed; framespeed=framespeed+framecounter; y=y-1; end; array=[matarray(:,1) timecol matarray(:,2:end)]; %Replace ' ' with NaN array(array== )=nan; %Create new variable column for Lead Shldr Azim Vel LeadShoulderAzAngVel=NaN(size(matArray,1),1); for w=2:size(leadshoulderazangvel)-1 LeadShoulderAzAngVel(w)=(array(w+1,21)-array(w-1,21))*15; w=w+1; end; t=2; %Continuity adjustment for Bat Azimuth angle while t<=size(array,1) if abs(array(t,37)-array(t-1,37))>1 array(t:end,37)=array(t:end,37)+36; end; t=t+1; end %Create new variable column for Bat Azim Vel BatAzAngVel=NaN(size(matArray,1),1); w=2; for w=2:size(batazangvel)-1 BatAzAngVel(w)=(array(w+1,37)-array(w-1,37))*15; w=w+1; end; %Recompose final data array finalarray=[array(:,1:21) LeadShoulderAzAngVel array(:,22:end) BatAzAngVel forcedata]; %Convert "finalarray" to cell array DataArray = num2cell(finalarray); %Create subject file, and write out headers to appropriate Excel sheet subjfile=batfile(1:6);
223 29 subjectfile=[subjfile 'data' '.xlsx']; sheetnames = {'Event frames', 'Lead Foot Off', 'Lead Foot Down', 'Lead Foot Commit', 'Ball Contact', 'Maximums'}; xlsheets(sheetnames,subjectfile); [d1 e1 f1] = xlsread(subjectfile,5); [sample_row, sample_column] = size(f1); myheader= {'Frame #' 'Time' 'Head Angle X' 'Head Angle Y' 'Head Angle Z' 'Head Pos X' 'Head Pos Y' 'Head Pos Z' 'Pelvis Tilt' 'Pelvis Obliq' 'Pelvis Rot' 'Pelvis Pos X' 'Pelvis Pos Y' 'Pelvis Pos Z' 'UT Flexion' 'UT Lat Flexion' 'UT Rot' 'Pelvis Rot Vel' 'UT Rot Vel' 'Lead Shldr Elev' 'Lead Shldr Azim' 'Lead Shldr Azim Vel' 'Trail Shldr Elev' 'Trail Shldr Azim' 'Lead Elbow' 'Trail Elbow' 'Lead Elbow Vel' 'Trail Elbow Vel' 'Lead Knee' 'Trail Knee' 'Lead Knee Vel' 'Stride Length' 'Stride Direction' 'Lead Foot Angle' 'Bat Length' 'Bat Lag' 'Bat Elevation' 'Bat Azimuth' 'Bat Azimuth Vel' 'Trail Foot GRFx' 'Trail Foot GRFy' 'Trail Foot GRFz' 'Trail Foot COPx' 'Trail Foot COPy' 'Lead Foot GRFx' 'Lead Foot GRFy' 'Lead Foot GRFz' 'Lead Foot COPx' 'Lead Foot COPy'}; if sample_row<2 theheader = ['Trial', 'Ball Location', 'Hit Result', myheader]; xlsappend(subjectfile, theheader, 'Lead Foot Off'); xlsappend(subjectfile, theheader, 'Lead Foot Down'); xlsappend(subjectfile, theheader, 'Lead Foot Commit'); xlsappend(subjectfile, theheader, 'Ball Contact'); end; %Write out data from Lead Foot Off frame line to appropriate Excel sheet of %subject file if FootOff=='Y' FootOffGRF=cell2mat(DataArray(1,47)); i=1; while (FootOffGRF>1.) i=i+1; FootOffGRF=cell2mat(DataArray(i,47)); end; FootOffdata = [trialinfo, DataArray(i,:)]; xlsappend(subjectfile, FootOffdata, 'Lead Foot Off'); end; %Write out data from Lead Foot Down frame line to appropriate Excel sheet %of subject file j=1; if FootDown=='Y' if FootOff=='Y' j=i+1; end;
224 21 FootDownGRF=cell2mat(DataArray(j,47)); while (FootDownGRF<1.) j=j+1; FootDownGRF=cell2mat(DataArray(j,47)); end; FootDowndata = [trialinfo, DataArray(j,:)]; xlsappend(subjectfile, FootDowndata, 'Lead Foot Down'); end; %Write out data from Lead Foot Commit frame line to appropriate Excel sheet %of subject file k=1; if FootCommit=='Y' if FootDown=='Y' k=j+1; end; FootCommitGRF=cell2mat(DataArray(k,47)); while (FootCommitGRF<5.) k=k+1; FootCommitGRF=cell2mat(DataArray(k,47)); end; FootCommitdata = [trialinfo, DataArray(k,:)]; xlsappend(subjectfile, FootCommitdata, 'Lead Foot Commit'); end; %Write out data from Ball Contact frame line to appropriate Excel sheet of %subject file BallContactdata = [trialinfo, DataArray(ballContact,:)]; xlsappend(subjectfile, BallContactdata, 'Ball Contact'); %Write out all key frames for storage on subject file key_frames_header = {'Trial' 'Location' 'Hit Result' 'Lead Foot Off' 'Lead Foot Down', 'Lead Foot Commit', 'Ball Contact'}; if sample_row<2 xlsappend(subjectfile, key_frames_header, 'Event frames'); end; frame_line = {trial_nmbr balllocation hit_result i j k ballcontact}; xlsappend(subjectfile, frame_line, 'Event frames'); %Create header for maxima and minima worksheet maxmin_header = {' ', ' ', ' ', 'Pelvis Rotation', ' ', 'UT Rotation', ' ', 'Lead Shldr Azim Pre-contact', ' ', 'Lead Shldr Azim Post-contact', ' ', 'Trail Elbow', ' ', 'Lead Knee', ' ', 'Bat Azimuth', ' ', 'Ball Speed', ' ', 'Bat Linear', ' ', 'Trail Foot GRFx', ' ', 'Trail Foot GRFy', ' ', 'Trail Foot GRFz', ' ', 'Lead Foot GRFx', ' ', 'Lead Foot GRFy', ' ', 'Lead Foot GRFz', ' ';
225 211 'Trial', 'Location', 'Hit Result', 'time', 'speed','time', 'speed','time', 'speed','time', 'speed','time', 'speed','time', 'speed','time', 'speed','incoming', 'Outgoing', 'time', 'speed','time', 'value','time', 'value','time', 'value','time', 'value','time', 'value','time', 'value'}; if sample_row<2 xlsappend(subjectfile, maxmin_header, 'Maximums'); end; %Locate maximum pelvis rotation velocity and index [max_pelvis max_pelvis_index] = max(finalarray(:,18)); max_pelvis_index = timecol(max_pelvis_index,1); %Locate maximum upper trunk rotation velocity and index [max_ut max_ut_index] = max(finalarray(:,19)); max_ut_index = timecol(max_ut_index,1); %Locate maximum lead shoulder azimuth velocity (pre-contact) and index [max_shldr_azim_prec max_shldr_azim_prec_index] = max(finalarray(1:ballcontact,22)); max_shldr_azim_prec_index = timecol(max_shldr_azim_prec_index,1); %Locate maximum lead shoulder azimuth velocity (post-contact) and index [max_shldr_azim_postc max_shldr_azim_postc_index] = max(finalarray(ballcontact:end,22)); max_shldr_azim_postc_index = timecol(max_shldr_azim_postc_index + ballcontact- 1,1); %Locate maximum trail elbow velocity and index [max_elbow max_elbow_index] = max(finalarray(:,28)); max_elbow_index = timecol(max_elbow_index,1); %Locate maximum lead knee extension velocity and index [max_knee max_knee_index] = min(finalarray(:,31)); max_knee_index = timecol(max_knee_index,1); %Locate maximum bat azimuth velocity and index [max_bat_azim max_bat_azim_index] = max(finalarray(:,39)); max_bat_azim_index = timecol(max_bat_azim_index,1); %Locate maximum bat linear velocity and index bat_linear = (aa(:,1)); [max_bat_linear max_bat_linear_index] = max(bat_linear); max_bat_linear = max_bat_linear/1; max_bat_linear_index = timecol(max_bat_linear_index,1); %Locate maximum Trail Foot GRFx and index [TF_GRFx TF_GRFx_index] = max(finalarray(1:ballcontact,4));
226 212 TF_GRFx_index = timecol(tf_grfx_index,1); %Locate maximum Trail Foot GRFy and index [TF_GRFy TF_GRFy_index] = max(finalarray(1:ballcontact,41)); TF_GRFy_index = timecol(tf_grfy_index,1); %Locate maximum Trail Foot GRFz and index [TF_GRFz TF_GRFz_index] = max(finalarray(1:ballcontact,42)); TF_GRFz_index = timecol(tf_grfz_index,1); %Locate maximum Lead Foot GRFx and index [LF_GRFx LF_GRFx_index] = min(finalarray(1:ballcontact,45)); LF_GRFx_index = timecol(lf_grfx_index,1); %Locate maximum Trail Foot GRFy and index [LF_GRFy LF_GRFy_index] = min(finalarray(1:ballcontact,46)); LF_GRFy_index = timecol(lf_grfy_index,1); %Locate maximum Trail Foot GRFz and index [LF_GRFz LF_GRFz_index] = max(finalarray(1:ballcontact,47)); LF_GRFz_index = timecol(lf_grfz_index,1); %Write out maxima/minima data to appropriate Excel sheet of subject file Maximumdata = [trialinfo, max_pelvis_index, max_pelvis, max_ut_index, max_ut, max_shldr_azim_prec_index, max_shldr_azim_prec, max_shldr_azim_postc_index, max_shldr_azim_postc, max_elbow_index, max_elbow, max_knee_index, max_knee, max_bat_azim_index, max_bat_azim, ball_vel_in, ball_vel_out, max_bat_linear_index, max_bat_linear, TF_GRFx_index, TF_GRFx, TF_GRFy_index, TF_GRFy, TF_GRFz_index, TF_GRFz, LF_GRFx_index, LF_GRFx, LF_GRFy_index, LF_GRFy, LF_GRFz_index, LF_GRFz]; xlsappend(subjectfile, Maximumdata, 'Maximums'); %Ask user to create file name and write out combined data file combinedfilename = strrep(forcefile, 'forces.data', 'combined'); combinedfilename = strcat (combinedfilename, '.xlsx'); %[CombinedFile, CombinedPath] = uiputfile('*.xlsx', 'Name the biomechanical data file to save:', combinedfilename); xlswrite(finalarray, bcf, myheader, combinedfilename); prompter = {'Please enter trial number (9999 to exit)'}; trial_num = inputdlg(prompter,dg_title,num_lines,default); trial_nmbr = str2double(trial_num{1,1}); end;
227 213 %graph_constructor.m % This program extracts data for the purpose of making graphs clear; clc %Prompt user for subject and desired pitch type prompt1 = {'6-digit subject ID', 'Pitch Type'}; answers = inputdlg(prompt1); subjectid = answers{1,1}; pitch_type = answers{2,1}; %header = {subjectid, pitch_type}; %Create initial 3 dimensional array of zeros as placeholders DataArray = NaN(91,19,47); DataArray(1,1,:) = -2; counter=1/3; for n=2:91 DataArray(n,1,:) = DataArray(n-1,1,:)+counter; end; %Create graphing file for desired pitch type sheetnames = {'Head Angle X' 'Head Angle Y' 'Head Angle Z' 'Head Pos X' 'Head Pos Y' 'Head Pos Z' 'Pelvis Tilt' 'Pelvis Obliq' 'Pelvis Rot' 'Pelvis Pos X' 'Pelvis Pos Y' 'Pelvis Pos Z' 'UT Flexion' 'UT Lat Flexion' 'UT Rot' 'Pelvis Rot Vel' 'UT Rot Vel' 'Lead Shldr Elev' 'Lead Shldr Azim' 'Lead Shldr Azim Vel' 'Trail Shldr Elev' 'Trail Shldr Azim' 'Lead Elbow' 'Trail Elbow' 'Lead Elbow Vel' 'Trail Elbow Vel' 'Lead Knee' 'Trail Knee' 'Lead Knee Vel' 'Stride Length' 'Stride Direction' 'Lead Foot Angle' 'Bat Length' 'Bat Lag' 'Bat Elevation' 'Bat Azimuth' 'Bat Azimuth Vel' 'Trail Foot GRFx' 'Trail Foot GRFy' 'Trail Foot GRFz' 'Trail Foot COPx' 'Trail Foot COPy' 'Lead Foot GRFx' 'Lead Foot GRFy' 'Lead Foot GRFz' 'Lead Foot COPx' 'Lead Foot COPy'}; filename = [subjectid '-graphs-' pitch_type '.xlsx']; fullfilename = fullpath(filename); xlsheets(sheetnames, fullfilename); %Prompt for initial trial number prompt2 = {'Please enter trial number (9999 to exit)'}; dg_title = 'tn'; num_lines = 1; default = {'9999'}; trial_nmbr = inputdlg(prompt2,dg_title,num_lines,default); trial_num = str2double(trial_nmbr{1,1}); %Initialize column counter and column header
228 214 column_count = 2; column_names = cell(1, 19); while trial_num~=9999 %Read in trial data trial_number = num2str(trial_num); combinedfile = [subjectid '-' trial_number '-combined.xlsx']; [num text raw] = xlsread(combinedfile); BallContactIndex = find(num(:,2) == ); StartIndex = 65-BallContactIndex; sizenm = size(num); sizenum = sizenm(1,1); EndIndex = StartIndex+sizenum-4; for i=1:47 count=4; for TimeIndex=StartIndex:EndIndex DataArray(TimeIndex,column_count,i) = num(count,i+2); count = count+1; end; end; column_id = ['Trial ' trial_number]; column_names(1, column_count) = {column_id}; column_count = column_count+1; prompter = {'Please enter trial number (9999 to exit)'}; trial_nmbr = inputdlg(prompter,dg_title,num_lines,default); trial_num = str2double(trial_nmbr{1,1}); end; for j=1:47 for n=1:91 nom=; denom=; for p=2:column_count-1 if isfinite(dataarray(n,p,j)) nom = nom+dataarray(n,p,j); denom = denom+1; end; end;
229 215 DataArray(n,18,j) = nom / denom; DataArray(n,17,j) = DataArray(n,18,j) - std(dataarray(n,2:column_count-1,j)); DataArray(n,19,j) = DataArray(n,18,j) + std(dataarray(n,2:column_count-1,j)); end; end; column_names(1,17) = {'-1 SD'}; column_names(1,18) = {'MEAN'}; column_names(1,19) = {'+1 SD'}; %Create header for output file header = cell(3,19); header(1:2,1) = answers; header(3,1:19) = column_names; %Open ActiveX for speedy processing Excel = actxserver('excel.application'); %Open created output file ExcelWorkbook = Excel.workbooks.Open(fullfilename); for k=1:47 xlswrite27(fullfilename, header, k, 'A1:S3'); xlswrite27(fullfilename, DataArray(:,:,k),k,'A4:S94') end; %Save and close output file ExcelWorkbook.Save ExcelWorkbook.Close(false) Excel.Quit; delete(excel); %Move file to appropriate destination newfilelocation = ['C:\Batting calculations\export data\' pitch_type]; copyfile(fullfilename, newfilelocation); disp('done');
230 216 %graph_compiler.m %Compiles data for all subjects for a given pitch type & result clear; clc %Prompt user for pitch type / location prompt1 = {'Enter Pitch Type / Location'}; answ = inputdlg(prompt1); answer = cell2mat(answ); %Create file for data storage sheetnames = {'Head Angle X' 'Head Angle Y' 'Head Angle Z' 'Head Pos X' 'Head Pos Y' 'Head Pos Z' 'Pelvis Tilt' 'Pelvis Obliq' 'Pelvis Rot' 'Pelvis Pos X' 'Pelvis Pos Y' 'Pelvis Pos Z' 'UT Flexion' 'UT Lat Flexion' 'UT Rot' 'Pelvis Rot Vel' 'UT Rot Vel' 'Lead Shldr Elev' 'Lead Shldr Azim' 'Lead Shldr Azim Vel' 'Trail Shldr Elev' 'Trail Shldr Azim' 'Lead Elbow' 'Trail Elbow' 'Lead Elbow Vel' 'Trail Elbow Vel' 'Lead Knee' 'Trail Knee' 'Lead Knee Vel' 'Stride Length' 'Stride Direction' 'Lead Foot Angle' 'Bat Length' 'Bat Lag' 'Bat Elevation' 'Bat Azimuth' 'Bat Azimuth Vel' 'Trail Foot GRFx' 'Trail Foot GRFy' 'Trail Foot GRFz' 'Trail Foot COPx' 'Trail Foot COPy' 'Lead Foot GRFx' 'Lead Foot GRFy' 'Lead Foot GRFz' 'Lead Foot COPx' 'Lead Foot COPy'}; filename = ['All Subjects - ' answer '.xlsx']; fullfilename = fullpath(filename); xlsheets(sheetnames, fullfilename); %Create cell array for column headers column_head = cell(1,4); column_head(1,1) = {'Time'}; column_head(1,2:34) = {'ck2626', 'ec2629', 'kk2631', 'my2632', 'jc2633', 'pb2634', 'jc2635', 'kk2636', 'sc2644', 'js2645', 'mh2647', 'pc2648', 'cr2649', 'rs265', 'ef2651', 'mf2656', 'cc2657', 'jh2658', 'da2659', 'dd2662', 'jm2663', 'rc2664', 'rc2665', 'lc267', 'hc2671', 'jg2672', 'jd2673', 'lp2789', 'bl2791', 'jw2795', 'md282', 'ar283', 'dl285'}; %Pre-allocate large array of NaNs GroupArray = NaN(91,4,47); %Add time columns for all variables GroupArray(1,1,:) = -2; counter = 1/3; for n=2:91 GroupArray(n,1,:) = GroupArray(n-1,1,:)+counter; end;
231 217 indivindex=1; subject_col=1; count=; for subject_col=2:34 the_subject=cell2mat(column_head(1,subject_col)); indivfile = [the_subject '-graphs-' answer '.xlsx']; realfile = fullpath(indivfile); if exist(realfile,'file') count = count+1; %Read in data from each sheet/variable using ActiveX Excel = actxserver('excel.application'); Excel.Workbooks.Open(realfile); for i=1:47 [num, text, ~] = xlsread1(realfile,i,'a4:s94'); for j=1:91 %Add subject's average data into his column in the array GroupArray(j,subject_col,i) = num(j,18); end; end; Excel.Quit Excel.delete clear Excel disp(the_subject); end; end; %Open ActiveX for speedy processing Excel = actxserver('excel.application'); %Open created output file ExcelWorkbook = Excel.workbooks.Open(fullfilename); for k=1:47 xlswrite27(fullfilename, column_head, k, 'A1:AN1'); xlswrite27(fullfilename, GroupArray(:,:,k), k, 'A2'); end; %Save and close output file ExcelWorkbook.Save
232 218 ExcelWorkbook.Close(false) Excel.Quit; delete(excel); disp(count); disp('done');
233 APPENDIX E: Graphs of biomechanical data for the typical professional batter 219

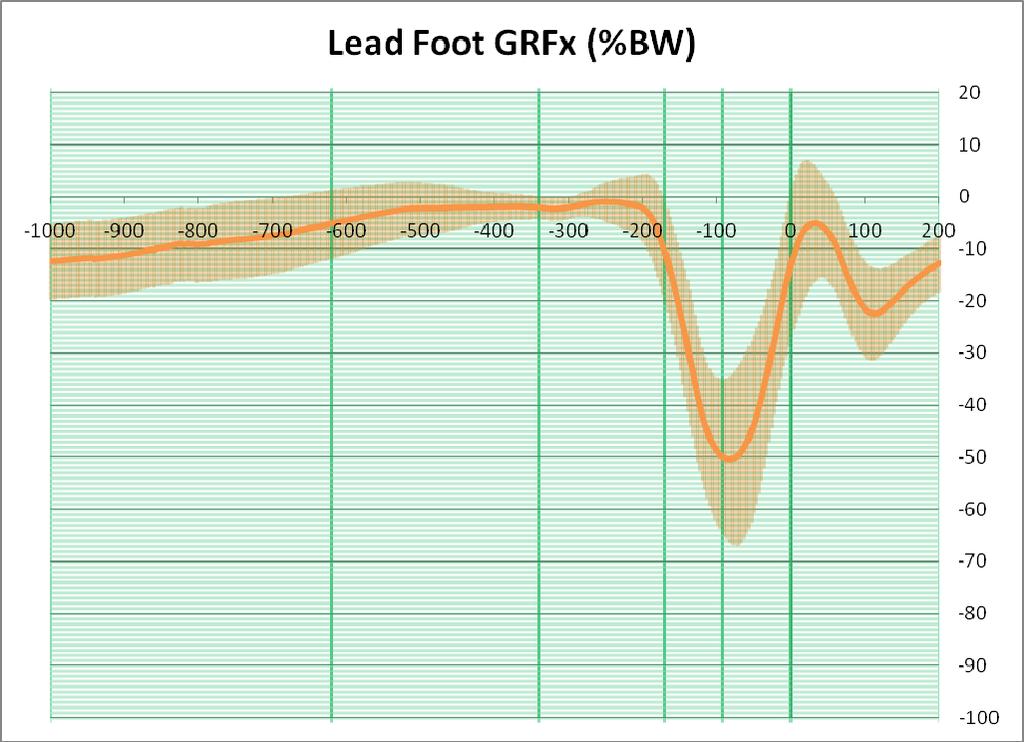
234 22

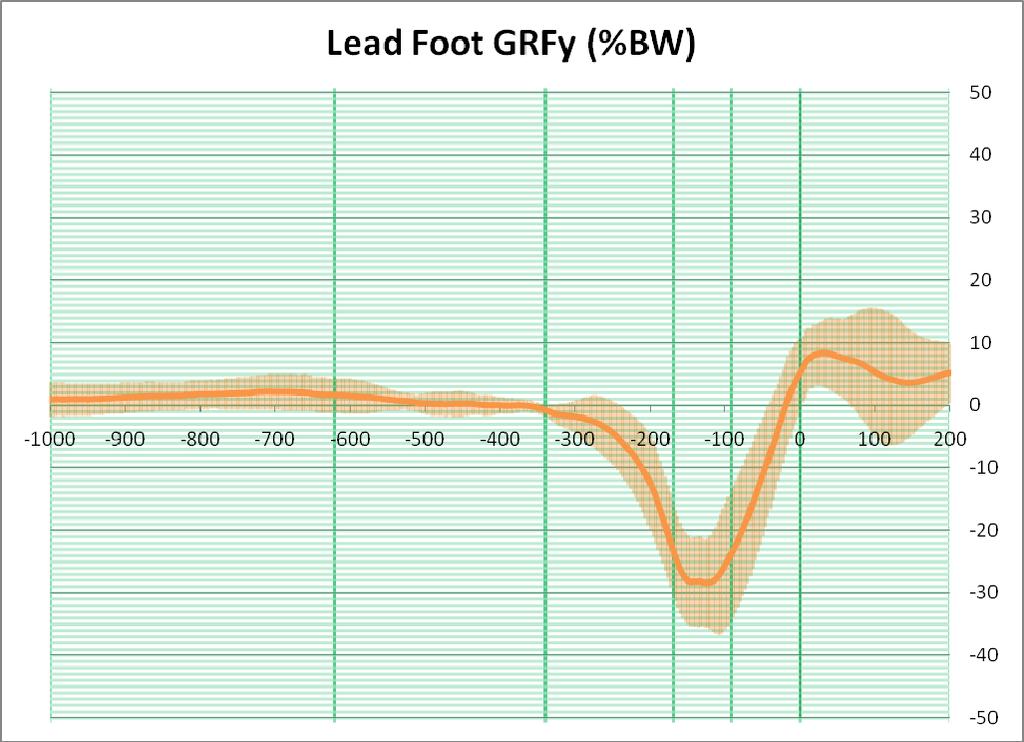
235 221

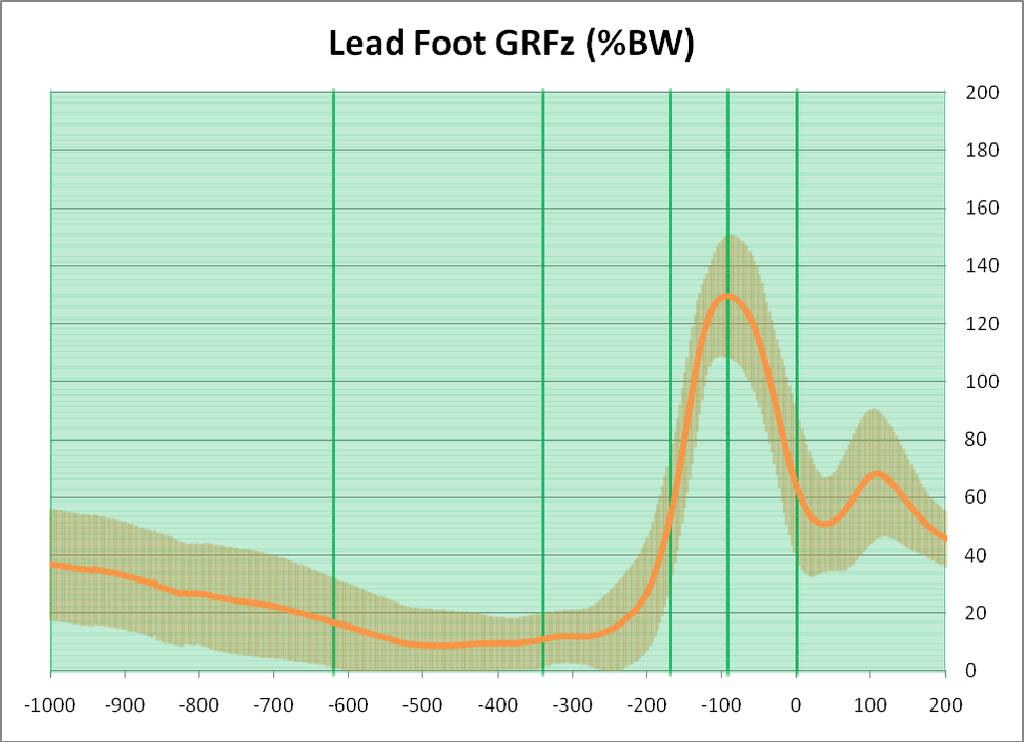
236 222

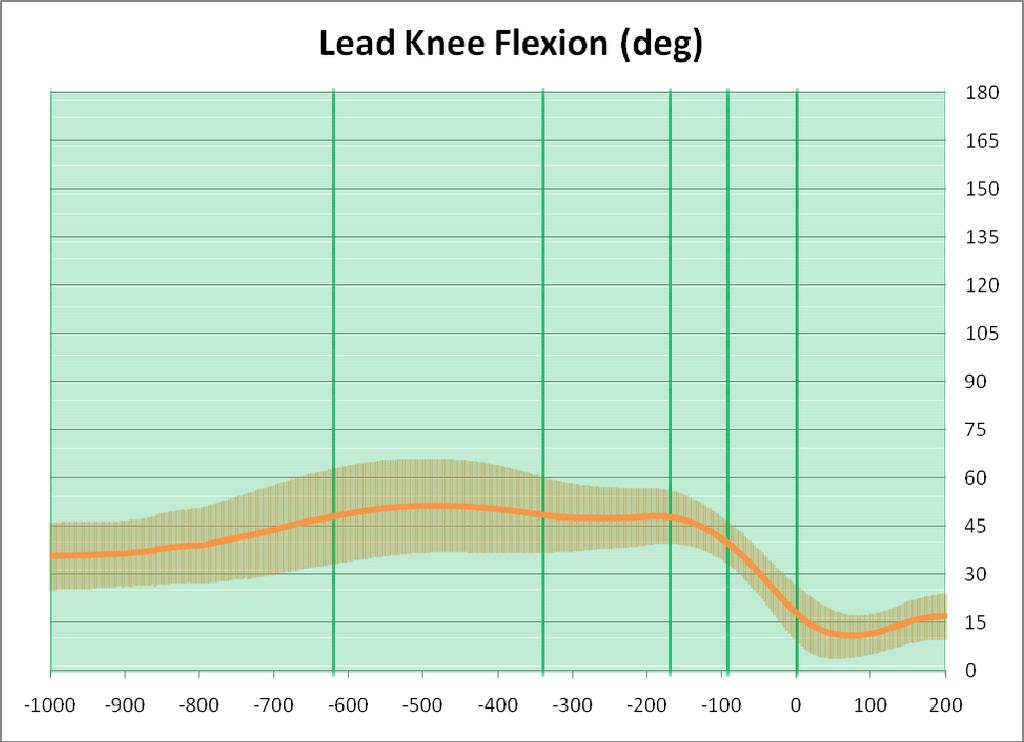
237 223

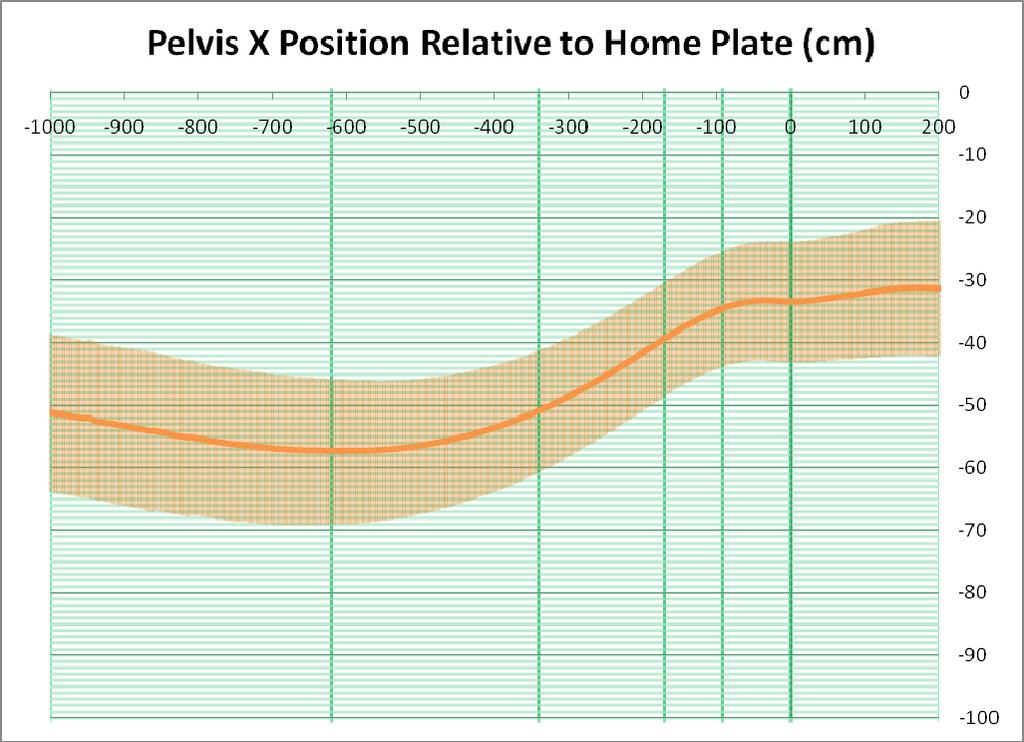
238 224

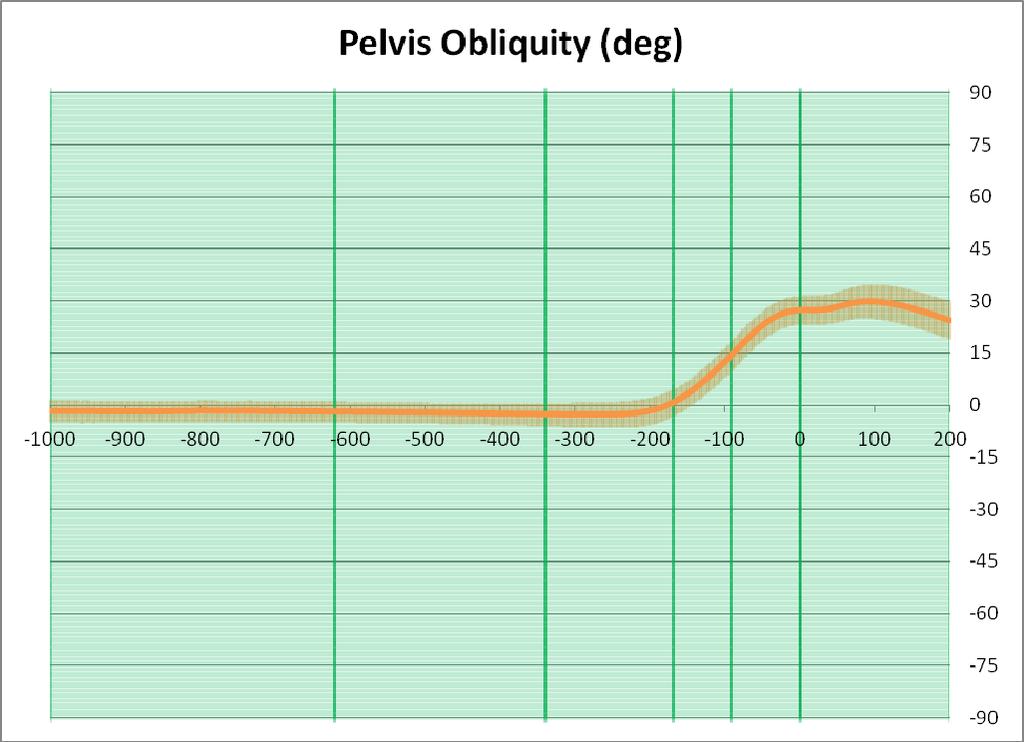
239 225

240 226

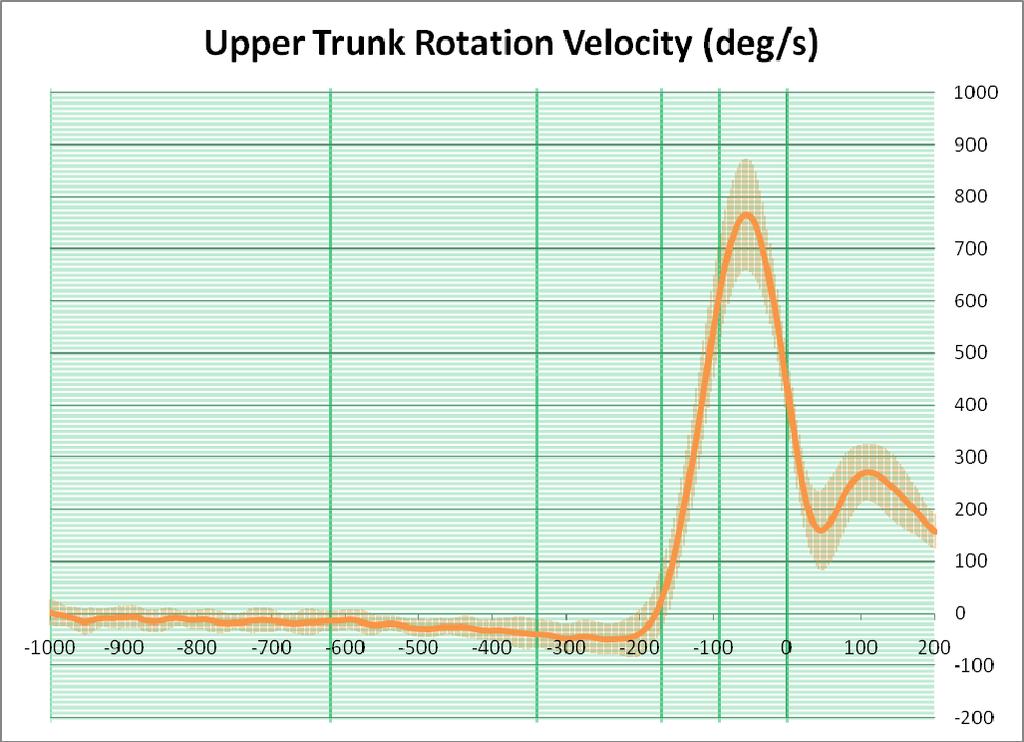
241 227

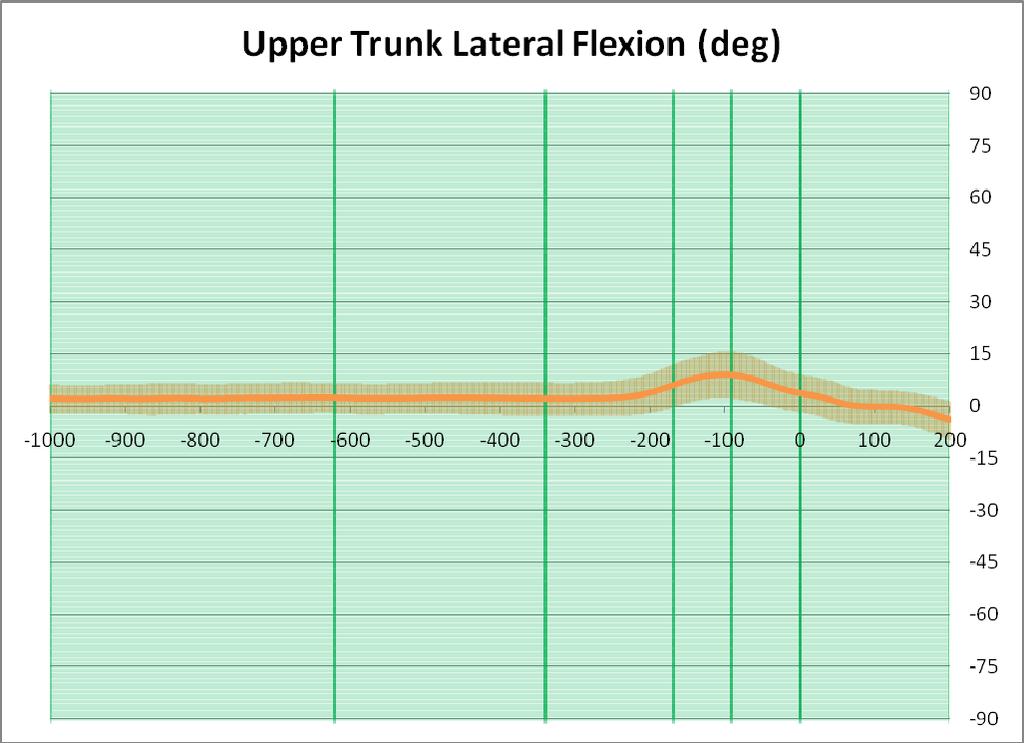
242 228

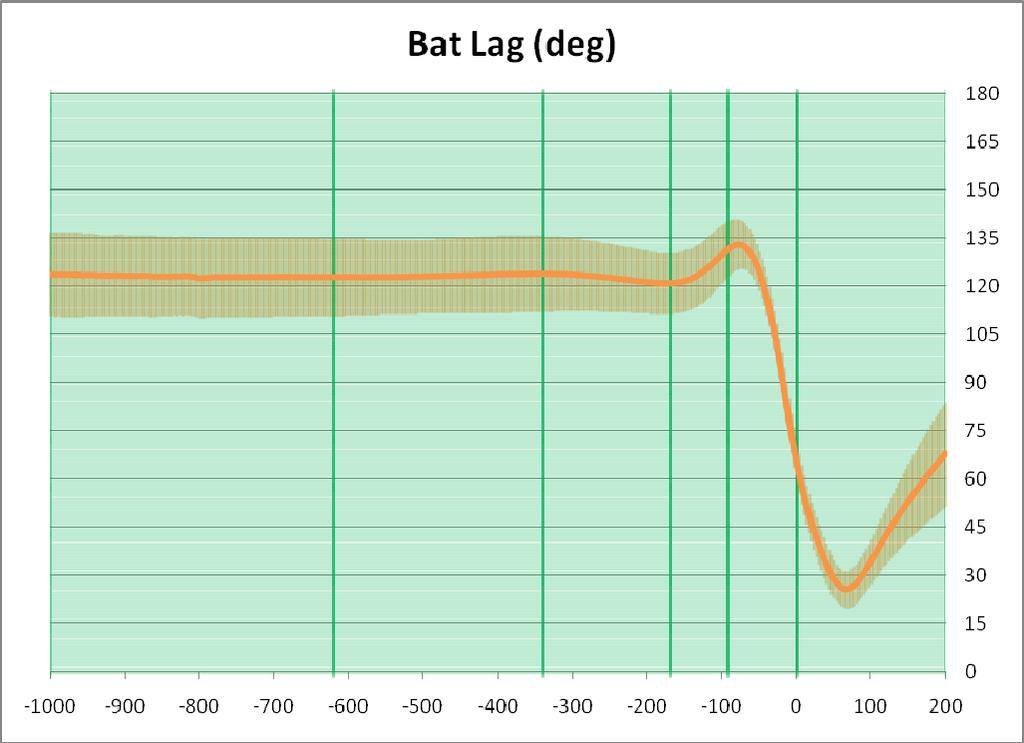
243 229

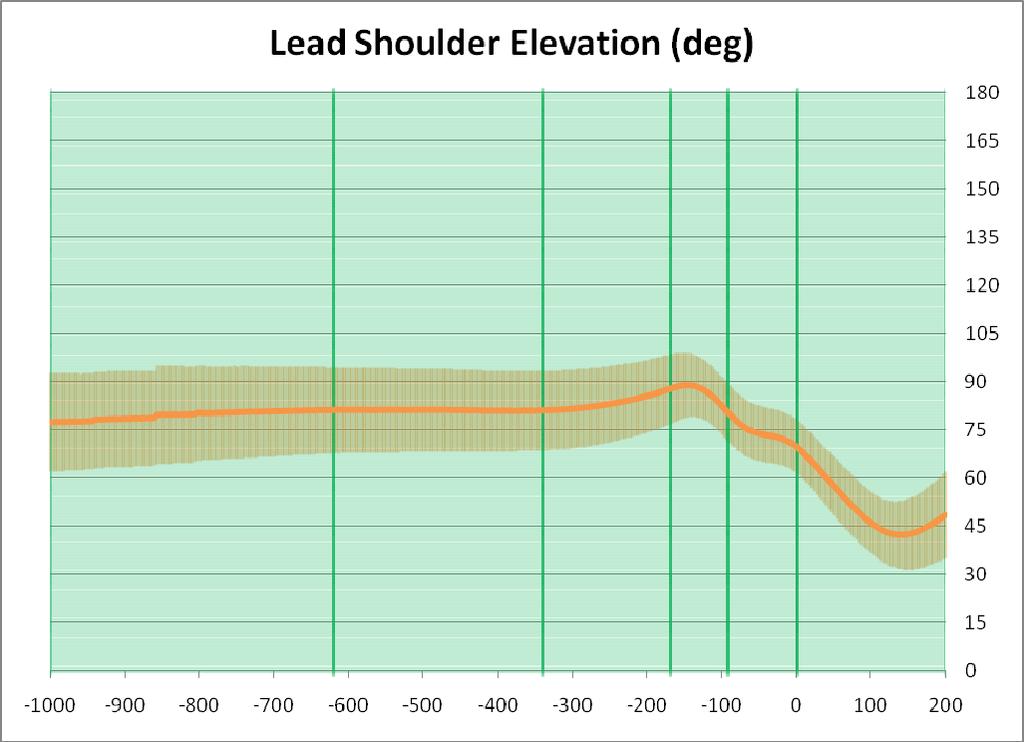
244 23
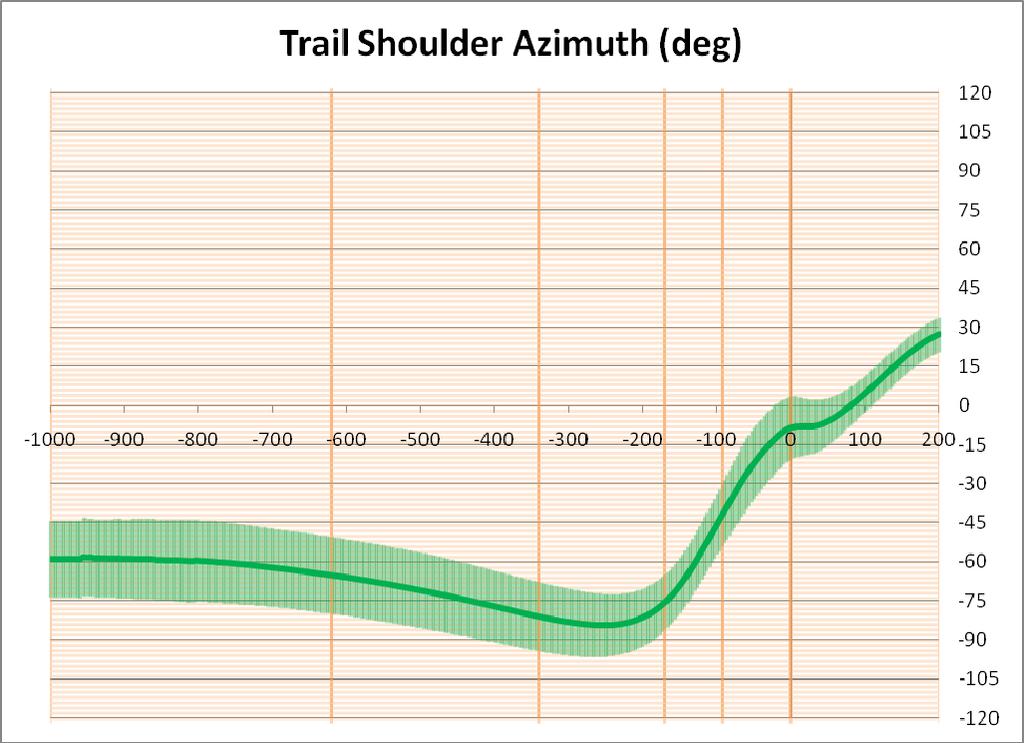
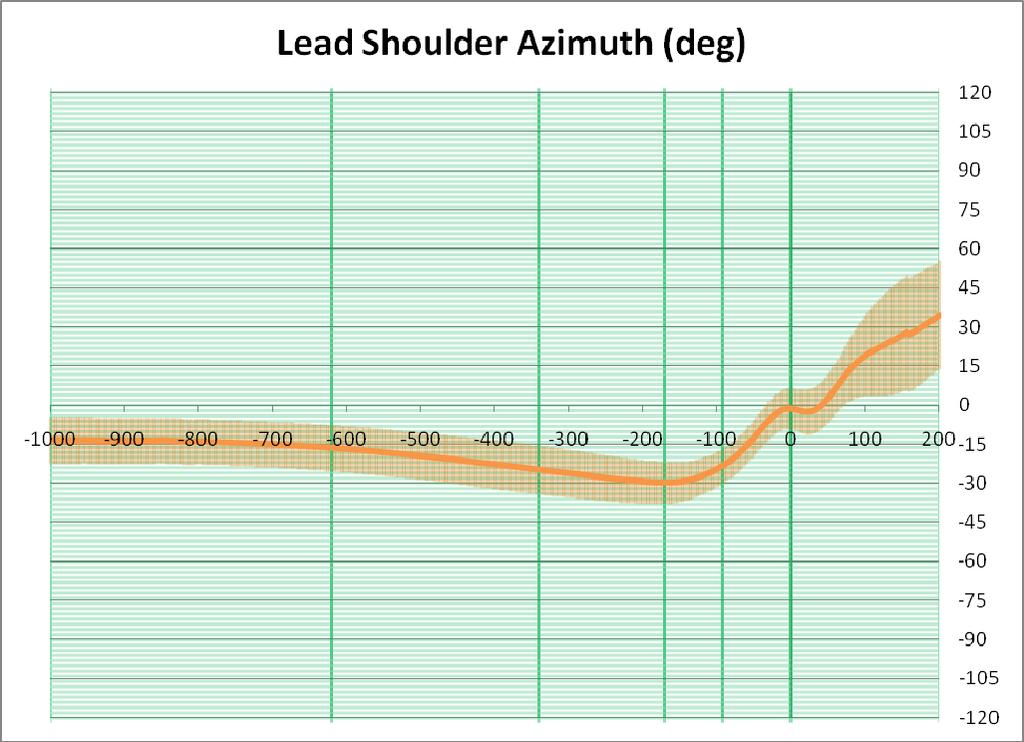
245 231
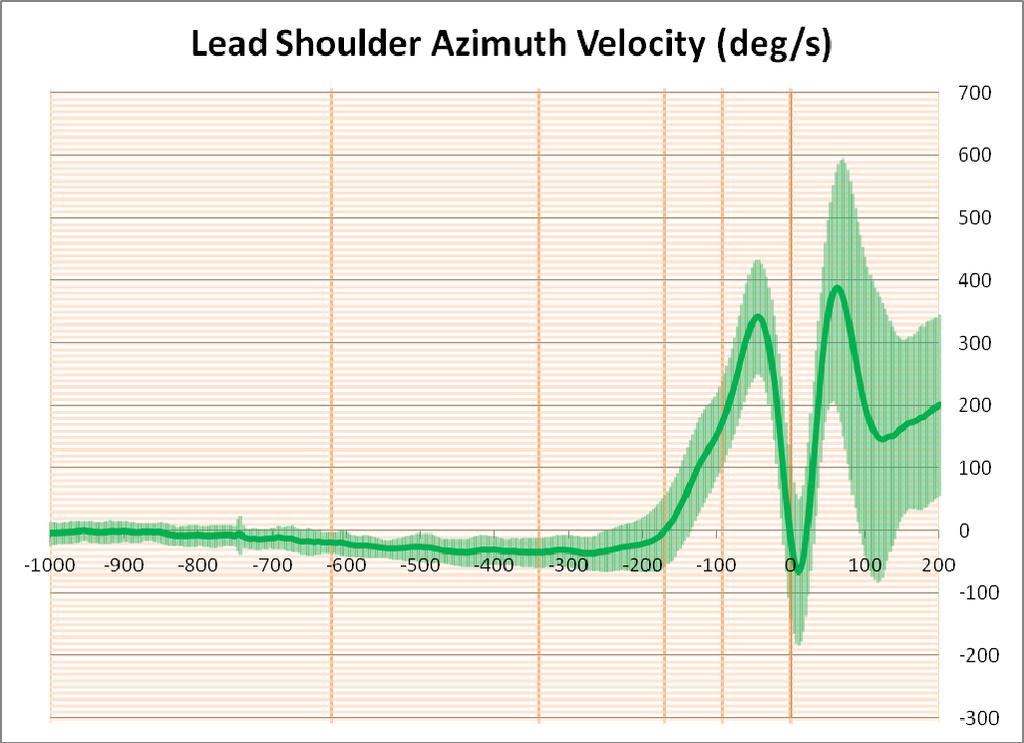
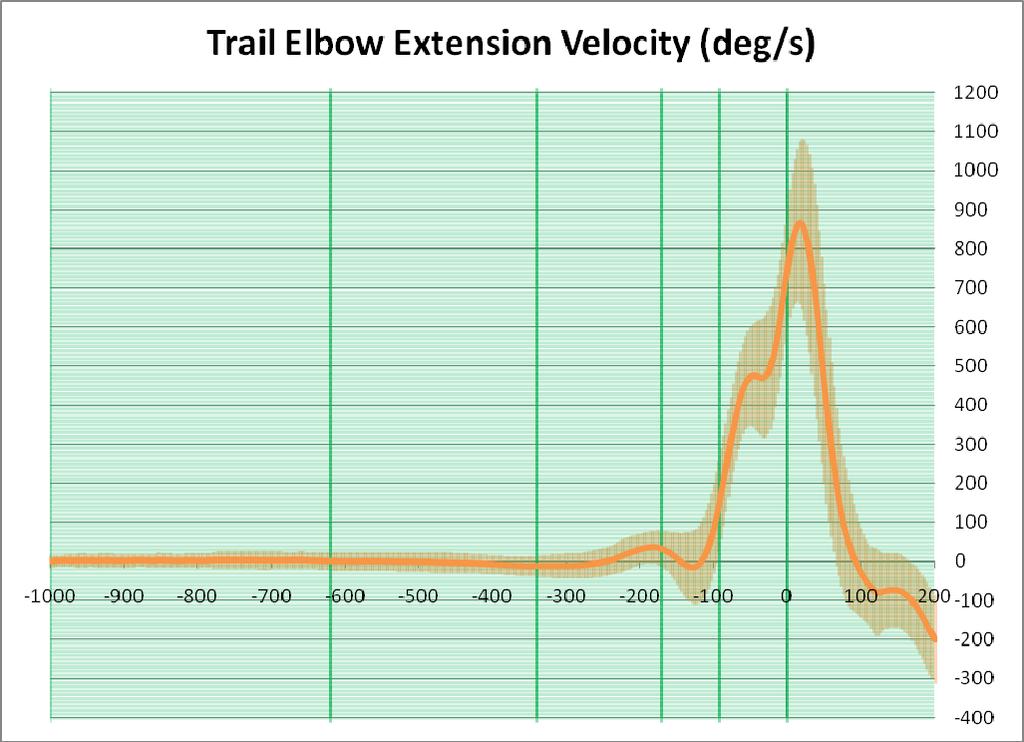
246 232

247 233

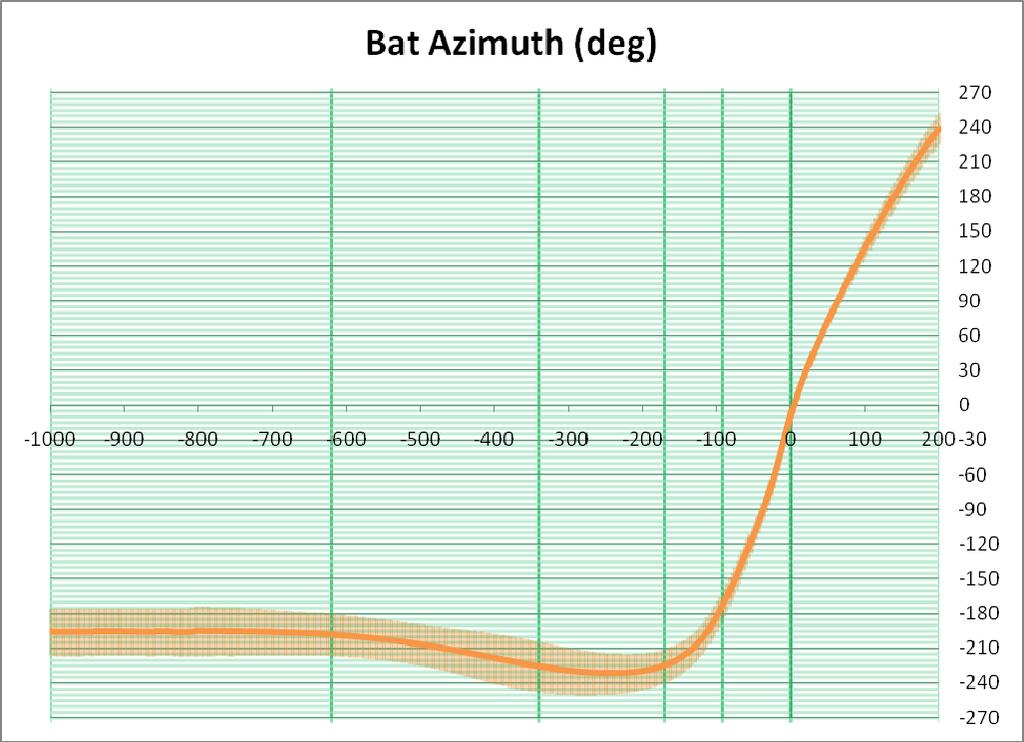
248 234

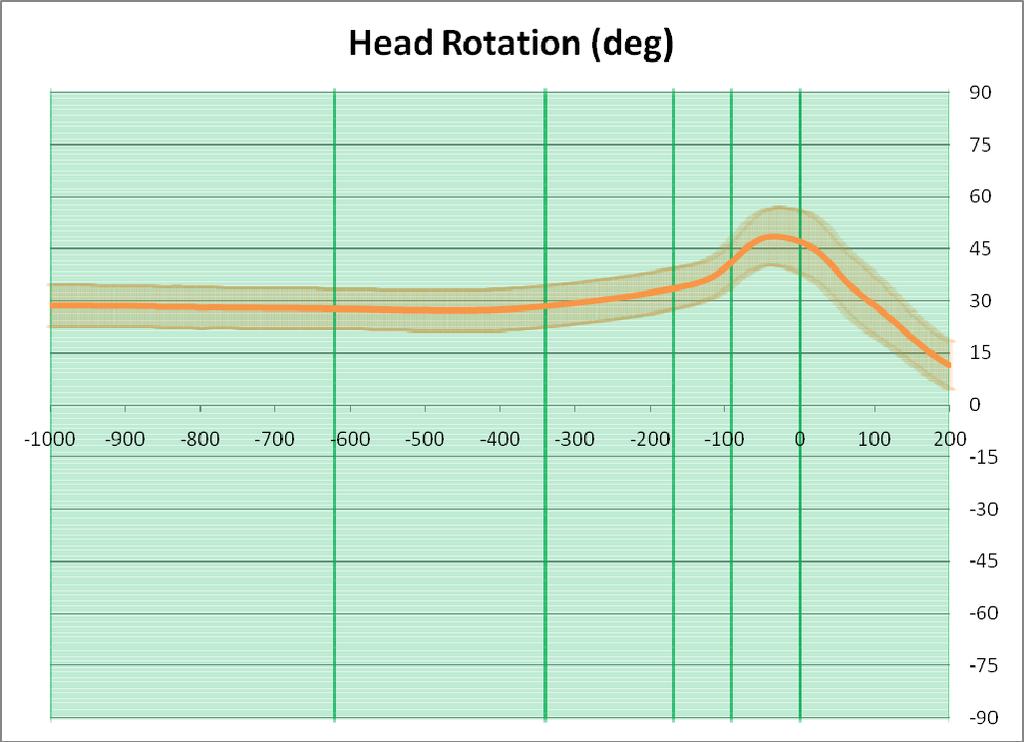
249 235
PROPER PITCHING MECHANICS
 PROPER PITCHING MECHANICS While each pitcher is a different person and can display some individuality in his mechanics, everyone has similar anatomy (the same muscles, bones and ligaments in the same locations)
by Michael Young Human Performance Consulting
 by Michael Young Human Performance Consulting The high performance division of USATF commissioned research to determine what variables were most critical to success in the shot put The objective of the
A QUALITATIVE ANALYSIS OF THE HIGH RACQUET POSITION BACKHAND DRIVE OF AN ELITE RACQUETBALL PLAYER
 A QUALITATIVE ANALYSIS OF THE HIGH RACQUET POSITION BACKHAND DRIVE OF AN ELITE RACQUETBALL PLAYER John R. Stevenson Wayne P. Hollander Since 1950, when Joe Sobek put strings on his paddleball paddle, the
A Comparison of Age Level on Baseball Hitting Kinematics
 Journal of Applied Biomechanics, 2009, 25, 210-218 2009 Human Kinetics, Inc. A Comparison of Age Level on Baseball Hitting Kinematics Rafael F. Escamilla, 1,2 Glenn S. Fleisig, 3 Coop DeRenne, 4 Marcus
ABCA Research Committee
 ABCA Research Committee Title: What the Best in Baseball Do A longitudinal / cross-sectional biomechanical study of the best hitters and pitchers in the game of baseball. Purpose: The purpose of this study
The Effects Of Various Warm-Up Devices on Bat Velocity and Trajectory in Collegiate Baseball Players
 Seton Hall University erepository @ Seton Hall Seton Hall University Dissertations and Theses (ETDs) Seton Hall University Dissertations and Theses Spring 5-12-2016 The Effects Of Various Warm-Up Devices
+ t1 t2 moment-time curves
 Part 6 - Angular Kinematics / Angular Impulse 1. While jumping over a hurdle, an athlete s hip angle was measured to be 2.41 radians. Within 0.15 seconds, the hurdler s hip angle changed to be 3.29 radians.
The effect of pitch type on ground reaction forces in the baseball swing
 Sports Biomechanics November 2011; 10(4): 270 279 The effect of pitch type on ground reaction forces in the baseball swing DAVE FORTENBAUGH 1,2,GLENN FLEISIG 1,ARZU ONAR-THOMAS 3,& SHIHAB ASFOUR 2 1 American
ITF Coaches Education Programme Biomechanics of the forehand stroke
 ITF Coaches Education Programme Biomechanics of the forehand stroke Original article: Bahamonde, R. (2001). ITF CSSR, 24, 6-8 Introduction The tennis forehand stroke has changed drastically over the last
Main Points Feet Balance Power Position (Power T Position)- Rotation Follow-through
- Rotation Follow-through") Pitching Main Points 1. Feet-take a small step back with non-throwing side foot, keeping the weight over the stationary foot, which is turned parallel and touching the rubber 2. Balance Position-non-throwing
Pitching Main Points 1. Feet-take a small step back with non-throwing side foot, keeping the weight over the stationary foot, which is turned parallel and touching the rubber 2. Balance Position-non-throwing
Moorhead Baseball Routines/Hitting Drills
 Moorhead Baseball Routines/Hitting Drills Philosophy How we train: Teach everyday with the goal of our players becoming their own coach. Get them to feel what s going on. Consistent mix of instruction
Breaking Down the Approach
 Breaking Down the Approach Written by Andre Christopher Gonzalez Sunday, July 31, 2005 One of the biggest weaknesses of the two-legged approach is the inability of the athlete to transfer horizontal momentum
Structure (Down plane)
") By Lauren Russell Structure (Down plane) The body (toes, knees, hips, wrists and shoulders) is aligned parallel to the intended target line. The torso is tilted over the ball from the hips whilst maintaining
By Lauren Russell Structure (Down plane) The body (toes, knees, hips, wrists and shoulders) is aligned parallel to the intended target line. The torso is tilted over the ball from the hips whilst maintaining
Baseball Hitting Principles Version 2
 Baseball Hitting Principles Version 2 Scott Kluemper 2/17/2013 Scott Kluemper 1 Table of Contents Page Swing Phases 3 Stance 4 Negative Move 10 Positive Move 12 Toe Touch 15 Heel Plant 17 Posture Lines
Putting Report Details: Key and Diagrams: This section provides a visual diagram of the. information is saved in the client s database
 Quintic Putting Report Information Guide Putting Report Details: Enter personal details of the client or individual who is being analysed; name, email address, date, mass, height and handicap. This information
A Biomechanical Approach to Javelin. Blake Vajgrt. Concordia University. December 5 th, 2012
 A Biomechanical Approach to Javelin Blake Vajgrt Concordia University December 5 th, 2012 The Biomechanical Approach to Javelin 2 The Biomechanical Approach to Javelin Javelin is one of the four throwing
Common Hitting Faults
 Common Hitting Faults In teaching hitting mechanics to youth, coaches will find that there are several hitting faults that are very common in youth baseball. Good coaches can quickly recognize a specific
Performance & Motor Control Characteristics of Functional Skill. Part III: Throwing, Catching & Hitting
 Performance & Motor Control Characteristics of Functional Skill Part III: Throwing, Catching & Hitting Throwing Interesting Facts Studies indicate that boys move across the stages at a faster rate than
ITF Coaches Education Programme Coaching High Performance Players Course Power and the Tennis Serve.
 ITF Coaches Education Programme Coaching High Performance Players Course Power and the Tennis Serve. By Machar Reid & Miguel Crespo A Powerful Serve A Key Ingredient of Successful Tennis Performance Preparation
Ground Forces Impact on Release of Rotational Shot Put Technique
 Brigham Young University BYU ScholarsArchive All Theses and Dissertations 2014-12-01 Ground Forces Impact on Release of Rotational Shot Put Technique Niklas B. Arrhenius Brigham Young University - Provo
Softball Pitching Mechanics
 Softball Pitching Mechanics When teaching softball pitching mechanics, the best way to avoid injury, develop consistency, and see results is through repetition and attention to detail. Even a slight change
Purpose: This drill is designed to teach the players to catch with both hands and build confidence.
 Drills Fielding Drill Drill: Soft Hands Drill Age Group: 4 8+ year olds Purpose: This drill is designed to teach the kids the proper way to catch the ball with two hands and builds confidence. Equipment:
Qualitative Analysis of Jumping Standing Long Jump Goals Note: Standing Long Jump
 Qualitative Analysis of Jumping Standing Long Jump *Any time a person or object is launched into the air Ex- jumping, diving, gymnastics, throwing, or striking Goals: 1. Distance Ex: standing long jump,
Ultimate Hitting Drills
 If You Enjoy This Report, Please Check Out Ultimate Hitting Drills Discover 56 Game-Te Tested Hitting Drills For A Faster, Smoother, And More Powerful Swing! Get Instant Access To The Complete Report Today,
Landing Hip Turn Glove Side. non teach. Soft test the ice. button Acceleration occurs around front leg Paul Nyman. determines There are no
 When I was asked to contribute to this series I initially declined. What could I possibly add to these distinguished pitching instructors? I re-thought that position when I remembered that my perspective
THE INITIAL STAGE THE FINAL STAGE
 THE JAVELIN RUN-UP By Hans Torim A detailed description of the author s views on the javelin run-up from the initial stages to the impulse stride and the pre-delivery position. The article is a slightly
Sitting. Volleyball. Skills and Systems
 Sitting Volleyball Skills and Systems Sitting Volleyball Skills Ready Positions There are two ready positions commonly used in sitting volleyball depending on the situation presented. Reception ready position
MULTI-SWING METHOD BY CLINTON BALGERA
 MULTI-SWING METHOD BY CLINTON BALGERA THREE-DIMENSIONAL POWER HITTING PAGE MENU Intro Hitting methods The big three contact zones Top and bottom hand power Hitting a dominant fastball Compact swing mechanics
Serve the only stroke in which the player has full control over its outcome. Bahamonde (2000) The higher the velocity, the smaller the margin of
 The higher the velocity, the smaller the margin of") Lower Extremity Performance of Tennis Serve Reporter: Chin-Fu Hsu Adviser: Lin-Hwa Wang OUTLINE Introduction Kinetic Chain Serve Types Lower Extremity Movement Summary Future Work INTRODUCTION Serve the
Lower Extremity Performance of Tennis Serve Reporter: Chin-Fu Hsu Adviser: Lin-Hwa Wang OUTLINE Introduction Kinetic Chain Serve Types Lower Extremity Movement Summary Future Work INTRODUCTION Serve the
A COMPARISON OF SELECTED BIOMECHANICAL PARAMETERS OF FRONT ROW SPIKE BETWEEN SHORT SET AND HIGH SET BALL
 A COMPARISON OF SELECTED BIOMECHANICAL PARAMETERS OF FRONT ROW SPIKE BETWEEN SHORT SET AND HIGH SET BALL PAPAN MONDAL a AND SUDARSAN BHOWMICK b,* a Assistant Professor, Department of Physical Education,
Glencoe Youth Baseball Player Coach Developmental Series
 Glencoe Youth Baseball Player Coach Developmental Series Dynamic Warm-ups: (Tony Bastinelli) 10-15 minutes -Start with a light jog, maybe two / three gym laps, w/ gloves on. Single file, no passing and
QUICK TIPS THROWING & FIELDING
 PRACTICE ACTIVITIES The number one reason children decided to stop playing baseball is they get bored. The best approach to planning and organizing practices is to make sure players are always active rather
 Hi Coach! Thanks for checking out this free report. Inside, you're going to discover 20 "plug and play" tips that will dramatically improve any hitter's swing. For better quality at-bats, improved contact,
Stance Recap Blocking Positions To the Right:
 Stance Recap We must create the ability to block out of both the primary (no runners on base) and the secondary (runners on base) stances. We have to put ourselves in a position to be able to get our feet
MINOR B DRILLS. 6:15 approx - Once the kids have completed all the stations, put the equipment away and prepare for the game
 MINOR B DRILLS 5:30 - Coaches arrive and prep field and set up pitching machine (please ensure you use the game machine and not the practice machine) - Coaches set up the 6 drill stations - Recruit 6-10
INTERACTION OF STEP LENGTH AND STEP RATE DURING SPRINT RUNNING
 INTERACTION OF STEP LENGTH AND STEP RATE DURING SPRINT RUNNING Joseph P. Hunter 1, Robert N. Marshall 1,, and Peter J. McNair 3 1 Department of Sport and Exercise Science, The University of Auckland, Auckland,
COMPARISON STUDY BETWEEN THE EFFICIENY OF THE START TECHNIQUES IN THE ROMANIAN COMPETITIVE SWIMMING
 Bulletin of the Transilvania University of Braşov Series IX: Sciences of Human Kinetics Vol. 6 (55) No. 1 2013 COMPARISON STUDY BETWEEN THE EFFICIENY OF THE START TECHNIQUES IN THE ROMANIAN COMPETITIVE
Granite Falls Little League Coaching Manual
 Page 1 of 12 Coaching Basic Skills Granite Falls Little League Coaching Manual GFLL approach to Teaching Basic Skills by level of Play Granite Falls Little League Page 2 of 12 Coaching Basic Skills Coaching
Player Development. Pitching 1
 Pitching Player Development Pitching 1 Delivery Mechanics Checklist: 1. Feet slightly spread on throwing arm side of rubber 2. Body weight positioned over stride leg 3. Torso upright 4. Hips and shoulders
110m Hurdle Theory and Technique
 110m Hurdle Theory and Technique Ralph Lindeman Head Track Coach, U.S. Air Force Academy Men's Hurdle Development Chairman, USATF WANTED: Highly motivated sprinters to attempt one of track & field's most
Colin Jackson's Hurdle Clearance Technique
 Colin Jackson's Hurdle Clearance Technique By Milan Čoh, Biomechanical Laboratory, Faculty of Sport, University of Ljubljana, Slovenia INTRODUCTION Colin Jackson is, uncontestedly, one of the greatest
The Discus. By Al Fereshetian. Nature of the Event
 11 The Discus By Al Fereshetian Nature of the Event Because of the numerous diverse qualities necessary for success, the discus throw is one of the most complex events in all of track and field. Discus
Critical Factors in the Shot Put
 Critical Factors in the Shot Put Operational Terminology By Michael Young Louisiana State University Flight phase: The duration of time where the athlete is moving towards the front of the throwing circle
QUALITYGOLFSTATS, LLC. Golf s Modern Ball Flight Laws
 QUALITYGOLFSTATS, LLC Golf s Modern Ball Flight Laws Todd M. Kos 5/29/2017 /2017 This document reviews the current ball flight laws of golf and discusses an updated and modern version derived from new
T-Ball is a baseball game for young boys and girls. It is a way to have fun while learning how to play.
 Coaching youth baseball is an exciting and rewarding way to be involved with youth sports. It is not always easy though. A majority of the coaches at T-ball level are coaching for the first time and sometimes
An investigation of kinematic and kinetic variables for the description of prosthetic gait using the ENOCH system
 An investigation of kinematic and kinetic variables for the description of prosthetic gait using the ENOCH system K. OBERG and H. LANSHAMMAR* Amputee Training and Research Unit, University Hospital, Fack,
A Three-Dimensional Analysis of Overarm Throwing in Experienced Handball Players
 Journal of Applied Biomechanics, 2007; 23:12-19. 2007 Human Kinetics, Inc. A Three-Dimensional Analysis of Overarm Throwing in Experienced Handball Players Roland van den Tillaar and Gertjan Ettema Norwegian
WGAAA Baseball Skill/Coaching Manual
 WGAAA Baseball Skill/Coaching Manual All baseball players regardless of age should have a base knowledge and capability of proper baseball mechanics. If a team is mechanically sound, more often than not,
TEMPORAL ANALYSIS OF THE JAVELIN THROW
 TEMPORAL ANALYSIS OF THE JAVELIN THROW Derek M. Helenbergerl, Michael T. Sanders 2, and Lawrence D. Abraha~n',~ Biomedical Engineering, Intercollegiate Athletics for Men, Kinesiology & Health Education
Baseball Hitting Drills for Batting Tee Work
 Baseball Hitting Drills for Batting Tee Work In my experience, the difference between those players who make it in baseball and those who don t is consistency repeating your swing with drills is an important
THE BACKSPIN BACKHAND DRIVE IN TENNIS TO BALLS OF VARYING HEIGHT. B. Elliott and M. Christmass
 THE BACKSPIN BACKHAND DRIVE IN TENNIS TO BALLS OF VARYING HEIGHT B. Elliott and M. Christmass The Department of Human Movement The University of Western Australia Nedlands, Australia INTRODUCfION Modem
TEMPORAL STRUCTURE OF A LEFT HAND TOSS VS. A RIGHT-HAND TOSS OF THE VOLLEYBALL JUMP SERVE
 TEMPORAL STRUCTURE OF A LEFT HAND TOSS VS. A RIGHT-HAND TOSS OF THE VOLLEYBALL JUMP SERVE C.L. Tant Iowa State University, Arnes, IA USA K. J. Witte Ohio Northern University, Ada, OH USA The volleyball
MINOR B DRILLS :45 - Begin the drills - After Batting station, kids move in clockwise direction to next station
 MINOR B DRILLS 2016 5:30 - Coaches arrive and prep field and set up pitching machine (please ensure you use the game machine and not the practice machine) - Coaches set up the 6 drill stations getting
THE IMPULSE-STEP IN THE JAVELIN THROW
 THE IMPULSE-STEP IN THE JAVELIN THROW Terseus Liebenberg North-West University Potchefstroom South Africa The most important biomechanical principle ultimately determining throwing distance is the release
Biomechanical Analysis of a Sprint Start. Anna Reponen JD Welch
 Biomechanical Analysis of a Sprint Start Anna Reponen JD Welch Introduction Our presentation will cover the Key Elements of our project. They will be presented along with the methods, results and discussion
2-HOUR PRACTICE PLAN EXAMPLE
 2-HOUR PRACTICE PLAN EXAMPLE Notes: In the following example, 5 minutes are allotted for flex-time. Have a written practice plan for every practice. Get good at time management. Wear a watch. 5 minutes:
Kinematic Differences between Set- and Jump-Shot Motions in Basketball
 Proceedings Kinematic Differences between Set- and Jump-Shot Motions in Basketball Hiroki Okubo 1, * and Mont Hubbard 2 1 Department of Advanced Robotics, Chiba Institute of Technology, 2-17-1 Tsudanuma,
CHAPTER IV FINITE ELEMENT ANALYSIS OF THE KNEE JOINT WITHOUT A MEDICAL IMPLANT
 39 CHAPTER IV FINITE ELEMENT ANALYSIS OF THE KNEE JOINT WITHOUT A MEDICAL IMPLANT 4.1 Modeling in Biomechanics The human body, apart of all its other functions is a mechanical mechanism and a structure,
PHYSICAL EDUCATION PERFORMANCE ASSESSMENT SUPPORT MATERIAL CRICKET
 PHYSICAL EDUCATION PERFORMANCE ASSESSMENT SUPPORT MATERIAL CRICKET IMPORTANT INFORMATION School Curriculum and Standards Authority, 2017 This document apart from any third party copyright material contained
Steffen Willwacher, Katina Fischer, Gert Peter Brüggemann Institute of Biomechanics and Orthopaedics, German Sport University, Cologne, Germany
 P01-3 ID126 SURFACE STIFFNESS AFFECTS JOINT LOADING IN RUNNING Steffen Willwacher, Katina Fischer, Gert Peter Brüggemann Institute of Biomechanics and Orthopaedics, German Sport University, Cologne, Germany
Influence of Body Kinematics on Tennis Serve
 EUROPEAN ACADEMIC RESEARCH Vol. III, Issue 1/ April 2015 ISSN 2286-4822 www.euacademic.org Impact Factor: 3.4546 (UIF) DRJI Value: 5.9 (B+) Influence of Body Kinematics IKRAM HUSSAIN Professor Department
Juniors BB Curriculum. Baserunning Curriculum (Juniors Level)
") Juniors BB Curriculum 1. Baserunning 2. Catcher 3. Batting 4. Infield 5. Outfield 6. Pitcher Objectives: Baserunning Curriculum (Juniors Level) Learn to take extra bases on a batted ball or an error Focus
Juniors BB Curriculum 1. Baserunning 2. Catcher 3. Batting 4. Infield 5. Outfield 6. Pitcher Objectives: Baserunning Curriculum (Juniors Level) Learn to take extra bases on a batted ball or an error Focus
GYROSTATIC DELIVERY TECHNIQUE By Macka Jensen
 GYROSTATIC DELIVERY TECHNIQUE By Macka Jensen Knowledge dispels fear 1. INTRODUCTION Gyrostatic technique: The application of these factors in the gyrostatic delivery technique is based on the principle
USA Track & Field Heptathlon Summit- November
 USA Track & Field Heptathlon Summit- November 1994 1 I. Technical considerations in the sprint hurdles Practical Biomechanics For the 100m Hurdles By Gary Winckler University of Illinois A. General flow
The Rochester Avon Recreation Authority appreciates your support and involvement and thank you for your time.
 COACHES HANDBOOK Table of Contents: Foreword... 1 T-Ball League Rules... 2 Coaches Introduction... 3 T-Ball Tips For Coaches... 4 Coaches Checklist... 6 T-Ball Skills Checklist... 8 Practice Tips... 12
Full swing technique is a pillar of a solid overall game. The following 4 core competencies are strong predictors of success in ball striking.
 Full Swing Analysis What are we trying to accomplish? Core Competencies in the Full Swing Full swing technique is a pillar of a solid overall game. The following 4 core competencies are strong predictors
Skill Development and Drills
 Skill Development and Drills Keith Van De Keere, NCCP Instructor vandekeere22@gmail.com Beginner Advanced Work with coach Work with player No Glove Glove Softer ball Baseball Short distance Full distance
GROUND REACTION FORCE DOMINANT VERSUS NON-DOMINANT SINGLE LEG STEP OFF
 GROUND REACTION FORCE DOMINANT VERSUS NON-DOMINANT SINGLE LEG STEP OFF Sara Gharabaghli, Rebecca Krogstad, Sara Lynch, Sofia Saavedra, and Tamara Wright California State University, San Marcos, San Marcos,
Anatomy of a Homer. Purpose. Required Equipment/Supplies. Optional Equipment/Supplies. Discussion
 Chapter 5: Projectile Motion Projectile Motion 17 Anatomy of a Homer Purpose To understand the principles of projectile motion by analyzing the physics of home runs Required Equipment/Supplies graph paper,
DIFFERENCE BETWEEN TAEKWONDO ROUNDHOUSE KICK EXECUTED BY THE FRONT AND BACK LEG - A BIOMECHANICAL STUDY
 268 Isas 2000! Hong Kong DIFFERENCE BETWEEN TAEKWONDO ROUNDHOUSE KICK EXECUTED BY THE FRONT AND BACK LEG - A BIOMECHANICAL STUDY Pui-Wah Kong, Tze-Chung Luk and Youlian Hong The Chinese University of Hong
Mutual and asynchronous anticipation and action in sports as globally competitive
 1 Supplementary Materials Mutual and asynchronous anticipation and action in sports as globally competitive and locally coordinative dynamics Keisuke Fujii, Tadao Isaka, Motoki Kouzaki and Yuji Yamamoto.
The Starting Point. Prosthetic Alignment in the Transtibial Amputee. Outline. COM Motion in the Coronal Plane
 Prosthetic Alignment in the Transtibial Amputee The Starting Point David C. Morgenroth, MD, Department of Rehabilitation Medicine University of Washington VAPSHCS Outline COM Motion in the Coronal Plane
The Kinematics of Forearm Passing in Low Skilled and High Skilled Volleyball Players
 The Kinematics of Forearm Passing in Low Skilled and High Skilled Volleyball Players M. E. Ridgway' and N. Hamilton 2 I) Physical Education Department. Univc"ily of Tcxa,-Arlington. Arlington. Tcxa, USA
Investigative Study: Movement Analysis
 Investigative Study: Movement Analysis SAMPLE M Background Research Biomechanics can simply be described as the physics of sports. Biomechanics is the study of human motion. (Miller, Biomechanical Analysis
Glencoe Youth Baseball Player Coach Developmental Series
 Glencoe Youth Baseball Player Coach Developmental Series Dynamic Warm-ups: (Tony Bastinelli) 10-15 minutes -Start with a light jog, maybe two / three gym laps, w/ gloves on. Single file, no passing and
Hitting and Bunting Drills
 Hitting and Bunting Drills Hitting from a Tee o Benefits - The Hitting from a Tee drill can be used to develop and reinforce the hitting fundamentals. This drill emphasizes that the player must keep her
Stance Starting point; need vision, balance, and plate coverage. Grip Loose grip in the fingers with the Door Knocking knuckles lined up to unlock
 Stance Starting point; need vision, balance, and plate coverage. Grip Loose grip in the fingers with the Door Knocking knuckles lined up to unlock the wrists and allow for greater bat speed. Weight Shift
BEGINNING PITCHING TIPS BRYC Softball Updated February 4, 2008
 BEGINNING PITCHING TIPS BRYC Softball Updated February 4, 2008 General 1. Work on sound mechanics before anything else. The earlier a player learns the mechanics, the quicker she will progress in learning
Caitlin Benyi First Base View
 An analysis of the swing of Caitlin Benyi First Base View Chris O Leary September 16, 2008 Version 1.1 How To Use This ebook The best way to use this ebook is to go through it frame by frame. You can advance
AYRA International League Minimum Skills
 AYRA International League Minimum Skills The International League should continue to work on all previous teachings and build upon these skills. This is a good age to start introducing more advanced skills,
Investigation of Bio-Kinematic Elements of Three Point Shoot in Basketball
 International Journal of Sports Science 2017, 7(4): 163-169 DOI: 10.5923/j.sports.20170704.02 Investigation of Bio-Kinematic Elements of Three Point Shoot in Basketball Ikram Hussain, Fuzail Ahmad *, Nidhi
I. General Coaching Tips
 I. General Coaching Tips 1. Be Enthusiastic 2. Build Confidence n Help kids believe in themselves n Instead of being critical or creating pressure 3. Enthusiasm and confidence building more important than
DIFFERENT TYPES ARM SWING USED IN INDIAN VOLLEYBALL AN EPIDEMIOLOGICAL ANALYSIS
 DIFFERENT TYPES ARM SWING USED IN INDIAN VOLLEYBALL AN EPIDEMIOLOGICAL ANALYSIS 1 Amritpal Singh Sidhu 1 Physical Education Teacher, Govt. Model Sen. Sec. School,Sheron (Sunam) Sangrur PB, India ABSTRACT
Week 2 Sunday, January 18 th. Topics to be Covered Tonight:
 Week 2 Sunday, January 18 th Topics to be Covered Tonight: Week One Review: Room for Improvement Instructors, Coaches, Players Re-emphasize Practice Concepts, Arrival Times Absolutes of Little League Swing
Biomechanics of Parkour: The Vertical Wall-Run Technique
 University of Colorado, Boulder CU Scholar Undergraduate Honors Theses Honors Program Spring 2015 Biomechanics of Parkour: The Vertical Wall-Run Technique Integrative Physiology, Peter.Lawson@Colorado.EDU
Development of an end-effector to simulate the foot to ball interaction of an instep kick in soccer
 Available online at www.sciencedirect.com Procedia Engineering 34 (2012 ) 284 289 9 th Conference of the International Sports Engineering Association (ISEA) Development of an end-effector to simulate the
2nd EDITION DESIGNED FOR BASEBALL COACHES, SCOUTS & PLAYERS
 2nd EDITION DESIGNED FOR BASEBALL COACHES, SCOUTS & PLAYERS by About the ReactionPro Report 2 nd Edition The ReactionPro Report 2 nd Edition helps to explain the concepts and applications behind the training,
APPLICATION OF FILMING AND MOTION ANALYSIS IN MOVEMENT STUDIES. Xie Wei Sports Medicine and Research Center, Singapore Sports Council, Singapore
 APPLICATION OF FILMING AND MOTION ANALYSIS IN MOVEMENT STUDIES Xie Wei Sports Medicine and Research Center, Singapore Sports Council, Singapore The sports biomechanics branch of Singapore Sports Council
Biomechanics Sample Problems
 Biomechanics Sample Problems Forces 1) A 90 kg ice hockey player collides head on with an 80 kg ice hockey player. If the first person exerts a force of 450 N on the second player, how much force does
MULTI-PITCH BATTING TRAINER
 MULTI-PITCH BATTING TRAINER I N S T R U C T I O N S & P R A C T I C E D R I L L S www.sklz.com THROWS A PERFECT PITCH EVERY TIME! Zip-N-Hit Pro acts like a portable batting cage, allowing batters to improve
ShuttlE. Schools Badminton. Module 5: 10 starter lessons
 ShuttlE Time Schools Badminton Teachers MANUAL Module 5: 10 starter lessons ShuttlE Time Schools Badminton Teachers MANUAL 10 starter lessons Badminton World Federation 2011. First published November
LAWS, Principles, and Preferences.
 LAWS of the Game of GOLF By James E. Coach Robertson From his book The Encyclopedia of Successful GOLF Coaching LAWS, Principles, and Preferences. The Model Golf Swing You can end your search for the one
The drills and practice plans listed below are to be used in conjunction with any other drills you may have in your own coaching arsenal.
 INTRODUCTION It s likely that this is the first youth baseball experience for most players and coaches and all are excited for the new season. These skills and practiced plans are designed to introduce
Mechanical Analysis of Overhead Throwing in Cricket
 ISSN 1750-9823 (print) International Journal of Sports Science and Engineering Vol. 05 (2011) No. 03, pp. 163-168 Mechanical Analysis of Overhead Throwing in Cricket Ikram Hussain 1 and Mohd. Arshad Bari
T-Ball, Rookie, & Single A COACHES CLINIC Hitting Station
 T-Ball, Rookie, & Single A COACHES CLINIC Hitting Station Sunday, March 18, 2018 GTP-Founders Deven Majkowski Pitching Machines As much as we can show you how to use the machine, it will malfunction at
Twisting techniques used in freestyle aerial skiing
 Loughborough University Institutional Repository Twisting techniques used in freestyle aerial skiing This item was submitted to Loughborough University's Institutional Repository by the/an author. Citation:
SPRINTING CHARACTERISTICS OF WOMEN S 100 METER FINALS AT THE IAAF WORLD CHAMPIONSHOPS DAEGU 2011
 9:30-9:45 am Sang-Kyoon Park. Sprinting characteristics of women's 100 meter finals at the IAAF world championships Daegu 2011. (228) SPRINTING CHARACTERISTICS OF WOMEN S 100 METER FINALS AT THE IAAF WORLD
The Examination of Upper Limb Ambidexterity in Wrestling Snap Down Technique
 Bridgewater State University Virtual Commons - Bridgewater State University Movement Arts, Health Promotion and Leisure Studies Faculty Publications Movement Arts, Health Promotion and Leisure Studies