ISDS 4141 Sample Data Mining Work. Tool Used: SAS Enterprise Guide
|
|
|
- Kevin Kelley
- 5 years ago
- Views:
Transcription

1 ISDS 4141 Sample Data Mining Work Taylor C. Veillon Tool Used: SAS Enterprise Guide You may have seen the movie, Moneyball, about the Oakland A s baseball team and general manager, Billy Beane, who focused on an analytical, evidence-based, approach to assembling a competitive baseball team, despite Oakland's disadvantaged revenue situation. Suppose you have the following data from the 2008 MLB season and want to determine an appropriate model for predicting the Number of Wins (Y) based upon the number of Runs, Hits, Walks, Errors, and Saves. Save the data at the end of this document in an Excel spreadsheet name BB2008 and BB2009, respectively. (This assignment has 50 points which will be converted to 100 pts) BB2008 data is your training data and BB2009 is your validation data be sure to use the appropriate data for the specified questions below. Use what you have learned this semester to build the best model by answering questions 1 8: 1. Complete descriptive statistics, including means, standard deviations, minimum, maximum, and number of observations for all variables. Also include distributional analyses and comment on the normality of each variable. Indicate if there are any outliers when looking at the univariate variables. (Don t delete any outliers at this point they may not be influential in the regression analysis). (Please report to 1 decimal) (4 pts) Descriptive Statistics Wins (Y) Runs (X1) Hits (X2) Walks (X3) Errors (X4) Saves (X5) Mean Std Dev Min Max Sample Size Evidence of Non-normality Yes Yes Yes Yes Yes Yes Outliers - Yes Yes Yes Yes Yes (For non-normality and outliers, place a check in the box if your answer is Yes; otherwise leave blank)
 using all predictors. a. What is the estimated regression equation of your best (baseline) model? (2 pts) Yˆ = 64.53528 + 0.")
2 2. Which team had the most Wins? California Angels (100 wins) (1 pt) Which team had the least Wins? Washington (50 wins) (1 pt) 3. Run a baseline model using the 2008 data to predict Number of Wins (Y) using all predictors. a. What is the estimated regression equation of your best (baseline) model? (2 pts) Yˆ = (X1) (X2) (X3) (X4) (X5) b. VALIDATE your results using BB2009 data. Attach a spreadsheet (like the one I provided in class when I discussed validation RMSE) showing the actual Y, predicted Y, error, error-squared and validation RMSE. Your validation RMSE is (5 pts) RMSE = c. Which predictor seems most related to Number of Wins (Y)? (1 pt) Saves (Semi partial correlation = ), and I know the predictor is definitely significant because its p value is less than alpha indicating that there is a relationship between the amount of saves and the number of wins for a team. d. Which predictor seems least related to Number of Wins (Y)? (1 pt) Errors (Semi partial correlation = ). However, this predictor is still potentially significant because its p-value is less than alpha. 4. To go along with the regression analysis, review a scatter plot matrix for Number of Wins (Y) and each predictor (X) to ensure that the linearity
3 assumption is reasonable (you don t have to include that output with your homework). For any situation where the relationship between Number of Wins (Y) and a predictor is non-linear, transform the predictor, so that the proper form of the predictor is used. Try to find the best transformation (both X 2 and X, ln(x), log(x), exp(x), sqrt(x), or 1/X). (NOTE: Always transform variables where necessary before checking for outliers. Remember correcting the form of the relationship may fix potential problems with outliers). a. Which predictor(s) need(s) transforming? (2 pts) Saves, Runs, Hits Saves:
4 Runs: Adjusted r squared is Taylor C. Veillon
5 Hits: is adjusted r squared. Appears that equal variance may be an issue. b. For each variable(s) needing transforming, what transformation was BEST? (4 pt) Saves(X2, X), RunsInverse, HitsLN

6 Saves: Variable Transformation Type Adjusted R 2 Saves SavesInverse SavesLN SavesSqRt SavesX SavesEXP The two highest adjusted R 2 values are for Saves inverse and SavesX 2. Of those two transformations, SavesX 2 appears to improve the linearity of the data more which leads me to assume that SavesX 2 is the best transformation for this variable. The p value is less than alpha so predictor is significant. Adjusted r squared is SavesX2-
7 Errors: Variable Transformation Type Adjusted R 2 Errors ErrorsInverse ErrorsLN ErrorsSqRt ErrorsX Taylor C. Veillon I have decided to leave errors in its original form. The original distribution of the data looks the best visually even though its adjusted r squared is not the highest.
8 Runs: Variable Transformation Type Adjusted R 2 Runs RunsInverse RunsLN RunsSqRt RunsX Taylor C. Veillon For runs, the two transformations with the highest adjusted R 2 values are RunsLN and RunsInverse. Of those two transformation types, RunsInverse does a better job with the linearity/distribution of the data leading me to believe that RunsInverse would be the best choice of possible transformations for this predictor. Its p-value is less than alpha indicating that it is significant in predicting wins, and its adjusted R 2 is equal to RunsInverse-
9 Variable Transformation Type Adjusted R 2 Walks WalksLN Walks SqRt WalksInverse WalksX Of the transformation options for the variable walks, the two highest adjusted R 2 values are for Walks and WalksX 2. Although WalksX 2 has a higher adjusted R 2, its effect on the distribution and linearity of the graph is bad, so I chose to keep the walks predictor in its original format. The p value is also less than alpha indicating that the predictor is significant. Walks-
10 Variable Transformation Type Adjusted R 2 Hits HitsLN HitsSqRt HitsInverse HitsX The adjusted R 2 values for the transformation types are incredibly similar for this predictor. However, the transformation with the best effect on the distribution and linearity of this predictor is HitsLN. It s p value is also less than alpha indicating it is significant.
11 HitsLN- Taylor C. Veillon
12 5. Run an analysis using 2008 data ONLY (as training data) to determine if there are any influential observations. Do this analysis using all of the predictors (taking into account any transformations you made in 4b above). a. What are the cutoffs for the following values for determining which observations are influential: leverage (h ii ) (1 pt) rstudent (t i ) _-2 or +2_(1 pt) DFFITS i or (1 pt) Cook s D i (1 pt) b. Based upon your cutoffs, If any, which observations have high leverage? None (1 pt) Why? No observations have an x value greater than the cutoff of (1 pt)
13 If any, which observations are discrepant (outliers)? (1 pt) Observation 14 (rstudent = ) Why? (1 pt) Observation 14 has an rstudent score beyond the cutoff of If any, which observations are influential? (1 pt) No observations are influential based on leverage and discrepancy alone. However, observation 14 does appear to have influence as well as observation 3 (once observation 14 is deleted). Why? (1 pt) Observation 14 has a DFFITS score of which is far beyond the cutoff of The Cooks D value is which is beyond the cutoff. Observation 14 also affects the slopes of all of the predictors slopes in my current prediction equation (runsinverse, HitsLN, Walks, Errors, Saves, SavesX2 and even the intercept). It appears to be affecting SavesX2 the most. Observation 20 was also a suspect for potential influence. It does have a DFFITS score of which is only slightly beyond the cutoff and is technically influencing the slope of LN(Hits). Cooks D for 20 is However, compared to observation 14, it does not appear to be influencing the prediction greatly; its leverage is also very low.
14 c. Assess the situation to see if you are justified in eliminating influential observations. Will you eliminate any influential observations? Yes or No (1 pt) Yes. Observation 14 and Observation 3. Why or why not? (1 pt) After eliminating observation 14, the adjusted r squared increased from.9094 to.9226.
15 Also using DFBETAS, the deletion statistic, the following calculations were made: DFBETAS cutoff is -0.4 to +0.4 Observation 14: DFBETASintercept = DFBETASRunsInverse = DFBETASHitsLN = DFBETASWalks = DFBETASErrors= DFBETASSaves= DFBETASSavesX2= Each of these values is beyond the cutoff zone further justifying my reasoning for deleting observation 14. Justification for observation 3 s deletion: (The influence of observation 3 became apparent after observation 14 was deleted.)

16 With outliers: Taylor C. Veillon

17 Without outliers: Taylor C. Veillon 6. At this point, you have decided whether or not to transformed your data and whether or not to delete influential observations. With those decisions made, conduct an all-possible-subset analysis and determine the best model (use 2008 data as TRAINING data)
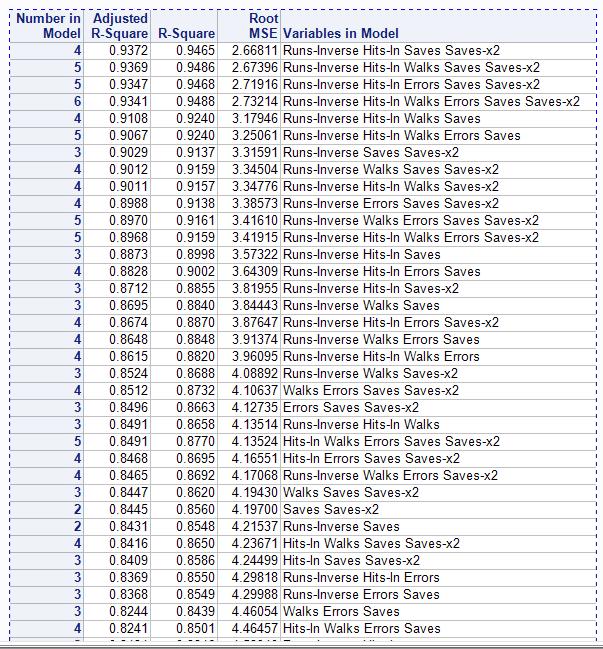
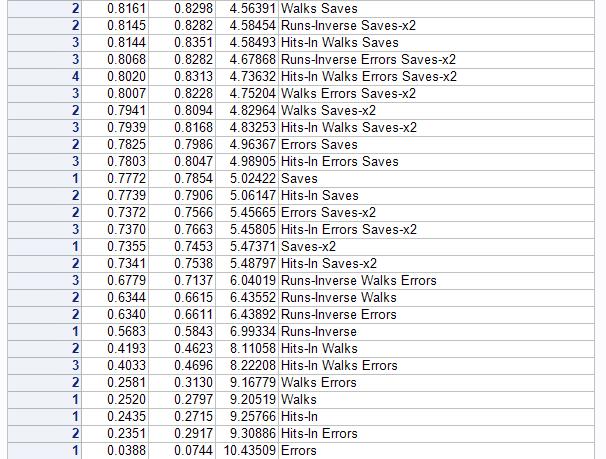
18
 This model has the highest adjusted r squared, the lowest root MSE, all of the predictors p-values are less than alpha indicating that they are significant in predicting wins. b.")
19 a. Which predictors are included in your BEST model? (1 pt) runs-inverse (X1), hitsln (X2), saves (X3), savesx2 (X4) b. How did you arrive at that decision? (1 pt) This model has the highest adjusted r squared, the lowest root MSE, all of the predictors p-values are less than alpha indicating that they are significant in predicting wins. b. What is the estimated regression equation of your best model? (2 pts) Y hat = (X1) (X2) (X3) (X4) d. VALIDATE your results using BB2009 data. Attach a spreadsheet (like the one I provided in class when I discussed validation RMSE) showing the actual Y, predicted Y, error, error-squared and validation RMSE. Your validation RMSE is (5 pts) 7. Which regression model is BEST? The one you found in 3a or 6c? (2 pts) 3A Why did you choose the model you did? (2 pts) In my case, it appears the best model I picked in 6c could perhaps be over-fitted and therefore does not do a great job predicting random samples of the population. Therefore, in following the criteria for picking the best model based on validation, I would have to choose the original model in 3A because its validation RMSE is lower.
20 8. Use your best model provided in #7 above to explain to a coach what to do to increase the number of Wins? (4 pts) Yˆ = (X1) (X2) (X3) (X4) (X5) Based on the original model, I would explain that to increase the number of wins the coach should focus on two variables: number of runs and number of saves. Both have the two highest semi partial correlations indicating that they can explain the variance in wins the most of the five predictors. He should focus on increasing the team s number of runs by 5.574% and increase the number of saves by %. NOTE: The person with the BEST model will receive 4 extra credit points toward the total number of points for the semester.
21 2008 Team Runs Hits Walks Errors Saves Wins Arizona Atlanta Baltimore Boston Chicago Cubs Chicago White Sox Cincinnati Cleveland Colorado Detroit Florida Houston Kansas City California Angels Los Angeles Dodgers Milwaukee Minnesota New York Mets New York Yankees Oakland Philadelphia Pittsburgh San Diego Seattle San Francisco St. Louis Tampa Bay Texas Toronto Washington Taylor C. Veillon
22 2009 TEAMS Wins Runs Hits Walks Errors Saves Arizona Atlanta Baltimore Boston Chicago Cubs Chicago White Sox Cincinnati Cleveland Colorado Detroit Florida Houston Kansas City California Angels Los Angeles Dodgers Milwaukee Minnesota New York Mets New York Yankees Oakland Philadelphia Pittsburgh San Diego Seattle San Francisco St. Louis Tampa Bay Texas Toronto Washington
(56.3%) AL (60%) (62%) (69%) (+4149) 7* 9-5 (64%) +450 (400% ROI
 AL (60%) (62%) (69%) (+4149) 7* 9-5 (64%) +450 (400% ROI") Season: 107-83 (56.3%) for +3924 AL System: 27-18 (60%) June: 18-11 (62%) and +1005 May: 22-10 (69%) (+4149) 7* and Higher: 9-5 (64%) Playoffs: +450 (400% ROI for Playoff purchasers) By Game Season To
Season: 107-83 (56.3%) for +3924 AL System: 27-18 (60%) June: 18-11 (62%) and +1005 May: 22-10 (69%) (+4149) 7* and Higher: 9-5 (64%) Playoffs: +450 (400% ROI for Playoff purchasers) By Game Season To
Descriptive Statistics Project Is there a home field advantage in major league baseball?
 Descriptive Statistics Project Is there a home field advantage in major league baseball? DUE at the start of class on date posted on website (in the first 5 minutes of class) There may be other due dates
Lesson 3 Pre-Visit Teams & Players by the Numbers
 Lesson 3 Pre-Visit Teams & Players by the Numbers Objective: Students will be able to: Review how to find the mean, median and mode of a data set. Calculate the standard deviation of a data set. Evaluate
Double Play System 1.0
 Double Play System 1.0 A step-by-step system for the MLB 2011 Season By James Jones The DPS 1.0 System is a very simple and effective system. There are two steps you must follow. 1) How to detect when
Lesson 5 Post-Visit Do Big League Salaries Equal Big Wins?
 Lesson 5 Post-Visit Do Big League Salaries Equal Big Wins? Objective: Students will be able to: Determine the average salary of a Major League Baseball player. Use charts to locate information. Compare
Stats in Algebra, Oh My!
 Stats in Algebra, Oh My! The Curtis Center s Mathematics and Teaching Conference March 7, 2015 Kyle Atkin Kern High School District kyle_atkin@kernhigh.org Standards for Mathematical Practice 1. Make sense
Lesson 2 Pre-Visit Big Business of the Big Leagues
 Lesson 2 Pre-Visit Big Business of the Big Leagues Objective: Students will be able to: Identify several sources of revenue for Major League Baseball teams. Use math skills to estimate team revenue from
Paul M. Sommers. March 2010 MIDDLEBURY COLLEGE ECONOMICS DISCUSSION PAPER NO
 IS THERE HOME-FIELD ADVANTAGE IN INTERLEAGUE PLAY? by Paul M. Sommers March 2010 MIDDLEBURY COLLEGE ECONOMICS DISCUSSION PAPER NO. 10-12 DEPARTMENT OF ECONOMICS MIDDLEBURY COLLEGE MIDDLEBURY, VERMONT 05753
A Competitive Edge? The Impact of State Income Taxes on the Acquisition of Free Agents by Major League Baseball Franchises
 University of South Carolina Scholar Commons Senior Theses Honors College 5-5-2017 A Competitive Edge? The Impact of State Income Taxes on the Acquisition of Free Agents by Major League Baseball Franchises
2014 MAJOR LEAGUE LEAGUE BASEBALL ATTENDANCE NOTES
 2014 MAJOR LEAGUE LEAGUE BASEBALL ATTENDANCE NOTES This is a brief summary of 2014 Major League Baseball attendance. It includes league and team attendance in the pages that follow the notes below. The
Traveling Salesperson Problem and. its Applications for the Optimum Scheduling
 Traveling Salesperson Problem and its Applications for the Optimum Scheduling Introduction When you think of the sports, what word do you imagine first? Competition? Winner? Soccer? Those words pretty
One Chrome Autographed Card Per Hobby Box!
 2012 MLB DRAFT CLASS 01. Houston Astros 02. Minnesota Twins 03. Seattle Mariners 04. Baltimore Orioles 05. Kansas City Royals 06. Chicago Cubs 07. San Diego Padres 08. Pittsburgh Pirates 09. Florida Marlins
Part A: Changes in Distance between Major League Baseball Franchises and their Triple-A Affiliates
 Five Themes of Geography: Movement Major and Minor League Baseball Team Affiliations, 1998 & 2011 Ezra Zeitler University of Wisconsin-Eau Claire Department of Geography & Anthropology Purpose: This exercise
American League Ballpark
 American League Ballpark Baltimore Orioles Oriole Park at Camden Yards open1992 Left Foul Line: 333feet/101.6m Left Power Alley: 364feet/111m Center Field: 400feet/122m Deep Center: 410feet/125m Right
NUMB3RS Activity: Choosing Contenders. Episode: Contenders
 Teacher Page 1 NUMB3RS Activity: Choosing Contenders Topic: Weighted averages, z-scores Grade Level: 9-12 Objective: Determine ratings using weighted averages of lists of data Time: 20-30 minutes Materials:
GEOGRAPHY LESSON 1: PRE-VISIT - SAFE AT HOME LOCATION, PLACE AND BASEBALL BASEBALL COAST TO COAST HOUSTON ASTROS IN PARTNER WITH THE NBHOF
 PRE-VISIT - SAFE AT HOME LOCATION, PLACE AND BASEBALL OBJECTIVE: Students will be able to: Define location and place, two of the five themes of geography. Give reasons for the use of latitude and longitude.
1988 Graphics Section Poster Session. Displaying Analysis of Baseball Salaries
 1988 Graphics Section Poster Session Displaying Analysis of Baseball Salaries The Statistical Graphics Section of the American Statistical Association is sponsoring a special poster session titled "Why
Arizona Diamondbacks Turner Field Atlanta Braves Chase Field Turner Field - Advanced Ballpark Factors
 Chase Field Arizona Diamondbacks Manager: A. J. Hinch Record: - Std Type: Retractable Dome/Grass Capacity:, Doubles: / Triples: Turner Field Atlanta Braves Manager: Bobby Cox Record: - Stadium Type: Open
Scotty s Spring Training
 Scotty s Spring Training A Reading A Z Level O Leveled Book Word Count: 761 LEVELED BOOK O Scotty s Spring Training 1982-2001 TONY GWYNN Right Field San Diego Padres Written by Blane Jeffries Illustrated
2016 MAJOR LEAGUE BASEBALL ATTENDANCE HIGHLIGHTS
 2016 MAJOR LEAGUE BASEBALL ATTENDANCE HIGHLIGHTS This is a brief summary of 2016 Major League Baseball attendance. It includes league and team attendance totals in the pages that follow the notes below.
2014 Baltimore Orioles
 Baltimore Orioles Record: 96-66 1st Place American League East Manager: Buck Showalter Oriole Park at Camden Yards - 48,187 Day: 1-8 Good, 9-15 Average, 16-20 Bad Night: 1-4 Good, 5-15 Average, 16-20 Bad
1982 Atlanta Braves. Record: st Place National League West Manager: Joe Torre
 Atlanta Braves Record: 89-73 1st Place National League West Manager: Joe Torre Atlanta-Fulton County Stadium - 52,785 Day: 1-10 Good, 11-17 Average, 18-20 Bad Night: 1-6 Good, 7-17 Average, 18-20 Bad Day:
2013 Baltimore Orioles
 Baltimore Orioles Record: 85-77 t-3rd Place American League East Manager: Buck Showalter Oriole Park at Camden Yards - 48,187 Day: 1-8 Good, 9-15 Average, 16-20 Bad Night: 1-4 Good, 5-15 Average, 16-20
2018 MAJOR LEAGUE AND MINOR LEAGUE BASEBALL ATTENDANCE HIGHLIGHTS
 2018 MAJOR LEAGUE AND MINOR LEAGUE BASEBALL ATTENDANCE HIGHLIGHTS This is a brief summary of 2018 Major League and Minor League Baseball attendance. It includes league and team attendance totals in the
SAP Predictive Analysis and the MLB Post Season
 SAP Predictive Analysis and the MLB Post Season Since September is drawing to a close and October is rapidly approaching, I decided to hunt down some baseball data and see if we can draw any insights on
2012 Baltimore Orioles
 Baltimore Orioles Record: 93-69 (Wild Card) 2nd Place American League East Lost - ALDS Manager: Buck Showalter Oriole Park at Camden Yards - 48,187 Day: 1-8 Good, 9-15 Average, 16-20 Bad Night: 1-4 Good,
2015 Baltimore Orioles
 Baltimore Orioles Record: 81-81 3rd Place American League East Manager: Buck Showalter Oriole Park at Camden Yards - 45,971 Day: 1-8 Good, 9-15 Average, 16-20 Bad Night: 1-4 Good, 5-15 Average, 16-20 Bad
2018 MAJOR LEAGUE AND MINOR LEAGUE BASEBALL ATTENDANCE HIGHLIGHTS
 2018 MAJOR LEAGUE AND MINOR LEAGUE BASEBALL ATTENDANCE HIGHLIGHTS This is a brief summary of 2018 Major League and Minor League Baseball attendance. It includes league and team attendance totals in the
1977 Boston Red Sox. Record: t-2nd Place American League East Manager: Don Zimmer
 Boston Red Sox Record: 97-64 t-2nd Place American League East Manager: Don Zimmer Fenway Park - 33,513 Day: 1-7 Good, 8-14 Average, 15-20 Bad Night: 1-3 Good, 4-13 Average, 14-20 Bad Day: 1-11 Good, 12-17
1973 Boston Red Sox. Record: nd Place American League East Manager: Eddie Kasko, Eddie Popowski (9/30/73)
") Boston Red Sox Record: 89-73 2nd Place American League East Manager: Eddie Kasko, Eddie Popowski (9/30/73) Fenway Park - 33,379 Day: 1-7 Good, 8-14 Average, 15-20 Bad Night: 1-3 Good, 4-13 Average, 14-20
Boston Red Sox Record: 89-73 2nd Place American League East Manager: Eddie Kasko, Eddie Popowski (9/30/73) Fenway Park - 33,379 Day: 1-7 Good, 8-14 Average, 15-20 Bad Night: 1-3 Good, 4-13 Average, 14-20
1969 Boston Red Sox. Record: rd Place American League East Manager: Dick Williams, Eddie Popowski (9/23/69)
") Boston Red Sox Record: 87-75 3rd Place American League East Manager: Dick Williams, Eddie Popowski (9/23/69) Fenway Park - 33,375 Day: 1-7 Good, 8-14 Average, 15-20 Bad Night: 1-3 Good, 4-13 Average, 14-20
Boston Red Sox Record: 87-75 3rd Place American League East Manager: Dick Williams, Eddie Popowski (9/23/69) Fenway Park - 33,375 Day: 1-7 Good, 8-14 Average, 15-20 Bad Night: 1-3 Good, 4-13 Average, 14-20
Lesson Plan: Bats and Stats
 Lesson Plan: Bats and Stats Lesson Designer: Leslie Knicl, Jefferson Middle School, 1115 S. Crescent, Champaign, IL 61821, knicle@cmi.k12.il.us Background: With the home run race consuming the sports news
Sports. Baseball. PERSONALIZE your cake by adding your own message, photo & icing colors Includes three baseball player figurines!
 PERSONALIZE Includes three baseball player figurines! Shown on ¼ Two Tier Cake Serves 64 100/170 cal. per slice 3 + WARNING Baseball 65 Decopac/MLBP 2013 Anaheim Angels #4672 Arizona Diamondbacks #4709
Take Me Out to the Ball Game. By: Sarah Gates
 Take Me Out to the Ball Game By: Sarah Gates Geographic Question: How does the location of major league sports teams correlate to population patterns of the U.S.? Overview: At the middle to high school
2017 MAJOR LEAGUE AND MINOR LEAGUE BASEBALL ATTENDANCE HIGHLIGHTS
 2017 MAJOR LEAGUE AND MINOR LEAGUE BASEBALL ATTENDANCE HIGHLIGHTS This is a brief summary of 2017 Major League and Minor League Baseball attendance. It includes league and team attendance totals in the
THE BIRD ON S.T.E.M.
 THE BIRD ON S.T.E.M. BASEBALL, METEOROLOGY AND CLIMATE The Bird on STEM: Baseball is played only under certain weather conditions. If it starts to rain too hard a game will be called, cancelled, postponed
Doc's NHL Hockey Record
 2006-2007 Doc's NHL Hockey Record Date Team Score W/L Units Total Units + / - Total $$ 18-Feb Dallas -110 over San Jose 5-2 Win 19-Feb Boston -110 over Philadelphia 6-3 Win 20-Feb St. Louis -165 over Columbus
MAJOR LEAGUE BASEBALL 2009 ATTENDANCE ANALYSIS. Written by David P. Kronheim
 MAJOR LEAGUE BASEBALL 2009 ATTENDANCE ANALYSIS Written by David P. Kronheim 2010 MAJOR LEAGUE BASEBALL 2009 ATTENDANCE ANALYSIS TABLE OF CONTENTS PAGES Attendance Reporting Guidelines and Information Sources..
1991 Boston Red Sox. Record: t-2nd Place American League East Manager: Joe Morgan
 Boston Red Sox Record: 84-78 t-2nd Place American League East Manager: Joe Morgan Fenway Park - 34,171 Day: 1-8 Good, 9-15 Average, 16-20 Bad Night: 1-4 Good, 5-13 Average, 14-20 Bad Day: 1-12 Good, 13-17
2004 Baltimore Orioles
 Baltimore Orioles Record: 78-84 3rd Place American League East Manager: Lee Mazzilli Oriole Park at Camden Yards - 48,876 Day: 1-8 Good, 9-15 Average, 16-20 Bad Night: 1-4 Good, 5-15 Average, 16-20 Bad
Baseball Basics for Brits
 Baseball Basics for Brits Volume 1. The Major League Baseball Season In this volume of Baseball Basics for Brits, we will be looking at how a Major League Baseball (MLB) season is structured. This includes:
MAJOR LEAGUE BASEBALL 2013 ATTENDANCE ANALYSIS. Compiled and Written by David P. Kronheim.
 MAJOR LEAGUE BASEBALL 2013 ATTENDANCE ANALYSIS Compiled and Written by David P. Kronheim d.kronheim@verizon.net 2014 MAJOR LEAGUE BASEBALL 2013 ATTENDANCE ANALYSIS TABLE OF CONTENTS PAGES Attendance Reporting
MAJOR LEAGUE BASEBALL 2014 ATTENDANCE ANALYSIS. Compiled and Written by David P. Kronheim.
 MAJOR LEAGUE BASEBALL 2014 ATTENDANCE ANALYSIS Compiled and Written by David P. Kronheim d.kronheim@verizon.net 2015 MAJOR LEAGUE BASEBALL 2014 ATTENDANCE ANALYSIS TABLE OF CONTENTS PAGES Attendance Reporting
76112F22 BALL COLOR: PMS 802 LOGO COLOR CHART LACE COLOR: PMS 380. White C-0 M-0 Y-0 K-0. Process Black C C-0 M-0 Y-0 K-100 BALL COLOR: PMS 380
 CONCESSIONS 76112F22 TOP BOTTOM LOGO COLOR CHART PMS CMYK White C-0 M-0 Y-0 K-0 Process Black C C-0 M-0 Y-0 K-100 FRANKLIN SPORTS INC/MLBP 2017 76012F - xxxxxxxxxx BALL COLOR: PMS 802 LACE COLOR: PMS 380
76112F15 BALL COLOR: PMS 802 LOGO COLOR CHART LACE COLOR: PMS 380. White C-0 M-0 Y-0 K-0. Process Black C C-0 M-0 Y-0 K-100 BALL COLOR: PMS 380
 CONCESSIONS 76112F15 TOP BOTTOM LOGO COLOR CHART PMS CMYK White C-0 M-0 Y-0 K-0 Process Black C C-0 M-0 Y-0 K-100 FRANKLIN SPORTS INC/MLBP 2017 76012F - xxxxxxxxxx BALL COLOR: PMS 802 LACE COLOR: PMS 380
MAJOR LEAGUE BASEBALL 2010 ATTENDANCE ANALYSIS. Compiled and Written by David P. Kronheim
 MAJOR LEAGUE BASEBALL 2010 ATTENDANCE ANALYSIS Compiled and Written by David P. Kronheim 2011 MAJOR LEAGUE BASEBALL 2010 ATTENDANCE ANALYSIS TABLE OF CONTENTS PAGES Attendance Reporting Guidelines and
August 2010 MIDDLEBURY COLLEGE ECONOMICS DISCUSSION PAPER NO DEPARTMENT OF ECONOMICS MIDDLEBURY COLLEGE MIDDLEBURY, VERMONT 05753
 When is the Honeymoon Over for Baseball s New Stadiums? by Mark B. Whelan Paul M. Sommers August 2010 MIDDLEBURY COLLEGE ECONOMICS DISCUSSION PAPER NO. 10-32 DEPARTMENT OF ECONOMICS MIDDLEBURY COLLEGE
The streak ended Aug. 17, 2017, with a loss at home to Cincinnati.
 The 2019 Cubs scored at least 10 runs in 5 of their first 10 games, something they had not accomplished since the birth of the National League in 1876. But they lost 2 of those games, 11-10 at Texas, on
PROMOS / CONCEPT=MLB ON FS1
 PROMOS / CONCEPT=MLB ON FS1 MLB ON FS1 FULLSCREEN MAX EVENTS = 4 - TAB0001 - DAY 1 NUMBER OF MATCHUPS - 1 TO 4 - TAB0002 - DAY 2 NUMBER OF MATCHUPS - 1 TO 4 - TAB0003 - DAY 3 NUMBER OF MATCHUPS - 1 TO
NFL SCHEDULE SAMPLE. Green Bay
 Scott Kellen NFL SCHEDULE SAMPLE Thursday game Monday night Green Bay DATE HA OPPONENT 7 9/11/2016 A Jacksonville Jaguars 7.33 9/18/2016 7 A Minnesota Vikings 9.55 9/25/2016 7 H Detroit Lions 7.24 BYE
76112F06 BALL COLOR: PMS 802 LOGO COLOR CHART LACE COLOR: PMS 380. White C-0 M-0 Y-0 K-0. Process Black C C-0 M-0 Y-0 K-100 BALL COLOR: PMS 380
 CONCESSIONS 76112F06 TOP BOTTOM LOGO COLOR CHART PMS CMYK White C-0 M-0 Y-0 K-0 Process Black C C-0 M-0 Y-0 K-100 FRANKLIN SPORTS INC/MLBP 2017 76012F - xxxxxxxxxx BALL COLOR: PMS 802 LACE COLOR: PMS 380
CLUBS LONGEST LOSING STREAK - 4 CINCINNATI 5/24/14 THRU 5/27/14 3 CINCINNATI 6/30/14 THRU 7/02/14
 TIME: 19:38:26 Compiled by the MLB Baseball Information System PAGE: 1 MOST RUNS, GAME - 13 CINCINNATI AT MILWAUKEE 6/15/14 12 CINCINNATI VS TAMPA BAY 4/13/14 MOST RUNS, GAME, BOTH CLUBS - 23 TORONTO 14
DR. JAY S INFALLIBLE BASEBALL SYSTEM!!!
 DR. JAY S INFALLIBLE BASEBALL SYSTEM!!! PLEASE NOTE: DR.JAY'S INFALLIBLE BASEBALL SYSTEM is quite legally protected and fully copyrighted according to British and American law. We have used the advice
OYO Baseball Hall of Fame Collector s Checklist
 RARY PRODUCT SERIES UPC Seq Numbered to 505 George Brett: Hall of Fame: American League: Generation 1 All Star Game Edition 1 099304293881 Rare Hall Of Fame: Earl Weaver: Baltimore Orioles: Generation
JAY BUCKLEY BASEBALL TOURS 2014 SCHEDULE
 JAY BUCKLEY BASEBALL TOURS 2014 SCHEDULE For reservations contact: Jay Buckley BASEBALL TOURS Box 213 La Crosse, Wisconsin 54602-0213 1.888.666.3510 info@jaybuckley.com www.jaybuckley.com Visit www.jaybuckley.com
Friday's Games (All Times Eastern) NHL PLAYOFFS - First Round (3) -Winnipeg 4 Minnesota 1 (Jets lead series 2-0)
 NHL PLAYOFFS - First Round (3) -Winnipeg 4 Minnesota 1 (Jets lead series 2-0)") Friday's Games (All Times Eastern) NHL PLAYOFFS - First Round (3) -Winnipeg 4 Minnesota 1 (Jets lead series 2-0) The Winnipeg Jets are in control of their first-round playoff series against Minnesota.
Friday's Games (All Times Eastern) NHL PLAYOFFS - First Round (3) -Winnipeg 4 Minnesota 1 (Jets lead series 2-0) The Winnipeg Jets are in control of their first-round playoff series against Minnesota.
BASEBALL AND THE AMERICAN CITY: An examination of public financing and stadium construction in American professional sports.
 BASEBALL AND THE AMERICAN CITY: An examination of public financing and stadium construction in American professional sports. By Brian Reich April 30, 2001 http://www.stadiummouse.com/ APPENDICIES 1A 1B
Section I: Multiple Choice Select the best answer for each problem.
 Inference for Linear Regression Review Section I: Multiple Choice Select the best answer for each problem. 1. Which of the following is NOT one of the conditions that must be satisfied in order to perform
4. Fortune magazine publishes the list of the world s billionaires annually. The 1992 list (Fortune,
 Class 2 1. For each of the following variables, indicate with Q or C whether it is a quantitative variable or a categorical variable. a. the color of a M&M candy b. the weight of an airplane c. the life
Announcements. Lecture 19: Inference for SLR & Transformations. Online quiz 7 - commonly missed questions
 Announcements Announcements Lecture 19: Inference for SLR & Statistics 101 Mine Çetinkaya-Rundel April 3, 2012 HW 7 due Thursday. Correlation guessing game - ends on April 12 at noon. Winner will be announced
2018 SCHEDULE. For reservations contact: Box 213 La Crosse, Wisconsin
 JAY BUCKLEY BASEBALL TOURS 2018 SCHEDULE For reservations contact: Jay Buckley BASEBALL TOURS Box 213 La Crosse, Wisconsin 54602-0213 1.888.666.3510 info@jaybuckley.com www.jaybuckley.com Visit www.jaybuckley.com
Q1A. Did you personally attend any Major League Baseball games LAST year, or not?
 1350 Willow Rd, Suite 102 Menlo Park, CA 94025 www.knowledgenetworks.com Interview dates: September 14 September 21, 2009 Interviews: 559 adults interested or very interested in MLB Sampling margin of
JAY BUCKLEY BASEBALL TOURS 2013 SCHEDULE
 JAY BUCKLEY BASEBALL TOURS 2013 SCHEDULE For reservations contact: Jay Buckley BASEBALL TOURS Box 213 La Crosse, Wisconsin 54602-0213 1.888.666.3510 info@jaybuckley.com www.jaybuckley.com Visit www.jaybuckley.com
This document is authorized for use only by P. Richard Hahn at University of Chicago Booth School of Business. THE OAKLAND A s (A)
") UVA-QA-0282 Rev. Jan. 22, 2013 Steward Roddey, general manager of the Oakland A s baseball team, stared at the attendance figures he had put together for the recently completed 1980 season (Exhibit 1).
UVA-QA-0282 Rev. Jan. 22, 2013 Steward Roddey, general manager of the Oakland A s baseball team, stared at the attendance figures he had put together for the recently completed 1980 season (Exhibit 1).
A Markov Model for Baseball with Applications
 University of Wisconsin Milwaukee UWM Digital Commons Theses and Dissertations December 2014 A Markov Model for Baseball with Applications Daniel Joseph Ursin University of Wisconsin-Milwaukee Follow this
NFL SCHEDULE SAMPLE. Green Bay
 NFL SCHEDULE SAMPLE Thursday game Monday night Green Bay DATE HA OPPONENT 7 9/11/2016 A Jacksonville Jaguars 7.33 9/18/2016 7 A Minnesota Vikings 9.55 9/25/2016 7 H Detroit Lions 7.24 BYE 10/9/2016 14
Liberty s MLB Draft Picks Free Agents Clay Elliot, SS Atlanta Braves Drafted 10 th Round
 Liberty s MLB Draft Picks Free Agents 1976 Clay Elliot, SS Atlanta Braves Drafted 10 th Round 1976 Jeff Mincey, C Pittsburgh Pirates Drafted 21 st Round 1978 Bernie Young, OF 1981 Sid Bream, 1B Los Angeles
NFL SCHEDULE SAMPLE. Green Bay
 NFL SCHEDULE SAMPLE Thursday game Monday night Green Bay DATE HA OPPONENT 7 9/11/2016 A Jacksonville Jaguars 7.33 9/18/2016 7 A Minnesota Vikings 9.55 9/25/2016 7 H Detroit Lions 7.24 BYE 10/9/2016 14
A) The linear correlation is weak, and the two variables vary in the same direction.
 The linear correlation is weak, and the two variables vary in the same direction.") 1 Which of the following is NOT affected b outliers in a data set? A) Mean C) Range B) Mode D) Standard deviation 2 The following scatter plot represents a two-variable statistical distribution. Which
1 Which of the following is NOT affected b outliers in a data set? A) Mean C) Range B) Mode D) Standard deviation 2 The following scatter plot represents a two-variable statistical distribution. Which
Lab 11: Introduction to Linear Regression
 Lab 11: Introduction to Linear Regression Batter up The movie Moneyball focuses on the quest for the secret of success in baseball. It follows a low-budget team, the Oakland Athletics, who believed that
Top3 Fantasy Sports Rules. General. Eligibility AGE PLACE OF RESIDENCE: pg. 1
 Top3 Fantasy Sports Rules General Eligibility AGE PLACE OF RESIDENCE: pg. 1 Contests CONTEST ENTRY Entry Fees pg. 2 Winning Ties and Tie Breakers pg. 3 Contests - Player Selections Game Play Time Period
Chapter 12 Practice Test
 Chapter 12 Practice Test 1. Which of the following is not one of the conditions that must be satisfied in order to perform inference about the slope of a least-squares regression line? (a) For each value
Table 1: Eastern Conference Final Standings (Sorted by Current Scoring System)
") Here is the full text that we sent to The Hockey News that appeared in the February 13, 2012 Issue under the heading Just Win, Baby. Following that is some additional analyses that were too lengthy to
Here is the full text that we sent to The Hockey News that appeared in the February 13, 2012 Issue under the heading Just Win, Baby. Following that is some additional analyses that were too lengthy to
MEMORABLE DRINKWARE PRODUCT FEATURES LICENSED COLLEGIATE DESIGNS 24 OUNCE TUMBLER
 81 MEMORABLE DRINKWARE With unique customizable options and the enduring quality of a product that s been made in America since 1946, Tervis drinkware is built for a lifetime of memorable moments and everyday
NFL SCHEDULE SAMPLE. Green Bay
 NFL SCHEDULE SAMPLE Thursday game Opponent off bye week Monday night Green Bay DATE HA OPPONENT 7 9/11/2016 A Jacksonville Jaguars 7.33 9/18/2016 7 A Minnesota Vikings 9.55 9/25/2016 7 H Detroit Lions
Building an NFL performance metric
 Building an NFL performance metric Seonghyun Paik (spaik1@stanford.edu) December 16, 2016 I. Introduction In current pro sports, many statistical methods are applied to evaluate player s performance and
Web Address: Address: 2018 Official Rules Summary
 2018 Official Rules Summary 1. $5.00 per week per entry over 17 weeks of the regular season and $5.00 for the playoffs. ($90.00 total for season). No limit on the number of entries per person each week.
Iowa's Major Leaguers
 Iowa's Major eaguers Born in Iowa Iowa igh School Iowa College Part Six Debuted 99-6 Jerry Kutzler illiam Penn College Chicago hite Sox 99. 6.. 9 99 Tom Drees Born in Des Moines Chicago hite Sox 99. Cal
SOUTHERN BASEBALL DIGEST
 SOUTHERN BASEBALL DIGEST Blisterin Billy Hamilton Back on July 8 baseball Twitter was buzzing over Billy Hamilton scoring a run while stealing second base. That sounds outrageous, but if you know a little
Effect of homegrown players on professional sports teams
 Effect of homegrown players on professional sports teams ISYE 2028 Rahul Patel 902949215 Problem Description: Football is commonly referred to as America s favorite pastime. However, for thousands of people
MAJOR LEAGUE BASEBALL 2016 ATTENDANCE ANALYSIS
 MAJOR LEAGUE BASEBALL 2016 ATTENDANCE ANALYSIS Compiled and Written by David P. Kronheim d.kronheim@verizon.net 2017 LAWRENCE PETER (YOGI) BERRA (1925-2015) He lived his life with pride and humility, and
Average Runs per inning,
 Home Team Scoring Advantage in the First Inning Largely Due to Time By David W. Smith Presented June 26, 2015 SABR45, Chicago, Illinois Throughout baseball history, the home team has scored significantly
y ) s x x )(y i (x i r = 1 n 1 s y Statistics Lecture 7 Exploring Data , y 2 ,y n (x 1 ),,(x n ),(x 2 ,y 1 How two variables vary together
 s x x )(y i (x i r = 1 n 1 s y Statistics Lecture 7 Exploring Data , y 2 ,y n (x 1 ),,(x n ),(x 2 ,y 1 How two variables vary together") Statistics 111 - Lecture 7 Exploring Data Numerical Summaries for Relationships between Variables Administrative Notes Homework 1 due in recitation: Friday, Feb. 5 Homework 2 now posted on course website:
Statistics 111 - Lecture 7 Exploring Data Numerical Summaries for Relationships between Variables Administrative Notes Homework 1 due in recitation: Friday, Feb. 5 Homework 2 now posted on course website:
Navigate to the golf data folder and make it your working directory. Load the data by typing
 Golf Analysis 1.1 Introduction In a round, golfers have a number of choices to make. For a particular shot, is it better to use the longest club available to try to reach the green, or would it be better
NFL SCHEDULE SAMPLE. Green Bay
 NFL SCHEDULE SAMPLE Thursday game Opponent off bye week Monday night Green Bay DATE HA OPPONENT 7 9/11/2016 A Jacksonville Jaguars 7.33 9/18/2016 7 A Minnesota Vikings 9.55 9/25/2016 7 H Detroit Lions
Past Major League Players. Top Gun Sports and Hartsell Athletics hosted events.
 Past Major League Players Top Gun Sports and Hartsell Athletics hosted events www.playtopgunsports.com 2012-Corey Seager---Los Angeles Dodgers, 1st round, 18th overall pick, Coach Dad, Jeff Seager, Hartsell/Top
Running head: DATA ANALYSIS AND INTERPRETATION 1
 Running head: DATA ANALYSIS AND INTERPRETATION 1 Data Analysis and Interpretation Final Project Vernon Tilly Jr. University of Central Oklahoma DATA ANALYSIS AND INTERPRETATION 2 Owners of the various
ASTERISK OR EXCLAMATION POINT?: Power Hitting in Major League Baseball from 1950 Through the Steroid Era. Gary Evans Stat 201B Winter, 2010
 ASTERISK OR EXCLAMATION POINT?: Power Hitting in Major League Baseball from 1950 Through the Steroid Era by Gary Evans Stat 201B Winter, 2010 Introduction: After a playerʼs strike in 1994 which resulted
National Football League
 1 Albo d Oro 1920 Akron PROS - 1921 Chicago STALEYS - 1922 Canton BULLDOGS - 1923 Canton BULLDOGS - 1924 Cleveland BULLDOGS - 1925 Chicago CARDINALS - 1926 Frankford YELLOW JACKETS - 1927 New York GIANTS
Predicting the use of the Sacrifice Bunt in Major League Baseball. Charlie Gallagher Brian Gilbert Neelay Mehta Chao Rao
 Predicting the use of the Sacrifice Bunt in Major League Baseball Charlie Gallagher Brian Gilbert Neelay Mehta Chao Rao Understanding the Data Data from the St. Louis Cardinals Sig Mejdal, Senior Quantitative
MEMORABLE DRINKWARE PRODUCT FEATURES 24 OUNCE TUMBLER
 81 MEMORABLE DRINKWARE With unique customizable options and the enduring quality of a product that s been made in America since 1946, Tervis drinkware is built for a lifetime of memorable moments and everyday
George F. Will, Men at Work
 Part of baseball s charm is the illusion it offers that all aspects of it can be completely reduced to numerical expressions and printed in agate type in the sport section. George F. Will, Men at Work
Years with Multiple players drafted - 11 Under Jordano - Nine. Players Drafted - 41 Under Jordano - 28
 Panthers in the Pros Yr. Player Round Team 2013 Ethan Mildren 12th Twins 2013 Elvin Soto 16th Diamondbacks 2013 Matt Wotherspoon 20th Tigers 2012 Matt Iannozzo FA Cubs 2011 Kevan Smith 7th White Sox 2011
NBA TEAM SYNERGY RESEARCH REPORT 1
 NBA TEAM SYNERGY RESEARCH REPORT 1 NBA Team Synergy and Style of Play Analysis Karrie Lopshire, Michael Avendano, Amy Lee Wang University of California Los Angeles June 3, 2016 NBA TEAM SYNERGY RESEARCH
Sports & Outdoors. Sports & Outdoors DecoPac
 Sports & Outdoors 2016 DecoPac - 20605 Selecting Your Cake Size and Cake Format How many guests do you expect? Figure at least one slice of cake per guest. Cakes are traditionally cut in 1" x 2" slices
New York Sports - New York Yankees (MLB)
") New York Sports - New York Yankees (MLB) Spielplan der Saison 2018 EDV-Code: NYC1NX Datum Gegner Uhrzeit April 02.04.18 Tampa Bay Rays TBD 04.04.18 Tampa Bay Rays TBD 05.04.18 Baltimore Orioles TBD 06.04.18
New York Sports - New York Yankees (MLB) Spielplan der Saison 2018 EDV-Code: NYC1NX Datum Gegner Uhrzeit April 02.04.18 Tampa Bay Rays TBD 04.04.18 Tampa Bay Rays TBD 05.04.18 Baltimore Orioles TBD 06.04.18
Terrell Davis. Running Back 5-11, 206 Long Beach State, Georgia Denver Broncos (seven playing seasons)
") Terrell Davis Running back Terrell Davis was selected in the sixth round, 196th player overall, of the 1995 NFL Draft by the Denver Broncos. The little-known back made a big splash when earned a starting
Terrell Davis Running back Terrell Davis was selected in the sixth round, 196th player overall, of the 1995 NFL Draft by the Denver Broncos. The little-known back made a big splash when earned a starting
Fundamental Certainty
 Fundamental Certainty.or No? a presentation at: R. Mark Woodworth PKF Hospitality Research, LLC May 7, 2013 mark.woodworth@pkfc.com Hotel Horizons Forecasting Model Smith Travel Research Historical rooms
(per 100,000 residents) Cancer Deaths
 Cancer Deaths") Unit 3 Lesson 2 Investigation 2 Radioactive Waste Exposure Cancer Deaths (per 100,000 residents) 250 200 150 100 Name: 50 0 0 5 10 15 Index of Exposure a. Describe the direction and strength of the relationship.
Unit 3 Lesson 2 Investigation 2 Radioactive Waste Exposure Cancer Deaths (per 100,000 residents) 250 200 150 100 Name: 50 0 0 5 10 15 Index of Exposure a. Describe the direction and strength of the relationship.
EXST7015: Salaries of all American league baseball players (1994) Salaries in thousands of dollars RAW DATA LISTING
 Salaries in thousands of dollars RAW DATA LISTING") ANOVA & Design Randomized Block Design Page 1 1 **EXAMPLE 1******************************************************; 2 *** The 1994 salaries of all American league baseball players ***; 3 *** as reported
ANOVA & Design Randomized Block Design Page 1 1 **EXAMPLE 1******************************************************; 2 *** The 1994 salaries of all American league baseball players ***; 3 *** as reported