US 29 Bus Rapid Transit Corridor Planning Study FINAL. Corridor Study Report From Silver Spring Transit Center. April 2017
|
|
|
- Gordon Doyle
- 5 years ago
- Views:
Transcription


1 US 29 Bus Rapid Transit Corridor Planning Study Corridor Study Report From Silver Spring Transit Center to Burtonsville Park and Ride FINAL April 2017


2 APRIL 2017
3 Table of Contents page Executive Summary... ES-1 ES-1 Preliminary Purpose Statement... ES-2 ES-2 ES-3 ES-4 ES-5 ES-6 Conceptual Alternatives... ES-2 Alternatives Comparison... ES-7 Public Involvement... ES-12 Draft Corridor Study Report Comments... ES-14 Next Steps... ES Introduction What is Bus Rapid Transit? Bus Rapid Transit Planning in Montgomery County... 2 Existing and Forecasted 2040 Conditions Study Area and Study Corridor Land Use Population, Jobs, and Income Corridor Travel Patterns - Study Area Daily Trip Patterns Transit Conditions Existing Transit Services Existing Roadway Conditions and Traffic Operations Roadway Characteristics Existing Structures Inventory and Condition Summary Roadway Operations Roadway Congestion and Safety Existing Intersection Level of Service Crash Rates Preliminary Purpose and Need Identified Corridor Problems and Issues Problems and Issues April 2017 TOC-Page 2
4 Table of Contents, continued 3.2 Preliminary Purpose Statement Preliminary Needs Identification Limitations in Existing Transit Service and its Appeal to the Public Transit Demand and Dependency and Growing Transit Market Limited Connectivity for Pedestrians and Bicyclists Planned Growth and Development Within the Study Area page 4 5 Defining BRT Alternatives BRT Components Summary Bus Running Ways Stations Service Operations Plan Preliminary Conceptual Alternatives Preliminary Conceptual Alternatives Eliminated from Consideration Conceptual Build Alternatives Descriptions of the Proposed Conceptual Build Alternative Running Way Elements Affected Environment Natural Resources Topography, Geology, Soils, and Groundwater Surface Water Resources, Water Quality, and Floodplains Total Maximum Daily Loads and MS4 Permit Waters of the U.S. including Wetlands Vegetation and Wildlife Section 4(f) and Cultural Resources Section 4(f) Resources Architectural Resources Archeological Resources April 2017 TOC-Page 3
5 Table of Contents, continued 5.3 Environmental Justice Indirect and Cumulative Effects Analysis page Alternative Evaluation Evaluation Process Level One: Identify Constraints (Reality Check) Level Two: Screening (Qualitative Evaluation) Level Three: Detailed Analysis (Quantitative Evaluation) Ridership Forecasting and Forecasted 2040 Traffic Operations Potential Socioeconomic, Cultural, and Natural Environmental Impacts Estimated Costs Level Four: Environmental Analysis/Preliminary Engineering Public Involvement and Agency Coordination Introduction Corridor Advisory Committees CAC Schedule of Meetings CAC Meeting Topics CAC Meeting Exercises Project Websites CAC Meeting Materials CAC Meeting Summaries Next Steps MDOT 2040 Study MCDOT TIGER Improvements Acronyms References Appendix A: Conceptual Build Alternative Draft Design Plans Appendix B: Comments Received on Draft Corridor Study Report April 2017 TOC-Page 4
6 List of Figures.. page Figure ES-1: Alternative A... ES-15 Figure ES-2: Alternative B... ES-16 Figure ES-3: Alternative B Modified... ES-17 Figure ES-4: Proposed BRT Network... ES-18 Figure 1-1: Emerald Express, Eugene, OR... 1 Figure 1-2: RTA HealthLine, Cleveland, OH... 2 Figure 1-3: RTC, Las Vegas, NV... 3 Figure 1-4: Metro Liner, Los Angeles, CA... 5 Figure 2-1: Study Area and Study Corridor... 9 Figure 2-2: Land Use Figure 2-3: Regional District Definition Figure 2-4: Worker Commuting Flows ( ) Figure 2-5: Travel Patterns Person Trips (2014) Figure 2-6: Travel Patterns Person Trips (2040) Figure 2-7: Existing Transit Operations Along US Figure 2-8: Silver Spring Metrorail Station Figure 2-9a: 2015 Average Daily Weekday Boardings for Northbound and Southbound WMATA Stops Within the Study Corridor Figure 2-9b: 2015 Average Daily Weekday Boardings for Northbound and Southbound Ride On Stops Within the Study Corridor Figure 2-10a: US 29 at Wayne Ave/2nd Street Looking North Figure 2-10b: US 29 at Fenton Street Looking North Figure 2-10c: US 29 at Sligo Creek Parkway Looking North Figure 2-10d: US 29 at Cherry Hill Rd/Randolph Road Looking North Figure 2-10e: US 29 at MD 193 Looking North Figure 2-10f: Lockwood Drive at Oak Leaf Drive Looking North Figure 2-11: Level of Service Grades A to F April 2017 TOC-Page 5
7 List of Figures, continued Figure 2-12: 2015 Morning Peak Hour Congestion Map in TTI Figure 2-13: 2015 Afternoon Peak Hour Congestion Map in TTI Figure 3-1: "Ladders of Opportunity" How Enhanced Transit Can Improve Quality of Life Figure 3-2: Census Blockgroups and Potential Transit Dependent Populations Figure 3-3: Existing Bicycle and Pedestrian Facilities along US Figure 3-4: Proposed Development Figure 4-1: Median Station and Platform Figure 4-2: Curbside Station and Platform Figure 4-3: Split-Center Median Station and Platform Figure 4-4: Curbside Station and Platform (Single Bus) Figure 4-5: Minimal Curbside Station and Platform (Single Bus) Two Options Shown Figure 4-6: Proposed BRT Network Figure 4-7a: Alternative A Peak Direction Curbside BAT Lanes in Existing Reversible Lane Segment (Section 2) Figure 4-7b: Alternative A Peak Direction Curbside BAT Lanes (Sections 4 and 5) Figure 4-7c: Alternative A Median Shoulder BRT Lanes (Section 8) Figure 4-7: Alternative A Figure 4-8a: Alternative B Peak Direction Curbside BAT Lanes in Existing Reversible Lane Segment (Section 2) Figure 4-8b: Alternative B Peak Direction Curbside Managed Lanes (Section 4) Figure 4-8c: Alternative B Bus-On-Outside-Shoulder (Section 7) Figure 4-8: Alternative B Figure 4-9a: Alternative B Modified Peak Direction Curbside BAT Lanes in Existing Reversible Lane Segment (Section 2) Figure 4-9b: Alternative B Modified Peak Direction Curbside Managed Lanes (Section 4) Figure 4-9c: Alternative B Modified Bus-On-Outside-Shoulder (Section 7) Figure 4-9: Alternative B Modified page April 2017 TOC-Page 6
8 List of Figures, continued Figure 5-1: Northwest Branch, Looking Towards the Southeast Figure 5-2: Watershed and Aquifer Boundaries Figure 5-3: Project Overview Figure 5-4: Project Overview Figure 5-5: Project Overview Figure 5-6: Project Overview Figure 5-7: Census Blockgroups and Potential Environmental Justice Populations Figure 6-1: Evaluation Process Flow Chart Figure 6-2: VISSIM Network Extents Figure 7-1: Study Team Members Discuss Proposed Station Locations with CAC Members page List of Tables page Table ES-1: Planned/Programmed Projects... ES-3 Table ES-2: Alternatives Comparison Matrix 2040 Ridership and Traffic... ES-10 Table ES-3: Alternatives Comparison Matrix Costs and Environmental Impacts... ES-12 Table 1-1: CTCFMP Proposed Dedicated Lanes, ROW, and Maximum Additional Transit Lanes.. 4 Table 2-1: Land Uses and Acreage Within Study Corridor and Study Area Table 2-2: Montgomery Ride On Bus Services Summary Table 2-3: WMATA Metrobus Services Summary Table 2-4: WMATA Metrorail Service Summary Table 2-5: MTA Commuter Bus Services Summary Table 2-6: Average Existing Daily Boardings Table 2-7: Existing 2015 ADT Table 2-8: Existing 2015 Intersection LOS Table 2-9: US 29 Crash Data Summary Table 3-1: Existing 2015 Average Daily Bus Peak Hour Speeds April 2017 TOC-Page 7
9 List of Tables, continued Table 3-2a: Existing 2015 vs No-Build Average Travel Times Table 3-2b: Existing 2015 vs No-Build Average Speeds Table 3-3: Existing 2015 On-Time Bus Performance Table 3-4: Population, Household, and Employment Growth, 2014 and Table 3-5: Reasonably Foreseeable Development Projects Table 3-6: Existing 2015 and Forecasted No-Build ADT Table 3-7: Existing 2015 and Forecasted 2040 Intersection LOS Table 4-1: Preliminary Station and Platform Sizes and Configurations Table 5-1: Map Unit Characteristics of Soils Occurring Within the Study Area Table 5-2: MIHP Resources and Preservation Easements Table 5-3: Potential Environmental Justice Populations Table 6-1: 2040 No-Build Characteristics of the Metrobus Corridor Routes Table 6-2: 2040 No-Build Characteristics of the Local Corridor Bus Routes Table 6-3: Daily Summary of 2040 Forecasted Bi-Directional Transit Boardings for 2040 No-Build Table 6-4: Station Groups and Corresponding BRT Stations Table 6-5: 2040 Alternative A Forecasted BRT Boardings by Time of Day Table 6-6: 2040 Alternative A Forecasted Daily Transit Boardings Table 6-7: 2040 Alternative B Forecasted BRT Boardings by Time of Day Table 6-8: 2040 Alternative B Forecasted Daily Transit Boardings Table 6-9: 2040 Alternative B Modified Forecasted BRT Boardings by Time of Day Table 6-10: 2040 Alternative B Modified Forecasted Daily Transit Boardings Table 6-11: Summary of 2040 Forecasted Boardings on BRT and other Corridor Routes by Alternative Table 6-12: Summary of 2040 Regional Transit Trips by Trip Purpose and Alternative Table 6-13: Summary of Regional Daily Changes in VMT and PMT in Comparison to No-Build 117 Table 6-14: Summary of Forecasted 2040 Accessibility Changes by Alternative page April 2017 TOC-Page 8
10 List of Tables, continued Table 6-15: Summary of Synchro and VISSIM Modeling Assumptions Table 6-16: US 29 BRT Alternative Comparison Table Table 6-17: Alternatives Comparison Matrix Environmental Impacts Table 6-18: Summary of Estimated Infrastructure Costs page April 2017 TOC-Page 9
11 Executive Summary This (FCSR) documents the evaluation of alternatives to provide new Bus Rapid Transit (BRT) service along US 29 (Colesville Road/Columbia Pike). This study has been completed by the Maryland Department of Transportation s (MDOT) Maryland Transit Administration (MTA), in cooperation with the MDOT State Highway Administration (SHA) and the Montgomery County Department of Transportation (MCDOT). The US 29 BRT Corridor covers approximately 14 miles of roadway, with mainline US 29 extending from the Silver Spring Transit Center to the Burtonsville Park and Ride in eastern Montgomery County, Maryland (approximately 10 miles) and spurs on Lockwood Drive/Stewart Lane (approximately two miles) and Briggs Chaney Road/Castle Boulevard (approximately two miles). This study includes a review of existing transit and traffic functions and explores possible improvements to transit services and facilities to address current and anticipated future needs in this active and growing part of the County. BRT, as a form of transit enhancement, is being considered as a possible option for addressing several existing needs: improved transportation options for corridor stakeholders (residents, businesses, commuters, pedestrians, bicyclists, etc.); support for planned land uses and future developments; reduction in single-occupant vehicle dependence; and enhancement to transit reliability for all users. It is anticipated that transit enhancement associated with BRT would also provide opportunities for low-income and minority populations to enhance their quality of life through improved transportation and employment options. Ultimately, BRT improvements have the potential to advance the accessibility, mobility, safety, and sustainability of transportation and related land uses within and surrounding the study area. In March 2016, the Montgomery County Executive announced a desired plan and budget for BRT on US 29 to be implemented and operational by To meet this timeline, the project would need to focus on minimizing potentially time-consuming and expensive roadway construction by staying within the existing right-of-way and utilizing existing transportation infrastructure to the extent possible. The County Executive s announcement provided a catalyst for focusing the potential conceptual build alternatives to those discussed later in this FCSR. South of New Hampshire Avenue, lane repurposing options was studied by MTA. To the north existing bus on shoulder operations were investigated for BRT applications. April 2017 ES-Page 1

12 ES-1 Preliminary Purpose Statement The purpose of this project is to improve mobility options by accommodating a high frequency, reliable transit service operating within existing right-of-way to the extent practical between the Silver Spring Transit Center and the Burtonsville Park and Ride with service commencing as quickly as possible. The preliminary purpose statement translates into the following distinct goals to guide the development of alternatives and as a performance evaluation measures for comparing alternatives: Enhance transit connectivity and multi-modal integration along the corridor as part of a coordinated regional transit system; Accommodate enhanced, efficient, high frequency, reliable transit service; Provide a sustainable and cost effective transit solution; Support approved Master Planned residential and commercial growth along the corridor by providing access to transit; Address current and future bus ridership demands; Attract new riders and provide improved service options for existing riders as an alternative to congested automobile travel through the corridor; Improve transit access to major employment and activity centers by connecting more jobs and people within 45 and 60 minutes of the activity centers; Utilize existing right-of-way to the extent possible to minimize property and environmental impacts; and Commence as quickly as possible. ES-2 Conceptual Alternatives Eight preliminary conceptual alternatives were initially developed by the Study Team through incorporating a combination of transit enhancement design elements, including transit service operation updates, station location and platform configurations, and roadway running way options. The preliminary conceptual alternatives were developed from input gathered at workshops between project stakeholders: MTA, SHA, MCDOT, and the US 29 BRT Corridor Advisory Committee (CAC) members. The Study Team utilized a series of qualitative screening criteria to narrow the preliminary conceptual alternatives down to three retained conceptual build alternatives for further development and more detailed quantitative evaluation and comparison to the No-Build April 2017 ES-Page 2
13 condition. The qualitative screening process evaluated an alternatives general ability to properly meet project purpose and need. The quantitative screening criteria included forecasted 2040 No-Build and build transit ridership and bus operations data, forecasted 2040 No-Build and build traffic operations, anticipated environmental resource and right-of-way (ROW) impact estimates, and estimated capital and operating costs for proposed roadway and transit improvements. A conceptual design plan of each of the three retained conceptual build alternatives, including the proposed limits of roadway improvements, station locations, pedestrian and bicyclist facilities, and associated limits of disturbance (LOD), is provided in Appendix A. No-Build Alternative The No-Build Alternative would not involve improvements to infrastructure or bus service along the US 29 study corridor beyond those improvements already planned and programmed in the regional 2014 Constrained Long-Range Plan (CLRP) for This plan included more than 300 projects, which will have impacts on the region s roadways and transit networks. Major regional transit projects in the 2014 CLRP include the Silver Line, Corridor Cities Transitway Bus Rapid Transit, and Purple Line. The proposed Purple Line will have a station at the Silver Spring Transit Center, providing intermodal connectivity with Metrorail, Metrobus, Ride On, and the proposed US 29 BRT. Table ES-1 shows some projects related to the US 29 Study Area. Table ES-1: Planned/Programmed Projects Project From To Complete Date Construct Olney Transit Center Adjacent to or north of MD Purple Line Transitway Bethesda New Carrollton 2021 Silver Spring Transit Center Phase II 2017 US 29 (Columbia Pike) Interchange at Musgrove/Fairland Rd I-95/I-495 (Capital Beltway) Branch Avenue Metro Access 2020 I-95/I-495 (Capital Beltway) Full Interchange at Greenbelt Metro 2020 I-95 Contee Road Relocated w/cd Roads 2014 Metrorail Silver Line Phase I East Falls Church Reston 2014 Metrorail Silver Line Phase II Reston Dulles Airport 2020 Intercounty Connector I-95 US Takoma Langley Transit Center Takoma 2016 Study Countywide BRT Various corridors N/A US 29, Columbia Pike North of MD 650 Howard County N/A Line White Oak Science Gateway Various new local roadways, improved existing roadways and transit N/A Source: TPB/MWCOG, 2014 CLRP and Fiscal Year (FY) TIP Air Quality Conformity Inputs. White Oak Science Gateway Master Plan, 2014 April 2017 ES-Page 3
14 The County also anticipates a concentration of development in White Oak as envisioned in the White Oak Science Gateway Master Plan (July 2014). Additional development proposed for Fairland and Burtonsville results in growth throughout the US 29 corridor that would benefit from multi-modal transportation networks with high quality transit services. Montgomery County identifies the following planned transportation facilities in the vicinity of the US 29 BRT corridor related to the BRT project: Extension of Old Columbia Pike to Lockwood Drive; Connector roads between Plum Orchard Court, Whitethorn Court, and Cherry Hill Road; Provision of local grid of streets and access roads in Burtonsville; and White Oak Science Gateway Master Plan Transportation Improvements (Not currently programmed), which includes: o BRT Network o Old Columbia Pike Bridge opened to vehicular traffic o Planned US 29 grade-separated interchanges at Tech Road/Industrial Road o New local roads proposed in the Life Sciences/FDA Village Center o Intersection geometric improvements. Alternative A The main elements of Alternative A would include median shoulder BRT lanes from south of MD 198 to Stewart Lane and intermittent peak period-peak direction curbside Business Access Transit lanes (BAT Lanes) with segments of mixed traffic from Stewart Lane to the Silver Spring Transit Center. There would also be segments where buses would run in mixed traffic. The proposed BAT lanes would be created by re-purposing the peak direction curb lane to accommodate BRT buses, local buses, and right turning traffic. See Figure ES-1 at the end of this Executive Summary for an illustration of the proposed Alternative A improvements. Alternative B For discussion purposes peak periods are 6 a.m. to 9 a.m. and 3 p.m. to 7 p.m. while peak hours are from 8 a.m. to 9 a.m. and 5 p.m. to 6 p.m. The main elements of Alternative B would include peak period bus-on-outside-shoulder lanes from south of MD 198 to Industrial Parkway and intermittent peak period-peak direction curbside managed lanes (HOV2+ with BAT lanes) with segments of mixed traffic from Oak Leaf Drive/Prelude Drive to the Silver Spring Transit Center. The proposed managed lanes would be created by repurposing the peak direction curb lane to accommodate vehicles with two or April 2017 ES-Page 4
15 more passengers, BRT buses, local buses, and right turning traffic. See Figure ES-2 at the end of this Executive Summary for an illustration of the proposed Alternative B improvements. Alternative B Modified The main elements of Alternative B Modified would include median shoulder BRT and Commuter Bus lanes from south of MD 198 to Stewart Lane (similar to Alternative A) and intermittent peak period-peak direction curbside managed lanes (HOV2+ with BAT lanes) with segments of mixed traffic (similar to Alternative B) from Oak Leaf Drive/Prelude Drive to the Silver Spring Transit Center. Again, the proposed managed lanes would be created by repurposing the peak direction curb lane to accommodate vehicles with two or more passengers, BRT buses, local buses, and right turning traffic. See Figure ES-3 at the end of this Executive Summary for an illustration of the proposed Alternative B Modified improvements. Proposed Station Locations Throughout the study process, the project team has made adjustments to station locations in coordination with Washington Metropolitan Area Transit Authority (WMATA), Maryland- National Capital Park and Planning Commission (M-NCPPC), MCDOT and comments received from US 29 BRT CAC members. The following station locations are proposed for the evaluation of conceptual alternatives (See Figure ES-4 at the end of this Executive Summary for map of locations): Silver Spring Transit Center Two platforms US 29 at Fenton Street/Spring Street Two platforms US 29 at MD 193 (University Boulevard) Split Ctr Median Station (Alt. A) One platform US 29 at MD 193 (University Boulevard) Curb Station (Alts. B and B Mod.) Two platforms US 29 at Burnt Mills Shopping Center Two platforms Lockwood Drive at Oak Leaf Drive Two platforms White Oak Transit Center Two platforms Stewart Lane at April Lane Two platforms US 29 at Tech Road Park and Ride Median Station (Alt. A and B Mod.) One platform US 29 at Tech Road Park and Ride Curb Station (Alt. B) Two platforms US 29 at Briggs Chaney Road Median Station (Alt. A) One platform No Station for Alt. B or Alt. B Mod. Castle Ridge Way at Castle Boulevard Two platforms Castle Terrace at Castle Boulevard Two platforms Briggs Chaney Park and Ride One platform US 29 at MD 198 (Burtonsville Park and Ride) One platform April 2017 ES-Page 5
16 Service Operations Plan A service operations plan that outlines the proposed bus routing, schedules, and vehicle operations costs was developed by MTA for use in the preliminary analysis. Assumptions made for this preliminary analysis are provided below. However, the final service operations plan will likely change and will be appropriately evaluated as the study progresses through later design phases. Preliminary Service Assumptions BRT will run on US 29 in both directions. For the purposes of this analysis, BRT service is assumed to operate between 5:00 a.m. and midnight. Service patterns, or the BRT physical routes, will differ during peak and off-peak travel periods. Two service patterns are assumed for the peak period and one service pattern for the off-peak period, and are described in more detail in the section below. Maximum headways, or the time span between consecutive BRT buses (the time between when one bus arrives and when the next bus arrives), are maintained at twelve minutes for peak periods and ten minutes for off-peak periods. Because there are two patterns running during the peak periods, the functional peak headways will be six minutes. US 29 BRT Pattern One Peak Period In the peak period, Pattern One runs between Burtonsville Park and Ride and Silver Spring Transit Center via US 29 with twelve-minute headways. It overlaps Pattern Two in some sections of US 29, reducing the headway to six minutes in those sections. Figure ES-4 at the end of the Executive Summary provides an overview of the route and stations Pattern One serves during the peak period. Note that the exact location of stations varies for each alternative. Off-Peak Period In the off-peak period, Pattern One runs between Burtonsville Park and Ride and Silver Spring Transit Center via Stewart Lane and Lockwood Drive, maintaining ten-minute headways. Figure ES-4 at the end of this Executive Summary provides an overview of the route and stations Pattern One serves during the off-peak period. US 29 BRT Pattern Two In peak periods, Pattern Two runs between Briggs Chaney Park and Ride and Silver Spring Transit Center via Castle Boulevard, US 29, and Stewart Lane/ Lockwood Drive. This pattern maintains twelve-minute headways. In common sections where it overlaps with Pattern One, April 2017 ES-Page 6
17 the effective headway is six minutes. Pattern Two is assumed to not operate in off-peak hours. See Figure ES-4 at the end of the Executive Summary for more detail on the route and stations Pattern Two services during the peak period. ES-3 Alternatives Comparison As described in detail later in this document, the Study Team took a four-step approach to evaluating the conceptual build alternatives. A summary of the qualitative evaluation results for each of the three conceptual build alternatives, including ridership and traffic operations, as compared with the No-Build condition, is described below and summarized in Table ES-2. A summary of anticipated costs, environmental impacts, and property impacts associated with the No-Build and three conceptual build alternatives is also described below and summarized in Table ES-3. The projected 2040 daily BRT boardings for the conceptual build alternatives range from 16,400 to 18,120 passengers. The projected 2040 daily transit boardings in the corridor for the conceptual build alternatives range from 33,700 to 34,900 passengers, increasing by 18 to 22 percent over the No-Build conditions. Automobile Vehicle Miles Traveled (VMT) is reduced under all three of the conceptual build alternatives as compared to the No-Build. Transit Person Miles Traveled (PMT) is increased under all three of the conceptual build alternatives as compared to the No-Build. In general, each of the conceptual build alternatives improve person throughput for passengers traveling along US 29, as compared to the No-Build, the exception is where PM northbound person throughput is reduced by 510 to 940 people south of Fenton Street. In general, each of the conceptual build alternatives improves transit travel times for passengers traveling along US 29, as compared to the No-Build, with BRT passengers saving as much as 20.5 minutes compared to the No-Build local buses. The number of accessible jobs forecasted to be within 45 minutes of the corridor, via transit, increases between 1.9 percent and 2.3 percent under the three conceptual build alternatives as compared to the No-Build. The number of activity centers forecasted to be within 45 minutes of the corridor, via transit, increases between 3.9 percent and 4.7 percent under the three conceptual build alternatives as compared to the No-Build. April 2017 ES-Page 7
18 The forecasted 2040 number of miles of roadway operating at level of service (LOS) E or F along the corridor in the PM peak hour shows a decrease from 5.4 miles in the No- Build to 2.1 to 3.7 miles under the conceptual build alternatives. The AM peak hour shows an increase from 7.3 miles under No-Build to up to 8.9 miles under the conceptual build alternatives. Alternative A would have one additional intersection operating at LOS E or F, a total of 25, as compared to No-Build (24 total). Alternatives B and B Modified match the No- Build at 24 intersections operating at LOS E or F in both the AM and PM peak hours. The estimated cost to purchase the required ROW for the conceptual build alternatives ranges from $1.5 million to $4.5 million (in 2016 dollars), and the amount of ROW required for the conceptual build alternatives ranges from 2.0 acres to 6.0 acres. The estimated cost of construction for the conceptual build alternatives ranges from $60 million to $112.4 million and the total capital cost, including ROW and vehicles, ranges from $79 million to $136.4 million in 2016 dollars. The estimated annual operating costs of the conceptual build alternatives range from $7.6 million to $9.8 million in 2016 dollars. The estimated number of properties impacted by the conceptual build alternatives ranges from five to 30. There are no property displacements or relocations anticipated at this time. The number of impacted properties is presented as a range. The actual effects would be determined by the final locations and size of BRT stations and roadway improvements based on further development of the conceptual build alternatives. The number of public parks impacted by the conceptual build alternatives ranges from zero to two and the estimated acreage impacted would range from zero acres to 0.2 acres. The estimated number of public facilities impacted by the conceptual build alternatives ranges from zero to three. The estimated number of historic structures impacted by the conceptual build alternatives ranges from zero to one. No archaeological sites are anticipated to be impacted; however, additional studies would be required to as the conceptual alternatives are further developed. April 2017 ES-Page 8
19 The estimated linear feet of streams impacted by the conceptual build alternatives range from zero to 125. The 100-year floodplain impacts range from zero to 1.0 acre. The estimated wetland impacts range from zero to less than 0.2 acre. The estimated forest impacts range from 1.0 acre to 5.0 acres. None of the conceptual build alternatives are estimated to have disproportionately high adverse impact on minority or low-income populations. It is estimated that the conceptual build alternatives may impact between 0.2 acre and 1.0 acre of potential Environmental Justice communities, primarily for the construction of BRT stations. However, this impact may be further refined as the conceptual build alternatives are further developed, and it is anticipated that these communities will benefit directly from the new transit service provided. April 2017 ES-Page 9
20 SB NB SB NB Table ES-2: Alternatives Comparison Matrix 2040 Ridership and Traffic Ridership 4 Evaluation Criteria Total Daily Transit Boardings No-Build Alternative Alternative A 1 Alternative B 2 Alternative B Modified 3 AM PM AM PM AM PM AM PM 28,500 (23,800 existing) 34,900 33,700 34,400 Total Daily BRT N/A 18,100 16,400 17,300 Peak Period (6 am 9 am and 3 pm 7 pm) Person Throughput 5 South of Fenton Street 1,390 3,260 1,560 2,320 1,580 2,490 1,590 2,750 North of Franklin Avenue South of Burnt Mills Shopping Center 2,090 4,770 2,450 4,470 2,370 4,670 2,390 4,700 3,140 5,300 3,450 5,100 3,430 5,540 3,440 5,590 On Lockwood Drive , , ,250 North of Stewart Lane 3,080 4,000 3,290 4,490 3,310 4,460 3,310 4,590 North of Greencastle Road North of Greencastle Road 3,060 3,940 3,070 4,200 3,070 4,170 3,090 4,230 4,410 3,410 4,720 3,420 4,660 3,420 4,740 3,430 North of Stewart Lane 3,270 3,260 3,310 3,550 3,590 3,510 3,610 3,560 On Lockwood Drive South of Burnt Mills Shopping Center North of Franklin Avenue 4,450 3,390 4,480 3,670 4,950 3,630 4,950 3,610 4,480 2,580 4,410 2,720 4,980 2,670 5,010 2,690 South of Fenton Street 3,730 1,790 3,990 1,950 4,150 2,010 4,230 1,990 Peak Hour Travel Times in Minutes: End-to-End (Silver Spring Transit Center to Burtonsville Park and Ride) Cars and Trucks Local Buses BRT N/A N/A Cars and Trucks Local Buses BRT N/A N/A Vehicle Miles Traveled (VMT) and Transit Person Miles Traveled (PMT) in Study Corridor Reduction in Daily Automobile VMT, as compared to the No-Build N/A 3,220 10,110 9,680 Increase in Daily Transit PMT, as compared to the No-Build N/A 34,800 26,300 19,170 April 2017 ES-Page 10
21 Table ES-2: Alternatives Comparison Matrix 2040 Ridership and Traffic, Continued Accessibility Evaluation Criteria Change in Number of Jobs within 45 Minutes of the Corridor, via Transit, as compared to the No-Build Change in Number of Jobs within 60 Minutes of the Corridor, via Transit, as compared to the No-Build Change in Number of People within 45 Minutes of the Corridor Activity Centers, via Transit, as compared to the No-Build Change in Number of People within 60 Minutes of the Corridor Activity Centers, via Transit, as compared to the No-Build Traffic Operations Miles of LOS E or F Operations Along the Corridor Intersections Operating at LOS E or F No-Build Alternative Alternative A Alternative B Alternative B Modified AM PM AM PM AM PM AM PM N/A 2.2% 1.9% 2.3% N/A <1% <1% 0% N/A 4.7% 4.1% 3.9% N/A <1% <1% 0% Alternative A BAT Lanes in south, Median Shoulder BRT Lanes in north (BRT buses only) 2. Alternative B Managed Lanes (BAT/HOV2+) in south, Bus-On-Outside-Shoulder in north 3. Alternative B Modified Managed Lanes (BAT/HOV2+) in south, Median Shoulder BRT Lanes in north (BRT and Commuter buses only) 4. Values are rounded to the nearest Values are rounded to the nearest 10. April 2017 ES-Page 11
22 COSTS 1 ENVIRONMENTAL IMPACTS 2 Table ES-3: Alternatives Comparison Matrix Costs and Environmental Impacts Evaluation Criteria No-Build Alternative Alternative A Alternative B Alternative B Modified Right-of-way (ROW) $0 $1.5M-$3M $2M-$4.5M $1.5M-$3M Construction $0 $80M-$112.4M $60M-$107.9M $77M-$105.6M Vehicles $0 $21M $17M $19M Total Capital Cost $0 $102.5M- $136.4M $79M-$129.4M $97.5M-$127.6M Annual Operating Cost $0 $8.8M-$9.8M $7.6M-$8.6M $8.5M-$9.5M Socioeconomic Total ROW Required (acres) Properties Impacted (number) Residential Relocations (number) Business Displacements (number) Public Parks Affected (number) Public Park Property Required (acres) Total Number of Public/Community Facilities Permanently Impacted Cultural Resources Historic Properties (acre) Natural Resources Stream Impact (linear feet) Year Floodplain (acres) Wetlands (acres) Forests (acres) Federally or State Listed RTE Species (number) Costs presented in 2016 dollars and as ranges developed using SHA estimating guidelines to account for currently unknown design and construction needs at this phase of the planning process. 2. Estimated Environmental Impacts are presented as ranges to account for the uncertainty associated with the preliminary infrastructure designs and the high-level environmental resource data used for this planning level analysis. ES-4 Public Involvement MCDOT maintains and regularly updates the county Bus Rapid Transit Project website to provide the public with information about the US 29 BRT Corridor Study: As part of approving the Montgomery County Planning Board s Countywide Transit Corridors Functional Master Plan (2013), the Montgomery County Council called for the formation of two CAC for the US 29 Corridor. One CAC group represents the southern portion of the study April 2017 ES-Page 12
23 corridor; the other group represents the north. The CACs give community residents and business owners/operators the opportunity to provide comments and make recommendations to the Study Team throughout the planning process. To date, nine CAC meetings have been held: US 29 South CAC Meeting #1 February 28, 2015 Meeting #2 March 31, 2015 Meeting #3 June 2, 2015 Meeting #4 September 10, 2015 Meeting #5 December 2, 2015 Meeting #6 May 24, 2016 Meeting #7 July 14, 2016 Meeting #8 September 26, 2016 Meeting #9 January 31, 2017 US 29 North CAC Meeting #1 February 28, 2015 Meeting #2 March 26, 2015 Meeting #3 May 28, 2015 Meeting #4 September 8, 2015 Meeting #5 December 1, 2015 Meeting #6 May 18, 2016 Meeting #7 July 20, 2016 Meeting #8 September 22, 2016 Meeting #9 February 2, 2017 Combined CAC Open House In addition to the above referenced CAC meetings, there was a combined South and North US 29 CAC Open House on February 1, Through the course of the CAC process, CAC members have participated in discussions on many topics relevant to the BRT Corridor Planning Process. Among the topics covered during the process were: The Project Development Process US 29 Existing Conditions Alternatives Selection Analysis Goals and Objectives Existing and Forecasted Transit Ridership Existing and Forecasted Traffic Operations Draft Preliminary Purpose and Need Conceptual Alternatives Development o Running way Options o Preliminary Service Plan o Preliminary Station Locations CAC meetings have included exercises and open discussions to spur questions and comments that contribute to project planning and the community s understanding of the project. Information regarding past and planned CAC meetings is maintained on MCDOT s BRT website at: April 2017 ES-Page 13
24 Additional public involvement and engagement with the CAC, associated with the public review of the Draft CSR, are detailed as part of the Next Steps. ES-5 Draft Corridor Study Report Comments A Draft CSR was made available for comment from January 19 through February 27, The Draft CSR and appendices, were made available, by link, on the project website: Written comments were to be submitted during the public review period by to US29BRT@mta.maryland.gov or mail to: Tamika Gauvin, Consultant Project Manager Maryland Transit Administration Office of Planning and Programming Suite 902, 6 Saint Paul Street, Baltimore, MD Following the comment period the project team developed this revised FCSR that addresses the comments received to the extent possible. The FCSR has been made available on the project website, provided above. ES-6 Next Steps After careful review of the traffic results, evaluation of the projected costs, and consideration of the input received from the public, MDOT and MCDOT agree that the alternatives under consideration as described in this report, both of which include repurposing general travel lanes for buses only or buses and other HOVs in the southern section, and reconstruction of the shoulders in the northern section, cannot be implemented within the timeframe desired and with the financial resources currently available. In light of these findings, MDOT is completing the without selecting an alternative. To address the immediate need for high-frequency, reliable transit, MCDOT will move forward with the implementation of a short-term project as outlined by the County Executive and submitted to USDOT as part of a TIGER Grant application in the spring of More details about the MCDOT project are available at The data and analysis contained within this, along with the public comments and feedback from other agency stakeholders, provide future planning teams valuable information for the continued study of operational improvements, such as potential managed lanes, on US 29. April 2017 ES-Page 14
25 ES-1 April 2017 ES-Page 15

26 ES-2 April 2017 ES-Page 16
27 ES-3 April 2017 ES-Page 17
28 ES-4 April 2017 ES-Page 18
 to evaluate a proposed Bus Rapid Transit (BRT) line along US 29 (Colesville Road/Columbia Pike) between the Silver Spring Transit")
29 1 Introduction The Maryland Department of Transportation (MDOT), through two of its business units, the Maryland Transit Administration (MTA) and the State Highway Administration (SHA), has partnered with the Montgomery County Department of Transportation (MCDOT) to evaluate a proposed Bus Rapid Transit (BRT) line along US 29 (Colesville Road/Columbia Pike) between the Silver Spring Transit Center and the Burtonsville Park and Ride in Montgomery County, Maryland. The intent of this Corridor Planning Study is to identify transportation needs and evaluate potential alternatives for accommodating enhanced transit service via BRT. These BRT alternatives are to be implemented within the existing curbs and right-of-way as much as possible. 1.1 What is Bus Rapid Transit? BRT is an innovative, high-capacity, and cost effective public transit solution that has been shown to significantly improve urban mobility in cities across the U.S. This integrated system uses specialized buses on roadways or dedicated lanes to quickly and efficiently transport passengers to their destinations, while Figure 1-1: Emerald Express, Eugene, OR offering the flexibility to meet transit demand (e.g. higher frequencies, all-day service, etc.). BRT systems can easily be customized to community needs and incorporate state-of-the-art technology that attracts more passengers and improves transit reliability. BRT stations typically include passenger shelters and loading platforms, level bus boarding, real-time bus arrival information, automated off-board fare collection, and site treatments such as pedestrian improvements, bike accommodations, landscaping and lighting enhancements. BRT vehicles are typically specialized buses with low floors that have multiple doors on both sides of the vehicle, increased passenger circulation and bicycle provisions, higher capacity through use of articulated buses, enhanced passenger amenities, and a unique brand identity. See Figures 1-1, 1-2, 1-3, and 1-4 throughout this section as examples of BRT in other cities. BRT service features stations that are spaced farther apart than local bus stops. Buses may operate in dedicated lanes reserved exclusively for BRT, or in shared travel lanes used by BRT April 2017 Page 1
 and special bus bypass lanes or queue jumps can provide buses travel enhancement options at intersections aimed at providing superior")
30 buses and other traffic. Infrastructure improvements like traffic signal priority (TSP) and special bus bypass lanes or queue jumps can provide buses travel enhancement options at intersections aimed at providing superior travel experience with potentially fewer congestionrelated delays. In cities where BRT has been implemented, it has been described as a bus that offers the convenience of rail transit with lower capital cost. 1.2 Bus Rapid Transit Planning in Montgomery County Montgomery County first proposed BRT as the most appropriate mode for improving transit in the corridor in the 1993 Strategic Transit Plan. Improvements to county transit systems have been proposed, discussed, and evaluated in several other county planning documents since then. Figure 1-2: RTA HealthLine, Cleveland, OH In 2011, MCDOT completed a Countywide Bus Rapid Transit Study, which provided an initial look at the possibility of BRT along several main county transportation routes, including US 29. The study was a proactive effort to explore transit improvements that could address the existing travel demand and the anticipated growth in overall (vehicle and transit) trips in Montgomery County. The study provided an overview of multiple study corridors with associated existing and future transit demand and recommended potential improvements for each. Acting upon the findings from the 2011 document and the recommendations for enhanced transit included in several other local area and sector plans, the Maryland-National Capital Park and Planning Commission (M-NCPPC) developed a Countywide Transit Corridors Functional Master Plan (CTCFMP). This plan was approved and adopted by the Montgomery County Council in December The CTCFMP proposes the development of a BRT network throughout the County to support the County s mobility, land use, and economic development goals. To ensure network integrity and achieve the County s vision, the document outlines recommendations and provides the basis for the rights-of-way reservations required to accommodate enhanced transit improvements (i.e., bus lanes, stations, roadway widening, etc.) in individual transit corridors. The CTCFMP also makes recommendations on the allocation of space for transportation system facilities related to motor vehicle traffic, transit, pedestrians, and bicycles. One of several April 2017 Page 2

31 corridors included in the CTCFMP is US 29 from the Silver Spring Transit Center to the Burtonsville Park and Ride. Figure 1-3: RTC, Las Vegas, NV Specific to US 29, the CTCFMP proposes the following recommendations, from north to south: Along US 29 from MD 198 to Stewart Lane, up to two additional dedicated lanes; Along Stewart Lane and Lockwood Drive, a mixed traffic operation; Along US 29 from Stewart Lane to Sligo Creek Parkway, dedicated lanes; Along US 29 from Sligo Creek Parkway to Georgia Avenue, a dedicated lane in the peakhour peak direction; and Along US 29 from Georgia Avenue to Sixteenth Street, dedicated lanes. CTCFMP Proposed Station Locations: Burtonsville Park and Ride Briggs Chaney Park and Ride US 29 and Fairland Road US 29 and Tech Road White Oak Transit Center Lockwood Drive and Oak Leaf Drive US 29 and Hillwood Drive US 29 and MD 193 US 29 and Franklin Avenue US 29 and Fenton Street Silver Spring Transit Center Table 1-1 summarizes the CTCFMP Proposed Dedicated Lanes, ROW, and Maximum Additional Transit Lanes: April 2017 Page 3
32 Table 1-1: CTCFMP Proposed Dedicated Lanes, ROW, and Maximum Additional Transit Lanes Road From To Dedicated Lane(s)? ROW** Maximum Additional Transit Lanes US 29 MD 198 Stewart Ln Yes Stewart Lane US 29 Lockwood Drive No 80 0 Lockwood Drive Stewart Ln New Hampshire Ave No 80 0 Lockwood Drive New Hampshire Ave US 29 No 80 0 US 29 Stewart Lane Lockwood Drive Yes US 29 Lockwood Dr Southwood Ave Yes US 29 Southwood Ave Sligo Creek Pkwy Yes US 29 Sligo Creek Pkwy Fenton St Yes* US 29 Fenton St Georgia Ave Yes* Colesville Road Georgia Ave East West Hwy Yes Colesville Road East West Hwy 16 th St Yes *The six existing general purpose lanes in these segments currently operate during peak hours as four in the peak direction and two in the off-peak direction; in off-peak hours, they operate as three lanes in each direction. This Plan recommends that the operation in peak hours there be a dedicated lane in the peak direction. **Reflects the minimum right-of-way, and may not include land needed for spot improvements such as turn lanes and stations. The US 29 corridor has been specifically identified as the implementation priority within the CTCFMP s proposed BRT network for the following reasons: 1. BRT will support fast paced growth in the county. With a current population of more than one million people, Montgomery County has the largest-growing population of any county in Maryland. Per US Census (2010), the County added more than 166,000 people between 2000 and The County is projected to add another 162,000 people between 2015 and 2040 according to the Metropolitan Washington Council of Governments (MWCOG), Household, Population and Employment Projection, Round 8.3. April 2017 Page 4

33 2. Planned White Oak development in the corridor will create additional vehicle trips that will increase congestion and could be addressed with high quality transit options. 3. Existing traffic challenges could be addressed with BRT by providing additional transportation options. 4. Silver Spring Transit Center provides a multi-modal hub link to get to downtown Washington, D.C. (DC) via Metrorail and other bus routes. 5. The corridor has an existing strong transit market with robust bus ridership. BRT transit services could enhance the quality of life for over 146,000 people who live within the US 29 Study Area. Figure 1-4: Metro Liner, Los Angeles, CA April 2017 Page 5
34 Corridor Snapshot Two regional activity centers, Silver Spring and White Oak, serve as an engine for activities and travel in the Study Area Strong employment growth in these two regional activity centers is forecasted for 2040, with a growth of almost 80 percent over current levels Trips traveling through the study area (i.e., not originating from the study area) represent a significant share of travel market for the Study Area, with approximately 40 percent of total trips expected in 2040 DC is a major destination of commuter trips from the Study Area, with approximately 20,000 trips commuting from US 29 to DC Another major DC-bound commuting flow of approximately 10,000 trips originates from Howard County Severe congestion exists at several locations along the US 29 corridor and is forecasted to exacerbate in the future 2040 condition The Study Area has a strong transit market, including an average weekday daily Metrorail boardings of approximately 13,000 for Silver Spring Station and more than 15,000 boardings for the Metrobus Z line buses, Ride On buses, and MTA commuter buses Provides convenient and reliable connections to other transit systems, including local Ride On and Metrobus service, Metrorail Red Line, and the future Purple Line light rail April 2017 Page 6
35 2 Existing and Forecasted 2040 Conditions This section compiles and summarizes information collected to reflect existing and forecasted future transportation infrastructure, socio-economic conditions, and land uses. 2.1 Study Area and Study Corridor This study focuses on US 29 in eastern Montgomery County, MD and the surrounding communities, employment areas, activity centers, and infrastructure facilities it serves. On a larger scale, Montgomery County is part of the DC metropolitan area, and US 29 is a major north-south highway within the National Highway System. As part of the National Highway System, US 29 is a vital transportation corridor that begins in Howard County, MD near Ellicott City and ends in Pensacola, FL. Within Maryland, US 29 is a multi-lane partially access controlled highway, where traffic flows are frequently separated by interchanges and dividing medians. US 29 is the westernmost north-south route between DC and the Baltimore area and provides a crucial link for the movement of people and freight. In order to provide an assessment of the existing features and needs of the transportation and community facilities in the area, the Study Team has identified two areas of focus that surround the segment of US 29 under investigation: the Study Area and the Study Corridor. The Study Area surrounds the Study Corridor and is defined for the purposes of evaluating travel demand, traffic patterns, community features, and socio-economic characteristics. The narrower Study Corridor is contained within the Study Area and is defined for the purposes of evaluating potential impacts to adjacent land uses, natural and cultural resources, existing infrastructure elements, and transportation operations and safety. The Study Area (see Figure 2-1) is an aggregate of Transportation Analysis Zones (TAZs) from the Metropolitan Washington Council of Governments/Transportation Planning Board (MWCOG/TPB) Regional Travel Demand Model and bounded by: The border of Montgomery County with Prince George s County on the east; The border of Montgomery County with Howard County on the north; The border of Montgomery County with District of Columbia on the south; and A study team generated border approximately one mile west of US 29, based on TAZs. TAZs are geographic areas commonly used in conventional transportation planning models. The size of each zone may vary, depending on the policies and procedures of the metropolitan planning organization, but are typically generated to define an area occupied by approximately 3,000 people. These TAZs often include US Census based data on socio-economic April 2017 Page 7
36 characteristics, employment, number of households and household income, and number of vehicles to compute existing and forecasted trips. The 14-mile Study Corridor, including mainline US 29 from the Silver Spring Transit Center to the Burtonsville Park and Ride (approximately 10 miles) and the spurs on Lockwood Drive/Stewart Lane (approximately two miles) and Briggs Chaney Road/Castle Boulevard (two miles) (see Figure 2-1) is comprised of the existing community and infrastructure features and facilities located within or adjacent-to the existing US 29 right-of-way for up to 200-feet on either side of the existing edge of pavement. The Study Corridor has a south terminus at the Silver Spring Transit Center and a north terminus at the Burtonsville Park and Ride, and includes spurs on Lockwood Drive and Stewart Lane and Briggs Chaney Road and Castle Boulevard. The Study Corridor intersects with arterial roadways such as University Boulevard (MD 193), New Hampshire Avenue (MD 650), East Randolph Road/Cherry Hill Road, Fairland Road, Spencerville Road/Sandy Spring Road (MD 198), and freeways such as I-495 and MD 200. A new interchange is proposed at Fairland Road/Musgrove Road and is planned in the 2014 CLRP. However it is currently on hold. There are several other potential interchanges proposed within the Study Corridor. However they are not included for funding in the CLRP at this time (See Figure 2-1). April 2017 Page 8

37 2-1 April 2017 Page 9
38 2.1.1 Land Use US 29 within the Study Area serves as the spine that links the residential communities from Silver Spring to Burtonsville, with the regional activity and growth generators at Silver Spring and White Oak. Additional significant activity centers that are a short distance away include DC, and Howard County. US 29 and the existing transit services in the Study Corridor offer quality service to their users. There are local bus services that serve shorter-distance trips with frequent stops, and there are commuter transit services providing mostly for peak hour commuting patterns with fewer stops. There is growing concern that these existing services may not meet needs of the riders travelling within and through the Study Corridor as the area continues to change and grow. Residential communities are located throughout the Study Area (see Figure 2-2). There is a mixture of low, medium, and high density residential areas, with concentrations of high density residential development near Briggs Chaney Road, New Hampshire Avenue (MD 650), and in downtown Silver Spring. Four Corners, Fairland, Burtonsville, and White Oak are just a few of the 14 well established residential communities in the Study Corridor. Commercial and institutional land uses are also dispersed throughout the corridor. Some industrial uses are located in the northern half of the Study Corridor near Industrial Parkway and Tech Road. A summary of land use types and corresponding acreages within the Study Corridor and Study Area are provided in Table 2-1. Table 2-1: Land Uses and Acreage Within Study Corridor and Study Area Land Use Type Area (Acreage) within Study Corridor Area (Acreage) within Study Area Low Density Residential 23 2,530 Medium Density Residential 132 6,581 High Density Residential 106 2,016 Commercial Industrial Institutional 33 1,339 Transportation Open Urban Land Agriculture/Forest 63 4,446 Water/Wetlands 4 76 Source: Maryland Department of Planning and SHA April 2017 Page 10

39 2-2 April 2017 Page 11
40 The commercial/retail uses are concentrated near the Silver Spring Transit Center, White Oak, and Burtonsville. White Oak and Silver Spring are regional activity centers expected to drive growth in the area, as envisioned by the White Oak Science Gateway Master Plan and the Silver Spring Central Business District (CBD) Sector Plan approved and adopted by the M-NCPPC. The White Oak Science Gateway Master Plan covers nearly 3,000 acres and envisions development that includes the existing U.S. Food and Drug Administration (FDA) Headquarters and Research Center, a Life Sciences/FDA Village, and the Hillandale Community. The Silver Spring CBD Sector Plan envisioned and laid the foundation for much of the development that has happened in the CBD. Downtown Silver Spring is home to Discovery Communications, the National Oceanic and Atmospheric Administration, and numerous retail, civic and entertainment venues that were envisioned for its revitalization and new development. The Sector Plan also drives the vision for future development Population, Jobs, and Income In 2014, population in the Study Area was estimated at 119,500 according to the MWCOG/TPB. Of those living in the corridor, the nearly 62 percent are minorities and five percent of the households in the Study Area are considered low-income and living below the poverty line according to 2010 decennial US Census Data. The MWCOG/TPB estimates the 2014 number of households at 52,100 and employment at 67,400 jobs in the Study Area. The activity centers at White Oak and Silver Spring are expected to drive future growth in the Study Area. Based on the 2010 US Census, as well as more recent 2015 American Community Surveys, Maryland has the highest median household income in the country. The most recent 5-yr estimate is $72,483. Montgomery County is the second wealthiest county within the state, with a median household income of $98,326. The percentage of the population living below poverty for the state and the county are ten percent and seven percent respectively. The average median household income in the Study Area is $95,292, which is about three percent lower than the County s median income. The percentage of the population living below poverty in the Study Area is five percent, which is two percent less than the County s overall population living below poverty. There are concentrations of the population with the highest median household incomes in the northwest portion of the Study Area and northern Silver Spring in the vicinity of US 29 and University Boulevard (MD 193). The areas with the lowest median household incomes are located in the northeast section of the Study Area, as well as the southern portion of the Study Area near downtown Silver Spring. April 2017 Page 12
41 2.1.3 Corridor Travel Patterns Study Area Daily Trip Patterns Potential travel markets for the proposed US 29 BRT depend on major travel patterns related to the US 29 BRT Study Area 1. To facilitate discussion of travel patterns, regional districts were defined for areas of the TPB model region (see Figure 2-3), with a detailed focus on Montgomery County, including the five Montgomery districts (I-270 West, I-270 East, MD 97, US 29, Inside Beltway), the District of Columbia, Columbia/Ellicott City, Rest of Maryland, and Virginia. Figure 2-4 highlights the major worker flows which are a significant segment of the potential markets for the US 29 BRT, based on the Census Transportation Planning Products (CTPP) compiled by Federal Highway Administration (FHWA). Similarly, Figure 2-5 displays the major flow patterns of outbound person trips from a home or non-home location, based on the 2014 TPB/MWCOG model results, while Figure 2-6 shows the forecasted 2040 flow patterns. Major travel patterns shown in the following tables and figures can be summarized in terms of potential markets for the proposed US 29 BRT as follows: 137,000 Internal trips within the US 29 Study Area represent a significant share of travel market for the study area, or 37 percent of total trips of the study area in 2014; Internal trips are expected to increase by 29 percent in between 2014 and 2040; DC-bound commuting trips were a major out-flow of trips from the study area, with 19,500 residents in the study area commuting to DC for work, based on the CTPP; Another major DC-bound commuting flow of approximately 10,000 trips were from Columbia and Ellicott City areas north of the US 29 BRT Corridor, some of which can use US 29 as a commuting route to DC; A smaller number of workers also commuted to work in the study area from Columbia and Ellicott City areas (3,400) and DC (4,000); and Major trip flows from the model results for 2014 and 2040 show patterns similar to the commuting flows described above. Trips to the study area were forecasted to increase significantly because of strong employment growth, for example, by 29 percent from Columbia and Ellicott City areas and DC. 1 The US 29 BRT Draft Preliminary Purpose and Need, (December 2015) includes additional information on travel patterns in the Study Area. Tables 2.4 and 2.5 show the district-level flows of daily person trips for 2014 and 2040, respectively, based on the MWCOG/TPB Version model results. April 2017 Page 13

42 Figure 2-3: Regional District Definition April 2017 Page 14

43 Figure 2-4: Worker Commuting Flows ( ) Data Source: CTPP. Note that internal flows are not included. April 2017 Page 15
44 Figure 2-5: Travel Patterns Person Trips (2014) Data Source: TPB/MWCOG Model for These trips are outbound trips from a home or a non-home location and include return trips. April 2017 Page 16
45 Figure 2-6: Travel Patterns Person Trips (2040) Data Source: TPB/MWCOG Model for These trips are outbound trips from a home or a non-home location and include return trips. April 2017 Page 17
46 2.2 Transit Conditions Existing Transit Services One of the key assets of the US 29 Corridor Study Area is its existing transit services. Montgomery County Ride On, Washington Metropolitan Area Transit Authority (WMATA) Metrobus Z-line bus, and the MTA Commuter Bus operate in the corridor. WMATA provides Metrorail Red Line service at the Silver Spring Station, which is near the recently completed Silver Spring Transit Center. The Transit Center serves as a hub for the Metrorail, MARC, Ride On, Metrobus, and local shuttle services. It is also a future stop for the planned Purple Line Light Rail, scheduled to be completed in The MTA MARC Brunswick Commuter Rail Line stops in Silver Spring are less than a block away from the Metrorail station. Understanding the transit services as they operate and perform today provides insight into the challenges that exist for the future. See Figure 2-7 for the transit services in the US 29 Study Area Montgomery County Ride On Bus Table 2-2 provides a summary of the Montgomery County Ride On bus service that covers portions of the US 29 BRT Study Corridor Area. Four of the routes, the 8, 9, 10, and 14 generally make frequent, all day stops within the corridor and operate at headways ranging from minutes. Routes 13, 21 and 22, operate on a limited peak period schedule with headways ranging from minutes, providing service during weekday morning and evening peak travel times with no mid-day/off peak service. Table 2-2: Montgomery Ride On Bus Services Summary Bus Routes From To Route 8 Route 9 Silver Spring Transit Center Silver Spring Transit Center Headway Peak Headway Off-Peak Wheaton min 30 min Wheaton min min Route 10 Twinbrook Hillandale min min Route 13 Route 14 Route 21 Route 22 Silver Spring Transit Center Franklin Avenue Silver Spring Transit Center Silver Spring Transit Center Takoma min n/a Silver Spring 5-20 min n/a Briggs Chaney Park and Ride min n/a Hillandale min n/a Span of Service Weekday (5:50am 8:31pm) Saturday (7:15am 7:46pm) Weekday (4:46am 10:58pm) Weekend (6:30am 9:55pm) Weekday (4:39am 11:07pm) Weekend (6:39am 11:08pm) Weekday (5:50am 7:45pm) No Mid-Day Service Weekday (5:50am 7:45pm) Weekend (7:31am 7:01pm) Weekday (5:36am 7:58pm) No Mid-Day Service Weekday (5:45am 7:25pm) No Mid-Day Service Source: Montgomery County Ride On Data, 2015/2016/2017 April 2017 Page 18

47 2-7 Sources: WMATA Metrobus, Ride On, MTA. April 2017 Page 19
48 Metrobus Several Metrobus Z-line buses serve the US 29 Corridor and the rest of the Study Area. These Z- line buses are mostly weekday services, except for Z8. Several are peak services only, including Z2, Z9/Z29, and Z11/Z13. The Z2, Z6, and Z8 lines provide all day local service, while Z9/Z29 and Z11/Z13 provides limited stop express service with no off-peak services. Most buses run on headways of six to 15 minutes, as summarized in Table 2-3. The Z-lines serve the area between Silver Spring Transit Center and Lockwood Drive/New Hampshire Avenue and offer a combined average service headway of 10 minutes in the a.m. peak period (6 a.m. to 9 a.m.) and six to seven minutes in the p.m. peak (4 p.m. to 7 p.m.). The combined average service headway declines farther north; 15 minutes in the a.m. and eight-and-a-half minutes in the p.m. from Lockwood Drive/New Hampshire Avenue to US 29 and Industrial Parkway, and 30 minutes north of Industrial Parkway. The Study Corridor is a portion of WMATA s Colesville Road/Columbia corridor, which is a part of WMATA s Priority Corridor Network (PCN). WMATA has a set of strategies for improving bus service travel times, reliability, capacity, efficiency, and system access along this corridor. As part of the PCN initiative, WMATA recently conducted the Metrobus Z-line Study. The Metrobus Z-line Study made a series of short, medium, and long-term recommendations for service, bus operations, traffic operations, and passenger facility improvements. Proposed improvements ranged from modifying span of service (additional weekday and weekend service), adding stop amenities (trashcans, benches, etc.), and implementing traffic signal optimizations to providing new limited stop express service routes. More details from the Metrobus Z-line Study are available on-line at: Table 2-3: WMATA Metrobus Services Summary Bus Routes Z2 Z6 Z8 Z11, Z13 Z9, Z29 From Silver Spring Transit Center Silver Spring Transit Center Silver Spring Transit Center Silver Spring Transit Center Silver Spring Transit Center To Headway Peak Headway Off-Peak Olney 6-15 min n/a Burtonsville Park and Ride Greencastle Park and Ride Greencastle Park and Ride Greencastle Park and Ride 5-15 min min 6-15 min min 6-15 min n/a 6-15 min n/a Span of Service Weekday (5:32am 8:06pm) No Mid-Day Service Weekday (4:55am 10:24pm) Weekend (5:45am 10:40pm) Weekday (4:50am 2:19am) Weekend (4:54am 1:24am) Weekday (5:18am 8:13pm) No Mid-Day Service Weekday (5:20am 7:18pm) No Mid-Day Service Source: WMATA Data, 2015 April 2017 Page 20

49 Metrorail The Silver Spring Metrorail Red Line Station (Figure 2-8) is located at the south end of the Study Area. The other Metrorail stations close to the Study Area include Forest Glen, Glenmont, and Wheaton. The Red Line is the busiest Metrorail line running through downtown DC and connecting Montgomery County and downtown DC. The U-shaped Red Line alignment is approximately 31.9 miles long from Shady Grove to Glenmont and crosses perpendicular to the US 29 Study Area on the east leg of its rail alignment. As shown in Table 2-4, the Red Line has frequent service during the weekday rush hours, and it provides reasonably frequent services during off-peak hours and weekends. It does not, however, run through the entire Study Area. Figure 2-8: Silver Spring Metrorail Station Table 2-4: WMATA Metrorail Service Summary Headways Weekday AM Peak Midday PM Peak Evening Late Night Monday to Friday 3-6 min 12 min 3-6 min 6-10 min min Weekend Daytime Late Night Saturday 12 min 15 min Sunday 15 min 15 min Source: WMATA Data, 2015 April 2017 Page 21
50 MTA Commuter Services: Bus and MARC MTA provides commuter bus services between Columbia/Ellicott City and DC, including Routes 305, 315, and 325, as show in Table 2-5. These commuter buses operate in the peak direction during peak periods, with 20-minute headways. In the southbound direction, Route 305 and 315 typically pick up passengers in Howard County and at the Burtonsville Park and Ride and discharge passengers at only two locations in the Study Area at Fenton Street, and the Silver Spring Metrorail Station. The commuter bus does not provide service for trips originating in between Silver Spring and Burtonsville. Routes 201 and 202 run on US 29 between Burtonsville Park and Ride and the Intercounty Connector (ICC/MD 200). Table 2-5: MTA Commuter Bus Services Summary Bus Routes From To Headway Peak Headway Off-Peak Route 305 Columbia Mall DC (Library of Congress) About 20 min n/a Route 315 Route 325 Route 201 Lotte Plaza in Ellicott City Harper's Farm Village Center in Columbia Gaithersburg Park and Ride Silver Spring and DC (Navy Yard) Silver Spring and DC (Library of Congress) BWI Marshall Airport and MARC/Amtrak Rail Station About 20 min About 20 min About 60 min Route 202 Gaithersburg DOT/Ft. Meade About 60 min n/a n/a About 60 min About 60 min Span of Service Weekday (5:08am 9:01am and 1:45pm - 8:13pm) No Mid-Day Service Weekday (5:16am 8:47am and 3:32pm 7:27pm) No Mid-Day Service Weekday (6:26am 8:41am and 4:05pm 6:02pm) No Mid-Day Service Weekday (4:35am 6:35pm) Weekend (4:32am 6:32pm) Weekday (5:10am 6:33pm) Source: MTA Data, 2015 The MARC Brunswick Line provides service between DC and Martinsburg, West Virginia. Nine inbound trains stop at the Silver Spring station in the morning and nine outbound trains stop at the Silver Spring station in the afternoon and evening, Monday through Thursday. On Fridays, there is an additional outbound train. Like the Commuter Bus, the MARC trains are focused on serving daily commuters, providing limited service, in the Study Area Transit Usage As illustrated by the figures and services described above, the Study Area has a strong transit market. The magnitude of the existing transit ridership by different modes and providers is shown in Table 2-6, and includes the following: April 2017 Page 22
51 With a daily ridership of approximately 13,200, Silver Spring Station is one of the top suburban stations for the Metrorail system. By comparison, nearby Forest Glen and Wheaton Metrorail stops serve 2,440 and 4,230 riders, respectively. The combined daily ridership of the Metrobus Z-line Buses, Ride On Buses, and MTA Commuter Buses totals 15,000, with approximately 11,400 on the US 29 Corridor. Metrobus Local services Z6 and Z8 carry the largest ridership on the US 29 Corridor, accounting for nearly 65 percent of the Metrobus ridership in the corridor. Transit travel patterns indicate the strongest transit market is on the southern portion of the US 29 corridor. The heaviest concentration of inbound boardings (passengers getting on buses) is within White Oak along Stewart Lane and Lockwood Drive and the heaviest concentration of inbound alightings is south of New Hampshire Avenue at Lockwood Drive. Outbound, the boardings are heavily concentrated in the line segment between Silver Spring and New Hampshire Avenue and Lockwood Drive, while the alightings (passengers getting off buses) are heavily concentrated along Stewart Lane and Lockwood Drive. The stops with the most boardings and alightings are between New Hampshire Avenue and Lockwood Drive and Silver Spring, and include Silver Spring Station, New Hampshire Avenue and Lockwood Drive, MD 193 (University Boulevard), and Spring Street. Other active stops include Tech Road, Castle Boulevard, the Briggs Chaney Park and Ride, and Burtonsville Park and Ride. Transit load profiles show a predominant concentration of transit rider volumes in the southern portion of the US 29 corridor and a large increase in loads along Stewart Lane and Lockwood Drive. Transit activity within the Study Corridor is illustrated in Figures 2-9a and 2-9b, below. April 2017 Page 23
52 Average Daily Boardings Figure 2-9a: 2015 Average Daily Weekday Boardings for Northbound and Southbound WMATA Stops Within the Study Corridor Figure 5a: 2015 Peak Average Daily Weekday Boardings for Northbound and Southbound WMATA Stops on US Source: 2015 WMATA APC data for Routes Z2, Z6, Z8, Z9/29, Z11/ ,200 1, WMATA Stops within Study Corridor Northbound.NB Trendline Southbound. SB Trendline April 2017 Page 24
53 Average Daily Boardings Figure 2-9b: 2015 Average Daily Weekday Boardings for Northbound and Southbound Ride On Stops Within the Study Corridor Source: 2015 Ride On data for Routes 8, 9, 10, 21, Ride On Stops within Study Corridor Northbound.NB Trendline Southbound. SB Trendline Figure 5b: 2015 Peak Average Daily Weekday Boardings for Northbound and Southbound Ride On Stops on US 29 April 2017 Page 25
54 Table 2-6: Average Existing Daily Boardings Operator Station/Route Name Daily Boardings WMATA Metrorail Silver Spring 13,200 Forest Glen (outside study area) Wheaton (outside study area) 2,440 4,230 Z2 850 Z6 3,330 WMATA Metrobus Z8 3,920 Z9/ Z11/13 1, Montgomery Ride On MTA Source: Metrorail: Year Historical Metrorail Ridership. Metrobus: 16-JUL-14 Washington Metropolitan Area Transit Authority (WMATA) Ridership by Route and Stop. Ride On Bus: FY13 Montgomery County US 29 Boarding and Alighting Data. MTA: Feb 2015 MTA Average Ridership Transit-Dependent Populations Transit dependent populations are often found in areas with lower income and minority populations. Minority populations include persons who identify themselves as Black or African-American, Asian, American Indian/Alaskan Native, Native Hawaiian/Pacific Islander, Other, Two or More Races, or any person of Hispanic descent. Areas of low-income populations include Census Block Groups with a meaningfully greater percentage of persons living below the federal poverty level than that of a greater geographic region. U.S. Census data is used in determining areas with significant minority or low-income populations, also referred to as potential environmental justice populations. Environmental justice is the terminology used to describe the fair treatment and meaningful involvement of all April 2017 Page 26
55 people regardless of race, faith, national origin, or income with the respect to development, implementation, and enforcement of environmental laws, regulations, and policies. Consistent with MDOT/SHA s guidelines, potential environmental justice lower income areas are Block Groups with the percentage of persons living below poverty greater than or equal to that of Montgomery County. Potential environmental justice minority populations are Block Groups with a meaningfully greater percentage of minorities than the averages located within Montgomery County. (See Figure 5-7 later in this document for details) Based on the 100 percent count data from the 2010 U.S. Census, 48 of the 99 Block Groups within the project vicinity have potential environmental justice populations. Based on the U.S. Census American Community Survey Estimates, 19 of the 99 Block Groups are potentially low-income populations. The Block Groups with potential minority populations are concentrated immediately along either side of US 29, north of New Hampshire Avenue (MD 650), as well as the southern portion of the Study Area near downtown Silver Spring. The Block Groups with potential low-income populations are dispersed throughout the Study Area with the only concentration just northeast of the US 29/ICC (MD 200) interchange. Twelve percent of the study area population is 65 or over and 23 percent of the population is under 18 years old. Six percent of the Study Area s population is disabled. Silver Spring, White Oak, and Fairland communities have populations with 10 percent of the population disabled. Twelve percent of the households in the study area do not have access to a personal motor vehicle. (See Figure 3-1 later in this document for more details) 2.3 Existing Roadway Conditions and Traffic Operations Roadway Characteristics The roadway classification of US 29 changes from a principal arterial with traffic signals in the southern portion of the BRT corridor around Silver Spring and White Oak to a limited-access highway in the northern portion of the BRT corridor around Fairland and Burtonsville. The typical cross section along the US 29 corridor varies between four-lane, five-lane, and sixlane sections with additional turn and merge/diverge lanes. A reversible-lane segment extends approximately one mile from the MD 97 (Georgia Avenue) intersection to just south of the Sligo Creek Parkway intersection. This section, south of Sligo Creek Parkway, is undivided, while the section north of Sligo Creek Parkway is divided using a combination of curb and grass medians, with breaks at intersections along the US 29 corridor. April 2017 Page 27


56 Figure 2-10a: US 29 at Wayne Ave/2 nd Street Looking North Figure 2-10d: US 29 at MD 193 Looking North Figure 2-10b: US 29 at Fenton Street Looking North Figure 2-10e: US 29 at Cherry Hill Rd/Randolph Rd Looking North Figure 2-10c: US 29 at Sligo Creek Parkway Looking North Figure 2-10f: Lockwood Drive at Oak Leaf Drive Looking North April 2017 Page 28
57 Along the US 29 BRT Study Corridor, there are six interchanges, 23 signalized and 22 unsignalized intersections, and numerous driveways. Some segments of the roadway include shoulders, medians, sidewalks, and curb and gutter that vary in design and utilization along the route. Utility poles and light poles are scattered throughout the corridor. Along Briggs Chaney Road/Castle Boulevard, there are five signalized and on unsignalized intersections, and numerous side street and driveway access points. Most of Briggs Chaney Road is four lane divided, closed section roadway, with posted speed limits of 35 mph. Castle Boulevard is a two lane undivided, closed section roadway with a center turn lane and posted speed of 30 mph. Along the Lockwood Drive/Stewart Lane segment, there are two signalized and 15 unsignalized intersections, and numerous driveways. This does not include the two intersections at US 29/Lockwood Drive and US 29/Stewart Lane that were counted in the section above. Some segments of this roadway also include shoulders, sidewalks, and curb and gutter. Street parking is present in the northbound and southbound directions along Lockwood Drive and Stewart Lane where shoulders are provided. Utility and light poles are located within the right-of-way. South of MD 650, US 29 has posted speeds of 30 to 45 mph. North of MD 650, US 29 has posted speeds of 45 to 55 mph. The posted speed limit along the Lockwood Drive/Stewart Lane segment is 30 mph. Four overpasses cross over US 29. Three are grade-separated roads and one is a rail line (see Figure 2-1 above). These four overpasses have column support structures in the median of US 29. In addition, three grade-separated roads pass under US 29. All intersections along the Lockwood Drive/Stewart Lane corridor are at-grade Existing Structures Inventory and Condition Summary SHA inspection reports and plans for 17 bridge structures were reviewed to determine if there are any potential concerns for utilizing existing inside or outside shoulders as a dedicated BRT lane. In general, the Study Team found that none of the structures have any load restrictions and many issues identified in the inspection reports are minor and are to be resolved with repairs as part of regular maintenance efforts. If dedicated BRT lanes/shoulders are ultimately pursued, additional studies may be required to determine whether a proposed dedicated BRT lane would result in the addition of a designated traffic lane on the bridge or whether modification of the shoulders could negatively impact the vertical clearance under a bridge or the slope of the roadway embankment. The structures reviewed are listed below. (All bridge numbers with an X are pipe structures): April 2017 Page 29
58 Bridge No X01 US 29 over Drainage Ditch; year built unknown Bridge No X01 US 29 over Tributary (Trib) to Little Paint Branch; year built unknown Bridge No X01 US 29 over Trib to Little Paint Branch; built in 1956 Bridge No X01 US 29 over Trib to Little Paint Branch; built in 1956 Bridge No X01 US 29 and RPS PA; MC over Drainage Ditch; built in 2004 Bridge No X01 US 29 over Drainage Ditch; built in 2003 Bridge No US 29 over Northwest Branch; built in 1920, widened in 1931 and 1961 Bridge No US 29 over Sligo Creek; built in 1936,widened in 1972 Bridge No US 29 over MD 650; built in 1954, re-decked in 1982 and 1994 Bridge No US 29NB over Paint Branch; built in 1957, re-decked in 1990 Bridge No US 29SB over Paint Branch; built in 1957, re-decked in 1990 Bridge No US 29 over I-495; built in 1959, reconstructed in 2004 Bridge No MD 29A over US 29 Ramp E; built in 2006 Bridge No US 29NB over MD 198; built in 2002 Bridge No US 29SB over MD 198; built in 2002 Bridge No Briggs Chaney Road over US 29; built in Roadway Operations The US 29 BRT Study Corridor is approximately 10 miles in length with an additional 2-mile segment of BRT along Lockwood Drive/Stewart Lane, and a 2-mile segment on Briggs Chaney Road/Castle Boulevard. The Average Daily Traffic (ADT) along the US 29 Study Corridor ranges from 39,600 vehicles south of Fenton Street to 79,400 vehicles north of Crestmoor Drive. The peak direction of traffic flow is southbound during the AM peak and northbound in the PM peak Roadway Congestion and Safety Roadway congestion presents a daily reminder of the high levels of activity that define this corridor, and the congestion is anticipated to worsen as growth and economic development continue to expand in the corridor and the region. Several roadway sections in the US 29 corridor exceed their volume to capacity ratio to the point that they are considered as unstable and Breakdown flow sections. There are six roadway sections that operate at Level of Service 2 (LOS) F and nine that are at LOS E (See Figure 2-11 below, for more details on 2 Level of Service is a traffic analysis tool used to communicate the operational integrity of roadway segments and intersections. Similar to school grading systems, LOS grade of A through C are considered acceptable operations with little to no delay. Grades of D, E, and F are signs of poor traffic operations that show potentially long delays and congestion. April 2017 Page 30


59 existing LOS). These grades represent very poor existing traffic operations for the corridor that lead to extended and more variable travel times and vehicles detouring to other facilities. Figure 2-11: Level of Service Grades A to F Shows How Intersections and Roadway Segments are Graded Based on Operational Capacity to Process Traffic Demand The US 29 corridor is characterized by variable traffic volumes and associated congestion (depending on location within the corridor) that hinders bus mobility and results in unpredictable service and travel times. This is especially true in the southern section near downtown Silver Spring, which has a denser urban fabric and narrower right-of-way. This congestion also frequently causes existing Metrobus and Ride On bus services on US 29 to operate behind schedule. Table 2-7 below shows the existing 2015 ADT along the corridor at major crossroads. April 2017 Page 31
60 Table 2-7: Existing 2015 ADT Roadway Sections (North to South) Sandy Spring Road (MD 198) to Cherry Hill Road/E. Randolph Road Cherry Hill Road/E. Randolph Road to New Hampshire Avenue (MD 650) New Hampshire Avenue (MD 650) to University Boulevard (MD 193) University Boulevard (MD 193) to Capital Beltway (I-495) Capital Beltway (I-495) to Georgia Avenue (MD 97) Source: 2015 Existing Data from Vehicle counts Existing ADT (vehicles/day) Lowest - Highest 70,900 73,700 59,800 71,600 65,500 79,400 74,000 39,600-65,200 A preliminary review of the corridor congestion was collected from the Regional Integrated Transportation Information System (RITIS) for the two selected peak hours, 8:00-9:00 am and 5:00-6:00 pm, and averaged over the entire 2015 year for a typical Tuesday, Wednesday, and Thursday. Shown below in Figures 2-12 and 2-13 provides peak hour Travel Time Indices (TTI) for the morning and afternoon peaks. TTI refers to the travel time as a percentage of the ideal travel time. This means the actual travel time under congested conditions is divided by the free-flow travel time for an estimate of the proportional time increase. In other words, TTI value of 2 means it will take twice as long to travel through the segment compared to the free flow conditions. Note that the color designations on the TTI maps shown below do not represent LOS, which will be shown in later sections of this report. Figure 2-12 shows congestion concerns for US 29 southbound in the morning peak hour, starting from Cherry Hill Road/E. Randolph Road and extending to MD 193 with a 2.5 TTI. Additionally, Figure 2-13 shows traffic approaching Silver Spring downtown area experiences some delays, in both northbound and southbound directions. In the afternoon peak hour, congestion delays were noted throughout the US 29 corridor. The average congestion appears to be above a 1.3 TTI (yellow) with only spot locations operating between TTI (green). The southbound direction of US 29 in Silver Spring also operates poorly while the northbound US 29 corridor has a larger number of segments above 1.6 TTI (orange and red). More details on TTI calculations are provided in the US 29 BRT Draft Preliminary Purpose and Need Document (December 2015). April 2017 Page 32

61 Figure 2-12: 2015 Morning Peak Hour Congestion Map in TTI Burtonsville Silver Spring Source: RITIS.org, 2015 Figure 2-13: 2015 Afternoon Peak Hour Congestion Map in TTI Burtonsville Silver Spring Source: RITIS.org, 2015 April 2017 Page 33
62 2.3.5 Existing Intersection Level of Service Intersection LOS is calculated based on approach vehicular delays and is measured in seconds of delay per vehicle (sec/veh). The approach delays are weighted based on vehicular volumes and added to provide a total intersection delay, which is then translated to a LOS grade based on the latest 2010 Highway Capacity Manual (HCM). As summarized in Table 2-8, a review of the US 29 operational results indicates that two intersections operate at LOS F, defined as delay greater than 80 sec/veh, under existing 2015 conditions: one in the AM peak hour (Tech Rd) and one in the PM peak hour (MD 650 at Lockwood Dr). Additionally, four intersections operate at LOS E with delays between 55 and 80 sec/veh), one in the AM peak hour (Greencastle Rd) and three in the PM peak hour (Dale Dr, Briggs Chaney Rd at Castle Blvd, and MD 198 at Old Columbia Pike). This happens in the PM peak hour for three out of the four intersections (see US 29 BRT Draft Preliminary Purpose and Need (December 2015) for more details). Table 2-8: Existing 2015 Intersection LOS US 29 Mainline Intersections (Associated Side-street Intersections) 2015 AM 2015 PM Delay (sec/veh) LOS Delay (sec/veh) LOS US 29 at Bonifant St 6.7 A 14.4 B US 29 at Wayne Ave 24.2 C 32.9 C Colesville Rd at Wayne Ave/2nd Ave 36.6 D 53.6 D US 29 at Fenton St 15.0 B 26.8 C US 29 at Spring St 26.0 C 44.2 D US 29 at Dale Dr 23.9 C 70.4 E US 29 at Sligo Creek Pkwy 30.5 C 44.0 D US 29 at Franklin Ave 18.6 B 14.2 B US 29 at MD 193 (South) 32.4 C 35.9 D MD 650 at Lockwood Dr 51.7 D F US 29 at Stewart Ln 14.3 B 20.5 C US 29 at Industrial Pkwy 15.6 B 48.1 D US 29 at Tech Rd 87.4 F 42.8 D US 29 at Randolph Rd 39.4 D 40.6 D Randolph Rd at Old Columbia Pike 32.1 C 29.0 C Fairland Rd at Old Columbia Pike 44.3 D 37.2 D Briggs Chaney Rd at Castle Blvd 34.4 C 57.4 E US 29 at Greencastle Rd 72.5 E 48.8 D US 29 at MD C 35.2 D MD 198 at Old Columbia Pike 40.8 D 67.9 E Old Columbia Pike at National Dr 4.3 A 11.7 B Source: SHA, 2015 Existing Data from Vehicle counts. April 2017 Page 34
63 2.3.6 Crash Rates Coinciding with high levels of roadway congestion, corridors like US 29 often experience safety issues. There is evidence that congested roadways frequently experience higher than average crash rates than similar types of facilities that are less congested. The segment of US 29 between MD 97 and Spring Street was identified as having a crash rate significantly higher than statewide average for similar state-owned roadways. A total of 1,088 crashes were reported along the US 29 corridor during the three-year study period from 2011 to Three (3) crashes resulted in three (3) fatalities. Four hundred forty-seven (447) of the crashes resulted in injuries to 649 vehicle occupants. There were 24 incidents involving pedestrians and/or bicyclists. Additional details related to reported crashes along US 29 are provided in Table 2-9. Table 2-9: US 29 Crash Data Summary Roadway Sections (North to South) 3-year Crash Rate per Mile Primary Crash Types MD 97 to Spring Street Includes portions of US 29 south of MD (above statewide average for similar facilities) Sideswipe, pedestrian, property damage, and parked vehicles Spring Street to MD 193 (University Boulevard) 182 Rear end and Sideswipe MD 193 (University Boulevard) to Lockwood Drive 117 Opposite Direction Lockwood Drive to Stewart Lane 103 Injury, Left Turn and Night time Stewart Lane to Musgrove Road 95 Injury, Left Turn, Angle, and Night Time Musgrove Road to MD 198 (Sandy Spring Road) 64 Night Time April 2017 Page 35
64 3 Preliminary Purpose and Need 3.1 Identified Corridor Problems and Issues This chapter identifies the existing and future transportation needs in the US 29 Study Area that a BRT project could potentially address. The Study Team has designated the Purpose and Need as preliminary. It is intended to provide the initial foundation for the official, agency supported, Purpose and Need statement as the project moves into a future development phase as part of the federal National Environmental Policy Act (NEPA) approval process. For more details please see the Draft Preliminary Purpose and Need document. Four specific preliminary needs for the corridor and Study Area have been categorized as the following, based on the problems and issues identified later in the chapter: Transit demand and attractiveness Transit demand and ridership in the US 29 corridor continues to increase. There is evidence of demand for a high-quality transit service to retain current transit riders and attract new riders. Mobility Traffic congestion currently impedes bus and rider mobility and results in unpredictable bus service, longer travel times, and delayed schedules. Corridor-wide enhancements may address efficiency and reliability and could potentially improve mobility for transit riders. System connectivity A high-quality, continuous transit service from Silver Spring to Burtonsville that can support the surrounding mixed used development along the corridor is largely absent to connect transit customers to local and regional employment and activity centers. Livability Transit improvements are needed throughout the US 29 corridor to create a transportation network that enhances choices for transportation users and promotes positive effects on the surrounding communities and residents quality of life Problems and Issues Based upon the analysis and input from elected officials, county planners, local residents and travelers, the Study Team has identified the following transportation challenges and issues in the US 29 corridor: Limitations in existing transit service and its appeal to the public; Transit demand and dependency and growing transit market; Limited connectivity for pedestrians and bicyclists; and Planned growth and development within the Study Area. These factors establish the basis of the needs for transit-related enhancements and ultimately define the purpose of this study. April 2017 Page 36
65 3.2 Preliminary Purpose Statement The purpose of this project is to improve mobility options by accommodating a high frequency, reliable transit service operating within existing right-of-way to the extent practical between the Silver Spring Transit Center and the Burtonsville Park and Ride with service commencing as quickly as possible. The preliminary purpose statement translates into the following distinct goals to guide the development of alternatives and as a performance evaluation measures for comparing alternatives: Enhance transit connectivity and multi-modal integration along the corridor as part of a coordinated regional transit system; Accommodate enhanced, efficient, high frequency, reliable transit service; Provide a sustainable and cost effective transit solution; Support approved Master Planned residential and commercial growth along the corridor by providing access to transit; Address current and future bus ridership demands; Attract new riders and provide improved service options for existing riders as an alternative to congested automobile travel through the corridor; Improve transit access to major employment and activity centers by connecting more jobs and people within 45 and 60 minutes of the activity centers; Utilize existing right-of-way to the extent possible to minimize property and environmental impacts; and Commence as quickly as possible. 3.3 Preliminary Needs Identification Limitations in Existing Transit Service and its Appeal to the Public Despite strong transit demand, existing corridor bus service is not attractive due to slow travel speeds, high delay, poor connectivity, unreliable service, and limited pedestrian and bicycle access. A review of current services reveals that the MTA 305, 315, and 325 Commuter Buses and the Metrobus Z29 do not serve the entire corridor. Specifically, the MTA Commuter buses only serve limited stop locations during peak AM and PM hours (stops at Burtonsville, Fenton Street, and Silver Spring), and Z29 limits riders from boarding/alighting between Blackburn and Spring Street, with the exception of Oak Leaf Drive, Prelude Drive, and University Boulevard. Other Z- April 2017 Page 37
66 line routes serve most of the corridor but have service gaps north of the Tech Road Park and Ride with routes deviating from the US 29 corridor. MCDOT Ride On service is fairly consistent from Silver Spring to Randolph Road but does not extend north of that location. Unlike the southern portion of the corridor, which has a robust transit service, the northern portion of the corridor is not as well served by transit. The Metrobus Z-line provides service from Silver Spring to the Burtonsville Park and Ride. Like all other vehicles, the Z-line buses experience delays due to traffic congestion that causes vehicles to queue or sit through multiple traffic signal cycles at intersections throughout the corridor. Similar issues are present along Lockwood Drive and Stewart Lane. Currently, there are lags in service that make it harder for users to utilize different transit options to travel the corridor. The WMATA Z-line Study offered the following potential shortterm operational changes to address these service issues (these changes were implemented in March 2016): Z6: Improve weekday schedule reliability Z6: Add Saturday service between Silver Spring Transit Center and Castle Boulevard Z8: Reduce Saturday frequency to coordinate with new Z6 trips for added frequency on overlapping portions of routes Z6 and Z8 Z9, Z29: Restructure service, combine with Z11, Z13 Z11, Z13: Restructure service, combine with Z9, Z29 General reliability issues (adherence to schedule, bus bunching, slow travel times) create undesirable levels of service for all riders, but especially for those individuals who rely on public transit as their primary mode of transportation. Furthermore, the issues associated with the current bus service make it less attractive to individuals with access to alternate transportation options who might otherwise elect to take the bus if it offered comfort, reliability, and convenience. Another issue with existing bus services; that are generally true of all non-brt bus systems, are the use of onboard fare collection, which are an added source of delay. Fares are usually taken as riders board the bus through one access point. This adds to dwell time which is the time the bus stays at the bus stop to allow for boardings, making the bus a less appealing travel option for those who have other travel options. Also, congestion in the roadway, particularly during peak hours, affects the frequency of buses as they progress slowly through the congested corridor. Longer wait times cause a greater number of passengers to gather at a bus stop. When a large group of passengers boards a bus at one time, fare collection takes longer, buses April 2017 Page 38
67 are further delayed, and on-time performance is affected due to the increased dwell time at these stops. Other contributors to inefficient bus service are closely spaced bus stops, inefficient pedestrian movements, delays at poorly operating signalized intersections, and merging movements into and out of traffic at stops. Current bus speeds along US 29 (developed from field verified data collection efforts) vary from 8 mph to 54 mph as shown in Table 3-1. Bus speeds are calculated directly from the travel times and thus include the dwell times at each stop. Table 3-1: Existing 2015 Average Daily Bus Peak Hour Speeds US 29 Northbound 2015 AM Peak Hour (mph) 2015 PM Peak Hour (mph) MD 97/Georgia Ave to Dale Dr Dale Dr to Sligo Creek Pkwy Sligo Creek Pkwy to Franklin Ave Franklin Ave to I-495 EB Ramp I-495 EB Ramp to I-495 WB Ramp I-495 WB Ramp to EB MD EB MD 193 to WB MD WB MD 193 to MD 650 SB Ramp MD 650 SB Ramp to MD 650 NB Ramp MD 650 NB Ramp to Fairland Rd Fairland Rd to Briggs Chaney Rd Briggs Chaney Rd to Greencastle Rd Greencastle Rd to Blackburn Rd Blackburn Rd to MD US 29 Southbound 2015 AM Peak Hour (mph) 2015 PM Peak Hour (mph) MD 198 to Greencastle Rd Greencastle Rd to Briggs Chaney Rd Briggs Chaney Rd to Fairland Rd Fairland Rd to MD 650 NB Ramp MD 650 NB Ramp to MD 650 SB Ramp 8 42 MD 650 SB Ramp to WB MD WB MD 193 to EB MD EB MD 193 to I-495 WB I-495 WB Ramp to I-495 Exit Ramp I-495 Exit Ramp to Franklin Ave Franklin Ave to Sligo Creek Pkwy 16 8 Sligo Creek Pkwy to Dale Dr Dale Dr to MD 97/Georgia Ave Source: SHA and MWCOG/TPB April 2017 Page 39
68 According to the recent WMATA Z-Line Study, the existing transit services in the US 29 corridor is hindered by bus overcrowding, lengthy waiting and dwell times, and overall reliability issues. Based on current travel times and speeds, buses along the corridor take up to over 20 percent longer on average than automobile trips, reaching as high as 60 percent longer in certain segments. These existing service issues illustrate how buses have limited ability to provide an appealing competing option to single occupant vehicles. In addition, the latest on-time performance evaluations indicate a 66 percent on-time performance for the most heavily utilized bus route in the corridor (WMATA Z8), with average travel speeds between eight and 18 miles per hour during the peak-hours in the most urbanized sections of Silver Spring. Tables 3-2a and 3-2b provide a summary of anticipated changes in corridor-wide average travel times and speeds between existing 2015 conditions and the 2040 No-Build conditions. Table 3-3 provides a summary of on-time bus performance. It is anticipated that 2040 travel times will increase by a total of 13 minutes in the morning and 14 minutes in the evening peak hours. There is a great potential for increasing the transit share in the Study Area, but achieving such a goal requires higher-quality transit service. Table 3-2a: Existing 2015 vs No-Build Average Travel Times Southbound (end-to-end) Northbound (end-to-end) 2015 Existing 2040 No- Build Percent Increase 2015 Existing 2040 No- Build Percent Increase AM Cars and Trucks 34 min 45 min 32% 21 min 21 min 0% AM Buses* 34 min 47 min 39% 25 min 25 min 0% PM Cars and Trucks 23 min 25 min 9% 25 min 37 min 48% PM Buses* 27 min 30 min 11% 30 min 44 min 47% *This percent increase does not affect buses individually; it is a network-wide bus miles traveled comparison. April 2017 Page 40
69 Table 3-2b: Existing 2015 vs No-Build Average Speeds Southbound (end-to-end) Northbound (end-to-end) 2015 Existing 2040 No- Build Percent Difference 2015 Existing 2040 No- Build Percent Difference AM Cars and Trucks 21 mph 16 mph 27% 32 mph 33 mph 3% AM Buses 20 mph 17 mph 16% 21 mph 21 mph 0% PM Cars and Trucks 29 mph 29 mph 0% 27 mph 22 mph 20% PM Buses 23 mph 22 mph 4% 27 mph 24 mph 12% Table 3-3: Existing 2015 On-Time Bus Performance Source: WMATA and Ride On Bus Service On-Time Performance Weekday AM 81% Weekday PM 49% Weekday Midday 68% Weekend AM 90% Weekend PM 82% Weekend Midday 79% Transit Demand and Dependency and Growing Transit Market Twelve percent of metropolitan DC area households are without a private vehicle and rely on transit, as do many low-income, disabled and elderly corridor residents. Some young adults are also seeking independence from private vehicle ownership and instead, would like multi-modal options. There is a great potential for increasing the transit share in the Study Area, but achieving such a goal requires higher-quality transit service. Currently, the transit share for all trip purposes in the corridor is ten percent, which is higher than the transit share in Montgomery County on average. Single-occupant vehicles are the primary travel mode for all trip purposes, accounting for almost 46 percent of all trips in the Study Area in For Home-Based Work (HBW) trips, transit plays an important role, with about 35 percent of modal share in the Study Area. For Home-Based Non-Work (HBNW) and Non Home-Based (NHB) trips, transit only accounts for about three percent and four percent of trips, while high-occupant vehicle shares for those trips are respectively 56 percent and 45 percent. April 2017 Page 41
70 As identified in the Countywide Bus Rapid Transit Study (2011) and in the CTCFMP (2013), Montgomery County seeks to enhance the existing and planned transit and transportation options throughout the County. In order to maintain or improve transit modal share, a higher quality of transit service is needed to attract new transit riders, including those who would regularly drive between points along the Study Corridor, or those who would benefit from longer trips and fewer stops, as offered by BRT. Generally, riders are attracted to transit service when travel times are reduced, reliability is increased, and they feel comfortable and safe. Despite some existing transit service issues, there is a growing market for a BRT service that is competitive with auto travel. Based on projected 2040 growth in population (13 percent), households (17 percent), and employment (78 percent), and anticipated increase in daily trip productions (13 percent) and attractions (43 percent), the numbers show a potential increase in transportation demands. Combine these demographic and travel demand growth metrics with the anticipated growth in transit usage (seven percent) and planned mixed use developments, and there is strong evidence for a growing market for transportation facilities and services that could be served by BRT. The Study Team is considering the following factors, farmed from 2010 Census Data and other surveys referenced in this document, as evidence of a growing market for enhanced transit services: Five percent of Study Area households are below the poverty level; Six percent of the Study Area s population is disabled. Silver Spring, White Oak, and Fairland communities have populations with ten percent of the population disabled; Twelve percent of the Study Area s population is 65 years and older, and 34 percent is 40 to 64 years old; Sixty-five percent are minority, 32 percent foreign born, and 31 percent over the age of five speak a language other than English; Research shows many young adults (millennials) are looking for locations to live and work that offer reliable multi-modal options; and Almost 12 percent of households in the study area do not have access to a personal motor vehicle; and more than 37 percent of households in the study area own a single motor vehicle. The above data summaries provide evidence that there is a current and potentially growing need for transit services in the region and within the Study Area for those who do not currently own a private vehicle (see Figure 3-2). While anticipated growth in employment may decrease the number of households living below the poverty level, there is a significant population within the Study Area that is aging and may require transit services. By providing improved April 2017 Page 42
71 connectivity and mobility through premium transit services, these transit-dependent populations may be better served. In addition, according to recent reports by the American Public Transportation Association (APTA) 3, millennials (those born between early 1980s and early 2000s or today s young adults) are looking to find employment and homes in communities that have a multitude of transportation choices. A 2014 study by the Rockefeller Foundation and Transportation for America 4 reported that four in five millennials in ten major U.S. cities say they want to live in places where they have a variety of options to get to jobs, school or daily needs. Millennials are driven by pragmatism ; with 46 percent saying a need to save money drives their choices. In addition, 44 percent of millennials value exercise and active lifestyles, 46 percent note convenience of transit and multi-modal options, and 35 percent say they want to live in a transit-friendly neighborhood. According to the APTA study and the Rockefeller Foundation/Transportation for America, millennials would like to see the following from public transit in the next 10 years: Seventy percent who currently do not have regular access to a vehicle say they could not afford to live in an area without access to public transportation; Eighty-six percent say that it is important that their city offer a low-cost public transportation system with affordable fares, especially for those earning less than $30,000 a year; Sixty-four percent say that the expense of owning a car is a major reason they want be less reliant on one, including 77 percent of millennials who earn less than $30,000 a year; Ninety-one percent believe that investing in quality public transportation systems creates more jobs and improves the economy; Sixty-one percent want more reliable systems; Fifty-five percent want real-time updates; Fifty-five percent want Wi-Fi or 3G/4G wherever they go; and Forty-four percent want a more user-friendly and intuitive travel experience. Figure 3-2 reflects transit dependent populations based on an index of populations below 18 years old and above 65 years old, populations below poverty level and households with one or less car. 3 American Public Transportation Association, Millennials & Mobility: Understanding the Millennial Mindset, Rockefeller Foundation and Transportation for America, Survey: To recruit and keep millennials, give them walkable places with good transit and other options, 2014 April 2017 Page 43
72 By improving access to transit and addressing the existing and forecasted transit demand, particularly for the transit dependent, we can hope to provide ladders of opportunity for upward mobility and ultimately enhance the overall quality of life for Montgomery County residents (Figure 3-1). According to a Harvard Study, commute times were identified as the single strongest factor in the odds of escaping poverty. 5 In the immediate future, providing faster service with reduced travel times could provide transit dependent populations more flexibility and convenience in their daily lives. In the long term, these transit enhancements could provide the framework for upward mobility. In addition, BRT enhancements could provide immediate, positive benefits to the diverse populations living along the corridor. Figure 3-1: Ladders of Opportunity How Enhanced Transit Can Improve Quality of Life Increase transit access and reliability Increase regional connections and access to a fast-growing Jobs corridor Support mixed-use developments in suburban corridors (reducing auto dependency) Improve quality of life through decreased travel times and congestionrelated negative impacts such as greenhouse gas emissions 5 Transportation Emerges as Crucial to Escaping Poverty. The New York Times, May 7, April 2017 Page 44

73 3-2 April 2017 Page 45
74 3.3.3 Limited Connectivity for Pedestrians and Bicyclists Accommodations for walking and bicycling are essential components of planning, design, construction, operations, and maintenance activities of any transportation project, but they are especially important for a premium transit service. A preliminary analysis of pedestrian connections in the US 29 BRT Study Corridor reveal that sidewalks exist predominantly south of New Hampshire Avenue in the northbound direction from the Silver Spring Transit Center to Oak Leaf Drive and on all of Lockwood Drive and Stewart Lane. In the southbound direction, sidewalks are intermittent between MD 650 and Southwood Avenue, then continuous from Southwood Avenue to the Silver Spring Transit Center. The size and condition of these sidewalks must be reviewed further. These are important determining factors for the likelihood sidewalks would be used to access transit services. There are no sidewalks on US 29 between New Hampshire Avenue and MD 198, making pedestrian movements difficult and impacting their ability to safely walk to existing bus stops. The 2005 Montgomery County s Countywide Bikeways Functional Master Plan (currently being updated) states that current state and county policies require that all new roads and highways be designed to accommodate bicycles and that all road improvement projects be designed to incorporate bicycle elements where feasible. This is in acknowledgement of the health benefits of bicycling and its role as a viable mode of transportation. Share the Road signed bicycle routes exist throughout the corridor. There are signs along sections of US 29 indicating bicyclists may share the road with motorists and areas where bicyclists may use the shoulder. All other bicycle routes enter and exit the corridor at various points. Lockwood Drive and Stewart Lane have a mix of shared roadway, striped bike lanes, and shoulders provided for bicyclists. Figure 3-3 shows the existing pedestrian and bicycle facilities along the corridor. Similar to sidewalks, bicycle routes must be reviewed to determine how they would relate to and support connectivity to proposed transit improvements. Coordination with Capital Bikeshare programs could further incentivize travelers to utilize bicycles as a convenient, healthy, and sustainable transportation option. Capital Bikeshare has 350 stations throughout the DC metropolitan region, including 58 bikeshare stations in Montgomery County. Montgomery County currently offers low-income residents free bikeshare memberships, training, helmets, and route planning. Additional Bikeshare stations could be added at proposed BRT stations. Further analysis of pedestrian and bicycle routes, in the context of the vehicular traffic movement, existing transit services, and proposed transit improvements would support the County s goal for multi-modal transportation in the US 29 Study Corridor. This comprehensive April 2017 Page 46
75 approach will improve the Transit-Oriented Development (TOD) potential in the corridor and increase the focus on accessibility and safety for pedestrians and bicyclists. In addition, any proposed roadway improvements to SHA facilities would require a review and approval and/or design exception from SHA that the proposed improvements are consistent with the MDOT/SHA Bicycle Policy & Design Guidelines (2015). Opportunities to enhance bicycle and pedestrian connections have been assessed as part of the preliminary conceptual alternatives development and evaluation process and will need to be carried forward as part of any subsequent related studies. Figure 9: Existing Pedestrian and Bicycle Facilities along US 29 April 2017 Page 47


76 3-3 Source: Montgomery County Department of Transportation April 2017 Page 48
77 3.3.4 Planned Growth and Development Within the Study Area Located in the most populous county in Maryland, the Study Area, along with the rest of the County, is expected to experience growth in population and employment. Growth forecasts for the Study Area are based on the latest land use forecasts in Cooperative Forecasting Round 8.3 of the MWCOG/TPB. Table 3-4 summarizes population, households, and employment growth between the base year 2014 and the forecasted year 2040 for the US 29 BRT Corridor Planning Study Area. Table 3-4: Population, Household, and Employment Growth, 2014 and 2040 Population Households Employment Percent Change Percent Change Percent Change Study Area 137, ,500 13% 52,060 60,920 17% 67, ,650 78% Source: MWCOG/TPB Round 8.3 Cooperative Forecasting As population, households, and employment opportunities grow within the Study Area, the following increases between 2014 and 2040 are anticipated: Internal US 29 trips are expected to increase by 29 percent; Total vehicle miles travelled are anticipated to increase by 15 percent; Metrorail usage at Silver Spring and the adjacent Forest Glen and Wheaton Stations are forecasted to grow by 40 percent; and Metrobus Z-line ridership is expected to grow by 36 percent. New development will drive growth in Montgomery County and the Study Area. Table 3-5 provides a list of reasonably foreseeable development projects within the US 29 BRT vicinity include both pending and recently approved projects identified by the County s Development Activity Information Center (DAIC). The locations of these projects are illustrated in Figure 3-4, which shows that development activity is largely concentrated in the vicinity of Silver Spring. The County also anticipates a concentration of development, in White Oak as envisioned in the White Oak Science Gateway Master Plan. Additional development proposed for Fairland and Burtonsville results in growth throughout the US 29 corridor that would benefit from multimodal transportation networks with high quality transit services. Montgomery County identifies the following planned transportation facilities in the vicinity of the US 29 BRT corridor April 2017 Page 49
78 related to the BRT project (Source: MWCOG/TPB, the 2014 Constrained Long Range Plan, and the White Oak Science Gateway Master Plan): Extension of Old Columbia Pike to Lockwood Drive; Connector roads between Plum Orchard Court, Whitethorn Court, and Cherry Hill Road; Provision of local grid of streets and access roads in Burtonsville; Purple Line Transitway; Metrorail Silver Line; Interchange at Musgrove Road/Fairland Road; White Oak Science Gateway Master Plan Transportation Improvements (Not currently programmed): o BRT Network; o Old Columbia Pike Bridge opened to vehicular traffic; o Planned US 29 grade-separated interchanges at Tech Road/Industrial Road; o New local roads proposed in the Life Sciences/FDA Village Center; and o Intersection geometric improvements. Current transportation infrastructure in the US 29 BRT Study Corridor between the Silver Spring Transit Center and Burtonsville Park and Ride is generally congested and may not be able to offer the capacity needed to support continued growth in eastern Montgomery County. Based on the White Oak Gateway Master Plan, transportation problems, and attempts to solve or relieve traffic congestion, have characterized the eastern County for 30 years. The US 29 corridor will need a substantial transit upgrade in order to handle future growth demand. Additional transit options along US 29 would support the planned TOD development and growth radiating outward from Silver Spring, thus capitalizing on public investments in transit by producing local and regional benefits. Direct benefits of this TOD could include increased ridership, revitalization of neighborhoods, financial gains for joint development opportunities, increases in the supply of affordable housing, and profits to those who own land and businesses near transit stops. Secondary benefits include congestion relief, land conservation, reduced outlays for roads, and improved safety for pedestrians and cyclists (United States Department of Transportation (US DOT, 2012)). April 2017 Page 50

79 3-4 April 2017 Page 51
80 Table 3-5 Reasonably Foreseeable Development Projects Map Plan Development Name Description Size ID Number 1 Silver Spring Park Condo, Hotel, Retail, Office 1.57 ac A Silver Spring Avenue Office, Residential 0.19 ac Georgia Avenue Condo 1.34 ac D 4 City Place Office, Retail 2.48 ac E 5 Chelsea Court Residential, Single-Family 5.25 ac A 6 United Therapeutics Office, R&D, Retail 2.2 ac B Georgia Avenue Condo, Office, Retail 0.69 ac B 8 Silver Spring Center Office 0.74 ac A Newell Street Condo, Retail 1.22 ac The Blairs Buildings F1/F2 Condo 3.79 ac Falkland North Commercial, Condo 3.5 ac A 12 White Oak Property (Science Gateway) Single-Family Attached ac C 13 Fairland Data Center General - Solar Panels 35.5 ac A 14 Montgomery Auto Sales Park Lot 17 Automobile-Related 4.78 ac Montgomery Auto Sales Park Lot 18 Automobile-Related 3.32 ac Woodlake Condo 32.7 ac B 17 Star Pointe Plaza Retail, Office, Restaurant 1.53 ac A 18 Burtonsville McDonalds Restaurant 2.4 ac Fenwick Station Single-Family 2.84 ac A 20 Korean Antioch Church Religious Worship 8.85 ac Snowden's New Birmingham Manor Church, Single-Family Detached 4.55 ac Boswell's Addition to Riding Stable Estates Single-Family Detached 5.89 ac A 23 Montgomery Auto Sales Park Lot 14 Automobile, Industrial, Retail 8.1 ac A 24 Guru Nanak Foundation of America Religious/Institutional ac Deer Park Single-Family Detached 2.8 ac White Oak Town Center (Science Gateway) Retail, Condo 6.98 ac White Oak Property (Science Gateway) Single-Family Detached ac A 28 Victory Crossing Religious/Institutional ac Northwood Knolls Single-Family Detached 0.77 ac Mt. Jezreel Senior Housing Religious/Institutional 9.73 ac Gough Property Single-Family Detached Woodside Park Single-Family Detached 1.48 ac Elizabeth Square Retail, Condo, Restaurant 3.12 ac Metro Plaza - Silver Spring Condo, Office, Retail 1.44 ac A 35 Falkland North Retail, Condo 9.77 ac A 36 The Blairs Master Plan Condo, Hotel, Office, Restaurant, Retail Rock Creek Forest (Hickey & Offutt's Subdivision) Single-Family Detached 1.56 ac Washington Adventist Hospital Hospital ac C 39 Colesville Eckerd Drug Store (Now Rite Aid) #6328 Commercial, Office 2.04 ac B 40 PMG Silver Spring Commercial 1.25 ac Eco Estates Single-Family Detached ac Shiloh Christian Fellowship Church Single-Family Detached/Religious/Institutional 2.58 ac Beall's Manor Single-Family Detached 2 ac No Gain Single-Family Detached 0.85 ac Fairland Park Community Single-Family Detached/Attached ac A / C 46 Silver Spring Library (construction near complete) Library <1 ac unknown April 2017 Page 52
81 Forecasted Future (2040) Traffic Conditions Under forecasted 2040 traffic conditions, the ADT ranges from a low of approximately 41,700 vehicles south of Fenton Street to a high of 88,100 vehicles north of Crestmoor Drive (see Table 3-6), an increase of four percent to 13 percent over existing 2015 volumes. This increase is representative of the anticipated growth in population, households, and economic development that will exacerbate congestion in the Study Area. Table 3-6: Existing 2015 and Forecasted No-Build ADT Roadway Sections (North to South) Sandy Spring Road (MD 198) to Cherry Hill Road/E. Randolph Road Cherry Hill Road/E. Randolph Road to New Hampshire Road (MD 650) 2015 Existing ADT (vehicles) Lowest Highest 2040 No-Build ADT (vehicles) Lowest Highest 70,900 73,700 73,900 82,900 59,800 71,600 67,700 79,300 New Hampshire Road (MD 650) to University Boulevard (MD 193) 65,500 79,400 72,600 88,100 University Boulevard (MD 193) to Capital Beltway (I-495) 74,000 81,900 Capital Beltway (I-495) to Georgia Avenue (MD 97) 39,600-65,200 41,700 72,400 Source: 2015 Existing Data from Vehicle counts No-Build Data from TPB/MWCOG regional transportation model Version , with land use forecast Round Forecasted Future (2040) Intersection Level of Service Along US 29 alone, seven intersections are noted to operate at LOS F under the AM and/or PM peak 2040 No-Build conditions. Seven additional intersections not on US 29, but associated with the US 29 corridor side streets, are also noted to operate at LOS F under the AM and/or PM peak No-Build conditions. Also, eight intersections that were operating acceptably under Existing 2015 conditions are forecast to deteriorate to LOS E under 2040 No-Build conditions. The Future 2040 No-Build AM peak experiences five new intersections operating at LOS E or LOS F, while the 2040 No-Build PM peak experiences sixteen intersections operating at LOS E or F when compared to Existing 2015 conditions. Table 3-7 provides details on the future 2040 intersections forecasted to operate at LOS E or LOS F. These poorly operating intersections affect the speed with which buses, and other vehicles, can travel through the corridor. Under existing and projected 2040 No-Build traffic conditions, motor vehicle and bus performance, including speed, reliability, and passenger comfort, are expected to decline in conjunction with the deteriorating traffic conditions. April 2017 Page 53
82 US 29 Mainline Intersections (Associated Side-street Intersections) Table 3-7: Existing 2015 and Forecasted No-Build Intersection LOS 2015 AM 2040 AM 2015 PM 2040 PM Delay (sec/veh) LOS Delay (sec/veh) LOS Delay (sec/veh) LOS Delay (sec/veh) US 29 at Bonifant St 6.7 A 11.1 B 14.4 B F US 29 at Wayne Ave 24.2 C 38.8 D 32.9 C 64.1 E Colesville Rd at Wayne Ave/2nd Ave 36.6 D 37.4 D 53.6 D 96.9 F US 29 at Fenton St 15.0 B 28.5 C 26.8 C 60.7 E US 29 at Spring St 26.0 C 40.9 D 44.2 D F US 29 at Dale Dr 23.9 C 40.0 D 70.4 E F US 29 at Sligo Creek Pkwy 30.5 C 40.8 D 44.0 D F US 29 at Franklin Ave 18.6 B 96.0 F 14.2 B 88.2 F US 29 at MD 193 (South) 32.4 C 39.2 D 35.9 D 62.7 E MD 650 at Lockwood Dr 51.7 D 47.8 D F F US 29 at Stewart Ln 14.3 B 12.7 B 20.5 C 66.4 E US 29 at Industrial Pkwy 15.6 B 24.0 C 48.1 D F US 29 at Tech Rd 87.4 F F 42.8 D 80.0 F US 29 at Randolph Rd 39.4 D 47.8 D 40.6 D 44.7 D Randolph Rd at Old Columbia Pike 32.1 C 81.1 F 29.0 C 30.3 C Fairland Rd at Old Columbia Pike 44.3 D 48.7 D 37.2 D F Briggs Chaney Rd at Castle Blvd 34.4 C 78.5 E 57.4 E F US 29 at Greencastle Rd 72.5 E 78.1 E 48.8 D 47.6 D US 29 at MD C 23.2 C 35.2 D 34.7 C MD 198 at Old Columbia Pike 40.8 D F 67.9 E F Old Columbia Pike at National Dr 4.3 A F 11.7 B 63.3 E Source: SHA, US 29 BRT Draft Preliminary Purpose and Need (December 2015), 2040 No-Build Data from TPB/MWCOG regional transportation model Version , with land use forecast Round 8.3 LOS April 2017 Page 54

83 4 Defining BRT Alternatives The Study Team has identified three main components that comprise the alternatives studied: Running Ways, Service Plans, and Station Locations. This chapter gives a brief overview of what those different components are and how they work together to form an alternative. 4.1 BRT Components Summary Bus Running Ways Bus running ways are best described as the physical roadway elements that are built or modified to accommodate dedicated bus services separate from general purpose traffic. Running way types vary in the degree that they are separated from the general purpose traffic and use of TSP. The running ways considered for US 29 BRT are described below Bus-on-Outside-Shoulder Under this option, BRT vehicles would operate in the partially dedicated right outside shoulder of the general traffic lanes. Use of this running way is sometimes limited to peak hour periods or congested conditions, and usually with operating constraints such as a maximum operating speed that is under the posted speed limit. Bus-on-outside-shoulder does encounter conflict points with access points, intersections, and interchange ramps that would require buses to yield. Today, buses are permitted to travel on the outside shoulders of US 29 north of Industrial Parkway during peak periods when general travel lanes are congested and moving slower than 35 mph Median Shoulder BRT Lane The median shoulder BRT Lane bus running way would utilize the left inside shoulders and portions of the median to provide dedicated lanes for BRT and Commuter buses. Using the median running ways is less constrained than using other running way options studied. They are not limited by time of day (peak travel periods) or by maximum operating speeds under the posted speed limit (buses can drive at posted speeds), and have fewer intersections and conflict points with general purpose traffic Managed Lanes BRT buses, local buses, high-occupancy vehicles (HOV) with two or more passengers, and vehicles turning right at intersections or access points share managed lanes. Managed lanes are typically repurposed from existing general travel lanes by adding travel restrictions to single occupant vehicles, thereby providing dedicated or partially dedicated lanes to transit and other April 2017 Page 55
84 high-occupancy vehicles. These dedicated/partially dedicated running ways are often located on the outermost right curb lanes (although, other inside lanes could also be repurposed), and are not physically separated from the general purpose traffic lanes, allowing all vehicles make turns at intersections and access points Business Access Transit (BAT) Lanes BRT buses, local buses, and vehicles turning right at intersections or access points share the BAT Lanes. Similar to managed lanes, BAT lanes are typically repurposed from existing general travel lanes by adding travel restrictions to vehicles. The partially dedicated BAT lanes are often located on the outermost right lanes and are not physically separated from the general purpose traffic lanes, allowing turning movements at intersections and access to local businesses and residences. BAT lanes are slightly different from the managed lanes in that non-bus HOVs are restricted from the BAT lanes and must remain in the general purpose traffic lanes Mixed-use Lane Buses and general traffic vehicles are permitted to ride in mixed-use lanes. Potential intersection enhancements such as widening and auxiliary lane additions could provide buses the option of jumping the queue at these locations and improve service time and reliability. Otherwise, no modifications to the existing roadway would be pursued and BRT buses would run in regular general purpose traffic lanes Stations Station Locations The Montgomery County CTCFMP identified the following potential station locations for further study: Silver Spring Transit Center US 29 at Fenton Street/Spring Street US 29 at Franklin Avenue US 29 at MD 193 US 29 at Burnt Mills Shopping Center Lockwood Drive at Oak Leaf Drive White Oak Transit Center US 29 at Tech Road Park and Ride US 29 at Fairland Road Briggs Chaney Road Park and Ride Burtonsville Park and Ride April 2017 Page 56
85 Throughout the study process, the Study Team has made adjustments to station locations in coordination with WMATA, M-NCPPC, MCDOT and comments received from US 29 BRT CAC members. The following locations are proposed for the evaluation of conceptual alternatives: Silver Spring Transit Center Curbside Station (Single Bus); US 29 at Fenton Street/Spring Street Minimal Curbside and Curbside Station (Single Bus); US 29 at MD 193 Split-Center Median Station for Alt. A; US 29 at MD 193 Curbside Station for Alt. Band and Alt. B Modified; US 29 at Burnt Mills Shopping Center Curbside Station (Single Bus) ; Lockwood Drive at Oak Leaf Drive Curbside Station; White Oak Transit Center Curbside Station; Stewart Lane at April Lane Curbside Station; US 29 at Tech Road Park and Ride Median Station for Alt. A and Alt. B Modified ; US 29 at Tech Road Park and Ride Curbside Station for Alt. B; US 29 at Briggs Chaney Road Median Station for Alt. A No Station for Alt. B Castle Ridge Way at Castle Boulevard Curbside Station (Single Bus); Castle Terrace at Castle Boulevard Minimal Curbside and Curbside Station (Single Bus); Briggs Chaney Park and Ride Curbside Station; and US 29 at MD 198 Curbside Station Station Location Identification Process These locations and preliminary layouts have been modified in three steps: Step 1: Establish Service Area Step 2: Review Locations Step 3: Determine Station Layout Step 1: Service Area The Study Team utilizes the physical BRT Routes established as part of the service operations plan (discussed in detail later in this chapter), to establish the service area. The service area for this study includes US 29 from Silver Spring Transit Center to the Burtonsville Park and Ride. It also includes spurs along Lockwood Drive/Stewart Lane and Briggs Chaney Road/Castle Boulevard. Each of these areas is proposed to be served by the BRT system and require BRT stations. Step 2: Review Locations The Study Team reviewed numerous sources of data to determine preliminary locations where BRT stations would most likely find their highest ridership while also fitting efficiently into the surrounding community and transportation infrastructure. The April 2017 Page 57
86 data sources included master plans, existing station locations and ridership data, existing and planned land uses, existing transportation facilities, existing natural and cultural resources, and specific feedback from CAC members and Study Team stakeholders. Access to and from employment and activity centers and residential developments, walkability and bikeability, proximity of parking, distance to bus transfers, potential impacts to surrounding features, and geographic spacing of BRT stations were considered in the investigation of potential station locations. Step 3: Determine Station Layout/Site Footprint Once a general location was determined to be suitable for a BRT Station, the Study Team investigated specific sites where the stations could be constructed. The team members looked at various station size and site footprint options to determine the preliminary design that was appropriate for the surrounding land uses and ridership activities. Then the station footprint was established to determine potential impacts to adjacent properties and existing features. Additional design details will need to be developed in a later phase. However, at this time, the preliminary station footprints provide a good estimation of where stations can be implemented in a way that maximizes efficiency for riders and BRT vehicles, and minimizes impacts to the surroundings Preliminary Station Sizes and Layout Configurations The preliminary station sizes and layout configurations currently under investigation are included below in Table 4-1 below. Note that the dimensions and configurations are based on modeled 2040 ridership demand needs and are still a work in progress. The sizes and configurations are likely to differ by location, depending on specific site design requirements and needs. The final dimensions and diagrams will be revised during subsequent phases of design. Assumptions used for US 29 stations were based on similar station typology and design recommendations developed and included in the Corridor Cities Transitway (CCT). The US 29 station estimate approach is also similar to MD 586 BRT Corridor Planning Study, which is another BRT project in Montgomery County. The station diagrams that follow (Figures 4-1, 4-2, 4-3, 4-4 and 4-5) are rough illustrations of how the stations could potentially look if implemented for the modeled 2040 ridership demands. Note that the dimensions and layouts are still a work in progress and will differ from location to location depending on specific design requirements. The final dimensions and layouts will be completed during later phases of detailed design. Note that for consistency purposes with other concurrent BRT studies, BRT platforms are defined as a singular raised area provided for level boarding and typically contains the shelter, canopy, benches, tactile warning strip, informational displays, etc. BRT stations are defined as April 2017 Page 58
87 the combination of BRT platforms, and any additional related access ways and ramps, amenities, utility boxes, hardscape and landscape features for both directions of travel. In most cases BRT stations have both northbound and southbound curbside platforms and related features. The exception is with median stations, where only one platform would be required. Table 4-1: Preliminary Station and Platform Sizes and Configurations Station Type BRT Bus Capacity Location Platform Dimensions (W x L) Overall Station Dimensions (W x L) Median 2 Median 18 ft x 125 ft 18 ft x 195 ft Special Features Two feet for a protective barrier between station and roadway Curbside 2 Sidewalk 11 ft x 125 ft 11 ft x 145 ft Additional sidewalk space must be reserved for mechanical/electrical boxes Split Center Median Curbside (single bus) Minimal Curbside (single bus) 2 Median 13 ft x 125 ft 13 ft x 220 ft 1 Sidewalk 11 ft x 63 ft 11 ft x 83 ft 1 Sidewalk 9 ft x 18 ft 11 ft x 30 ft Split Center Median - 5 foot landing area and a 25-foot ramp should be added beyond the crosswalk to access the platform. Large refuge area should be provided as overflow capacity. Additional sidewalk space must be reserved for mechanical/electrical boxes Width can vary depending on location to minimize impacts April 2017 Page 59


88 Figure 4-1: Median Station and Platform SUBJECT TO CHANGE Not to Scale Figure 4-2: Curbside Station and Platform SUBJECT TO CHANGE Not to Scale April 2017 Page 60


")

89 Figure 4-3: Split-Center Median Station and Platform SUBJECT TO CHANGE Not to Scale Figure 4-4: Curbside Station and Platform (Single Bus) SUBJECT TO CHANGE Not to Scale April 2017 Page 61
 Stations are likely to feature the following ADA-compliant amenities and design elements.")
90 Figure 4-5: Minimal Curbside Station and Platform (Single Bus) Two Options Shown Option 1: Sidewalk behind platform and Option 2: Sidewalk through platform and 18 SUBJECT TO CHANGE Not to Scale Station Features (Subject to Change) Stations are likely to feature the following ADA-compliant amenities and design elements. The final amenities will be determined during detailed design phases: Canopy and wind-screen shelter from weather elements; Off-board fare collection and ticket vending machine; Pedestrian, bicycle, and ADA access; Bicycle racks and lockers, bicycle share-program facilities; Safety call boxes, surveillance cameras; Raised platform for level boarding (approximately 14-inch curb height); Real-time transit information screens; and Lighting, benches, trash receptacles, and other hardscape and street furniture features. April 2017 Page 62
91 Additionally, the station design and features will support and enhance the following surrounding community features: Existing and future land uses and development opportunities Pedestrian and bicycle network Local transit connections Vehicular patterns and physical barriers Landmarks Connections Local bus transfers Service Operations Plan A service operation plan was developed for use in preliminary analysis. Assumptions made for this preliminary analysis are provided below. However, the final service operations plan will likely change and will be appropriately evaluated as the study progresses through later design phases Preliminary Analysis Assumptions BRT will run on US 29 in both directions. For the purposes of this analysis, BRT service is assumed to operate between 5:00 a.m. and midnight. Service patterns, or the BRT physical routes, will differ during peak and off-peak travel periods. Two service patterns are assumed for the peak period and one service pattern for the off-peak period, and are described in more detail in the section below. Maximum headways, or the time span between consecutive BRT buses (when one BRT bus arrives and the next BRT bus arrives), are maintained at 12 minutes for peak periods and ten minutes for off-peak periods. Because there are two patterns running simultaneously during the peak periods, the functional peak headways will be six minutes apart US 29 BRT Pattern One Peak Period In the peak period, Pattern One runs between Burtonsville Park and Ride and Silver Spring Transit Center via US 29 with 12-minute headways. It overlaps Pattern Two in some sections of US 29, reducing the functional headway to six minutes in the common sections. Figure 4-6 provides an overview of the route and stations Pattern One serves during the peak period. Note that the exact location of stations varies for each alternative and are subject to change as each alternative is further developed. Additional details on station location are provided in Section Off-Peak Period In the off-peak period, Pattern One runs between Burtonsville Park and Ride and Silver Spring Transit Center via Stewart Lane and Lockwood Drive, maintaining ten-minute headways. Figure April 2017 Page 63
92 4-6 provides an overview of the route and stations Pattern One serves during the off-peak period US 29 BRT Pattern Two In peak periods, Pattern Two runs between Briggs Chaney Park and Ride and Silver Spring Transit Center via Castle Boulevard, US 29, and Stewart Lane/Lockwood Drive. This pattern maintains 12-minute headways. In common sections where it overlaps with Pattern One, the effective headway is six minutes. Pattern Two is assumed to not operate in off-peak hours. Figure 4-6 provides more detail on the route and stations Pattern Two services during the peak period Background Bus Network Changes The background bus network included in ridership and traffic analyses is the 2014 CLRP network. Changes are proposed for some routes/lines, but for those that are unchanged, headways and speeds are based on the CLRP network. Routing changes (route extensions to cover removal of express service) occur on the Metrobus Z6 and Z8 lines but there are no modifications to the headways for these two services. These services serve different rider markets than the BRT would. In addition, the background bus network model assumes the following: Remove WMATA Z11 service from the network; Extend Z8 peak period service to Greencastle Park and Ride to cover Z11 service area for the No-Build peak period; Eliminate Z9/Z29 service from network; Extend Z6 peak period service to Burtonsville Park and Ride to cover the Z9/Z29 service area for the No-Build peak period; Create new circulator/feeder service between South Laurel Park and Ride and Burtonsville Park and Ride to cover the peak period trips eliminated with the removal of Z9/Z29; Finish Ride On 21 and 22 routes at the White Oak Transit Center 6 ; and Extend K9 service from current FDA campus terminal up to the proposed White Oak Transit. 6 Based upon public, feedback the Study Team has agreed to return Ride On Routes 21 and 22 to the background bus network as part of future refinement studies. April 2017 Page 64
93 4-6 April 2017 Page 65
94 4.2 Preliminary Conceptual Alternatives Eight preliminary conceptual alternatives were considered and qualitatively examined at a high level during the initial concept development phase. The preliminary conceptual alternatives included the following: Alternative 1 No-Build Alternative 2 TSM (Intersection Transit Signal Priority and Queue Jump Lane Widening) Alternative 3 Median BRT Lanes (Median and Left Turn Lane Repurposing) Alternative 4 Curb Business Access Transit (BAT) Lanes (Reversible Lane Repurposing and Widening) Alternative 5 Median BRT Lanes (Median Repurposing and Widening) Alternative 6 Curb Business Access Transit (BAT) Lanes (Curb Lane Repurposing) Alternative 7 Additional BRT Lanes (Widening) Alternative 8 Additional Curb BAT Lanes (Widening) Preliminary Conceptual Alternatives Eliminated from Consideration In early spring 2016, the Montgomery County Executive announced that the alternative implemented in the US 29 corridor had to be built within the existing right-of-way to avoid significant property impacts and should be implemented in fewer than four years to provide a rapid improvement to transit service in this critical commuter corridor. The announcement came after the initial public reaction, as expressed through the CAC, opposed any alternatives that would require major right-of-way acquisition or could create significant property impacts. Quick and reliable implementation was another major screening factor. Alternatives that required lengthy planning, design, and implementation process involving complicated property acquisition, environmental permitting, and construction efforts were dropped from consideration. The following alternatives were eliminated: Alternative 3 Median BRT Lanes (Median and Left Turn Lane Repurposing) Eliminated due to impacts and construction schedule Alternative 4 Curb Business Access Transit (BAT) Lanes (Reversible Lane Repurposing and Widening) Eliminated due to impacts Alternative 5 Median BRT Lanes (Median Repurposing and Widening) Eliminated due to impacts Alternative 7 Additional BRT Lanes (Widening) Eliminated due to impacts and schedule Alternative 8 Additional Curb BAT Lanes (Widening) Eliminated due to impacts and schedule April 2017 Page 66
95 4.3 Conceptual Build Alternatives The County Executive proposed a new alternative, referred to as Alternative B in this report. This proposal had many of the characteristics of a Transportation System Management (TSM) alternative, including TSP and other transit and pedestrian friendly intersection operations modifications like extended pedestrian crossing times. The County Executive s proposal also incorporated some features of the original Conceptual Alternative 6, including lane repurposing and the use of shoulders by BRT buses. Two new conceptual alternatives Alternative A (previously called preliminary conceptual alternative 6) and Alternative B (a modified version of preliminary conceptual alternative 6) were developed by the Study Team for analysis to a higher level of detail and evaluation against the quantitative selection criteria. As the evaluation was underway the Study Team determined that a third alternative, one that is a hybrid of Alternative A and Alternative B should also be analyzed. Hence the Study Team developed Alternative B Modified. These three alternatives and the No-Build Alternative are the subjects of this. Alternative A, Alternative B, and Alternative B Modified are described in detail below. The screening process and the analysis results are described in Chapter Descriptions of the Proposed Conceptual Build Alternative Running Way Elements The following sections provide descriptions of the No-Build Alternative and the three retained conceptual build alternatives, A, B, and B Modified Description of the No-Build Running Way Alternative The No-Build Alternative includes planned and programmed transit and roadway improvements as listed in the 2014 CLRP. The Study Team uses this alternative to evaluate 2040 future conditions without BRT, and compare them to 2040 conditions with each of the two conceptual BRT alternatives Description of Alternative A Running Way The main elements of Alternative A running way would include peak period median shoulder BRT lanes in the north and peak period curbside BAT Lanes in the south. Note that for all alternatives, peak periods are assumed to be from 6 a.m. to 9 a.m. and from 3 p.m. to 7 p.m. The BAT lanes would be created by repurposing the peak direction curb lane to accommodate BRT buses, local buses, and right turning traffic. Note that the peak period movement is southbound in the morning and northbound in the afternoon. All stations would be curbside stations unless noted. For description purposes, the alternatives are divided into geographical sections based on the specific running way improvements proposed in each section (see Figures 4-7a, 4-7b, 4-7c, 4-7). April 2017 Page 67
96 Section One: Silver Spring Transit Center to MD 97/Fenton Street Buses would run in mixed traffic in southbound direction from Fenton Street to just south of MD 97 where buses will transition from the curb lane to the left lane to use the existing bus only lane to turn left into the Silver Spring Transit Center. Buses would run in mixed traffic in northbound direction from Silver Spring Transit Center to MD 97. A transition zone for northbound BAT lane during p.m. peak period between MD 97 and Fenton Street would be provided. During off-peak times, northbound buses would run in mixed traffic from Silver Spring Transit Center to Fenton Street. Existing overhead variable lanes signs (OVLS) would be modified or new OVLS would be provided to communicate when BAT lanes are active/inactive during peak and off-peak periods. Additional BAT lane signage and/or lane markings would be provided as needed. Existing left turn lanes and movements would be maintained for general traffic. Section Two: MD 97 to Sligo Creek Parkway BAT lane in the peak direction during the peak period would be provided through repurposing of the peak direction curb lanes. Operation of existing reversible auto lanes would be maintained during peak periods. Off-peak direction buses would operate in mixed traffic during the peak period and off-peak period. Existing OVLS would be modified and/or new OVLS installed along with other signage/lane markings as needed. Left turn lanes and movements for general traffic would be maintained. April 2017 Page 68
97 Figure 4-7a: Alternative A Peak Direction Curbside BAT Lanes in Existing Reversible Lane Segment (Section 2) Section Three: Sligo Creek Parkway to Hasting Drive/Granville Drive BAT lanes would be provided in the peak direction through repurposing of the peak direction curb lanes. Off-peak direction buses would operate in mixed traffic. New OVLS and other signage/lane markings would be provided as needed. Section Four: Hastings Drive/Granville Drive to Timberwood Avenue All lanes and vehicles would operate as mixed traffic at all times. BRT buses would transition from the curb lanes to the left lanes to access the proposed median station between the eastbound and westbound legs of MD 193. Section Five: Timberwood Avenue to Prelude Drive/Oak Leaf Drive BAT lanes would be provided in the peak direction through repurposing of the peak direction curb lanes. April 2017 Page 69
98 Off-peak direction buses would operate in mixed traffic. New OVLS and other signage/lane markings would be provided as needed. Figure 4-7b: Alternative A Peak Direction Curbside BAT Lanes (Sections 4 and 5) Section Six: Prelude Drive/Oak Leaf Drive to Stewart Lane All lanes and vehicles would operate as mixed traffic at all times. Northbound BRT buses would transition from the curb lanes to the left lanes to access the proposed median shoulder BRT lanes at Stewart Lane. Southbound BRT buses would transition from median shoulder BRT lanes to curb lanes Section Seven: Lockwood Drive/Stewart Lane All lanes and vehicles would operate as mixed traffic at all times. Dedicated bicycle lanes would be provided within existing pavement. Continuous sidewalk connections would be provided as needed. April 2017 Page 70
99 Section Eight: Stewart Lane to MD 198 and Burtonsville Park and Ride New median shoulder BRT lanes would be constructed where needed and/or existing median shoulder would be widened as needed to accommodate BRT buses operating at posted highway speeds. Existing signalized intersections would be reconstructed to accommodate median shoulder BRT lanes while maintaining existing turn and through lane movements and configurations. Only BRT buses would have access to run in median shoulder BRT lane. BRT buses would run in mixed traffic between MD 198 to Burtonsville Park and Ride Signage and lane markings would be provided as needed. Figure 4-7c: Alternative A Median Shoulder BRT Lanes (Section 8) Section Nine: Briggs Chaney Road/Castle Boulevard All lanes and vehicles would operate as mixed traffic at all times. April 2017 Page 71
100 April 2017 Page 72
101 Description of Alternative B Running Way Alternative B would feature managed lanes (HOV2+/BAT Lanes, also known as managed lanes) in the south and buses would operate on outside shoulders in the north. For description purposes, the alternatives are divided into geographical sections based on the specific running way improvements proposed in each section (see Figures 4-8a, 4-8b, 4-8c, 4-8): Section One: Silver Spring Transit Center to MD 97/Fenton Street Buses would run in mixed traffic in southbound direction from Fenton Street to just south of MD 97 where buses will transition from the curb lane to the left lane to use the existing bus only lane to turn left into the Silver Spring Transit Center. Buses would run in mixed traffic in northbound direction from Silver Spring Transit Center to MD 97. A transition zone for northbound managed lane during p.m. peak period between MD 97 and Fenton Street would be provided. During off-peak times, northbound buses would run in mixed traffic from Silver Spring Transit Center to Fenton Street. Modifications to existing OVLS or new OVLS would be provided to communicate when managed lanes are active/inactive during peak and off-peak periods. Other managed lane signage and/or lane markings would be provided as needed. Existing left turn lanes and movements for general traffic would be maintained. Section Two: MD 97 to Sligo Creek Parkway A managed lane in the peak direction during the peak period would be provided through repurposing of the peak direction curb lanes. Operation of existing reversible auto lanes would be maintained during peak periods. Off-peak direction buses would operate in mixed traffic during the peak period and off-peak period. Modifications to existing OVLS or new OVLS would be provided along with other signage/lane markings as needed. Left turn lanes and movements for general traffic would be maintained. April 2017 Page 73

102 Figure 4-8a: Alternative B Peak Direction Curbside BAT Lanes in Existing Reversible Lane Segment (Section 2) Section Three: Sligo Creek Parkway to Timberwood Avenue All lanes and vehicles would operate as mixed traffic at all times. BRT buses would remain in the mixed traffic curb lanes to access curbside stations at MD 193. Section Four: Timberwood Avenue to Prelude Drive/Oak Leaf Drive Managed lanes would be provided in the peak direction through repurposing of the peak direction curb lanes. Off-peak direction buses would operate in mixed traffic. New OVLS and other signage/lane markings would be provided as needed. April 2017 Page 74

103 Figure 4-8b: Alternative B Peak Direction Curbside Managed Lanes (Section 4) Section Five: Prelude Drive/Oak Leaf Drive to Industrial Parkway All lanes and vehicles would operate as mixed traffic at all times. Section Six: Lockwood Drive/Stewart Lane All lanes and vehicles would operate as mixed traffic at all times. Dedicated bicycle lanes would be provided within existing pavement. Continuous sidewalk connections would be provided as needed. Section Seven: Industrial Parkway to MD 198 and Burtonsville Park and Ride BRT, MTA Commuter, and local buses would be permitted to run on outside shoulder (match existing bus-on-outside-shoulder conditions) during peak periods and times traffic of congestion. April 2017 Page 75
104 All buses on outside shoulder would be limited to maximum speed of 35 mph and should not travel more than five mph faster than traffic in adjacent general traffic lanes. All buses would stay in general traffic lanes until travel speeds fall below 35 mph. All buses running on outside shoulders must yield to general traffic turning at intersections and entering and exiting at interchange ramps. BRT buses would run in mixed traffic between MD 198 to Burtonsville Park and Ride Figure 4-8c: Alternative B Bus-On-Outside-Shoulder (Section 7) Section Eight: Briggs Chaney Road/Castle Boulevard All lanes and vehicles would operate as mixed traffic at all times. April 2017 Page 76
105 April 2017 Page 77
106 Description of Alternative B Modified Running Way Alternative B Modified is a hybrid of features contained in Alternatives A and B. It incorporates the Alternative A median shoulder BRT lanes with the Alternative B managed lane (BAT/HOV2+) improvements. Alternative B Modified is slightly different than Alternative A in that the median shoulder BRT lanes would also be open to MTA Commuter buses. Local service would still be restricted to general purpose lanes. For description purposes, the alternatives are divided into geographical sections based on the specific running way improvements proposed in each section (see Figure 4-9a, 4-9b, 4-9c, 4-9): Section One: Silver Spring Transit Center to MD 97/Fenton Street Buses would run in mixed traffic in southbound direction from Fenton Street to just south of MD 97 where buses will transition from the curb lane to the left lane to use the existing bus only lane to turn left into the Silver Spring Transit Center. Buses would run in mixed traffic in northbound direction from Silver Spring Transit Center to MD 97. A transition zone for northbound managed lane would be provided during p.m. peak period between MD 97 and Fenton Street. During off-peak times, northbound buses would run in mixed traffic from Silver Spring Transit Center to Fenton Street. Modifications to existing OVLS or new OVLS would be provided to communicate when managed lanes are active/inactive during peak and off-peak periods. Other managed lane signage and/or lane markings would be provided as needed. Existing left turn lanes and movements for general traffic would be maintained. Section Two: MD 97 to Sligo Creek Parkway A managed lane in the peak direction would be provided during the peak period through repurposing of the peak direction curb lanes. Operation of existing reversible auto lanes during peak periods would be maintained. Off-peak direction buses would operate in mixed traffic during the peak period and off-peak period. Modifications to existing OVLS or new OVLS would be provided along with other signage/lane markings as needed. Left turn lanes and movements for general traffic would be maintained. April 2017 Page 78
107 Figure 4-9a: Alternative B Modified Peak Direction Curbside BAT Lanes in Existing Reversible Lane Segment (Section 2) Section Three: Sligo Creek Parkway to Timberwood Avenue All lanes and vehicles would operate as mixed traffic at all times. BRT Buses would remain in the mixed traffic curb lanes to access curbside stations at MD 193. Section Four: Timberwood Avenue to Prelude Drive/Oak Leaf Drive Managed lanes in the peak direction would be provided through repurposing of the peak direction curb lanes. Off-peak direction buses would operate in mixed traffic. New OVLS and other signage/lane markings would be provided as needed. April 2017 Page 79
108 Figure 4-9b: Alternative B Modified Peak Direction Curbside Managed Lanes (Section 4) Section Five: Prelude Drive/Oak Leaf Drive to Stewart Lane All lanes and vehicles would operate as mixed traffic at all times. Northbound BRT buses would transition from the curb lanes to the left lanes to access the proposed median shoulder BRT and Commuter Bus lanes at Stewart Lane. Southbound BRT buses would transition from median shoulder BRT and Commuter Bus lanes to curb lanes Section Six: Lockwood Drive/Stewart Lane All lanes and vehicles would operate as mixed traffic at all times. Dedicated bicycle lanes would be provided within existing pavement. Continuous sidewalk connections would be provided as needed. April 2017 Page 80
109 Section Seven: Stewart Lane to MD 198 and Burtonsville Park and Ride New median shoulder BRT and Commuter Bus lanes would be constructed where needed and/or existing median shoulder would be widened as needed to accommodate BRT buses operating at highway speeds. Existing signalized intersections would be reconstructed to accommodate median shoulder BRT and Commuter Bus lanes while maintaining existing turn and through lane movements and configurations. Only BRT and MTA Commuter buses would have access to run in median shoulder BRT lanes as needed. BRT buses would run in mixed traffic between MD 198 to Burtonsville Park and Ride Signage and lane markings would be provided as needed. Figure 4-9c: Alternative B Modified Bus-On-Outside-Shoulder (Section 7) Section Eight: Briggs Chaney Road/Castle Boulevard All lanes and vehicles would operate as mixed traffic at all time. April 2017 Page 81

110 April 2017 Page 82

111 5 Affected Environment This section documents the natural, socio-economic, and cultural resources, including both architectural and archeological resources, within the Study Area that could potentially be impacted by the proposed project. The information in this chapter is compiled from desktop research of readily available county, state and Federal data, and a windshield survey of the Study Corridor. Detailed environmental impact assessment and documentation are planned for a later phase of the study. 5.1 Natural Resources Although the Study Area is largely urbanized and developed land, several significant areas containing natural resources are located throughout the US 29 Corridor. These areas include four main tributaries of the Anacostia River that cross through the US 29 Study Area: Sligo Creek, Northwest Branch (Figure 5-1), Paint Branch, and Little Paint Branch. Forests, floodplains, and nontidal wetlands are also associated with some of these stream systems. Figure 5-1: Northwest Branch, Looking Towards the Southeast There is no federal or state parkland located within the Study Area. One water supply park, the T. Howard Duckett Watershed, is owned by the Washington Suburban Sanitary Commission (WSSC) and is located just north of the study limits. All other parkland within the Study Area is owned by the M-NCPPC. See Section 4(f) discussion below for a detailed list of the parklands. See the Project Overview Figures (see Figures 5-3, 5-4, 5-5, and 5-6) for details on natural resources locations. The following sections provide detail on the Study Area surrounding natural environment. April 2017 Page 83
112 5.1.1 Topography, Geology, Soils, and Groundwater The Study Area is located within the Upland Section, or northern division of the Piedmont Plateau physiographic province. The Piedmont Region is further divided into sub regions, with the US 29 BRT Study Area falling within the Major Land Resource Area (MLRA) 148 of Land Resource Region (LRR) south (S) (USACE, 2012). The Study Area is underlain by older metamorphic and igneous formations. The U.S. Army Corp of Engineers (USACE) uses these MLRA regions in the determination of wetland indicators in conjunction with delineation methodologies. These regions are largely affected by climatic conditions and the physical and biological characteristics of the landscape. In general, groundwater in these regions can be found in consolidated rock fractures, or weathered rock. The Study Area lies between two principle aquifers, the Piedmont and Blue Ridge Crystalline-Rock Aquifer and the Northern Atlantic Coastal Plain Aquifer System (see Figure 5-2) (USGS, 2003). Generally, these aquifers are the underground reservoirs that store and yield groundwater. Twenty different soil map units are present within the Study Area. Two of these soils, Hatboro silt loam and Baile silt loam, are listed as hydric in the Hydric Soils of the U.S. (USDA SCS, 1991). These soils can be found within the study limits along the Paint Branch and Little Paint Branch stream crossings. These hydric soils have formed under conditions of saturation, flooding, or ponding for long enough periods during the growing season that anaerobic conditions have developed in the upper soil profile (USACE, 2012). Erodibility of a soil is expressed as a K-value, which ranges from 0.02 to Other factors being equal, the higher the value, the more susceptible the soil is to water erosion. Table 5-1 summarizes the soil map units present in the Study Area and its physical characteristics, with several soils indicating the upper spectrum of erodibility. Factors such as soils erodibility, susceptibility to flooding, depth to restrictive layers and water table are all important considerations should construction activities result in soil disturbance. April 2017 Page 84


113 Figure 5-2: Watershed and Aquifer Boundaries April 2017 Page 85
114 Table 5-1: Map Unit Characteristics of Soils Occurring within the Study Area Map Unit Map Unit Name % Slope Erodibility 1B 3-8 Gaila silt loam 1C 8-15 Hydric (Y or N) N 2B 3-8 Glenelg silt loam 2C UB 0-8 Glenelg-Urban land complex 2UC A 0-3 Glenville silt loam 5B N N N 6A Baile silt loam Y 16D Brinklow-Blocktown channery silt loams N 53A Codorus silt loam occasionally flooded N 54A Hatboro silt loam frequently flooded Y 55C Evesboro loamy sand N 57B C Chillum silt loam N 57D UB Chillum-Urban land complex N 58B 3-8 Sassafras loam 58C A 0-3 Beltsville silt loam 59B N N April 2017 Page 86
115 Table 5-1: Map Unit Characteristics of Soils Occurring Within the Study Area, Continued Map Unit 61B Map Unit Name % Slope Erodibility 3-8 Hydric (Y or N) 61C 8-15 Croom gravelly loam 61D N 61E UB Croom-Urban land complex N 65B Wheaton silt loam N 66UB 0-8 N Wheaton-Urban land complex UC 8-15 N 67UB Urban land-wheaton complex N 116D Blocktown channery silt loam, very rocky 116E N/A N 400 Urban land N/A N/A N Surface Water Resources, Water Quality, and Floodplains The Study Area is located entirely within the Anacostia River watershed, spanning from the watershed s northern most boundary to the southern limit. There are four main tributaries of the Anacostia River and sub-basins of the Anacostia that cross through the Study Area, including Sligo Creek, Northwest Branch, Paint Branch, and Little Paint Branch (See Figure 5-2). Sligo Creek is the southernmost stream that crosses the Study Area, just north of downtown Silver Spring and south of I-495 (Capital Beltway). Sligo Creek is designated a Use I stream (i.e., suitable for water recreation and support of aquatic life) by Maryland Department of the Environment (MDE). The condition of fish and macroinvertebrate populations in Sligo Creek has improved due to restoration efforts. However, aquatic resources still remain heavily impacted. Sligo Creek is one of the most urbanized sub-watersheds within the Maryland portion of the Anacostia watershed; with approximately 90 percent of the total subwatershed area being April 2017 Page 87
116 developed and only about 35 percent of the stream corridor characterized by riparian forest buffer. In general, the overall health of the macroinvertebrate and fish communities in Sligo Creek can be characterized as poor to good (MWCOG, 2009). The Northwest Branch crosses the Study Area north of I-495 and south of MD 650 (New Hampshire Ave), and it is designated as a Use IV stream (recreational trout waters) by the MDE. Many efforts to stock the stream and provide an established brown trout population are ongoing by the MDNR, and joint efforts by the Maryland Department of Natural Resources (MDNR) and the M-NCPPC have now introduced fingerling smallmouth bass in the vicinity of I- 495 and the Study Area portion of the Northwest Branch. Today this waterway supports a selfreproducing smallmouth bass fishery (MWCOG, 2009). The Paint Branch subwatershed is generally bound by MD 198 (Sandy Spring Road/Spencerville Road) to the north, US 29 and Cherry Hill Road to the east, US 1 and College Park Airport to the southeast and MD 650 (New Hampshire Avenue) to the west. The entire Paint Branch subwatershed upstream of the Capital Beltway and within the Study Area has been designated by MDE as Use III (natural trout waters). The Paint Branch is considered the Anacostia watershed s highest quality stream system, and it has supported a naturally reproducing brown trout population since the 1930s. In general, the overall health of the aquatic community in the Paint Branch can be characterized as being poor-to-good for macroinvertebrates and poor to excellent for fish (MWCOG, 2009). The Little Paint Branch subwatershed is primarily located in the Coastal Plain physiographic province, with only the northern most tributaries located in the Piedmont and crossing the northern most portion of the Study Area. Little Paint Branch is designated a Use I stream, suitable for water recreation and support of aquatic life. In general, the overall health of the macroinvertebrate and fish communities in Little Paint Branch can be characterized as ranging from very poor to good. It has been known to support sensitive species such as mayflies, stoneflies, and caddisflies (MWCOG, 2009). Data from the Federal Emergency Management Agency (FEMA) Flood Insurance Rate Maps was obtained to identify 100-year floodplains within the Study Area (FEMA, 2011). Records indicate 100-year floodplain associated with the main-stem crossings of Sligo Creek, Northwest Branch, and Paint Branch Total Maximum Daily Loads and MS4 Permit A Total Maximum Daily Load (TMDL) calculates the maximum amount of a pollutant that a waterbody can receive while still meeting water quality standards. Section 303(d) of the Clean Water Act requires that a TMDL be developed for the pollutant(s) responsible for impairing a April 2017 Page 88
117 waterbody. Each state compiles a list, which identifies the impaired waterbodies contained within their state, and further broken down into Counties. Currently 733 waters are identified as impaired in the State of Maryland (MDE, 2006), and within the Anacostia River Watershed the Environmental Protection Agency approved TMDLs include bacteria, nutrients, sediment, trash, and Polychlorinated Biphenyls (PCBs). As the Study Area is largely urbanized, stormwater off of the roads, sidewalks, parking lots and surrounding area makes its way into the storm drains and eventually into the streams. The federal government regulates stormwater through the Municipal Separate Storm Sewer System Permit Program (MS4 Permit Program). This permit requires that the county meet certain water quality standards. The permit is given every five years and progress of the county is monitored Waters of the U.S. Including Wetlands According to published resources of the National Wetlands Inventory (NWI) and U.S. Geological Survey (USGS), several wetland systems are identified within and surrounding the Study Area. To supplement desktop research, a wetland corridor windshield identification study was conducted in the fall of 2014, throughout the entire Study Area, to field verify the presence of wetlands and waters identified by the NWI and USGS databases, as well as locate any areas where potential jurisdictional wetlands or waters may be located. Identified features were sketched onto field mapping and illustrated in the Project Overview Figures (see Figures 5-3, 5-4, 5-5, and 5-6), as Observed Wetlands. These are described below as potential wetland systems, as sample data points and tests for specific wetland criteria have not been performed and confirmation of wetland status determined. North of MD 650, and within a 200-foot wide natural resource Study Area, there are several small NWI wetland systems. Four of these wetlands no longer exist and therefore were removed from the mapping. Based on the windshield field survey, an additional nine potential wetland systems were identified within the Study Area. Hydric soils, hydrophytic vegetation, and hydrology were all noted at each location. The following summarizes the findings: Three potential palustrine forested wetland (PFO) systems identified along the west side of Wexhall Drive, parallel to US 29. One potential PFO identified near US 29 within an existing forest conservation easement. Two potential palustrine emergent (PEM) wetlands identified on the east side of US 29 in the vicinity of Randolph Road. One potential linear PEM identified along northbound US 29 just north of Stewart Lane. April 2017 Page 89
118 Two potential PFO wetlands identified along southbound US 29, one at Prelude Drive and one within Sligo Creek Stream Valley Park. In addition to readily available published wetland information and field observed wetlands, surveyed wetlands are also located on the attached mapping. These surveyed wetlands have been completed by the SHA or other consultant firms, for other various projects whose study areas coincide with the US 29 BRT Study Area. In addition to the wetland systems identified, a total of six streams were identified by MDNR as crossing under US 29 within the Study Area; Sligo Creek, Northwest Branch, Paint Branch, and three small tributaries associated with Little Paint Branch. Field investigations confirmed all of these perennial stream crossings. Several potential intermittent and ephemeral streams associated with these large perennial waters are also located within the Study Area. Areas of roadside grass swales and channels that were not connected to waters of the U.S. were not mapped. Field delineations completed in accordance with the Regional Supplement to the Corps of Engineers Wetland Delineation Manual: Eastern Mountains and Piedmont Region, Version 2.0 (USACE, November 2012) would be required to confirm the exact limits of all waters of the U.S., including wetlands, in the Study Area Vegetation and Wildlife Much of the Study Area is occupied by residential land uses, with areas of commercial centers focused around the major intersections and towns. The existing forest within and immediately adjacent to the Study Area is largely associated with the major stream crossings within existing M-NCPPC parkland: Sligo Creek Stream Valley Park; Northwest Branch Stream Valley Park; and the Upper Paint Branch Stream Valley Park. The forested stream buffers associated with these systems consist of largely mid to late successional deciduous forest of the Oak-Northern Hardwoods Forest Association and are dominated by white oak, northern red oak, black oak, tulip poplar, red maple, green ash, American sycamore, and American beech. The canopy species in the mid-successional forest are primarily within the 16 to 28-inch diameter at breast height (dbh) size class throughout the Study Area with larger trees scattered throughout. Much of the canopy functions as important cover over stream valleys, helping to maintain water quality and habitat within the stream channels. Approximately two dozen specimen trees (trees greater than 30 inches dbh or 75 percent of the state champion) were observed during the windshield survey. However, there is the potential for specimen trees within the forest interior that was not visible during the survey, and in April 2017 Page 90
119 private residential areas. Many of these specimen trees were identified in the southern portion of the Study Area. A moderately diverse understory of shrubs and saplings is present within these larger forest tracts. In addition to the parkland forest areas, there are street trees, forest fragments, and naturally regenerating areas present in several locations throughout the corridor. Several of these areas contain early to mid-successional forests dominated by tulip poplar, red maple, silver maple, American beech, and black cherry, of approximately 12 to 18 dbh. Additional common tree species include persimmon, white pine, Virginia pine, and along several roadway edges, tree-ofheaven, Hawthorne, Bradford pear, and black locust. All of the observed forested areas contain a high percentage of invasive plants, particularly vines that in some cases have grown into the canopy layer. The abundance of vines suggests a high amount of light availability, which often results from forest fragmentation. Japanese honeysuckle and greenbrier are prevalent in almost all forested locations throughout the Study Area. Oriental bittersweet, poison ivy, and English ivy are also commonly found. If the conceptual build alternatives require the cutting or clearing of forest greater than one acre, the Maryland Reforestation Law requires that these trees be replaced on an acre-for-acre, one to one, ratio on public lands and within two years, or three growing seasons of the completion of the project. If the proposed conceptual build alternatives require less than one acre of tree clearing, information will need to be provided to the MDNR identifying trees to be impacted and documented under their existing Roadside Tree Blanket Permit. According to MDNR Geographic Information System (GIS) information, there are several locations of Forest Interior Dwelling Species (FIDS) habitat identified within the Study Area. FIDS typically require large tracts of forest in which to maintain viable populations. FIDS habitat was identified on the west side of US 29 within the forested stream buffer in Sligo Creek Stream Valley Park; both the east and west of US 29 within the Northwest Branch Stream Valley Park and the Paint Branch Stream Valley Park; and a small portion adjacent to the east side of US 29 along the Little Paint Branch. Coordination with the MDNR Wildlife and Heritage Service is necessary if any impacts to FIDS are proposed. The Study Area is a very densely populated area, especially in the southern portion of the Study Area; therefore, the opportunity for wildlife use is limited, and largely confined to relatively narrow corridors. The existing parkland provides the most abundant habitat available for wildlife, as well as additional local parks in the vicinity of the Study Area. However, the local parks also play host to community activities thus limiting wildlife. Observed wildlife includes squirrels, song birds, and falcons, with other evidence of beavers and raccoons. April 2017 Page 91
120 5.2 Section 4(f) and Cultural Resources Section 4(f) Resources Section 4(f) of the U.S. Department of Transportation Act of 1966, 49 USC 303(C) protects publicly owned parks, recreation area, wildlife management areas, scenic and wild rivers, or state wildlands, as well as significant public or privately owned historic sites. Evaluation of all 4(f) resources within the Study Area must be done to determine the use of the Section 4(f) resource. It requires that the agencies identify and evaluate 4(f) resources and take steps to avoid, minimize, and mitigate any use on these resources. The Study Area crosses three M-NCPPC Stream Valley Parks (SVPs) as well as adjacent local parks and conservation areas all owned by the M-NCPPC, including the following: Gene Lynch Urban Park Ellsworth Urban Park Sligo Creek Stream Valley Park Hastings Neighborhood Conservation Area Northwest Branch Stream Valley Park Burnt Mills West Special Park Paint Branch Stream Valley Park Martin Luther King Jr. Recreational Park Stonehedge Local Park Calverton Neighborhood Conservation Area Stonecrest Neighborhood Conservation Area In addition to the identified parks, publicly owned schools often have facilities, such as playground or athletic facilities that are open to the public. Several schools have property that directly abuts the US 29 right-of-way: Montgomery Blair High School, Paint Branch High School, and the Fairland Center. Montgomery Blair High School and Paint Branch High School are currently active. The Fairland Center has been identified as both the formerly Glenallen Elementary School, and the historic Fairland School. The site consists of two parcels, a north and south, which are both owned by the Board of Education. It is not currently used as an elementary school. However, local groups use the open fields at the site for sporting events. Parklands and community facilities are illustrated on Project Overview Figures (see Figures 5-3, 5-4, 5-5, and 5-6). There is the potential that sidewalk uses and/or park entrances could be altered, depending on final design and bus stop locations. Any encroachment onto these park properties will require further coordination with the M-NCPPC. If federal funds are used for this project, any encroachment on a publicly-owned and used park or recreation area will require development April 2017 Page 92
121 and evaluation of avoidance and minimization alternatives under Section 4(f) of the USDOT Act of There are no wildlife management areas, scenic rivers, or state wildlands located within or adjacent to the Study Area Architectural Resources Historic resources that are eligible for or listed in the National Register of Historic Places are protected by the provisions of Section 106 of the National Historic Preservation Act (36 CFR Part 800) and the Maryland Historical Trust Act of 1985 (as amended, 5A-325 and 5A-326 of the Annotated Code of Maryland). These state and federal regulations require that agencies identify and evaluate historic properties listed or eligible for listing in the National Register of Historic Places (NRHP) with potential to be affected by their proposed infrastructure elements. In addition, agencies must consult with the stakeholders including the Maryland Historical Trust (MHT) and State Historic Preservation Office (SHPO) to take steps to avoid, minimize, and mitigate the adverse effects of undertakings on these resources. SHA cultural resource professionals reviewed the SHA-GIS Cultural Resources Database, the MHT Digital Library, property tax information, and aerial photographs to develop a preliminary inventory for the proposed US 29 BRT project. These references were reviewed for historic architectural and archaeological resources within approximately 200 feet on either side of US 29, the same approximate study limits for the environmental inventory. US 29 from Silver Spring to the Howard County Line runs primarily in a northeast direction and through highly built-out suburban development. The surrounding development is generally older the closer to the DC, with early twentieth century development in Silver Spring. US 29 is known as Colesville Road in Silver Spring and the roadway and surrounding development has an urban character. The Study Area contains multiple properties that have been inventoried during historic resource surveys and entered into the Maryland Inventory of Historic Properties (MIHP) database. A compilation of those resources is listed in Table 5-2. Of those historic resources on the MIHP, some resources have not been evaluated for NRHP eligibility, but most have had eligibility determinations and have been listed, determined eligible, or determined not eligible for the NRHP. One of the resources (the Silver Theater and Silver Spring Shopping Center, M: ) has preservation easements on the property. April 2017 Page 93
122 MIHP Number Table 5-2: MIHP Resources and Preservation Easements Resource Name Town NRHP Eligibility M: Henry S. Krusen House (Bricefield Property) Burtonsville M: Polychrome Historic District (Polychrome Houses) Woodmoor Not Eligible (demolished) Listed NR-1169 M: 32-7 Argyle Park Neighborhood Silver Spring Not Eligible M: North Hills of Sligo Park Silver Spring Not Eligible M: Indian Spring Club Estates/Indian Spring Terrace/Indian Spring Manor M: Sligo Creek Parkway M: Fairway, Chalfonte, Country Club Park, Country Club View Silver Spring Silver Spring, Takoma Park, Hyattsville Silver Spring Not Eligible Eligible Not Eligible M: Choi Property Silver Spring Not Eligible M: Robert B. Morse Water Filtration Plant Woodmoor Eligible M: Bridge Silver Spring Eligible M: Bridge 15009, Burnt Mills Bridge Woodmoor Not Eligible M: 34-3 Pease House (Duvall House) Burtonsville Not Evaluated (demolished) M: Carroll House (John Hardesty Property) Burtonsville Not Eligible M: M: Samuel S. Aitcheson House (Walter Fehr Property) Willard Marlow House I & II (William Ellin Property) Burtonsville Colesville M: John Hardisty House Burtonsville Not Eligible Not Eligible Not Eligible (demolished) M: Jackson Yang Property Burtonsville Not Eligible M: Carroll and V.E. Ricketts Property Burtonsville Not Eligible M: Stephen C. Beaver III House Silver Spring Not Eligible M: Fairland Data Center Silver Spring Not Eligible M: Georgetown Branch, B&O Railroad Chevy Chase Not Eligible M: 36-7 Old Silver Spring Commercial Area Silver Spring M: M: Silver Theatre and Silver Spring Shopping Center Preservation Easement, Silver Spring Shopping Center (E-568) Silver Spring Silver Spring Eligible not applicable (n/a) April 2017 Page 94
123 MIHP Number Table 5-2: MIHP Resources and Preservation Easements, Continued Resource Name Town NRHP Eligibility M: Preservation Easement, Silver Theatre (E-581) Silver Spring n/a M: Montgomery Arms Silver Spring Eligible M: J.C. Penney Co. Building Silver Spring Facadectomy M: City Springs (No Documentation on File) Silver Spring Not Evaluated M: 36-9 Mrs. K's Toll House Silver Spring Not Evaluated M: Woodside Park Historic District Silver Spring Not Evaluated Source: MIHP database In addition, many other properties over forty-five years of age are located adjacent to the project limits that have not been previously inventoried or evaluated for the NRHP. These unevaluated properties include, but are not limited to, the following: Calverton Neighborhood Deer Park Drive Rolling Acres, Section 1 Springbrook Village 1302 Milestone Drive Burnt Mills Townhouses (1968) Burnt Mills Village Burnt Mills Manor Woodmoor Northwood Park View Northwood Park Indian Spring View Four Corners Commercial Area Seven Oaks South Woodside Park Bridge First India United Methodist Silver Spring Library 8915 Colesville Road Colesville Towers Road 1000 Noyes Drive 8808 Colesville Road Colespring Plaza, 1001 Spring Street Spring-Colesville Parking Garage, 1000 Spring Street 8728 Colesville Road 8727 Colesville Road 8501 Colesville Road Archeological Resources A review of existing cultural resource databases reveals that no archeological sites have been recorded within the Study Area, and no archeological surveys have been conducted for the Study Area. The following inventoried properties are located within the project Study Area: April 2017 Page 95
124 18MO271 (Stewart Lane and Old Columbia Pike) 18MO481, 18MO482 (Paint Branch) 18MO609 (site was mitigated for the ICC and has been destroyed) 18MO272 (near Randolph Road) 18MO274 (near Little Paint Branch) Much of the Study Area has been developed for commercial or residential purposes. However, the Study Area may include undisturbed terrain at the crossings of major streams, including Paint Branch and Northwest Branch. Phase I archeological survey may be warranted, if right-ofway acquisition is required within high potential areas overlooking stream crossings. However, this preliminary conclusion will need to be re-evaluated once project plans are available, to make a conclusive determination. April 2017 Page 96

125 April 2017 Page 97

126 April 2017 Page 98

127 April 2017 Page 99

128 April 2017 Page 100
129 5.3 Environmental Justice Executive Order directs federal agencies to identify and address any disproportionately high and adverse human health or environmental effects on minority and low-income populations. The Environmental Justice considerations in proximity of the project corridor were assessed in compliance with the Environmental Justice Guidelines for Maryland State Highway Administration Projects (2001). U.S. Census data (2010) was used in determining potential minority or low-income populations (see Table 5-3). Consistent with SHA s guidelines, minority populations are identified as Block Groups with a meaningfully greater percentage of minorities than that of a greater geographic region. For this planning study, Block Groups with minority populations greater than or equal to that of Montgomery County are considered potential environmental justice populations. Minority populations will include persons who identify themselves as Black or African-American, Asian, American Indian/Alaskan Native, Native Hawaiian/Pacific Islander, Other, Two or More Races, or any person of Hispanic descent. Likewise, low-income populations will include Block Groups with meaningfully greater percentage of persons living below the federal poverty level than that of a greater geographic region. For this planning study, Block Groups with the percentage of persons living below poverty greater than or equal to that of Montgomery County are considered potential environmental justice populations. Based on the 100 percent count data from the 2010 U.S. Census, 48 of the 99 Block Groups within the project vicinity are potential minority populations. Based on the U.S. Census American Community Survey Estimates, 19 of the 99 Block Groups are potentially lowincome populations (see Figure 5-7). The Block Groups with potential minority populations are concentrated immediately along either side of US 29 north of MD 650, as well as the southern portion of the Study Area near downtown Silver Spring. The Block Groups with potential lowincome populations are dispersed throughout the Study Area with the only concentration just northeast of the US 29 and MD 200 (Intercounty Connector) interchange. April 2017 Page 101
130 Table 5-3: Potential Environmental Justice Populations Geography Minority (%) EJ Below Poverty (%) EJ Geography Minority (%) EJ Below Poverty (%) Study Area 62% -- 5% -- Census Block Group 1 32% NO 3% NO Block Group 1 41% NO 0% NO Tract Block Group 2 19% NO 0% NO Census Block Group 2 66% YES 3% NO Block Group 3 16% NO 0% NO Tract Block Group 3 42% NO 7% NO Block Group 1 65% YES 2% NO Block Group 4 44% NO 0% NO Census Block Group 2 20% NO 0% NO Tract Census Block Group 1 36% NO 0% NO 7022 Block Group 3 28% NO 0% NO Tract Block Group 2 62% YES 0% NO Block Group 4 28% NO 0% NO Block Group 3 51% NO 0% NO Census Block Group 1 71% YES 19% YES Census Block Group 1 87% YES 3% NO Tract Block Group 2 87% YES 11% YES Tract Block Group 2 79% YES 6% NO Census Block Group 1 67% YES 2% NO Block Group 3 78% YES 0% NO Tract Block Group 2 25% NO 0% NO Block Group 1 63% YES 10% YES Block Group 3 62% YES 2% NO Census Block Group 2 64% YES 7% NO Census Block Group 1 31% NO 7% NO Tract Tract Block Group 3 76% YES 6% NO Block Group 2 43% NO 2% NO Block Group 4 87% YES 3% NO Census Block Group 1 62% YES 0% NO Block Group 1 46% NO 0% NO Tract Block Group 2 52% NO 0% NO Census Block Group 2 81% YES 0% NO Block Group 3 64% YES 19% YES Tract Block Group 3 53% NO 0% NO Block Group 1 75% YES 5% NO Block Group 4 69% YES 1% NO Census Block Group 2 61% NO 0% NO Tract Block Group 5 84% YES 3% NO 7025 Block Group 3 69% YES 41% YES Block Group 1 83% YES 7% NO Block Group 4 59% NO 7% NO Census Block Group 2 76% YES 7% NO Block Group 1 65% YES 0% NO Tract Block Group 3 78% YES 9% YES Block Group 2 50% NO 0% NO Census Block Group 4 85% YES 20% YES Tract Block Group 3 55% NO 0% NO Census Tract Block Group 1 78% YES 2% NO Block Group 4 51% NO 0% NO Block Group 1 35% NO 9% YES Census Block Group 1 39% NO 12% YES Census Tract Block Group 2 8% NO 0% NO Tract Block Group 2 64% YES 16% YES Block Group 3 74% YES 0% NO Block Group 1 37% NO 2% NO Block Group 4 70% YES 7% NO Block Group 2 61% NO 11% YES Census Census Tract Tract Block Group 1 88% YES 3% NO 7028 Block Group 3 30% NO 0% NO Census Block Group 1 95% YES 35% YES Block Group 4 38% NO 6% NO EJ April 2017 Page 102
131 Geography Tract Census Tract Census Tract Census Tract Census Tract Census Tract Census Tract Table 5-3: Potential Environmental Justice Populations, Continued Minority (%) EJ Below Poverty (%) Block Group 2 97% YES 4% NO EJ Geography Minority (%) EJ Below Poverty (%) Block Group 1 20% NO 0% NO Block Group 1 75% YES 0% NO Census Block Group 2 31% NO 0% NO Block Group 2 93% YES 13% YES Tract Block Group 3 36% NO 0% NO 7029 Block Group 3 91% YES 12% YES Block Group 4 45% NO 0% NO Block Group 1 63% YES 0% NO Block Group 5 18% NO 0% NO Block Group 2 73% YES 4% NO Census Block Group 1 39% NO 0% NO Block Group 3 63% YES 0% NO Tract 7030 Block Group 2 32% NO 2% NO Block Group 4 68% YES 3% NO Block Group 1 64% YES 4% NO Block Group 1 80% YES 20% YES Census Block Group 2 47% NO 0% NO Tract Block Group 2 73% YES 0% NO 7031 Block Group 3 46% NO 4% NO Block Group 3 60% NO 5% NO Block Group 4 47% NO 0% NO Block Group 1 42% NO 8% NO Block Group 1 20% NO 0% NO Block Group 2 59% NO 4% NO Census Block Group 2 14% NO 0% NO Tract Block Group 3 47% NO 0% NO Block Group 3 47% NO 5% NO Block Group 1 92% YES 31% YES Block Group 4 48% NO 2% NO Block Group 2 84% YES 0% NO Census Block Group 1 61% NO 10% YES Block Group 3 90% YES 12% YES Tract Block Group 2 55% NO 3% NO Block Group 1 52% NO 0% NO Block Group 2 93% YES 6% NO Block Group 3 91% YES 3% NO Block Group 4 96% YES 19% YES EJ April 2017 Page 103

132 5-7 April 2017 Page 104
133 5.4 Indirect and Cumulative Effects Analysis Once more detailed engineering has been conducted on the proposed alternatives as part of subsequent phases of study, a detailed Indirect and Cumulative Effects (ICE) scoping and analysis will be completed according to guidance provided by the Maryland State Highway Administration in Section 1, Scoping/Initial ICE Analysis Activities in the 2007 Indirect and Cumulative Effects Analysis Guidelines. Indirect effects are defined as, Effects which are caused by the action and are later in time or farther removed in distance, but are still reasonably foreseeable. Indirect effects may include growth inducing effects and other effects related to induced changes in the pattern of land use, population density or growth rate, and related effects on air and water and other natural systems, including ecosystems (40 CFR (b)). Cumulative effects are defined as, Impacts on the environment which result from the incremental impact of the action when added to other past, present, and reasonably foreseeable future actions regardless of what agency (Federal or non-federal) or person undertakes such other actions (40 CFR ). This pre-scoping consideration of indirect and cumulative effects will evaluate socioeconomic, cultural, and environmental resources of concern; the geographical and temporal boundaries to be included during future stages of the US 29 BRT Study; and the past, present, and reasonably foreseeable future development actions. Proposed improvements associated with the US 29 BRT project would affect capacity along the US 29 corridor, which could encourage development within the Study Area. The environmental resources of concern for an indirect and cumulative effects analysis are typically the environmental resources that would be directly affected by the project. The proposed US 29 BRT project would predominately occur on existing roadway and other paved surfaces, and there would be limited direct environmental effects on natural resources. However, potential direct effects of the proposed project are listed below. These resources must be considered in the indirect and cumulative effects analysis: Right-of-way acquisition Business or residential displacement Effects to access or mobility for residents and businesses in the corridor vicinity Effects to community facilities Historic Properties Parks Forested Areas Waters of the US and Wetland April 2017 Page 105

134 6 Alternative Evaluation As discussed in Chapter 4, the conceptual alternatives were evaluated using two sets of criteria an initial qualitative evaluation followed by a more detailed quantitative evaluation. The following chapter provides a summary of the qualitative and quantitative alternative evaluation process and results. 6.1 Evaluation Process Figure 6-1 provides an overview of the overall evaluation process for this study. There are four main steps: Identify Constraints, Screening, Detailed Analysis/Conceptual Alternative, and Environmental Analysis/Preliminary Engineering. Each of these steps receives review and input from project stakeholders, including Study Team members from MDOT, MCDOT, and Corridor Advisory Committee members. Figure 6-1: Evaluation Process Flow Chart April 2017 Page 106
135 6.2 Level One: Identify Constraints (Reality Check) The intent of level one is to quickly and efficiently utilize qualitative evaluation criteria to gauge the ability of each preliminary conceptual alternative to meet the project purpose. Any fatallyflawed alternative, that is any alternative that could not feasibly meet the project purpose, is eliminated from further evaluation at this stage. For example, Alternative 7 looked at possible roadway widening in sections south of I-495 where extensive right-of-way impacts and related acquisition would be required. Because the purpose of this project includes the avoidance of right-of-way impacts as a key metric 7, this preliminary conceptual alternative was quickly eliminated from further consideration. Similarly, other preliminary conceptual alternatives, like Alternatives 4 and 8 were eliminated from further consideration because the Study Team determined that they would not best meet the project purpose due to potential impacts to properties, natural resources, traffic operations and safety, and/or constructability concerns. Other factors considered included construction duration, costs, and complexity. 6.3 Level Two: Screening (Qualitative Evaluation) Several preliminary conceptual alternatives passed the initial round of qualitative evaluation screening for fatal flaws. These preliminary conceptual alternatives, namely Alternatives 2, 3, 5 and 6, were sketched out to take a slightly more detailed, but still qualitative, look at the level of impact and functional benefit they might achieve if implemented. A specific example is with Alternative 3, where the Study Team investigated opportunities to repurpose existing median areas and left turn lanes to provide a peak direction reversible BRT lane. Ultimately, the team determined that this alternative would likely require roadway widening at selected locations, and meeting the purpose of this project would introduce an unacceptable level of right-of-way impacts and traffic operations issues. Alternative 3 was eliminated from consideration due to qualitative concerns about traffic operations, safety, and potential right-of-way impacts. Alternative 5 was similarly eliminated during this phase. Features of Alternative 2 were incorporated in to the retained Alternatives A, B, and B Modified. As discussed previously in Chapter 4, the following preliminary conceptual alternatives were eliminated from consideration: Alternative 3 Median BRT Lanes (Median and Left Turn Lane Repurposing) - Eliminated Alternative 4 Curb Business Access Transit (BAT) Lanes (Reversible Lane Repurposing and Widening) - Eliminated Alternative 5 Median BRT Lanes (Median Repurposing and Widening) - Eliminated 7 In early spring 2016, the Montgomery County Executive announced that the alternative implemented in the US 29 corridor had to be built within the existing right-of-way to the extent possible to avoid significant property impacts and should be implemented in fewer than four years. April 2017 Page 107
136 Alternative 7 Additional BRT Lanes (Widening) - Eliminated Alternative 8 Additional Curb BAT Lanes (Widening) - Eliminated 6.4 Level Three: Detailed Analysis (Quantitative Evaluation) Once the first two rounds of evaluation had been completed, the Study Team had retained three conceptual build alternatives: No-build, Alternative A, and Alternative B. As the initial model results became available, the Study Team elected to test a new alternative, Alternative B Modified, which incorporates the northern end median shoulder treatment into Alternative B. The following sub-sections describe the quantitative evaluation screening criteria that the Study Team has compiled for the analysis and comparison of the No-Build and three remaining conceptual build alternatives (Alternative A, Alternative B, and Alternative B Modified). This section summarizes the methodologies and evaluation analyses used to generate forecasted ridership, travel demand and traffic operations, costs, and environmental impacts associated with the proposed conceptual build alternatives Ridership Forecasting and Forecasted 2040 Traffic Operations Ridership forecasting and forecasted 2040 Traffic Operations, important elements of the US 29 BRT Study, were conducted using MWCOG and the National Capital Regional TPB Travel Demand Forecasting Model Version as the base model, with refinements and validation in the study area Ridership Forecasts The following is a summary of the ridership forecasting methodology used to generate anticipated transit boardings along US Model Assumptions and Methodology The base model set for this study was the TPB/MWCOG regional travel model Version , with model validation for the base year 2014, for the US 29 corridor and 2040 No-Build, refined and prepared by MWCOG in April For the purposes of this study, the TPB/MWCOG model set was enhanced to include the following assumptions and refinements, which were previously adopted and discussed in the original project Purpose and Need analysis: Land Use is the MWCOG Cooperative Forecast Round 8.3, with modifications using the White Oak area socio-economic forecasts from the M-NCPPC. Network is the CLRP 2014 adopted on October 15, 2014 with refinements by MWCOG and Cambridge Systematics to better reflect transportation facility details along the US 29 corridor. April 2017 Page 108
137 MWCOG modification is focused on ensuring that roadway and transit networks are upto-date (including headway and routing) and that centroid connections were correct. MWCOG conducted the initial model validation, including both highway and transit. After further model refinements were made, the transit ridership estimates from the base year model were compared and verified against the observed transit ridership. The ridership forecasting process also included FTA recommended performance credit adjustments to account for the effects of premium guideway enhancements as part of the analysis Ridership Forecast for 2040 No-Build Alternative This section presents ridership forecasting results for the No-Build scenario for the purposes of comparison with the Build alternatives. Tables 6-1 and 6-2 highlight the modeling assumptions of the corridor bus routes, such as frequency of the corridor routes in the peak and off-peak periods, run time, total route distance, and speed. Table 6-1: 2040 No-Build Characteristics of the Metrobus Corridor Routes Route Name/Direction Headway (min) PK Run Time (min) Total Route Distance (miles) Average Speed (mph) WMATA Z2 Inbound WMATA Z2 Outbound WMATA Z6 (Briggs Chaney Rd) WMATA Z6 (Burtonsville) 10, WMATA Z8 Inbound (Briggs Chaney Rd) WMATA Z8 (Greencastle Rd) 10, WMATA Z WMATA Z WMATA Z WMATA Z *PK = Peak Periods (6 am 9 am and 3 pm 7 pm), OP = Off-Peak Period ** Route Z6 has two run patterns in inbound direction: starting from Burtonsville and starting from Castle Blvd OP April 2017 Page 109
138 Table 6-2: 2040 No-Build Characteristics of the Local Corridor Bus Routes Route Name/Direction Headway (min) PK OP Run Time (min) Total Route Distance (miles) Average Speed (mph) Ride On 8 Inbound Ride On 8 Outbound Ride On 9 Inbound Ride On 9 Outbound Ride On 10 Inbound Ride On 10 Outbound Ride On 13 Inbound Ride On 13 Outbound Ride On 21 Inbound/Outbound Ride On 22 Inbound Ride On 22 Outbound MTA Commuter Bus MTA Commuter Bus MTA Commuter Bus MTA Commuter Bus MTA Commuter Bus MTA Commuter Bus *PK = Peak Periods (6 am 9 am and 3 pm 7 pm), OP = Off-Peak Period Table 6-3 presents the summary of forecasted boardings on the corridor bus routes in the No- Build alternative. As can be seen from the table, the average weekday ridership on Z-lines is around 17,440 boardings per day, while the total study area ridership is approximately 28,530 boardings (increased from 23,830 in 2015). It should be noted that Ride On and MTA buses show a decrease in ridership from 2015 due to the attractiveness of the Z routes and service changes between 2015 and Table 6-3: Daily Summary of 2040 Forecasted Bi-Directional Transit Boardings for 2040 No-Build Bus Routes/Names PK OP Daily Boardings WMATA Z Buses (Z2, Z6, Z8, Z29) 14,870 2,570 17,440 Ride On Buses (8,9,10,13,21,22) 1,680 1,440 3,120 MTA Buses (201,202,203,305,315,325) 7, ,970 Total 24,450 4,080 28,530 *PK = Peak Periods (6 am 9 am and 3 pm 7 pm), OP = Off-Peak Period **Numbers rounded to the nearest 10 April 2017 Page 110
139 Ridership Forecast for Alternative A This section presents 2040 ridership forecasting results for Alternative A. For reporting purposes, certain BRT stations were grouped together. Table 6-4 presents the station groups and corresponding stations. Table 6-4: Station Groups and Corresponding BRT Stations Station Group Silver Spring Transit Center Fenton Street University Boulevard Burnt Mills/Lockwood Drive Stewart Lane and April Lane Tech Road Briggs Chaney Road and Park and Ride Castle Boulevard Burtonsville Park and Ride Stations Silver Spring Transit Center Fenton Street University Boulevard Burnt Mill Shopping Center Oak Leaf Drive White Oak Transit Center Stewart Lane and April Lane Tech Road Briggs Chaney Road Briggs Chaney Park and Ride Castle Blvd and Castle Terrace Castle Blvd and Woodlake Drive Burtonsville Park and Ride As seen from the Table 6-5, the total BRT ridership in the forecast year is approximately 18,120 boardings, with approximately 53 percent of the boardings in the peak periods and 47 percent in off-peak period. Stations with the highest boardings are Silver Spring Transit Center (29 percent of total boardings), Fenton Street (14 percent), Stewart Lane and April Lane (13 percent), and Tech Road (15 percent). Table 6-5: 2040 Alternative A Forecasted BRT Boardings by Time of Day Station/Station Group PK OP Daily Boardings Silver Spring Transit Center 3,240 2,050 5,290 Fenton Street 910 1,690 2,600 University Boulevard ,100 Burnt Mills/Lockwood Drive ,100 Stewart Lane and April Lane 1,130 1,290 2,420 Tech Road 1,590 1,110 2,700 Briggs Chaney Road and Park and Ride Castle Boulevard Burtonsville Park and Ride 1, ,290 Total 9,600 8,520 18,120 * PK = Peak Periods (6 am 9 am and 3 pm 7 pm), OP = Off-Peak Period. **Numbers rounded to the nearest 10. April 2017 Page 111
140 Table 6-6 presents the summary of boardings on the BRT line as well as on the corridor bus routes as a result of the implementation of Alternative A. As can be seen from the table, the daily ridership was estimated to be 6,400 on Z-lines, 2,220 on Ride On buses, and 8,150 boardings on MTA buses, with the total study area ridership summing up to 34,890, which is an increase of 6,300 boardings from the No-Build. The ridership would increase by two percent in the peak periods and by 147 percent in the off-peak period in comparison to the No-Build. Table 6-6: 2040 Alternative A Forecasted Daily Transit Boardings BRT/Bus Route PK OP Daily Boardings Alternative A BRT 9,600 8,520 18,120 WMATA Z Buses (Z2, Z6, Z8, Z29) 5, ,400 Ride On Buses (8,9,10,13,21,22) 1, ,220 MTA Buses (201,202,203,305,315,325) 8, ,150 Total 24,830 10,060 34,890 * PK = Peak Periods (6 am 9 am and 3 pm 7 pm), OP = Off-Peak Period ** Boarding numbers have been rounded to the nearest 10 In comparison with the No-Build scenario, there is an increase of 4,530 daily linked transit trips for Alternative A (see Table 6-12), including those from/to and within the corridor. Home-based work (HBW) transit trips for Alternative A constitute the highest share of transit trips with approximately 71 percent of regional transit trips. There are approximately 17 percent of home-based other (HBO) trips and relatively a small share of non-home based (NHB), home-based school (HBS) and non-home based other (NHO) trips. Within the study area, White Oak and Silver Spring districts produce and attract the highest number of transit riders on the BRT in comparison to other districts. Transit trips are different from boardings in that they are linked trips defined by the origin and destination and trip purpose, while boardings represent the number of times riders board the transit vehicle. A linked transit trip can have more than one boarding Ridership Forecast for Alternative B This section presents 2040 ridership forecasting results for Alternative B. Table 6-7 presents boardings by station and station groups on US 29 for Alternative B. As seen from the table, the total BRT ridership in the forecast year is approximately 16,430 boardings, with approximately 51 percent of the boardings in the peak periods and 49 percent in off-peak period. Stations with April 2017 Page 112
141 the highest boardings are Silver Spring Transit Center (34 percent of total boardings), Fenton Street (12 percent) and Stewart Lane and April Lane (14 percent) and Tech Road (15 percent). Table 6-7: 2040 Alternative B Forecasted BRT Boardings by Time of Day Station/Station Group PK OP Daily Boardings Silver Spring Transit Center 3,180 2,330 5,510 Fenton Street 500 1,420 1,920 University Boulevard ,080 Burnt Mills/Lockwood Drive ,150 Stewart Lane and April Lane 1,050 1,230 2,280 Tech Road 1,520 1,080 2,600 Briggs Chaney Road Park and Ride Castle Boulevard Burtonsville Park and Ride ,100 Total 8,390 8,040 16,430 * PK = Peak Periods (6 am 9 am and 3 pm 7 pm), OP = Off-Peak Period ** Boarding numbers have been rounded to the nearest 10 Table 6-8 presents the summary of boardings for Alternative B as well as on the corridor bus routes as a result of the implementation of the build alternative. As can be seen from the table, the daily ridership was estimated to be 6,740 on Z-lines, 2,300 on Ride On buses, and 8,200 boardings on MTA buses, the sum of the total study area ridership being 33,670, which is an increase of 5,140 boardings from the No-Build. The ridership will decrease by two percent in the peak periods and increased by 140 percent in the off-peak period in comparison to the No- Build. Table 6-8: 2040 Alternative B Forecasted Daily Transit Boardings BRT/Bus Route PK OP Daily Boardings Alternative B BRT 8,390 8,040 16,430 WMATA Z Buses (Z2, Z6, Z8, Z29) 6, ,740 Ride On Buses (8,9,10,13,21,22) 1, ,300 MTA Buses (201,202,203,305,315,325) 8, ,200 Total 23,880 9,790 33,670 * PK = Peak Periods (6 am 9 am and 3 pm 7 pm), OP = Off-Peak Period ** Boarding numbers have been rounded to the nearest 10 April 2017 Page 113
142 There is an overall increase of approximately 3,580 transit trips for Alternative B (see Table 6-12). Regional HBW transit trips for Alternative B constitute the highest share of transit trips, with approximately 71 percent of regional transit trips. There are approximately 17 percent of HBO trips and a relatively small share of NHB, HBS and NHO trips. Within the study area, White Oak and Silver Spring districts produce and attract the highest number of transit riders on the BRT when compared to other districts. To properly assign traffic volumes in the VISSIM model for the managed lanes in Alternative B and Alternative B Modified, it was necessary to determine what vehicles that qualify as HOV 2+ would use these lanes between Timberwood Avenue and Prelude Drive north of the Beltway, and between Sligo Creek Parkway and Fenton Street south of I-495. This was done by reviewing the peak period volumes assigned to the peak period/direction HOV 2+ lanes coded into the 2040 MWCOG model network along US 29 for Alternatives B and B Modified. When compared to the overall 2040 No-Build peak hour volumes on US 29, the 1,300 and 900 peak hour HOV 2+ volumes account for over 35% of total volume in the peak direction between Timberwood and Prelude, and over 25% between Sligo Creek and Fenton. As the MWCOG model does not account for friction from stopped busses and right-turning traffic in the managed lanes, it was the opinion of the forecasting team that the assignment of peak period/direction traffic to the HOV lanes exceeding 25% of total traffic volumes in all lanes would be too aggressive. It was also noted that recent vehicle occupancy counts taken for Montgomery County DOT along the corridor showed that in 2015 that only 15% of passenger vehicles were found to be HOV 2+ eligible, generally matching the 2015 model results. Based on vehicle occupancy counts, it was decided that the appropriate percentage to use for HOV 2+ vehicles to total vehicles was 25 percent in the managed lanes for Alternatives B and B Modified. This results in volumes in the range of 500 to 1050 peak hour HOV 2+ vehicles on the managed lanes in this corridor. When comparing the total peak hour/direction HOV 2+ volumes for all lanes of traffic forecast to be on US 29 in 2040 between the No-Build Alternative and Alternative B and B Modified, the HOV 2+ volumes are forecasted to increase by over 60 percent in the AM and PM peaks when compared to the No-Build Ridership Forecast for Alternative B Modified This section presents 2040 ridership forecasting results for Alternative B Modified. Table 6-9 presents boardings by station and station groups on US 29 for Alternative B Modified. As seen from the table, the total ridership in the forecast year is approximately 17,310 boardings, with approximately 52 percent of the boardings in the peak periods and 48 percent in off-peak April 2017 Page 114
143 period. Stations with the highest boardings are Silver Spring Transit Center (34 percent of total boardings), Fenton Street (12 percent) and Stewart Lane and April Lane (13 percent) and Tech Road (16 percent). Table 6-9: 2040 Alternative B Modified Forecasted BRT Boardings by Time of Day Station/Station Group PK OP Daily Boardings Silver Spring Transit Center 3,480 2,390 5,870 Fenton Street 530 1,460 1,990 University Boulevard ,110 Burnt Mills/Lockwood Drive ,180 Stewart Lane and April Lane 1,050 1,250 2,300 Tech Road 1,630 1,110 2,740 Briggs Chaney Road Park and Ride Castle Boulevard Burtonsville Park and Ride 1, ,350 Total 9,070 8,240 17,310 * PK = Peak Periods (6 am 9 am and 3 pm 7 pm), OP = Off-Peak Period ** Boarding numbers have been rounded to the nearest 10 Table 6-10 presents the summary of boardings for Alternative B Modified as well as on the corridor bus routes as a result of the implementation of the build alternative. As can be seen from the table, the daily ridership was estimated to be 6,530 on Z-lines, 2,370 on Ride On buses, and 8,180 boardings on MTA buses, the sum of the total study area ridership being 34,390, which is an increase of 5,860 boardings from the No-Build. The ridership would not change in the peak periods and increase by 144 percent in the off-peak period in comparison to the No-Build. Table 6-10: 2040 Alternative B Modified Forecasted Daily Transit Boardings BRT/Bus Route PK OP Daily Boardings Alternative B Modified BRT 9,070 8,240 17,310 WMATA Z Buses (Z2, Z6, Z8, Z29) 5, ,530 Ride On Buses (8,9,10,13,21,22) 1, ,370 MTA Buses (201,202,203,305,315,325) 8, ,180 Total 24,440 9,950 34,390 * PK = Peak Periods (6 am 9 am and 3 pm 7 pm), OP = Off-Peak Period ** Boarding numbers rounded to the nearest 10 April 2017 Page 115
144 There is an overall increase of approximately 3,600 transit trips for Alternative B Modified (see Table 6-12 below). Regional HBW transit trips for Alternative B Modified constitute the highest share of transit trips, with approximately 71 percent of regional transit trips. There are approximately 17 percent of HBO trips and a relatively small share of NHB, HBS and NHO trips. Within the study area, the White Oak and Silver Spring districts produce and attract the highest number of transit riders on the BRT when compared to other districts Summary of Ridership Forecasts Table 6-11 summarizes the ridership forecasts for the No-Build when compared with Alternatives A, B, and B Modified. As can be seen in the table, Alternative A results in 22 percent increase in total corridor ridership in comparison to No-Build scenario, and similarly, forecasts show 18 percent increase in ridership for Alternative B and 20 percent increase in ridership for Alternative B Modified. Alternative A attracts more BRT and total transit riders in comparison to Alternatives B and B Modified. Table 6-11: Summary of 2040 Forecasted Boardings on BRT and other Corridor Routes by Alternative Daily Boardings Bus Routes/Names No-Build Alternative A Alternative B Alternative B Modified BRT 0 18,120 16,430 17,310 WMATA Z Buses (Z2, Z6, Z8, Z29) 17,440 6,400 6,740 6,530 Ride On Buses (8,9,10,13,21,22) 3,120 2,220 2,300 2,370 MTA Buses (201,202,203,305,315,325) 7,970 8,150 8,200 8,180 Total 28,530 34,890 33,670 34,390 * Boarding numbers have been rounded to the nearest 10 Table 6-12 summarizes regional transit trips by trip purpose for the No-Build scenario and Alternatives A, B, and B Modified. As can be seen in the table, Alternative A results in a 4,530 transit trips increase from the No-Build scenario, and similarly, forecasts show a 3,580 transit trips increase for Alternative B and a 3,600 transit trips increase for Alternative B Modified. April 2017 Page 116
145 Table 6-12: Summary of 2040 Regional Transit Trips by Trip Purpose and Alternative Trip Purpose No-Build Alternative A Alternative B Alternative B Modified HBW 1,118,230 1,118,590 1,118,210 1,118,170 HBO 270, , , ,710 NHB 124, , , ,140 HBS 21,800 22,030 22,000 22,000 NHO 40,610 41,330 41,240 41,270 Total 1,575,690 1,580,220 1,579,270 1,579,290 Home-based work (HBW), Home-based other (HBO), Non-home based (NHB), Home-based school (HBS), Non- Home based other (NHO) * Numbers have been rounded to the nearest 10 Table 6-13 presents a summary of changes in auto vehicle miles traveled (VMT) and transit person miles traveled (PMT) for Alternatives A, B, and B Modified, in comparison to the No- Build. Transit PMT measure indicates the magnitude of total transit travel as a result of implementing the alternatives. As seen from the tables, all build alternatives would reduce auto VMT but increase transit PMT relative to the No-Build, which is an indication of the project s effectiveness in promoting transit when compared to auto. Table 6-13: Summary of Regional Daily Changes in VMT and PMT in Comparison to No-Build Measure No-Build Alternative A Alternative B Alternative B Modified Auto VMT (miles) 4,376,860 4,373,640 4,366,750 4,367,180 Transit PMT (miles) 234, , , ,240 Changes in Auto VMT versus No-Build -3,220-10,110-9,680 Changes in Transit PMT versus No-Build 34,800 26,300 19,170 * Numbers have been rounded to the nearest 10 Transit accessibility was estimated in terms of population and employment reachable within 45 minutes and 60 minutes via transit to and from the study area as a result of implementing Alternatives A, B, and B Modified. Table 6-14 presents a summary of accessibility changes in terms of population and employment accessible within 45 minutes and 60 minutes via transit to and from the study area as a result of implementing Alternatives A, B, and B Modified. As can be seen from the table, all alternatives would increase accessibility, relative to the No-Build. April 2017 Page 117
146 Table 6-14: Summary of Forecasted 2040 Accessibility Changes by Alternative Measure No-Build Alternative A Alternative B Alternative B Modified Population within 45 min by transit 439, , , ,000 Population within 60 min by transit 964, , , ,400 Employment within 45 min by transit 543, , , ,700 Employment within 60 min by transit 1,160,500 1,167,400 1,164,700 1,160,500 Population change versus No-Build within 45 min 20,800 17,800 17,000 Population change versus No-Build within 60 min 2, Employment change versus No-Build within 45 min 11,900 10,200 10,400 Employment change versus No-Build within 60 min 6,900 4,200 0 * Numbers have been rounded to the nearest 10 Based on the max load analysis, in Alternative A each route pattern would have to run every eight minutes (combined headway of four minutes) and in Alternative B, each pattern would have to run every 10 minutes. The operating plan had each pattern running every 12 minutes. These conclusions should be revisited as these alternatives are further developed Forecasted 2040 Traffic Operations The following sections describe the travel demand analysis and forecasted future traffic operations associated with the 2040 No-Build condition and proposed conceptual build alternatives Existing Conditions Model Calibration SHA provided previously calibrated VISSIM models for the downtown Silver Spring area (from US 29 at MD 97 to Sligo Creek Parkway) and US 29 at I-495. Using these as a base, VISSIM models were further developed for the BRT project s expanded study area to model and simulate the typical weekday AM and PM peak hours under existing conditions. The VISSIM study network is shown in Figure 6-2. Additionally, Synchro models were obtained and further developed for signal timing optimization purposes and for the purposes of identifying initial ridership modeling assumptions. Existing 2015 peak hour VISSIM models for 8:00 AM to 9:00 AM and 5:00 PM to 6:00 PM were calibrated to match balanced intersection turning movement counts and link volume data within the study area. The VISSIM model was also calibrated to match existing field-confirmed travel times and meet the validation targets of an overall 10 percent difference along the entire corridor and +/- 30 seconds along the smaller travel time segments through links between intersections. The following input sources were used to help develop and refine the VISSIM Model: April 2017 Page 118
147 Operational Patterns Transit Signal Priority Background Bus Network Changes Pedestrian Volumes Assumed Future Development and Infrastructure Projects in the CLRP Local Bus Ridership and Dwell Time Table 6-15 provides a summary of the assumptions used for the Synchro and VISSIM modeling efforts of the 2040 No-Build Alternative, Alternative A, Alternative B, and Alternative B Modified. April 2017 Page 119

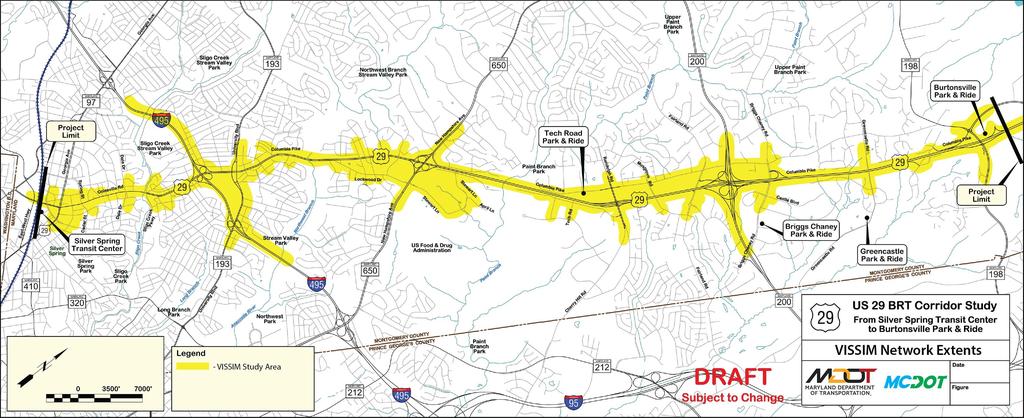
148 April 2017 Page
149 Table 6-15: Summary of Synchro and VISSIM Modeling Assumptions Assumptions No-Build Alternative Alternative A Alternative B Alternative B Modified Traffic Signals at US 29 at MD 193: Traffic Signals at US 29 at MD 193: Traffic Signals at US 29 at MD 193: Proposed No improvements beyond what is reroute left turn movements from reroute left turn movements from reroute left turn movements from Changes to already included in the region s 2040 east and west to the existing jughandles then right on US 29. handles then right on US 29. handles then right on US east and west to the existing jug- east and west to the existing jug- Operations CLRP (2014) 29. Traffic Volumes Signal Timing Local Bus Boardings/ Dwell Time BRT Boardings/ Dwell Time Transit Signal Priority -MWCOG Regional Model -NCHRP 756 methodologies Synchro and VISSIM models developed and updated with optimized signal timings. Ride On Boardings North of I-495: +46% Ride On South of I-495: +0% WMATA North of I-495: +20% WMATA South of I-495: +5% N/A N/A Alternative A volumes remain the same as No-Build.* No-Build models updated with Alternative A lane configurations and corresponding optimized signal timing where applicable (optimized split, phase order, and cycle length). The changes in local bus ridership with Alternative A were obtained from the MWCOG model; changes represent decreases in local bus ridership due to riders switching from local buses to the BRT and some eliminated/modified transit lines. Daily Boardings: 18,120 Dwell Times reduced by 25% compared to Local Bus. TSP thresholds met at two locations (AM only): -US 29 at Industrial Parkway -US 29 at Old Columbia Pike Connector Overall traffic volumes are assumed to decrease by up to 600 vehicles, depending upon location. Up to 25% of vehicles assumed to be HOV using managed lanes. 60% overall increase in HOV from No- Build during AM and PM Peak. No-Build models updated with Alternative B lane configurations and corresponding optimized signal timing where applicable (optimized split, phase order, and cycle length). The changes in local bus ridership with Alternative B were obtained from the MWCOG model; changes represent decreases in local bus ridership due to riders switching from local buses to the BRT and some eliminated/modified transit lines. Daily Boardings: 16,430 Dwell Times reduced by 25% compared to Local Bus. TSP thresholds met at two locations (AM only): -US 29 at Industrial Parkway -US 29 at Old Columbia Pike Connector Alternative B Modified volumes (including HOV) match the forecasted volumes for Alternative B. No-Build models updated with Alt. B Modified lane configurations and corresponding optimized signal timing where applicable (optimized split, phase order, and cycle length). The changes in local bus ridership with Alternative B Modified were obtained from the MWCOG model; changes represent decreases in local bus ridership due to riders switching from local buses to the BRT and some eliminated/modified transit lines. Daily Boardings: 17,310 Dwell Times reduced by 25% compared to Local Bus. TSP thresholds met at two locations (AM only): -US 29 at Industrial Parkway -US 29 at Old Columbia Pike Connector * While it is possible that some travelers that use their vehicles in the No-Build Alternative may shift to the new BRT service with Alternative A, the MWCOG model is demonstrating that there is enough latent demand for traveling the US 29 corridor that the drivers shifting modes from personal vehicle to transit will essentially be replaced or balanced out by latent demand. April 2017 Page 121
150 Alternative A Traffic Analysis Findings Summary The Alternative A proposed conversion of a general traffic lane in the peak direction to a BAT lane generates a range of effects. Alternative A would result in a lower BRT travel time through the median-lane and BAT-lane sections than the time for local bus or cars and trucks under No- Build conditions. However, there would be increased non-brt vehicular travel time under Alternative A, increased delay at intersections with LOS F, increased number of vehicles denied entry (i.e., latent demand), and decreased vehicle throughput during the peak hours. The decrease in vehicle throughput results in an apparent improvement in traffic operations in some segments because fewer vehicles entering the corridor leads to improved travel times along US 29 and a decrease in miles of LOS E or F conditions. Alternative A reduces vehicle capacity along US 29 in the peak directions. In addition, subsequent studies of Alternative A will need to evaluate the traffic safety associated with the weaving conditions introduced to BRT in each southbound/northbound direction between the start/end point of the median BRT lane and the on/off ramp of Burtonsville park-and-ride/md 198 interchange Alternative B Traffic Analysis Findings Summary Due to the HOV vehicles and BRT service, Alternative B increases the total person throughput at all locations identified in the AM peak and along Lockwood Drive/Stewart Lane and US 29 north of Greencastle Road in the PM peak, while resulting in a decrease to the total vehicles within the network. The decrease in vehicle throughput results in some segments experiencing improvements; i.e., because fewer vehicles entering the corridor result in reduced travel times along US 29 and a decrease in miles of LOS E or F conditions. The overall impact of Alternative B shows that vehicular capacity is reduced, but that reduction is offset by higher vehicle occupancies. Another advantage of Alternative B is that it provides a BRT option with overall travel times that decrease by more than 10 percent in the peak direction, as compared to the local bus travel time in the No-Build Alternative. However, Alternative B s repurposing of a general Overall, there is over a 60 percent increase in HOV vehicles in all lanes from the No-Build during the AM and PM peak hours with Alternative B and B Modified. traffic lane in the peak direction to a managed lane generates impacts to traffic operations, including increased travel time during both peaks for cars and trucks through the managed lane section, increased delay at intersections with LOS F, and increased number of vehicles denied entry (i.e., latent demand). In addition, subsequent studies of Alternative B will need to evaluate the traffic safety associated with the higher volumes of buses operating on the outside shoulders as compared to the existing conditions. Specifically, the convergence zones of April 2017 Page 122
151 shoulders and interchange ramps will need to be evaluated for potential safety hazards with a higher volume of buses expected to operate on the outside shoulders Alternative B Modified Traffic Analysis Findings Summary Due to the HOV vehicles and BRT service, Alternative B Modified increases the total person throughput at all locations identified in the AM peak and along Lockwood Drive/Stewart Lane and US 29 north of Greencastle Road in the PM peak, while resulting in a decrease to the total vehicles within the network. The decrease in vehicle throughput results in some segments experiencing improvements; i.e., because fewer vehicles entering the corridor results in improved travel times along US 29 and a decrease in miles of LOS E or F conditions. The overall impact of Alternative B Modified shows that vehicular capacity is reduced, but that reduction is offset by higher vehicle occupancies. In the northern section of the corridor, widening into the median space to create an exclusive bus and BRT lane significantly improves travel time for these modes with fewer impacts to general traffic. However, the repurposing of a general traffic lane in the peak direction to a managed lane generates a range of impacts, including increased travel time for the AM and PM peak directions through the southern managed lane section, increased delay at intersections with LOS F, and increased number of vehicles denied entry (i.e., latent demand). Similar to Alternative A, subsequent studies of Alternative B Modified will need to evaluate the traffic safety associated with the weaving conditions introduced to BRT in each southbound/northbound direction between the start/end point of the median shoulder BRT lane and the on/off ramp of Burtonsville park-and-ride/md 198 interchange Traffic Operations Results: Alternatives Comparison The traffic analysis results for the BRT alternatives along the US 29 corridor indicate a range of advantages and disadvantages for various roadway users when compared to the No-Build Alternative. In the peak period directions (i.e., southbound in AM; northbound in PM), corridorlevel travel times for the BRT are better than for the local buses during similar No-Build conditions. During the AM peak in the southbound direction, person throughput increases at all six measured locations with the BRT alternatives when compared to No-Build conditions except at a point north of Franklin Avenue with Alternative A where person throughput decreases less than two percent. During the PM peak in the northbound direction, person throughput increases at four of the six measured locations with the BRT alternatives compared to No-Build conditions. The conversion of a general traffic lane to a BAT lane (Alternative A) or managed lane (Alternative B and Alternative B Modified) in the southern portion of the corridor causes pinch points and queues that impact the northern portion of the corridor to various extents. However, the off-peak direction operates similarly to the No-Build Alternative for both April 2017 Page 123
152 alternatives. The peak direction traffic analysis results are summarized below. Table 6-16 provides a comparison summary of the alternatives Future Modeling Refinements Possible refinements to the traffic modeling operations and transit and roadway improvements that may be considered as part of future analyses and design to further improve transportation performance associated with implementing the proposed BRT service include the following: Traffic Modeling and Transit Operations Refinements: o Enhancing signal timing refinements to reduce intersection delay, latent delay, and corridor travel time; o Refining TSP locations with early green/green extension adjustments; o Improving passive coordination by adjusting offsets to improve progression for BRT vehicles, particularly at BRT stations where BRT dwell time may degrade progression; o Providing conditional TSP along the corridor to serve BRT, local, and commuter buses; o Modifying Alternative B such that the managed lanes begin north of Sligo Creek Parkway; o Maintaining the Ride On service routes 21 and 22; o Removing the dedicated or managed lanes south of I-495 in both directions; o Implementing pedestrian improvements at locations with increased pedestrian activity to remove the conflict between general traffic and pedestrians; o Enhanced Transportation Demand Management programs to reduce single-occupant vehicle demand; and o Alternative bus routing, particularly near the Silver Spring CBD. Roadway Improvements to Consider: o Providing additional roadway capacity at existing constraints, where feasible; o Improving the intersection at US 29 at MD 193 (including turning restrictions, rerouting traffic, and signal phasing/timing modifications); o Constructing a third southbound lane along US 29 over MD 650; o Identify and evaluate the need for improvements at US 29 at Tech Road (including an interchange or other intersection improvements); and o Constructing a pedestrian overpass at US 29 at Tech Road. It should be noted that most of these refinements have not been modeled as part of this phase of the project. However, they may be considered if these alternatives are further developed. April 2017 Page 124
153 Alternative Description: Corridor Travel Time by Vehicle Type (minutes) Northbound Southbound Table 6-16: US 29 BRT Alternative Comparison Table 2040 AM Peak Hour 2040 PM Peak Hour No-Build Alt A Alt B Alt B Modified No-Build Alt A Alt B Alt B Modified Cars and Trucks Local Bus BRT N/A N/A Weighted by Person Cars and Trucks Local Bus BRT N/A N/A Weighted by Person Person Throughput at Select Locations (people) Northbound Southbound South of Fenton St 1,390 1,560 1,580 1,590 3,260 2,320 2,490 2,750 North of Franklin Ave 2,090 2,450 2,370 2,390 4,770 4,470 4,670 4,700 South of Burnt Mills Shopping Center 3,140 3,450 3,430 3,440 5,300 5,100 5,540 5,590 On Lockwood Dr ,290 1,250 1,250 North of Stewart Ln 3,080 3,290 3,310 3,310 4,000 4,490 4,460 4,590 North of Greencastle Rd 3,060 3,070 3,070 3,090 3,940 4,200 4,170 4,230 North of Greencastle Rd 4,410 4,720 4,660 4,740 3,410 3,420 3,420 3,430 North of Stewart Ln 3,270 3,310 3,590 3,610 3,260 3,550 3,510 3,560 On Lockwood Dr South of Burnt Mills Shopping Center 4,450 4,480 4,950 4,950 3,390 3,670 3,630 3,610 North of Franklin Ave 4,480 4,410 4,980 5,010 2,580 2,720 2,670 2,690 South of Fenton St 3,730 3,990 4,150 4,230 1,790 1,950 2,010 1,990 Miles of Poor or Failing Vehicle Speeds Along US 29 (miles) LOS E or F Intersections Operating at LOS E or F LOS E or F Network Statistics Total Delay (seconds) 1 12,276,000 14,082,000 14,704,000 15,119,000 13,102,000 14,580,000 13,345,000 13,482,000 % Latent Demand (of all vehicles) 2 3% 6% 7% 7% 7% 11% 9% 9% 1 Total delay includes side street delay; does not include latent delay 2 Latent Demand/[Vehicles(arrived)+Vehicles(active)+Latent Demand]; Latent demand includes the vehicles that could not be served during the one-hour peak simulation period 10% or more worse than No-Build 10% or more better than No-Build April 2017 Page 125
154 6.4.2 Potential Socioeconomic, Cultural, and Natural Environmental Impacts Potential impacts to socioeconomic, cultural, and natural environmental resources are summarized in sections and in Table 6-17 below Potential Socioeconomic Impacts to Properties (Right-of-Way) The No-Build Alternative would require no right-of-way impacts or displacements. Each of the conceptual build alternatives would require both temporary easements to facilitate construction activities and permanent property acquisition throughout the study corridor. At this time there are no anticipated displacements or relocations of existing residences or businesses. Due to the preliminary nature of the design detail and property boundary data, the potential right-of-way impacts are provided as ranges for the purposes of these preliminary study findings Potential Impacts to Cultural Resources (Historic Properties) The No-Build Alternative would not impact any existing historic properties within the study corridor. Each of the conceptual build alternatives have the potential to impact historic properties, as summarized in Table Future studies will need to perform a full effects determination study to document the potential impacts to these resources along with all minimization and avoidance options investigated. Due to the preliminary nature of the design detail and historic property boundary data, the potential impacts are provided as ranges for the purposes of this report Potential Impacts to Waters of the U.S., Including Wetlands, Floodplains, and Forested Areas The No-Build Alternative would require no impacts to Waters, Wetlands, Floodplains, or Forested Areas. Each of the conceptual build alternatives would potentially impact these existing natural environmental features as summarized in Table Future studies will need to perform detailed resource delineations to document the potential impacts related to the proposed construction needs. Due to the preliminary nature of the design detail and resource boundary data, the potential impacts are provided as ranges for the purposes of this report. April 2017 Page 126
155 Table 6-17: Alternatives Comparison Matrix Environmental Impacts Evaluation Criteria No-Build Alternative Alternative A Alternative B Alternative B Modified Socioeconomic Total ROW Required (acres) Properties Impacted (number) Residential Relocations (number) Business Displacements (number) Public Parks Affected (number) Public Park Property Required (acres) Total Number of Public/Community Facilities Permanently Impacted Cultural Resources Historic Properties (acres) Natural Resources Stream Impact (linear feet) Year Floodplain (acres) Wetlands (acres) Forests (acres) Federally or State Listed RTE Species (number) Impacts to Water Quality and Groundwater Modification of hydrologic features due to construction activities could impact water quality. Alternative A would result in approximately 9.5 acres of new impervious surface. Alternative B would result in approximately three acres. Alternative B Modified would have approximately nine acres of new impervious surface. The introduction of new impervious surfaces could modify existing hydrology and possibly destabilize channel and stream banks, increase erosion and sediment loads in the stream, and affect overall water quality. Using the Best Management Practices (BMPs) in accordance with Maryland s Stormwater Management Act (MSMA), the Study Team has initiated the conceptual development of new proposed stormwater management and environmental site design facilities throughout the corridor to address preliminary estimates for stormwater management retention and treatment. See alternatives mapping in Appendix A for the location of these proposed facilities. In some cases these proposed facilities may require temporary and permanent right-of-way acquisition. Additional detailed studies will be required to finalize these study findings. April 2017 Page 127
156 6.4.3 Estimated Costs The following is a description of the methodology and resulting cost estimating analysis for the proposed conceptual build alternatives Cost Estimating Methodology The following sections describe the preliminary methodologies used to develop planning-level costs estimates for preliminary conceptual proposed roadway and station infrastructure improvements associated with Alternatives A, B, and B Modified. Due to the preliminary nature of the data available and the considerable number of unknown design challenges that could arise, the Study Team developed high-end and low-end estimates for the conceptual build alternatives. The high-end estimates represent a conservative approach for the highest assumed magnitude of infrastructure improvements and associated costs involved. Conversely, the low-end estimates represent a scenario where the needed improvements are assumed to be less complicated and therefore less expensive. Differences in material quantities, element sizes, finishes, and amenities vary depending upon the high-end versus low-end estimating approach. In addition, currently non-quantifiable construction elements related to drainage, utility relocation, traffic, landscaping, environmental monitoring, and systems integration were accounted for using industry accepted methods of applying percentage-based calculations to develop costs for these unknown items. These percentagebased costs will be used as placeholders until more details on these can be developed and made available as the project progresses. Similar to the quantifiable elements, high-end and low-end percentages were used to generate a range of potential costs Roadway Infrastructure The roadway infrastructure construction costs were developed based on recommended methodology and guidance on unit prices documented in the MDOT/SHA 2015 Highway Construction Cost Estimating Manual and 2016 SHA Price Index. The estimates include various elements related to preliminary site preparation, earthwork, drainage, structures, pavement, shoulders, landscaping, traffic, utilities, and other roadway construction related elements for conceptual Alternatives A, B, and B Modified. Estimations of cost for conceptual Alternatives A, B, and B Modified were prepared. These estimates assign unit costs for all known quantifiable elements associated with the proposed infrastructure improvements. In addition to using quantifiable materials and costs, industry accepted standard practices for projects at this stage of planning commonly utilize percentage-based calculations to account for elements where detailed design information is not currently available. April 2017 Page 128
157 Station and Platform Elements The station costs were calculated using the different size BRT Station typologies described above and guidance on unit prices based on research and previous project experience, such as the CCT BRT project. The US 29 approach is also based on coordination regarding the assumptions and methodology used for the similar MD 586 Corridor Planning Study. The cost of each component was estimated individually using assumed quantities per the station typology and unit cost to calculate the total cost. These costs include the platform and canopies for the passenger waiting area, architectural elements, signage, and general assumptions for the mechanical/electrical/plumbing/ fire protection elements. The Minimal Curbside station typology (9 x 18 platform) has the lowest cost estimate of approximately $175,000 each, followed by the Curbside (Single Bus) station typology (11 x 63 platform) which has a cost of approximately $261,000 each, and the highest cost estimate for the dual bus Curbside Station typology (11 x 125 platform) at $511,000 each. Similar to the roadway portion of the cost estimates, the station and platform design detail is limited at this stage of planning. Percentage-based calculations are also used to account for those elements that cannot be quantified at this time Systems Elements The station costs listed above do not include the systems elements; the MDOT team is recommending that additional costs for the systems elements be added to each station. Based on the 30 percent design cost estimate for the CCT, the estimates for the systems elements that are not included in the cost estimates listed above are: Ticket Vending Machine, Real-Time Passenger Information Display, Emergency Blue Phones, CCTV, Fare Card Validators, Local Area Network (LAN), and potentially System Enclosures (at larger stations). The Minimal Curbside station typology (9 x 18 platform) and the Curbside (Single Bus) station typology (11 x 63 platform) are both assumed to need similar systems elements with a cost of approximately $62,000 each, but the dual bus Curbside Station typology (11 x 125 platform) is assumed to need systems elements with a cost of approximately $144,000. Similar to the roadway and station portion of the cost estimates, the system design detail is limited at this stage of planning. The corridor wide system elements such as running way duct bank/conduits, fiber/wire, and systems junction boxes are assumed as a percentage calculation for the US 29 estimates. As the design progresses, it may be determined that duct bank/conduits, fiber/wire, and systems junction boxes are only needed in limited cases or not at all. April 2017 Page 129
158 The systems estimate does not include Central Control/System Integration elements like dispatch hardware ($20,000 per workstation), AVL integration ($150,000), APC Software ($60,000), or vehicle security monitoring system ($10,000). This will be dependent of the operator of the BRT and/or other corridor connections. If the operator has existing control center, or a control center is constructed under another BRT project, the US 29 BRT may just need additional workstations only Contingencies and Additive Rates The Overhead Additive is an estimate of the incidental costs related to a project. Additives include items such as fringe benefits, vehicles, equipment, lab testing, office supplies, construction inspection, etc. The project costs shown in the Ad Schedule and Consolidated Transportation Program are the neat construction estimate plus the Overhead Additive. The Overhead Additive Rate should also be included in any third party participation if SHA is to provide construction inspection and testing on the work to be done. For this project we are using the SHA recommended Overhead Additive Rate of 15.3 percent for construction of a Major Project. In addition, a Contingency percentage is the amount added to the estimated construction cost to account for unknowns throughout the design process. For this project we are using the SHA recommended contingency percentage of 35 percent for construction of a Major Project currently in the planning/concept development phase Additional Related Infrastructure and Systems Costs The construction costs described above are only one component of the overall project costs. There will also be costs associated with right-of-way acquisition, new bus procurement, and operating costs Right-of-Way Costs Right-of-Way costs were developed utilizing available property value information for properties along the US 29 Corridor. The Study Team utilized available land and improvement (buildings/dwellings) tax assessment data, along with historical property sales data to generate an assumed cost per acre to purchase residential and commercial land. There are no displacements anticipated for this project, so no building purchases are included in the estimates. Future phases of study will need to coordinate with SHA to refine and finalize potential right-of-way cost estimates Preliminary Bus Procurement Montgomery County DOT is preparing the specifications for the BRT buses now. Until more information is made available, the Study Team is assuming the total cost of buses will be April 2017 Page 130
159 approximately $1 million each. At this time, based on the operating assumptions and anticipated ridership, the following number of buses would need to be purchased for each alternative: Alternative A 21 Buses at $21million Alternative B 17 Buses at $17 million Alternative B Modified 19 Buses at $19 million Preliminary Annual System Operations The Study Team is estimating that the annual system operations of buses, including driver, fuel, maintenance, cleaning, etc., will cost $8.8 to $9.8 million for Alternative A, $7.6 to $8.6 million for Alternative B, and $8.5 to $9.5 million for Alternative B Modified. While system operations are not considered part of the total capital costs, they are an important factor to consider when evaluating different alternatives and their respective operating needs Cost Summary Table 6-18 provides a summary of the estimated costs to construct the BRT infrastructure needs to support the proposed alternatives. All costs are presented in ranges. Construction costs, right-of-way costs, and bus procurement are combined to estimate the total capital costs. The system operations costs are noted separately; however, they carry similar importance for comparing alternatives. Table 6-18: Summary of Estimated Infrastructure Costs Construction Cost ($M) Right-of-Way Cost ($M) Bus Procurement Cost ($M) Total Capital Costs ($M) Annual Operations Cost ($M) Alternative A $80 to $112.4 $1.5 to $3.0 $21 $102.5 to $136.4 $8.8 to $9.8 Alternative B $60 to $107.9 $2.0 to $4.5 $17 $79.0 to $129.4 $7.6 to $8.6 Alternative B Modified $77 to $105.6 $1.5 to $3.0 $19 $97.5 to $127.6 $8.5 to $ Level Four: Environmental Analysis/Preliminary Engineering Completing the four step process outlined at the beginning of this Chapter, the Study Team would continue the project development by formally entering into the NEPA process and carry on the more detailed environmental analysis and preliminary design engineering for the recommended alternative. This recommended alternative would be presented to the public, elected officials, and other decision makers as the option that would be carried forward for April 2017 Page 131
160 NEPA approvals and preliminary design and engineering (up to 30 percent design). Federal, State, and local agencies would need to concur or comment on the recommendation and the lead Federal Agency would need to provide NEPA concurrence and approvals before any federal funds can be used to implement the alternative. Once these approvals have been achieved, the alternative would require environmental clearances to move forward through future design and construction implementation phases. Level Four was not completed for this study. April 2017 Page 132
161 7 Public Involvement and Agency Coordination 7.1 Introduction Public Involvement has played an important role in the and includes CAC and a project web site which are described in more detail below. 7.2 Corridor Advisory Committees At the outset of the, the County initiated two CACs comprised of stakeholders representing the US 29 Study Area. The work of the CACs began with a kickoff meeting on February 28, 2015 and has continued through the publication of this report. The US 29 South CAC includes approximately 40 stakeholders focused on the southern part of the Study Area from Silver Spring to the White Oak area. The US 29 North CAC includes approximately 15 stakeholders focused on the northern part of the Study Area from the White Oak area to Burtonsville. The Mission Statement for the US 29 North and South CACs is to: Give community participants the opportunity to provide input to all planning and design efforts. Provide the opportunity to discuss study assumptions and methodologies. Fulfill County Council requirements for transparency and community involvement. Provide the opportunity for interaction and information-sharing among impacted residents/communities, property owners of businesses/institutions, transportation agency representatives, and transportation system users. Study and discuss potential community impacts in a comprehensive manner that supports cost-effective and context sensitive and community sensitive implementation outcomes. Serve as a clearinghouse for sharing of timely and accurate information on the studies and plans in each section of the corridor. Share information from the CAC meetings with the community groups that members represent and share input received from them during subsequent CAC meetings; and Provide leadership and build consensus within the community to coalesce diverse interests and address stakeholder issues. The work of both the US 29 North and South CACs progressed concurrently with each group following roughly the same schedule and receiving similar technical content. In addition, each CAC had a unique professional facilitator to lead the CAC meetings and be the point of contact for all correspondence before and after CAC meetings. April 2017 Page 133

162 Although the topic and goal of each CAC meeting was unique, the general meeting approach was to make structured presentations followed by opportunities to ask questions or make comments. Each meeting typically wrapped up with breakout exercises or table-top discussions designed to provide opportunities for the CAC members to provide feedback on the progress of the planning study and to speak one on one directly with a Study Team member. Each meeting typically lasts between 2.5 and three hours. Figure 7-1: Study Team Members Discuss Proposed Station Locations with CAC Members 7.3 CAC Schedule of Meetings The following is the CAC meeting schedule through the publication of this report. The topics for each meeting are discussed in the next section. US 29 South CAC Meeting #1 February 28, 2015 Meeting #2 March 31, 2015 Meeting #3 June 2, 2015 Meeting #4 September 10, 2015 Meeting #5 December 2, 2015 Meeting #6 May 24, 2016 Meeting #7 July 14, 2016 Meeting #8 September 26, 2016 Meeting #9 January 31, 2017 April 2017 Page 134
163 US 29 North CAC Meeting #1 February 28, 2015 Meeting #2 March 26, 2015 Meeting #3 May 28, 2015 Meeting #4 September 8, 2015 Meeting #5 December 1, 2015 Meeting #6 May 18, 2016 Meeting #7 July 20, 2016 Meeting #8 September 22, 2016 Meeting #9 February 2, 2017 In addition to the above referenced CAC meetings, there was a combined (north and south) US 29 CAC Open House on February 1, The purpose of the CAC Open House was to allow members of the CAC to interact with project team members on the Draft Preliminary Purpose and Need document prior to submitting questions and comments. All information related to the work of the CACs is posted on the project websites. See below for more details on the websites. 7.4 CAC Meeting Topics Through the course of the CAC process, CAC members have participated in discussions on many topics relevant to the BRT Corridor Planning Process. Among the topics covered during the process were: The Project Development Process US 29 Existing Conditions Existing and Forecasted Transit Ridership Existing and Forecasted Traffic Operations Draft Preliminary Purpose and Need Alternatives Selection Analysis Goals and Objectives Conceptual Alternatives Development o Running way Options o Preliminary Service Plan o Preliminary Station Locations 7.5 CAC Meeting Exercises Through the course of the CAC process, CAC member participated in numerous exercises and discussions to give feedback to the Study Team. These exercises included: A map exercise to gain feedback from the CAC on: o How they and people they know use transit; o For what purposes, do they use the US 29 corridor; and o Ideas to make using transit more attractive. An exercise to identify Strengths and Opportunities within the US 29 Corridor. April 2017 Page 135

164 An exercise to identify Needs, Values and Concerns related to transit investment in the US 29 Corridor. A breakout discussion on appropriate running ways, station locations and service plans. 7.6 Project Websites A website has been in place from the start of the. The website ( is regularly updated with new information related to the CAC process and Public Meetings. The website offers the public the opportunity to submit comments related to the Public Open Houses or the project team. Additionally, the County has recently launched a new website ( to engage the community on BRT in general. 7.7 CAC Meeting Materials All materials presented at CAC meetings are placed on the website for review by the public. These materials include agendas, presentations, mapping and meeting summaries. 7.8 CAC Meeting Summaries A detailed meeting summary for each US 29 CAC meeting is produced at the conclusion of each meeting. The meeting summary is developed by the project team and reviewed by the CAC members before being made final. These CAC meeting summaries are placed on the project website to allow for public review. In addition, a video of each CAC meeting (Starting with CAC meeting #4) is also on the website for the public to review. April 2017 Page 136
Countywide Transit Corridors Functional Master Plan
 Countywide Transit Corridors Functional Master Plan Makeover Montgomery II May 10, 2014 Master Plan Status Begun: August 2011 Planning Board Approved Draft Plan: July 2013 Council Approved Final Plan:
Preliminary Transportation Analysis
 Preliminary Transportation Analysis Goals of a Robust, Multimodal Transportation Network Safe Accessible/Connected Efficient Comfortable Context-Sensitive Motor Vehicle: Continue to analyze the data to
Presentation of Staff Draft March 18, 2013 COUNTYWIDE TRANSIT CORRIDORS FUNCTIONAL MASTER PLAN
 Presentation of Staff Draft March 18, 2013 COUNTYWIDE TRANSIT CORRIDORS FUNCTIONAL MASTER PLAN Public Outreach Fall 2011: Two community meetings/open houses Fall 2012: Three community meetings/open houses
PURPOSE AND NEED SUMMARY 54% Corridor Need 1. Corridor Need 2. Corridor Need 3. Corridor Need 4. Corridor Need 5
 SUMMARY PURPOSE AND NEED Chapel Hill Transit ridership has increased Buses operate every 4 minutes and have standing room only Exceeding seated capacity by 12% Corridor Need 1 by more than 20 percent between
Main-McVay Transit Study: Phase 2 Options Definition and High Level Constraints Evaluation
 Main-McVay Transit Study: Phase 2 Options Definition and High Level Constraints Evaluation APRIL 2016 A collaborative study between: For Additional Information or to Comment If you would like additional
MONTGOMERY COUNTY PLANNING DEPARTMENT THE MARYLAND-NATIONAL CAPITAL PARK AND PLANNING COMMISSION
 MONTGOMERY COUNTY PLANNING DEPARTMENT THE MARYLAND-NATIONAL CAPITAL PARK AND PLANNING COMMISSION SHA CTP Project No. MO891A21, US 29, Fairland Road to Musgrove Road Interchange Improvement, Design Review
Comments EXECUTIVE SUMMARY
 Comments 1. Under any Alternatives, MCDOT should provide better at-grade pedestrian crossing of Georgia Avenue and Forest Glen Road, including improved crosswalks with wider medians and adequate signal
WHITE OAK SCIENCE GATEWAY MASTER PLAN Transportation Appendix
 WHITE OAK SCIENCE GATEWAY MASTER PLAN Transportation Appendix Montgomery County Planning Department M-NCPPC www.montgomeryplanning.org Contents Master Plan and Study Area Boundaries... 1 Existing Conditions
Scottsdale Road/Rural Road Alternatives Analysis (AA) Study. Arizona ITE/IMSA Spring Conference March 7, 2012
 Study. Arizona ITE/IMSA Spring Conference March 7, 2012") Scottsdale Road/Rural Road Alternatives Analysis (AA) Study Arizona ITE/IMSA Spring Conference March 7, 2012 Study Location and Duration Primary Study Corridor (major focus of effort) Rural Road and Scottsdale
Scottsdale Road/Rural Road Alternatives Analysis (AA) Study Arizona ITE/IMSA Spring Conference March 7, 2012 Study Location and Duration Primary Study Corridor (major focus of effort) Rural Road and Scottsdale
Bus Rapid Transit Plans
 Twin Cities Region Bus Rapid Transit Plans ULI Minnesota Workshop Connecting Bus Rapid Transit to the Community December 15, 2009 John Levin Director of Service Development Metro Transit Metropolitan Area
4. ENVIRONMENTAL IMPACT ANALYSIS 9. TRANSPORTATION AND TRAFFIC
 4. ENVIRONMENTAL IMPACT ANALYSIS 9. TRANSPORTATION AND TRAFFIC 4.9.1 INTRODUCTION The following section addresses the Proposed Project s impact on transportation and traffic based on the Traffic Study
Corridor Advisory Group and Task Force Meeting #10. July 27, 2011
 Corridor Advisory Group and Task Force Meeting #10 July 27, 2011 1 Agenda Recap CAG/TF #9 Public Meeting #2 Summary Single Mode Alternatives Evaluation Results Next Steps 2 3 CAG/TF #9 Recap CAG /TF #9
Arterial Transitway Corridors Study. Ave
 Arterial Transitway Corridors Study Ave January 2012 Arterial Transitway Corridors Study Overview Corridor Features and Demographics 11 study corridors, 95 route miles 86,000 daily rides and half of existing
Fitting Light Rail through Well-established Communities
 Fitting Light Rail through Well-established Communities San Francisco 2008 Michael D. Madden Chief, Project Development, Maryland Transit Administration Project Setting Located inside the Capital Beltway
PERFORMANCE ANALYSIS of The Draft 2015 CLRP
 Item 9 PERFORMANCE ANALYSIS of The Draft CLRP Presentation to the Transportation Planning Board September 16, CLRP Performance Analysis 1 What is the Long-Range Transportation Plan (CLRP)? The CLRP identifies
ROUTES 55 / 42 / 676 BUS RAPID TRANSIT LOCALLY PREFERRED ALTERNATIVE
 ROUTES 55 / 42 / 676 BUS RAPID TRANSIT LOCALLY PREFERRED ALTERNATIVE April, 2012 1 INTRODUCTION The need for transit service improvements in the Routes 42/55/676 corridor was identified during the Southern
Exhibit 1 PLANNING COMMISSION AGENDA ITEM
 Exhibit 1 PLANNING COMMISSION AGENDA ITEM Project Name: Grand Junction Circulation Plan Grand Junction Complete Streets Policy Applicant: City of Grand Junction Representative: David Thornton Address:
Corpus Christi Metropolitan Transportation Plan Fiscal Year Introduction:
 Introduction: The Safe, Accountable, Flexible, Efficient Transportation Equity Act: A Legacy for Users (SAFETEA-LU) has continued the efforts started through the Intermodal Surface Transportation Efficiency
Highway 49, Highway 351 and Highway 91 Improvements Feasibility Study Craighead County
 Highway 49, Highway 351 and Highway 91 Improvements Feasibility Study Craighead County Executive Summary March 2015 Highway 49, Highway 351 and Highway 91 Improvements Feasibility Study Craighead County
Appendix A-2: Screen 1 Alternatives Report
 Appendix A-2: Screen 1 Alternatives Report SCREEN 1 ALTERNATIVES REPORT Western & Ashland Corridors Bus Rapid Transit (BRT) Project Prepared for Chicago Transit Authority 567 West Lake Street Chicago,
Washington DC Section of ITE Project Briefing
 Washington DC Section of ITE Project Briefing November 5, 2015 Renée Hamilton, VDOT, Deputy District Administrator I-66 Outside the Beltway Improvement Area Project Location Virginia 2 Purpose and Need
Ownership Lots 17 & 18 (Part of Lot 14), Montgomery Auto Sales Park
, Montgomery Auto Sales Park") Traffic Impact Analysis Ownership Lots 17 & 18 (Part of Lot 14), Montgomery Auto Sales Park Silver Spring, MD Lot 17: Site Plan No. 821413 Lot 18: Site Plan No. 821414 Filing Number: 13-TS-1198527A Prepared
Traffic Impact Analysis Ownership Lots 17 & 18 (Part of Lot 14), Montgomery Auto Sales Park Silver Spring, MD Lot 17: Site Plan No. 821413 Lot 18: Site Plan No. 821414 Filing Number: 13-TS-1198527A Prepared
WELCOME TO OPEN HOUSE # 1 June 14, 2017
 Langstaff Road Weston Road to Highway 7 Class Environmental Assessment Study WELCOME TO OPEN HOUSE # 1 June 14, 2017 Please sign in and join our mailing list Purpose of Open House #1 & Study Area York
Transportation Master Plan Advisory Task Force
 Transportation Master Plan Advisory Task Force Network Alternatives & Phasing Strategy February 2016 BACKGROUND Table of Contents BACKGROUND Purpose & Introduction 2 Linking the TMP to Key Council Approved
Route 7 Corridor Study
 Route 7 Corridor Study Executive Summary Study Area The following report analyzes a segment of the Virginia State Route 7 corridor. The corridor study area, spanning over 5 miles in length, is a multi
Providence Downtown Transit Connector STAKEHOLDER MEETING #2. Stakeholder Meeting #1 October 24, 2016
 Providence Downtown Transit Connector STAKEHOLDER MEETING #2 Stakeholder Meeting #1 October 24, 2016 February 2017 1 AGENDA 1 DTC Goals and Expectations 2 Street Design Concepts 3 Potential Benefits and
Abstract. Source of Copies The Maryland-National Capital Park and Planning Commission 8787 Georgia Avenue Silver Spring, MD 20910
 1 Abstract This document contains an examination of and recommendations for transit, bicycle, and pedestrian infrastructure that will help create complete transportation options. With the approval and
Highway 217 Corridor Study. Phase I Overview Report
 Highway 217 Corridor Study Phase I Overview Report November 3, 24 BACKGROUND AND OVERVIEW Study purpose The Highway 217 Corridor Study is developing multi-modal transportation solutions for traffic problems
1. Operate along freeways, either in regular traffic lanes, in high-occupancy vehicle (HOV) lanes, or along the shoulders.
 lanes, or along the shoulders.") Most decisions about whether or not to use transit involve time and cost, and most transit services are slower than travel by private vehicle. However, when transit is faster or nearly as fast as travel
Most decisions about whether or not to use transit involve time and cost, and most transit services are slower than travel by private vehicle. However, when transit is faster or nearly as fast as travel
Clackamas County Comprehensive Plan
 ROADWAYS The County s road system permits the movement of goods and people between communities and regions, using any of a variety of modes of travel. Roads provide access to virtually all property. They
Defining Purpose and Need
 Advanced Design Flexibility Pilot Workshop Session 4 Jack Broz, PE, HR Green May 5-6, 2010 Defining Purpose and Need In your agency s project development process, when do design engineers typically get
Proposed White Flint Separated Bike Lane Network September 2015
 Proposed White Flint Separated Bike Lane Network September 2015 Abstract This report includes a proposed separated bike lane network for the White Flint Sector Plan area. Separated bike lanes create a
Regional Transportation Needs Within Southeastern Wisconsin
 Regional Transportation Needs Within Southeastern Wisconsin #118274 May 24, 2006 1 Introduction The Southeastern Wisconsin Regional Planning Commission (SEWRPC) is the official areawide planning agency
Purpose and Need. Chapter Introduction. 2.2 Project Purpose and Need Project Purpose Project Need
 Chapter 2 Purpose and Need 2.1 Introduction The El Camino Real Bus Rapid Transit (BRT) Project (Project) would make transit and other transportation improvements along a 17.6-mile segment of the El Camino
Chapter 5 Future Transportation
 Chapter 5 Future Transportation The Future Land Use Plan identifies the desired land use designations. The land uses desired for Crozet depend, in large part, on the success of the transportation system,
Executive Summary June 2015
 Executive Summary June 2015 Highway 112 Corridor Study Benton and Washington Counties Executive Summary June 2015 Prepared by Transportation Planning and Policy Division Arkansas State Highway and Transportation
City of Wayzata Comprehensive Plan 2030 Transportation Chapter: Appendix A
 A1. Functional Classification Table A-1 illustrates the Metropolitan Council s detailed criteria established for the functional classification of roadways within the Twin Cities Metropolitan Area. Table
ALTERNATIVES ANALYSIS EXECUTIVE SUMMARY
 West Valley Connector Corridor ALTERNATIVES ANALYSIS EXECUTIVE SUMMARY FINAL September 2014 Ontario International Airport Ontario Mills Rancho Cucamonga Metrolink Station Kaiser Permanente PARSONS EXECUTIVE
Chapter 3 BUS IMPROVEMENT CONCEPTS
 Chapter 3 BUS IMPROVEMENT CONCEPTS The purpose of this chapter is to describe potential bus improvement strategies and potential impacts or implications associated with BRT implementation within the existing
Afeasibility study to evaluate bus rapid transit service in the East-West Corridor connecting major employment and activity centers between downtown
 East-West Bus Rapid Transit Feasibility Study Update and Recommended Locally Preferred Alternative (LPA) Summary City of Wauwatosa, Transportation Affairs Committee June 2016 Afeasibility study to evaluate
JONESBORO HIGHWAY 63 HIGHWAY 18 CONNECTOR STUDY
 JONESBORO HIGHWAY 63 HIGHWAY 18 CONNECTOR STUDY Craighead County May 2007 JONESBORO HIGHWAY 63 HIGHWAY 18 CONNECTOR STUDY Craighead County May 2007 Prepared by Planning and Research Division Arkansas State
Gratiot Avenue Transit Study Tech Memo #4: Ridership
 Gratiot Avenue Transit Study Tech Memo #4: Ridership 5/31/2016 Table of Contents 1 INTRODUCTION... 3 PROJECT DESCRIPTION... 3 2 TECH MEMO #4 OVERVIEW... 5 METHODOLOGY... 5 3 THE ALTERNATIVES AND POTENTIAL
South King County High-Capacity Transit Corridor Study
 HIGH-CAPACITY TRANSIT CORRIDOR STUDY South King County Corridor South King County High-Capacity Transit Corridor Study Corridor Report August 2014 South King County High Capacity Transit Corridor Report
4 DISRUPTION MANAGEMENT PLAN HIGHWAY 7 RAPIDWAY CONSTRUCTION BETWEEN BAYVIEW AVENUE AND WARDEN AVENUE TOWNS OF MARKHAM AND RICHMOND HILL
 4 DISRUPTION MANAGEMENT PLAN HIGHWAY 7 RAPIDWAY CONSTRUCTION BETWEEN BAYVIEW AVENUE AND WARDEN AVENUE TOWNS OF MARKHAM AND RICHMOND HILL The Transportation Services Committee recommends the adoption of
Sixth Line Development - Transit Facilities Plan
 Memorandum Date: November 13, 2012 To: From: c.c. Subject: Rob Freeman (Freeman Planning) Kevin Phillips Sixth Line Development - Transit Facilities Plan 33016631 This memo was prepared to review the transit
FY2006 Budget Board Budget Committee request for information. Board Request: Detailed information on bus route 5A DC-Dulless Airport
 Board Request: Detailed information on bus route 5A DC-Dulless Airport Tracking Number: 29 Assigned to Dept/Office: OPER Contact Person: Jim Hughes Metrobus Route 5A was established in December 2000 in
I-395 Express Lanes Northern Extension Project Crystal City Civic Association September 21, 2016
 I-395 Express Lanes Northern Extension Project Crystal City Civic Association September 21, 2016 Mike Snare, PE, Project Manager Virginia Department of Transportation GEC Michelle Holland, Megaprojects
University Hill Transportation Study Technical Memorandum Alternatives Modeling and Analysis May 2007
 Technical Memorandum May 2007 Syracuse Metropolitan Transportation Council Edwards and Kelcey with Wallace Roberts and Todd Alta Planning and Design CONTENTS SECTION ONE- INTRODUCTION...1 SECTION TWO-
DULLES AREA TRANSPORTATION ASSOCIATION (DATA) February 18, Susan Shaw, P.E., VDOT, Megaprojects Director
 February 18, Susan Shaw, P.E., VDOT, Megaprojects Director") DULLES AREA TRANSPORTATION ASSOCIATION (DATA) February 18, 2015 Susan Shaw, P.E., VDOT, Megaprojects Director I-66 Corridor Conditions Steady population growth Employment growth in activity centers Congestion
DULLES AREA TRANSPORTATION ASSOCIATION (DATA) February 18, 2015 Susan Shaw, P.E., VDOT, Megaprojects Director I-66 Corridor Conditions Steady population growth Employment growth in activity centers Congestion
Maryland State Highway Mobility Report. Morteza Tadayon
 Maryland State Highway Mobility Report Morteza Tadayon Background Mobility is a Key Performance Area (KPA) in the SHA Business Plan SHA adopts a performance based approach Monitors Highway System to identify
Circulation in Elk Grove includes: Motor vehicles, including cars and trucks
 Circulation, as it is used in this General Plan, refers to the many ways people and goods move from place to place in Elk Grove and the region. Circulation in Elk Grove includes: Motor vehicles, including
APPENDIX 2 LAKESHORE ROAD TRANSPORTATION REVIEW STUDY EXECUTIVE SUMMARY
 APPENDIX 2 LAKESHORE ROAD TRANSPORTATION REVIEW STUDY EXECUTIVE SUMMARY Appendix 2 City of Mississauga Lakeshore Road FINAL REPORT Transportation Review Study December 2010 EXECUTIVE SUMMARY Study Purpose
SANTA CLARA COUNTYWIDE BICYCLE PLAN August 2008
 SANTA CLARA COUNTYWIDE BICYCLE PLAN August 2008 To assist VTA and Member Agencies in the planning, development and programming of bicycle improvements in Santa Clara County. Vision Statement To establish,
What if YOU could help plan Northern Virginia s transportation future?
 What if YOU could help plan Northern Virginia s transportation future? Photo credits: Washington Metropolitan Area Transit Authority And improve the quality of life in your community -- for yourself, your
Operational Comparison of Transit Signal Priority Strategies
 Operational Comparison of Transit Signal Priority Strategies Revision Submitted on: November, 0 Author: Adriana Rodriguez, E.I Assistant Engineer Parsons Brinckerhoff 0 South Orange Avenue, Suite 00 Orlando,
Durham Region Long Term Transit Strategy
 Durham Region Long Term Transit Strategy An adaptive, safe, reliable, frequent, accessible and desirable transit system that shapes and connects Durham Region and beyond in an economically and environmentally
Appendix A-K Public Information Centre 2 Materials
 Appendix A-K Public Information Centre 2 Materials Our Rapid Transit Initiative Make an impact on the future of transit Join the discussion on Rapid Transit in London You re invited to a Public Information
Community Task Force July 25, 2017
 Community Task Force July 25, 2017 Welcome and Introductions Project Partners Regional Transportation District (RTD) Colorado Department of Transportation (CDOT) Denver Regional Council of Governments
Interim Transit Ridership Forecast Results Technical Memorandum
 Interim Transit Ridership 401 South Jackson Street Seattle, WA 98104-2826 September 2012 Table of Contents 1 INTRODUCTION... 1-1 1.1 Project Background... 1-1 2 RIDERSHIP FORECASTS... 2-1 2.1 System Ridership
Arlington County 10-Year Transit Development Plan & Premium Transit Network Briefing. May 2016
 Arlington County 10-Year Transit Development Plan & Premium Transit Network Briefing May 2016 Overview 10-Year Transit Development Plan Premium Transit Network Columbia Pike service concept Premium amenities
Arterial Transitway Corridors Study
 Arterial Transitway Corridors Study February 2012 Arterial Transitway Corridors Study Overview Corridor Features and Demographics 11 study corridors, 95 route miles Routes: 86,000 daily rides and half
PEDESTRIAN ACTION PLAN
 ATTACHMENT 2 CITY OF SANTA MONICA PEDESTRIAN ACTION PLAN CITY OF SANTA MONICA PEDESTRIAN ACTION PLAN This page intentionally left blank EXECUTIVE SUMMARY CHAPTER 1 EXECUTIVE SUMMARY Setting the Stage
Executive Summary BEYOND THE B-LINE: RAPID TRANSIT LINE PHASE II - COMMERCIAL DRIVE WEST. Final Draft December 13, Appendix B BROADWAY/LOUGHEED
 BEYOND THE B-LINE: BROADWAY/LOUGHEED RAPID TRANSIT LINE PHASE II - COMMERCIAL DRIVE WEST Appendix B Executive Summary Final Draft December 13, 1999 UMA Lloyd Lindley Davidson Yuen Simpson Architects BROADWAY/LOUGHEED
MONTGOMERY COUNTY PLANNING DEPARTMENT
 MONTGOMERY COUNTY PLANNING DEPARTMENT THE MARYLAND-NATIONAL CAPITAL PARK AND PLANNING COMMISSION Veirs Mill Corridor Master Plan: Work Session #5 MCPB Item No. Date: 10/04/18 Jessica McVary, Planner Coordinator,
Bus Rapid Transit ALTERNATIVES ANALYSIS. Open House
 Bus Rapid Transit ALTERNATIVES ANALYSIS Open House June 23, 2015 Open House Meeting Agenda Agenda Introductions What is BRT? Project Goals Study Tasks Next steps Discussion PVTA Bus Rapid Transit Study
MCTC 2018 RTP SCS and Madera County RIFP Multi-Modal Project Eval Criteria GV13.xlsx
 MCTC 8 RTP SCS and Madera County RIFP Multi-Modal Project Eval Criteria GV.xlsx Madera County Transportation Commission Regional Transportation Plan / Sustainable Communities Strategy Multi-Modal Project
Appendix B: Forecasting and Traffic Operations Analysis Framework Document
 Existing Conditions Report - Appendix Appendix B: Forecasting and Traffic Operations Analysis Framework Document This document defines the methodology and assumptions that will be used in the traffic forecasting
Spring Lake Park Mounds View North Oaks. Arden Hills. Shoreview. Roseville. Little Canada. Falcon Heights SNELLING. Lilydale. West Saint Paul 35E
 Coon Rapids Blaine Spring Lake Park Mounds View rth Oaks In 2011, Metro Transit embarked on the Arterial 494 Minnetonka Maple Grove Plymouth Hopkins Brooklyn Park New Hope Golden Valley Louis Park Edina
I-105 Corridor Sustainability Study (CSS)
") I-105 Corridor Sustainability Study (CSS) Metro Streets and Freeways Subcommittee March 21, 2019 Gary Hamrick Cambridge Systematics, Inc. I-105 CSS Project History & Background Funded by Caltrans Sustainable
I-105 Corridor Sustainability Study (CSS) Metro Streets and Freeways Subcommittee March 21, 2019 Gary Hamrick Cambridge Systematics, Inc. I-105 CSS Project History & Background Funded by Caltrans Sustainable
MONTGOMERY COUNTY PLANNING DEPARTMENT THE MARYLAND-NATIONAL CAPITAL PARK AND PLANNING COMMISSION
 MONTGOMERY COUNTY PLANNING DEPARTMENT THE MARYLAND-NATIONAL CAPITAL PARK AND PLANNING COMMISSION MCPB Item No. 3 Date: 01-19-12 Worksession: Countywide Transit Corridors Functional Master Plan Larry Cole,
Southwest Bus Rapid Transit (SW BRT) Functional Planning Study - Executive Summary January 19 LPT ATTACHMENT 2.
 Functional Planning Study - Executive Summary January 19 LPT ATTACHMENT 2.") Southwest Bus Rapid Transit (SW BRT) Functional Planning Study - Executive Summary 2011 January 19 1 of 19 Introduction This executive summary presents the results of the Southwest Bus Rapid Transit (SW
Southwest Bus Rapid Transit (SW BRT) Functional Planning Study - Executive Summary 2011 January 19 1 of 19 Introduction This executive summary presents the results of the Southwest Bus Rapid Transit (SW
Executive Summary Route 30 Corridor Master Plan
 Route Corridor Master Plan Project Overview The Route Corridor Master Plan is a coordinated multimodal transportation and land use plan for the entire stretch of Route through East Whiteland Township,
TRANSPORTATION NEEDS ASSESSMENT
 TRANSPORTATION NEEDS ASSESSMENT A travel demand analysis was carried out to determine the operational issues and the potential benefit that adding traffic capacity would have on the road network. All the
Lee s Summit Road Improvement Study Public Open House June 7, 2007 Summary of Comment Card Responses
 Lee s Summit Road Improvement Study Public Open House June 7, 2007 Summary of Comment Card Responses Introduction At the Lee s Summit Road Improvement Study Public Open House held Thursday, June 7, 2007
I-395 Express Lanes Northern Extension Project Public Hearings
 I-395 Express Lanes Northern Extension Project Public Hearings Susan Shaw, PE, Megaprojects Director Virginia Department of Transportation Amanda Baxter, Special Projects Manager Virginia Department of
Proposed. City of Grand Junction Complete Streets Policy. Exhibit 10
 Proposed City of Grand Junction Complete Streets Policy Exhibit 10 1 City of Grand Junction Complete Streets Policy Vision: The Complete Streets Vision is to develop a safe, efficient, and reliable travel
2014 Mobility Assessment Report Functional Planning & Policy Montgomery County Planning Department
 2014 Mobility Assessment Report Functional Planning & Policy Montgomery County Planning Department Travel Trends National & Local Travel Trends Multi-Modal Monitoring Pedestrian Bikes Bus Rail Future Efforts
Memorandum. Fund Allocation Fund Programming Policy/Legislation Plan/Study Capital Project Oversight/Delivery Budget/Finance Contract/Agreement Other:
 Memorandum Date: November 20, 2017 To: Transportation Authority Board From: Eric Cordoba Deputy Director Capital Projects Subject: 12/5/17 Board Meeting: San Francisco Freeway Corridor Management Study
2014/2015 BIKE ROUTE PLAN 83 AVENUE PROTECTED BIKE LANE
 About the Project 2014/2015 BIKE ROUTE PLAN The City of Edmonton is planning a major bike route on the south side of Edmonton. This bike route is one part of a plan to provide citizens with transportation
TRANSPORTATION & MOBILITY
 TRANSPORTATION & MOBILITY ROADWAY SYSTEM There are approximately 40 miles of roadways in Manitou Springs. For planning purposes, roadways are typically assigned a functional classification which defines
Roadways. Roadways III.
 Introduction 97 Roadway Design Principles 98 Safe Speeds 99 Optimizing of Street Space 00 Minimum Lane Widths in the City of Boston 02 Design Features that Reduce Operating Speeds 05 Travel Lanes Transit
the Story of the 30s & 70s Bus Lines James Hamre - WMATA
 Evaluation of a Service Restructuring: the Story of the 30s & 70s Bus Lines James Hamre - WMATA Metrorail is the second largest rail transit system in the nation 230 million annual riders 780,000 weekday
3.0 Future Conditions
 3.0 Future Conditions In order to be able to recommend appropriate improvements to the transportation system of the Town, it is important to first understand the nature and volume of traffic that is expected
Scope of the Transit Priority Project
 Transit Planning Committee #1 March 19, 2015 Scope of the Transit Priority Project Review of the 2010 plan Analysis of Transit Priority Measures Preliminary plans for rapid transit Recommendations for
State Road 54/56 Tampa Bay s Northern Loop. The Managed Lane Solution Linking I-75 to the Suncoast Parkway
 State Road 54/56 Tampa Bay s Northern Loop The Managed Lane Solution Linking I-75 to the Suncoast Parkway SUNCOAST PARKWAY Both I 75 and the Suncoast Parkway are planning, or in the process of constructing,
Title. Metropolitan Council Transportation Committee December 12, Brad Larson Metro District MnDOT
 Title Metropolitan Council Transportation Committee December 12, 2016 Evaluating the potential for Bus Rapid Transit and MnPASS Express Lanes in the southwest Metro Brad Larson Metro District MnDOT Background
Rapid Transit in Montgomery County
 Rapid Transit in Montgomery County Montgomery County Department of Transportation Al Roshdieh, Acting Director 1 Background Corridors in Detail Corridor Cities Transitway MD 355 (Bethesda to Rockville
MONTGOMERY COUNTY PLANNING DEPARTMENT THE MARYLAND-NATIONAL CAPITAL PARK AND PLANNING COMMISSION
 MONTGOMERY COUNTY PLANNING DEPARTMENT THE MARYLAND-NATIONAL CAPITAL PARK AND PLANNING COMMISSION MCPB Item No. 4 Date: 04-17-14 2014 Mobility Assessment Report José Dory, Senior Planner, Functional Planning
Frequently Asked Questions (FAQ)
") Frequently Asked s (FAQ) Study Process... 2 Rapid Transit Service and Operations... 5 Public Consultation... 8 Business Impacts... 8 Design and Property Impacts... 9 Construction Impacts...12 Traffic,
Frequently Asked s (FAQ) Study Process... 2 Rapid Transit Service and Operations... 5 Public Consultation... 8 Business Impacts... 8 Design and Property Impacts... 9 Construction Impacts...12 Traffic,
Greater Cleveland Regional Transit Authority
 Greater Cleveland Regional Transit Authority Transit Priority Corridor Initiatives West 25 th Street /East 105 th /East 93 rd Streets June 20, 2017 Presented to: Planning & Development Committee Greater
MONTGOMERY COUNTY COUNCIL MEMORANDUM
 MONTGOMERY COUNTY COUNCIL R O C K V I L L E, M A R Y L A N D HANS RIEMER COUNCILMEMBER AT-LARGE MEMORANDUM To: T&E Committee From: Councilmember Hans Riemer Date: March 1, 2016 Re: Funding a Protected
STUDY ADVISORY COMMITTEE. October 8, 2015
 STUDY ADVISORY COMMITTEE October 8, 2015 Study Purpose evaluate the long-term transportation strategies and investments needed to sustain the county s economic health and quality of life in the coming
City of Gainesville Transportation/Roadway Needs PROJECT SUMMARY
 A1 Roadway Resurfacing $23,846,000 TYPE: Preservation of existing system Roadway resurfacing A2 Signal Replacement $6,000,000 TYPE: Preservation of existing system Replace traffic signals. B1 W 6th St
TRASBURG RANSPORTATION
 TRASBURG RANSPORTATION LAN DEVELOPED BY THE TRANSPORTATION PLANNING DIVISION OF THE VIRGINIA DEPARTMENT OF TRANSPORTATION IN COOPERATION WITH THE U.S. DEPARTMENT OF TRANSPORTATION, FEDERAL HIGHWAY ADMINISTRATION
2045 Long Range Transportation Plan. Summary of Draft
 2045 Long Range Transportation Plan Summary of Draft Fredericksburg Area Metropolitan Planning Organization The George Washington Region includes the City of Fredericksburg and the counties of Caroline,
Waterford Lakes Small Area Study
 Waterford Lakes Small Area Study Existing Traffic Conditions PREPARED FOR: ORANGE COUNTY PUBLIC WORKS DEPARTMENT TRAFFIC ENGINEERING DIVISION ORLANDO, FLORIDA PREPARED WITH: INWOOD CONSULTING ENGINEERS
Calgary Transit Route 302 Southeast BRT Year One Review June
 Calgary Transit Route 302 Southeast BRT Year One Review 2011 June Calgary Transit Route 302 Southeast BRT: Year One Review 2011 April Table of Contents 1.0 Executive Summary... 1 2.0 Introduction... 3
Chapter 7. Transportation. Transportation Road Network Plan Transit Cyclists Pedestrians Multi-Use and Equestrian Trails
 Chapter 7 Transportation Transportation Road Network Plan Transit Cyclists Pedestrians Multi-Use and Equestrian Trails 7.1 TRANSPORTATION BACKGROUND The District of Maple Ridge faces a number of unique
5. RUNNINGWAY GUIDELINES
 5. RUNNINGWAY GUIDELINES These guidelines should be considered collectively when making runningway decisions. A runningway is the linear component of the transit system that forms the right-of-way reserved
EVAN GLASS. Montgomery County Council District 5
 EVAN GLASS 1. Do you support funding and advancing the Purple Line to groundbreaking as described in the Locally Yes. As a member of the recently convened Purple Line Implementation Advisory Group, I will