Impact Analysis of the 2007 MBTA Fare Increase and Restructuring A report produced by the Central Transportation Planning Staff for the Massachusetts
|
|
|
- Monica Eaton
- 5 years ago
- Views:
Transcription


1 Impact Analysis of the 2007 MBTA Fare Increase and Restructuring A report produced by the Central Transportation Planning Staff for the Massachusetts Bay Transportation Authority
2 Impact Analysis of the 2007 MBTA Fare Increase and Restructuring Project Manager & Author Robert Guptill Contributing Staff Thomas J. Humphrey Cover Design Maciej Citowicki Central Transportation Planning Staff Directed by the Boston Region Metropolitan Planning Organization. The MPO is composed of state and regional agencies and authorities, and local governments. September 2008
3
4 TABLE OF CONTENTS LIST OF TABLES AND FIGURES...5 EXECUTIVE SUMMARY...7 INTRODUCTION...9 SUMMARY OF THE PRE-FARE INCREASE IMPACTS ANALYSIS...10 DESCRIPTION OF AND RATIONALE FOR THE FARE RESTRUCTURING...10 ESTIMATION METHODS USED...11 PROJECTIONS OF REVENUE AND UNLINKED TRIPS...13 RESULTS OF THE POST-FARE INCREASE IMPACTS ANALYSIS...16 RIDERSHIP ESTIMATION...17 Methodology Estimated Ridership...19 REVENUE ESTIMATION...19 Methodology Estimated Revenue...21 COMPARISON OF THE POST- AND PRE-FARE INCREASE IMPACTS ANALYSES...23 RIDERSHIP...23 Percent Changes...23 Comparison to Projections...26 REVENUE...26 Percent Changes...27 Comparison to Projections...29 ELASTICITY...30 Demonstrated Elasticities...30 Comparison to the Model s Elasticity Inputs...32 RIDERSHIP DIVERSION...32 Possible Diversion Factors...32 Comparison to the Model s Diversion Inputs...34 PASS-RIDE VALUES...35 SUMMARY OF ANALYSIS RESULTS AND COMPARISONS...36 REVENUE-BASED RIDERSHIP ESTIMATION RESULTS AND COMPARISON TO AFC FIGURES...37 BACKGROUND...37 COMPARISON...37 Motorbus...37 Trackless Trolley...38 Light Rail...38 Heavy Rail...39 Summary
5 RIDERSHIP CHARACTERISTICS OF THE CORE SYSTEM (AFC DATA)...41 MONTHLY AFC TRANSACTIONS IN AFC TRANSACTIONS BY FARE TYPE...43 AFC TRANSACTIONS BY FARE MEDIA...46 CONCLUSION...49 APPENDIX: AFC TRANSACTIONS BY ROUTE AND STATION
6 LIST OF TABLES AND FIGURES TABLES 1 Price Elasticities Used in Spreadsheet Model Diversion Factors Used in Spreadsheet Model Core System Revenue and Ridership: Projected Changes Non-Core System Revenue and Ridership: Projected Changes Systemwide Combined Revenue and Ridership: Projected Changes Comparison of System Revenue and Ridership: Projected Changes In-Station Transfer and Non-Interaction Factors Monthly Commuter Rail (CR) and Commuter Boat Pass-Ride Values Total Unlinked Trips by Modal Category Total Revenue by Modal Category Percent Change in Single-Ride Unlinked Trips Percent Change in Pass Unlinked Trips Percent Change in All Unlinked Trips Projected vs. Actual Percent Changes in Unlinked Trips Percent Change in Single-Ride Revenue Percent Change in Pass Revenue Percent Change in All Revenue Projected versus Actual Percent Changes in Revenue Calculated Price Elasticities Model Input Elasticities versus Demonstrated Elasticities Diversion Assumptions and Diversion Factors: Single-Ride to Pass Trips Diversion Assumptions and Diversion Factors: Bus to Rapid Transit Trips Pass-Ride Values Comparison of Pass-Ride Values Comparison of CY 2007 Estimates of Total Unlinked Trips Comparison of Estimates of Total Unlinked Trips: Five-Year Average...40 A-1 Fare Type and Fare Media Percentages by Surface Bus Route...54 A-2 Fare Type and Fare Media Percentages by Subway Rapid Transit Station...60 A-3 Fare Type and Fare Media Percentages by Surface Green Line Branch...61 FIGURES 1 Monthly Total Core Ridership by Modal Category, CY Monthly Core Ridership by Fare Media Type, CY Monthly Pass Sales by Pass Type, CY Fare Media Usage, CY Percent of Transactions: Single-Ride Fares and Passes Single Ride vs. Pass Usage by Mode, CY Fare Media Usage by Mode, CY Fare Media Usage by Mode/Fare Type, CY Fare Media Usage by Mode for Single-Ride Adult Fares, CY Single-Ride vs. Pass Usage by Fare Media by Mode, CY A-1 Fare Type Percentages by Surface Bus Route Ridership
7 A-2 Fare Media Percentages by Surface Bus Route Ridership...51 A-3 Fare Type Percentages by Subway Rapid Transit Station Ridership...52 A-4 Fare Media Percentages by Subway Rapid Transit Station Ridership...52 A-5 Fare Type Percentages by Surface Green Line Branch Ridership...53 A-6 Fare Media Percentages by Surface Green Line Branch Ridership
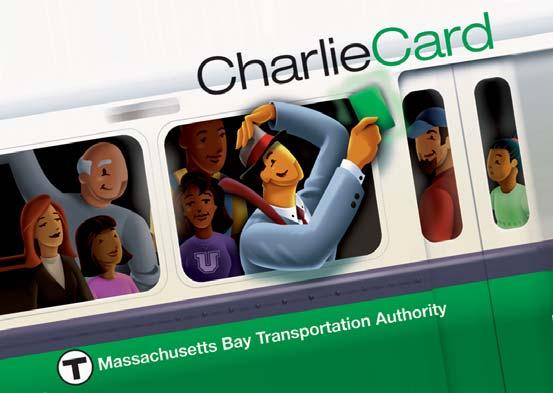
8 EXECUTIVE SUMMARY Some of the technical terms that are used in this summary without explanation are explained in the course of the discussions in the main body of this report. In January 2007, the MBTA raised fares to meet a projected budget deficit and raise approximately $70 million in additional annual revenue. A Pre-Fare Increase Impacts Analysis model was developed to project the ridership and revenue implications of any fare change. Also included in the model were functions to estimate the effects of certain changes to the fare structure. The Pre-Fare Increase Impacts Analysis estimated that the combined effect of the proposed fare increases and structural changes would be a 5.0 percent decline in annual unlinked trips and a 21.2 percent increase in annual revenue. The Post-Fare Increase Impacts Analysis was intended, in part, to test these projections. Assisting with the analysis was the full implementation of automated fare-collection (AFC) technology throughout the MBTA s core local bus and rapid transit system. Although the data from AFC still needed some adjustments to account for in-station transfers, flash pass activity, and fare evasion, the extent of the data, and the ability to disaggregate it by mode, fare type (single-ride or pass), and fare media (CharlieCard, CharlieTicket, or cash onboard), provided a significant improvement over the old revenue-based ridership estimation methodology. When ridership and revenue from all the various categories were summed for calendar year 2007, total unlinked trips were estimated to have decreased by 9.5 percent. Annual revenue was estimated to have increased by 23.0 percent. While the model appears to have slightly underestimated the negative and positive effects on ridership and revenue, respectively, this was not consistent across all modes and fare types. Generally within the core system, the model underestimated the loss in pass ridership more than the loss in single-ride ridership. This was particularly the case for surface Green Line ridership. Outside the core system, on commuter rail and ferry services, the situation was reversed, with the model underestimating the negative ridership impact on single-ride trips. At the heart of the underestimation of the ridership loss were elasticities that, upon analysis of the actual responses to the fare increase, appear to be too inelastic. Whereas the model in the Pre-Fare Increase Impacts Analysis generally assumed elasticities between and for single-ride trips and between and for pass trips, the demonstrated elasticities were much less concentrated. The surface Green Line and commuter rail single-ride elasticities were much more elastic than what the model assumed, thus leading to ridership losses greater than the model s projections. Similarly, demonstrated pass elasticities in the core system were all much more elastic than those used in the model. In addition to elasticity inputs, ridership diversion factors were used in the Pre-Fare Increase Impacts Analysis to project ridership changes. These factors estimate the shift in trips between ridership categories, for example from single-ride to pass or from local bus to rapid transit. While it is not possible to directly estimate these factors for the Post-Fare Increase Impacts Analysis, we have made certain assumptions and noted the relative ridership changes in the single-ride versus pass categories, and it seems likely that the actual scale of diversion is greater than what was modeled. 7
9 AFC technology dramatically facilitates the analysis of various ridership characteristics. For example, it is now possible to chart total ridership, or ridership broken down by any category such as mode or fare type, over time. In 2007, ridership appears to have dropped in the first two months but then risen (though not to pre-increase levels) and stayed relatively constant throughout the remainder of the year. Over this time, pass ridership had greater variability than single-ride ridership. Sales of the LinkPass in particular reflect this variability; sales of the other major passes stayed constant or increased at a constant rate. The penetration of CharlieCards increased throughout 2007, as the proportion of trips made using a CharlieCard grew from 56 percent in January 2007 to 67 percent in December Single-ride and pass unlinked trips can also be broken down. For single-ride trips, adult fares composed the majority of trips for all modes, but short fares and transfers together accounted for 30 percent on bus. For pass trips, more trips were taken on LinkPasses than any other pass. Even on buses, the LinkPass was responsible for 48 percent of trips, compared to 20 percent for the Local Bus Pass. On surface rapid transit, 77 percent of pass trips were taken using a LinkPass. Surface rapid transit also had the highest percentage of CharlieCard trips. Analyses such as these using AFC data can be conducted down to the station or route level as well. The adoption of AFC technology along with significant changes to the fare structure heralded an entirely new way for many customers not only to pay their fare but also to think about how to take their trip. With lower per-ride fares for trips taken with a CharlieCard, the introduction of the LinkPass, and transfer discounts for CharlieCard holders, the MBTA is encouraging customers to consider the entire system when deciding on their trip. AFC technology is also enhancing planning at the MBTA. Through the detailed transaction data that AFC equipment provides by route, station, fare type, or fare media, the MBTA can better understand rider characteristics and use this understanding in its planning efforts. Indeed, this Post-Fare Increase Impacts Analysis is likely to be one of many reports to come that draw heavily on AFC data. 8
10 INTRODUCTION This study, herein referred to as the Post-Fare Increase Impacts Analysis, has several purposes. The first is to estimate the ridership and revenue impacts of the January 2007 MBTA fare increase and restructuring. A second purpose is to compare these impacts to those projected by a 2006 study (documented in the technical report entitled Impact Analysis of a Potential MBTA Fare Increase and Restructuring in 2007) herein referred to as the Pre-Fare Increase Impacts Analysis. This comparison concerns not only the aggregate ridership and revenue impacts of the fare increase and restructuring, but also some of the inputs traditionally used to estimate those impacts in advance. Specifically, elasticity, ridership diversion factors, and pass-ride values were used in the Pre-Fare Increase Impacts Analysis to estimate the effect of individual and relative price changes for different fare types. The Post-Fare Increase Impacts Analysis will derive these factors based on actual ridership changes and compare them to those used to make the projections. This report is also intended to assist the MBTA in its determination of the preferable method for estimating ridership, whether for reporting annual modal ridership to the National Transit Database (NTD) or for internal understanding of ridership trends. Before automated fare collection (AFC), the MBTA relied on a revenue-based ridership estimation methodology. In addition to collecting AFC data for 2007, therefore, CTPS also continued to conduct the surveys used in the revenue-based methodology and produced estimates of 2007 ridership using that methodology. In this report, those estimates will be compared to the data from AFC. The MBTA will undoubtedly make greater use of AFC technology and reports in the future; however, a comparison of the ridership estimates of the two approaches may assist the MBTA in better understanding its past ridership estimates in light of the current technology. Finally, AFC offers a wealth of data on the choices that MBTA riders make on a daily basis. This data extends into where and at what time riders generally travel, as well as the method of payment that they choose to use for these trips. The final section of the Post-Fare Increase Impacts Analysis will therefore summarize and report on various ridership trends and characteristics in 2007 as indicated by AFC. In this report, 2007 refers to calendar year 2007, unless stated otherwise. 9
11 SUMMARY OF THE PRE-FARE INCREASE IMPACTS ANALYSIS CTPS conducted a Pre-Fare Increase Impacts Analysis to assist MBTA staff and the MBTA Board of Directors in estimating the impacts of the proposed 2007 fare increase and restructuring on ridership and revenue. This section of the Post-Fare Increase Impacts Analysis revisits the rationale for changing the fare structure. It also describes the methodologies used to project ridership and revenue changes and the inputs used in those methodologies. These ridership and revenue projections will be compared to the actual 2007 ridership and revenue figures, which are presented later in this report. Description of and Rationale for the Fare Restructuring The Rider Oversight Committee was established in response to the previous MBTA fare increase in 2004 to better incorporate the public and advocacy voices into the planning process. At its inception, the committee was specifically charged with reviewing the existing fare structure and, should it have any suggestions for change, discussing those suggestions with the MBTA. Many of the features implemented in the new fare structure are the result of this process. The principal characteristics of the proposed fare structure are as follows: Flat fares by mode for all local bus and rapid transit trips and a reduction of express bus fare zones to two A step-up transfer privilege between local bus, rapid transit, and express bus whereby the transfer price equals the step-up, or difference, in price from a lower-priced mode to a higher-priced mode, such that the customer never pays any more than the fare of the higher-priced mode for the entire linked trip The merging of the Subway and Combo Pass categories Single-ride fare surcharges on trips not made with the new CharlieCard technology There are several reasons why the Rider Oversight Committee and the MBTA decided on these changes to the fare structure. The new flat fare by mode with simple step-up transfer privileges between local bus, rapid transit, and express bus responds to the MBTA s enabling legislation, which requires the Authority to adopt a fare policy that provides for free or substantially reduced-rate bus-rail transfers on the system. 1 Indeed, by instituting the step-up transfer, the MBTA can ensure that basic transit mobility is priced the same for those who live within walking distance of a rapid transit line and those who must take a bus to access that line. Whereas previously a local bus rapid transit transfer trip would generally cost $2.15 (and even more if the trip was made on a zoned-local bus or through an extra-fare station on the rapid transit system), the new maximum fare actually decreased to $1.70. This logic also applies to the merging of the Subway and Combo Pass categories. Whereas the Combo Pass price was $71.00, the new merged LinkPass price is $ MGL Chapter 161A, Section 5(r). 10
12 There was also a compelling business interest in implementing this major fare restructuring requested by the Rider Oversight Committee at the same time as the institution of the AFC system. The restructuring eliminated more than a dozen anomalies in the fare structure that were the product of various political and operating considerations over the years many of which had little ongoing justification. It was expected that these changes would attract potential customers who were unfamiliar with the transit system and intimidated by the complicated fare structure. The installation of AFC equipment also permitted the adoption of the step-up transfer privilege. This was intended to lower the cost of bus-rapid transit transfer trips and thus encourage more customers to make better use of the entire MBTA system. Finally, in the interest of encouraging customers to use the CharlieCard, which is the most efficient mode of payment using AFC, the MBTA assessed a surcharge on all single-ride trips that are not made using this fare-payment media. In addition, the step-up transfer privilege was only offered to CharlieCard customers. Estimation Methods Used Two separate approaches were used by CTPS in attempting to project the impact on MBTA ridership and revenue. The first approach consisted of applying the regional travel demand model of the Boston Region Metropolitan Planning Organization (MPO) to forecast demand for each MBTA mode with the previous and increased fare levels. The second approach used a set of spreadsheets originally created by CTPS and the MBTA to project impacts. In the past, CTPS had used solely a spreadsheet-based approach to compute ridership and revenue impacts. The regional travel demand model was employed in this fare impacts analysis to complement the spreadsheet model, with the two models together providing some indication of the potential range of impacts that could be expected. The Pre-Fare Increase Impacts Analysis presents a detailed description of the two separate approaches. While aggregate modal results from the Post-Fare Increase Impacts Analysis will be compared against figures from both the spreadsheet model and travel demand model, more detailed data, in terms of more specific modal categories as well as specific fare media (CharlieCard, CharlieTicket, or cash onboard) and fare type (single-ride fare or pass type) categories, is only available with the spreadsheet approach. Therefore, for purposes of more detailed comparisons between the Pre- and Post-Fare Increase Impacts Analyses, the spreadsheet model approach will be used. One additional reason for using the spreadsheet model as the basis for comparison lies with that model s use of price elasticity and diversion factors in its projection of ridership changes. These factors are also subject to comparison in this analysis. With data on the actual ridership and price changes for various modal and fare categories, CTPS can estimate the actual price elasticities and assume the extent of ridership diversion that occurred due to the fare increase. A detailed description of price elasticity and ridership diversion is presented in the Pre-Fare Increase Impacts Analysis; however, a basic explanation of the factors is given below. As described in the Pre-Fare Increase Impacts Analysis, these factors were taken from studies of the experiences of peer agencies. 11
13 Price elasticity is the measure of the rate of change in demand relative to a change in price if all other factors remain constant. Price elasticities are generally expected to be negative, meaning that a positive price increase will lead to a decrease in demand (with a price decrease having the opposite effect). As the absolute value of the price elasticity increases, the projected impact on demand also grows. Larger (or more negative) price elasticities are said to be relatively elastic, while smaller negative values closer to zero are said to be relatively inelastic. Thus, if the price elasticity of the demand for transit is assumed to be elastic, a given fare increase would cause a greater loss of ridership than if demand were assumed to be inelastic. The price elasticities used to project ridership changes in the spreadsheet model are presented in Table 1. As shown in the table, the bus mode was generally assumed to be the most elastic or responsive to price changes. Rapid transit was assumed to be slightly less elastic, with commuter rail and water transportation assumed to be even less elastic. Pass elasticities were assumed to be slightly more inelastic than cash elasticities, and ridership was expected to respond more dramatically to price decreases than price increases. TABLE 1 Price Elasticities Used in Spreadsheet Model Price Increase Price Decrease Cash Elasticities Bus Subway Combo Commuter Rail Water The RIDE Pass Elasticities Bus Subway Combo Commuter Rail Water Diversion factors reflect estimates of the likelihood of a switch in demand for one good to another that is related to the change in the relative prices of those goods. These factors are always given as pairs, with the direction of the diversion and thus the diversion factor values depending on the categories respective price changes. The category with the greater respective price decrease (or the smaller respective price increase) would gain riders from the diversion while the category with the smaller respective price decrease (or the greater respective price increase) would lose riders from the diversion. The diversion factors essentially work to redistribute demand between the two categories after the respective price elasticities have been applied. The factor itself represents the ratio of the estimated actual diversions to the estimated potential diversions. Actual diversions equal the difference between the total ridership change and the change in ridership caused 12
14 solely by price elasticity. Potential diversions equal the percentage change in the relative price ratio multiplied by the ridership caused solely by price elasticity. In other words, the ridership diversion factor can be explained as the percent of potential diversions that actually do switch from one good to another. The diversion factors that were used in the Pre-Fare Increase Impacts Analysis to estimate the diversion of ridership from one modal or fare type category to another due to the relative price changes in the two categories are presented in Table 2. As shown in the table, the subway single-ride mode was modeled to lose a slightly higher rate of riders to the bus single-ride mode than vice-versa, given the relative price changes. Diversion between various pass types was assumed to be much lower. The largest diversion factors were assumed to occur from single-ride customers switching to passes. TABLE 2 Diversion Factors Used in Spreadsheet Model To Bus To Subway To Combo Modal Diversion SR* From Bus From Subway From Combo Pass From Bus - < From Subway < From Combo Fare Type Diversion To Bus Pass To Subway Pass To Combo Pass From Bus SR* From Subway SR* From Combo SR* *SR: Single-Ride Projections of Revenue and Unlinked Trips The Pre-Fare Increase Impacts Analysis projected the absolute and percentage changes in annual ridership and revenue by mode. The projections made by the spreadsheet model are presented in Tables 3 and 4. The impacts of the fare increase and restructuring on revenue and unlinked trips 2 in the core system, 3 as shown in Table 3, were generally modeled to be greater for single-ride compared to pass customers. The surcharge placed on non-charliecard fares, the elimination of free outbound fares on all surface rapid 2 Linked trips represent the number of riders, while unlinked trips represent the number of trips on individual transit vehicles. For example, a trip involving a transfer from bus to rapid transit or between rapid transit lines is one linked trip, but two unlinked trips. 3 The core system is composed of the following modal categories: rapid transit and Central Subway (Blue, Orange, and Red Lines and subway Green Line), surface Green Line, and bus and trackless trolley. The non-core system is composed of express bus, commuter rail, ferry services, and The RIDE. 13
15 transit lines, a smaller overall percentage increase in pass prices, and the larger elasticities of single-ride versus pass customers were expected to be some of the major causes of the greater impact on core single-ride trips. TABLE 3 Core System Revenue and Ridership: Projected Percent Changes % Change Revenue % Change Ridership Mode Single-Ride Pass Single-Ride Pass Rapid Transit and Central Subway +26.8% +14.2% -6.9% -2.4% Surface Green Line +47.7% +47.0% -16.0% -8.4% Bus and Trackless Trolley +34.1% +4.2% -7.8% -2.3% Total +30.5% +13.5% -8.4% -2.9% Projected changes in revenue and unlinked trips outside of the core system (express bus, commuter rail, ferry services, and The RIDE) from the proposed fare increase and restructuring are shown in Table 4. As was the case with the core system, the impacts on single-ride customers were generally expected to be greater than for pass customers. Unlike the core system, however, where surcharges resulted in a significant increase in price for customers paying with cash onboard vehicles or using CharlieTickets, the difference in impacts for express buses, commuter rail, and boats is due mainly to the relative increase in cash and pass prices. This is because the installation of AFC technology has not occurred on these modes with the exception of express buses. In the case of both single-ride fares and pass prices, the percent increase was greater for the core compared to the non-core, and, in some cases, such as with the effective lowering of pass prices for some express bus customers and Inner Harbor ferry customers, projected revenue actually declined and ridership increased for certain non-core categories. TABLE 4 Non-Core System Revenue and Ridership: Projected Percent Changes % Change Revenue % Change Ridership Mode Single-Ride Pass Single-Ride Pass Express Bus +2.9% -12.8% +0.8% +11.9% Commuter Rail +22.8% +20.9% -3.6% -2.4% Ferry Services +0.6% -1.1% -0.9% +3.2% The RIDE +10.0% -0.7% Total +19.5% +20.1% -2.7% -1.8% The estimated changes in systemwide combined single-ride fare and pass revenue and unlinked trips from the fare increase and restructuring, as projected using the travel demand model, are shown in Table 5. Note that the travel demand model does not estimate revenue on a modal basis; thus only the systemwide revenue total is presented. 14
16 Aside from commuter rail, the change in unlinked trips projected by the travel demand model for all modes was quite modest. Trips on bus and trackless trolley were actually projected to increase under the fare increase and restructuring scenario. Revenue was projected to increase by 18.4 percent systemwide. TABLE 5 Systemwide Combined Revenue and Ridership: Projected Percent Changes % Change Mode Revenue Ridership Rapid Transit -1.9% Bus and Trackless Trolley +3.1% Commuter Rail -16.1% Express Bus +0.7% Ferry -8.6% Total +18.4% -1.7% Table 6 presents the percent changes projected by the travel demand model and the spreadsheet model for unlinked trips, revenue, and revenue per unlinked trip. What differences there are between the two models percentages can be explained in large part by certain assumptions used for each model with regard to elasticities, trip conservation, 4 and transfer activity. However, the difference between the two models projections represents a range of estimates. In summary, therefore, the Pre-Fare Increase Impacts Analysis estimated a decrease in unlinked trips of between 1.7 percent and 5.0 percent, and an increase in revenue of between 18.4 percent and 21.2 percent. Henceforth, for purposes of comparison with the results of the Post-Fare Increase Impacts Analysis, the projections of the spreadsheet model will be used. TABLE 6 Comparison of System Revenue and Ridership: Projected Percent Changes Projected Change Travel Demand Model Spreadsheet Model Unlinked Trips -1.7% -5.0% Revenue +18.4% +21.2% Revenue per Unlinked Trip +20.5% +27.6% 4 The travel demand model starts with a set number of trips and then distributes these trips to various modes, such as driving or transit, based on the relative costs, thus conserving the total number of trips in the region. 15
17 RESULTS OF THE POST-FARE INCREASE IMPACTS ANALYSIS On January 1, 2007, the MBTA implemented a fare increase, the major purpose of which was to raise approximately $70 million in revenue. At the same time, several new fare structure elements were implemented along with the full adoption of AFC technology on local bus, express bus, and rapid transit. Specifically, the step-up transfer, differential pricing by fare media, and the replacement of the Subway Pass with the LinkPass were entirely new concepts to MBTA riders. The restructuring also included the elimination of pricing inconsistencies, such as free outbound travel on surface Green Line vehicles and the higher-priced fare zones on the Green Line D branch and the Red Line South Shore branch. The combination of the restructuring and the systemwide use of new AFC faregates and fareboxes along with CharlieCards represented perhaps the greatest change to the way MBTA riders paid their fares since the implementation of exit fares in the days of Charlie on the MTA. There is therefore much interest in learning how MBTA riders responded not only to the fare increase but also to these significant changes in the fare structure. As the Post-Fare Increase Impacts Analysis represents one of the first comprehensive uses of AFC data for reporting purposes, a learning curve with respect to the ability to organize and analyze the data was to be expected. The establishment of a data warehouse, separate from the live AFC database that is continually updated with every individual transaction, vastly improved the ease with which reports could be run and data downloaded. Several queries for analyzing the database had been developed in advance of its release. These queries summarized transactions in various ways, such as by product type, station location, or date. However, it was not until CTPS began to actively use that data for this study that limitations to the pre-existing queries could be determined, ideas for new queries suggested, and refinements made. At all times, the AFC department at the MBTA was exceptionally responsive to the needs and concerns of CTPS. One of the greatest concerns that CTPS has with the existing AFC structure is the time limit that is placed on data storage. Currently, data from every sale or transaction is stored in the data warehouse for 14 months. Data more than 14 months old is deleted upon daily update of the database. This caused a problem in the present study when certain queries to retrieve and summarize data from the data warehouse needed to be refined. Specifically, the data for the months of January and February 2007 had been collected via a query that had two minor problems. First, the query did not account for the delay in downloading data from some fareboxes, particularly on surface Green Line routes. Second, a coding modification was needed to avoid the query s double-counting of transactions on the first day of every month. Rectification was impossible, because the data was more than 14 months old by the time the query was corrected. However, taken together, the two problems with the query largely offset each other, and the estimated effect on ridership and revenue totals is negligible; however, the fact remains that this study uses data for the months of January and February 2007 that it would not have used if the 14-month window for these two months had not passed. 16
18 The AFC department at the MBTA has since put into place a mechanism for indefinitely storing a summarized version of the data warehouse that uses less memory. This data summary is of sufficient detail to permit the type of analysis presented in the present study to occur on a regular basis. However, data at the level of detail of an individual transaction is still being purged after 14 months. It will therefore be impossible, for example, to compare a certain day s ridership from one year to the next if the first date is more than 14 months in the past. Such a limitation will require greater foresight when planning for the performance of various analyses. Perhaps more importantly, as the MBTA and CTPS continually learn how to better use AFC data, this time window of data availability prevents the application of these improved processes to older information. Ridership Estimation Methodology With the adoption of AFC technology in the core transit system, ridership data on all AFC transactions is now available for local buses, express buses, light rail, and heavy rail. This data is divided between fareboxes on all buses and light rail vehicles operating on the surface, validators 5 at light rail stops on the surface, and faregates at all subway stations and surface stations with pre-payment fare zones. 6 Farebox data can be organized by sign code (the route designation), while validator and faregate data is collected by station. In this way, AFC data can be segregated and summarized according to the desired modal category. While AFC provides a 100 percent count of all passengers who interact with the equipment, any trips that either do not pass through an AFC payment zone or are not recorded will not be counted. In the case of the former, children aged 11 and under, who are not required to pay, and passengers transferring between rapid transit lines within the pre-payment zone are examples. Fare evaders as well as those customers who have bought a pass but board a vehicle by simply flashing it are examples of the latter. Therefore, CTPS has developed factors for estimating the extent to which in-station transfers and farebox or faregate non-interaction are occurring. These factors vary according to the mode or AFC equipment type and must be estimated separately for each. Table 7 presents the factors that were applied to AFC transactions to estimate ridership for the core transit system in the Post-Fare Increase Impacts Analysis. Outside of the core transit system, various data sources were used to estimate ridership. For commuter rail, ticket sales of single-ride zonal fares were used as a proxy for the number of riders in these ridership categories except for onboard and special fares, for which conductor counts were used. For pass trips on commuter rail, the number of pass sales by pass type was multiplied by the pass-ride value, or the number of trips made per 5 Validators essentially act as fareboxes, with the added function that they validate each transaction by providing a validation slip that indicates that the passenger has paid his or her fare. This allows the passenger to board a bus or Green Line vehicle through a rear door without having to interact with the farebox at the front door. Validators are located at certain Green Line surface stops and other high-volume boarding areas. 6 Any transit boarding area where entry is restricted to customers who have already paid their fare is referred to as a pre-payment fare zone. Faregates are the exclusive means for granting entry to these zones. 17
19 month per pass type for passes that were estimated to have been used on commuter rail. These pass-ride values were calculated from a commuter rail pass-users survey. TABLE 7 In-Station Transfer and Non-Interaction Factors In-Station Transfer Factors HR Transfers per HR Trip 0.21 LR Transfers per HR Trip 0.18 LR Transfers per LR Trip 0.02 HR Transfers per LR Trip 0.22 HR Transfers per SSTA HR Boardings SL Transfers per SSTA SL Boardings 2.6 Non-Interaction Factors Bus Fareboxes Faregates LR Fareboxes HR: Heavy Rail; LR: Light Rail; SL: Silver Line; SSTA: South Station TABLE 8 Monthly Commuter Rail (CR) and Commuter Boat Pass-Ride Values (Trips per Month) Monthly Pass-Ride Value Pass Type On Commuter Rail On Commuter Boat CR Zone 1a CR Zone CR Zone CR Zone CR Zone CR Zone CR Zone CR Zone CR Zone Commuter Boat InterZone (all) Student Day LinkPass* *Weekly Pass-Ride Value Commuter boat and Inner Harbor ferry single-ride and pass trips were reported by boat operators and were separated by fare type. However, pass use was not broken down into the various pass types, so pass-ride values for boat travel using the commuter rail and commuter boat passes were taken from the commuter rail pass-users survey and multiplied by pass sales for the respective pass type for passes that were estimated to 18
20 have been used on water transportation. The pass-ride values calculated from the commuter rail pass-users survey are presented in Table 8. Finally, the Office for Transportation Access at the MBTA directly reported the number of trips by month on The RIDE Estimated Ridership The total number of unlinked trips in 2007 is estimated at 351 million (see Table 9). Of this total, more than 91 percent, or million, are taken on the core transit system, where AFC equipment is in place. Within the core system, 70 percent of the trips are taken on rapid transit, encompassing all subway stations, in-station transfers, both branches of the Silver Line, and surface light rail, with the remaining trips split between the bus modes of local buses, crosstown buses, and the inner and outer express buses. The remaining 29.3 million trips, of which almost 90 percent are on commuter rail, are taken on the non-core system, where AFC is not in usage. Boat services account for 4.7 percent of trips, with trips on The RIDE making up the remaining 5.6 percent of trips in this category. Within the bus category, local bus service carries 96 percent of trips, followed by inner express bus service with 2.3 percent, crosstown bus service with 1.1 percent, and outer express bus service with less than 1 percent of trips. Within the rapid transit category, riders using subway stations make up the majority of trips, at 62 percent, with transfer trips between rapid transit lines constituting an additional 26 percent. Taken together, these trips made on the Red, Orange, and Blue lines and the subway portions of the Green and Silver lines are nearly 89 percent of trips made on rapid transit. Surface light rail, including the B, C, D, and E surface branches of the Green Line as well as the Mattapan High-Speed Line, accounts for almost all of the remaining rapid transit ridership, with 9.1 percent of the total. The Silver Line along Washington Street and the Silver Line Waterfront surface service represent the final 2.2 percent of rapid transit trips. The highest ridership on the commuter rail system is estimated to occur in Zone 3 with 16.1 percent of trips, followed by Zone 2 with 15.9 percent, Zone 4 with 15.2 percent, and Zone 6 with 14.9 percent. Zone 8 has the next highest percentage of trips, at 10.1 percent, followed by Zones 1, 5, and 7, each with about 8 percent of trips. Zone 1a has the smallest percentage of trips, at 3.4 percent. Of the commuter boat routes, route F1 carries slightly more than half of all boat trips, and F2 and F4 both carry approximately 23 percent of these trips. Revenue Estimation Methodology Revenue can be reported by the new AFC system for the core transit system in two different ways. First, sales revenue is compiled from all sales at AFC fare vending machines (FVMs), retail sales terminals (RSTs), bus fareboxes, and other sales sources such as station ticket windows, private agents, the MBTA website, and the Corporate 19
21 Pass Program. Sales revenue therefore equals the sum of all revenue collected at the point of sale of various fare and pass products. TABLE Total Unlinked Trips by Modal Category Mode Unlinked Trips Bus 95,179,710 Local 91,357,245 Crosstown 1,086,621 Inner Express 2,235,797 Outer Express 500,047 Rapid Transit 226,487,126 Red, Orange, Blue, Green, Silver Line Waterfront Subway 141,430,954 In-Station Transfer 59,535,381 Silver Line Washington Street 3,717,045 Silver Line Waterfront Surface 1,252,987 Light Rail Surface (Green Line and Mattapan High-Speed Line) 20,550,759 Total Core AFC System 321,666,836 Commuter Rail 26,226,769 Zone 23,481,737 Zone 1a 792,394 Zone 1 1,712,504 Zone 2 3,728,952 Zone 3 3,790,055 Zone 4 3,574,174 Zone 5 2,027,534 Zone 6 3,489,613 Zone 7 1,988,155 Zone 8 2,378,357 InterZone (all zones) 101,231 Onboard (all zones) 2,643,801 Commuter Boat 1,378,946 F1: Hingham-Boston 749,449 F2: Quincy-Hull-Boston-Logan Airport 319,483 F4: Boston-Charlestown 310,014 The RIDE 1,648,941 Total Non-Core, Non-AFC System 29,254,656 Total System 350,921,492 Transaction revenue, the other method by which revenue is estimated, totals and distributes revenue collected at the point of use. In the case of single-ride transactions, it equals each transaction type multiplied by its price summed for all transactions. In the case of passes, total revenue per pass type is calculated by multiplying the pass price by 20
22 the number of passes sold. Revenue is then distributed among the various modal categories equal to the distribution of transactions. In theory, total sales and transaction revenue should sum to the same amount. However, there are a few slight differences in the way in which the two revenue totals are collected. One example would be in the calculation of revenue from short fares, or fares deposited in bus and light rail fareboxes that are less than the correct fare. Whereas sales revenue would equal the sum of all short fares, the calculation for transaction revenue necessitates estimating an average short fare and then applying this average to all short fare transactions. The two methods therefore result in different total revenue estimates for this type of fare transaction. Another example occurs with the use of stored value. Sales revenue would simply equal the sum of all stored value added to CharlieCards or CharlieTickets. Transaction revenue, on the other hand, would equal the sum of all the transactions that use this stored value if and when they use it. For example, stored value that is lost or discarded would be counted as sales revenue but not as transaction revenue because it was never actually used. Similarly, stored value that was loaded before the study time period would not count as sales revenue but would be counted as transaction revenue. Considering these differences between the two methodologies, transaction revenue is used to estimate revenue in this Post-Fare Increase Impacts Analysis because it can more closely relate revenue to ridership Estimated Revenue Table 10 presents the estimates of 2007 revenue by modal category. Total systemwide revenue is estimated at $424.2 million. Due to the higher average fares and pass prices of non-core modes, the core system accounts for a relatively smaller percentage of total revenue than it did for ridership. However, core revenue still makes up 74 percent of systemwide revenue. Within the core, similarly due to its lower average fares and pass prices, the bus category now accounts for 24 percent of core revenue less than its ridership percentage with rapid transit constituting the other 76 percent. Individual bus modal revenue distributions largely mirror those of ridership, with a slightly smaller percentage of revenue going to the local bus category due to the higher fares and pass prices for inner and outer express buses. While a lower percentage of revenue is allocated to in-station transfers, owing to the free in-station transfer for single-ride trips, revenue for pass trips in this category is distributed according to estimated flash pass trips, so this modal category still receives some of the pass revenue. The combined subway categories still account for 90 percent of rapid transit revenue, followed by surface light rail at 8.5 percent, and the two surface Silver Line categories at 1.7 percent. For the non-core, non-afc system, commuter rail contributes by far the largest portion of revenue at 91 percent, with commuter boat and The RIDE contributing 5.6 and 3.0 percent, respectively. Among the commuter rail zones, Zone 6 accounts for the largest portion of revenue at 17.5 percent. Owing to their higher fares and pass prices, the zonal categories 5 and above make up a greater percentage of the commuter rail revenue total than of the ridership total, whereas the opposite is true for zonal categories 4 and below. Among the commuter boat categories, while the F4 Inner Harbor ferry service contributes 23 percent of total commuter boat ridership, it makes up only 5.3 percent of revenue, due 21
23 to its lower fares compared to those of other boat services. The F1 and F2 services account for 63 percent and 32 percent, respectively, of commuter boat revenue. TABLE Total Revenue by Modal Category Mode Revenue Bus $74,079,491 Local $67,677,183 Crosstown $878,215 Inner Express $4,203,321 Outer Express $1,320,772 Rapid Transit $238,746,027 Red, Orange, Blue, Green, Silver Line Waterfront Subway $177,672,061 In-Station Transfer $36,710,658 Silver Line Washington Street $2,566,146 Silver Line Waterfront Surface $1,521,242 Light Rail Surface (Green Line and Mattapan High-Speed Line) $20,275,920 Total Core AFC System $312,825,518 Commuter Rail $101,856,083 Zone $82,675,818 Zone 1a $1,033,484 Zone 1 $4,587,109 Zone 2 $10,426,206 Zone 3 $12,148,803 Zone 4 $12,245,406 Zone 5 $7,820,010 Zone 6 $14,476,898 Zone 7 $8,801,540 Zone 8 $11,136,362 InterZone (all zones) $310,294 Onboard (all zones) $18,869,972 Commuter Boat $6,248,346 F1: Hingham-Boston $3,939,383 F2: Quincy-Hull-Boston-Logan Airport $1,979,443 F4: Boston-Charlestown $329,520 The RIDE $3,297,882 Total Non-Core, Non-AFC System $111,402,311 Total System $424,227,829 22
24 COMPARISON OF THE POST- AND PRE-FARE INCREASE IMPACTS ANALYSES This section will show the percent changes in ridership and revenue due to the 2007 fare increase and restructuring and compare these percentages to those projected by the Pre- Fare Increase Impacts Analysis. It will then show the calculated price elasticities and possible ridership diversion factors, and compare them to those that were used to make the projections. Finally, the pass-ride values determined for each pass type (the number of uses per month per modal category) will be presented and compared to those used in the Pre-Fare Increase Impacts Analysis. Ridership Percent Changes In estimating the percent change in unlinked trips for various modal categories, it is possible to split the ridership totals between single-ride and pass trips to better understand the impact depending on the rider category. In general, the data from AFC makes this split relatively easy, as each trip is matched with a specific transaction type that can be coded as either single-ride or pass. One issue arises, however, with the designation of trips estimated using the farebox or faregate non-interaction factors. Because these trips, by definition, do not interact with any AFC equipment, it is impossible to know how each should be classified. If they are children or fare evaders, then they should be classified as single-ride trips. If they are pass holders who flash their pass to gain entry, however, then they should be classified as pass trips. As part of the surface Green Line fare-mix study and passenger count, the number of flash pass trips and the number of other non-interaction trips were counted. Flash pass trips were found to make up 40.8 percent. This ratio was assumed to be the flash pass percentage for all farebox non-interaction trips (all faregate non-interaction trips were assumed to be single-ride). This assumption has a significant effect on the relative ridership estimates for single-ride versus pass trips. Ridership declines are generally witnessed throughout the system. Total bus ridership for 2007 was estimated at 95.2 million, as shown in Table 9. This represents a 7.9 percent decrease compared to the annual bus ridership total before the fare increase and restructuring. When breaking out total bus ridership between single-ride and pass trips, single-ride trips show a decrease of 6.8 percent, while pass trips decrease by 8.9 percent. Whereas pass trips seem to have responded to the fare increase more dramatically than single-ride trips for bus, this was not the case for rapid transit categories. All subway stations (including in-station transfers) along the Red, Orange, Blue, Green, and Silver Waterfront lines constitute 202 million annual unlinked trips. This represents a 6.6 percent decrease compared to the annual total before the fare increase and restructuring. Single-ride and pass ridership both declined by 6.6 percent. Total unlinked trips on the surface Green Line decreased by 31.3 percent, and single-ride trips declined by more than pass trips, 34.2 percent versus 27.8 percent, respectively. 23
25 Outside of the core transit systems, commuter rail appears to have witnessed a 12 percent decline in unlinked trips. Unlike bus and even more so than with rapid transit, the majority of this decline seems to have occurred in single-ride trips, with a 33.9 percent decline in this category. Pass trips, on the other hand, decreased by only 1.1 percent. Within the commuter rail zones, the higher-priced zones on average saw larger percentage decreases in single-ride trips. Some passes actually appear to have higher ridership now than before the fare increase, though on average the impact on total pass ridership was slightly negative. Ridership on commuter boat increased by 9.2 percent; this was driven by a doubling of pass ridership, as there was a decrease of 11.2 percent in single-ride trips. Despite the increase in pass trips on commuter boat, they still amount to only about half the number of single-ride trips on this mode. Finally, The RIDE also witnessed an increase in ridership during 2007, as the number of trips on this service jumped by 23.5 percent. The above figures are presented in Tables 11 through 12. Note that only modes with ridership totals at or near one million trips are presented in the tables, although ridership on these modes is included in the modal subtotals. Table 13 presents the ridership for the entire core system, which declined by 9.7 percent for single-ride trips and 9.3 percent for pass trips, for a total percent decrease across all fare categories in core trips of 9.5 percent. Total non-core ridership declined by 25.7 percent for single-ride trips and actually increased by 0.1 percent for pass trips. The total percent decrease in non-core trips was 9.7 percent. Taken together, core and non-core single-ride trips fell by 10.9 percent in 2007, while pass trips fell by 8.5 percent, for a total annual systemwide decrease in unlinked trips of 9.5 percent. TABLE 11 Percent Change in Single-Ride Unlinked Trips Mode Post-Fare Increase Pre-Fare Increase % Change Bus 45,831,007 49,196, % Rapid Transit 98,740, ,942, % Subway & Silver Line Waterfront 86,212,749 92,297, % Silver Line Washington St 1,929,477 1,696, % Surface Green Line 10,597,337 16,116, % Total Core AFC System 144,571, ,139, % Commuter Rail 6,510,593 9,852, % Zone 1a 90,600 94, % Zone 1 450, , % Zone 2 1,034,362 1,376, % Zone 3 1,069,749 1,434, % Zone 4 828,582 1,191, % Zone 5 628, , % Zone 6 1,004,307 1,507, % Zone 7 533, , % Zone 8 853,555 1,244, % Commuter Boat 930,154 1,047, % The RIDE 1,648,941 1,335, % Total Non-Core Non-AFC System 9,089,688 12,235, % Total System 153,661, ,374, % 24
TECHNICAL REPORT: Impact Analysis of a Potential MBTA Fare Increase and Restructuring in 2007
 TECHNICAL REPORT: Impact Analysis of a Potential MBTA Fare Increase and Restructuring in 2007 Prepared for Dennis A. DiZoglio, MBTA Deputy General Manager for Development Project Manager Clinton Bench
Potential MBTA Fare Changes in SFY 2017
 Potential MBTA Fare Changes in SFY 2017 Option 1 Impact Analysis A report produced for the Massachusetts Bay Transportation Authority by the Central Transportation Planning Staff Potential MBTA Fare Changes
Potential MBTA Fare Changes in SFY 2017
 Potential MBTA Fare Changes in SFY 2017 Modification to Option 2: Impact Analysis A report produced for the Massachusetts Bay Transportation Authority by the Central Transportation Planning Staff Potential
Title VI Fare Change Equity Analysis
 Title VI Fare Change Equity Analysis Evaluation Report Submitted to Dallas Area Rapid Transit Submitted by TranSystems June 2012 Title VI Fare Change Equity Analysis Introduction DART has proposed a schedule
Greenbush Commuter Rail Before-and-After Study
 Greenbush Commuter Rail Before-and-After Study a report produced by the Central Transportation Planning Staff for the Massachusetts Bay Transportation Authority Greenbush Commuter Rail Before-and-After
Guidelines for Providing Access to Public Transportation Stations APPENDIX C TRANSIT STATION ACCESS PLANNING TOOL INSTRUCTIONS
 APPENDIX C TRANSIT STATION ACCESS PLANNING TOOL INSTRUCTIONS Transit Station Access Planning Tool Instructions Page C-1 Revised Final Report September 2011 TRANSIT STATION ACCESS PLANNING TOOL INSTRUCTIONS
1999 On-Board Sacramento Regional Transit District Survey
 SACOG-00-009 1999 On-Board Sacramento Regional Transit District Survey June 2000 Sacramento Area Council of Governments 1999 On-Board Sacramento Regional Transit District Survey June 2000 Table of Contents
Appendix 3.2 D. Ridership Errata Sheet
 Appendix 3.2 D Ridership Errata Sheet January 14, 2010 Since the release of the Alternatives Description for the South Coast Rail project, the Massachusetts Department of Transportation has identified
Midtown Corridor Alternatives Analysis
 Midtown Corridor Alternatives Analysis Ridership Forecast Methodology and Results December 2013 Prepared by the SRF Consulting Group Team for Table of Contents Introduction... 1 Methodology... 1 Assumptions...
BOSTON REGION METROPOLITAN PLANNING ORGANIZATION
 PLANNING ORGANIZATIO BOSTON REGION MPO NMETROPOLITAN BOSTON REGION METROPOLITAN PLANNING ORGANIZATION Stephanie Pollack, MassDOT Secretary and CEO and MPO Chair Karl H. Quackenbush, Executive Director,
February 2018 METRO TRANSIT RIDERSHIP AUDIT PROGRAM EVALUATION AND AUDIT
 February 2018 METRO TRANSIT RIDERSHIP AUDIT PROGRAM EVALUATION AND AUDIT INTRODUCTION Background Each weekday, Metro Transit provides more than 250,000 rides across 131 routes. This includes urban local
Travel and Rider Characteristics for Metrobus
 Travel and Rider Characteristics for Metrobus 040829040.15 Travel and Rider Characteristics for Metrobus: 2012-2015 Overview The Miami Dade County Metropolitan Planning Organization (MPO) conducted a series
Operational Comparison of Transit Signal Priority Strategies
 Operational Comparison of Transit Signal Priority Strategies Revision Submitted on: November, 0 Author: Adriana Rodriguez, E.I Assistant Engineer Parsons Brinckerhoff 0 South Orange Avenue, Suite 00 Orlando,
ORANGE COUNTY TRANSPORTATION AUTHORITY. Metrolink Ridership and Revenue Quarterly Report. Staff Report
 ORANGE COUNTY TRANSPORTATION AUTHORITY Metrolink Ridership and Revenue Quarterly Report Staff Report March 8, 2012 To: From: Subject: Transit Committee Will Kempton, Chief Executive Officer Metrolink Ridership
Interim Transit Ridership Forecast Results Technical Memorandum
 Interim Transit Ridership 401 South Jackson Street Seattle, WA 98104-2826 September 2012 Table of Contents 1 INTRODUCTION... 1-1 1.1 Project Background... 1-1 2 RIDERSHIP FORECASTS... 2-1 2.1 System Ridership
Report Overview Policy versus Performance: Directions for North Carolina s Largest Transit Systems
 For Truth. For Freedom. For the Future of North Carolina Report Overview Policy versus Performance: Directions for North Carolina s Largest Transit Systems By David T. Hartgen Professor of Transportation
Where We Live and Work Today
 San Diego Forward: The 2019-2050 Regional Plan Network Concepts Transportation Committee Item 4 October 19, 2018 Where We Live and Work Today 2018 2 2019 Regional Plan Transportation Committee Item 4 October
REPORT. RECOMMENDATION: 1. That the report on Pilot Results Free Transit for Seniors, dated October 25, 2012, from Oakville Transit be received.
 REPORT MEETING DATE: NOVEMBER 15, 2012 FROM: Oakville Transit DATE: October 25, 2012 SUBJECT: Pilot Results - Free Transit for Seniors LOCATION: Town Wide WARD: Town wide Page 1 RECOMMENDATION: 1. That
SUBJECT: Board Approval: 4/29/04
 1255 Imperial Avenue, Suite 1000 San Diego, CA 92101-7490 619/231-1466 FAX 619/234-3407 Policies and Procedures No. 38 SUBJECT: Board Approval: 4/29/04 OUT-OF-DIRECTION BUS ROUTINGS PURPOSE: To establish
Tulsa Metropolitan Area LONG RANGE TRANSPORTATION PLAN
 Tulsa Metropolitan Area LONG RANGE TRANSPORTATION PLAN Indian Nations Council of Governments August 2005 CONTACTING INCOG In developing the Destination 2030 Long Range Transportation Plan, INCOG s Transportation
Modal Shift in the Boulder Valley 1990 to 2009
 Modal Shift in the Boulder Valley 1990 to 2009 May 2010 Prepared for the City of Boulder by National Research Center, Inc. 3005 30th Street Boulder, CO 80301 (303) 444-7863 www.n-r-c.com Table of Contents
. ' motion. APPLtlDK.L - L"iLC_t1GLR 201b APPENDIX 7 TECHNICAL MEMOS
 . ' motion APPLtlDK.L - L"iLC_t1GLR 201b APPENDIX 7 TECHNICAL MEMOS The nmotion program will provide a large number of benefits for Middle Tennessee. This document presents selected benefits and other
Hampton Roads Transit. Ridership Report for February 2014 Operations & Oversight Committee Meeting
 Hampton Roads Transit Report for February 214 Operations & Oversight Committee Meeting Hampton Roads Transit UPDATED: Wednesday, January 8, 214 Hampton Roads Transit Report for the March 214 Operations
Cheryl Thole CUTR/NBRTI, Senior Research Associate Tampa, Florida
 A Change in Accessibility and Convenience? Implementing BRT and the Impact on Transit Riders Cheryl Thole CUTR/NBRTI, Senior Research Associate Tampa, Florida Project Background Greater station spacing
APPENDIX C Arlington Transit On-Board Survey Technical Memorandum
 APPENDIX C Arlington Transit On-Board Survey Technical Memorandum Arlington County Appendix C December 2010 TABLE OF CONTENTS 1.0 Overview of Transit Rider Survey Process... 1 2.0 Responses to Survey Questions...
Evan Johnson, Tindale Oliver & Associates. Alan Danaher, P.E., PTOE, AICP, PTP
 To: Copies: From: Evan Johnson, Tindale Oliver & Associates Matt Muller, RTS Jesus Gomez, RTS Alan Danaher, P.E., PTOE, AICP, PTP Date: January 14, 2014 Subject: Ridership Projections Gainesville Streetcar
FARE IMPACT STUDY. Prepared by the. Pioneer Valley Planning Commission
 FARE IMPACT STUDY Prepared by the Pioneer Valley Planning Commission March 30, 2018 CONTENTS 1. PURPOSE... 3 2. STUDY CONTEXT... 4 3. PVTA S CURRENT FARE PRICES AND POLICIES... 4 4. HISTORY OF PVTA FARE
2016 Capital Bikeshare Member Survey Report
 2016 Capital Bikeshare Member Survey Report Prepared by: LDA Consulting Washington, DC 20015 (202) 548-0205 February 24, 2017 EXECUTIVE SUMMARY Overview This report presents the results of the November
WHAT IFS: Over the course of
 WHAT IFS: Over the course of the 422plus Project certain questions have arisen multiple times at meetings, briefings and on-line at the website. Most of these questions start with WHAT IF. WHAT IF vehicle
Safety and Service Delivery. Committee Information Item III-A. April 12, 2018
 Safety and Service Delivery Committee Information Item III-A April 12, 2018 Fair Share Initiative Update Page 3 of 41 Washington Metropolitan Area Transit Authority Board Action/Information Summary Action
Capital Metro Monthly Ridership Report March 2017 (Fiscal Year 2017)
") Capital Metro Monthly Ridership Report March 2017 (Fiscal Year 2017) Page 1 of 5 Ridership Summary This is a summary of Capital Metro system-wide ridership statistics for the month of March 2017 by mode
Capital Metro Monthly Ridership Report March 2017 (Fiscal Year 2017) Page 1 of 5 Ridership Summary This is a summary of Capital Metro system-wide ridership statistics for the month of March 2017 by mode
METRO Light Rail: Changing Transit Markets in the Phoenix Metropolitan Area
 METRO Light Rail: Changing Transit Markets in the Phoenix Metropolitan Area Abhishek Dayal, AICP Planner III, METRO Light Rail Phoenix, AZ BACKGROUND Transit in the Phoenix Region Transit services in the
Rochester Area Bike Sharing Program Study
 roc bike share Rochester Area Bike Sharing Program Study Executive Summary ~ January 2015 JANUARY 2015 8484 Georgia Avenue, Suite 800 Silver Spring, MD 20910 3495 Winton Pl., Bldg E, Suite 110 Rochester,
Capital Metro Monthly Ridership Report November 2016 (Fiscal Year 2017)
") Capital Metro Monthly Ridership Report November 2016 (Fiscal Year 2017) Page 1 of 5 Ridership Summary This is a summary of Capital Metro system-wide ridership statistics for the month of November 2016
Capital Metro Monthly Ridership Report November 2016 (Fiscal Year 2017) Page 1 of 5 Ridership Summary This is a summary of Capital Metro system-wide ridership statistics for the month of November 2016
Sketch Level Assessment. of Traffic Issues. for the Fluor Daniel I-495 HOT Lane Proposal. Ronald F. Kirby
 Sketch Level Assessment of Traffic Issues for the Fluor Daniel I-495 HOT Lane Proposal Ronald F. Kirby Director of Transportation Planning National Capital Region Transportation Planning Board (TPB) Metropolitan
Revenue Estimating Conference Lottery Sales Executive Summary
 Revenue Estimating Conference Lottery Sales Executive Summary July 14, 2014 The Revenue Estimating Conference reviewed Lottery revenues on July 14, 2014, and decreased the overall forecast from the one
Capital Metro Monthly Ridership Report December 2016 (Fiscal Year 2017)
") Capital Metro Monthly Ridership Report December 2016 (Fiscal Year 2017) Page 1 of 5 Ridership Summary This is a summary of Capital Metro system-wide ridership statistics for the month of December 2016
Capital Metro Monthly Ridership Report December 2016 (Fiscal Year 2017) Page 1 of 5 Ridership Summary This is a summary of Capital Metro system-wide ridership statistics for the month of December 2016
PARKING REVENUE MODEL AN INFORMATIONAL REPORT. Nitin P. Deshpande Jacobs. Errol K. Stevens Regional Transport District - Denver
 PARKING REVENUE MODEL AN INFORMATIONAL REPORT Nitin P. Deshpande Jacobs Errol K. Stevens Regional Transport District - Denver SUMMARY Denver, Colorado is the seventh 1 most congested large urban area (over
Appendices. Atkins SBL Forecasting Report 54
 Appendices Atkins 5103087 SBL 54 Atkins 5103087 SBL 55 Appendix A. Local Trip End Generation Rates A.1. A.1.1. Trip Rates The trip rates calculated from TRICS v6.8.1 are presented below for each of the
Ridership in Virginia by System FY2017
 #6C TO: FROM: Chairman McKay and NVTC Commissioners Kate Mattice, Andrew D huyvetter and Nobuhiko Daito DATE: August 30, 2017 SUBJECT: NVTC FY2017 Annual Ridership Report Overall transit ridership in Northern
MEMORANDUM. Charlotte Fleetwood, Transportation Planner
 MEMORANDUM Date: Updated August 22, 2017 To: Organization: Charlotte Fleetwood, Transportation Planner Boston Transportation Department From: Jason DeGray, P.E., PTOE, Regional Director of Engineering
Members of the Board of Directors. Wendy Knowles, Clerk of the Board. Metrolink Ridership and Revenue Annual Report
 COMMITTEE TRANSMITTAL January 13, 2014 To: From: Subject: Members of the Board of Directors Wendy Knowles, Clerk of the Board Metrolink Ridership and Revenue Annual Report Transit Committee Meeting of
ENHANCED PARKWAY STUDY: PHASE 2 CONTINUOUS FLOW INTERSECTIONS. Final Report
 Preparedby: ENHANCED PARKWAY STUDY: PHASE 2 CONTINUOUS FLOW INTERSECTIONS Final Report Prepared for Maricopa County Department of Transportation Prepared by TABLE OF CONTENTS Page EXECUTIVE SUMMARY ES-1
1.221J/11.527J/ESD.201J TRANSPORTATION SYSTEMS FALL 2003 FINAL EXAMINATION. 1. Open-book and open-notes, calculators are fine -- no laptops.
 1.221J/11.527J/ESD.201J TRANSPORTATION SYSTEMS FALL 2003 FINAL EXAMINATION Instructions: PROFESSOR JOSEPH M. SUSSMAN (LECTURER) 1. Open-book and open-notes, calculators are fine -- no laptops. 2. The exam
2.2 TRANSIT VISION 2040 FROM VISION TO ACTION. Emphasize transit priority solutions STRATEGIC DIRECTION
 TRANSIT VISION 2040 FROM VISION TO ACTION TRANSIT VISION 2040 defines a future in which public transit maximizes its contribution to quality of life with benefits that support a vibrant and equitable society,
Value of time, safety and environment in passenger transport Time
 TØI report 1053B/2010 Author(s): Farideh Ramjerdi, Stefan Flügel, Hanne Samstad and Marit Killi Oslo 2010, 324 pages Norwegian language Summary: Value of time, safety and environment in passenger transport
ECTS Purpose & Needs. Exhibit Home-Based Work Trips Attracted to the Penn/Jeannette Area
 Exhibit 4.23 - Home-Based Work Trips Attracted to the Penn/Jeannette Area Exhibit 4.24 - Transit Use for Work Trips Attracted to the Penn/Jeannette Area Eastern Corridor Transit Study 61 Greensburg - and
Purpose and Need. Chapter Introduction. 2.2 Project Purpose and Need Project Purpose Project Need
 Chapter 2 Purpose and Need 2.1 Introduction The El Camino Real Bus Rapid Transit (BRT) Project (Project) would make transit and other transportation improvements along a 17.6-mile segment of the El Camino
STAFF REPORT ACTION REQUIRED
 STAFF REPORT ACTION REQUIRED 2016 Ridership Update Date: March 23, 2016 To: From: TTC Board Chief Executive Officer Summary This report provides an update of TTC ridership results to the end of February
APPENDIX A LITERATURE REVIEW AND SUMMARY OF STAKEHOLDER INTERVIEWS
 APPENDIX A LITERATURE REVIEW AND SUMMARY OF STAKEHOLDER INTERVIEWS Page A-1 Revised Final Report September 2011 INTRODUCTION A literature review was conducted to identify the current body of knowledge
Gratiot Avenue Transit Study Tech Memo #4: Ridership
 Gratiot Avenue Transit Study Tech Memo #4: Ridership 5/31/2016 Table of Contents 1 INTRODUCTION... 3 PROJECT DESCRIPTION... 3 2 TECH MEMO #4 OVERVIEW... 5 METHODOLOGY... 5 3 THE ALTERNATIVES AND POTENTIAL
Capital Metro Monthly Ridership Report September 2017 (Fiscal Year-end 2017)
") Capital Metro Monthly Ridership Report September 2017 (Fiscal Year-end 2017) Page 1 of 6 Ridership Summary This is a summary of Capital Metro system-wide ridership statistics for fiscal year-end and the
Capital Metro Monthly Ridership Report September 2017 (Fiscal Year-end 2017) Page 1 of 6 Ridership Summary This is a summary of Capital Metro system-wide ridership statistics for fiscal year-end and the
Increased Onboard Bicycle Capacity Improved Caltrain s Performance in 2009
 Increased Onboard Bicycle Capacity Improved Caltrain s Performance in 2009 February 4, 2010 Prepared by: BIKES ONboard Project San Francisco Bicycle Coalition Prepared by the San Francisco Bicycle Coalition
January Project No
 January 13 2015 Project No. 5070.05 Neil Connelly, Director University of Victoria, Campus Planning and Sustainability PO Box 1700 STN CSC Victoria, BC V8P 5C2 Dear Neil: Re: UVic 2014 Traffic Final Report
WHITE PAPER: TRANSIT SERVICE FOR SOUTH SHAGANAPPI
 9/27/2012 TRANSIT PLANNING WHITE PAPER: TRANSIT SERVICE FOR SOUTH SHAGANAPPI 2012 Calgary Transit 1 Table of Contents Purpose... 3 Area of Change... 3 Background... 3 Access to destinations... 5 Connecting
Understanding Transit Demand. E. Beimborn, University of Wisconsin-Milwaukee
 Understanding Transit Demand E. Beimborn, University of Wisconsin-Milwaukee 1 Purpose To provide a basic understanding of transit ridership and some common misunderstandings. To explain concepts of choice
TRANSPORTATION TOMORROW SURVEY
 Clause No. 15 in Report No. 7 of was adopted, without amendment, by the Council of The Regional Municipality of York at its meeting held on April 17, 2014. 15 2011 TRANSPORTATION TOMORROW SURVEY recommends
Executive Summary BEYOND THE B-LINE: RAPID TRANSIT LINE PHASE II - COMMERCIAL DRIVE WEST. Final Draft December 13, Appendix B BROADWAY/LOUGHEED
 BEYOND THE B-LINE: BROADWAY/LOUGHEED RAPID TRANSIT LINE PHASE II - COMMERCIAL DRIVE WEST Appendix B Executive Summary Final Draft December 13, 1999 UMA Lloyd Lindley Davidson Yuen Simpson Architects BROADWAY/LOUGHEED
ALTERNATIVES ANALYSIS EXECUTIVE SUMMARY
 West Valley Connector Corridor ALTERNATIVES ANALYSIS EXECUTIVE SUMMARY FINAL September 2014 Ontario International Airport Ontario Mills Rancho Cucamonga Metrolink Station Kaiser Permanente PARSONS EXECUTIVE
CITY OF ALPHARETTA DOWNTOWN MASTER PLAN TRAFFIC EVALUATION
 CITY OF ALPHARETTA DOWNTOWN MASTER PLAN TRAFFIC EVALUATION June 2015 CITY OF ALPHARETTA DOWNTOWN MASTER PLAN TRAFFIC EVALUATION Introduction The Alpharetta Downtown Master Plan was developed in the fall
LESSONS FROM THE GREEN LANES: EVALUATING PROTECTED BIKE LANES IN THE U.S.
 LESSONS FROM THE GREEN LANES: EVALUATING PROTECTED BIKE LANES IN THE U.S. FINAL REPORT: APPENDIX C BICYCLIST ORIGIN AND DESTINATION ANALYSIS NITC-RR-583 by Alta Planning and Design Matt Berkow Kim Voros
Capital Metro Monthly Ridership Report January 2018 (Fiscal Year 2018)
") Capital Metro Monthly Ridership Report January 2018 (Fiscal Year 2018) Page 1 of 5 Ridership Summary This is a summary of Capital Metro system-wide ridership statistics for the month of January 2018 by
Capital Metro Monthly Ridership Report January 2018 (Fiscal Year 2018) Page 1 of 5 Ridership Summary This is a summary of Capital Metro system-wide ridership statistics for the month of January 2018 by
3 ROADWAYS 3.1 CMS ROADWAY NETWORK 3.2 TRAVEL-TIME-BASED PERFORMANCE MEASURES Roadway Travel Time Measures
 ROADWAYS Approximately 6 million trips are made in the Boston metropolitan region every day. The vast majority of these trips (80 to percent, depending on trip type) involve the use of the roadway network
May Canal Cordon Report 2017
 May 2018 Canal Cordon Report 2017 Report on trends in mode share of vehicles and people crossing the Canal Cordon to 2017 2 Analysis of trends in mode share of people crossing the canal cordon - 2017 Contents
Chapter 2 Current and Future Conditions
 Chapter 2 Current and Future Conditions 2.1 An Overview of Ottawa s Transportation System The City of Ottawa is home to about 870,700 people. The city covers an area of 2,760 square kilometres of which
CHAPTER 10 TOTAL RECREATIONAL FISHING DAMAGES AND CONCLUSIONS
 CHAPTER 10 TOTAL RECREATIONAL FISHING DAMAGES AND CONCLUSIONS 10.1 INTRODUCTION This chapter provides the computation of the total value of recreational fishing service flow losses (damages) through time
TRANSIT & NON-MOTORIZED PLAN DRAFT FINAL REPORT Butte County Association of Governments
 1 INTRODUCTION Maintaining a high quality of life is the essence of this plan for transit and non-motorized transportation in Butte County. Curbing greenhouse gas emissions (GHG) by reducing congestion,
Joe Rocca P.Eng., Traffic and Asset Management Supervisor. Review for Proposed Kingsway Sports and Entertainment Complex, City of Greater Sudbury
 LETTER REPORT TO: Joe Rocca P.Eng., Traffic and Asset Management Supervisor FROM: Brett Sears and Ubaid Ali, WSP SUBJECT: Review for Proposed Kingsway Sports and Entertainment Complex, City of Greater
RIVER CROSSINGS: EAST OF SILVERTOWN CROSSINGS
 TRANSPORT FOR LONDON RIVER CROSSINGS: EAST OF SILVERTOWN CROSSINGS SUPPORTING TECHNICAL DOCUMENTATION TRAFFIC IMPACT REPORT Neil Georgeson July 2014 This report examines the traffic impacts that potential
El Paso to Las Cruces Proposed Rail Service Estimated Ridership and Proposed Schedule
 to Las Cruces Proposed Rail Service Estimated Ridership and Proposed Schedule Ridership estimation is a central consideration when assessing the feasibility of a proposed transit line. A sketch model is
Regional Transportation Needs Within Southeastern Wisconsin
 Regional Transportation Needs Within Southeastern Wisconsin #118274 May 24, 2006 1 Introduction The Southeastern Wisconsin Regional Planning Commission (SEWRPC) is the official areawide planning agency
IMPACTS TO TRANSIT FROM LOS ANGELES CONGESTION REDUCTION DEMONSTRATION. Word Count: 3,386 (body) + 2,000 (8 tables) + 1,500 (6 figures) = 6,886 words
 + 2,000 (8 tables) + 1,500 (6 figures) = 6,886 words") IMPACTS TO TRANSIT FROM LOS ANGELES CONGESTION REDUCTION DEMONSTRATION TRB PAPER -0 Brian Pessaro, AICP Senior Research Associate Center for Urban Transportation Research (CUTR) University of South Florida
IMPACTS TO TRANSIT FROM LOS ANGELES CONGESTION REDUCTION DEMONSTRATION TRB PAPER -0 Brian Pessaro, AICP Senior Research Associate Center for Urban Transportation Research (CUTR) University of South Florida
Arterial Transitway Corridors Study
 Arterial Transitway Corridors Study February 2012 Arterial Transitway Corridors Study Overview Corridor Features and Demographics 11 study corridors, 95 route miles Routes: 86,000 daily rides and half
Aurora Corridor to E Line
 Aurora Corridor to E Line Jack Whisner Transit Planner, Service Development King County Metro Transit Seattle, Washington jack.whisner@kingcounty.gov 206-477-5847 King County Metro Transit Part of general
Philadelphia Bus Network Choices Report
 Philadelphia Bus Network Choices Report JUNE 2018 SEPTA Table of Contents Executive Summary...7 What if transit gave us more freedom?... 8 What is this report?... 8 The main conclusions... 9 What is happening
APPENDIX 2 LAKESHORE ROAD TRANSPORTATION REVIEW STUDY EXECUTIVE SUMMARY
 APPENDIX 2 LAKESHORE ROAD TRANSPORTATION REVIEW STUDY EXECUTIVE SUMMARY Appendix 2 City of Mississauga Lakeshore Road FINAL REPORT Transportation Review Study December 2010 EXECUTIVE SUMMARY Study Purpose
Non-motorized Transportation Planning Resource Book Mayor s Task Force on Walking and Bicycling City of Lansing, Michigan Spring 2007 pg.
 Non-motorized Transportation Planning Resource Book pg. 105 of 158 Non-motorized Transportation Planning Resource Book pg. 106 of 158 Non-motorized Transportation Planning Resource Book pg. 107 of 158
RIDERSHIP PREDICTION
 RIDERSHIP PREDICTION Outline 1. Introduction: route ridership prediction needs and issues. 2. Alternative approaches to route ridership prediction. Professional judgement Survey-based methods Cross-sectional
Camosun College Modal Split
 2010 Camosun College Modal Split How Does the College Community Get to Campus? Shannon Craig & Julie Higginson Camosun College 1/21/2011 Contents Introduction... 3 Methodology... 3 Results... 6 Mode Share
ITS-NY ANNUAL MEETING Bus Rapid Transit in New York City: Bus Lane Operations on One-Way Arterial Streets
 ITS-NY ANNUAL MEETING Bus Rapid Transit in New York City: Bus Lane Operations on One-Way Arterial Streets June 9, 2011 Ted Orosz AICP, Director Long Range Bus Planning MTA New York City Transit 1 Overview
AMERICAN ACADEMY OF ACTUARIES MEDICARE SUPPLEMENT WORK GROUP SUBTEAM REPORT ON LOSS RATIO CURVES FOR REDETERMINATION OF REFUND BENCHMARKS
 AMERICAN ACADEMY OF ACTUARIES MEDICARE SUPPLEMENT WORK GROUP SUBTEAM REPORT ON LOSS RATIO CURVES FOR REDETERMINATION OF REFUND BENCHMARKS March 10, 2004 The American Academy of Actuaries is the public
MoPac South: Impact on Cesar Chavez Street and the Downtown Network
 MoPac South: Impact on Cesar Chavez Street and the Downtown Network Prepared by: The University of Texas at Austin Center for Transportation Research Prepared for: Central Texas Regional Mobility Authority
Preliminary Report. Note: calculations reported are preliminary and should not be cited without the author s permission. December 21, 2003.
 Preliminary Report Analysis of Total Fishing Mortality for Gulf of Mexico Red Snapper Contributed by Shrimp Trawl Bycatch and Commercial and Recreational Fisheries (Including Discards) Note: calculations
Reduction of Speed Limit at Approaches to Railway Level Crossings in WA. Main Roads WA. Presenter - Brian Kidd
 Australasian College of Road Safety Conference A Safe System: Making it Happen! Melbourne 1-2 September 2011 Reduction of Speed Limit at Approaches to Railway Level Crossings in WA Radalj T 1, Kidd B 1
At each type of conflict location, the risk is affected by certain parameters:
 TN001 April 2016 The separated cycleway options tool (SCOT) was developed to partially address some of the gaps identified in Stage 1 of the Cycling Network Guidance project relating to separated cycleways.
Defining Purpose and Need
 Advanced Design Flexibility Pilot Workshop Session 4 Jack Broz, PE, HR Green May 5-6, 2010 Defining Purpose and Need In your agency s project development process, when do design engineers typically get
York Scarborough Bridge Economic Appraisal Update Technical Note
 York Scarborough Bridge Economic Appraisal Update Technical Note Specification No. 1 Client name West Yorkshire Combined Authority Client reference M088 Discipline Transportation Project name CCAG2 Economics
Gray Diversion Study Draft Report
 Gray Diversion Study Draft Report Presented to: Maine Turnpike Authority HNTB Corporation January 30, 2014 Table of Contents Section 1. Purpose... 3 Section 2. Data Sources... 3 Section 3. Background...
MTA CAPITAL PROGRAM: Tri-State Transportation Campaign
 MTA CAPITAL PROGRAM: WHAT S IT IN FOR LONG ISLAND? Tri-State Transportation Campaign December 3, 2009 The Context From 2000-2008 Population growth 3.8% 25-44 years olds percentage of population dropped
An Evaluation of Comprehensive Transit Improvements TriMet s Streamline Program
 An Evaluation of Comprehensive Transit Improvements TriMet s Streamline Program Peter Koonce, Kittelson & Associates, Inc. Paul Ryus, Kittelson & Associates, Inc. David Zagel, TriMet Young Park, TriMet
Evaluating the Influence of R3 Treatments on Fishing License Sales in Pennsylvania
 Evaluating the Influence of R3 Treatments on Fishing License Sales in Pennsylvania Prepared for the: Pennsylvania Fish and Boat Commission Produced by: PO Box 6435 Fernandina Beach, FL 32035 Tel (904)
Estimating Ridership of Rural Demand-Response Transit Services for the General Public
 Estimating Ridership of Rural Demand-Response Transit Services for the General Public August 2016 prepared for US DOT prepared by Jeremy Mattson North Dakota State University Upper Great Plains Transportation
STATE OF NEW YORK OFFICE OF THE STATE COMPTROLLER 110 STATE STREET ALBANY, NEW YORK September 2015
 THOMAS P. DiNAPOLI COMPTROLLER STATE OF NEW YORK OFFICE OF THE STATE COMPTROLLER 110 STATE STREET ALBANY, NEW YORK 12236 GABRIEL F. DEYO DEPUTY COMPTROLLER DIVISION OF LOCAL GOVERNMENT AND SCHOOL ACCOUNTABILITY
Cotton Belt Corridor Regional Rail Project
 Cotton Belt Corridor Regional Rail Project Ridership July 2013 Prepared by URS Corporation Prepared for Dallas Area Rapid Transit General Planning Consultant Managed by URS Corporation Document Revision
Appendix 1 Transit Network Analysis
 Appendix 1 Transit Network Analysis APPENDIX 1 TRANSIT NETWORK ANALYSIS The purpose of this appendix is to provide an update on the transit network analysis as it pertains to: i. SmartTrack ii. Scarborough
Photo: Skot Weidemann
 Photo: Skot Weidemann To Assess Madison s Market Possibilities, We Analyzed EmpowerMINT database ANALYTICAL PROCESS STEP 1 STEP 2 STEP 3 Started with approximately 25,000 rows of data from the Destination
WORKING GROUP ON STOCK ASSESSMENTS 5 TH MEETING DOCUMENT SAR-5-08 TARGET SIZE FOR THE TUNA FLEET IN THE EASTERN PACIFIC OCEAN
 INTER-AMERICAN TROPICAL TUNA COMMISSION COMISIÓN INTERAMERICANA DEL ATÚN TROPICAL WORKING GROUP ON STOCK ASSESSMENTS 5 TH MEETING LA JOLLA, CALIFORNIA (USA) 11-13 MAY 2004 DOCUMENT SAR-5-08 TARGET SIZE
BOSTON REGION METROPOLITAN PLANNING ORGANIZATION
 PLANNING ORGANIZATIO BOSTON REGION MPO NMETROPOLITAN BOSTON REGION METROPOLITAN PLANNING ORGANIZATION Stephanie Pollack, MassDOT Secretary and CEO and MPO Chair Karl H. Quackenbush, Executive Director,
Washington Metropolitan Area Transit Authority Board Action/Information Summary. MEAD Number:
 Washington Metropolitan Area Transit Authority Board Action/Information Summary Action Information MEAD Number: 100962 Resolution: Yes No TITLE: Bicycle and Pedestrian Access Improvements Study PURPOSE:
November 14, Dulles To DC Loop Public-Private Partnership Proposal. Executive Summary
 November 14, 2005 Dulles To DC Loop Public-Private Partnership Proposal Executive Summary Virginia Mobility Associates LLC, a newly established single purpose entity, proposes to privately finance the