2017 Annual Traffic Safety Report
|
|
|
- Reynard Nichols
- 5 years ago
- Views:
Transcription


1 2017 Annual Traffic Safety Report City of Santa Cruz Public Works Department
2 I. Introduction The purpose of the 2017 City of Santa Cruz Traffic Safety Report is to provide an overview of traffic safety trends to help guide future enforcement and engineering efforts. Collisions form a significant portion of the Police Department s workload, and create substantial costs for the City and society as a whole. In 2017 there were 257 reported injury collisions in Santa Cruz, causing 316 injuries and three fatalities. According to estimates from the American Association of State Highway Transportation Officials Highway Safety Manual, these collisions resulted in more than $30M in societal costs. Property damage only collisions are not included in these figures, making the costs likely to be even higher. This report focuses on crash data of reported traffic collisions for the full year ending December 31, 2017 that resulted in injury or fatality. The majority of collision data for this report is accessed through the Statewide Integrated Traffic Records System (SWITRS), due to the superior analysis and mapping features of the system. SWITRS data adoption is delayed, so the annual report for a given year will be submitted approximately one year later, and data is still provisional. Property damage only collisions are not included in SWITRS, and therefore are not included in this report. Although not all collisions are reported, use of the reported collisions provides a consistent measure of crash rates, and focusing on injury collisions allows for analysis of the most serious incidents. This report examines travel mode split, current traffic safety campaigns, and high collision streets. Crash trends over the past 10 years are analyzed, including bike, pedestrian, motorcycle and youth crashes, as well as key factors in collisions. Overall, crash trends were positive for some groups and troubling for others. Total injury crashes are down 4% from 2016 to In a very encouraging trend, bicycle injury crashes are down slightly from 2016, and have decreased nearly 25% since Injury crashes involving motorcycles increased by 30% during the same time period, reversing the downward trend of the past two years, and injury crashes involving pedestrians increased by 19%. The number of hit and run collisions did not change from , while alchohol-involved collisions increased by 21%. The number of collisions involving youth going to or from school remained the same from 2016 to 2017, and Section V includes an analysis of each 2017 incident. While the total number of collisions is small, continued work will be done to direct enforcement, education and engineering efforts towards improving safe routes to schools.
3 II. Travel Modality An understanding of the different ways people travel within the city is useful when analyzing crash data. Below is a table of mode splits the breakdown by percentage of the ways people travel to work in Santa Cruz. During the five years reported ( ), 56.5% of commuters drove alone, 10% walked, 9.5% bicycled, 8% carpooled, 7% took the bus, and 2% used other modes such as taxi, motorcycle, etc. This data marks significant progress towards the City s Climate Action Plan goals to increase biking and walking and decrease single-occupancy vehicle use. Santa Cruz has one of the highest bicycle mode splits in the country, and a significantly lower Drive Alone mode split than most California cities. City of Santa Cruz Mode Split Drove Alone Carpool Public transit Walked Bicycle Taxi Worked at home USA California Santa Cruz County Santa Cruz City Source: U.S. Census Bureau, American Community Survey 5-Year Estimates When mode split is compared with crashes by travel mode, the data shows that cyclists are disproportionally involved in injury collisions. Bicyclists account for about 10% of work trips, but are involved in 38% of injury collisions in the same time period- nearly the same rate as drivers. The California Office of Traffic Safety (OTS) collision rankings for cities of similar population size (50, ,000) consistently rank Santa Cruz among the highest for bicyclist crashes. However, it is important to note that OTS data is not adjusted for mode split - our collision numbers are higher than other cities in part due to our high rates of bicycle trips. Pedestrians are also involved in in a slightly higher rate of injury collisions (12%), and motorcyclists are also overrepresented in collision data. Meanwhile, drivers are involved in injury crashes at disproportionately low rates. Focusing enforcement, education and engineering efforts on cyclist and pedestrian collisions could help address this disparity. 1
4 Collisions by Mode Motor Vehicle 40% Bicycle 38% Motorcycle 10% Pedestrian 12% III. Current Traffic Safety Campaigns The City of Santa Cruz and partner agencies are currently involved in the following traffic safety campaigns, designed to improve safety and reduce collisions on our roadways. Santa Cruz Public Works Department The majority of Transportation Engineering activities are geared towards improving safety. These activities include: Securing grant funding for a wide variety of projects, including safety improvements near schools and operational improvements Maintaining infrastructure and addressing traffic safety issues, such as potholes The Street Smarts campaign raises awareness of common traffic safety issues, and encourages safe behavior among drivers, cyclists and pedestrians Responding to pedestrian and bicyclist hazard reports filed by the community Responding to requests for neighborhood safety improvements Reviewing traffic safety plans for projects in the public right-of-way Santa Cruz Police Department Traffic safety tips shared via Police Department blog and social media Back to school bike and pedestrian safety videos 2
5 School crossing guard program at all City of Santa Cruz elementary schools In-school safety presentations at elementary schools Officer attendance at neighborhood meetings Targeted neighborhood speed enforcement Multi-jurisdictional speed enforcement efforts Online form available to residents to register traffic safety concerns Traffic safety plans for special events Community Traffic Safety Coalition (sponsored by County of Santa Cruz Public Health) Vision Zero campaign raises awareness of traffic injuries and fatalities as preventable, and focuses the conversation around proven strategies Ride n Stride program provides bike and pedestrian safety education at elementary schools throughout the county Neighborhood Pace Car program encourages people to set an example by driving slowly in their neighborhoods Traffic Calming Trash Can Sticker program provides free Please Slow Down stickers to City of Santa Cruz residents Bike Traffic School provides a bike safety class to people who receive a traffic ticket while bicycling. Classes are open to the public. Ecology Action Bike Smart program provides bike safety training for elementary, middle and high school students Walk Smart provides pedestrian safety training for elementary school students UCSC bike safety classes and bike light giveaways Biannual Bike to Work/School Days celebrate cycling and provide data on local bike commuting habits as well as opportunities for bike safety education Santa Cruz City Schools Complete Streets Master Plan provides recommendations for improvements to improve safe routes to schools (partnership with City of Santa Cruz and Santa Cruz City Schools) Bike safety trainings at local employers through Employer Membership Program Bike Santa Cruz County Middle School Bike Clubs at Mission Hill and Branciforte Middle Schools teach bike safety skills to students through on-bike field trips 3
6 IV. Highest Crash Locations The majority of crashes in Santa Cruz occur along our major corridors and other hightraffic areas, particularly at intersections. See below for a ranking of the top injury collision locations for the five year period from Data is divided into intersection and mid-block locations. The top injury collision location was Laurel Street at Washington. Of the nine collisions that occurred there between , four collisions involved motor vehicles only. There was one collision involving a car and pedestrian, and two involving a car and a cyclist. There was also a solo bike collision and a solo collision involving a motorcyclist. Corridor improvements on Laurel Street were installed in late 2011, including pedestrian median islands, dedicated left-turned lane pockets, parking removal, and relocated bus stops. While collisions along this corridor remain high, there has been a reduction since improvements were installed. Between 2008 and 2011, there were 18 injury collisions on Laurel Street between California and Chestnut. In the four years after improvements were installed, that number went down to 12. Green bike lane treatments were also installed in conflict zones along the Laurel St. corridor in early 2015, as well as a left-turn pocket at Walti, new pavement markings and visibility improvements at intersections. The collision reductions at both Laurel and Washington and Laurel and Walti have been significant. In the three years since the 2015 improvements there has been a 50% collision reduction at Laurel and Washington, and a 62% reduction in bike collisions at Laurel and Walti, compared to the three years prior. We will continue to monitor the data to see if these promising trends continue. The #2 collision location, Hwy 1 at River Street, is scheduled for improvements in the next few years, including new lanes and assignments designed to reduce rear-end and sideswipe collisions. The intersection of Seabright and Broadway received new green bike lane treatments in 2016, and the intersection of Bay and King is scheduled for a new left turn pocket, dedicated signal phase and new sidewalk in Highest Injury Collision Intersection Locations (All Modes) 1. Laurel at Washington 9 crashes 2. State Hwy 1 at River 8 crashes 3. Laurel at Walti 6 crashes 4. Ocean St at Plymouth 6 crashes 5. Seabright at Broadway 6 crashes 6. Bay St. at King 5 crashes 7. Laurel St at Pacific 5 crashes 8. Mission at Van Ness Ave 5 crashes 9. Mission at Bay 5 crashes *Eight intersections tied for 10 th with four collisions each 4

7 Highest Injury Collision Mid-block Locations (All Modes) 1. Beach St from Riverside Ave to Cliff St 6 crashes 2. Municipal Wharf from end to Beach St 6 crashes 3. State Hwy 1 from River St. to Chestnut St. Extension 5 crashes Eleven locations tied for 4 th with four collisions each: Mission St. from Van Ness Ave. to Laurent St. Chestnut St. Extension from Mission St. to State Hwy 1 Front St. from Cathcart St. to Soquel Ave. Soquel Ave from Ocean St. to Dakota Ave. Front St. from Laurel St. to Cathcart St. Washington St. from Center St. to Laurel St. Laurel St. from San Lorenzo Blvd. to Front St. Murray St. from Lake Ave. to Seabright Ave. West Cliff Dr. from Beach St. to Bay St. West Cliff Dr. from Pelton Ave. to Columbia St. Source: Crossroads

8 Bike & Pedestrian Top Collision Locations People biking and walking are disproportionately involved in collisions, and the top bike and pedestrian collision locations were analyzed separately to guide future improvements. For cyclists, locations with steep hills and high cyclist speeds rose to the top of the list. At Bay and Escalona, the top bike collision intersection, improvements are planned for 2019 to widen the downhill bike lane and add green lane treatments. There is also an RRFB planned for this intersection. Laurel and Walti, the #2 location, as mentioned above has seen a significant reduction in bike collisions following improvements installed in The improvements planned for Highway 1 at River Street include new bike lanes on River Street, which may help reduce bike collisions. The City has also constructed a bike and pedestrian path under Highway 1, as well as a bike and pedestrian bridge at Felker, to provide a safe alternative to this high-traffic intersection. Highest Collision Intersection Locations (Bikes) 1. Bay St. at Escalona 6 2. Laurel at Walti 5 1
9 3. State Hwy 1 at River St Bay Dr. at Meder 3 5. Laurel St. at Washington 3 6. Municipal Wharf at Beach St Ocean St. at Plymouth 3 8. Union St. at Cedar 3 9. Water St. at Front St. 3 Public Works will continue to investigate possible improvements at Laurel and Pacific, the top pedestrian collision intersection. Pedestrian countdown signals were installed in late 2015, which provide more warning to pedestrians on when it is safe to cross. While this change is too recent to provide conclusive data, early results are positive in the first two years since the new signals were installed there have been two pedestrian collisions, compared to four collisions in the two years prior to improvements. As discussed above, a connection to the levee trails has been constructed to provide a safe alternative to the intersection of Highway 1 at River Street. The #3 pedestrian injury intersection, Mission Street at Van Ness, is under the jurisdiction of Caltrans. Public Works staff works with Caltrans on an ongoing basis to encourage safety improvements in the Mission Street corridor. Highest Collision Intersection Locations (Pedestrians) 1. Laurel St. at Pacific Ave State Hwy 1 at River St Mission St. at Van Ness 3 4. Beach St. at Cliff St Dakota Ave. at Soquel 2 6. Laurel at Washington 2 7. Ocean St. at Plymouth 2 8. San Lorenzo Blvd. at Riverside Ave Water at Ocean 2 47 intersections tied for 10 th place with one pedestrian collision each 2
10 V. Collision/Crash Trends To establish collision trends, injury collisions for the 10-year period from were analyzed. This is enough time to adjust for changes in population, economic variations, and transportation mode shifts. The decline in collisions from was likely due to the economic recession, which resulted in higher unemployment and fewer car trips nationwide. Statewide collision data has followed a similar trend, with collisions decreasing significantly from , and rising steadily from Therefore, the rise in collisions between 2012 and 2014 should be viewed as a sign of increased overall trips resulting from economic recovery. 350 Injury Collisions Of these total crashes, a very small percentage cause fatalities. The chart below is included to show both the random nature of fatal collisions and the importance of the Traffic Division of the Police Department and the Traffic Engineering Section of Public Works. Enforcement and engineering are the primary tools in the work required to eliminate fatal crashes. If one looks at 10 years of data comparing fatal crashes versus homicides, a trend does not appear. The number of incidents for any particular year is small, and so variations can appear to be significant. 1. Brekke, Dan. With Rising Numbers of Highway Deaths, California Bucks a National Trend. KQED News. Nov
11 Fatal Crashes vs. Homicides Fatal Crashes Homicides Source: SCPD + SWITRS Crash Date and Time Data Looking at all 2017 crashes by month, day of the week, and time of day does not reveal many surprises. Crashes are higher in the summer when traffic volumes are higher. Crashes are also highest during the peak commute time, 3:00pm-6:00pm. Unlike the past few years, when collisions peaked on Fridays and Saturdays, the midweek period had the highest rate of collisions in Crashes by Month Source: Crossroads 4
12 2017 Collisions by Time of Day Source: Crossroads 2017 Crashes by Day of the Week Monday Tuesday Wednesday Thursday Friday Saturday Sunday Source: Crossroads Motorcycle Crashes Motorcycle crashes are consistently high for our jurisdiction. In 2015, the most recent year available, the Office of Traffic Safety ranked Santa Cruz #18 out of 105 cities of similar size for motorcycle crashes. The number of collisions involving motorcycles rose by 30% from 2016 to Comparing motorcyclist injury crashes to total injury crashes for the 10 year period, the trend line is consistent for motorcyclist crashes while overall crashes show a slight upward trend. 5
13 Motorcycle Collisions Total Motorcycle Linear (Total) Linear (Motorcycle) Bike and Pedestrian Crashes Santa Cruz has a high bike and pedestrian mode split, and a correspondingly high number of crashes involving people biking and walking. Over a 10-year period, the trend for bicyclist crashes is increasing as bicycle mode split increases, and cyclists continue to be disproportionately involved in injury collisions. However, in 2017 we saw the continuation of a promising downward trend in the number of bicycle collisions. Pedestrian injury crashes increased in 2017, in conjunction with a rising pedestrian mode-split. Bike Collisions Total Bicycle Linear (Total) Linear (Bicycle)
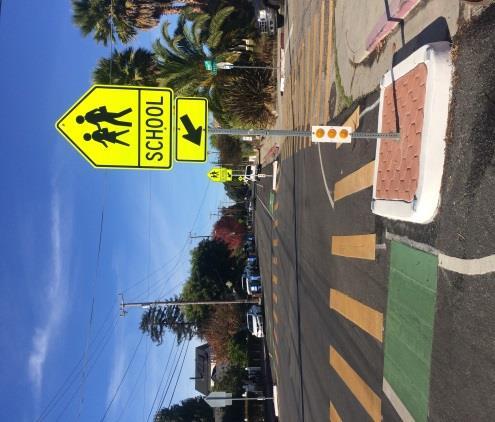
14 Pedestrian Collisions Total Pedestrian Linear (Total) Linear (Pedestrian) Safe Route to Schools Data The safety of youth biking and walking to school is a frequent concern in our community. Analysis of injury crashes involving school-aged pedestrians and bicyclists for the 10-year period, focusing on trips to and from school, provides insight into the data behind the perception of safety. The following graphs represent collisions that occurred on weekdays from September through June, between 6:00am and 6:00pm, and involving young people aged Between 2008 and 2017, the majority of injury crashes (72%) involved bicyclists rather than pedestrians, and high school-aged youth had the highest rate of injury collisions, averaging 4 crashes annually. Elementary school students were involved in crashes at the lowest rate, averaging less than one injury collision per year for the entire city. There were no collisions involving elementary-aged youth in The largest percentage of youth injury collisions occurred between 3pm-6pm, when young people are sharing the roads with commute traffic. 41% of crashes occurred on five streets, with Soquel Avenue accounting for 16% (11 crashes) of all crashes in this group. There was no change to the list of high collision streets between 2016 and Bay Street was the 2 nd highest crash location, with 5 crashes in the ten year period. 7
15 Collisions 12 Safe Routes to School Collisions by Age Group Age Age Age The number of injury collisions involving youth going to or from school remained the same between 2016 and Of the seven crashes involving cyclists and pedestrians aged 5-17, five involved cyclists and two involved pedestrians. Four of the collisions were the fault of a driver, and three were the fault of the pedestrian or cyclist. Of collisions where drivers were at fault, one was caused by a driver who made a left turn and struck two pedestrians in the crosswalk. Another collision occurred when a driver made a left turn through a gap in traffic and struck a youth cyclist traveling in the bike lane. The third collision was caused by a driver making a three point turn who backed into the bike lane in front of a cyclist. Lastly, one collision occurred when a driver slowly pulled into the crosswalk into the path of several pedestrians. Of collisions where youth were at fault, one was a solo crash where a cyclist traveling at high speed down High Street lost control. Another collision was caused by a cyclist making a left turn from the bike lane into the path of a Metro bus. The final collision occurred when a cyclist rode through a crosswalk into the path of an oncoming car. Awareness is a key factor in all of these collisions. Reminding drivers to check for cyclists and pedestrians before all turns, and encouraging youth to check for cars before making turning movements or entering crosswalks, is an important complement to enforcement and engineering activities. The City of Santa Cruz Street Smarts campaign is aimed at increasing this awareness, and reminding all road users to follow the rules of the road. 8
16 This data represents a more complete picture of the relative risk of biking or walking to school in Santa Cruz, and may suggest that additional bike and pedestrian safety education for older students is warranted. Youth Bike/Ped Crashes by Mode Pedestrian Bicycle Youth Crashes by Time of Day am-9am 9am-12pm 12pm-3pm 3pm-6pm 9
17 Top 5 Crash Streets # Average SOQUEL AVE 11 >1/year BAY ST 5 <1/year KING ST 4 <1/year LAUREL ST 4 <1/year SEABRIGHT AVE 4 <1/year VI. Key Collision Factors Finally, collision data was analyzed by primary collision factor, as well as for trends in hit and run and alcohol-involved crashes. After an increase in , the number of hit and run crashes remained the same from Alcohol-involved crashes have seen an upward trend since 2015, with a 21% increase from Improper Turning was the #1 cause of collisions, followed by Unsafe Speed and Other Improper Driving. 31 Felony Hit and Run Crashes
18 Alcohol Involved Crashes Collisions by Primary Collision Factor Wrong Side of Road 1% Following Too Closely 1% Other than Driver (or Pedestrian) 3% Traffic Signals and Signs Pedestrian Violation 5% 2% Driving or Bicycling Under the Influence of Alcohol or Drug 3% Other Improper Driving Unsafe 10% Starting or Backing 9% Improper Turning 19% Automobile Right of way 9% Unknown 25% Unsafe speed 13% Source: Crossroads 11
19 Primary Collision Factor Definitions Unsafe speed: Driving at a speed greater than is reasonable or prudent, or without due regard for weather, visibility, traffic, etc. Automobile Right of way: Failure to yield right of way to other roadway users. Improper Turning: Making an unsafe turning movement, or failure to signal. Driving or Bicycling Under the Influence of Alcohol or Drug: Operating a vehicle while under the influence. Pedestrian Violation: Pedestrian failure to yield right of way to other vehicles while outside of a legal crosswalk. Other than Driver (or Pedestrian): Collision caused by outside factor. Pedestrian Right of Way: Driver failing to yield right of way to a pedestrian at a legal crosswalk. Following Too Closely: Following another vehicle more closely than is reasonable and prudent. Wrong Side of Road: Driving a vehicle on the wrong side of the road or against traffic. 12
BICYCLE SAFETY OBSERVATION STUDY 2014
 County of Santa Cruz Health Services Agency BICYCLE SAFETY OBSERVATION STUDY BACKGROUND AND PURPOSE The County of Santa Cruz Health Services Agency (HSA) in conjunction with the Community Safety Coalition
AGENDA: November IO, 1998 REPORT BACK ON BICYCLE SAFETY PROGRAMS
 COUNTY OF SANTA CRUZ HEALTH SEWiCES AGENCY ADMINISTRATION HEALTH SERVICES AGENCY P.O. BOX 962, 1080 EMELINE AVENUE SANTA CRUZ, CA 95061 (408) 454-4066 FAX: (408) 454-4770 TDD: (408) 454-4123 October 21,
Appendix E: Bike Crash Analysis ( )
") Appendix E: Bike Crash Analysis (2009-2012) Davis Bicycle Crashes Analysis 2009-2012 December 2013 Ride Walk Davis Active Transportation Program City of Davis December 2013 Prepared by: Jimmy Fong Active
Appendix E: Bike Crash Analysis (2009-2012) Davis Bicycle Crashes Analysis 2009-2012 December 2013 Ride Walk Davis Active Transportation Program City of Davis December 2013 Prepared by: Jimmy Fong Active
City of San Diego Vision Zero Draft Strategic Plan FY 2017
 City of San Diego Vision Zero Draft Strategic Plan FY 2017 Engineering Objective: To develop and implement a strategy that employs best planning, design and engineering practices. Background: Over the
8. Collisions INTRODUCTION
 8. Collisions INTRODUCTION While traffic collisions can affect anyone, they have a disproportionate impact on bicyclists, who along with pedestrians are the most vulnerable users of the transportation
City of Coronado Bicycle Map, Schools, Traffic Signals and Crossing Guard Locations
 City of Coronado Bicycle Map, Schools, Traffic Signals and Crossing Guard Locations Early Childhood Development Center Crossing Guard - AM Crossing Guard - PM Coronado Middle Village Elementary Coronado
Safer Cycling: How the City of Vancouver is Proactively Improving Cycling Safety
 Safer Cycling: How the City of Vancouver is Proactively Improving Cycling Safety Brian Patterson, MCIP, RPP Urban Systems 2015 Canadian Association of Road Safety Professionals (CARSP) Conference Session
MEMORANDUM. City Constituents. Leilani Schwarcz, Vision Zero Surveillance Epidemiologist, SFDPH
 MEMORANDUM TO: FROM: CC: City Constituents Leilani Schwarcz, Vision Zero Surveillance Epidemiologist, SFDPH Megan Wier, Co-Chair, San Francisco Vision Zero Task Force, SFDPH Commander Ann Mannix, Traffic
COLLISION STATISTICS May Engineering Services Box 5008, th Avenue Red Deer, AB T4N 3T4
 COLLISION STATISTICS 2016 2016 Red Deer Annual Motor Vehicle Collision Report May 2017 Engineering Services Box 5008, 4914 48th Avenue Red Deer, AB T4N 3T4 engineering@reddeer.ca RCMP GRC Red Deer City
Traffic Safety Plan Traffic Safety Plan 2015
 Traffic Safety Plan 2015 Purpose Airdrie s last Traffic Safety Plan was created in 2011. The 2015 Traffic Safety Plan is a revised model of the traffic operations for the City of Airdrie. The purpose of
Vision Zero Task Force February 28, Collision Landscape Analysis
 Vision Zero Task Force February 28, 2017 Collision Landscape Analysis Welcome! What happened since our last Task Force meeting: City Council adopted the Vision Zero Resolution Applied for an OTS grant
FEDERAL HIGHWAY ADMINISTRATION APPLICATION
 FEDERAL HIGHWAY ADMINISTRATION APPLICATION REQUEST FOR PERMISSION TO EXPERIMENT WITH A BICYCLE BOX INTERSECTION TREATMENT Submitted by: City of Columbus Department of Public Service Date: June 26, 2009
San Francisco 2009 Collisions Report April 21, 2011
 San Francisco 29 Collisions Report April 21, 211 City and County of San Francisco San Francisco Municipal Transportation Agency 1 South Van Ness Avenue, 7 th Floor San Francisco CA 9413 CONTENTS About
Vision Zero Traffic Fatalities: 2017 End of Year Report
 Vision Zero Traffic Fatalities: End of Year Report April, updated July Produced by the San Francisco Department of Public Health, in collaboration with the San Francisco Municipal Transportation Agency
Pedestrian & Bicycle Safety Innovations & Applications
 Pedestrian & Bicycle Safety Innovations & Applications County Engineers Association of Maryland Spring, 2017 Conference May 25, 2017 George Branyan Pedestrian Program Coordinator District Department of
Bicycle Network. Vision Zero San Francisco The City and County of San
 PROJECT BACKGROUND Project Needs 1. 17th between Church and Sanchez is identified as a location where there is a disproportionate number of crashes involving people riding bikes. 2. There is currently
Designing for Pedestrian Safety in Washington, DC
 Designing for Pedestrian Safety in Washington, DC February 25, 2014 George Branyan Pedestrian Program Coordinator District Department of Transportation DC Journey to work mode split: 2012 Means of Transportation
MTCF. Michigan Traffic Crash Facts FACT SHEETS
 FACT SHEETS This page left intentionally blank GENERAL FACTS The driver, the roadway, and the motor vehicle contribute in some measure to every crash. A preponderance of evidence, however, points to driver
SPEED MANAGEMENT FOR VISION ZERO
 SPEED MANAGEMENT FOR VISION ZERO LUANN HAMILTON, DEPUTY COMMISSIONER FOR PROJECT DEVELOPMENT CHICAGO DEPARTMENT OF TRANSPORTATION NACTO DESIGNING CITIES 2017 Vision Zero Action Plan Speed management and
road safety issues 2001 road toll for Gisborne district July 2002 Road user casualties Estimated social cost of crashes*
 GISBORNE DISTRICT road safety issues July 22 The Land Transport Safety Authority (LTSA) has prepared this Road Safety Issues Report. It is based on reported crash data and trends for the 1997 21 period.
Effective Pedestrian & Bicycle Safety Enforcement
 Effective Pedestrian & Bicycle Safety Enforcement October 20, 2011 George Branyan Pedestrian Program Coordinator District Department of Transportation Increasingly multi-modal region Change in Daily Trip
MTCF. Michigan Traffic Crash Facts FACT SHEETS
 FACT SHEETS This page left intentionally blank GENERAL FACTS The driver, the roadway, and the motor vehicle contribute in some measure to every crash. A preponderance of evidence, however, points to driver
Pedestrian Safety Action Plan Bicycle Safety Action Plan
 Pedestrian Safety Action Plan Bicycle Safety Action Plan January 24, 2017 VISION: Safe travel for all MISSION STATEMENT: Partner with the community to plan and fund transportation projects and programs
APPENDIX C. Systems Performance Report C-1
 APPENDIX C Systems Performance Report C-1 System Performance Report & Requirements According to the FAST Act, a long range transportation plan needs to include a system performance report and subsequent
Northbound San Jose Avenue & I-280 Off-Ramp Road Diet Pilot Project
 Project Overview Fed by a two-lane Interstate-280 (I-280) off-ramp, high vehicular volumes and speeds are longstanding issues along San Jose Avenue. Residents in the surrounding neighborhoods have expressed
MEET IN THE STREET MOVING TO ZERO
 WE MEET IN THE STREET MOVING TO ZERO Tips for sharing the street Traffic deaths are preventable. We need your help getting the message out. 2 A NEW PLAN A NEW PLAN Philadelphia is proud to adopt Vision
2012 Petaluma Traffic Safety Report Collisions Rise for 2 nd Year in a Row
 NEWS RELEASE For Immediate Release/Broadcast Thursday, March 7, 2013 2012 Petaluma Traffic Safety Report Collisions Rise for 2 nd Year in a Row The 2012 annual review of traffic safety in Petaluma has
PEDESTRIAN ACTION PLAN
 ATTACHMENT 2 CITY OF SANTA MONICA PEDESTRIAN ACTION PLAN CITY OF SANTA MONICA PEDESTRIAN ACTION PLAN This page intentionally left blank EXECUTIVE SUMMARY CHAPTER 1 EXECUTIVE SUMMARY Setting the Stage
The 2002 Pedestrian Safety Awareness Campaign
 The 2002 Pedestrian Safety Awareness Campaign From the Metropolitan Washington Council of Governments ABOUT THIS REPORT This report describes the 2002 Street Smart Campaign of the Metropolitan Washington
Lincoln Avenue Road Diet Trial
 Lincoln Avenue Road Diet Trial Data Collection Report June 1, 2015 Department of Transportation Table of Contents I. Introduction...... 3 II. Data Collection Methodology & Results...... 5 A. Traffic Volume
DRAFT MOVING FORWARD RHODE ISLAND BICYCLE MOBILITY PLAN 2018 PREPARED FOR PREPARED BY IN ASSOCIATION WITH
 RHODE ISLAND MOVING FORWARD BICYCLE MOBILITY PLAN 2018 PREPARED FOR PREPARED BY IN ASSOCIATION WITH T AF CHAPTER 1 D R INTRODUCTION CHAPTER 3 ARTICULATES VISION Bicycling is safe, fun and practical in
Pinellas County Metropolitan Planning Organization (MPO) 2014 Crash Data Report
 2014 Crash Data Report") Pinellas County Metropolitan Planning Organization (MPO) 2014 Crash Data Report MPO Board July 8, 2015 2 Crash Data Collection Motorcycle drove between stopped cars, ran a red light and collided with a
Pinellas County Metropolitan Planning Organization (MPO) 2014 Crash Data Report MPO Board July 8, 2015 2 Crash Data Collection Motorcycle drove between stopped cars, ran a red light and collided with a
CITY AND COUNTY OF SAN FRANCISCO BOARD OF SUPERVISORS. Policy Analysis Report
 CITY AND COUNTY OF SAN FRANCISCO BOARD OF SUPERVISORS BUDGET AND LEGISLATIVE ANALYST 1390 Market Street, Suite 1150, San Francisco, CA 94102 (415) 552-9292 FAX (415) 252-0461 Policy Analysis Report To:
CHAPTER 9: SAFETY 9.1 TRAFFIC SAFETY INTERSECTION COLLISIONS
 CHAPTER 9: SAFETY 9.1 TRAFFIC SAFETY Creating a transportation network that is not only efficient but also safe is a key objective of the General Plan and the WBCMP. To assess the current safety conditions
Pedestrian injuries in San Francisco: distribution, causes, and solutions
 Pedestrian injuries in San Francisco: distribution, causes, and solutions Presentation to the San Francisco Health Commission RAJIV BHATIA, MD, MPH DIRECTOR OF OCCUPATIONAL AND ENVIRONMENTAL HEALTH, SAN
Safety and Active Transport. Dr. Maureen Carew, Medical Officer of Health Renfrew County and District Health Unit May 30, 2014
 Safety and Active Transport Dr. Maureen Carew, Medical Officer of Health Renfrew County and District Health Unit May 30, 2014 Active Transport Vision Increase levels of walking and cycling Reduce vehicle
Beaverton Police Department Traffic Safety Team
 Traffic Safety Team November 1, 2010 Executive Summary The Beaverton Police Department takes pride in the distinction as being one of the safest cities in the northwest. Being a safe city is more than
COMMUNITY PEDESTRAIN SAFETY TRAINING. Long Beach June 5 th, 2010
 COMMUNITY PEDESTRAIN SAFETY TRAINING Long Beach June 5 th, 2010 Long Beach The City of Long Beach is located in Los Angeles County, Southern California. Long Beach is currently home to 462,604 persons
TRANSPORTATION TRAINING TOPICS. April 6, 2010
 TRANSPORTATION TRAINING TOPICS April 6, 2010 Roles of Transportation Providers Context and Policy Makers Division of Transportation and Traffic Other City Operations Other Transportation Operators CMA
SUMMARY OF TRANSPORTATION INVESTMENTS
 Santa Cruz County 2016 Measure D: Transportation Improvement Expenditure Plan - Approved by over 2/3 of Santa Cruz County voters on November 8, 2016 - Overview Measure D, the 2016 Transportation Improvement
Vision Zero San Jose. Moving toward zero traffic deaths and providing safe streets for all
 Vision Zero San Jose Moving toward zero traffic deaths and providing safe streets for all SPUR San Jose April 4, 2017 Source: Vision Zero Network Vision Zero Core Principles 1. Traffic deaths are preventable
Deaths/injuries in motor vehicle crashes per million hours spent travelling, July 2007 June 2011 (All ages) Mode of travel
 Mode of travel") Cyclists CRASH STATISTICS FOR THE YEAR ENDED 31 DECEMBER 211 Prepared by the Ministry of Transport CRASH FACTSHEET 212 Cyclists have a number of risk factors that do not affect car drivers. The main risk
Cyclists CRASH STATISTICS FOR THE YEAR ENDED 31 DECEMBER 211 Prepared by the Ministry of Transport CRASH FACTSHEET 212 Cyclists have a number of risk factors that do not affect car drivers. The main risk
CHAPTER 3: Vision Statement and Goals
 Davidson Walks & Rolls: Active Transportation Master Plan CHAPTER 3 Contents: Overview Vision Statement Measurable Goals Public Outreach CHAPTER 3: Vision Statement and Goals Overview The vision statement
POLICY AGENDA For Elder Pedestrian Safety
 POLICY AGENDA For Elder Pedestrian Safety Older adults and people with disabilities often have mobility, cognitive, and sensory limitations that affect their behavior as pedestrians and place them at risk
Creating a Successful Pedestrian Safety Campaign. St. Paul, MN
 Creating a Successful Pedestrian Safety Campaign St. Paul, MN - 2015-2017 The Problem The Problem A pedestrian or bicyclist is struck by a vehicle every other day in St. Paul (.84 per day) This doesn t
Community Advisory Committee
 Community Advisory Committee Meeting #1 November 19, 2014 Presentation Team Matt Fulda, Greater Bridgeport Regional Council Chris Granatini, P.E., Tighe & Bond Craig Yannes, P.E., PE PTOE, Tighe & Bond
Project Goal and Description. Why Broadway? Broadway SFMTA.COM/BROADWAY. The goal of the Broadway Safety Improvement
 PROJECT OVERVIEW Project Goal and Description The goal of the Broadway Safety Improvement d St Van Ness Ave Project is to improve safety and comfort for all who Franklin St Hyde St Octavia St Gough St
Caltrans Sloat Boulevard Pedestrian Safety Project Response to Community Questions, Comments & Concerns
 Caltrans Sloat Boulevard Pedestrian Safety Project Response to Community Questions, Comments & Concerns Revised: May 10, 2016 The California Department of Transportation (Caltrans) is planning various
PEDESTRIAN COLLISIONS IN LOS ANGELES 1994 through 2000
 PEDESTRIAN COLLISIONS IN LOS ANGELES 1994 through 2000 City of Los Angeles Department of Transportation Gloria Jeff, General Manager March, 2006 This document printed with grant funds from the California
Lessons Learned from Cycle Tracks (Class IV Bikeways) Design Practice
 Design Practice") Lessons Learned from Cycle Tracks (Class IV Bikeways) Design Practice By: Min Zhou, P.E., Principal/Vice President KOA Corporation 1 What is a Cycle Track (Class IV) TYPICAL BIKEWAY CLASSIFICATION CLASS
Lessons Learned from Cycle Tracks (Class IV Bikeways) Design Practice By: Min Zhou, P.E., Principal/Vice President KOA Corporation 1 What is a Cycle Track (Class IV) TYPICAL BIKEWAY CLASSIFICATION CLASS
Walking & Bicycling Questionnaire for Candidates
 Walking & Bicycling Questionnaire for Candidates This Walking & Biking Questionnaire for State Candidates was developed by Hawaii Bicycling League, Kauai Path, Maui Bicycling League, and PATH - Peoples
TRANSPORTATION & MOBILITY
 TRANSPORTATION & MOBILITY ROADWAY SYSTEM There are approximately 40 miles of roadways in Manitou Springs. For planning purposes, roadways are typically assigned a functional classification which defines
Development of Arlington County s Marked Crosswalk Guidelines. Jon Lawler, P.E. Design Engineer Arlington County, VA
 Development of Arlington County s Marked Crosswalk Guidelines Jon Lawler, P.E. Design Engineer Arlington County, VA April 13, 2015 Transportation System Users Residents Estimated 215,000 in 2014 Lowest
Road Safety Audit Course Participant Guidebook. August 22 & 23, Cleveland Avenue Columbus, Ohio
 Road Safety Audit Course Participant Guidebook August 22 & 23, 2017 Cleveland Avenue Columbus, Ohio 1 2 Table of Contents Executive Summary... 5 Cleveland Avenue City of Columbus... 6 Road Location Details...
Pedestrian Safety Campaign
 Pedestrian Safety Campaign 2017-18 Traffic Safety Plan PART OF THE DRIVE FOCUS LIVE TRAFFIC SAFETY PLAN Table of Contents Background. 1 Pedestrian Collision Stats.... 2-3 Goals.. 4 Objectives.. 5 Implementation
VISION ZERO: ELIMINATING TRAFFIC DEATHS BY 2024 MARCH 2015
 Through Vision Zero SF we commit to working together to prioritize street safety and eliminate traffic deaths in San Francisco by 2024 VISION ZERO: ELIMINATING TRAFFIC DEATHS BY 2024 MARCH 2015 VISION
For Information Only. Pedestrian Collisions (2011 to 2015) Resolution. Presented: Monday, Apr 18, Report Date Tuesday, Apr 05, 2016
 Resolution. Presented: Monday, Apr 18, Report Date Tuesday, Apr 05, 2016") Presented To: Operations Committee For Information Only Pedestrian Collisions (0 to 0) Presented: Monday, Apr 8, 06 Report Date Tuesday, Apr 0, 06 Type: Correspondence for Information Only Resolution For
Presented To: Operations Committee For Information Only Pedestrian Collisions (0 to 0) Presented: Monday, Apr 8, 06 Report Date Tuesday, Apr 0, 06 Type: Correspondence for Information Only Resolution For
Key objectives of the survey were to gain a better understanding of:
 3 COMMUNITY INPUT Community input is an essential part of corridor studies. For the SR 87 corridor study, VTA staff conducted an extensive online survey of people living and commuting along the corridor.
MEMORANDUM. Charlotte Fleetwood, Transportation Planner
 MEMORANDUM Date: Updated August 22, 2017 To: Organization: Charlotte Fleetwood, Transportation Planner Boston Transportation Department From: Jason DeGray, P.E., PTOE, Regional Director of Engineering
Bicycle Master Plan Goals, Strategies, and Policies
 Bicycle Master Plan Goals, Strategies, and Policies Mobilizing 5 This chapter outlines the overarching goals, action statements, and action items Long Beach will take in order to achieve its vision of
City of Novi Non-Motorized Master Plan 2011 Executive Summary
 City of Novi Non-Motorized Master Plan 2011 Executive Summary Prepared by: February 28, 2011 Why Plan? Encouraging healthy, active lifestyles through pathway and sidewalk connectivity has been a focus
Data Analysis February to March Identified safety needs from reported collisions and existing travel patterns.
 Welcome! Thank you for participating in today s Valencia Bikeway Improvements workshop. Data Analysis February to March Identified safety needs from reported collisions and existing travel patterns. Initial
THE OFFICIAL GUIDE TO CYCLING SAFELY IN PHILADELPHIA
 B IKE NICE THE OFFICIAL GUIDE TO CYCLING SAFELY IN PHILADELPHIA A partnership of the City of Philadelphia and the Bicycle Coalition of Greater Philadelphia ABOUT VISION ZERO & BIKE NICE It s a great day
Bay to Bay Boulevard Complete Streets Project
 Bay to Bay Boulevard Complete Streets Project Dale Mabry Highway to Bayshore Boulevard February 08, 2018 Photo Source: Tampa Bay Times Alessandra Da Pra Meeting Format Introduction Resurfacing Information
City of Seattle Edward B. Murray, Mayor
 City of Seattle Edward B. Murray, Mayor Department of Transportation Scott Kubly, Director Eastlake Community Council 117 E Louisa St. #1 Seattle, WA 98102-3278 January 28, 2016 RE: Roosevelt to Downtown
Kentucky s Surface Transportation System
 Kentucky s Surface Transportation System ROAD AND BRIDGE CONDITIONS, TRAFFIC SAFETY, TRAVEL TRENDS, AND NEEDS MARCH 2018 PREPARED BY WWW.TRIPNET.ORG Founded in 1971, TRIP of Washington, DC, is a nonprofit
25th Avenue Road Diet Project A One Year Evaluation. Transportation Fund for Clean Air Project #05R07
 25th Avenue Road Diet Project A One Year Evaluation Transportation Fund for Clean Air Project #05R07 Submitted by: The San Francisco Municipal Transportation Agency Dan Provence May 22, 2009 EXECUTIVE
Pedestrian-Bicycle Emphasis Area Breakout Session. Highway Safety Summit April 26, 2016
 5/20/2016 Pedestrian-Bicycle Emphasis Area Breakout Session Highway Safety Summit April 26, 2016 Fatality and Serious Injury Averages (2008-2013) by Emphasis Area Where We ve Been: February 2014 Highway
Why Zone In on Speed Reduction?
 Learn it. Do it. Live it! SPEED REDUCTION IN THE ZONE Why Zone In on Speed Reduction? Speeding is a serious issue that plays a major role in the risk of serious injury and pedestrian fatality in a crash.
Vision Zero Traffic Fatalities: 2017 End of Year Report
 Vision Zero Traffic Fatalities: 07 End of Year Report April 0 Produced by the San Francisco Department of Public Health, in collaboration with the San Francisco Municipal Transportation Agency and the
Pedestrian Safety HANDBOOK
 City & County of San Francisco Department of Public Health Community Health Programs International Institute of San Francisco Immigration & Citizenship Program Find out more about our injury data, community-based
Safety Emphasis Areas & Safety Project Development Florida Department of Transportation District Seven Tampa Bay
 Safety Emphasis Areas & Safety Project Development Florida Department of Transportation District Seven Tampa Bay Stephen L. Benson, AICP, CNU-A FDOT District Seven Safety Office Presentation Overview Safety
Alberta. Traffic Collision Statistics. Office of Traffic Safety Transportation Services Division May 2017
 Traffic Collision Statistics Office of Traffic Safety Transportation Services Division May 217 This page was intentionally left blank. 2 Table of Contents Traffic Collisions... 4 Traffic Collision Rates...
2015 Victorian Road Trauma. Analysis of Fatalities and Serious Injuries. Updated 5 May Page 1 of 28. Commercial in Confidence
 2015 Victorian Road Trauma Analysis of Fatalities and Serious Injuries Updated 5 May 2016 Page 1 of 28 Commercial in Confidence VICROADS_n3445896_2015_Victorian_Trauma_Report_- _updated_may_2016.docx 2015
Citizen Advocacy. VISION ZERO IN HILLSBOROUGH COUNTY TODAY
 Citizen Advocacy http://www.tampabay.com/news/publicsafety/accidents/car-bus-crash-kills-one/441282 VISION ZERO IN HILLSBOROUGH COUNTY TODAY Does Vision Zero Make Sense Here? Traffic Deaths per 100,000
FHWA Resources for Pedestrian and Bicycle Professionals
 FHWA Resources for Pedestrian and Bicycle Professionals Charlie Zegeer, UNC Highway Safety Research Center/PBIC Libby Thomas, UNC Highway Safety Research Center Dan Nabors, Vanasse Hangen Brustlin (VHB)
VISIONZEROPHL.COM #VISIONZEROPHL
 What is Vision Zero? What is Vision Zero? A policy that states clearly that traffic deaths are preventable and unacceptable. CORE PRINCIPLES: Human life takes priority over mobility; Human error is inevitable
City of San Francisco 2009 Pedestrian Count Report. April 2010
 April 2010 TABLE OF CONTENTS Introduction... 3 Background... 3 Methodology:... 4 Results... 4 Recommendations... 6 Conclusion... 7 APPENDIX A: CENSUS DATA... 8 APPENDIX B: COUNT LOCATIONS... 8 APPENDIX
Public Opinion, Traffic Performance, the Environment, and Safety After Construction of Double-Lane Roundabouts
 Public Opinion, Traffic Performance, the Environment, and Safety After Construction of Double-Lane Roundabouts TRB 93 rd Annual Meeting Washington, D.C. January 15, 2014 Wen Hu, Ph.D. Intersection crashes
MEMORANDUM. Earl Haugen and UND Transportation and Traffic Coordination Committee
 SRF No. 7766 MEMORANDUM TO: FROM: Earl Haugen and UND Transportation and Traffic Coordination Committee Rick Lane, P.E. DATE: November 26, 2013 SUBJECT: UNIVERSITY AVE REVIEW Our review of the University
FLORIDA STRATEGIC HIGHWAY SAFETY PLAN
 FLORIDA STRATEGIC HIGHWAY SAFETY PLAN 1 FLORIDA STRATEGIC HIGHWAY SAFETY PLAN Presenter: Joe Santos State Safety Engineer FDOT State Safety Office 2 Presentation 3/28/2017 3 FLORIDA STRATEGIC HIGHWAY SAFETY
Welcome! San Jose Avenue Open House August 25, 2015
 Welcome! San Jose Avenue Open House August 25, 2015 Vision Zero The City and County of San Francisco adopted Vision Zero San Francisco Vision Zero High Injury Network as a policy in 2014, committing an
LAGUNA BEACH POLICE DEPARTMENT MEMORANDUM
 LAGUNA BEACH POLICE DEPARTMENT MEMORANDUM TO: FROM: Christa Johnson, Assistant City Manager Jason C. Kravetz, Captain DATE: January 16, 2015 SUBJECT: Laguna Canyon Road Collision Analysis Within the last
Safety & Convenience for All Users, in All Modes. Barbara McCann NCSL December 3, 2013
 Safety & Convenience for All Users, in All Modes Barbara McCann NCSL December 3, 2013 Safety & Convenience for All Users? Who was left out when this road was planned? Takaaki Iwabu for Raleigh News Observer
TABLE OF CONTENTS. Executive Summary
 Executive Summary Background... ES-1 Pedestrian Network... ES-2 Bikeway Network... ES-2 Collision History... ES-2 Public Input... ES-4 Conclusions and Recommendations... ES-4 1. Introduction and Setting
TASK FORCE UPDATE MARCH 29, 2016
 Through Vision Zero SF we commit to working together to prioritize street safety and eliminate traffic deaths in San Francisco by 2024 MARCH 29, 2016 1 WHY WE RE HERE We never planned on losing our son.
92% COMMUTING IN THE METRO. Congested Roadways Mode Share. Roadway Congestion & Mode Share
 COMMUTING IN THE METRO Roadway Congestion & Mode Share The majority of major roadways in Greater Des Moines are without congestion and have underutilized capacity. This surplus capacity could be used for
North Shore Transportation Improvement Strategy
 North Shore Transportation Improvement Strategy Preliminary, Near-term Recommendation 2016 April Transportation Improvement Strategy (TIS) Comprehensive and Analytical A multi-modal transportation strategy
Board-Approved Funding Awards for Cycle 4 Active Transportation Grant Program Projects (in Order of Project Rankings) Approved on
 Approved on") CAPITAL Large Category Projects Board-Approved Funding Awards for Cycle 4 Active Transportation Grant Program Projects (in Order of Project Rankings) Approved on 07-27-18 1 La Mesa University Ave Pedestrian
CAPITAL Large Category Projects Board-Approved Funding Awards for Cycle 4 Active Transportation Grant Program Projects (in Order of Project Rankings) Approved on 07-27-18 1 La Mesa University Ave Pedestrian
CITY OF LOS ANGELES INTER-DEPARTMENTAL MEMORANDUM
 CITY OF LOS ANGELES INTER-DEPARTMENTAL MEMORANDUM Date: April 1, 219 To: Honorable City Council c/o City Clerk, Room 395, City Hall Attention: Honorable Mike Bonin, Chair, Transportation Committee From:
Better Market Street Project Update. Urban Forestry Council September 17, 2014
 Better Market Street Project Update Urban Forestry Council September 17, 2014 Project Area Limits Better Market Street Schedule Market Street City s busiest transit corridor Over 85 buses per hour 14 surface
UPDATES, SUCCESSES, AND WHAT S AHEAD ON THE ROAD TO ZERO
 Vol. 1, Issue 1 I Spring 2018 www.planhillsborough.org/vision-zero S A F E S T R E E T S N O W H I L L S B O R O U G H UPDATES, SUCCESSES, AND WHAT S AHEAD ON THE ROAD TO ZERO TRACKING PROGRESS This is
SAFETY GUIDE FOR SCHOOL CHILDREN & PARENTS. toronto.ca/visionzeroto #VisionZeroTO
 SAFETY GUIDE FOR SCHOOL CHILDREN & PARENTS toronto.ca/visionzeroto #VisionZeroTO VISION ZERO ROAD SAFETY PLAN Toronto s Vision Zero Road Safety Plan is a five-year strategy for eliminating traffic-related
In 2014, the number of traffic fatalities in the United States reached its lowest level at. Bicycle Collisions. Effective in Reducing
 CASE STUDY Pierre Aden/shutterstock.com Countermeasures Prove Effective in Reducing Bicycle Collisions By Nazir Lalani, P.E. and Kristopher Gunterson In 2014, the number of traffic fatalities in the United
Public Information Centre
 WELCOME Public Information Centre Father Tobin Road Lougheed Middle School - Library Wednesday November 7, 2012 7:00 p.m.to 9:00 p.m. Please sign in Neighbourhood Traffic Calming Guide Background The City
Vulnerable Road Users Safety: What Cities Can Do To Make Things Better?
 Vulnerable Road Users Safety: What Cities Can Do To Make Things Better? Transportation Research Board Webinar September 27, 2016 Robert Hull, Cambridge Systematics, Inc. The Issue Today NHTSA 2015 estimates:
Welcome and Introductions Overview of the Study to Date Community Involvement Intersection Improvement Concepts Bike-Ped Recommendations ITS
 Welcome and Introductions Overview of the Study to Date Community Involvement Intersection Improvement Concepts Bike-Ped Recommendations ITS Recommendations Transit Recommendations Next Steps Inventoried
Traffic Collision Statistics Report
 Traffic Collision Statistics Report 2016 Prepared by Tahir Hameed, M.Eng, P.Eng, PTOE Traffic Safety Engineer Debbie Rawson, M.Sc. Transportation Integration and Safety Advisor Transportation Planning
CITY OF COCOA BEACH 2025 COMPREHENSIVE PLAN. Section VIII Mobility Element Goals, Objectives, and Policies
 CITY OF COCOA BEACH 2025 COMPREHENSIVE PLAN Section VIII Mobility Element Goals, Objectives, and Policies Adopted August 6, 2015 by Ordinance No. 1591 VIII MOBILITY ELEMENT Table of Contents Page Number
2014 QUICK FACTS ILLINOIS CRASH INFORMATION. Illinois Emergency Medical Services for Children February 2016 Edition
 2014 QUICK FACTS ILLINOIS CRASH INFORMATION February 2016 Edition Illinois Emergency Medical Services for Children www.luhs.org/emsc Illinois Emergency Medical Services for Children TABLE OF CONTENTS