Colorado s Transit, Biking & Walking Needs Over The Next 25 Years
|
|
|
- Angelina Lydia Walsh
- 6 years ago
- Views:
Transcription


1 August 2016 Colorado s Transit, Biking & Walking Needs Over The Next 25 Years How Much Colorado Needs To Invest & Why It Is The Right Path Forward CC BY-NC 2.0 Chocopups

2 August 2016 Colorado s Transit, Biking & Walking Needs Over The Next 25 Years How Much Colorado Needs To Invest & Why It Is The Right Path Forward Lead Authors Danny Katz, CoPIRG Foundation Will Toor, Southwest Energy Efficiency Project Mike Salisbury, Southwest Energy Efficiency Project Contributing Authors: Jill Locantore, Walk Denver Acknowledgments The authors wish to thank the following people for commenting on earlier drafts of this document: Jill Locantore and Gosia Kung of Walk Denver; Ted Heyd of Bicycle Colorado; Elena Wilken and Ann Rajewski of the Colorado Association of Transit Agencies; Alana Miller of Frontier Group; John Olivieri of U.S. PIRG Education Fund; Karen Moldovan of LiveWell Colorado; Betsy Jacobsen of the Colorado Department of Transportation; Jaclyn Lensen of the Colorado Health Foundation; Tim Mauck, Clear Creek County Commissioner; Terri Blackmore of North Front Range MPO; Chris Pangilinan of TransitCenter ; Scott McCarrey of Boulder County Transportation, Steve Cook of the Denver Regional Council of Governments, Peter Kenney of the Metropolitan Mayors Caucus. Thanks to CoPIRG Foundation intern Morgan Ferris for her contribution to this report. The CoPIRG Foundation and SWEEP gratefully acknowledge the support of the Colorado Health Foundation for this research project. The authors bear responsibility for any factual errors. Policy recommendations are those of CoPIRG Foundation and SWEEP. The views expressed in this report are those of the authors and do not necessarily reflect the views of our funders or those who provided review.

3 Contents Executive Summary 5 Transit, Biking and Walking Investments Needed Over the Next 25 Years 6 Additional Transit Investments That Should Be Considered 10 Additional Transit Investments That Could Be Considered 10 Policy Recommendations 11 The Benefits of Transit, Biking & Walking to Colorado s Transportation System 12 Increasing Affordability and Accessibility 12 Tackling Obesity and Living A Healthier Life 15 Increasing Access to Healthy Food and Necessary Services 16 Reducing Air Pollution and Tackling Climate Change 16 Increasing Economic Vitality 18 Reducing Crashes, Saving Lives 19 Underinvesting in Colorado s Transit, Walking and Biking System for Years 20 (continued) 2016 CoPIRG Foundation and SWEEP. Some Rights Reserved. This work is licensed under a Creative Commons Attribution Non-Commercial No Derivatives 3.0 Unported License. To view the terms of this license, visit creativecommons.org/licenses/by-nc-nd/3.0. CoPIRG Foundation s mission is to deliver persistent, results-oriented public interest activism that protects consumers, encourages a fair, sustainable economy, and fosters responsive, democratic government. CoPIRG Foundation, a 501 (c)(3) corporation, works to educate the public through the media, generate grassroots support around timely issues, mobilize citizens to vote, build coalitions, foster increased civic awareness and engagement, and provide policy expertise so that we can achieve concrete results that positively impact the lives of Coloradans. For more information about the CoPIRG Foundation or for additional copies of this report, please visit The Southwest Energy Efficiency Project (SWEEP) is a public interest organization promoting greater energy efficiency in Arizona, Colorado, Nevada, New Mexico, Utah, and Wyoming. SWEEP focuses on utility energy efficiency policy and programs, combined heat and power system, buildings and transportation. For more information about SWEEP, please visit Report Design: Cecily Anderson / Anagramist.com

4 Contents (continued) Transit, Walking and Biking: Necessary Tools to Meet the Challenges of a Growing and Changing Colorado A Fast Growing Population 22 Transit, Walking and Biking Needed to Meet Demand 22 Colorado s Not Just Growing; Coloradans Are Changing How They Travel 25 Many Trips Are Short and Easily Replaced with Biking and Walking 27 In Summary: The Benefits of Transit, Walking and Biking A Vision for Colorado s Transit, Walking and Biking Investments 32 The Walking Needs in Colorado 33 The Biking Needs in Colorado 34 The Transit Needs of Colorado 38 Local Transit Service 41 Statewide Transit 52 Current and Future Investments in Colorado Transportation 61 Recommendations 64 Methodology 67 Appendix A Walking Methodology 67 Appendix B - Transit Levels of Investment 69 Appendix C Elasticity of RTD Service 70 Appendix D Cars Displaced on I-70 by Transit 71 Notes 72 1


5 Bicycle Colorado and David Budd Executive Summary Bike path in front Denver s City and County Building. Transit, walking and biking are critical components of a 21st century transportation system in Colorado but have been underfunded for decades. Without significant investments in transit, biking and pedestrian services and infrastructure, Colorado will not be able to meet the demands and challenges of our shifting demographics and growing population, and will miss out on the many benefits transit, walking and biking provide. Colorado needs to increase investments in transit, walking and biking by $1.05 billion dollars per year over the next 25 years to ensure every Coloradan in our towns and cities experiences the multitude of benefits that come from good access to adequate sidewalks, safe bicycle infrastructure including safe shoulders on rural highways, and good transit service within cities as well as a comprehensive statewide, bus-based, intercity transit system. The benefits of this investment are immense. Transit, walking, and biking are critical to increase the safety, accessibility, and affordability of our transportation system and reduce the negative impacts on our health, local economy, environment and quality of life from a mostly single-mode, car-oriented transportation system. Coloradans from all backgrounds and all parts of the state will benefit whether it is a family in Denver who can ride a bus to the ski areas; or an aging resident of Craig who needs to get to a critical medical appointment 100 miles away without a car; or for a child in Greeley to safely walk to school; or for a bicyclist in Longmont to commute to Boulder; or for residents of Aurora to have access to employment opportunities from Louisville to Highlands Ranch riding fast and frequent bus rapid transit. An increased investment in transit, biking and walking can save a Coloradan thousands of dollars each year by providing more affordable options for travel and reducing the need to own a car. Expanded and improved transit service combined with bike 5

6 RTD and walking investments increase the accessibility of employment opportunities, schools, medical services, grocery stores and entertainment for the nearly 10% of Coloradans of driving age who do not have a driver s license and the hundreds of thousands of additional Coloradans who want to get around without car. Traveling as a pedestrian, bicyclist or transit rider provides significant health benefits by reducing air pollution like greenhouse gas emissions and smog forming particulates. These modes of travel also offer a way to combat obesity and improve individual health by providing active transportation options. Transit, walking, and biking can play a big role in shorter trips of 3 miles or less, which make up a majority of the total trips along the Colorado Front Range. Walkability, bikeability and transit-oriented areas provide benefits to local businesses. Better pedestrian, bicycle, and transit services and infrastructure are critical tools for eliminating transportation-related crashes and fatalities. With 2.4 million more people pouring into Colorado in the next 25 years, transit, biking and walking are important transportation options to combat congestion. Finally, we need to increase investments in transit, walking and biking because that is what Coloradans say they want in polls and surveys, whether it is the swelling Millennial population or the aging Baby Boomers who are found not just in urban areas but in rural communities across the state. This will require a partnership between local, state and federal government and the private sector to both reallocate existing funds and generate new money for multimodal transportation needs. Transit, Biking and Walking Investments Needed Over the Next 25 Years An additional $1.05 billion dollars per year in transit, walking and biking builds a complete sidewalk system in cities and towns across Colorado; brings intracity bike infrastructure up to the standards of the best communities in Colorado and adds regional bicycle connections and safer biking options along rural highway shoulders; and would bring good transit service to the major Colorado population centers, provide fare-free service in the Denver metro area, complete over a dozen local bus rapid transit lines, and build out a comprehensive statewide, intercity transit system including dozens of buses from Denver to ski areas and demand response bus service to meet the growing rural transit needs. The D Line, part of RTD s light-rail system. 36
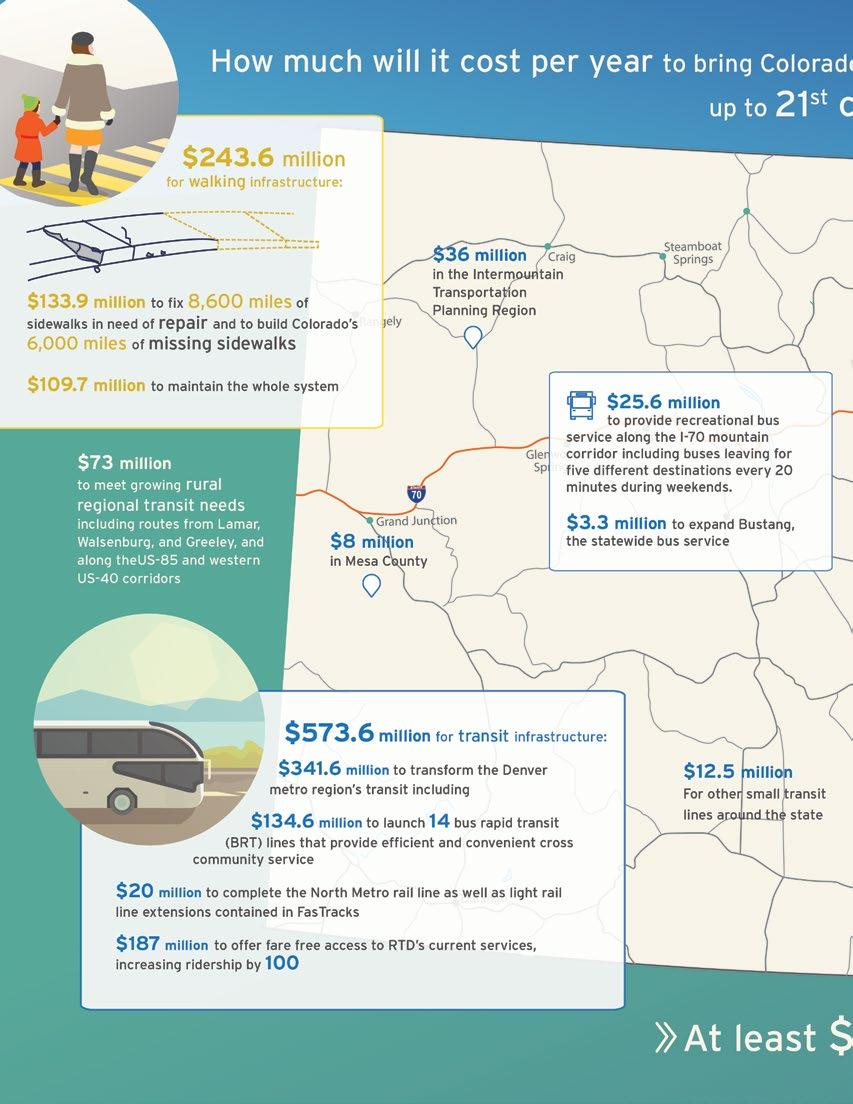
7 $1.05 billion per year: Colorado needs to increase investment in transit, bicycle, and pedestrian investments by $1.05 billion per year in the following ways: $243.6 million per year for walking infrastructure: $133.9 million to build the 6,000 miles of missing sidewalks and to repair 8,600 miles of inadequate sidewalks in Colorado urbanized areas $109.7 million to maintain the entire system $229.5 million per year for bicycle infrastructure: $100.8 million to bring the biking infrastructure in every city up to the standards of the best communities in Colorado $17.4 million to build regional bicycle routes that connect cities and towns across the state $100 million to ensure we have safe shoulders on rural roads to allow safe bike travel $11.3 million to expand bike share programs to increase access to biking options $573.6 million per year for transit, including: $341.6 million for the Denver metro region $134.6 million to launch 14 bus rapid transit (BRT) lines that provide efficient and convenient cross community service along some of the busiest corridors $20 million to complete the North Metro Rail Line as well as the Central and Southwest Rail Extensions $187 million to offer fare-free access to RTD s current services, increasing ridership by 100 million trips. $113.1 million to increase the quality of cityrun transit services outside of the Denver metro area including: $15 million per year in Colorado Springs $29.6 million per year in the North Front Range including: - $12.9 million in Fort Collins - $2.7 million in Berthoud, Greeley-Evans and Loveland - $14 million for regional service $12 million per year in Pueblo $8 million per year in Mesa County $36 million per year in the Intermountain Transportation Planning Region (IMTPR) encompassing Eagle, Garfield, Lake, Pitkin and Summit Counties $12.5 million per year for the rest of the smaller transit providers $3.3 million in annual operating costs and $3 million in one-time capital costs to expand Bustang, the statewide bus service $25.6 million per year to provide recreational bus service along the I-70 mountain corridor including buses leaving for five different destinations every 20 minutes during weekends $17 million per year to provide BRT service in managed lanes between Denver and Fort Collins $43.2 million per year to meet the growing rural regional transit needs including routes from Lamar, from Walsenburg, from Greeley along U.S. 85 and along the U.S. 40 corridor in northwest Colorado $29.8 million per year to meet the growing demand for specialized rural transit service 7
8 8

9 Figure 1 9
10 Additional Transit Investments That Should Be Considered There are more transit investments that Colorado decision makers should consider beyond the basic $573.6 million in investments that Colorado needs. These additional investments would increase transit service even more and therefore offer the opportunity to realize even bigger benefits. Specifically, an additional $219 million per year over the next 25 years could bring transit services in cities across the state to an even higher level of service and complete a commuter rail system along I-25: $59 million per year in additional local transit service investment - $56 million in Colorado Springs - $3 million in Berthoud, Greeley-Evans and Loveland. $1.2 billion ($48 million annually) to build a commuter rail service along I-25 from Denver to Fort Collins. $2.8 billion ($112 million annually) for a commuter rail service between Denver, Colorado Springs and Pueblo 1 Additional Transit Investments That Could Be Considered If funding opportunities presented themselves, there are two other major rail investments that Colorado could consider. They will take significant more capital, will likely need a more long-term approach, and therefore are not included in the recommended $573.6 million annual investment in this report. However, these investments could offer increased benefits to Coloradans and are worth considering. The state could invest an additional $1.978 billion per year over the next 25 years to build a rail line connecting Denver to Longmont via Louisville and Boulder and add high speed rail service along I-25 and I-70. Specifically: $1.3 billion total ($52 million annually) for Northwest rail from Denver to Longmont $1.062 billion annually on high speed rail service along the I-25 corridor 2 $864 million annually on high speed rail service into the mountains connecting Denver (and the I-25 high speed rail service) with Summit County and Eagle County 3 Figure 2. Additional Transit Investments for Consideration $2,500 $2,000 $1,978 Millions $1,500 $1,000 $500 $0 $219 High Speed Rail and NW Rail Line Commuter Rail and Additional Bus Service 10
11 Policy Recommendations To meet the needs of transit, walking and biking in Colorado over the next 25 years, policy-makers should: Ensure that existing state transportation funding is flexible and can be used to address the particular transportation needs of a corridor, rather than being arbitrarily limited to only one mode of transportation. Currently, state law restricts the Colorado Department of Transportation s (CDOT) use of the vast majority of state transportation funding to highway and road projects. In 2013, the legislature removed this restriction from cities and counties through the passage of SB The legislature should give the same flexibility to CDOT. Require that toll revenues be used to support transit service in the same corridor. Increasingly, the state has turned to toll lanes as both a way to finance highway expansion and a way to manage congestion in those lanes, by charging a higher toll during congested periods. In order to make sure that these projects serve all income ranges and support Colorado s multimodal needs, the state should require that a portion of toll revenues be invested in public transit in these corridors. The state and every regional planning partner should conduct the same level of analysis to identify funding gaps for transit, bicycle, and pedestrian infrastructure as they do for roads and highways. The state and the regional planning organizations currently develop detailed projections of funding needs for both maintenance and expansion of highways. These plans don t just show what can be done with existing funding, but identify funding gaps. This level of analysis should be fully extended to transit, bicycle and pedestrian infrastructure. New state funding sources for transportation should be designed to provide Coloradans with options to meet the broad multimodal transportation needs of our residents. While the state is not solely responsible for transportation investment local and federal funding play a big role it is a crucial partner for implementing good public transit, bicycle and pedestrian infrastructure, in addition to highways. In 2016, the two proposals to increase state funding that received the most attention were a proposal to issue $3.5 billion in bonds and another to raise the state sales tax by $670 million per year. Unfortunately, these proposals provided either zero or minimal funding for transit, walking or biking.. Colorado s Metropolitan Planning Organizations (MPOs) should use the funding that comes to them to support the broad range of multimodal needs. MPOs such as the Denver Regional Council of Governments (DRCOG), the Pikes Peak Council of Governments and the North Front Range MPO are the lead agencies for programming how federal transportation funds get invested in their regions. Many of these federal funding streams are flexible dollars that can be used for all modes of transportation. While some MPOs have used this flexibility, others spend the vast majority of flexible funds on roadway projects. MPOs should more robustly fund multimodal investments needed to serve their regions. Cities and counties should adequately fund sidewalks, safe crossings, and local bicycle infrastructure, in addition to partnering with transit agencies to provide adequate transit to their residents. Local funds, typically generated from sales taxes, property taxes and fees on development, are an important source of transportation dollars in Colorado. 11

12 Walk Denver Wheat Ridge pedestrian-activated crossing The Benefits of Transit, Biking & Walking to Colorado s Transportation System Transit, walking, and biking bring immense benefits when prioritized within a transportation system. They can increase affordability and accessibility, improve health opportunities, reduce air pollution, provide economic benefits to communities, reduce transportation-related crashes, injuries and deaths, and increase the overall efficiency of our transportation system. Increasing Affordability and Accessibility Combating High Housing Costs For most households, transportation is the second largest cost after housing. 4 While the percent of household income that is spent on transportation varies depending on where you live, households in auto-dependent communities can spend as much as 25 percent of their household income on transportation versus 9 percent for a household that is close to employment, shopping and other needs and amenities (figure 3). 5 FIGURE 3. Percent of Income Spent on Transportation Based on Type of Place You Live 30% 25% 20% 15% 10% 5% 25% 19% 0% Auto-Dependent Location Average American Family Car-Lite Location 9% Source: Federal Highway Administration Livability Initiative 6 12

13 It is important to note that low-income households can feel an even bigger financial squeeze from high transportation costs because their overall household income is lower, forcing them to forego other basic needs. Therefore reducing transportation costs is a particularly important and necessary public policy strategy for low-income households. Figure 4. Housing and Transportation Costs as a Percent of Income for a Typical Household Source Citizens Budget Commission 12 The main cost driving transportation expenses is owning and operating a vehicle. AAA s annual Your Driving Costs report estimates the annual cost at $8,698 for the average American in The significant cost of owning and operating a vehicle, much less two or three in a household, explains why the Federal Highway Administration reports that a household can cut their total cost of housing and transportation in half by living in a community where they can reduce the number of cars they own by one. 8 Given the incredible savings that a family can realize by managing their transportation costs when options are available, it is possible that a family could actually save money by living in a more expensive home or apartment with access to biking, walking and transit than in a less expensive home or apartment in a car-dependent community because they can reduce or eliminate vehicle expenses. In fact, when taking transportation costs and savings into consideration many cities that are often viewed as unaffordable like New York City and San Francisco, can appear more affordable than sprawling cities like Riverside, CA and Miami, FL due to the additional driving-related expenses. 9 For low-income families, the same conclusions can hold true. When you consider housing and transportation costs together, like the Citizens Budget Commission did in a 2014 report, the top five cities for location affordability for low-income families (defined as making half of the HUD area median) include San Francisco (42%), Washington D.C. (43%), and New York (47%), all cities with high housing costs. 10 The bottom line: Low transportation costs can help cities remain more affordable and help offset higher housing costs. 11 The data is particularly compelling when you reverse the list. The five worst cities in terms of location affordability for low-income families are San Antonio (71%), Riverside (71%), Jacksonville (64%), San Diego (62%), and Phoenix (61%) all car-reliant places with high annual transportation costs, low transit share and very few zero-vehicle households. Eric Jaffe from the Atlantic s CityLab concludes, In the case of San Antonio, the high cost of transportation is enough to make the metro area unaffordable to low-income families even though it s the cheapest in terms of annual rent. 13 Smart Growth America came to a similar conclusion in a George Washington University School of Business report that compares the walkability of America s largest metro areas to a social equity index that they created. 14 The social equity index combined the costs of housing and transportation in the selected metro areas. Cities like New York and San Francisco, with high walkability, also ranked high on the social equity index despite residents having a larger percent of their incomes going to housing costs because the percent of income going to transportation costs was lower than most cities and helped make up the difference. 15 They also found those residents had better access to jobs. Denver ranked 9th for both walk- 13
14 ability and social equity, with slightly lower housing costs than the other top cities but slightly higher transportation costs. 16 Colorado needs to pay particularly close attention to this data because the state s housing prices are not only growing at a fast rate but many of the housing markets in Colorado have experienced price increases locally. According to CoreLogic, home prices in Colorado rose 9.8 percent between February 2014 and February 2015, the fastest rise in the country. 17 A study by Zillow in 2014 found that Denver-area rent has skyrocketed so much that a renter would need to make approximately 4.5 times the minimum wage to afford a median-priced rental. 18 In addition, Housing Colorado, a nonprofit that advocates for affordable housing, estimates that one in four renters in Colorado spend 50 percent or more on housing costs. 19 With housing costs increasing in the state, it is good public policy for Colorado to act to offset these expenses by providing residents with a range of low-cost transportation options that can make going car-free or car-lite easier. In practice, this means providing residents with improved and expanded transit options, increased investment in walking infrastructure, and expanded biking options that allow Coloradans to reduce transportation costs by reducing driving or foregoing car ownership. This is just as true in rural areas as it is in urban areas, since transportation costs can erode any savings a household gains from living in an area with lower housing costs. Increasing Accessibility to Employment High individual transportation costs not only puts a strain on a household s budget, but it can also create substantial barriers to employment. According to the Leadership Conference Education Fund, As jobs move to auto-dependent suburbs, those without access to cars including low-income workers and people with disabilities lose out on employment opportunities. Many workers without access to a car spend hours on multiple buses traveling to remote work places; some are unable to get to these jobs at all. 20 Keeping Transit Affordable While providing some level of transit service is good, transit fares and inadequate or inconvenient service are barriers to accessibility. Typically, higher fares make transit less affordable and fewer people use it. For example, raising transit fares by 10% can lead to a 3% decrease in transit ridership. 21 Moreover, while some people have multiple transportation options and can choose to not use transit if it becomes more expensive, some Coloradans are transit-dependent and will be forced to pay the higher fares or forego making essential trips. Therefore, just because people continue to choose to ride transit after a fare increase does not mean it is affordable they may not have any other adequate option. High transit fares mean more income goes to transportation at the expense of other needs or amenities. To combat this challenge, many communities across Colorado have made the decision to invest in farefree transit, including Summit County, Steamboat Springs and the towns of Nederland, Lyons, and (for local trips) the City of Longmont. Keeping Transit Accessible Unsafe or inaccessible bus stops and the areas that lead from bus stops to final destinations, often referred to as first and final mile, can also be a barrier to transit use. Since every transit user is a pedestrian or bicyclist at some part in their trip, focusing dollars on walking and biking will enhance current and future transit investments. For example, a Health Impact Assessment conducted in southwest Adams County found that over half of the blocks along a 20-block stretch of Federal Boulevard, that includes two new RTD rail stations, lacked sidewalks. 22 Motor vehicle crashes along the corridor are not uncommon and a higher proportion result in injury when compared to the rest of Adams County. 23 Transit Provides Accessibility, Especially in Rural Areas While total ridership on transit in urban areas is higher than in rural areas, transit provides a lifeline for many people in rural parts of Colorado to get to medical appointments, employment, groceries and other needs and is an important tool to service aging populations. Currently the rural population of 14
 is set to grow to 11.")
15 Colorado is set to grow from approximately 900,000 to 1.3 million by 2040, while the percentage of that population over the age of 75 (the age at which people typically require additional transportation options) is set to grow to 11.4% or approximately 160,000 rural Coloradans. 24 This number does not take into account the people under the age of 75 who, because of a disability, income, health, or other restrictions, are unable to drive a personal vehicle the often long distances to get to necessary services. Tackling Obesity and Living A Healthier Life While Colorado may be the healthiest state in the nation that has not stopped our obesity rate from skyrocketing along with the rest of the country. In fact, Colorado is more obese now (21 percent) than the most obese state was in 1995, Mississippi (20 percent in 1995 vs 35 percent in 2015). 25 Active transportation, such as riding a bike, walking or even taking transit, which almost always requires some walking to get to and from the bus stop, can be an impactful way to improve health by replacing excessive travel in vehicles. For example, one study of automobile commuters in Texas, published in the American Journal of Preventive Medicine, found that longer trips to and from work correlated with various indicators of poor health including decreased cardiorespiratory fitness, increased weight, high cholesterol, and elevated blood pressure. 26 It also found that commuters driving more than 15 miles each way were less likely to meet recommendations for moderate to vigorous physical activity and were more likely to be obese. 27 Just providing options can go a long way to increasing health. In Seattle, researchers found that every 5 percent increase in the overall level of walkability A 5% increase in walkability can create a 32% increase in walking & biking Not All Improvements Take Significant New Investments This report focuses on the needs for new investments in our transit, walking and biking infrastructure and services. But some major improvements can be achieved without significant new investments. For example, the lack of real time location information for buses and the need to purchase paper tickets or passes, often at a physical location that is nowhere near where you would board or disembark a bus or train, lead many people to opt-out of riding transit. Infrequent or slow transit service and poorly designed routes can remove transit as a viable travel option too. Technology has provided a number of ways to break down these barriers, creating real-time location mobile apps, paperless ticketing options and mobile-phone based transportation like bikeshare and car-share programs to fill in the first and final mile gaps. Most transit agencies and cities are just scratching the surface in fully realizing the ridership benefits of these tools. More also can be done to reconfigure transit routes and shift services to combat infrequent and inconvenient operations. While some of this requires increased funding, which is addressed in the transit section below, some can be done by better utilizing existing funding. For example, in the 1990s, Boulder County rebranded buses and simplified bus routes with a redesigned bus network, most of which required simply spending existing money in new ways. In less than a decade, transit ridership quadrupled while the population only grew by 13%. 15
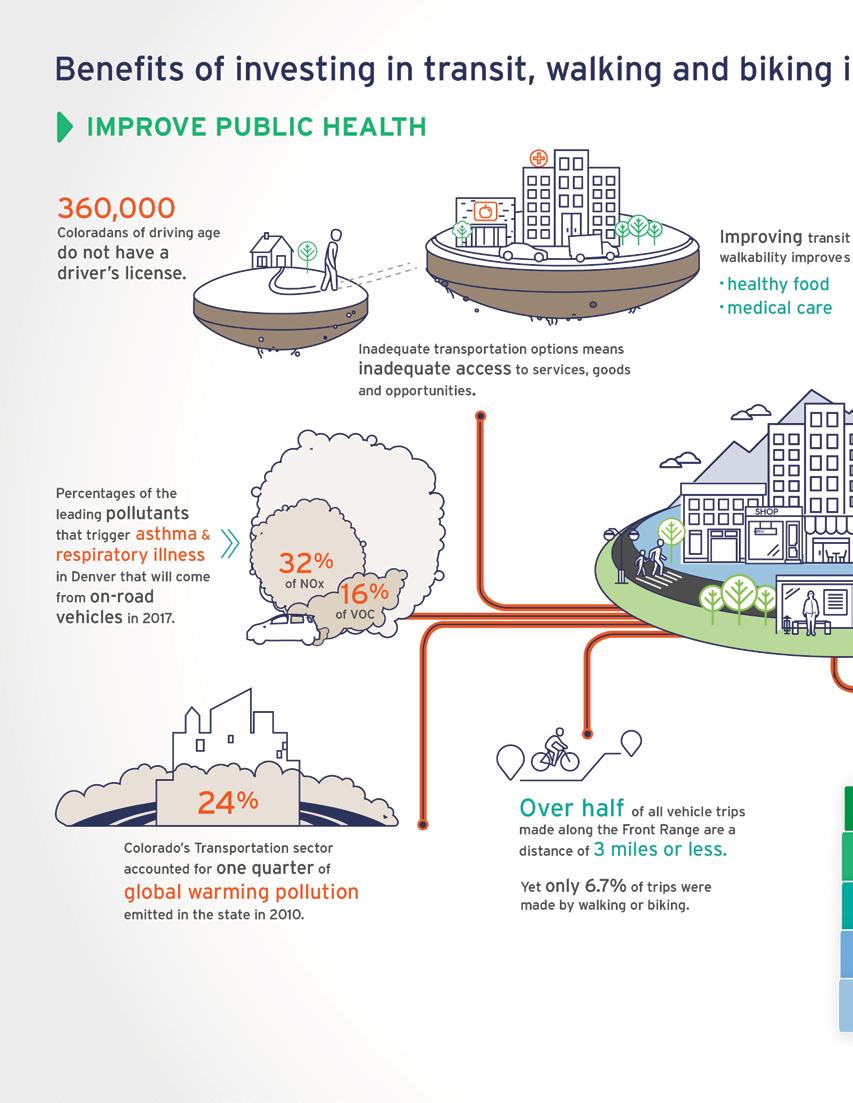
16 was associated with a 32 percent increase in minutes of walking or biking and a reduction in Body Mass Index. 28 Another study in the American Journal of Preventive Medicine suggests that adding active transportation to your day is important even for people who fit in time to exercise after work. 29 An earlier study by researchers at the University of Sydney s School of Public Health supports the thesis that leisure-time exercise alone is often not enough to prevent obesity and the authors recommend using active transportation like biking and walking for trips. 30 Increasing Access to Healthy Food and Services Investing in biking, walking and transit can also break down barriers for people so they can access healthy food and critical medical services, especially for the 115,000 households in Colorado that have no vehicle available. 31 Too often, these Coloradans live in areas where the only store they can walk to is a corner store, which might carry more brands of cigarettes than types of vegetables or fruit. Good transit and biking options increase the distance they can travel and can be the difference between having healthy food options and necessary medical services, or going without. Reducing Air Pollution and Tackling Climate Change Transit, walking and biking provide important tools for reducing air pollution in the transportation sector since car-generated pollutants have negative impacts on our health and our environment. According to a study by the Massachusetts Institute of Technology s Laboratory for Aviation and the Environment, emissions from road transportation cause nearly 53,000 premature deaths a year. 32 In addition, the Colorado Greenhouse Inventory Report found that in 2010 the transportation sector in Colorado accounted for 24% of the state s Figure 5. Greenhouse Gas Emissions by Source in Colorado MMTCO 2e Fossil Fuel Combustion Residental Fossil Fuel Combustion Commerical Fossil Fuel Combustion Industrial Fossil Fuel Combustion Transportation Fossil Fuel Combustion ElectricPower Industrial Processes 16

17 Rick Kimpel Smog in Denver greenhouse emissions, the second-most of any sector, contributing more than all of the greenhouse gases emitted by residential, commercial and industrial fuel use, and only slightly less than the total emissions from all of the coal-fired power plants in the state. 33 Not only do vehicles make a significant contribution to climate change, which can also speed up the requisite chemical reactions that create smog, but they also emit harmful pollutants that can lead to and exacerbate respiratory ailments like asthma and bronchitis, and heighten the risk of life-threatening conditions like cancer. According to the Union of Concerned Scientists, in 2013, transportation contributed more than half of the carbon monoxide and nitrogen oxides, and almost a quarter of the hydrocarbons emitted into our air. 35 One example of a pollutant that harms Coloradans and the environment is ground-level ozone pollution. Ozone, produced when vehicle emissions come in contact with sunlight, contributes to asthma, lung disease, and premature death, and is most dangerous to children, teens and the elderly. 36 Unfortunately, the Denver metro area and the North Front Range are currently out of attainment with the current federal ozone pollution standard of 75 ppb (parts per billion), which is designed to protect public health. The Environmental Protection Agency s scientific advisory committee concluded that the level most protective of human health would be 60 ppb. Therefore, the region should aim to not just meet but exceed the federal standards. The major contributors to ozone pollution are emissions of Nitrogen Oxides (NOx) and Volatile Organic compounds (VOCs). The Regional Air Quality Council in Denver projects that in 2017, 32% of NOx emissions and 16% of VOC emissions will be from on-road vehicles. 37 While federal vehicle standards are making cars cleaner over time and the move towards electric vehicles will further help reduce pollution, transit, walking and biking will need to play a big role. Beyond just reducing overall pollutant totals, transit, walking and biking can have a big impact in reducing pollution that disproportionately impacts specific communities. Citing a Health Effects Institute study, the American Lung Association points out that an estimated 30 to 45 percent of the people in North American cities live or work close enough to hightraffic roadways to experience significantly higher levels of pollution. In addition, poor and disadvantaged communities often bear a disproportionate burden of transportation emissions because many major transportation facilities (major highways, rail yards, freight depots, and ports) are located in and near their neighborhoods
18 Transit and smart land use can save Colorado billions of dollars Increasing Economic Vitality As cities and towns have increasingly embraced the need to become more walkable and bikeable, they have experienced a positive impact on their economic vitality. People for Bikes reports a number of success stories across the country. For example, on Broadway Street in Salt Lake City, they found that businesses realized an increase in retail sales after they replaced parking spots with protected bike lanes. 39 Specifically, the general street upgrade removed 30 percent of the auto parking from nine blocks but improved crosswalks, sidewalks and added protected bike lanes. 40 In the first six months of the next year, retail sales were up 8.8 percent over the first six months of the prior year, compared to a 7 percent increase citywide. 41 In addition, a recent Brookings Institute report found that places with high walkability, on average, generate 80 percent more in retail sales as compared to a place with fair walkability, holding household income levels constant. 42 These success stories lead employers to locate businesses in places that are walkable and bikeable. This in turn changes travel patterns, providing an economic boost to other businesses and residences located not only near large employers but with easy and safe multimodal access that makes the whole area benefit from the overall walkability, bikeability and transit-oriented infrastructure. Beyond the immediate bottom line benefit that employers and businesses are seeing from more walkable, bikeable and transit-oriented communities, multimodal-oriented communities provide greater access to a wide range of destinations to residents whether for employment, shopping areas, schools or medical centers. Combing investments in transit with smart growth strategies that locate jobs and homes near transit lines can make the whole region function better and save billions of dollars in public investment. When DRCOG developed its Metro Vision 2035 Plan, setting forth a 25-year vision for land use and for transportation investments, the region was not content simply to project out current trends. Instead, DRCOG developed alternative scenarios to explore which approaches would produce the most desirable outcomes. This led to a scenario planning effort that combined different land use futures (some were more sprawling, some focused development along transit), and different transportation futures (ranging from focusing most investment on expanding highways to focusing on transit). In each case, the modelers assumed the same total growth in population and in jobs. They ran these scenarios through regional models that predicted traffic levels, water use, air quality impacts, access to employment, and other impacts on the economy and quality of life. The results were striking. The scenario that combined transit with transit-oriented land use performed better on every single metric that DRCOG looked at lower water use, less traffic congestion, better access to jobs, and lower infrastructure spending. This scenario needed $5 billion less in regional spending on infrastructure than the highway-oriented scenario, while having less traffic congestion. 45 For years our planning and building strategies have 18


19 Denver Metro Living Streets Initative Eric Fischer Pedestrian infrastructure in Denver; New York City 49 focused on increasing vehicle travel speeds and increasing the number of people that can drive from point A to point B. But with limited space to expand streets and add parking, especially in urban areas, transit, biking, and walking provide greater access to the jobs, shops, and residents that one can reach, which in turn drives the economic vitality of a community. This benefit is augmented when that access allows households to reduce transportation costs by foregoing owning a car. Recent research for Colorado Springs transit system found that the system reaps annual economic benefits for the region of $5.4 million due to reduced congestion, vehicle operating cost savings, reduced emissions, fewer accidents, additional economic activity and job creation. 43 The Roaring Fork Transportation Authority (serving the corridor along Highway 82 and I-70 between Aspen and Glenwood Springs) contributed $63.4 million in annual benefits from transit corresponding to vehicle operating cost savings, reduced congestion, avoided parking lot costs and the provision of access to jobs for people without access to their own car. 44 Reducing Crashes, Saving Lives Investments to improve transit, walking and biking options will be a good tool for reducing traffic crashes and saving lives. In 2014, 32,675 people died from motor vehicle crashes in the United States, with 488 deaths in Colorado. 46 Of the 488 deaths, 63 pedestrians and 10 bicyclists died in vehicle crashes. 47 With Colorado s population set to grow by 2.4 million in the next 25 years, it is imperative that we improve the safety of our transportation system to save lives. Education of drivers, bicyclists and pedestrians; continued development of safety features in vehicles; and enforcement of current traffic laws will all play a large role in reducing fatalities. Over time, the movement towards autonomous vehicles will likely help too. But this is not enough. Colorado needs to change street designs and implement new infrastructure to reach any vision of zero transportation fatalities in the future. Sweden provides a guide to gauge how increased transit, walking and biking can reduce fatalities. Nicole Gelinas from the Manhattan Institute observed that over the last 15 years Sweden has reduced pedestrian deaths by 31% and overall traffic deaths by 45%. 48 According to Gelinas, one key strategy was to redesign streets so the priority is not on making them faster for cars but safer for pedestrians. Some of this comes from changing speed limits but a lot of the strategy revolves around adding bike lanes, pedestrian plazas and reconfiguring streets. New York City cut fatalities by a third since 2005 by employing a similar strategy. For example, they focused on redesigning intersections that had the most fatalities. 50 A review of studies in the Crash Modification Factors Clearinghouse website found that reducing mean speed by 15% reduced fatal crashes by 44% Number of traffic related deaths in Colorado last year. 19


20 Problematic bus stops in Denver; Broomfield, CO. Walk Denver Aaron Schultz Underinvesting in Colorado s Transit, Walking and Biking System for Years One reason Colorado has so many unmet transit needs is that the state, through the Colorado Department of Transportation, has historically invested very little state money into transit. Colorado also spends very little state transportation revenue on bicycle and pedestrian infrastructure. The major source of state funding for the Colorado Department of Transportation is the state gas tax, which has not increased in over 20 years. Under current state law, this funding is limited to highway expenditures and cannot be used for transit. 52 However, nationwide, there are 20 states in which gas taxes are used to support public transit. 53 The only consistent state source of transit revenue in Colorado is $15 million per year coming from vehicle registration fees that was established as part of the 2009 FASTER state legislation. This is a fixed level of funding, rather than a percentage of the total collected, so each year it declines in buying power due to inflation. Compounding the published values for the consumer price index in the Denver-Boulder area, the buying power of FASTER transit revenues has declined by 13% since the legislation passed in In addition, FASTER authorized the state to use toll revenues from a highway corridor to support all transportation modes in that corridor. To date, the state s High Performance Transportation Enterprise (HPTE), which administers toll lanes, has not spent any toll revenues to support transit. The HPTE has signed a Memo of Understanding (MOU) with local governments along the U.S. 36 corridor committing that transit will be eligible for funding from toll revenues once the revenue hits certain targets, but that date is undetermined. Besides FASTER, there are also temporary sources 20


21 Walk Denver Walk Denver Colorado has 8,600 miles of sidewalk in need of repair, and 6,000 miles of missing sidewalk. of state funds for transit. In 2009, the Legislature passed SB authorizing a transfer of up to $200 million a year of funds from the general fund to CDOT under certain conditions and requires that a minimum of 10% be used for public transit. 55 However, there has only been one year since 2009 that the conditions have been met to allow the transfer and future transfers are uncertain. The maximum amount that this could generate for transit in a single year is $20 million. Compared to other states, the level of state support for public transit in Colorado is one of the worst in the country. In Colorado s Statewide Transit Plan, CDOT used information from the 2012 National Transit Database to compare Colorado s state funding for both capital and operating to the nation as a whole. For the nation as a whole, including states that do not provide any support for transit, states provide 26% of the operating costs for transit, and 12% of the capital costs. In Colorado, in 2012 the state provided no operating funding and 1% of transit capital funding. Since then, investment in each has gone up but remains behind other states. FIGURE State Investments in Transit Across the Country 56 30% 25% 20% 15% 10% Colorado National average 5% 0% State Share of capital funding State share of operating funding 21


22 RTD Richard Masoner New free bus service along 17th and 18th Streets in downtown Denver. Transit, Walking and Biking: Necessary Tools to Meet the Challenges of a Growing and Changing Colorado As one of the fastest growing states in the country, with significant increases in Millennials and a large and aging Baby Boomer population, good transit, walking and biking options will increasingly be necessary to meet our growing transportation demand and to meet the changing travel trends of the overall population. A Fast Growing Population Between April 1, 2010 and July 1, 2015, Colorado s population grew by 8.5 percent, the fourth fastest out of the 50 states and the District of Columbia. During these 63 months, Colorado s population grew from a little over 5 million to just under 5.5 million. 57 In 2015 alone, Colorado gained approximately 101,000 people, a growth rate second only to North Dakota. 58 According to the Colorado State Demography Office, Colorado s population is projected to grow to 7.9 million, or an additional 2.4 million people, in the next 25 years. 59 Transit, Walking and Biking Needed to Meet Demand With a net growth of 2.4 million people in Colorado in 25 years, providing robust transit, walking and biking options will be critical. Research demonstrates that building additional highway capacity whether by widening existing roads or building new thoroughfares does not solve congestion, but rather creates more traffic, in which more drivers spend more time behind the wheel. 60 A 2016 report by the CoPIRG Foundation and Frontier Group highlighted numerous examples of highway widening projects around 22

23 FIGURE 7 Congestion Levels on I-25 in South Denver Source: Southwest Energy Efficiency Project the country that failed to address congestion including the Katy Highway in Texas, which was expanded to 26 lanes the world s widest highway in 2012 but by 2014, 85 percent of commutes along that highway took longer than they had in In Colorado, congestion along I-25 through south Denver reached pre-construction congestion levels within five years of completing the widening project know as T-REX. The chart above shows the volume/capacity ratio, a common measure of congestion, on this section of I-25. The state spent $1.2 billion on this road widening, with no long-term benefit in lowered congestion. Congestion is already a problem for intercity trips during peak periods and the congestion on interstates like I-70 and I-25 are expected to get even worse with the projected population expansion. The mountain corridors already suffer capacity failure several weekends each year. Since many of the 23,000 miles of highways in Colorado are in mountain corridors, the cost of expanding the footprint of these roads is significant. For example, one CDOT study estimates it would cost approximately $5 billion to add additional lanes along I-70 from Golden to Vail. 62 Given that traditional highway widening projects are hugely expensive, especially in tight urban and mountain corridors and can result in less efficient flow of traffic, Colorado should not try to build its way out of congestion by simply widening highways. Statewide investments in transit, biking and walking will help provide the options to keep Coloradans moving. The Colorado Department of Transportation (CDOT) has begun to recognize the value and benefits that transit, walking and biking provides to our transportation system in Colorado. While CDOT still spends the vast majority of its funding on highways, it has re-written its mission to include choice, mobility, travel management, and biking and walking, as illustrated in figure 8 from a 2014 CDOT presentation. 52% of Coloradans say that want to live in a place where they seldom need to use a car. 23


24 FIGURE 8 Colorado Department of Transportation s Mission: Old versus New Source: CDOT Similarly, many cities in Colorado, from Denver s urban core to the mountain towns, are also running out of space to widen streets to accommodate more and more cars. Local decision makers increasingly recognize that making communities more convenient and safe to walk, bike or take transit is the more efficient and cost effective way to accommodate increased growth both for residences and businesses. The Cycling Promotion Fund captures the concept of space related to different modes of travel in this photograph: The Space Related to Different Modes of Travel Source: 24

25 Colorado s Not Just Growing; Coloradans Are Changing How They Travel Source: AARP Public Policy Institute In addition to growing, Colorado s demographics are changing greatly and in ways that require an increased role for transit, walking and biking. For example, the state s total senior population is expected to see a significant increase. In 2000, there were approximately 400,000 Coloradans over the age of 65. By 2040, that number will be 1.5 million. 63 As Baby Boomers age, they shift their travel patterns. While they fueled the Driving Boom of the late 20th century, now Baby Boomers are showing an increased preference for riding transit, walking, and biking. In 2014, the AARP Public Policy Institute surveyed 4,500 Americans over the age of 50 about their community needs. The top two requests in that survey were a bus stop within 1 mile or less of their house (50 percent) and a grocery store within 1 mile of their house (47 percent). In addition, the survey found that they ranked making streets more walkable and adding transportation for older adults and those with disabilities in their top five ways to improve their community (along with parks, schools and police). 64 Figure 9 What Community Amenities Do Older Adults Want Close To Home? 360,000 or 9.2% of Coloradans of driving age do not have a driver s license Millennials are also flooding into the state. According to the State Demography Office, between 2000 and 2010, the age group that increased the most in Colorado was 10 to 35 year olds. 65 Here in Colorado, the number of Coloradans age will swell from 1.4 million in 2010 to 2 million by The rise of the Millennials in Colorado is significant because their behavior demonstrates that they will use our transportation system in vastly different ways than it was used in the 20th century when previous generations were their age. The well-documented shift by Millennials away from driving their own cars as the primary mode of transportation is more than temporary. 67 Surveys of Millennials consistently demonstrate a preference to drive less and use modes like transit, walking and biking more to get from point A to point B. 68 The trend extends beyond Millennials. A 2014 Urban Land Institute report found 52% of Coloradans say that want to live in a place where they seldom need to use a car. 69 A year later, the Urban Land Institute reported over half of Colorado residents call walkable neighborhoods, with sidewalks, crosswalks and other pedestrian-friendly features a top or high priority. 70 While travel patterns are shifting, driver licensure rates among both Americans under 19 and those 20 to 24 years old are declining significantly. 71 In total, 360,000 or 9.2% of Coloradans of driving age do not have a license and therefore need options to travel around their community and the state. 72 Since technology-enhanced transportation options are 25
26 Surveys of Millennials consistently demonstrate a preference to drive less and use modes like transit, walking and biking. 1.4 million The number of Coloradans who will be aged by projected to increase in the coming years, we are only seeing the beginning of the impact of ride share, bike share and multimodal phone apps that make it increasingly easier to live a car-free or carlite lifestyle. Another example of the changing transportation desires by Coloradans can be seen in the recent polling done for MPACT 64. MPACT 64 was a broad statewide group convened between 2012 and 2014 to examine transportation funding. The group included the Metropolitan Mayors Caucus, Progressive 15, Action 22 and Club 20, representing a broad cross section of urban and rural Colorado. MPACT 64 recommended that at a minimum transportation funding should increase by $650 million per year, with 33% or $214.5 million allocated for public transit. As part of the MPACT 64 process, a statewide poll was commissioned to better understand what transportation investments Colorado s voters believed were most important. This poll, conducted in January 2014, asked voters to rank how important it is to increase funding for a wide variety of improvements to Colorado s transportation system. As the following chart shows, voters top priorities were Safe Routes to School for children, and a variety of aspects of public transportation, followed by bicycle and pedestrian improvements. Isn t driving returning to the consistent increases seen from ? In January, the Federal Highway Administration released 2014 data that showed per-capita driving increased for the first time in a decade and total VMT increased for the third consecutive year. Therefore, some have theorized that this proves that ten years of reduced driving was a temporary blip and travel patterns will return to the 20th century normal of large annual increases. However, Frontier Group demonstrates that a deep dive into the data tells a different story. 73 Per-capita driving is still well below the peak reached in 2004 (6% lower) and below 1997 levels. 74 In addition, these increases came at a time of rock-bottom gas prices, ultralow interest rates, and looser lending terms for new and used cars. 75 This confluence of factors is unlikely to be permanent and as referenced in this section a number of factors from shifting Millennial preferences to technology are helping increase car-lite lifestyles, thus indicating it is more likely that driving levels will not return to 20th century increases. Over half of Colorado residents call walkable neighborhoods, with sidewalks, crosswalks and other pedestrian-friendly features a top or high priority
27 TABLE 1 Coloradan s Transportation Preferences, January 2014 MPACT 64 Poll Very Somewhat Not very Safe Routes To School programs to make it safe for kids to walk or bike to school Transit for the elderly, people with disabilities, and those unable to drive (asked in metro area) 53% 30% 16% 50% 37% 22% Transit for the elderly and disabled (asked in rural areas) 42% 41% 15% Improved bus service accessing employment, shopping and schools 42% 32% 28% Completing FasTracks (asked in metro area) 40% 35% 24% Bicycle and pedestrian projects such as bike lanes and paths, underpasses, improved sidewalks, safer crosswalks Improved safety on rural roads, including the addition of turn lanes and shoulders (asked in rural areas only) Local transportation projects selected by your county or municipality 36% 36% 22% 32% 45% 22% 29% 49% 20% Interregional transit service (asked in rural areas only) 27% 39% 31% State road projects determined by the Colorado Transportation Commission 22% 50% 28% Many Trips Are Short and Easily Replaced with Biking and Walking FIGURE 10 Distance of Daily Trips in Front Range, Transit, walking, and biking are important tools to meet the challenges of a growing population whose travel patterns are shifting because many trips in Colorado are short and can be easily replaced with good transit, biking and walking. 46% 26% 28% Less than 1 mile 1-3 miles Other In a 2011 study, residents of Colorado s Front Range made a total of 14 million trips every day million were work related and the remaining 10.8 million trips were to school, the grocery store, medical appointments, entertainment, etc. The study found that 26 percent of the trips (3.7 million) were less than one mile in length. Another 28 percent of the trips (4.0 million) were between 1 and 3 miles. 76 Yet only 6.7% of trips were undertaken by walking or biking. 77 Since an average person can walk a mile in about 25 minutes, many of the 3.7 million trips of less than a mile could be made by walking. 79 For bike trips, Bikecitizens.net has an interactive map for measuring the distance someone can bike in 5, 10, 15, and 30 minutes. Accordingly, an individual should be able to bike 3 miles in 15 minutes and therefore many of the 7.7 million trips that are under 3 miles could be made on a bicycle. 80. In Colorado, currently 1.3% of commuters (33,500 out of a total of 2,544,000) ride their bicycles to work 27
 or Boulder (10.5% biking, 9.")

28 Bicycle Colorado and David Budd Bicycle Colorado and 3.0% walk to work (76,300). 81 But communities across Colorado show that these rates can significantly increase. If the state as a whole reached bike and pedestrian commuting levels currently seen in Fort Collins (6.5% biking, 3.5% walking) or Boulder (10.5% biking, 9.6 % walking), whose rates could also improve, this would increase the number of bicycle commuters to 254, ,000 assuming 2015 population numbers. 82 TABLE 2 Bicycle and Pedestrian Commutes Statewide Percent of Bike and Pedestrian Number of Bike and Pedestrian Commuters Current Level 4.3% 110,000 At Fort Collins Level 10.0% 254,000 At Boulder Level 20.2% 514,000 In Summary: The Benefits of Transit, Walking and Biking In summary, investments and improvements in transit, walking and biking in Colorado can have tremendous benefits and will help us meet a number of challenges. These investments will: 1. Increase the affordability of transportation with potentially big implications on the cost of living in a state with steeply increasing housing costs. 2. Increase accessibility for all Coloradans from urban cities to rural communities to reach jobs, school, medical appointments, grocery stores and other needs and amenities. 3. Reduce the impact of pollution from our transportation system on global climate change and local health. 4. Increase opportunities for exercise via active transportation and provide a great tool for tackling our obesity epidemic. 5. Enhance economic opportunities, especially in dense urban areas. 6. Reduce traffic fatalities and improve overall transportation safety. 7. Meet the demands of a growing state and tackle congestion by giving Coloradans options to travel without a car. 8. Provide the options that Coloradans are increasingly demanding and relying on. 9. Provide an efficient option for the approximately half of trips that are 3 miles or less. 28

29 Self-driving Vehicles and the Future of Colorado Big changes are coming to automobile technology. Some automakers are already adding features such as adaptive cruise control and automated lane keeping, and major advances are being made that will likely lead to the market introduction of vehicles that drive themselves within the next few years. However, it will likely take many years for these to achieve deep penetration into the market. For example, Navigant Research projects that it will take until 2035 for self-driving vehicles to reach 75% of new vehicle sales. 83 No one really knows what the impact of self-driving vehicles will be on driving. Some analysts predict, at least in urban areas, that personal vehicle ownership will largely go away and that people will instead access vehicles by using a cellphone app to hail a selfdriving car when they need one, paying by the trip and avoiding all of the costs associated with car ownership. Under this scenario, total driving likely decreases and the need for parking lots is largely eliminated, allowing more housing and jobs within existing towns and cities. Others believe that self-driving cars will make it easier to travel long distances and will accelerate urban sprawl and total driving. It is possible that both of these trends will exist in parallel. One outcome is likely: The rise of self-driving cars are likely to reduce the need to expand highways, even if total vehicle miles travelled increases, because the self-driving vehicles will be able to travel in narrower lanes, travel more closely together, and will likely have fewer crashes and associated congestion. It is also likely that the underlying trends leading to greater demand for walkable and bikeable communities will not be affected by the rise of self-driving cars, so the overall needs identified in this report are unlikely to be changed. There is debate about the implications for public transit. Generally, people believe that high capacity transit like rail, bus rapid transit and regional bus service will be least affected, and in fact may become more attractive due to the use of self-driving vehicles for first and final mile connections to transit lines. The impacts on the use of local bus service are much less clear. In some ways, self-driving cars are like the paratransit services we see today on-call vehicles ready to take you where you need to go. Therefore, it is possible the bus service of today will not look like the bus service of tomorrow. However, because local bus service does not require large capital expenditures, and the lifetime of buses themselves is about a decade, investing in better bus service over the next 25 years does not lock us into old infrastructure we can provide good bus service today, and then modify the service into the future. 29
30 30

31 Figure 11 31


32 Danny Katz Danny Katz Free bus service around town by the Black Hawk and Central City Tramway.; Regional bike path in Eagle County. A Vision for Colorado s Transit, Walking and Biking Investments Given all the benefits to our health, environment, safety, affordability, and accessibility of our transportation system, and the important role they play to meet the growing and changing needs of our state, it is time for Colorado to significantly expand investment in transit, walking and biking. This report finds that Colorado needs to spend an additional $1.05 billion dollars per year on transit, biking and walking over the next 25 years to ensure our transportation system is safe, accessible, affordable, and enhances the quality of life in Colorado. That breaks down to: $243.6 million for walking infrastructure $229.5 million per year for bicycle infrastructure $573.6 million for transit infrastructure with long distance connections provided primarily with bus service. The transit investment could rise to $219 million per year if additional transit and commuter rail is included and to $1.9 billion dollars per year if the transit investment includes high speed rail along the I-25 and I-70 corridors and the completion of a rail line from Denver to Longmont via Louisville and Boulder (FasTrack s Northwest Rail line). These calculations are based on surveys, studies, and estimates that take into account the changing demographics of Colorado. 32
33 The Walking Needs in Colorado Overall Capital Expense: $243.6 million per year $133.9 million to build the 6,000 miles of missing sidewalks and to repair 8,600 miles of inadequate sidewalks in Colorado urbanized areas $109.7 million to maintain the entire system Everyone is a pedestrian at some point. Colorado needs a complete pedestrian network that makes walking safe and easy for pedestrians, people using wheelchairs and strollers. To meet this vision will require everything from specific pedestrian infrastructure like wide and protected sidewalks, streets with crosswalks and pedestrian-friendly intersections, and zoning and community designs like compact, mixed-use development that provides shopping, work and recreation within walking distance of residential areas. Fundamentally, the basic building block of a pedestrian network that meets the needs of Colorado is sidewalks. Unfortunately, the sidewalks in many Colorado communities are inadequate. Some communities have no sidewalks at all; some sidewalks end in the middle of a block; some sidewalks exist but are narrower than a wheelchair or stroller; and some sidewalks are cracked and crumbling, creating a hazard for pedestrians. In all of these instances, our incomplete sidewalk system forces pedestrians onto streets to continue walking to their destination or they stop walking altogether. Since walking is often required to get to and from transit stops, the lack of adequate pedestrian infrastructure can undermine transit usage as well. In addition, some pedestrian infrastructure also serves as bicycle infrastructure, which, if inadequate, either eliminates biking as a transportation option or pits pedestrians and bicyclists against each other on dangerously narrow paths. To understand the walking needs of Colorado over the next 25 years, our analysis focuses primarily on completing the sidewalk system in towns and cities across Colorado including installing new sidewalks to fill gaps and repairing existing sidewalks that are crumbling and/or unusable. While it is also important to redesign communities and roads to be pedestrian friendly, those specific expenses are not in this study because the costs associated with those types of improvements vary widely depending on local circumstances. Therefore, our calculations are conservative to gauge overall pedestrian needs. For detailed methodology, see Appendix A on page 67. To ensure Colorado has a complete sidewalk system, our analysis concludes that we need to: Construct 6,000 new miles of sidewalks to fill in the gaps that exist Repair and replace 8,600 miles of sidewalks that have deteriorated, creating a safety hazard and accessibility challenges. The cost of building the new sidewalks and repairing and replacing the inadequate sidewalks would be approximately $3,348,700,000 or $133.9 million per year. This breaks down as: Construction of concrete sidewalk - $6.09 per square foot = $36.54 for one linear foot of a 6 foot wide sidewalk Construction of curb and gutter - $34.64 per linear foot (assumed to be required in 50 percent of the cases when a new sidewalk is built). We assumed an average sidewalk width of six feet. Five feet is a common minimum standard, and greater widths are recommended to allow two pedestrians to comfortably pass or walk side by side. With this build out and upgrade, there would be 28,400 miles of sidewalk in Colorado. In order to maintain a system of sidewalks this large it would cost approximately - $109,726,000 per year. 84 This is a conservative estimate of pedestrian infrastructure needs because it focuses exclusively on sidewalks and does not include other infrastructure such as enhanced pedestrian crossing treatments, pedestrian signals, and pedestrian bridges. Therefore, it should be assumed that communities will need to 33
34 have additional funds to pay for these kinds of upgrades, the cost of which is often driven by the types of investments already made in the street. For example, a raised pedestrian crossing that increases the safety for pedestrians crossing a fourlane street would cost tens of thousands of dollars. However, if that four-lane street is widened to six or even eight lanes, a pedestrian bridge may become necessary so pedestrians have time to cross the street, but would balloon the investment into the millions of dollars. 85 This is one more way that an imbalanced transportation system can lead to higher costs for all modes of travel. The Biking Needs in Colorado Overall Expense: $229.5 million per year $100.8 million to bring the biking infrastructure in every city up to the standards of the best communities in Colorado $17.4 million to build regional bicycle routes that connect cities and towns across the state $100 million to ensure we have safe shoulders on rural roads to allow safe bike travel $11.3 million to expand bike share programs to increase access to biking options A complete bicycle network not only gives avid bicyclists safe and comfortable routes to get to where they need to go, it needs to give anyone who could use a bicycle a safe and comfortable way to travel. This includes many types of infrastructure such as painted bike lanes, protected bike lanes, wayfinding signage, secure bike parking at destinations, better shoulders on state highways, and bike-friendly intersections. Over half of the daily trips made along the Front Range are three miles or less, making biking a practical way to get around if the infrastructure is there to make biking convenient, safe and pleasant. 86 In addition, Colorado could save money on transportation through zoning and community development decisions that allow residents easy access to shopping, work and recreation, which would allow even more daily needs to be met on bicycle. Unfortunately, bicycle infrastructure across Colorado is often inadequate including: Few protected or off-street bike paths Bike lanes often end unexpectedly and far from key destinations (i.e. transit stops) Intersections create right turn traps and other problems that can lead to vehicle-bicycle crashes Unclear or nonexistent wayfinding signage directing bicyclists to the safest routes The lack of adequate bike infrastructure forces some bicyclists onto crowded roads with vehicles or to seek out alternative paths like alleys, sidewalks and dirt shoulders, which can create conflict with pedestrians and dangerous encounters with cars. Moreover, for many would-be bicyclists, these barriers to entry discourage them from riding a bike all together. The National Association of City Transportation Officials (NACTO) Urban Street Design Guide is a great resource for understanding how streets can be designed to be safer for bicycling. 87 To understand and accommodate the biking needs of Colorado over the next 25 years, we focused primarily on infrastructure that helps people bike between common destinations including home, work, school, shopping, and entertainment. While important for quality of life and economic reasons, we did not focus on infrastructure primarily used for recreational bicycling, such as non-paved trails. Therefore, communities should seek to fund these kinds of upgrades beyond the numbers presented in this report. Current Unfunded Bike Requests Indicate Sizable Need Most communities and regions in Colorado do not have enough money to fund all of the bicycle infrastructure projects they have prioritized. This is demonstrated by reviewing planning documents like Bicycle Master Plans and funding applications submitted to local MPOs or CDOT. Therefore the 34
35 projects that are unfunded by these agencies and planning organizations provide an initial picture of the unmet need in Colorado. While not every project that goes unfunded deserves funding, we know that many deserving projects are not even proposed to the MPOs or CDOT because communities assume that there are limited resources available. Accordingly, these lists are just a starting point and do not represent the full bike needs of a community. In the Denver metro area, the Denver Regional Council of Government s (DRCOG) is the transportation planning organization responsible for allocating federal transportation funds amongst 56 member governments. DRCOG s Transportation Improvement Program (TIP) identifies all the projects receiving federal funding over a six-year period. Local governments and agencies apply for TIP funding for a variety of projects (roadway, transit, bike, pedestrian) and submitted projects are then scored and ranked with the top scoring projects in each category receiving funding. For DRCOG s most recent TIP, there was significantly more demand for bicycle/pedestrian projects than there was funding. For the years 2016 to 2021, there were $36.9 million of bicycle and bicycle/pedestrian projects that received funding, however there was $111 million of additional requests for bicycle and bicycle/pedestrian projects that were not funded. 88 Over the six years of the TIP, this comes to an annual unmet funding need of $18.5 million in the Denver metro area or $5.93 per person. In DRCOG s 2040 Regional Transportation Plan (covering transportation projects from 2016 to 2040), $530 million worth of bike and pedestrian projects have been identified that have funding available. However, the total needs for new bike and pedestrian projects by 2040 is estimated at $1.26 billion, leaving $730 million of unfunded bike and pedestrian needs in the region. This comes to an annual unmet demand of $29.2 million or $7.86 per person. 89 The Mesa County Regional Transportation Plan ( ) identifies approximately $85 million worth of bicycle projects with only $14 million in expected funding, leaving an unmet need of $71 million over the next 25 years. This results in an annual unmet need of $2.8 million or approximately $15.08 per person for that region. The Pikes Peak Area Council of Governments, as part of their Regional Non-Motorized Plan (part of the Moving Forward 2040 Regional Transportation Plan), identified bicycling corridors in their region that should be priorities for future funding. 90 The plan identified 68 corridors and then prioritized eleven of them based on ranking each corridor s mobility, connectivity, livability and deliverability. Planning level cost estimates were then developed, although costs such as right of way were not included, which could substantially increase a project s cost, making these estimates conservative. The average estimated cost to implement projects on all eleven corridors was $70.7 million. Over the 25 years of the plan that results in $2.8 million in needs annually or $4.35 per capita. If the average cost of the eleven prioritized projects ($6.4 million) was applied to all 68 corridors this would result in $435 million in needed funding. This would require the region to invest $26.92 per person per year. Recognizing that investments in bicycling infrastructure to support commuting and other utilitarian (non-recreational) trips may be better focused on more urban areas, we have applied these TABLE 3 - Unmet Need for Bicycling Infrastructure Based on Projects Identified by MPOs 92 Per Capita Annual Unmet Demand DRCOG TIP $5.93 $27.8 million DRCOG RTP $7.86 $36.8 million Mesa County RTP $15.08 $70.7 million PPACG RTP (low) $4.35 $20.4 million PPACG RTP (high) $26.92 $126.3 million Annual Statewide Funding Based on Extrapolating to Urbanized State Population (4,692,654) 35
36 values to the population living in Colorado s urban areas as defined by the 2010 census. 91 This provides an estimate of the statewide demand for bicycling infrastructure might be. While this approach provides an estimation of the funding required to implement existing plans, it does not provide the amount of funding required to bring high quality bicycle infrastructure to every urbanized area in the state because the state lacks a comprehensive bike-needs inventory of every community in Colorado. Therefore, this report estimates the funding needs using the following strategies: 1. An analysis of the per capita money spent on bike infrastructure by some of the top biking communities; 2. An analysis of additional unfunded biking needs. Current Needs Based on Leading Communities Per Capita Spending: $100.8 million/year Looking at unfunded projects at the regional level provides a data point; however it is incomplete. Much of the planning and provision of bicycling infrastructure takes place at a local level. Therefore, in order to better estimate unmet need, we also looked at what the top-ranked bicycle-friendly communities in Colorado spend and extrapolated their investments to the state s urban areas. Many municipalities in Colorado have adopted Bicycle Master Plans and some of those include estimates of how much funding is needed to realize plan implementation. Aurora, Boulder, Denver, Durango, Fort Collins, Greeley and Loveland are examples of Colorado communities that provide details of what bicycling infrastructure they hope to provide and how much this level of infrastructure would cost. Because these plans are for communities of varying size and cover a different range of years, an effort was made to compare apples to apples by calculating the annual bike expenditure per person. For those plans which did not specify a timeline, implementation was assumed over a fifteen-year period. TABLE 4 - Bike Infrastructure Spending Based on Bicycling Master Plans Cost of Bicycle Master Plan (full) Implementation (Millions of $) Aurora $12.6** $2.39 Boulder $13.6 $22.07 Denver $119.0** $11.95 Durango $15.2 $42.67 Fort Collins $40.4* $43.12 Investment Per Year per Capita *Fort Collins and Loveland both provide a low and high estimate of the costs. The average of the two is shown here. ** Implementation assumed over 15 years. Among the larger municipalities in the state, Boulder, Fort Collins, and Durango have made the largest commitments to funding cycling infrastructure and also have the highest level of bicycling in the state. Currently, just over 10 percent of Boulder s workers commute by bicycle, 6.5 percent of Fort Collins commuters are cyclists, and 6.1 percent of Durango commuters bike. 93 Fort Collins and Boulder have also earned the Platinum rating from the League of American Bicyclists. 94 Platinum is the highest possible community rating and only five communities across the US have earned this distinction. In some smaller towns, the percent of commuters on bikes is even higher, reaching as high as 15 percent in Gunnison and 29 percent in Crested Butte. In addition to the percent of commuters who bike, three municipalities were able to provide data on past expenditures for bicycling infrastructure. The City of Durango has spent $3.5 million ($700,000 annually) over the last five years on bicycle infrastructure. That s $39 per resident annually, which is in line with what they have proposed in their bike master plan. Between 2013 and 2016, the City of Longmont spent $13.1 million or approximately $3.28 million per year. With a population of 90,237, Longmont has spent $36 per capita per year on bicycling infrastructure. 36


37 Bicycle Colorado Danny Katz Bike lane in Fort Collins and path in Colorado Springs. The City of Boulder was able to provide data for the previous 11 years. Between 2005 and 2015, Boulder annually spent between $668,000 and $3.9 million on cycling infrastructure in the city, which translates to between $7 and $37 per capita. Taking the average of these 11 years shows an average annual spending per capita of $25, which is in line with their projected spending in the future. Based on these investments by leading Colorado cities, our analysis sets a goal of every Colorado community investing $25 per capita per year in bike infrastructure. That would require $100.8 million in annual funding for all the urbanized areas of the state, which comes to $2.5 billion over the next 25 years. 95 TABLE 5 Investing $25 Per Person in Urbanized Areas in Colorado Annually Total Over 25 Years $100.8 million $2.5 billion To place these numbers in an international perspective, in the Netherlands, where an estimated 30 percent of commuting trips are made by bicycle, approximately $28 per person is spent on cycling infrastructure annually. Additional Areas for Bicycle Funding Regional Connections: $17.4 million per year In addition to creating bicycle networks within local municipalities, Colorado should also focus on connecting communities via regional bike infrastructure. A recent example of regional bike infrastructure is the U.S. 36 Bikeway, which provides an eighteen mile separated bike path facility between Boulder and Westminster, passing through or by Superior, Louisville and Broomfield. 96 This path, which generally parallels the highway, cost $16.6 million or 3.8 percent of the total U.S. 36 project cost of $427 million. In Colorado there are 628 miles of interstate or freeways and expressways that are located in urban areas (as identified by the Federal Highway Administration). 97 When CDOT and the local jurisdictions are considering these roadways for expansion or major reconstruction, the feasibility of adjacent but separated bicycle and multi-use paths should be examined. These paths may not be feasible for all major highways due to right of way constraints and other roads may already have some parallel biking 37
 yields an estimated cost of $434 million or an annual investment of $17.4 million over the next 25 years.")

38 infrastructure Applying the per mile costs of the U.S. 36 Bikeway to 75% of the state and federal roadways in urban areas (471 miles) yields an estimated cost of $434 million or an annual investment of $17.4 million over the next 25 years. Rural Shoulders: $100 million per year In rural parts of the state, the addition or expansion of shoulders along highways is a good way to accommodate bicyclists and improve safety for pedestrians, motorists, and farmers, especially when vehicles travel at higher speeds. In 2012, CDOT estimated that the cost to widen shoulders (along with other safety improvements) on all rural highways would cost $100 million annually, or $2.5 billion over 25 years. 98 Rural parts of the state could also benefit from investment in other types of cycling infrastructure, such as designated bike paths, but we do not have sufficient data to make estimates of what level of investment would be necessary. Bikeshare Expansion: $11.3 million per year While improving roads and multi-use trails is the primary focus of improving cycling infrastructure, another important program that increases the feasibility of using bicycles for more trips is expanding bicycle sharing programs in municipalities throughout the state. As of 2016, Denver, Boulder, Fort Collins and Aspen have bike share programs. A report by the Institute for Transportation and Development Policy estimated that between 10 and 30 bikes per 1,000 residents are necessary for a successful bike sharing program. 100 The capital costs to set up a bike share can range between $4,200 and $5,400 per bike. 101 Taking the midpoint of these ranges (20 bikes per 1,000 people and $4,800 per bike) and applying them to the populations of the largest and most bike-friendly cities in the state not already served by a bike share program would result in startup capital costs of $205 million. 102 Annual operating and maintenance costs of $150 per bike would mean an additional expenditure of $6.3 million. Spreading this cost over 25 years results in annual funding needs of $8.2 million of capital costs and an average operating cost of $3.1 million. 103 The Transit Needs of Colorado Overall Expense: $573.6 million per year Colorado needs to spend $573.6 million annually to bring good transit service to the major Colorado population centers, provide fare-free service in the Denver metro area, complete over a dozen local bus rapid transit lines, and build out a comprehensive statewide intercity transit system including dozens of buses from Denver to the ski areas and demand response bus service to meet the growing rural transit needs. 99 Figure 12 - Annual Bike Funding By Category Denver Bicycle 38
39 Colorado needs to increase investment in transit by $573.6 million per year in the following ways: $341.6 million per year for the Denver metro region s transit: $134.6 million per year to launch 14 bus rapid transit (BRT) lines that provide efficient and convenient cross community service along some of the busiest corridors $20 million per year to complete the North Metro Rail Line as well as the Central and Southwest Rail Extensions $187 million per year to offer farefree access to RTD s current services, increasing ridership by 100 million trips $113.1 million per year to increase the quality of city-run transit services outside of the Denver metro area including: $15 million per year in Colorado Springs $29.6 million per year in the North Front Range including: - $12.9 million in Fort Collins - $2.7 million in Berthoud, Greeley- Evans and Loveland - $14 million for regional service $12 million per year in Pueblo $8 million per year in Mesa County $36 million per year in the Intermountain Transportation Planning Region (IMTPR) encompassing Eagle, Garfield, Lake, Pitkin and Summit Counties $12.5 million per year for the rest of the smaller transit providers. $3.3 million per year in annual operating costs and $3 million in one-time capital costs to expand Bustang, the statewide bus service $25.6 million per year to provide recreational bus service along the I-70 mountain corridor including buses leaving for five different destinations every 20 minutes during weekends $17 million per year to provide BRT service in managed lanes between Denver and Fort Collins $43.2 million per year to meet the growing rural regional transit needs including routes from Lamar, from Walsenburg, from Greeley along U.S. 85 and along the U.S. 40 corridor in northwest Colorado $29.8 million to meet the growing demand for specialized rural transit service. FIGURE 13 Increases in Annual Transit Funding (excluding major rail and high speed rail projects) Denver Metro Other Metro Areas State-wide Bus Service Rural Regional Rural On Demand 39
40 Additional Transit Investments That Should Be Considered There are more transit investments that Colorado decision makers should consider beyond the basic $573.6 million in investments that Colorado needs. These additional investments would increase transit service even more and therefore offer the opportunity to realize even bigger benefits. Specifically, an additional $219 million per year over the next 25 years could bring transit services in cities across the state to an even higher level of service and complete a commuter rail system along I-25: $59 million per year in additional local transit service investment $56 million in Colorado Springs $3 million in Berthoud, Greeley-Evans and Loveland. $1.2 billion ($48 million annually) to build a commuter rail service along I-25 from Denver to Fort Collins. $2.8 billion ($112 million annually) for a commuter rail service between Denver, Colorado Springs and Pueblo. 104 Additional Transit Investments That Could Be Considered If funding opportunities presented themselves, there are two major rail investments that Colorado could consider. They will take significant more capital, will likely need a more long-term approach, and therefore are not included in the recommended $573.6 million annual investment in this report. However, these investments could offer increased benefits to Coloradans and are worth considering. The state could invest an additional $1.978 billion per year over the next 25 years to build a rail line connecting Denver to Longmont via Louisville and Boulder and add high speed rail service along I-25 and I-70. Specifically: $1.3 billion total ($52 million annually) for Northwest rail from Denver to Longmont $1.062 billion annually on high speed rail service along the I-25 corridor $864 million annually on high speed rail service into the mountains connecting Denver (and the I-25 high speed rail service) with Summit County and Eagle County. Figure 14 - Additional Transit Investments for Consideration 40

41 Danny Katz Bus stop in Colorado Springs. Local Transit Service A complete transit system that provides affordable, efficient and accessible service to get between residences and shopping, school, medical services, work, grocery stores, and other needs and amenities, requires a number of key elements. 1. Service that connects people to all the places they need to go 2. Frequent and fast travel times that are competitive with cars 3. Affordable fares, especially for lower and moderate-income travelers 4. Safe stops and stations with safe and pleasant ways for people to walk or bike to the stops 5. Appropriate service for passengers who are either elderly, have physical or cognitive disabilities or both 6. Land use patterns that ensure housing and jobs are accessible along transit lines. Based on these criteria, there are significant parts of the state that do not have adequate transit service. While some communities lack any transit service, a more widespread challenge is service that is too infrequent or slow. The level of investment in local transit service varies among communities across Colorado. The best service tends to be in the central Denver metro area, university towns such as Fort Collins, and in mountain resort areas. Many rural communities struggle to provide trips beyond the basic lifeline and medical services for elderly and those with disabilities. Most communities have a hard time providing first and final mile connections to transit stops and stations too. Bus stops can be unsafe and unpleasant sometimes just a dirt patch right next to a road without even a sidewalk or concrete pad. The use of technology like paperless ticketing or real-time bus information are in their infancy and regional and statewide bus service is in the earliest stages of meeting the needs of communities across the state. Outside of the Denver metro area, rail is still in conceptual stages. According to data from the 2015 State Transit Plan there is wide variation in the annual investment in transit and the ridership across the state
42 Table 6 Statewide Investment and Ridership of Select Colorado Communities Colorado Springs Annual operating cost(millions) Annual boardings Population served Per capita boardings $ ,930, , $31 Fort Collins $8.3 2,306, , $58 Loveland $ ,172 60, $18 Mesa County $3.5 1,028, , $29 Greeley $ ,143 93, $29 Pueblo $4.7 1,134, , $45 RTD (Denver) $416 98,518,888 2,619, $159 Per capita investment Transit Levels of Investment As the chart above shows, there is a strong correlation between levels of investment in a local transit system and the ridership on the system. As described in Appendix B, we group systems based on whether the community makes VERY LOW, LOW, MEDIUM, or HIGH levels of investment in transit service and identify the costs for communities to improve their transit service. Denver Metro Area Local Transit Needs $341.6 per year for the Denver metro region s transit: $134.6 million per year to launch 14 bus rapid transit (BRT) lines that provide efficient and convenient cross community service along some of the busiest corridors $20 million per year to complete the North Metro Rail Line as well as the Central and Southwest Rail Extensions $187 million per year to offer farefree access to RTD s current services, increasing ridership by 100 million trips While the Denver metro area has done more to implement transit than any other part of the state, it still has significant areas that need improvement including completing the regional rail network, adding bus rapid transit into major corridors, expanding bus service, and maximizing ridership. Over the next 25 years, $341.6 million needs to be invested per year in transit to complete three currently unfunded rail lines, launch 14 BRT lines in some of the busiest corridors and increase ridership on the RTD transit system by 100 million trips by offering fare-free access. If additional money was available, an additional $52 million could be invested per year to complete the Northwest Rail Line. FasTracks Completion: $20 million annually total to complete the North Line, Central Extension, and Southeast Extension ($500 million total over 25 years) $72 million annually to complete Northwest Rail Line along with the North Line, Central Extension and Southeast Extension ($1.8 billion total over 25 years) The Regional Transportation District (RTD) began building out a rapid transit system in the late 1990s 42
43 connecting central Denver with the region s suburban communities, starting with the Southwest Light Rail Line, followed by the Southeast Line. In 2004, voters approved FasTracks, which added additional light rail, commuter rail and bus rapid transit lines. While much of the system will be built and operating by 2018, there is not enough revenue to complete it. There are four major elements that RTD currently projects it will not have enough revenue to complete by 2040 the Northwest Rail Line past Westminster; the North Metro Rail Line north of 122nd Ave; and the Central and Southwest Rail Extensions. DRCOG estimates that the funding gap, in 2015 dollars, is $1.6 billion. 106 RTD is currently updating these estimates, and states that the cost is likely between $1.77 billion and $1.88 billion. 107 One of these corridors, the Northwest Rail Line, may be problematic, with right of way owned by a private railway company and relatively low projected ridership. The capital cost for Northwest Rail is approximately $1.3 billion. If Northwest Rail is removed, the deficit for the other lines is approximately $500 million or $20 million per year. 108 Completing FasTracks would also bring annual operating costs. RTD estimates approximately $23 million for Northwest Rail; the operating costs for the extensions will be much lower. Some portion of operating would be covered by fares and it is also likely that the growth in sales tax over time in RTD s FasTracks sales tax of 0.4% would be able to absorb the operating costs, so we only show capital costs in the table below. TABLE 7 Additional Costs of Completing FasTracks Northwest Rail Completion of North Metro Rail Central Rail Extension Southwest Rail Extension Total Total without Northwest Rail $ 1.3 billion $ million $ million $ million $ billion $ million In the overall summation of needs in this report we show Northwest Rail as a possible investment but do not include it in our estimate of the immediate transit needs due to its high cost and low projected ridership. While Northwest Rail was included in the 2004 FasTracks ballot issue, since that time the projected costs have grown substantially and a robust additional study has been completed on the potential for Bus Rapid Transit (BRT) in the Northwest portion of the metro area. The Northwest Area Mobility Study, conducted by the Regional Transportation District and a consortium of local governments, identified a set of BRT improvements that are estimated to cost about four times less than Northwest Rail, while moving more than twice as many people. Thus, we do not include Northwest Rail in the estimated $573.6 million per year of needed statewide transit investments but do include the new BRT costs. Bus Rapid Transit (BRT) in Denver: $134.6 million per yearto launch 14 new lines ($48.6 million in capital and $86 million in operating) Bus Rapid Transit Travel patterns have shifted so that many trips take place suburb to suburb, rather than commute trips from the suburbs to central Denver. Bus rapid transit or BRT can be an effective way to fill any gaps left by the current FasTracks system with high quality transit service, especially in the near future, where in most cases population and employment densities are not projected to be high enough to warrant additional rail build out. In many cases, the urban corridors in the most need could be retrofitted to add BRT at a 43

44 RTD The Flatiron Flyer service along U.S. 36 between Denver and Boulder much lower cost than a streetcar or rail line. BRT combines several elements to give bus riders faster, more frequent, and more comfortable service. The best BRT systems offer many of the characteristics that we typically associate with rail service. BRT service can be provided both on highways linking communities and in the heart of urban areas. The U.S. 36 BRT service between Boulder and Denver, called Flatiron Flyer, which opened in early 2016, and the VelociRFTA service linking Glenwood Springs and Aspen are examples of the former; the MAX BRT in Fort Collins is an example of the latter. The most important element of BRT is a right of way that allows buses to travel faster than general automobile traffic, giving a travel time advantage to transit. This can be achieved in a variety of ways. The best service will come from a dedicated BRT right of way for the length of the corridor. For example, the MAX BRT in Fort Collins operates on an old rail right of way that has been converted into a dedicated bus lane. However, due to space limitations and the potential high cost of expanding urban roadways, it may not always be possible to create new capacity for BRT lanes. Even without using new capacity, it is possible to achieve meaningful travel time savings by incorporating BRT service into existing capacity in the following ways: Operating in High Occupancy Toll (HOT) lanes (U.S. 36 is an example) Operating on the shoulder of highways (often only during peak periods) Operating in a physically separated median Using dedicated right of way for portions of a corridor Using bidirectional lanes that share one lane for both directions Using peak hour only lanes where BRT uses a dedicated lane, but only during peak travel times (this is planned for Colfax Avenue in Denver) Other roadway modifications that BRT service can incorporate to improve travel times over regular traffic include: Transit queue jump lanes that allow buses to bypass congestion at intersections Transit signal priority at signalized intersections Other elements of BRT service, which should not be exclusive to BRT, may include: High service frequencies Pre-paid fares to speed up boarding 44

45 Level boarding platforms and multiple doors to speed up boarding Figure 15: Fourteen New Bus Rapid Transit Routes for the Denver Metro Area Branded service and visible, branded stations Real time bus arrival information First and Final mile connections, such as bike share or car share services at stations. Flatiron Flyer The Denver Region s First Bus Rapid Transit Line The Flatiron Flyer is the only BRT line built to date within the Denver metro area. It operates in a managed lane for the vast majority of the trip. CDOT is contractually obligated to maintain bus speeds in this lane a minimum of 55 mph in most of the corridor so it is considerably faster to take the bus than it is to drive in the general purpose lanes during rush hour. The service is also frequent, with buses once every six minutes on average during the morning and afternoon peak periods. The Flatiron Flyer opened in January 2016, and by the end of March ridership had grown by almost 50 percent compared to the previous bus service, from about 9,400 to 14,400 trips per day. It is currently projected to keep growing to nearly 19,000 trips. A Vision for Bus Rapid Transit in the Denver Metro Region There are a number of corridors that are excellent candidates for BRT lines. The Northwest Area Mobility (NAM) study identified six additional BRT corridors in the NW portion of the Denver metro area, at a cost of approximately $300 million in capital costs. These lines would run on arterial corridors linking the cities of Longmont, Broomfield, Lafayette, Erie and Boulder and are projected to carry nearly 29,000 trips per day. In addition, DRCOG has identified potential corridors for BRT along Alameda, Hampden, Wadsworth, and C-470 and estimates these projects will cost approximately $800 million in capital costs in 2015 dollars. 109 In addition, Denver has conducted an alternatives analysis and selected BRT as the preferred approach for Colfax Avenue/SH 40 through Denver, at a cost of $115 million. This would dedicate one travel lane in each direction to BRT service during the morning and afternoon peak periods. The City of Denver projects that this will shorten transit travel time by 11 minutes, carry over 40,000 people per day, and increase access to 280,000 jobs and 50 schools. Another potential corridor is SH 2 from Denver to Brighton, which the North Area Transportation Evaluation by RTD and local partners concluded is the preferred approach. There are other corridors in the Denver metro area that are also appropriate for BRT. A 2014 analysis by the Southwest Energy Efficiency Project identified 14 potential corridors, many of which we have already mentioned as shown in the map above. 110 RTD and DRCOG will partner to conduct a regional BRT planning-level analysis in 2017, which will identify the highest priority corridors and approximate costs and projected ridership. DRCOG has put a placeholder in the 2040 regional plan, titled next tier rapid transit of $800 million in capital costs in 2015 dollars. For the purposes of this report, we use this as an estimate for 45
46 the cost of the highest priority BRT corridors beyond the NAMS and Colfax corridors. The total capital costs for launching 14 new bus rapid transit lines would be $48.6 million per year. Table 8 Bus Rapid Transit Options in the Denver Metro Area: Total capital costs NAMS BRT corridors (SH 119, SH7, SH 42, US 287, South Boulder Road, 120th Ave) Colfax BRT DRCOG s Next tier BRT $300 million $115 million $800 million Total $1.215 billion over 25 years ($48.6 million per year) The corridors will also have operating expenses. The Colfax alternatives assessment estimates an annual operating cost of $13 million, while the NAMS study estimates annual operating costs of approximately $23 million. 111 No estimate is available on the operating cost associated with the other BRT listed above. If you assume a similar relationship between capital and operating costs for these projects compared to the others, operating costs would be about $50 million per year. Some portion of the operating cost will be covered by fares and some portion of it may be fundable due to the growth of the sales tax base in the existing RTD base funding of 0.6% sales tax. RTD currently projects cash flow availability beginning around However, this will also need to be used for enhancements to the base bus service in the region. Thus, unlike for the FasTracks elements shown above, we assume that incremental revenue is needed for the BRT operating costs. An estimate of the operating costs associated with these BRT lines is $86 million per year. First and Last Mile Investments to Maximize FasTracks and BRT In addition to the costs of the transit lines themselves, so-called first and final mile improvements are important to make sure that there are convenient and safe ways for riders to get to and from the stations. These often involve improvements to make the areas surrounding stations more walkable and bikeable, adding bike-sharing and bicycle storage, and local bus service or shuttles to stations. In the future they may include technology-enabled programs such as autonomous vehicle shuttles. A 2015 study by Walk Denver and Mile High Connects identified pedestrian and bicycle improvements as the highest priority for first and final mile improvements. 112 No comprehensive study has identified the total funding needed for first and final mile improvements. In this report we do not separately identify a cost, but the estimates in the biking and walking sections of this study likely address a portion of first and final mile needs, however money will likely be needed. Fare Free RTD Total cost: $187 million per year ($160 million to replace farebox, $27 million for added service) The estimates in the previous section are based on adopted plans and studies conducted by RTD and DRCOG. In this section, we propose a new approach that is not contained in any adopted plans but would complement the Denver area s transit investments by vastly increasing ridership on existing and new bus and rail lines. One of the factors that affect public transit ridership is the cost of a fare. It is a very different structure than car ownership. When someone owns a car, they have a large fixed cost (the cost of purchasing the vehicle) and insurance costs that are usually unrelated to how much the vehicle is driven. The only variable costs that are visible to the driver are the costs of gas and occasionally tolls or parking. Therefore the perceived cost of the trip is usually lower than the actual cost. By contrast, a transit rider has no fixed costs but has to pay for every trip, which leads to a perception of high costs. Transit riders (especially on local buses) are also, on average, lower-income than the population as a whole, so they are more price sensitive. 113 Thus, transit fares can be a barrier to transit ridership especially if people perceive transit as more expensive. 46
47 In the early 1990s, RTD created an unlimited access transit pass program (EcoPass), where every member of a population, such as employees of a company or business district or students at a university, receives a pass allowing them fare-free access to public transit. Since then, there has been an explosion in its usage. Transit use tends to increase dramatically when unlimited access pass programs are introduced one study found cases where transit ridership tripled after a population was given access to transit passes. 114 The higher ridership associated with these passes can justify higher levels of transit service, which in turn support higher levels of ridership a virtuous cycle instead of a vicious one. For example, when the University of Colorado developed a transit pass program in the early 1990s, the large increase in ridership then convinced RTD to expand service with routes such as the SKIP, which then led to still higher ridership, which justified more service. 115 Twenty years later, CU student ridership is over six times higher than before the pass program was created. Transit pass programs also save individuals money because they are bought in bulk by a group and therefore tend to cost much less per person than an individual transit pass would. Transit pass programs are a cost effective tool to maximize the use of existing transit service. Buses run whether they are filled or not. So while more people with transit passes increases the number of people riding buses, they are often filling empty seats. Therefore, doubling transit ridership by providing fare-free passes does not mean you need to double the amount of buses or routes. Currently, the RTD EcoPass is primarily available to employees of participating businesses or to students at universities that participate in the college pass program. There are a few broader programs the towns of Lyons and Nederland have created community wide pass programs, a few neighborhoods have programs where all neighborhood residents are eligible, and in downtown Boulder parking revenues are used to pay for EcoPasses for everyone who works downtown. But the vast majority of residents in the Denver metro region do not have access to one of these community EcoPass programs. Creating a region-wide transit pass program, allowing everyone fare-free access to RTD s bus and rail system just by showing an ID via an EcoPass for all type program, would approximately double transit ridership. Because work trips are less responsive to fare changes since a person who needs to get to work is more likely to take the bus whatever the fare is, peak demand would not go up as rapidly as total ridership, which would result in much better use of existing transit service by filling empty seats. In addition, fare-free service vastly improves access for low-income residents. The biggest cost of a fare-free system would be the foregone fare revenue. In 2016, RTD s total fare revenue is budgeted at approximately $160 million per year. 118 In addition, there might be costs associated with new service to meet some of the new trips, though as was stated earlier, many of these new riders would fill existing seats with no new service needed. Without a detailed route-by-route analysis of the likely ridership increases during peak and off-peak periods it is difficult to estimate the level of new service that would be required or the associated costs. However, a community EcoPass feasibility study conducted by Charlier and Associates and Nelson Nygaard for the City of Boulder and Boulder County provides an estimate. 119 In their analysis, the conclusion was that for a countywide EcoPass the costs of additional service would be about 17% of the lost revenue. If we apply that same percentage here, the additional annual service costs would be $27 million. Thus, the total annual cost of a region-wide fare-free pass program would be roughly $187 million. RTD currently provides about 100 million trips per year, so we would anticipate around 100 million new trips. Since the total cost is $187 million, the cost per new trip would be only about $1.87 much lower than the cost per new trip from system expansion. Note that adding 100 million trips per year would bring the metro area to approximately 75 trips per capita. 47
48 Small and Medium Size Cities Needed investment: $64.6 million per year brings each community up one level of investment, and assures that every community meets at least the LOW level Higher investment: $123.6 million per year brings every community up to a MEDIUM level of investment Colorado Springs Next tier of planned improvements: $6 million per year Raising from VERY LOW to LOW investment level: $15 million per year Raising from VERY LOW to MEDIUM investment level: $71 million per year Colorado Springs is the second largest metropolitan area in the state and their transit agency, Mountain Metro Transit, operates as a division of the Colorado Springs municipal government. Unfortunately, service levels are constrained by limited funding. Per capita funding for transit in Colorado Springs is 30 percent less than Pueblo, 50 percent less than Fort Collins, and 80 percent less than in the Denver metro area. The major sources of transportation funding are federal funds, sales tax revenues from the Pikes Peak Rural Transportation Authority, and an annual allocation from the city. In their 2040 Transit Plan, Colorado Springs identified a set of peer cities including Madison, Minneapolis/St Paul, Ann Arbor, Grand Rapids, and Spokane. All of the peer cities made larger per capita expenditures on transit, and have substantially higher ridership. For example, Madison spends about six times more ($104 per person each year) on transit, and has per capita ridership that is seven times higher than Colorado Springs. In their 2040 Transit Plan, the city identifies a set of improvements to bus service, with a cost of $13.8 million per year. 120 Approximately half of this could be funded with revenue increases based on anticipated growth of sales tax revenue, fares, and federal funds, leaving an unmet need of $6 million per year. 121 Some of the issues identified in the 2040 plan include the need for higher frequencies of service along core routes, with a goal of daytime service every 15 minutes; improving connectivity among routes; and enhanced service to major medical facilities and the military bases. The plan also identifies a long-term goal for higher capacity service along key corridors such as Academy Boulevard, Nevada Avenue, and Platte Avenue, probably through enhanced bus or bus rapid transit. There are no cost estimates given in the plan for these high capacity transit services. Another approach to identifying the funding needs for transit in Colorado Springs is to look at population and per capita cost numbers to estimate what level of funding would be required to bring Colorado Springs from the current VERY LOW level of investment to a LOW or MEDIUM level of investment. That is, if we look at the per capita expenditures of $150 per year as MEDIUM and $58 per year for LOW, we calculate the additional expenditures that would be required for Colorado Springs to achieve these same levels. Planned unfunded needs: approximately $6 million per year LOW investment level $15 million per year MEDIUM investment level $71 million per year North Front Range, Including the cities of Berthoud, Fort Collins, Greeley and Loveland North Front Range Regional Bus Service: $14 million per year for regional service Raising Fort Collins from LOW to MEDIUM investment level $12.9 million per year Berthoud, Greeley-Evans, Loveland local service: Raise from VERY LOW to LOW investment level = $2.7 million per year Raise from VERY LOW to MEDIUM investment level = $5.7 million per year 48

49 Source: TransFort The cities and counties in the North Front Range have seen not only some of the fastest growth in the state, but in the country. Census data shows that between July 2013 and July 2014, the Fort Collins- Loveland metro area was the 12th fastest growing metro area in the country and Greeley was eighth. 122 However, according to table 6, the North Front Range cities, with the exception of Fort Collins, have the lowest per capita expenditures on public transit, and the lowest levels of ridership of the larger urbanized areas. In addition, there is only one regional bus route, the FLEX bus service that connects Fort Collins to Longmont along U.S. 287 and offers some express service connecting Fort Collins to Boulder. North Front Range Regional Bus Service: $14 million per year for regional service The North Front Range Metropolitan Planning Organization has developed a number of scenarios that look at expanding regional services between the cities within a rather constrained level of potential funding. Regional connections that should be studied are additional service along U.S. 287 and new service connecting Fort Collins, the Greeley/Evans area, Loveland, and Denver. The 2040 plan does set out several scenarios for modestly expanding regional transit, with additional costs up to approximately $14 million per year. This would include bus service between Fort Collins and the Greeley/Evans area, between the Greeley/Evans area and Loveland, and between the Greeley/Evans area and Denver, as well as additional service and investment along the U.S. 287 corridor. This does not include the cost of rail or BRT connecting to Denver. Fort Collins local service: Raising Fort Collins from MEDIUM investment level: $12.9 million per year Fort Collins operates its transit system, TransFort, as a division of the city. They have the highest per capita transit ridership of any urbanized area in Colorado outside of the RTD system. TransFort has developed a strong local system, including the MAX BRT line and a fare-free transit pass system for Colorado State University students. The next phase of service expansion outlined in the Transfort strategic operation plan includes additional transit growth in Fort Collins including longer service hours and limited Sunday transit service, as well as expansion of regional service to Denver, Boulder, Berthoud, and Longmont. This phase assumes the implementation of additional MAX services that extend outside of the Mason Corridor and completes the transition to a full grid network in Fort Collins. 123 Implementing this phase would bring their level of investment up to MEDIUM. The plan identifies a funding gap of $11.25 million for local service and $2.4 million for regional service to meet their vision (these are in 2009 dollars). 124 In order to avoid double counting with the regional needs identified by the North Front Range MPO, we 49
50 only include the local routes in this analysis. Inflating the 2009 dollars to 2015, the annual cost would be $12.9 million. Berthoud, Greeley-Evans, Loveland local service: Raise from a VERY LOW to LOW investment level = $2.7 million per year Raise from a VERY LOW to MEDIUM investment level = $5.7 million per year The transit service for the rest of the urbanized areas of the North Front Range is currently funded at a VERY LOW level. Given the lack of detailed plans available, we use the population and per capita cost estimates to project the level required to bring the investment to LOW or MEDIUM. Since the current per capita ridership in Berthoud is less than one trip per year and in Loveland is just over two trips per year, either of these investment levels (a LOW is projected to generate 20 trips per capita per year, while MEDIUM is projected to generate 40) would represent enormous increases in transit ridership. Pueblo Raise from VERY LOW investment to MEDIUM investment: $12 million per year Their local long-range transportation plan discusses two modest sets of unfunded improvements to their transit system: expanding bus service to additional times and expanding bus service to major activity centers such as the University/Pueblo Mall and Pueblo West and the Airport Industrial Park. 125 The unfunded vision plan includes rail service along I-25. We estimate an investment of $12 million per year would bring transit service up to a MEDIUM investment level, based on multiplying the population of Pueblo by the difference in per capita transit expenditures in Pueblo and in communities reaching this level of investment and ridership. Mesa County Raise from a VERY LOW to a LOW/MEDIUM level of investment= $8 million per year The long-range plan for Mesa County contains an unfunded transit vision with $209 million of need (in 2014 dollars) over a 25 year period, or approximately $8 million per year. 126 This would likely raise Mesa County to a level of investment of LOW/MEDIUM. The plan envisions many elements including increasing service frequency (currently once an hour on most routes) first to 30 minutes then to 15 minutes, improving pedestrian access to bus stops, and adding new service in areas such as Pear Park and F1/2 Road. Intermountain Transportation Planning Region $29 million per year operating including costs to maintain service $7 million per year capital The Intermountain Transportation Planning Region (IMTPR) encompasses Eagle, Garfield, Lake, Pitkin and Summit Counties, containing most of the major ski resorts in Colorado. Driven by the demands of commuting and tourism, the Intermountain TPR boasts some of the state s most well-developed transit systems. Although designated in federal statute as rural, these systems provide levels of service typically seen in urban communities so we include this region in our analysis of urban systems. The largest transit system in the IMTPR is the Roaring Fork Transportation Authority (RFTA) but there are also substantial systems in Eagle County (ECO Transit) and in Summit County (the Summit Stage), as well as several municipal systems. Collectively, they provide 13.5 million trips per year. This region is facing significant funding challenges just to maintain current levels of service. Many costs are higher in the mountains, leading to operating costs that are growing faster than revenues. Currently, the region predicts that annual operating expenses will exceed revenues by $25 million by In order to improve services, the IMTPR projects a need for $86 million in capital expenditures for 50
51 bus stations, park-n-rides and other facilities over a 12-year time horizon, or approximately $7 million per year. They also project a need for approximately $4 million per year in increased bus service linking communities across the region. The IMTPR also projects a need for approximately $20 million in bicycle and pedestrian improvements to support first and final mile connections to transit over the next six years, or about $3 million per year. For the purposes of this report, we do not include the bicycle and pedestrian improvements, assuming that these would be included in the additional bicycle and pedestrian needs identified in those sections of this report. Smaller Transit Systems: $12.5 million per year There are many more transit systems in small communities across the state including Montrose, Telluride, Durango, Cortez, Alamosa, Trinidad, Salida and Steamboat Springs, as well as communities launching new service like Winter Park. Assuming an investment of $150 per capita to move transit to MEDIUM service levels we calculate a cost of $12.5 million per year. 128 First and Final Mile Connections The expansion of transit service (like the buildout of the FasTracks system in the Denver metro area or the VelociRFTA and MAX BRT in the Roaring Fork Valley and Fort Collins respectively or the Bustang statewide bus service) is only the beginning of developing a successful and sustainable transportation system. First and Final mile connections (FFM) play an integral role in getting people from their home to transit stops and then to their final destination. To encourage people to walk and bike rather than driving their own car to get to a transit stop, adequate and attractive pedestrian and biking infrastructure needs to be in place. Areas lacking sidewalks, bike routes, or safe crossings for pedestrians and cyclists are unlikely to encourage potential transit riders. FFMs serve a critical role in making transit service accessible to those populations (disabled, low-income, youth, elderly) who lack access to a personal vehicle. Ultimately, improvements to FFMs will increase transit ridership and help maximize the benefits from the investment in transit. In addition to improved bike and pedestrian connections, there are many experiments across the country on how to effectively use services like Uber, Lyft, bike sharing and car sharing to access transit stations. Unfortunately, there has not been any systematic work done to evaluate the funding needed across the state for FFM investments. For the purposes of this report, we assume that there will be some overlap, where pedestrian and bicycle investments that we recommend will address many FFM needs, and that the bus improvements we recommend will also help address FFM gaps. However, this overlap is not comprehensive and is likely missing some investments needed to address FFMs. One recommendation we do offer is that any future BRT or rail planning efforts should identify FFM needs in the planning process and should fund these as a part of the transit project. Historically, at least in the RTD region, the transit projects have paid for the rail or BRT investment, but FFM has been left as an unfunded afterthought for the surrounding local government. This means that we make multi-billion dollar investments to create transit lines that act as a backbone for an overall system but often do not make the much smaller FFM investments that would maximize the investment through increased usage. 51

52 Statewide Transit Currently, Colorado lacks a comprehensive transit system linking communities across the state. However, there is a growing urgency to address inter-regional transit, particularly on the congested corridors of I-25 along the Front Range and I-70 from Denver through the mountains. At the very least, Colorado needs to make the investments in the lower cost options of providing high quality bus connections and should consider additional investments in commuter rail and high speed rail that bring additional benefits but also have much higher costs. Regional and State Transit - Bus One of the quickest ways to improve regional and statewide transit options is to ramp up bus service. One type of regional transit is Intercity Bus Service, which provides scheduled and reliable service to more urban areas over long distances. It serves the general public, can transport passengers baggage, and makes meaningful connections with other transit services like Bustang to get to more distant points. 129 Another type of service is Regional Bus Service, which typically offers higher frequency, shorter distance trips. Some regional services are designed to serve specific markets such as resort employees or those needing transportation to regional airports. Other regional programs are designed to serve people who need to access government services and medical trips and designed to permit users to complete the trip in one day. An example of a regional provider is Eagle County Transit (ECO Transit) providing services along the I-70 corridor from Gypsum to Vail. The last type is Demand Response Service, which provides service on an on-demand schedule. The routes are not fixed and without a set schedule they can pick people up and take them to where they need to go in real time. This type of service makes the most sense in less dense population centers where fixed route service would not be efficient. Calculating the demand for transit service between communities depends on the size and density of FIGURE 16 Transit Dependent Communities in Colorado Based on Density Colorado Department of Transportation, Statewide Intercity and Regional Bus Network Plan 52
53 an area s population and on the demographic and economic characteristics of that population. FIGURE 17 - expanding bustang CDOT used data from the 2010 Census and the American Community Survey (ACS) to identify four potentially transit-dependent population segments in Colorado: 1. Young Adults (age 18 to 34): college students, enlisted military personnel and other young adults, some of whom do not have access to an automobile. Individuals in this age range often make up the bulk of intercity and regional bus ridership. 2. Elderly (age 65 and above): advancing age can mean diminished ability or desire to drive (particularly on a long trip) and increased need for regular trips to medical facilities. 3. Low Income: Coloradans living in poverty are often precluded from owning or operating a car, or have only one car per household, making longdistance trips impossible. 4. Autoless households: More than 100,000 households in Colorado do not have a car and rely on transit services. Figure 16 indicates the density of transit-dependent populations, overlaid with existing Intercity and Regional Bus Services. Bustang Expansion: $3.3 million per year in annual operating costs and $3 million in onetime capital costs to expand Bustang Bustang was launched in July 2015 by CDOT to provide bus service between regions. Bustang has provided more than 100,000 trips in the first year of operation. Currently Bustang operates three routes: 1. Denver to Fort Collins with stops along I-25 in Loveland and Windsor (five services daily and one weekend CSU Ram Route) 2. Denver to Colorado Springs with stops along I-25 in Monument (nine services daily, weekday only) 3. Denver to Glenwood Springs with stops along I-70 in Frisco, Vail and Eagle (one service daily) Expanding Bustang service would be an easy way to increase statewide connectivity. One way to expand the service would be to extend the existing routes to Grand Junction going west and to Pueblo going south. Adding Grand Junction to the I-70 route would add 180 miles for each roundtrip and adding Pueblo would add 88 miles for each roundtrip. Operating costs for Bustang (at 2016 diesel prices) are approximately $4.25 per mile so adding Grand Junction and Pueblo would add $765 and $374 to each respective route s trip. Over the course of the year this would increase operating costs by $195,000 for the Grand Junction section (365 operating days) and $95,000 for the Pueblo corridor (255 operating days). If we assume that three of the daily Denver to Colorado Springs trips continue on to Pueblo that would add a daily cost of $1,122. Over the course of a year this would increase operating costs by $286,000. Annualizing the one daily roundtrip between Denver and Grand Junction would result in additional operating costs of $279,000. Table 9 - Extending Current Bustang Routes Extension Glenwood Springs to Grand Junction Additional Cost per Round Trip Number of Daily Roundtrips $765 1 $279,000 Colorado Springs to Pueblo $374 3 $286,000 Total Cost for Extension 53
54 In addition to lengthening current routes, Bustang could increase the frequency of its service and offer more trips on the weekends. The table below estimates the costs of adding three roundtrips on Saturday and Sunday for the North and South routes and adding two additional roundtrips every day for the West line (which would require additional buses). Roundtrip service could also be added between Denver and Greeley. New buses would need to be added to the Bustang fleet to accommodate this new service. If two daily roundtrips were added this would require at least two new buses, plus a backup, which would cost approximately $1.8 million total ($600,000 per bus). The operating costs would be approximately $800,000 for a two daily roundtrips. The total new capital costs to expand Bustang service would be $3 million and the total new annual operating costs would be $3.3 million. TABLE 10 Expanding Current Bustang Service Cost to add an additional roundtrip Number of Additional Weekly Roundtrips Total Annual Operating Cost Denver to Pueblo $1,012 6 $315,588 - Denver to Fort Collins $553 6 $172,380 - Denver to Grand Junction Capital Cost for Additional Buses $2, $1,504,048 $1.2 million Denver to Greeley 2 $800,000 $1.8 million Buses to Serve Recreational Demand on the I-70 Corridor: $25.6 million per year The estimated capital cost for this system is approximately $100 million in 2000 dollars and breaks down as follows: 131 $40.6 million to purchase 116 buses ($350,000 each) $25 million to build transit centers $36 million in additional capital costs As part of the Preferred Environmental Impact Statement (PEIS) for the I-70 corridor, CDOT modeled the impact of providing bus service mixed into the I-70 general purpose lanes. The analysis found that a bus traveling in mixed traffic (the Minimal Action scenario) would have a transit mode share of around four to five percent for winter weekends, which translates to an estimated 600 passengers per hour during peak periods or a little over 200 fewer cars per hour (See Appendix D for more information). At certain locations (at the Twin Tunnels for example) the percentage of transit users could increase to around nine to ten percent. 132 Weekday transit mode share in the Minimal Action scenario would be around two percent with an overall share of 3.3 percent for the entire corridor. This analysis was done prior to the opening of the I-70 Mountain Express Lane. This lane does not currently allow buses but if it did, it would give buses a travel time advantage over non-toll paying vehicles and thus increase ridership. The system CDOT modeled (without the potential of buses using the new express lane) involved five different lines, all originating in Denver and running to the major ski and resort areas of Winter Park, Keystone, Silverthorne, Frisco, Breckenridge, Copper Mountain and Vail. During winter weekends, each line would have 20-minute headways resulting in 15 buses leaving each hour from RTD s W Rail station near Golden. 133 The system also has an estimated annual operating cost of $14.8 million. All of these numbers come from an analysis done in To make them more comparable to the other numbers cited more recently, we should inflate them to 2013 dollars, bringing the capital costs to approximately $135 million and the annual operating costs to $20.2 million. Based on the ridership numbers from the 54
55 I-70 Mountain Express Lanes Access to the mountains from the Front Range is a key factor in Colorado s quality of life, and congestion on I-70 is cited by major employers as a negative factor in locating new jobs in Colorado. Existing levels of congestion on the corridor during peak periods are already high and are expected to worsen significantly in future years as Colorado s population grows. The solutions proposed in the I-70 Mountain Corridor Programmatic Environmental Impact Statement such as an Advanced Guideway System (AGS) for transit or expansion of the interstate to three lanes of cars and trucks in each direction will take many years to complete. One relatively low cost solution that could be implemented much faster than highway expansion or an AGS would be to provide high-quality bus service in the corridor. Given the critical role transit can play in this corridor, bus service impact could be maximized by expanding the I-70 Mountain Express Lanes (Peak Period Toll Lanes) and allowing bus use similar to U.S. 36 s bus-oriented managed lanes. Currently, the tolled Mountain Express Lane (using the shoulder) covers 13 miles of the eastbound lane between Empire and the Twin Tunnels near Idaho Springs and operates during a limited number of days each year. If the Express Lane was safely extended to cover a larger section of the corridor and also developed on the Westbound lane, without negatively impacting the surrounding communities, this would provide the potential for buses to make a relatively congestion free trip along significant sections of the corridor study, this could transport 2.1 million people to and from the ski resorts and mountain towns. If CDOT allowed these buses free access to the current and any future I-70 Express Lanes, transit would have an important travel time advantage for at least a portion of the corridor, increasing the value and usage of the service. Additional InterCity Rural Service Bus: $43.2 million annually As Colorado invests in statewide transit to connect major population centers and major recreational areas, it should not ignore the need to connect more rural regions. Too many rural parts of Colorado lack regional transit options that carry them to government services, medical appointments, airports and transit centers, and other amenities in more urban areas. Figure 16 demonstrated that communities with high relative need for transit services outside the major metro areas are located along major highways and with some notable exceptions, the existing bus network currently provides at least some service for almost all of these areas. More difficult to capture are those parts of the state that require a 200+ mile round-trip to reach a major medical, employment or retail center. To make the trip in one day and have 4-5 hours at the destination requires bus service that starts between 5 am and 6 am, and returns 12 or 14 hours later. Sufficient and well-timed service would avoid the necessity of staying overnight, which adds cost and hardship to the trip. Areas where modest improvements could yield significant benefit are: Lamar to Pueblo - regional route with same day service Trinidad/Walsenburg to Denver: regional services providing either same-day or a one-night stayover Greeley to Denver: service for towns on U.S. 85 U.S. 40 Corridor to Denver: allows same-day service for those residents living fairly close in (such as Kremmling) and a one-night stay for those living at greater distances The first three corridors have relatively high levels of service for single passengers, including Medicaid Non-Emergency Medical Transportation (NEMT), 55
 with")
56 Veterans transportation, and general-purpose trips that are presently met by a mix of volunteer driver programs, county-based services, friends and family, and private providers. Because these single-passenger services are expensive, it may be possible to provide comprehensive services (open to all riders instead of each vehicle carrying only a single type of client) with little additional cost. The regional routes provided by local entities have annual operating expenses of $14 million and carry over 2.6 million annual riders. The average corridor length is just over 31 miles. The average cost per passenger is $6.42. TABLE 11 - Forecasted Demand and Costs for Regional Trips in Colorado 2014 Total Population (000) Pct of Population Cost per Trip Regional Trips (000) Estimated Total year olds 134 Regional Cost (000) 5,050 24% $6.42 2,618 $16, Total Population Pct of Population year olds1 Cost per Trip Regional Trips (000) Estimated Total Regional Cost (000) 7, % $ ,109 $43,268 Based on population estimates and inflation rates, we calculate that the number of regional trips will increase to 4.5 million by This is calculated using the growth in Colorado s population as a whole and the slight decline in the percent of population by year olds the demographic most prevalent in regional and intercity trips. Estimated total cost rises to $43 million by 2040, based on a 2 percent inflation rate per year. Demand Response Service in Rural Colorado Bus: $29.8 million annually Demand Response Service accounted for about 5% of the total trips offered in rural Colorado in This figure is significantly lower in some areas of the state like the mountain communities since fewer people requiring specialized transit tend to live FIGURE 18 Passenger Trips by Mode Rural Colorado Source: National Transit Database,
57 in those areas. However, the Eastern Plain and Western Slope communities experience a higher than average percentage of trips dedicated to Demand Response Services. With the current data, we cannot distinguish between the very different profiles of mountain rural and non-resort rural communities. The Colorado State Demography Office estimates that by 2040, the percentage of Coloradans over the age of 75 will increase significantly. 136 In rural communities, the percentage will increase from 6 percent in 2010 to 11 percent; urban areas will see an increase from the current 5 percent to 10 percent. These figures are regional averages some counties will see much higher percentages, especially in rural counties that do not enjoy significant in-migration by younger age groups. We estimated that the percentage of transit services required by the 75+ age group will increase disproportionately to the demand for transit services overall. If transit demand increases at the same rate that the population as a whole is expected to increase, the demand for specialized services will increase at a greater rate, given the aging population is more likely to utilize specialized services. These calculations do not take into account the likelihood that the demand may increase at a faster rate as younger riders take advantage of greater service levels and convenience in urban areas. TABLE 12 Demand Response Service Trips 2014 versus Total Population (000) Percent of Ppln 75+ Cost per Demand Response Trip Demand Response Trips (000) Rural % $ ,883 Non Denver Urban 1, % $ $9,915 Denver Region 2, % $ ,270 48,087 Statewide 5, % $ ,326 69,885 Total Demand Response Cost ($000) 2040 Total Population (000) Percent of Ppln 75+ Cost per Demand Response Trip Demand Response Trips (000) Total Demand Response Cost ($000) Rural 1, % $ ,051 $29,859 Non Denver Urban 2, % $ $27,398 Denver Region 4, % $ ,939 $120,433 Statewide 7, % $ ,613 $177,690 Based on current Demand Response Service trips, the percentage of the population over 75 (the age at which people typically require additional transportation options), and the current cost per trip, we estimated the demand for and cost of demand response trips in Population estimates indicate that the percentage of the population that is over 75 will double for all regions of the state, thereby effectively doubling the demand for specialized transit services. Cost per trip was inflated at 2 percent per year. The national average for rural demand response trips is $ This is likely low for Colorado, where rural agencies typically have longer trip distances and/or harsher environmental conditions that increase both capital and operating costs. Nonetheless, using this figure we estimate that of the 57
58 total transit expenditures in rural Colorado in 2014 some $87 million more than 14 percent or $12 million was spent on these types of trips. However, these figures only cover the most basic of necessary trips medical appointments, picking up prescriptions. In Jefferson County, the Seniors Resource Center found that when seniors were offered the option to use transit for non-medical trips (such as trips to the hair-dresser, shopping for more than just groceries, and trips to volunteer opportunities) the organization saw an increase in demand between 25 percent and 30 percent. A 20 percent increase in the figures cited would go a long way toward providing transit service that goes beyond necessary trips service that would contribute significantly to the quality of life for those who do not participate in the transportation system via privatelyowned cars. Regional and Statewide Transit Rail and Bus Rapid Transit Commuter Rail along I-25: $1.2 billion ($48 million annually) to build a commuter rail service along I-25 from Denver to Fort Collins. A lower cost alternative, if express lanes are added to North I-25, is the addition of BRT service in these lanes, at a capital cost of $126 million ($5 million annually) and an annual operating cost of $12 million. $2.8 billion ($112 million annually) for a commuter rail service between Denver, Colorado Springs and Pueblo. 138 The Environmental Impact Statement (EIS) for the North I-25 corridor between Denver and Fort Collins, looked at the possibility of setting up commuter rail from Fort Collins that connected to Denver s FasTracks system. Specifically they studied service from Fort Collins to Denver via Longmont connecting to RTD s North Metro Rail line (no transfer necessary). The estimated cost for commuter rail was $1.2 billion. 139 The North I-25 EIS also looked at the cost of bus rapid transit options between Fort Collins and Denver. The cost for BRT was $126 million, ($5 million annually) and the service would have an annual operating cost of $12 million annually, though this does not include the cost of building new express lanes for the bus to operate along with toll paying and high occupancy vehicles. The express lanes are estimated to cost $1.56 billion in 2009 dollars. Over 25 years, that would be $17 million per year to offer BRT service in express lanes along I-25 between Fort Collins and Denver. No similar study exists for the southern portion of I-25, however a rough estimate of the cost of similar commuter rail between Denver and Pueblo would be $25 million per mile. With a distance of 115 miles between the two cities, this gives a total cost of $2.8 billion for a southern commuter rail line. TABLE 13 Comparing Bus and Commuter Rail Service along North I-25 BRT Capital MPPSL Expansion O&M costs Ridership $126 million (without highway expenses) - $12 million 2.3 million North I-25 Commuter Rail $1.2 billion - $40 million 2.2 million 58
59 High speed rail along I-25 and I-70 Capital cost of approximately $21-30 billion $ billion per year over 25 years (including bonding costs) Operating cost estimates range from $144-$450 million, but farebox revenue is projected to cover this cost, and generate excess revenue of $ million per year that could help pay bond costs While inter-regional commuter rail is one option for a statewide rail network, another option is high speed rail. Key differences between the two are cost, travel distance, speed and the tracks. High speed rail runs much faster, reaching speeds of over 300 mph, partly because it has its own dedicated tracks and rolling stock, and therefore can provide convenient connections over longer distances. Commuter rail is slower than high speed rail but still attains speeds that make it a faster alternative to driving over shorter distances, often between city centers and suburban communities from which people commute. Commuter rail can also cost much less because it can utilize pre-existing tracks and rail systems. Two recent studies have examined the potential for high speed rail service along the I-25 and I-70 corridors in Colorado. In 2010, the Rocky Mountain Rail Authority s study estimated it would cost $21.2 billion in capital costs for both corridors. Total annual ridership was estimated at 34.5 million, a mode share of 16% for inter-urban trips. In 2014, CDOT published the Interregional Connectivity Study (ICS) and the Advanced Guideway Study (AGS). The ICS, which incorporated the work of the AGS, identified a high speed rail option for both corridors with capital costs of $30.1 billion and annual ridership of 18.3 million. In order to raise the capital cost necessary to build out the high speed rail system, bonding would likely be necessary. With a bond rate of four percent and a term of 25 years, it is estimated that it would require annual payments of $1.9 billion to pay off $30.1 billion and annual payments of $1.3 billion to pay off $21.2 billion. We do not include high speed rail in recommendations for immediate investments but instead show it as a potential additional investment that the state could make if funding were available. TABLE 14 High Speed Rail Costs and Ridership Estimates Rocky Mountain Rail Authority Inter Connectivity Study (LPA Base Option)* I-70 (Eagle to DIA) Capital Cost I-25 (Pueblo to Fort Collins) Capital Cost Annual O&M Costs Annual Revenue (2035) Estimated Transit Mode Share Annual Ridership (2035) $13.8 $7.4 billion 142 $450 million 143 $754 16% billion 141 million 144 million 146 $13.5 $16.6 billion 148 $144 million (Ibillion ); $63 million (I-70) 149 $344 10% 18.3 million 150 million 151 *Unless otherwise indicated the figures are for both corridors. 59

60 FIGURE 19 Amtrak routes as of May 26, 2013 Photo credit: Wikimedia user Chumwa, CC BY-SA 2.5 The Southwest Chief and the Winter Park Ski Train The National Railroad Passenger Corporation, also known as Amtrak, operates passenger railroad service over medium and long distances across the United States including two current routes through Colorado. California Zephyr from Chicago to the Bay Area with stops in Denver and Glenwood Springs. Southwest Chief from Chicago to Los Angeles with stops in Lamar, La Junta, and Trinidad. Recently, Amtrak considered rerouting the Southwest Chief into Oklahoma and Texas, bypassing Colorado, unless a segment of tracks were repaired. Working together, local, state, and federal governments have secured the necessary funding to keep the Chief in Colorado for the immediate future. There is a proposal to extend the route to include a stop in Pueblo and a study of the potential costs of that extension will be completed this summer. In addition to the two current routes, Amtrak also ran a train from Denver to Winter Park, commonly referred to as the ski train. The train shared tracks with freight railroad but was generally able to make the trip in 2 hours and 15 minutes, depositing people approximately 100 yards from the lifts at Winter Park. The last regular service was in 2009, though it made a couple of special runs carrying 450 passengers for its 75th anniversary in Approximately $3 million is currently allocated to update the boarding platform and make track safety improvements at which time Amtrak can consider continuing the service. Given that it is possible this service could operate again without additional state investments, no costs were included in this report s recommendations. 60

61 Stephen Rees Current and Future Investments in Colorado Transportation In order to invest $1.05 billion annually to meet the needs of our transit, walking and biking infrastructure and services across the state, Colorado must look at both current and new funding sources. Without any changes, well over $100 billion in local, state and federal funds will be spent on our transportation infrastructure and services in Colorado over the next 25 years. 153 The largest source of funding currently is federal dollars, collected through a combination of federal gas taxes and general fund revenue and distributed to the state via the Colorado Department of Transportation (CDOT), local Metropolitan Planning Organizations (MPOs), and directly to local communities or transit agencies. While some of this money will continue to come from the federal gas tax, if current trends continue federal transportation dollars will increasingly be made up of general tax revenue. Over the last decade, the share of federal transportation dollars coming from general tax revenue has increased to 42 percent, which means the average American household pays $597 per year in general taxes to cover transportation costs above and beyond the federal gas tax, which hasn t been raised since Colorado currently receives approximately $550 61
62 million per year in federal transportation funding that is distributed to CDOT, transit agencies, and local governments, and would be expected to receive approximately $14 billion over 25 years, with a little over half of this going directly to CDOT. 155 A second major source of transportation funding is local revenue. Some communities have specific taxes, often approved by voters, which support local transportation infrastructure and services. A few communities use this money to fund regional connections and some use their general tax dollars to augment transportation specific dollars. We do not have an estimate for how much of this money is invested in transportation each year. Every community in Colorado also receives a share of the state gas tax revenues, the Highway Users Tax Fund or HUTF, a portion of which can be used to support any mode of travel. The local share of the HUTF generates about $250 million per year, or about $6.25 billion over 25 years. This does not include the local tax revenues that go to transportation. Local and regional funds are the largest source of funding for public transit in Colorado, providing over 75% of all transit funding in the state. 156 The future of local transportation dollars is hard to predict. While the HUTF portion of local transportation dollars is projected to decrease as vehicles become more fuel efficient or transition from gasoline to electric and therefore pay less in gas tax, many communities have approved or increased local investments. The final major source of transportation funding is state revenue that is collected by CDOT from the state gas tax, tolls and vehicle registration fees. 157 Adding in some limited money that comes from general state taxes, the total state money is approximately $500 million per year, or $13 billion over 25 years. Given that most of this money comes from state gas taxes, without a significant change in state transportation revenue, state investments is expected to plateau or even to decrease. It is likely, given the broad consensus that exists on the need for more transportation investments, that transportation funding will be significantly increased in the future. Given the historical underinvestment in Colorado s transit, biking and walking that was covered this report, we cannot take for granted that enough of these transportation dollars will be used to realize the multitude of benefits that come from significant investments in a multimodal transportation system. Therefore it is imperative that Colorado fundamentally deepen the investment we make in transit, walking and biking, whether it is from current or increased transportation dollars, so we can meet the demands and challenges of the 21st century in Colorado in a way that ensures a high quality of life, access to jobs, safety, good health and a strong economy. 62
63 Colorado s Blue Ribbon Panel on Transportation Back in 2008, the state commissioned a blue ribbon panel, known as the Colorado Transportation Finance and Implementation Panel. The panel s work was summarized in a Report to the Public published in The panel graded Colorado s transportation infrastructure, grading existing urban and rural transit at C, and interregional transit at D. The report concluded that state funding of $317 million per year was needed to bring inter-regional transit up to a bare standard of C+; $72 million in annual state funds to match local investment in rural and urban transit to bring these up from a C to a B, in addition to $632 million per year to multimodal corridor projects that combine highway improvements with transit. In the report s recommendation for $1.5 billion in additional transportation funding, $10 million was allocated for bicycle and pedestrian funding. While this information is older and is not included in our calculations of the needs of transit, biking and walking in the state, it is important to include to demonstrate that such a broad representative panel came to the conclusion that the level of state funding for transit, walking, and biking was far below the level needed. The 32-member panel included representatives from all across the state, including private-sector members, elected officials, and transportation experts. The Co-Chairs: Douglas Aden Chairman of the Colorado Transportation Commission and a resident of Grand Junction Cary Kennedy State Treasurer Bob Tointon President, Phelps-Tointon, Inc. Members: Ray Baker Colorado Commission on Higher Education Charles Bedford The Nature Conservancy Joe Blake Denver Metro Chamber of Commerce Mike Cheroutes Hogan & Hartson Ken Conyers Action 22 Bill Elfenbein Regional Transportation District Board Cas Garcia Attorney Russell George Executive Director CDOT, (ex officio member) Neal Hall Colorado Building & Construction Trades Council James Hume citizen; agriculture perspective Mick Ireland Intermountain Transportation Planning Region Steve Johnson State Senator Joe Kiely Town of Limon Carl Maxey Maxey Company Mark Mehalko - Move Colorado Tony Milo Colorado Contractors Association Dale Mingilton President First Bank Kevin O Malley Clear Creek County Commissioner Michael Penny Frisco Town Manager Joe Rice State Representative Vince Rogalski Club 20 Cathy Shull Progressive 15 Paul Smith Smith Railway Consulting Vivian Stovall citizen; elderly and disabled perspective Dan Stuart Alpern Myers, Stuart, Scheuerman & Hickey Stephanie Takis State Senator Ed Tauer Mayor of Aurora Will Toor Boulder County Commissioner Glenn Vaad State Representative Melanie Worley Douglas County Commissioner 63

64 Chris Brooks Light-rail station at Union Station in Denver. Recommendations for Moving Our Transportation System Forward To meet the needs of transit, walking and biking in Colorado over the next 25 years, policymakers will need to make sure that planning adequately includes the full range of transportation modes, not just car-based travel; make existing funding sources more effective and more flexible; and will need to identify new sources of transportation funding. We offer six recommendations that would help to achieve these changes. Ensure that existing state transportation funding is flexible, and can be used to address the particular transportation needs of a corridor, rather than being arbitrarily limited to only one mode of transportation. Currently, state law restricts the Colorado Department of Transportation s use of the vast majority of state transportation funding to highway and road projects. Under existing law, the use of state gas tax revenues and the vast majority of vehicle registration fees are limited to highway expenditures. The state gas tax generates about $350 million per year for CDOT, and about $250 million per year for local governments. Back in 2013 the legislature removed this restriction from cities and counties through the passage of SB because they recognized that cities and counties should have the flexibility to examine their own particular corridor or neighborhood s needs and spend transportation dollars on the modes that best meet those needs instead of being arbitrarily limited to road-only projects. The same logic should apply to CDOT. On many corridors, the highest priority improvements may not be highway widening but adding sidewalks, building bicycle facilities, or improving transit service. CDOT should have the ability to invest in these whether as stand-alone projects or in concert with a highway project. This would bring Colorado in line with many states that allow much greater flexibility in the use of state gas tax revenues. 64
65 Require that toll revenues be used to support transit service in the same corridor. Increasingly, the state has turned to toll lanes as both a way to finance highway expansion and a way to manage congestion by charging a higher toll during congested periods. In order to make sure that these projects serve Coloradans of all income levels and support Colorado s multimodal needs, the state should require that a portion of toll revenues be invested in public transit in these corridors. Demographic analysis of drivers who pay tolls and of transit users shows that regular toll users are overwhelmingly upper-income, while transit riders are much more diverse, including both low and high-income travelers. 159 Including funding in toll projects for express bus or bus rapid transit service would make the projects more equitable and would make them more effective transportation projects, carrying more people within the constraints of the current infrastructure. The state and every regional planning partner should conduct the same level of analysis to identify funding gaps for transit, bicycle, and pedestrian infrastructure as they do for roads and highways. The state and the regional planning organizations currently develop detailed projections of funding needs for both maintenance and expansion of highways. These plans don t just show what can be done with existing funding, but identify funding gaps. However, it is unusual to see the same level of planning for other modes. At the state level, the state transportation plan includes little information on funding needs for bicycle and pedestrian infrastructure. It does provide some information on needs for transit funding. At the regional level, the Denver Regional Council of Governments and the Intermountain Transportation Planning Region appear to have the most well developed assessment of the funding and bicycle, pedestrian and transit infrastructure needs within their regional plans. If these modes are not fully incorporated into the planning process, informed decisions cannot be made regarding transportation funding priorities. The state and its planning partners should ensure that transit, walking and biking modes are incorporated into the next iteration of long-range transportation plans. New state funding sources for transportation should be designed to provide Coloradans with options to meet the broad multimodal transportation needs of our residents. While the state is not solely responsible for transportation investment local and federal funding play a big role it is a crucial partner for implementing good public transit, bicycle and pedestrian infrastructure, in addition to highways. In the last two years, there have been multiple pieces of legislation introduced and ballot issues proposed to increase transportation funding. In 2016, the two proposals to increase state funding that received the most attention were a proposal to issue $3.5 billion in bonds and another to raise the state sales tax by $670 million per year. Unfortunately, neither of these proposals provided significant funding for transit, walking or biking. This type of highway-oriented funding will not adequately address the diverse transportation needs of Colorado. As this report demonstrates, there is a large gap between current funding levels and the needed investment in Colorado s pedestrian, bicycle and transit infrastructure and services. Any new transportation funding, whether implemented through legislation or by ballot, should include meaningful funding for these modes. One way to ensure future funding is meeting the demands of Coloradans is to include a broad range of stakeholders and residents of Colorado in the processes used to develop future funding options. Polls and surveys are demonstrating this is what Coloradans want so decision makers need to find ways to have Coloradans raise their voices and then listen to them. 65
66 Colorado s Metropolitan Planning Organizations (MPOs) should use the funding that comes to them to support the broad range of multimodal needs. MPOs such as the Denver Regional Council of Governments (DRCOG), the Pikes Peak Council of Governments and the North Front Range MPO are the lead agencies for prioritizing how federal transportation funds get invested in their areas. Many of these federal funding streams are flexible dollars that can be used for all modes of transportation. While some MPOs have used this flexibility, others spend the vast majority of flexible funds on highway projects. MPOs should fund the wide range of multimodal investments needed to serve their regions. In addition, CDOT should use the flexible federal funds that it does have to fund multimodal needs. Cities and counties should adequately fund sidewalks, safe crossings, and local bicycle infrastructure, in addition to partnering with transit agencies to provide adequate transit to their residents. There are enormous variations across the state in the extent to which local governments invest in multimodal transportation. Some spend the vast majority of their funding on roadway projects. Others have developed priorities where pedestrian, bicycle and transit modes are the highest priorities for new projects, although even here most dollars get spent on maintaining existing roads. Many cities do not even take responsibility for funding or maintaining sidewalks, leaving property owners on the hook. Local street designs often emphasize car flow, leaving pedestrians and bicycle riders by the side of the road. Local funds, generally generated from sales taxes, property taxes and fees on development, are an important source of transportation dollars in Colorado and local governments need to ensure that this funding as well as their design and planning offices see walking, biking, and transit on a level playing field as car and truck traffic. 66
67 Methodology Appendix A Walking Methodology For the purpose of this study, we defined urbanized areas as incorporated municipalities with a population of 5,000 or greater located within micropolitan or metropolitan core based statistical areas (CBSAs). A CBSA is a U.S. geographic area defined by the Office of Management and Budget (OMB) that centers on an urban center of at least 10,000 people and adjacent areas that are socioeconomically tied to the urban center by commuting. Since sidewalks are not always appropriate in smaller, more rural or isolated communities, or along state highways crossing unincorporated county land where there is little pedestrian activity unless public transit is present, the focus on towns and cities excluded these areas and provides us a conservative assessment of the walking needs in Colorado. Using CBSAs also excludes unincorporated areas that may be governed by a Homeowners Association. A large, unique example of this is Highlands Ranch, the largest Homeowners Association in the nation. However, since many Homeowners Associations exist in planned communities, like Highlands Ranch, they often have an existing, extensive sidewalk network, decreasing the impact of this exclusion. Costs Methodology Estimating Sidewalk Needs - To calculate the number of new or replacement sidewalks needed across the state of Colorado, we calculated the following metrics, at the census tract level: Roadway Mileage: Miles of roadway in the census tract. Sidewalk Coverage: Percent of road miles that have existing sidewalks. Sidewalk Gap: Percent of road miles without sidewalks. Replacement Needed: Percent of road miles that need sidewalk repair/replacement. Ideal Coverage: Percent of road miles that would have sidewalks in an ideal scenario. This considers that some cities may not need 100% of roadways to have sidewalks. Road Mileage Roadway data was obtained through the Colorado Department of Transportation s Online Transportation Information System s Data Catalog: Shapefiles used were local roads, major roads, and highways. These files provide baseline data for roadway mileage across the entire state of Colorado. These files were clipped to include only roads within urbanized areas as defined above, and filtered to exclude limited-access interstates. More details on roadway mileage calculations are available. Because full sidewalk infrastructure would require sidewalks on two sides of every street, roadway mileage was doubled. This figure represents the maximum potential sidewalk mileage in urbanized areas across the state. Sidewalk Coverage There is very limited data on sidewalk needs: Public works officials in local municipalities lack reliable inventories of existing sidewalks, even in those cities with active repair programs. Through its Regional Data Catalog, the Denver Regional Council of Governments (DRCOG) has recently released sidewalk data obtained through the Denver Regional Aerial Photography Project. Sidewalk centerline shapefiles provide the locations of sidewalks in the Denver metro area. DRCOG released data in phases as 67
68 it became available; this project utilized data from all seven project delivery areas available in March This sidewalk mileage was calculated and compared to roadway mileage for each census tract studied that was located within the available delivery areas. Analyzing the data for 425 census tracts across 23 Denver region cities, average sidewalk coverage trends became apparent, based on the population density of the census tract. We utilized this data to estimate current sidewalk coverage in urbanized areas across the state. The sidewalk coverage percentages assigned to census tracts based on population density are below: Population Density (persons per square mile) 0 to 1,000 55% 1,001 < 4,000 80% 4,001 < 7,000 90% 7,001 or greater 93% Sidewalk Coverage Assigned (% of road miles) These sidewalk coverage percentages were used to calculate the existing sidewalk infrastructure, at the census tract level. Existing sidewalk mileage = roadway mileage x 2 x sidewalk coverage %. Sidewalk Gap Missing Sidewalk mileage = roadway mileage x 2 x (100% - sidewalk coverage). Sidewalks Needing Replacement Sidewalk Lifespan and Maintenance Based on expert interviews, we assumed the average lifespan of a concrete sidewalk is 50 years. This means that 2% of sidewalk mileage needs to be repaired or replaced every year, if cities are regularly performing maintenance. Because most cities in Colorado do not have a city-run program to repair and replace sidewalks, with many cities assigning the maintenance responsibility to the property owner, sidewalks are frequently neglected and maintenance does not occur. We estimated that 50% of necessary maintenance has occurred since initial sidewalk installation, across the state. To approximate the age of sidewalks, we used housing data, under the assumption that the sidewalk was built when the housing around it was built. We used the median year built of housing in census tracts, using five year averages from American Community Survey results. Sidewalk age was assigned to each road segment, based on the census tract it is located in. Sidewalk age = median housing year built subtracted from Percent of existing sidewalks needing repairs = Sidewalk Age * 2% * 50%. Based on expert interviews, we assumed a high level of sidewalk coverage is ideal for urbanized areas across the state. Specifically, we assumed an ideal of 100% coverage for municipalities with populations of 50,000 or more, and 95% for smaller municipalities. Ongoing Maintenance - Once the full sidewalk network is built out, the total statewide inventory of sidewalks would be 28,400 miles. Assuming an average lifespan of 50 years, 2% of this network would need to 68
69 be repaired or replaced each year, at an annual cost of $109,726,000 for maintenance of the sidewalk network. Limitations - The major limitation of this study is the lack of comprehensive data on the existence, age, and condition of sidewalks throughout the state. By extrapolating from existing data available for the Denver metro area, and by using proxy measures such as age of housing stock and population density, we were able to generate an overall estimated need for urbanized areas across the state, while acknowledging that the need may vary greatly from one community to the next. Our estimate focused specifically on urbanized areas, based on a general consensus among the experts we interviewed that a high level of sidewalk coverage in these areas is ideal. Communities outside of these areas are much more diverse in terms of the ideal sidewalk coverage. In some non-urbanized areas, sidewalks may not be appropriate due to topography or the rural nature of the community. Other communities, however, expressed a strong desire for a more comprehensive sidewalk network. Therefore our estimate based solely on urbanized areas is likely conservative. Our estimate is also conservative because it does not include major additional costs that may arise when installing basic sidewalks, such as right-of-way acquisition and drainage improvements. Minor repairs needed before the end of the projected sidewalk lifecycle were not included in these estimates, either. Finally, as mentioned above, our estimate of pedestrian infrastructure needs is conservative in that it focused exclusively on sidewalks, and did not include other infrastructure such as enhanced pedestrian crossing treatments, pedestrian signals, and pedestrian bridges. Therefore, it should be assumed that communities will need to dedicate additional funds to pay for these kinds of upgrades. Appendix B - Transit Levels of Investment We will rank urban transit systems based on per capita investment. For the urbanized areas, we will focus on what levels of funding would be required to generate higher levels of ridership. There are multiple measures of transit level of service. 160 A leading indicator of good service is high ridership. When we look at the data on annual per capita ridership and annual per capita investment, the two track quite closely. We looked at transit systems across the country. There is a very top tier of systems in large, dense cities such as New York and San Francisco that have much higher levels of ridership, which we excluded because of the unique opportunities related to their size, geography and population density. There is a pretty strong correlation between per capita investment and per capita ridership. Therefore, we set a HIGH level of investment based on the level in communities with the highest per capita ridership among the small and midsized cities that are more analogous to Colorado s urbanized areas. Portland, OR and Seattle, WA both have per capita ridership of about 60 trips/year, which we set as a HIGH level, while setting Denver s current level of about 40 trips/year as a MEDIUM level, 20 trips/year as LOW, and 10 trips/year or less as VERY LOW. Our study analyzes how much funding would be required to bring Colorado s urbanized areas up to the LOW, MEDIUM and HIGH levels, in addition to looking at the needs for inter-regional travel that are not captured by these urbanized area measures. For RTD, Pueblo and Fort Collins transit, we primarily used the plans that were developed by the transit agencies, which include significant service increases that are high enough to bring the community to an overall higher level of service. For RTD, we added in a proposal to dramatically increase ridership through a community wide transit pass program. For Colorado Springs and the remaining Northern Colorado metropolitan areas, the existing plans were relatively constrained. For these communities we used broad 69
70 estimates based upon an assumed per capita level of funding required to bring the community to a higher transit investment level. The way that we did this calculation was by looking at the per capita expenditures in the communities in Colorado that are achieving higher transit levels of investment, and then used this as an estimate of the level of funding required to achieve the same level of investment in these communities. This is clearly a rough estimate, but nonetheless gives some insight into the level of funding needed in order to develop robust transit service in these communities. Appendix C Elasticity of RTD service What would happen if the region created a region-wide transit pass program, allowing everyone fare-free access to bus and rail service just by showing ID? In order to answer this we need to estimate the elasticity of demand that is, how much does the number of transit trips go up when the fare goes down by 1%? Based on national data, a reasonable estimate is 0.35%. 161 For a large price change, the appropriate method for estimating demand is the midpoint arc elasticity formula 162 ; for a final price of zero, as in an EcoPass program, Fd=(1-ε) Fi1+ ε Here Fd is the final ridership demand, Fi is the initial ridership demand, and ε is the elasticity of demand. For an elasticity of -.35, this gives Fd=2.08Fi Therefore it is reasonable to estimate that a communitywide EcoPass program would approximately double transit ridership. During peak periods, elasticity of demand is lower, because work trips are less responsive to fare changes 163. In other words, a person who needs to get to work, is more likely to take the bus whatever the fare is. Thus, peak demand would not go up as rapidly as total ridership, so much of the effect will be to fill up empty seats on existing routes. Note that this is a rough estimate. The Nederland community pass led to a 45% increase in transit use; the University of Colorado pass program led to a 200% increase. The costs of a community-wide program would be primarily the foregone fare revenue. Currently, RTD s total fare revenue is budgeted at approximately $160 million/year. Without a detailed route-by-route analysis of the likely ridership increases during peak and off-peak periods, it is difficult to estimate the level of new service that would be required or the associated costs. We can get some insight by looking at a community EcoPass feasibility study conducted by Charlier and Associates and Nelson Nygaard for the City of Boulder and Boulder County. 164 In this analysis, the conclusion was that for a county-wide EcoPass the costs for additional service would be about 17% of the costs of lost revenue. If we apply that same percentage here, the additional annual service costs would be $27 million. Thus, the total annual cost would be roughly $187 million. RTD currently has about 100 million trips per year, so we would anticipate around 100 million new trips. Since the total cost is $187 million, the cost per new trip would be only about $1.87 much lower than the cost per new trip from system expansion. Note that adding 100 million trips per year would bring the metro area to approximately 75 trips per capita, well into the range of level A service. 70
71 There are two huge benefits of this approach: vastly improved access for low income residents, and much better use of existing transit service, by filling empty seats. Total cost: $187 million/year ($160 million to replace farebox, $27 million for added service) Appendix D Cars Displaced on I-70 by transit In 2035, Average Daily Traffic on a Winter Weekend is forecast to be 71,850 Eastbound and 78,350 Westbound for the segment of I-70 between Beaver Brook and C With average vehicle occupancy of 2.7 people per car this comes to 193,995 and 211,545 person trips a day. If transit makes up an estimated 4 percent of total trips, 166 this would come to 7,759 and 8,461 transit trips on a winter weekend. Using some hourly traffic distribution data from the RMRA study (Chapter 6) we estimated that peak vehicle traffic (volumes over 3,000 vehicles/hour) makes up 57% of total Eastbound volume and 62% of total Westbound volume and assumed that transit service would mirror peak vehicle times. Then the total number of peak hours in each direction (again when volumes were over 3,000) was factored in to determine how many of the transit trips would be taken during peak hours. Total Transit Trips * % of Trips During Peak Hours / Number of Peak Hours = Transit Trips During Peak Hours. Then the total number of transit trips during peak hours (632 Eastbound and 588 Westbound) was divided by 3 to determine how many peak hour vehicles would be displaced. This is then finally compared to the number of vehicles forecast in 2035 during peak hour on this segment in the I-70 Preferred Environmental Impact Statement (PEIS). Population Density (persons per square mile) Average Daily Traffic Vehicle Person Trips (ADT*3) Transit Trips (4% of Total) % of Trips During Peak Hours Transit Trips during peak hours Cars Displaced / peak hr. Peak Hour Volume Eastbound 0 to 1,000 71, ,995 7,759 57% ,080 Westbound 1,001 < 4,000 78, ,545 8,461 62% ,160 71
72 Notes 1. No reliable study has been done for commuter rail between Denver to Pueblo but a very rough estimate of $25 million per mile results in an estimated cost of $2.8 billion. 2. Colorado Department of Transportation, Interconnectivity Study, 2014, Chapter 6, Page 24 (6-24). High-speedrail for I-25 at $16.6 billion and for I-70 at $13.5. Part of the reason I-25 is larger is that it is bearing the cost ofconnecting the two HSR lines in metro Denver. 3. Ibid. 4. U.S. Department of Transportation Federal Highway Administration, Transportation and Housing Costs (FactSheet), 20 October U.S. Department of Transportation Federal Highway Administration, Transportation and Housing Costs (FactSheet), 20 October U.S. Department of Transportation Federal Highway Administration, Transportation and Housing Costs (FactSheet), 20 October AAA, Your Driving Costs, U.S. Department of Transportation Federal Highway Administration, Transportation and Housing Costs (FactSheet), 20 October F. Kaid Benfield, how Transit, Walkability Help Make Cities More Affordable, Huffington Post, 25 August Rahul Jain, Charles Brecher, Citizens Budget Commission, Location Affordability in Large U.S. Cities, August Eric Jaffe, 7 Charts That Show How Good Mass Transit Can Make a City More Affordable, The Atlantic, 25August Citizens Budget Commission, Housing Affordability Versus Location Affordability, August Eric Jaffe, 7 Charts That Show How Good Mass Transit Can Make a City More Affordable, The Atlantic, 25August Christopher Leinberger and Michael Rodriguez, The George Washington University School of Business, Foot Traffic Ahead, Christopher Leinberger and Michael Rodriguez, The George Washington University School of Business, Foot Traffic Ahead, Christopher Leinberger and Michael Rodriguez, The George Washington University School of Business,Foot Traffic Ahead, Aldo Svaldi, Colorado home prices rising at fastest rate in the country, Denver Post, April 7, Aldo Svaldi, Housing costs outstrip incomes, putting Colorado economy at risk, Denver Post, December13 th, Stephanie Paige Ogburn, Affordable Housing Hard To Come By On Fast Growing Front Range, KUNC, Feb23, The Leadership Conference Education Fund, Getting to Work: Transportation Policy and Access to JobOpportunity, July Christopher MacKechnie, How Much is Too Much for Bus Fare, About Money, 14 February SW Adams County Health Impact Assessment 23. Ibid. 24. Population by Age and Gender - Results. Colorado State Demographers Office. Colorado Dept of Local Affairs, n.d. Web. 02 May The State of Obesity. Adult Obesity in the United States. Accessed at June
73 26. Nate Berg, Longer Commute, Bigger Waistline. The Atlantic. 8 May Nate Berg, Longer Commute, Bigger Waistline. The Atlantic. 8 May Chuck Kooshian and Steve Sinkelman. Center for Clean Air Policy. Growing Wealthier: Smart Growth,Climate Change and Prosperity. January Jay Walljasper, Studies Show that Bike Commuting is one of the Best Ways to Stay Healthy, Grist, 31March Jay Walljasper, Studies Show that Bike Commuting is one of the Best Ways to Stay Healthy, Grist, 31 March United States Census Bureau, American Community Survey 2014, Caiazzo, F., Ashok, A., Waitz, I.A., Yim, S.H.L., and Barrett, S.R.H. (2013, May 31). Air pollution and early deaths in the United States. Part I: Quantifying the impact of major sectors in Atmospheric Environment Journal, 79, , 203. Retrieved from Note: Air pollution causes acute respiratory problems, temporary decreases in lung capacity, and inflamation of lung tissue. In addition, it impairs the body s immune system, reduces the release of oxygen to body tissues, and increases a person s risk of cancer-related death. 33. Steven Arnold, Tim Dileo and Theresa Takushi, Colorado Department of Public Health and Environment, Colorado Greenhouse Gas Inventory 2014 Update Including Projections to 2020& October Steven Arnold, Tim Dileo and Theresa Takushi, Colorado Department of Public Health and Environment, Colorado Greenhouse Gas Inventory 2014 Update Including Projections to 2020& October Union of Concerned Scientists, Vehicles, Air Pollution and Human Health, Union ofconcerned Scientists, 36. American Lung Association, Ozone, American Lung Association, accessed athttp:// healthy-air/outdoor/air-pollution/ozone.html, 3 June Regional Air Quality Council Ozone SIP, chapter 3: American Lung Association. Transportation. 39. People for Bikes, Salt Lake City street removes parking, adds bike lanes and sales go up, accessed at peopleforbikes. org October 5, People for Bikes, Salt Lake City street removes parking, adds bike lanes and sales go up, accessed at peopleforbikes.org October 5, People for Bikes, Salt Lake City street removes parking, adds bike lanes and sales go up, accessed at peopleforbikes.org October 5, Christopher Leinberger and Mariela Alfonzo, The Brookings Institute, Walk This Way, May Colorado Department of Transportation, Assessing Transit Impacts for Colorado s Small and Medium Sized Communities: Two Case Studies Final Report, Mike Salisbury, Southwest Energy Efficiency Project, Economic Benefits of Transit Systems, September A detailed description of the study was published in an article by Locantore et al titled Scenario Analysis Helps Identify Sustainable Land Use And Transportation Policies, published in Projections, Volume 9, MIT Journal of Planning, (2010). 46. Insurance Institute for Highway Safety Highway Loss Data Institute, General Statistics (factsheet), February Insurance Institute for Highway Safety Highway Loss Data Institute, General Statistics (factsheet), February Nicole Gelinas, What Stockholm can Teach L.A. when it Comes to Reducing TrafficFatalities, Los Angeles Times, 7 June Pedestrian Plaza outside Macy s in New York City, Eric Fischer. 50. Nicole Gelinas, What Stockholm can Teach L.A. when it Comes to Reducing TrafficFatalities, Los Angeles Times, 7 June Elvik, R., Christensen, P., and Amundsen, A., Speed and Road Accidents An Evaluation of the Power Model. Oslo, Norway, Transportokonomisk Institutt,
74 52. C.R.S Robert Puentes and Ryan Prince, The Brookings Institution, Fueling Transportation Finance,March Colorado Department of Local Affairs, Inflation / Denver-Boulder-Greeley Consumer Price Index, accessed at June Under SB 228, the transfer is triggered when personal income growth exceeds 5% in a year, but is reduced in years when state revenue levels trigger a TABOR refund, and can be eliminated if the refund exceeds 3% of general fund revenues, Adele Peters, CoExist, New York City s Protected Bike Lanes Have Actually Sped Up Its CarTraffic, 12 September United States Bureau, Population Estimates, accessed at html, 3 June Aldo Svaldi, Colorado s Population Jumped by 101,000 in 12 Months, The Denver Post, 22December Colorado Department of Local Affairs, State Demography Office- Dashboard, accessed athttps://dola.colorado.gov/ demog_webapps/dashboard.jsf. 4 June Jeff Ingles and John Oliver, CoPIRG Foundation and Frontier Group, HighwayBoondoggles 2: More Wasted Money and America s Transportation Future, 19 January Jennifer Reyna, Houston Commute Times Quickly Increasing, Click2Houston, 4 February 2014, archived at web. archive.org/web/ / ng_ Colorado Department of Transportation, Programmatic Environmental Impact StatementExecutive Summary, March Leeds School of Business University of Colorado Boulder, Colorado Business EconomicOutlook 2015, Holly Richmond, Public Transit s Unlikely Advocates? Older Americans, Grist, 29 April Colorado Department of Local Affairs, State Demography Office- Dashboard, accessed athttps://dola.colorado.gov/ demog_webapps/dashboard.jsf. 4 June Colorado Department of Local Affairs, Population by Age and Gender- Parameters, accessedat gov/demog_webapps/pagparameters.jsf. 4 June Tony Dutzik and Jeff Inglis, CoPIRG Foundation Frontier Group, Millennials in Motion:Changing Travel Habits of Young Americans and the Implications for Public Policy, October Tony Dutzik and Jeff Inglis, CoPIRG Foundation Frontier Group, Millennials in Motion:Changing Travel Habits of Young Americans and the Implications for Public Policy, October Kathleen Carey et al, Urban Land Institute, Colorado in 2015: A ULI Survey of Views ofhousing, Transportation, and Community, November Urban Land Institute, Colorado in 2015, November 19, Tony Dutzik, Driving Trends: 2014, Frontier Group, 5 January US Department of Transportation, Federal Highway Administration, Highway Statistics Series2014, December In 2014, Colorado had 3,883,362 licensed drivers, with a total driving agepopulation of 4,244,057 and a total population of 5,355, Tony Dutzik, Driving Trends: 2014, Frontier Group, 5 January Tony Dutzik, Driving Trends: 2014, Frontier Group, 5 January Tony Dutzik, Driving Trends: 2014, Frontier Group, 5 January Denver Regional Council of Governments, Front Range Travel Counts Household SurveyData Release (fact sheet), 20 June Denver Regional Council of Governments, Front Range Travel Counts Household SurveyData Release (fact sheet), 20 June
75 78. Denver Regional Council of Governments, Front Range Travel Counts Household SurveyData Release (fact sheet), 20 June U.S. Department of Transportation, Federal Highway Administration, 2009 Edition Chapter4E. Pedestrian Control Features, accessed athttp://mutcd.fhwa.dot.gov/htm/2009/part4/part4e.htm, 7 June The Federal Manual onuniform Traffic Control Devices estimates that an average person can walk a mile in about 25minutes (the suggested walking speed is 3.5 feet per second or about 2.39 miles per hour) 80. Bike Citizens, Mineapolis, accessed at 7 June American Community Survey, Five year Data, 2014, Table B American Community Survey, Five year Data, 2014, Table B Navigant Research, Autonomous Vehicles Will Surpass 95 million in Annual Sales by 2035(press release), 21 August This cost assumes the complete system we recommend is built and therefore needs to be maintained. If you remove the additional sidewalks we recommend the maintenance costs per year would be lower 85. Max A. Bushell, Bryan W. Poole, Charles V. Zegeer, Daniel A. Rodriguez, UNC Highway Safety Research Center, Costs for Pedestrian and Bicyclist Infrastructure Improvements, October Denver Regional Council of Governments, Front Range Travel Counts Household SurveyData Release (fact sheet), 20 June National Association of City Transportation Officials, Urban Street Design Guide, accessed athttp://nacto.org/ publication/urban-street-design-guide/, 9 June In the TIP, bike and pedestrian projects are considered in one category. Based on project descriptions we have sorted them into: bike, combination bike/pedestrian and pedestrian projects (and eliminated the pedestrian projects). The combination bike/pedestrian projects are generally infrastructure such as underpasses, bridges and multi-modal paved trails. 89. Note there will be some overlap between these projects and the sidewalk numbers we calculated in the walking section. However, the overlap should be small since most of these project s costs are more than the cost of a sidewalk. 90. Pikes Peak Area Council of Governments, Long Range Plan, accessed athttp:// 7 June For the cycling section we have used a slightly broader definition of urban area than is used in the walking section. The 2010 census definition includes unincorporated areas of counties that fall within major metropolitan areas: such as the unincorporated areas of Adams, Arapahoe, Douglas and Jefferson counties which together account for 566,000 residents. While these areas may be slightly more isolated and not ideal for pedestrian infrastructure but they generally are within biking distance of more urban areas and so we felt it prudent to include them in our estimate. 92. Data on levels of unfunded bicycle and pedestrian projects was researched for the other MPOs in the state but generally data was unavailable or insufficient. Other MPOs with smaller TIP funding pools, may have only had one or two unfunded bicycle and pedestrian projects making it difficult to extrapolate regional demand. Other MPOs have a less formal call for projects so there is not a list of unfunded projects to evaluate. Regarding Regional Transportation Plans, only DRCOG, PPACG and Mesa County included a Vision Bike and Ped component with some information funding levels required to meet the Vision level of bike infrastructure. Pedestrian funding was also pulled out where identified 93. American Community Survey, Five year Data, 2014, Table B The League of American Bicyclists, Award Database, accessed athttp:// 7 June This figure assumes that the approximately $16.5 million already identified in the Master Bike Plans for Aurora, Boulder, Denver, Durango, Fort Collins, Greeley and Loveland is already funded. 96. Commuting Solutions, U.S. 36 Bikeway: New Highway for Cyclists, accessed athttp://36commutingsolutions.org/us- 36-projects/u-s-36-bikeway/, 7 June U.S. Department of Transportation, Highway Statistics 2014, accessed athttp:// statistics/2014/hm20.cfm, 7 June
76 98. Colorado Department of Transportation, State of Transportation in Colorado, March Institute for Transportation and Development Policy, The Bike Sharing Planning Guide (press release), 5 December Toole Design Group and Pedestrian and Bicycle Information Center, Colorado Department of Transportation, State of the Practice and Guide to Implementation, September (2,135,979 people) - The population of the 20 largest cities in Colorado plus those cities that have received a rating from the League of American Bicyclists totals just over 3 million. As Denver, Fort Collins, Boulder and Aspen leaves 2.1 million residents in areas that would most benefit from a bike share program The $3.1 million annual maintenance number assume the buildout would happen over 25years and not all at once. Once all the bike shares are up and running in 2040 the totalmaintenance costs would be $6.3 million, but the average cost over that time comes out to $3.1million No reliable study has been done for commuter rail between Denver to Pueblo but a very rough estimate of $25 million per mile results in an estimated cost of $2.8 billion 105. Felsburg Holt & Ullevig, Colorado Department of Transportation Division of Transit and Rail, Statewide Transit Plan: Connecting People Across Colorado, March Denver Regional Council of Governments, 2040 Fiscally Constrained Transportation Plan,18 February Future Construction FasTracks Corridors Federal Funding Analysis, RTD, available at FileOpen.aspx? 108. Ibid Denver Regional Council of Governments, 2035 Metro Vision Transit Element 16 February2011 p Southwest Energy Efficiency Project, Considering a Regional Network of Bus Rapid Transitin the Denver Metro Area, October 2014, Table City and County of Denver, East Colfax Alternatives Analysis, Walk Denver and Mile High Connect and BBC Research & Consulting, First and Last Mile:Funding Needs and Priorities for Connecting People to Transit, 13 July RTD 2011 Customer Satisfaction Survey, Demographic Comparisons, Annual Household Income; US Census. Table B19011: Household Income in the Past 12 Months, American Community Survey 5-Year Estimates for the Denver-Aurora-Boulder Combined Statistical Area Brown et al, Unlimited Access, Institute of Transportation Studies, Volume(Issue) , Digital Object Identifier, Will Toor and Spenser Havlick, Transportation for Sustainable Campus Communities, (Washington, Dc, Island Press, 2004) See APPENDIX C for a detailed analysis Note that this is a rough estimate. The Nederland community pass led to a 45% increase in transit use; the University of Colorado pass program led to a 200% increase Regional Transportation District, RTD 2016 Adopted Budget, as seen at: financialreports/rtd-adopted-budget-2016.pdf 119. Charlier Associates, Inc., Boulder County, Countywide Ecopass Feasibility Study, FinalReport, January Steer Davies Gleave, City of Colorado Springs Transit Service Division, Colorado Springs2040 Regional Transportation Plan. July Transit Plan Appendices, transit_appendixa_verfinal2.pdf 122. Adrian Garcia, Fort Collins 12th among fastest-growing metros, Coloradoan, March 27,
77 123. City of Fort Collins, TransFort Strategic Plan, accessed athttp:// 7 June City of Fort Collins, TransFort Strategic Plan, accessed athttp:// 7 June Pueblo Area Council of Governments, Chapter 5 Coordinated Public Transit-HumanServices Transportation Element, Intermountain TPR Regional transit Plan, page Assumes a population of approximately 83,000 residents based on the cities listed Studying and then creating an express lane along the westbound shoulder has been prioritized for implementation when funding is available I-70 Mountain Corridor Final PEIS Cost Estimates_TR Page 46/ PEIS_Transportation_Analysis_TR Table Colorado Statewide Intercity and Regional Bus Network Study. Appendix A: I-70 Mountain Corridor Analysis Population by Age and Gender - Results. Colorado State Demographers Office. Colorado Dept of Local Affairs, n.d. Web. 02 May The National Transit Database (NTD). Federal Transit Administration. National Transit Database, n.d. Web. 02 May Population by Age and Gender - Results. Colorado State Demography Office. Colorado Dept of Local Affairs, n.d. Web. 02 May Godavarthy, Ranjit Prasad, Jeremy Mattson, and Elvis Ndembe. Cost Benefit Analysis of Rural and Small Urban Transit in the United States. Transportation Research Record: Journal of the Transportation Research Board 2533 (2015): National Center for Transit Research, 01 July Web. 02 May No reliable study has been done for commuter rail between Denver to Pueblo but a very rough estimate of $25 million per mile results in an estimated cost of $2.8 billion 138. The original EIS for the corridor was published in 2011, but in 2015 an update was completed for the cost of the commuter rail which revised the cost estimates. CDOT. North I-25 Commuter Rail Update. projects/north-i-25-eis/north-i25-commuter-railupdate Note: comparing these studies is not an apples to apples comparison. They use widely different assumptions that influence both cost and ridership estimates and there is no common baseline for ridership amongst the many studies Rocky Mountain Rail Authority, High Speed Rail Feasibility Study, March 2010, Chapter 8 -Capital Costs Rocky Mountain Rail Authority, High Speed Rail Feasibility Study, March 2010, Chapter 8.Capital Costs Rocky Mountain Rail Authority, High Speed Rail Feasibility Study, March 2010, OperatingCosts Rocky Mountain Rail Authority, High Speed Rail Feasibility Study, March 2010, Chapter 6.Travel Demand Rocky Mountain Rail Authority, High Speed Rail Feasibility Study, March 2010, Chapter 6.Travel Demand Rocky Mountain Rail Authority, High Speed Rail Feasibility Study, March 2010, Chapter 6Travel Demand 146. Colorado Department of Transportation, January 2014, Exhibit Colorado Department of Transportation, January 2014, Exhibit Colorado Department of Transportation, January 2014, Exhibit Colorado Department of Transportation, January 2014, Exhibit Colorado Department of Transportation, January 2014, Exhibit
78 151. Wikipedia, Ski Train, accessed on June 7, Denver Regional Council of Governments, 2040 Fiscally Constrained Regional Transportation Plan, 18 February, 2015 Shows that DRCOG projects approximately $100 billion to be spent just in Denver region Frontier Group and CoPIRG Foundation, Who Pays for Roads, Spring 2015, page Based on approximately $300 million/year to CDOT shown in the 2040 statewide transportation plan and approximately $250 million/year for transit shown in the 2040 state transit plan Colorado Association of Transit Agencies US36 Commuting Solutions, The State of Transportation in Colorado, reviewed on 3 July Denver Regional Council of Governments, 2040 Fiscally Constrained Regional Transportation Plan, 18 February, 2015 Shows that DRCOG projects approximately $100 billion to be spent just in Denver region CO_April_2014.pdf 159. Todd Litman, Multimodal Level of Service Indicators, Online TDM Encyclopedia, tdm129.htm 160. Todd Litman, Victoria Transport Policy Institute, Transit Price Elasticities and Cross-Elasticities, 11 May Richard H. Pratt, Chapter 1 - Introduction, TCRP Report 95: Traveler Response to Transportation System Changes (2013), Litman, ibid 163. Boulder County,Countywide Ecopass Feasibility Study, Final Report, I-70 Mountain Corridor PEIS Travel Demand Technical Report, Appendix E. Table E I-70 Mountain Corridor PEIS Comparison of Alternatives 78
79 79

80 80
FACTS AND FIGURES: MAKING THE CASE FOR COMPLETE STREETS IN LEE COUNTY
 FACTS AND FIGURES: MAKING THE CASE FOR COMPLETE STREETS IN LEE COUNTY Safety: Close to 5,000 pedestrians and bicyclists die each year on U.S. roads, and more than 70,000 are injured. [Mean Streets, Surface
Improving Mobility Without Building More Lanes
 Improving Mobility Without Building More Lanes By Mike Salisbury and Will Toor July 2017 Copyright 2017 by Southwest Energy Efficiency Project. All rights reserved. Photo: Courtesy of the Denver Post Anyone
2015 Florida Main Street Annual Conference. Complete Streets Equal Stronger Main Streets
 WHAT ARE COMPLETE STREETS? CASE STUDIES COMPLETING YOUR MAIN STREET 2015 Florida Main Street Annual Conference St. Petersburg, Florida August 19, 2015 WHAT ARE COMPLETE STREETS? CASE STUDIES COMPLETING
2. Context. Existing framework. The context. The challenge. Transport Strategy
 Transport Strategy Providing quality connections Contents 1. Introduction 2. Context 3. Long-term direction 4. Three-year priorities 5. Strategy tree Wellington City Council July 2006 1. Introduction Wellington
Perryville TOD and Greenway Plan
 Perryville TOD and Greenway Plan Greenway Glossary Pathway: A bicycle and pedestrian path separated from motorized vehicular traffic by an open space, barrier or curb. Multi-use paths may be within the
PEOPLE ARE PEDESTRIANS BY DESIGN JOIN THE MOVEMENT AT
 PEOPLE ARE PEDESTRIANS BY DESIGN JOIN THE MOVEMENT AT WWW.WALKDENVER.ORG Our Vision: In 2040, Denver will be the most walkable city in the United States. As a result, its residents will be the country
Regional Transportation Needs Within Southeastern Wisconsin
 Regional Transportation Needs Within Southeastern Wisconsin #118274 May 24, 2006 1 Introduction The Southeastern Wisconsin Regional Planning Commission (SEWRPC) is the official areawide planning agency
NASHUA REGIONAL PLANNING COMMISSION REGIONAL BICYCLE AND PEDESTRIAN PLAN
 NASHUA REGIONAL PLANNING COMMISSION REGIONAL BICYCLE AND PEDESTRIAN PLAN June, 2005 Prepared by the Nashua Regional Planning Commission 2005 NRPC Regional Bicycle and Pedestrian Plan- JUNE 2005 ACKNOWLEDGEMENTS
May 12, 2016 Metro Potential Ballot Measure Issue Brief: Local Return
 Summary: Local return is an important revenue source for cities to maintain their local transportation infrastructure. Most cities use their local return to operate small bus systems and repave streets,
BUILDING THE CASE FOR TRAVEL OPTIONS IN WASHING TON COUNTY. Image: Steve Morgan. Image: Steve Morgan
 BUILDING THE CASE FOR TRAVEL OPTIONS IN WASHING TON COUNTY Image: Steve Morgan Image: Steve Morgan Image: TriMet Image: TriMet WHAT ARE TRAVEL OPTIONS PROGRAMS? Travel options programs encourage residents,
PEDESTRIAN ACTION PLAN
 ATTACHMENT 2 CITY OF SANTA MONICA PEDESTRIAN ACTION PLAN CITY OF SANTA MONICA PEDESTRIAN ACTION PLAN This page intentionally left blank EXECUTIVE SUMMARY CHAPTER 1 EXECUTIVE SUMMARY Setting the Stage
WILMAPCO Public Opinion Survey Summary of Results
 Wilmington Area Planning Council WILMAPCO Public Opinion Survey Summary of Results Prepared by: 2955 Valmont Road, Suite 300 Boulder, Colorado 80301 t: 303-444-7863 f: 303-444-1145 www.n-r-c.com Table
CITY OF BLOOMINGTON COMPLETE STREETS POLICY
 CITY OF BLOOMINGTON COMPLETE STREETS POLICY POLICY OBJECTIVE: The City of Bloomington will enhance safety, mobility, accessibility and convenience for transportation network users of all ages and abilities,
Chapter 5. Complete Streets and Walkable Communities.
 Chapter 5. Complete Streets and Walkable Communities. 5.1 Description of Complete Streets. Cities throughout the world, and specifically the United States, are coming to embrace a new transportation and
Transportation Master Plan Advisory Task Force
 Transportation Master Plan Advisory Task Force Network Alternatives & Phasing Strategy February 2016 BACKGROUND Table of Contents BACKGROUND Purpose & Introduction 2 Linking the TMP to Key Council Approved
Proposed. City of Grand Junction Complete Streets Policy. Exhibit 10
 Proposed City of Grand Junction Complete Streets Policy Exhibit 10 1 City of Grand Junction Complete Streets Policy Vision: The Complete Streets Vision is to develop a safe, efficient, and reliable travel
Purpose and Need. Chapter Introduction. 2.2 Project Purpose and Need Project Purpose Project Need
 Chapter 2 Purpose and Need 2.1 Introduction The El Camino Real Bus Rapid Transit (BRT) Project (Project) would make transit and other transportation improvements along a 17.6-mile segment of the El Camino
What s Health Got to Do With It? Health and Land Use Planning
 What s Health Got to Do With It? Health and Land Use Planning CANDACE RUTT, PH.D. EXECUTIVE DIRECTOR APRIL 13 TH, 2016 Planning and Public Health Planning + Public Health Healthy Communities Healthier
Complete Streets 101: The Basics
 Complete Streets 101: The Basics Michigan Municipal League - Capital Conference March 21, 2017 Chip Smith, AICP - Senior Planner - Wade Trim Inc. and City Council member City of Ann Arbor 2017 MML Capital
Cities Connect. Cities Connect! How Urbanity Supports Social Inclusion
 Cities Connect! How Urbanity Supports Social Inclusion Todd Litman Victoria Transport Policy Institute Metropolis Toronto, Canada - 14 June 2006 Cities Connect People with people. People with jobs. People
Balboa Area Transportation Demand Management
 Balboa Area Transportation Demand Management April 2016 Presented by: Jeff Tumlin What Are We Aiming For? Transportation is not an end in itself. It is merely a means by which we support the community.
Appendix T 1: Additional Supporting Data
 Appendix T 1: Additional Supporting Data Project Delivery Delays with the implementation of the 2000 TIP became apparent early in the decade. In response to direction among policy officials, ARC began
The best indicator of an individual s and expanding access to parks and open space.
 Health & Wellness Create a Safe and Healthy Built Environment Artist s rendering, 2014 Health is important to Loveland residents, and stakeholders see the many strong connections between quality of life,
Typical Rush Hour Commute. PennyforTransportation.com
 Typical Rush Hour Commute In the News Overview of the Plan Collaborative plan with projects in every community Prioritizing connectivity and congestion relief Dedicated transportation-specific funding;
Prioritizing Transportation Policy and Funding for Active Transportation, Safety, Equity and Health
 Mayor Karl Dean, Chairman Prioritizing Transportation Policy and Funding for Active Transportation, Safety, Equity and Health Leslie A. Meehan, AICP Planning and Implementing the Active Community Webinar
Cascade Bicycle Club Strategic Plan
 The Greater Context Bicycling has become fundamentally important as large-scale currents of change threaten the health, economy and livability of communities throughout the United States and the world
Multimodal Transportation Plan
 Multimodal Transportation Plan The Multimodal Transportation Plan will accommodate MILLENIALS ARE DRIVING LESS. WE CANNOT BUILD OUR WAY all modes of transportation by keeping pedestrians, OUT OF CONGESTION.
Transportation Issues Poll for New York City
 2016-17 Transportation Issues Poll for New York City 82% support Vision Zero and reducing traffic deaths 72% on average, support more street space for children to play, protected bike lanes and other safety
Cherry Creek Transportation and Land Use Forum September 25, 2013 Meeting Summary
 Cherry Creek Transportation and Land Use Forum September 25, 2013 Meeting Summary I. LEAD-IN TO SMALL GROUP DISCUSSION, POLLING AND STEERING COMMITTEE/TECHNICAL TASK FORCE DISCUSSION The meeting began
EXECUTIVE SUMMARY. Vision
 Vision Walking and bicycling in Salt Lake City will be safe, convenient, comfortable, and viable transportation options that connect people to places, foster recreational and economic development opportunities,
About the Active Transportation Alliance
 About the Active Transportation Alliance Chicagoland s voice for better biking, walking and transit Founded 1985 7,000 members, ~33 full time staff Serve Chicago metro region 1 More Cars, More Driving
City of Novi Non-Motorized Master Plan 2011 Executive Summary
 City of Novi Non-Motorized Master Plan 2011 Executive Summary Prepared by: February 28, 2011 Why Plan? Encouraging healthy, active lifestyles through pathway and sidewalk connectivity has been a focus
2045 Long Range Transportation Plan. Summary of Draft
 2045 Long Range Transportation Plan Summary of Draft Fredericksburg Area Metropolitan Planning Organization The George Washington Region includes the City of Fredericksburg and the counties of Caroline,
Governor s Transportation Vision Panel
 Office of Governor Kate Brown Governor s Transportation Vision Panel JLA Public Involvement Project Overview The is a yearlong effort to develop a series of recommendations for the Governor that address
Detroiters need to be able to conveniently and reliably get to work, school, church, stores, and parks.
 Environment & MOBILITY Detroiters need to be able to conveniently and reliably get to work, school, church, stores, and parks. Several surveyed challenges related to lack of mobility ranked in the top
PEDALING FORWARD. A Glance at the SFMTA s Bike Program for SFMTA.COM
 PEDALING FORWARD A Glance at the SFMTA s Bike Program for 2017-2021 SFMTA.COM INTRODUCTION About This Booklet More people from all walks of life see their bicycle as a more convenient way to get where
ORDINANCE NO
 1 Sponsored by: Councilmembers Stan Flemming, Connie Ladenburg, and Rick Talbert 2 Requested by: Executive/Public Works and Utilities - Transportation Services 3 4 5 6 7 10 11 ORDINANCE NO. 2014-445 12
5. Pedestrian System. Accomplishments Over the Past Five Years
 5. Pedestrian System Accomplishments Over the Past Five Years The Alamo Area Metropolitan Planning Organization (MPO) and its partner agencies recognize the importance of improving pedestrian mobility.
NACTO Designing Cities 2014 Dongho Chang, City Traffic Engineer October 23, 2014
 NACTO Designing Cities 2014 Dongho Chang, City Traffic Engineer October 23, 2014 Presentation overview Perspective on Safety Changing needs of our cities How Seattle is meeting those needs Challenge for
Town of Superior. Superior Trails Plan
 Part 1 Base Information 1. Project Title US 36 Bikeway Extension 2. Project Start/End points or Geographic Area Provide a map with submittal, as appropriate 3. Project Sponsor (entity that will construct/
Dear City Council Members,
 From: Bob Kenyon [mailto: ] Sent: Monday, February 08, 2016 10:20 AM To: City Clerk Subject: Please prioritize Caltrain and a complete transit network Thank you for prioritizing bringing BART to San Jose
PERFORMANCE ANALYSIS of The Draft 2015 CLRP
 Item 9 PERFORMANCE ANALYSIS of The Draft CLRP Presentation to the Transportation Planning Board September 16, CLRP Performance Analysis 1 What is the Long-Range Transportation Plan (CLRP)? The CLRP identifies
Bicycle and Pedestrian Plans and Improvements
 Bicycle and Pedestrian Plans and Improvements Presented to the City Council By Randle Harwood, Planning and Development, and Richard Zavala, Parks and Community Services September 24, 2013 Purpose Review
Base Information. 1. Project Title SH7/East Arapahoe Multi-Use Path and Transit Stop Improvements. 2. Project Start/End points or Geographic Area
 Part 1 Base Information 1. Project Title SH7/East Arapahoe Multi-Use Path and Transit Stop Improvements 2. Project Start/End points or Geographic Area 38 th /Marine streets to Cherryvale Road (See attached
How To Encourage More Efficient Transportation in Brazilian Cities
 How To Encourage More Efficient Transportation in Brazilian Cities Todd Litman Victoria Transport Policy Institute Presented Seminar on Discouraging The Use Of Cars São Paulo, Brazil 3 September 2013 Creating
Better Market Street Project Update. Urban Forestry Council September 17, 2014
 Better Market Street Project Update Urban Forestry Council September 17, 2014 Project Area Limits Better Market Street Schedule Market Street City s busiest transit corridor Over 85 buses per hour 14 surface
El Paso County 2040 Major Transportation Corridors Plan
 El Paso County 2040 Major Transportation Corridors Plan Connect-our-County Online Transportation User Survey Preliminary Results June 24, 2010 Years of Residence 2. How many years have you LIVED HERE?
Bicycle Master Plan Goals, Strategies, and Policies
 Bicycle Master Plan Goals, Strategies, and Policies Mobilizing 5 This chapter outlines the overarching goals, action statements, and action items Long Beach will take in order to achieve its vision of
A District Council of the Urban Land Institute
 A District Council of the Urban Land Institute Thank you to our sponsors! A District Council of the Urban Land Institute Thank you to our Community Partners! A District Council of the Urban Land Institute
Chapter 2. Bellingham Bicycle Master Plan Chapter 2: Policies and Actions
 Chapter 2 Bellingham Bicycle Master Plan Chapter 2: Policies and Actions Chapter 2: Policies and Actions The Bicycle Master Plan provides a road map for making bicycling in Bellingham a viable transportation
DANGEROUS BY DESIGN MARYLAND. Solving the Epidemic of Preventable Pedestrian Deaths (And Making Great Neighborhoods)
") DANGEROUS BY DESIGN 2011 MARYLAND Solving the Epidemic of Preventable Pedestrian Deaths (And Making Great Neighborhoods) DANGEROUS BY DESIGN 2011 Maryland T4AMERICA.ORG Between 2000 and 2009, 1,057 people
DANGEROUS BY DESIGN 2011 MARYLAND Solving the Epidemic of Preventable Pedestrian Deaths (And Making Great Neighborhoods) DANGEROUS BY DESIGN 2011 Maryland T4AMERICA.ORG Between 2000 and 2009, 1,057 people
Bristol City Council has produced a draft Bristol Transport Strategy document.
 Bristol Transport Strategy Summary Document Introduction Bristol City Council has produced a draft Bristol Transport Strategy document. The Strategy fills a gap in transport policy for Bristol. We have
Public Consultation Centre For. Transportation Master Plan Update. Information Package
 Public Consultation Centre For Transportation Master Plan Update Information Package Date Location Hours Tuesday, September 12, 2017 Wednesday, September 13, 2017 Tuesday, September 19, 2017 Cambridge
Summary of Feedback Received during Speak Up Broward s 22 Speakers Bureau Engagements from December 10, 2013 through April 2, 2014
 Summary of Feedback Received during Speak Up Broward s 22 Speakers Bureau Engagements from December 10, 2013 through April 2, 2014 Broward County Transit (BCT): Concerns for the safety of children particularly
APPENDIX C. Systems Performance Report C-1
 APPENDIX C Systems Performance Report C-1 System Performance Report & Requirements According to the FAST Act, a long range transportation plan needs to include a system performance report and subsequent
TRANSIT & NON-MOTORIZED PLAN DRAFT FINAL REPORT Butte County Association of Governments
 1 INTRODUCTION Maintaining a high quality of life is the essence of this plan for transit and non-motorized transportation in Butte County. Curbing greenhouse gas emissions (GHG) by reducing congestion,
Thank you for this opportunity to discuss with you how we can work together to make our streets more complete.
 Thank you for this opportunity to discuss with you how we can work together to make our streets more complete. 1 2 3 Thank you for this opportunity to discuss with you how we can work together to make
WALKNBIKE DRAFT PLAN NASHVILLE, TENNESSEE EXECUTIVE SUMMARY NASHVILLE, TENNESSEE
 NASHVILLE, TENNESSEE EXECUTIVE SUMMARY Executive Summary A world-class multi-modal transportation system is essential to a vibrant city and better quality of life. -Mayor Barry The WalknBike plan aims
Berkeley Strategic Transportation Plan A-76
 Berkeley Strategic Transportation Plan A-76 Appendices 1. A Team Effort 2. Where We ve Been A-11 Berkeley Strategic Transportation Plan Alameda County Transportation Plan Alameda County will be served
Goal 3: Foster an environment of partnerships and collaboration to connect our communities and regions to one another.
 Non-Motorized Transportation Plan (NMTP) Draft Vision, Goal and,, Tri-County Regional Planning Commission (TCRPC) Purpose The purpose of the Tri-County Regional Planning Commission (TCRPC) Non-Motorized
GRAHAM PEDESTRIAN TRANSPORTATION PLAN
 GRAHAM PEDESTRIAN TRANSPORTATION PLAN Chapter 1 I 1.1 Scope and Purpose n March of 2005, the City of Graham contracted with Greenways Incorporated (GWI) to create a Pedestrian Transportation Plan. The
Building a Toronto that Moves
 Building a Toronto that Moves Image courtesy of the City of Toronto Setting Election Priorities for Walking, Cycling & Public Transit Toronto is a fast-paced, dynamic city. It s a city that moves except
Corpus Christi Metropolitan Transportation Plan Fiscal Year Introduction:
 Introduction: The Safe, Accountable, Flexible, Efficient Transportation Equity Act: A Legacy for Users (SAFETEA-LU) has continued the efforts started through the Intermodal Surface Transportation Efficiency
Performance Criteria for 2035 Long Range Transportation Plan
 Minimizing Impacts on Natural, Historic, Cultural or Archeological Resources 2035 LRTP Weighting Factor: 7% Objective 1.1: Use appropriate planning and design criteria to protect and enhance the built
Pocatello Regional Transit Master Transit Plan Draft Recommendations
 Pocatello Regional Transit Master Transit Plan Draft Recommendations Presentation Outline 1. 2. 3. 4. What is the Master Transit Plan? An overview of the study Where Are We Today? Key take-aways from existing
International Journal of Research (IJR) Vol-1, Issue-8, September *
 Vol-1, Issue-8, September *") Development towards Sustainable Transportation Planning in India through Management of Non-motorized Transport Akshay Patil 1 * & 2 * 1 3 rd year B. Tech Planning student at College of Engineering Pune,
Development towards Sustainable Transportation Planning in India through Management of Non-motorized Transport Akshay Patil 1 * & 2 * 1 3 rd year B. Tech Planning student at College of Engineering Pune,
Community Task Force July 25, 2017
 Community Task Force July 25, 2017 Welcome and Introductions Project Partners Regional Transportation District (RTD) Colorado Department of Transportation (CDOT) Denver Regional Council of Governments
Passenger Rail in Virginia
 Passenger Rail in Virginia Executive Summary! In 2011, Washington DC-VA-MD ranked 1st in the U.S. per auto commuter in the following categories:1 o Yearly Delay; 67 hours o Excess Fuel; 32 gallons o Congestion
Lisa Quinn Executive Director
 Transforming Injury and Violence Prevention: Innovations in Policy, Practice, and Partnerships Advocating for Prevention: Enacting and Reacting to Legislation Lisa Quinn Executive Director Feet First works
Agenda. Overview PRINCE GEORGE S PLAZA METRO AREA PEDESTRIAN PLAN
 PRINCE GEORGE S PLAZA METRO AREA PEDESTRIAN PLAN May 28, 2008 Agenda Welcome and introductions Project overview and issue identification Planning context and strengths Design challenges and initial recommendations
CHAPTER 1 INTRODUCTION
 CHAPTER 1 INTRODUCTION Chapter Table of Contents THE 2017 HOUSTON BIKE PLAN 1-1 HOUSTON BIKEWAYS PROGRAM 1-2 HISTORY OF BICYCLE PLANNING IN HOUSTON 1-3 BICYCLE LEVEL OF COMFORT 1-3 EXISTING PLANS, PROGRAMS
RESOLUTION NO ?? A RESOLUTION OF THE CITY OF NEPTUNE BEACH ADOPTING A COMPLETE STREETS POLICY
 RESOLUTION NO. 2018-?? A RESOLUTION OF THE CITY OF NEPTUNE BEACH ADOPTING A COMPLETE STREETS POLICY WHEREAS, safe, convenient, and accessible transportation for all users is a priority of the City of Neptune
CML s 91 st Annual Conference June 18 21, 2013 Vail, Colorado. Why a Campaign? Learn More. City of Brush! 6/13/2013
 REVITALI ZE Your Community with LiveWell Colorado s HEAL Cities & Towns Campaign CML s 91 st Annual Conference June 18 21, 2013 Vail, Colorado Vicky Quinlin, Council Member, Brush! Monty Torres, City Administrator,
City of Jacksonville Mobility Fee Update
 City of Jacksonville Mobility Fee Update 2017 Preliminary Analysis May 3, 2017 Carnival Cruise lines photo credit Presentation Overview Public Outreach Process Pedestrian and Bicycle Master Plan Study
Transportation and Equity: A 2017 Agenda for Candidates
 In New York, mobility is opportunity. We have succeeded as a global leader in social justice, economic growth and environmental sustainability by investing for more than a century in comprehensive, reliable
Public Works AGENDA ITEM D-2 STAFF REPORT
 AGENDA ITEM D-2 Public Works STAFF REPORT Transportation Master Plan Oversight and Outreach Committee Meeting Date: 10/30/2017 Staff Report Number: 17-001-TMP Regular Business: Provide feedback on Performance
1999 On-Board Sacramento Regional Transit District Survey
 SACOG-00-009 1999 On-Board Sacramento Regional Transit District Survey June 2000 Sacramento Area Council of Governments 1999 On-Board Sacramento Regional Transit District Survey June 2000 Table of Contents
TR NEWS. Public Health and Transportation. Innovation, Intervention, and Improvements NUMBER 299 SEPTEMBER OCTOBER 2015
 TR NEWS NUMBER 299 SEPTEMBER OCTOBER 2015 Public Health and Transportation Innovation, Intervention, and Improvements Public Health and Transportation Measuring the Health Benefits of Walking and Bicycling
AMATS Complete Streets Policy
 AMATS Complete Streets Policy Table of Contents: Section 1. Definition of Complete Streets Section 2. Principles of Complete Streets Section 3. Complete Streets Policy Section 4. Consistency Section 5.
Chapter 7. Transportation. Transportation Road Network Plan Transit Cyclists Pedestrians Multi-Use and Equestrian Trails
 Chapter 7 Transportation Transportation Road Network Plan Transit Cyclists Pedestrians Multi-Use and Equestrian Trails 7.1 TRANSPORTATION BACKGROUND The District of Maple Ridge faces a number of unique
Kentucky s Surface Transportation System
 Kentucky s Surface Transportation System ROAD AND BRIDGE CONDITIONS, TRAFFIC SAFETY, TRAVEL TRENDS, AND NEEDS MARCH 2018 PREPARED BY WWW.TRIPNET.ORG Founded in 1971, TRIP of Washington, DC, is a nonprofit
Urban planners have invested a lot of energy in the idea of transit-oriented
 DOES TRANSIT-ORIENTED DEVELOPMENT NEED THE TRANSIT? D A N I E L G. C H AT M A N Urban planners have invested a lot of energy in the idea of transit-oriented developments (TODs). Developing dense housing
Reflections on our learning: active travel, transport and inequalities
 Reflections on our learning: active travel, transport and inequalities Jill Muirie Glasgow Centre for Population Health Active travel definition Active travel refers to walking, cycling or using some other
DANGEROUS BY DESIGN WISCONSIN. Solving the Epidemic of Preventable Pedestrian Deaths (And Making Great Neighborhoods)
") DANGEROUS BY DESIGN 2011 WISCONSIN Solving the Epidemic of Preventable Pedestrian Deaths (And Making Great Neighborhoods) DANGEROUS BY DESIGN 2011 Wisconsin T4AMERICA.ORG Dangerous by Design 2011: Wisconsin
DANGEROUS BY DESIGN 2011 WISCONSIN Solving the Epidemic of Preventable Pedestrian Deaths (And Making Great Neighborhoods) DANGEROUS BY DESIGN 2011 Wisconsin T4AMERICA.ORG Dangerous by Design 2011: Wisconsin
Goals, Objectives, and Policies
 Goals, Objectives, and Policies ADVISORY GROUP INPUT PUBLIC INPUT SNS PREVIOUS STUDIES RBPP Goals Vision Statement Southern Nevada will develop a safe, connected, and convenient walking and bicycling system
Complete streets serve the 1/3 of Hoosiers who do not drive.
 Complete Streets Complete streets are safe, comfortable and convenient for all users, including pedestrians, bicyclists, motorists and public transit riders, regardless of age or ability. Complete streets
T1-A - Service Reduction (Re-sizing)
") Key T1-A Choice A Key T1-B Choice B Key T1-C Choice C Key T1-D Choice D Key T1-E Choice E Key T1-F Choice F Key Choice G T2 T1-A - Service Reduction (Re-sizing) Description This key choice would represent
Key T1-A Choice A Key T1-B Choice B Key T1-C Choice C Key T1-D Choice D Key T1-E Choice E Key T1-F Choice F Key Choice G T2 T1-A - Service Reduction (Re-sizing) Description This key choice would represent
Win-Win Transportation Solutions
 Win-Win Transportation Solutions Todd Litman Victoria Transport Policy Institute Presented Lipinski Symposium on Transportation Policy Chicago, Illinois 15 October 2007 What is The Transportation Problem?
City of Jeffersonville Complete Streets Workshop
 City of Jeffersonville Complete Streets Workshop Planning for a Healthy Community Proudly brought to you by: WORKSHOP OVERVIEW 1. Complete Streets 101 2. Bloomington-Monroe County MPO Policy 3. Mobile
WALK- AND bike-friendly TURLOCK
 WALK- AND bike-friendly TURLOCK Ideas to Encourage Walking and Biking Benefits to the COMMUNITY Get Connected People who walk and bike have many more opportunities for casual interactions with friends
4 Ridership Growth Study
 Clause 4 in Report No. 15 of Committee of the Whole was adopted, without amendment, by the Council of The Regional Municipality of York at its meeting held on November 16, 2017. 4 Ridership Growth Study
MASTER BICYCLE AND PEDESTRIAN PLAN
 VILLAGE OF NORTHBROOK MASTER BICYCLE AND PEDESTRIAN PLAN DRAFT PLAN OPEN HOUSE May 2, 2018 AGENDA 1. Community Engagement 2. Vision and Goals 3. General Structure of Plan 4. Recommendations Overview 5.
Congestion Evaluation Best Practices
 Congestion Evaluation Best Practices Todd Litman Victoria Transport Policy Institute Presented International Transportation and Economic Development Conference 10 April 2014 Congestion Indicators Indicator
 Time of Change We Are Growing We Are An Attractive Place To Live We Are Age Diverse + Living Longer 50000 40000 30000 20000 10000 0 2010 Census Job Density Housing Sheds Transit Sheds The Project FUNDING
Tulsa Metropolitan Area LONG RANGE TRANSPORTATION PLAN
 Tulsa Metropolitan Area LONG RANGE TRANSPORTATION PLAN Indian Nations Council of Governments August 2005 CONTACTING INCOG In developing the Destination 2030 Long Range Transportation Plan, INCOG s Transportation
Economics of Highway Spending and Traffic Congestion. Todd Litman Victoria Transport Policy Institute Presented Strong Towns Webinar 3 February 2016
 Economics of Highway Spending and Traffic Congestion Todd Litman Victoria Transport Policy Institute Presented Strong Towns Webinar 3 February 2016 Motor Vehicle Travel is Peaking Annual Vehicle Mileage
WELCOME. City of Greater Sudbury. Transportation Demand Management Plan
 WELCOME City of Greater Sudbury Transportation Demand Management Plan Public Consultation Session St. Andrew s Place, Activity Hall 111 Larch Street Wednesday September 13, 2017 6:00 to 8:00 pm Welcome
MOBILITY RESULTS AREA. Budgeting For Outcomes Council Presentation January 12, 2007
 MOBILITY RESULTS AREA Budgeting For Outcomes Council Presentation January 12, 2007 Mobility Results Team Members 2 Hammond Perot, OED, Co-Team Leader Bonnie Meeder, DEV (returning), Co-Team Leader Peer
North Coast Corridor:
 North Coast Corridor: Connecting People, Transportation & Environment Legislative Hearing: 11.8.10 1 North Coast Corridor Region s Lifeline A Regional Strategy Mobility, Economy & Environment North Coast
Highway 217 Corridor Study. Phase I Overview Report
 Highway 217 Corridor Study Phase I Overview Report November 3, 24 BACKGROUND AND OVERVIEW Study purpose The Highway 217 Corridor Study is developing multi-modal transportation solutions for traffic problems