Auto Theft and Recovery: Effects of the Anti Car Theft Act of 1992 and the Motor Vehicle Theft Law Enforcement Act of 1984
|
|
|
- Camron Parsons
- 6 years ago
- Views:
Transcription
1 People Saving People n htsa. dot. gov National Highway Traffic Safety Administration U.S. Department of Transportation Auto Theft and Recovery: Effects of the Anti Car Theft Act of 1992 and the Motor Vehicle Theft Law Enforcement Act of 1984 Report to the Congress My 1998
2
3 Table of Contents List of Figures List of Tables Executive Summary Recommendations TABLE OF CONTENTS Page i iv vii viii xvi Discussion of Recommendations Received from Commenters xix Introduction 1 Motives and The Market 5 Theft, Theft Rates, and Recovery Rates, Effect of Parts Marking and Antitheft Devices on Thefts and Recovery Rates 14 Effect of Vehicle Age on Theft and Recovery Rates 19 Collection and Dissemination of Theft and Recovery Information 20 The Economic Cost of Auto Theft 23 The Cost of Marking Parts 25 Arrest and Prosecution 27 Surveys of District Attorneys 28 Surveys of Law Enforcement Agencies 29 Surveys of Motor Vehicle Administrations 30 Insurance Premiums 30 Insurance Claim Payments for Recovered Vehicles Before and After Inception of Parts Marking 32 Used Replacement Parts 34
4 The Condition of Recovered Vehicles 35 Adequacy of Theft Laws 39 The Adequacy of Tracking Systems for Theft Investigators 40 Benefits of Parts Marking to Other Classes of Motor Vehicles 41 APPENDIX A - Effects of Parts Marking and Antitheft Devices on Theft and Recovery Rates Potential Effects of Parts Marking or Antitheft Devices A-l The Confounding Effect of "Regression to the Mean" A-4 Preview of Analyses A-5 Long-Term Theft and Recovery Rates (model years ) A-7 Parts Marking and Theft Rates Just Before and After Model Year 1987 A-13 Parts Marking, Recovery Rates and Unrecovered-Theft Rates Before/After Model Year 1987A-29 Effects of Antitheft Devices Introduced in MY Domestic Cars A-35 Effects of Factory-installed Antitheft Devices in Other Cars A-41 "In-part" Recovery Rates Just Before and After Model Year 1987 A-53 Conclusions A-59 APPENDIX B - Analysis of Regression to the Mean in Theft Rates of Cars With Marked and Unmarked Parts Estimation of Regression to the Mean Effects B-3 Effects of Regression to the Mean on Average Theft Rates B-6 APPENDIX C - Vehicle Age and Passenger Car Theft and Recovery Experience The Effect of Vehicle Age on Thefts and Recoveries C-l
5 Vehicle Age and Theft Rates of Passenger Cars C-l Recovery Rates for Passenger Cars C-4 Vehicle Age and Theft and Recovery Rates for Light Trucks C-4 Effects of Parts Marking on Vehicle Age and Theft and Recovery Rates C-5 APPENDIX D - Summary and Discussion of Docket Comments - Docket No , Notice NO1-002 Jaguar Cars. Inc. D NO1-003 Florida Motor Vehicle Theft Prevention Authority D NO American Automobile Manufacturers Association D NO Advocates for Highway and Auto Safety '. D NO Nissan North America. Inc. D NO Dade County Multi-Aeencv Auto Theft Task Force D NO Florida Auto Theft Intelligence Unit D NO Volkswagen of America. Inc. D NO State Farm Insurance Companies D-ll NO International Association of Auto Theft Investigators D NO Highway Loss Data Institute D NO Document does not exist D NO Toyota D NO M Safety and Security Systems D NO Association of International Automobile Manufacturers (AIAM) D NO Iowa State Patrol D-14 Discussion D-15 iii
6 LIST OF FIGURES Page Figure 1A. Motor Vehicle Thefts by Vehicle Type 10 Figure IB. Total Motor Vehicle Thefts 10 Figure 2A. Motor Vehicle Theft Rates by Vehicle Type 11 Figure 2B. Theft Rates for All Vehicles 11 Figure 3 A. Motor Vehicle Recovery Rates All Vehicles 13 Figure 3B. Motor Vehicle Recovery Rates by Type 13 Figure 4. Federal Court Motor Vehicle Theft Statistics 27 APPENDIX A Figure A-l. Passenger Car Theft Rates by Model Year, A-8 Figure A-2. Theft Rate Differential, MY Make-Models That Got Parts Marking or Antitheft Devices in 1987 Versus Make-Models That Never Had Them at Anytime A-11 Figure A-3. Passenger Car Recovery Rates by Model Year, A-14 Figure A-4. Recovery Rate Differential, MY Make-Models That Got Parts Marking or Antitheft Devices in 1987 Versus Models That Never Had Them At Any Time A-l5 Figure A-5. Unrecovered Theft Rates by Model Year, A-16 Figure A-6. Unrecovered Theft Rate Differential, MY Make-Models That Got Parts Marking in 1987 Versus Make-Models that never had Them at any time A-17 Figure A-7. Passenger Car Theft Rates by Model Year, A-20 Figure A-8. Theft Rate Differential, MY Make-Models That Got Parts Marking in 1987 Versus Make-Models Without Parts Marking or Antitheft Devices in A-21 IV
7 Figure A-9. Theft Rate Differential, MY , Brand New Cars Make-Models that got Parts Marking in 1987 versus Make-Models without Parts Marking or Antitheft Devices in A-26 Figure A-10. Brand-New Passenger Car Theft Rates by Model Year, A-27 Figure A-l 1. Brand-New Passenger Car Overall Theft Rates by Model Year, A-31 Figure A-12. Passenger Car Recovery Rates by Model Year, A-32 Figure A-13. Recovery Rate Differential, MY Make-Models That Got Parts Marking in 1987 Versus Make-Models Without Parts Marking or Antitheft Devices in A-42 Figure A-14. Unrecovered Theft Rate Differential, MY Make-Models That Got Parts Marking in 1987 Versus Make-Models Without Parts Marking or Antitheft Devices in A-43 Figure A-15. Unrecovered Theft Rate Differential, MY Brand-New Cars Make-Models That Got Antitheft Devices in 1987 Versus Make-Models Without Pans Marking or Antitheft Devices in A-44 Figure A-16. Passenger Car Theft Rates by Model Year, 19B8-95 A-47 Figure A-17. Theft Rate Differential, MY , LeSabre +88+ Bonneville (Antitheft Devices in ) versus Taurus +Sable (No Parts Marking or Antitheft Devices ) A-48 Figure A-18. Recovery Rate Differential, MY , LeSabre +88+ Bonneville (Antitheft Devices in ) versus Taurus +Sable (No Parts Marking or Antitheft Devices ) A-49 Figure A-19. Unrecovered Theft Rate Differential, MY , LeSabre +88+ Bonneville (Antitheft Devices in ) versus Taurus +Sable (No Parts Marking or Antitheft Devices ) A-50 Figure A-20. Theft Rate Differential General Motors Cars that Got Antitheft Devices, Starting in versus Control Group Cars that did not get Antitheft Devices in A-51 Figure A-21. Unrecovered Theft Rate Differential General Motors Cars that Got Antitheft Devices, Starting in versus Control Group Cars that did not get Antitheft Devices in A-52
8 APPENDIX B Exhibit 1. Theft Rates for Current Year Cars B-2 APPENDIX C Figure C-l. Theft Rates - Calendar Year for Passenger Cars C-l Figure C-2. Theft Rates - Model Year of Passenger Cars C-2 Figure C-3. Model Year 86 - Theft Rates - Passenger Cars C-2 Figure C-4. Model Year 87 - Theft Rates - Passenger Cars C-2 Figure C-5. Model Year 88 - Theft Rates - Passenger Cars C-2 Figure C-6. Model Year 89 - Theft Rates - Passenger Cars C-3 Figure C-l. Model Year 90 - Theft Rates - Passenger Cars C-3 Figure C-8. Model Year 91 - Theft Rates - Passenger Cars C-3 Figure C-9. Model Year 92 - Theft Rates - Passenger Cars C-3 Figure C-10. Theft Rates - Model Year Passenger Cars C-3 Figure C-l 1. Recovery Rates - Model Year Passenger Cars C-4 Figure C-12. Theft Rates - Model Year Light Trucks C-4 Figure C-l3. Recovery Rates - Model Year Light Trucks C-5 Figure C-l4. Theft Rates - Model Year Unmarked, Marked, Antitheft Passenger Cars C-5 Figure C-l5. Recovery Rates - Model Year Unmarked, Marked, Antitheft Device Cars C-6 VI
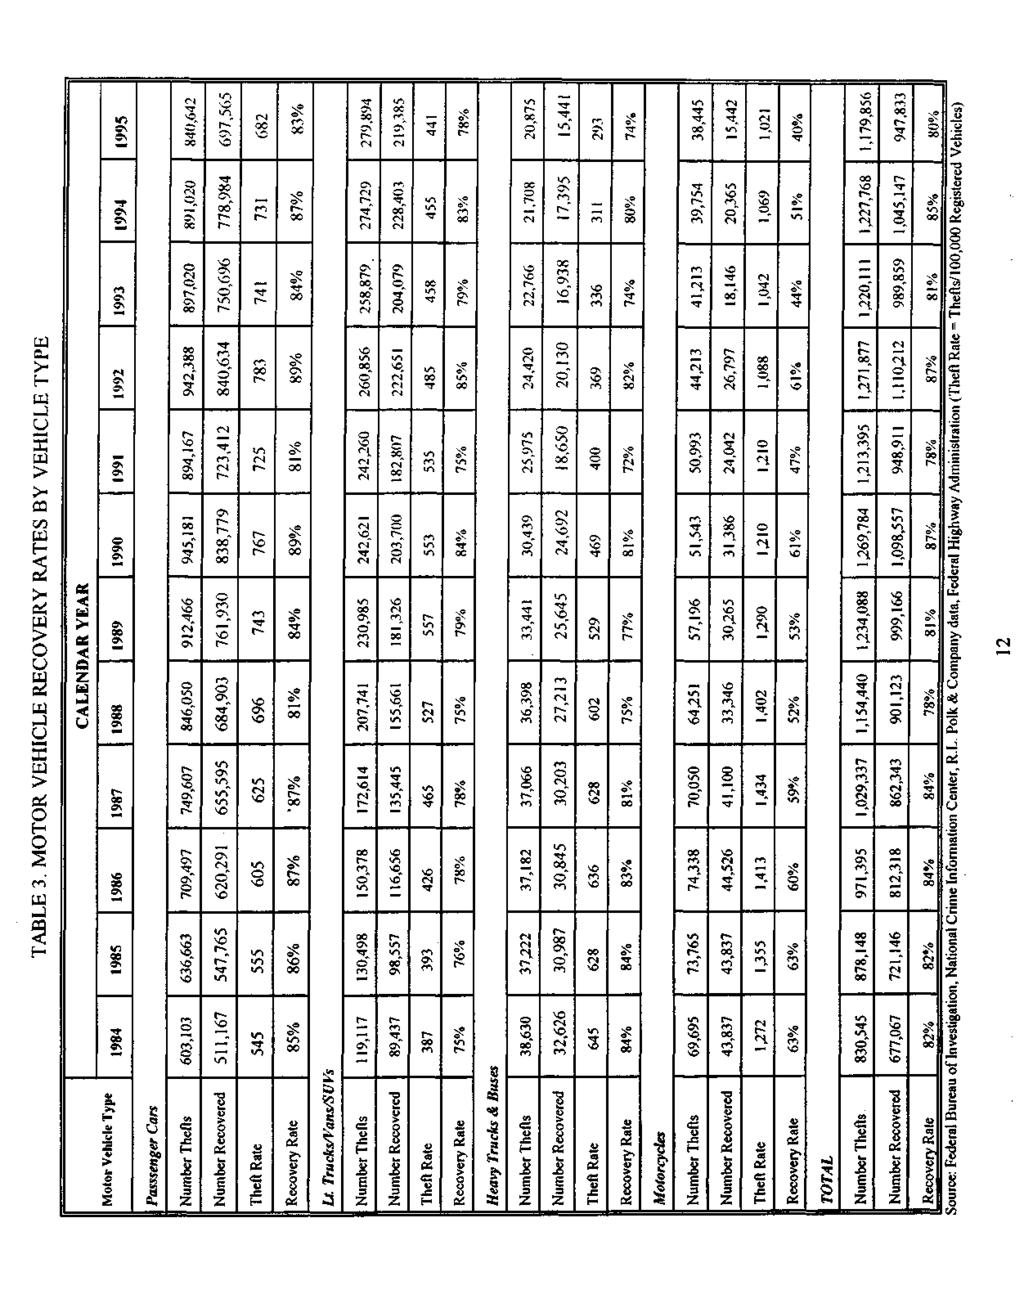
9 LIST OF TABLES Page Table 1. Motor Vehicle Thefts 10 Table 2. Motor Vehicle Theft Rates by Vehicle Type 11 Table 3. Motor Vehicle Recovery Rates by Vehicle Type 12 Table 4. Average Theft Claim Payments and Number of Claims for CMY Marked, & Unmarked, and Antitheft Device Passenger Cars 33 Table 5. Percent of Claims and Average Payments for In-Part, Intact, and In-whole Insurance Claims 38 APPENDIX B Table 1. Average Theft Rates Current Year Passenger Vehicles by Type B-9 Table 2. Thefts, Registrations and Theft Rates for Current Year Marked and Unmarked Passenger Vehicles B-10 Table 3. Theft Rate Correlation Matrix B-l 1 Table 4. Calculation of Expected Regression Marked and Unmarked Passenger Vehicles B-12 vn
10 Executive Summary Motor vehicle theft was a growing problem in the early and mid 1980's. In 1984, Congress enacted the Motor Vehicle Theft Law Enforcement Act in order to reduce the incidence of motor vehicle thefts and facilitate the tracing and recovery of stolen motor vehicles and parts from stolen vehicles. The Department of Transportation implemented the 1984 Act by issuing the Federal Motor Vehicle Theft Prevention Standard, which requires manufacturers of designated high theft passenger car lines to inscribe or affix the Vehicle Identification Number (VTN) onto the engine, the transmission, and 12 major body parts. As an alternative to parts marking, manufacturers could choose to install antitheft devices as standard equipment on a limited number of those lines. The objective of parts marking is to allow law enforcement agencies to identify stolen vehicles or parts removed from stolen vehicles - and to deter professional thieves since they will have difficulty in marketing stolen marked parts and are more likely to get caught if they steal cars with marked parts. The high-theft car lines were designated in 1985, and actual parts marking began with model year In 1991, the National Highway Traffic Safety Administration (NHTSA) presented a report to the Congress assessing the auto theft problem in the United States and, in particular, attempting to evaluate parts marking. At that time, however, only two years of theft and recovery data were available for cars with marked parts. Evidence of the effectiveness of parts marking could not be obtained through statistical analysis of theft and recovery rates. Nevertheless, the Department found wide support in 1991 for parts marking from the law enforcement community. Investigators believed that parts marking provided them with a valuable tool for detecting, apprehending, and prosecuting thieves. After considering the analyses, surveys and public comments obtained during the preparation of the 1991 report, the Department recommended that the theft prevention standard be continued with minor changes. In , motor vehicle theft was still a large problem. Thefts had increased from 830,000 in 1984 to 1,270,000 by In search of stronger remedies, and in response to the Department's recommendation and other information, Congress enacted the Anti Car Theft Act of The 1992 Act built on the 1984 Act in several ways: Federal penalties were enhanced; a grant program was authorized to help law enforcement agencies concerned with auto theft; steps were taken to Vlll
11 improve motor vehicle titling, registration, and salvage; the Theft Prevention Standard was to be expanded to other passenger car lines and high theft multipurpose passenger vehicles and light trucks with gross vehicle weight ratings of 6,000 pounds or less, which became effective starting with the 1997 model year; rules were established regarding salvage or junk vehicles; a stolen parts information system was to be maintained by the Attorney General; dealing in stolen marked parts became a Federal crime; and random customs inspections were allowed. The 1992 Act requires the Department of Transportation to provide a report to the Congress updating the findings of the 1991 report and evaluating the effects of the 1984 and 1992 acts. As a first step, the Department published a Preliminary Report for public review and issued a notice in the Federal Register on June 26, 1997 announcing a 45 day opportunity for public comment Comments received have been summarized and discussed as part of this Final Report that will be transmitted to the Congress. The goals of this report are: To update the detailed statistics on motor vehicle theft and recovery presented in the 1991 report. For this report, theft and recovery data were available from 1984 through 1995, and insurance data from 1986 through To revisit the evaluation of parts marking and antitheft devices, now that extensive data are available on the theft experience of cars with those remedies. (However, since theft data were available only through 1995, the effectiveness of the 1992 Act as regards expanded coverage in 1997 and later models cannot be analyzed at this time.) To evaluate other provisions of the 1992 Anti Car Theft Act and the 1984 Act, focusing on changes that have occurred since the 1991 report. The basic reasons for stealing cars have not changed since the 1991 report. Cars are stolen for transportation, joyriding, export, for repair parts, and to obtain expensive items such as stereo equipment for a quick profit. Since the last report to Congress, a new type of auto theft crime has emerged - carjacking -- but the theft motives are still the same. Fundamentally, though, two IX
12 types of auto theft may be recognized: (1) Professional thefts for profit, such as thefts to supply chop shops, retagging and retitling, or for illegal export. These thefts often result in a total loss to the original owner, but there is hope they can be deterred by remedies such as parts marking. They are believed to account for at least 23 percent of all thefts, and perhaps substantially more. (2) Nonprofessional thefts for purposes such as joyriding or to obtain temporary transportation. The vehicles are mostly recovered; on the other hand, parts marking would not appear as likely to deter these thefts. Overall theft and recovery statistics: As in the 1991 report, theft and recovery data come from the FBI's National Crime Information Center. The data do not indicate the motives for individual thefts or separate the "professional" from the "nonprofessional" thefts. Analyses based on aggregate data cannot identify the effectiveness of each subsection of the 1984 and 1992 Acts, but can provide insights on the trend in thefts and recoveries. The principal finding of this evaluation is that the auto theft problem, which was growing during the mid 1980's, leveled off or even began to decline after In 1995, there were 1,180,000 motor vehicles stolen, a decline of seven percent from the all-time peak of 1,270,000 experienced in both 1990 and However, the 1995 thefts are still 39 percent more than the 830,000 experienced in The theft rate per 100,000 registered vehicles increased from 543 in 1984 to 714 in 1990, but had dropped back to 597 by Passenger cars account for 71 percent of all motor vehicle thefts, followed by light trucks - pickup trucks, sport utility vehicles and vans - at 24 percent. The remaining thefts are split between heavy trucks and motorcycles. Theft rates for all four vehicle types have declined since Recoveries of stolen vehicles have kept pace with thefts over the years - recovery rates have remained stable at close to 80 percent of thefts throughout Passenger cars have slightly higher recovery rates than light trucks. Motorcycles have substantially lower recovery rates, and they have gotten worse. It is estimated that the annual economic loss resulting from vehicle thefts - and from the fact that many vehicles are never recovered or only recovered in a damaged condition - is at least $4 billion and could be as high as $8 billion.
13 Effect of parts marking and antitheft devices: The average consumer cost of parts marking in 1995 models was $4.92 per car. At that cost, just a 2 percent reduction in the theft rate would create consumer benefits exceeding the cost of parts marking. Theft and recovery rates for car lines that got parts marking in 1987 were compared to the rates for the same car lines before 1987 and to the rates for car lines that did not get either parts marking or antitheft devices. However, the fact that, originally, only high-theft car lines got parts marking resulted in biases in the data that made it essentially impossible to reliably attribute a specific percentage reduction in thefts or increase in recoveries to parts marking. Still, the analyses provided five indications (hedged with caveats) that parts marking quite possibly had beneficial effects at times, apparently greater than 2 percent: There was a conspicuous shift in theft rates in model years , coinciding with the introduction of parts marking. Cars with marked parts had lower theft rates than expected, while those with unmarked parts had higher rates than expected. The effect was as strong as 20 percent when cars were new, but it weakened as they became older and seemed to have vanished by the time they were two years old. The latter is a noteworthy finding, since it is consistent with the view that many professional thieves subsequently learned how to obliterate the markings, and found them less of a deterrent. Recovery rates for 1987 cars with marked parts were consistently higher than for corresponding 1986 models, even as the cars got older. However, this favorable effect in model year 1987 consistently deteriorated in later model years. In calendar year 1987, the unrecovered-theft rate of model year 1987 cars with parts marking was 26 percent lower than expected. As the model year 1987 cars got older, the benefit diminished, but still persisted at about 6 percent. However, the latter estimate is within the "noise range" of possible biases in the data and it cannot be attributed to parts marking without considerable doubt. Almost all car lines had lower theft rates in their early 1990's models than in their late 1970's models. However, the long-term reduction was substantially greater in the car lines that got xi
14 parts marking or antitheft devices than in the car lines that did not. It is not so clear what happened during the crucial intervening years, the 1980's. There was a strong reduction after 1987 in the percentage of vehicles that were only recovered in-part - i.e., missing their engine, transmission or a major body part (those which for high theft lines are required to have markings). There was a corresponding increase in percentage of vehicles recovered in-whole (no major parts missing) or intact. This trend was especially strong in the car lines with marked parts. By contrast, for at least one type of factory-installed antitheft device, the available data unequivocally show effectiveness. The system installed by a domestic manufacturer as standard equipment in various car lines during was associated with an immediate, and persistent 70 percent reduction in the theft rate and a 58 percent reduction in the unrecovered-theft rate. This device appears to be quite effective in reducing both "professional" and "casual" thefts. Of course, a system of this type has a far higher cost than parts marking. Fewer data were available on the antitheft devices factory-installed by other manufacturers. Specific estimates were not obtained, but there appeared to be considerable variation in effectiveness. With some of the devices, little change was seen in theft rates; with others, there were reductions comparable to those for the domestic manufacturer. No data were available for evaluating the effect of aftermarket antitheft devices. On the whole, the analysis results seem to suggest that the approach of Chapter 331 of the Ami Car Theft Act, which views both parts-marking and factory-installed antitheft devices as effective deterrents to automobile theft, has had benefits. There is some indication that the effect of parts marking might have been greater than two percent needed for cost-effectiveness, at least at certain times. Parts marking and antitheft devices have complementary roles: antitheft devices make it harder to steal a car, while parts marking deters professional thieves because it makes it easier to apprehend and convict them. The two remedies seem to be integral components of a larger program to combat auto theft. That program has, on the whole, had an impact, as evidenced by the leveling off and reduction of theft rates after Xll
15 Discussion of other provisions of the 1984 and 1992 Acts: Collection and dissemination of theft and recovery information has improved since 1991, primarily because technical advances in communications and computer equipment made databases more complete and accessible to agencies needing the information. The two systems called for in the Anti Car Theft Act of the National Motor Vehicle Title Information System and the National Stolen Auto Part Information System - are either not completely in place or are so new that their effects on vehicle theft (prevention, recovery or apprehension of thieves) cannot be evaluated at this time. In tandem with the number of motor vehicle thefts, arrests for auto theft peaked in 1989 and have leveled off since then. In 1994, an estimated 200,000 were arrested for auto theft or attempted theft in the United States. While recent surveys of district attorneys and law enforcement agencies did not provide detailed statistical data on arrests, prosecutions, and convictions for auto theft, they present an even more encouraging picture than corresponding surveys in the earlier report. Since 1991, there have been moderate increases in the number of prosecutions under both Federal Acts. There have also been increases in the level of effort directed to each prosecution. Now that they have better evidence with which to work, both prosecutors and officers are willing to invest more effort at obtaining a conviction. By 1996, prosecutors saw an increase of over 20 percent in the number of prosecuted cases, and 10 percent said that theft rates had declined in their jurisdictions. By 1996, in contrast to almost no effect seen in 1991, almost half of the district attorneys reported an increase in convictions - and most of them attributed it to the Federal Acts. Stiffer sentencing was occurring in 45 percent of the convictions, including a 75 percent increase in jail sentences. This could be even higher, they report, but for prison overcrowding. Law enforcement agencies report the same attitudes about the deterrent effects of parts marking in 1996 as they did in They feel that auto thefts for chop shop operations will continue if there is a demand for a part, marked or not. But almost half of the investigators feel that parts marking makes professional thieves more cautious or even deters them completely from stealing cars with marked parts. All investigators thought parts marking had no effect on amateur thieves. Xlll
16 Parts marking seems to have the greatest effect on chop shop operators because of the increased cost of "doing business." Auto theft investigators feel that parts marking is a valuable tool for arresting and prosecuting thieves. In 1991, they saw little or no effect, but by 1996, most of them felt that parts marking did assist in identifying and recovering stolen parts and vehicles. About three fourths of the law enforcement agencies in big cities said parts marking helped in arresting both chop shop operators and professional thieves. Auto theft investigators, as in 1991, still say that more permanent methods for parts marking are needed. Even though it is unlawful to remove labels from marked parts and the labels are required to leave evidence that they were once on the marked part, thieves have found methods for removing both the label and its "footprint". The investigator then has to be sufficiently knowledgeable to recognize that the part should have a label. Also without the label it is very difficult to trace the part back to the vehicle from which it was stolen. Data received from the Customs Service since the 1991 report, indicates it has improved its ability to recoup stolen vehicles. Insurance companies have not reported any effects of parts marking on insurance premiums. Some insurance companies do offer discounts on comprehensive premiums for vehicles equipped with certain types of anti theft devices. Analysis of claim payments also has not shown any specific effects of either parts marking or antitheft devices. Insurance companies report that their used part policies have not changed since About three fourths of the reporting companies encourage the use of used parts for crash repairs. Most companies rely on the repair shops to obtain parts from reputable sources. In conclusion, it appears that parts marking and other provisions of the 1984 and 1992 Acts have given the law enforcement community tools they can use to deter thefts, trace stolen vehicles and parts, and apprehend and convict thieves. Theft rates leveled off after and have begun to drop. While the program to reduce auto theft has had an impact, there appear to be four areas with potential room for improvement: (1) Insurance companies and motor vehicle departments could take better advantage of the existing parts marking program by routinely requiring xiv
17 inspection of the markings of used parts acquired at body shops and used vehicles brought in for new titles. The current setup, where some models have parts marking and others do not, may discourage routine inspections. (2) To the extent that current parts markings can be obliterated, their long-term deterrent effect may be diminished. (3) Since many vehicles still do not have marked parts, the deterrent effect of parts marking at this time may be offset by increased thefts of the vehicles without marked parts. (4) Appropriate antitheft devices can substantially reduce all types of thefts, but are currently standard equipment on only a limited number of car lines. However, to the extent that antitheft devices and parts marking are complementary strategies, more extended availability of antitheft devices ought not come at the expense of eliminating parts marking. The best results are likely to be obtained when vehicles have both remedies. XV
18 Recommendations Section 33113(b)(l 1) of Title 49, USC Chapter 331 requires the Department to "...include recommendations (including, as appropriate, legislative and administrative recommendations) for (A) continuing without change the standards prescribed under this chapter, (B) amending this chapter to cover more or fewer lines of passenger motor vehicles, (C) amending this chapter to cover other classes of motor vehicles, or (D) ending the standards for all future motor vehicles." Some analyses of the data suggest that parts marking has shown effectiveness as a theft deterrent at times greater than the two percent cost beneficial threshold. Comments received from the law enforcement community, prosecutors, and motor vehicle administrations indicate that parts marking has been an aid in detecting, apprehending, prosecuting and convicting auto thieves. These officials also recommend extending parts marking to all passenger motor vehicles, requiring more permanent marking methods, adding other parts for marking, and eliminating anthitheft device exemptions. In contrast, the auto industry favors discontinuing parts marking, or if that is not done, having more exemptions for antitheft devices. Insufficient information was received from the public comments to determine the cost of more permanent marking methods. Likewise, no information was provided on the cost of marking air bags - the one part that appears worthy of consideration for addition to the list of major parts to be marked. Airbags are expensive to replace costing between $500 and $1,500 and are frequently stolen. Because the Justice Department is required to evaluate the effectiveness of antitheft devices by December 31, 1999, decision making regarding exemptions should be postponed until that time. Within the authority provided by the current legislation, the Department is considering taking several actions: The Department is considering issuing an Advance Notice of Proposed Rulemaking to obtain data on parts marking methods. This information was requested when the preliminary report was published. No public comments were received on parts marking methods. Currently, parts xvi
19 marking sources are being surveyed for more information and there is some indication that more permanent marking methods are under development. If there is sufficient information obtained from the advance notice to indicate that more permanent methods beyond adhesive labels can be used which have a cost less than the cost limitations specified in Section of Chapter 331, then the Department could proceed with rulemaking to require more permanent marking methods. This action is warranted because the analyses suggest that the reason parts marking effectiveness seems to be short termed is that professional thieves have discovered ways to remove the adhesive marking labels along with the label's footprint. There is also evidence that professional thieves are counterfeiting labels. In one case, a vehicle had the VTN plate on the dashboard replaced with a plate and counterfeit labels that had the same VTN were put on major parts in place of the original labels. Hence more permanent marking methods should increase effectiveness to the extent that benefits exceed the added marking cost. The Department is contemplating issuing another Advance Notice of Proposed Rulemaking to obtain data on the cost of marking air bags and glazing. Currently information is being sought from the auto industry. One manufacturer indicated that it costs them about $2 per vehicle to mark airbags and maintain cross reference information after a one time cost of about $14 per vehicle for facilities investments. Another manufacturer indicated that they used a low-cost adhesive label to mark its airbags. No manufacturer reported marking glazing. If there is sufficient information obtained from the Advance Notice to indicate that one or both can be marked so that the total parts marking cost is less than the cost limitations specified in Section of Chapter 331, then the Department could proceed with rulemaking to require air bags and/or glazing be marked. This action is warranted for air bags which, in addition to being a safety item, cost $500 to $1,500 to replace (based on one comment received). Air bags are theft targets (several comments indicated this). While air bags do have serial numbers, they may not easily be identified with the vehicles from which they were taken. Some manufacturers indicate that they are crossreferencing the air bag serial number with the VTN. Marking air bags with the VTN, which would have to be done during the assembly process, would aid in parts recovery and for use as evidence xvii
20 of vehicle theft. Marking glazing is not for the purpose of preventing glazing from being stolen but to act as a theft deterrent, especially for retag operations. Marking glazing has been previously considered and rejected for cost reasons. However, it might be worth taking another look at this alternative since it has a great deterrent possibility. Pending the Justice Department's 1999 evaluation, the Department would consider making a recommendation to have the legislation changed to eliminate granting exemptions from parts marking for vehicles equipped with antitheft devices which meet certain requirements. This report found that parts marking and antitheft devices address different theft problems. Antitheft devices tend to have a greater deterrent effect on amateur thieves who steal vehicles for joy riding or transportation. Professional thieves and chop shops still want vehicles that are likely to have antitheft devices because these vehicles are often more expensive and thus these vehicles and their parts will potentially bring a better price on the illicit market. The evidence to support these conclusions is the fact that vehicles equipped with antitheft devices show lowered theft rates but their recovery rates, which were always lower than the average stolen vehicle, does not improve to the same level as vehicles without antitheft devices. Vehicles that are stolen by amateurs have a high recovery rate. Vehicles stolen by professional thieves and for chop shops are more often either dismantled or exported and are less likely to be recovered. Parts marking deters professional thieves and chop shops because the marked parts aid law enforcement in detecting a stolen vehicle or part and also help get the criminals convicted of motor vehicle theft. Parts marking also helps in recovering stolen vehicles and parts. Thus, antitheft devices systems are not a replacement for the parts marking system. Both systems complement each other. Having vehicles with antitheft devices and with marked parts should prove to be sufficiently effective to warrant the cost of both the devices and the cost of parts marking. After receiving the Justice Department findings, the Department will determine whether to propose that the theft prevention standard be amended to require all passenger vehicles, rated at 6,000 pounds gross vehicle weight or less, to have marked parts, except pickup trucks and vehicles granted exemptions for antitheft devices. xvin
21 Discussion of Recommendations Received from Commenters Section 614(c)(4) states that at least 90 days before submitting this report to Congress, the Secretary shall publish the proposed report for public review and for an opportunity for written comment of at least 45 days. The Secretary shall include a summary of such comments with the final report. Comments were received from 17 companies, automobile manufacturers, automobile associations, and state enforcement agencies recommending modifications to the parts marking standard. Listed below is a summary by issue of recommendations received from commenters. All comments received are discussed in Appendix D. Extend Parts Marking to Other Vehicles Eight commenters recommend extending the parts marking to other vehicles currently exempt. Seven commenters (Florida Motor Vehicle Theft Prevention Authority (FL MVTPA), Advocates for Highway and Auto Safety, Dade County Multi-Agency Auto Theft Task Force, State Farm Insurance Companies, International Association of Auto Theft Investigators (IAATI), 3-M Safety and Security Systems, and Iowa State Police) recommend extending parts marking to all passenger vehicles (passenger cars, sport utility vehicles, and light duty trucks). Advocates, IAATI, Florida Auto Theft Intelligence Unit (FL ATIU) and 3-M also recommended extending the parts marking to vehicles with antitheft devices. State Farm wants to extend parts marking to vehicles with ineffective antitheft devices. Two commenters (IAATI and 3-M) even recommend eliminating the 6,000 pounds weight exemption. The auto industry comments were opposed to parts marking. They feel that parts marking should either be terminated, phased out, or limited to only high theft lines. The industry favors antitheft devices over parts marking because of demonstrated effectiveness. Auto manufacturers say that parts marking costs are higher than the government estimate, hence they say the cost benefit is either lower or nonexistent. xix
22 parts marking costs are higher than the government estimate, hence they say the cost benefit is either lower or nonexistent. RESPONSE: The Department tentatively believes that parts marking should be extended to other passenger vehicles and light trucks for the following reasons: (1) parts marking has shown effectiveness that at times exceeded the threshold for cost effectiveness, and (2) law enforcement, prosecutors, and motor vehicle administrations have presented evidence that parts marking is effective in detecting, arresting, prosecuting, and convicting auto thieves. If all passenger vehicles are marked, law enforcement officers, repair shops, and insurance agents will know that any used major part from vehicles made after the effective date must be marked. While the position of the auto industry is understandable, parts marking effectiveness has been demonstrated even though it is difficult to quantify. We agree that antitheft devices are effective but not necessarily as a substitute for parts marking which acts both as a deterrent and for tracing stolen parts and vehicles. The government calculation of the cost for parts marking has been estimated by two different sources with similar results using recognized-standard estimating procedures. Little cost information was provided by the auto manufacturers - only estimates from Nissan and Volkswagen which were higher than the government estimates, but still within the statutory cost limit. Nissan stated that other manufacturers with low volume production lines subject to parts marking might have costs in excess of the Congressional ceiling. Extend Parts Marking to Additional Parts Six commenters recommend extending parts marking to additional parts. FL MVTPA, Dade County, FL ATIU, State Farm, 3-M, and Iowa State Police recommend parts marking for air bags. Three of these commenters (Dade County, FL ATIU, and State Farm) also recommend parts marking for glazing and two of these commenters (3-M and Iowa State Police) also recommend parts marking for sound systems. Toyota opposes marking glazing because of the unreasonable labor costs to coordinate marked glazing to their respective vehicles and the lack of demonstrable benefits. xx
23 RESPONSE: One comment indicated that the replacement cost of air bags was between $500 and $1,500. While air bags have serial numbers, tracing an air bag back to its rightful vehicle without parts marking is more difficult to do. Marking glazing has a deterrent effect but its cost may exceed the Congressional limit per vehicle. The cost estimate of marking glazing was excessive a few years ago when the Department considered rulemaking to require glazing be marked. The theft of sound systems is more related to theft of vehicle contents rather than stealing the entire vehicle. Thus, the Department does not support marking sound systems. No data on the cost of marking for any of these additional parts was provided with the comments received. To consider rulemaking for inclusion of any of these parts, the Department would have to obtain cost data. In addition, information would be needed to indicate that marking any of these parts would reduce vehicle thefts. Rulemaking would only proceed if there was evidence that adding one or more of these parts could be done without increasing the total cost of parts marking above the Congressional threshold and that there would be sufficient reductions in auto thefts to pay for the costs. Make Parts Marking More Permanent FL MVTPA, Advocates, Dade County, and FL ATIU recommend making parts marking more permanent. FL ATIU mentions invisographic type labels which leave the full VIN as its footprint if the label is peeled off. RESPONSE: While more permanent marking methods have merit, no data were provided in the comments received to support this initiative. The Department is interested in pursuing this recommendation but needs additional information before arriving at a final decision. Parts marking manufacturers have given some indication that such technology is under development. xxi
24 Expand Exemptions of the Parts Marking Standard Volkswagen of America, Inc recommends that NHTSA request Congress to allow exempting at least two car lines per year, instead of one and Association of International Automobile Manufacturers (AIAM) recommends expanding antitheft device exemptions. RESPONSE: The Department made this recommendation in the 1991 Report to Congress. However, given the variety of effectiveness of antitheft devices, the Department defers any decision making until the Justice Department has finished its 1999 study. xxu
25 AUTO THEFT AND RECOVERY Effects of The Anti Car Theft Act Of 1992 and The Motor Vehicle Theft Law Enforcement Act Of 1984 July 1998
26 Auto Theft and Recovery Introduction Every year, more than one million motor vehicles are stolen. Estimates show that the economic loss resulting from these thefts is at least $4 billion, and it could be as high as $8 billion. In 1991, the National Highway Traffic Safety Administration presented a report to the Congress assessing the auto theft problem in the United States and the measures employed to fight theft. The basic reasons for stealing cars have not changed since the 1991 report. For example, cars are stolen for transportation (including unauthorized use of a vehicle or for use in transporting stolen goods or committing other types of crimes), joyriding, export, for repair parts, and for obtaining expensive stereo equipment to sell for a quick profit. A substantial economic loss continues to result from thefts motivated to meet the demands for replacement parts. Since the last report to Congress, a new type of auto theft crime has emerged ~ carjacking but the motives for auto theft are still the same. Auto theft was an escalating problem that caused Congress to enact the Motor Vehicle Theft Law Enforcement of 1984 (the 1984 Theft Act). The Theft Act was designed to reduce the incidence of motor vehicle thefts and simplify the tracing and recovery of parts from stolen vehicles. The Act directed the Secretary of Transportation to issue a theft prevention standard requiring manufacturers to inscribe or affix numbers or symbols on major parts of passenger-car, high-theft lines for identification "purposes. The Act also addressed other issues such as criminal penalties, export of stolen motor vehicles, and comprehensive insurance premiums. In October 1985, the Department issued the Federal Motor Vehicle Theft Prevention Standard (49 CFR Part 541) which requires manufacturers of designated high theft passenger car lines to inscribe or affix the vehicle identification number (VIN) onto the following major parts: engines, transmissions, fenders, doors, bumpers, quarter panels, hoods, and decklids/tailgates and/or hatchbacks. In the case of engines and transmissions, either the 17-digit vehicle identification number (VTN) or an eight digit VTN derivative must be engraved or stamped. Manufacturers can meet the affixation requirements with indelibly marked labels that cannot be removed without becoming torn or rendering the number on the label illegible. The labels must also leave a residue on the part after being removed. 1
27 As a further theft deterrent, the 1984 Act allowed for an exemption from the parts-marking requirements for certain car lines where antitheft devices were installed as standard equipment in factory-delivered passenger cars. The Act limited each manufacturer to two car line exemptions per model year. The manufacturer has to petition NHTSA for an exemption which is granted if it is determined that the devices are likely to be as effective in reducing and deterring motor vehicle theft as compliance with parts marking. The common features of antitheft devices installed as standard equipment for which exemptions have been granted include "passive" systems, which means that the system engages automatically without any extra action by motorists. Such systems are activated automatically by removing the key from the ignition and locking the doors. Sensors located in the doors, hood, trunk, and key cylinders activate alarms when unauthorized entry is attempted. The approved systems have a starter or ignition interrupt and power (battery) protection. Most systems granted exemptions in full have an audio and/or visual alarm (some of the GM systems which use the PASS-Key have been granted exemptions in full but have no visual or audio alarm). Systems granted a partial exemption because they do not have the audio/visual alarm, must have the engines and transmissions marked. In the 1991 report, theft rates between marked and unmarked cars was found to be statistically insignificant. Recovery rates also showed no statistically significant differences between marked and unmarked car lines. Cars with antitheft devices did not show a significant difference in theft rates of cars containing marked parts. Recovery rates of antitheft device equipped cars appeared to be lower than those of marked cars. Analysis of theft claims costs resulted in the same conclusion. At the time of the 1991 report, evidence of the effectiveness of the theft standard could not be obtained through statistical analysis of the data sets examined. However, the Department did find wide support in 1991 for parts marking from the law enforcement community. Law enforcement agents concerned with prevention and deterrence of motor vehicle theft or the capture and prosecution of perpetrators believed that marking parts provided them a valuable tool.
28 After considering the analyses, surveys, and public comments obtained during the preparation of the 1991 report, the Department recommended that the theft prevention standard be continued with several minor changes. As a result of the Department's recommendation and other information received by the Congress, the Anti Car Theft Act of 1992 was enacted. This Act built on the 1984 Act in several ways: Federal penalties for auto theft were enhanced. A grant program was authorized to help state and local law enforcement agencies concerned with auto theft. Experts were called on to look into and report on motor vehicle titling, registration, and salvage (the report was published in February 1994). The National Motor Vehicle Title Information System was to be established and the states were required to participate in the system; the Theft Prevention Standard was expanded, rules were established to check if salvage or junk vehicles are stolen; and the Attorney General is to maintain a National Stolen Auto Part Information System. Selling or distributing marked parts that are stolen became a Federal crime. Random customs inspection to detect stolen vehicles being exported were allowed. A pilot study on a nondestructive inspection system was authorized. As in the 1984 Act, the Anti Car Theft Act of 1992 calls for a report to the Congress on the effects of the Act on trends in motor vehicle thefts and recovery. The report is due five years after the legislation was enacted (October 25, 1992). As in the 1984 Act, a preliminary report was published in June 1997 and announced in the Federal Register (June 26, 1997 page 34494) with a 45 day comment period ending August 11. The comments received are summarized and discussed in Appendix D of this report. The 1992 Act's amendments on theft prevention include: expanding coverage to selected lines that were below the 1990/1991 median theft rate, and including high theft multipurpose passenger vehicles and light trucks that are rated at not more than 6,000 pounds gross vehicle weight under the provisions of the theft standard. These changes had to be made two years (1994) after the enactment of the Act. Three years later (1997), based on the Attorney General's findings, the Secretary of Transportation shall designate all remaining such lines of passenger motor vehicles (other than light-duty trucks), unless the Attorney General determines such additional parts marking would not substantially inhibit chop shop operations and vehicle thefts. By the end of 1999, the Attorney General shall determine if the rules have been effective in inhibiting chop
29 shops and vehicle theft and send these findings to the Secretary. These findings are to include an analysis of the effectiveness of factory-installed antitheft devices as a substitute for parts marking. The rulemaking process and manufacturer comments regarding lead time to implement parts marking resulted in expansion of the Theft Prevention Standard to a selected group of low theft line vehicle lines and other passenger vehicles beginning with the 1997 model year. The most recent theft data available for this report from the National Crime Information Center is the 1995 file. Thus the effectiveness of the Anti Car Theft Act as regards to expanded coverage cannot be determined with the available data at this time. Other provisions of the 1992 Anti Car Theft Act and the effectiveness of the 1984 Act are evaluated in this report. Both the 1984 and the 1992 Acts require the Secretary to include the following information in the evaluation report: motor vehicle theft and recovery statistics as well as their collection and reliability; the extent to which motor vehicles are dismantled or exported; the market for stolen parts; the cost and benefit of marking parts; arrest and prosecution of auto theft offenders; the Act's effect on the cost of comprehensive premiums; the adequacy of Federal and State theft laws; and an assessment the potential benefits of parts marking on other classes of motor vehicles. The 1991 report studied and discussed each of these topics in depth. This report focuses on changes that have occurred since the 1991 report. It also updates detailed statistics on motor vehicle theft and recovery. Theft data were available from 1984 through 1995, and insurance data from 1986 through The Department obtained data from sources specified in the Act and available elsewhere, including: the FBI's National Crime Information Center (NCIC), the U.S. Attorney Generals Office, the Bureau of Customs, the Highway Loss Data Institute (HLDI), the National Insurance Crime Bureau (NICB), and individual insurance companies. Surveys or interviews were conducted with officials of state, county and city enforcement agencies, motor vehicle administrations and court systems; and with personnel at auto body repair shops.
30 In preparing this report, the Department worked with and consulted the Department of Justice's National Institute of Justice. Motives and the Market Thieves differ in their motives for stealing motor vehicles. The 1991 report included two surveys, performed in 1989, that estimated the distribution of car thefts by motive. Fundamentally, some vehicles are stolen in more or less professional operations for profit, while other thefts are typically the work of individuals, for profit or for other reasons. Here are some of the most common motives for theft: Thefts to supply vehicles or parts for resale: Chop shop operations: businesses that acquire stolen vehicles or hire thieves to provide vehicles so that parts can be removed and sold for profit. These parts may eventually be sought by others to repair damaged vehicles, since they sell for substantially less than original equipment parts. (The 1989 surveys estimated that chop shops account for between 10 and 16 percent of all thefts.) Theft and retag: vehicles are stolen and sold for profit to be registered under another VTN. The new VTN and title are obtained by purchasing a junked vehicle of the same make-model. The VTN plate is transferred from the junked vehicle to the stolen vehicle and the title may need slight alteration to match the stolen vehicle (an estimated 15 percent of thefts). Thefts for export: vehicles are stolen and illegally shipped out of the United States to be sold for profit (4 to 17 percent of thefts). Other motives for theft:
31 Insurance fraud: "stealing" your own car, or having somebody else "steal" and hide it, so you can collect its insured value. After the insurance company pays off, the vehicle may be abandoned by the thieves, eventually recovered, and end up as the property of the insurance company. Insurance fraud might be contemplated, for example, if the owner has financial distress, or if the vehicle is in much worse shape than its insured value (9 to 23 percent of thefts). For concealing one's identity while committing another crime: stealing a vehicle as temporary transportation to and from the scene of another crime. The stolen vehicle does not belong, and cannot be traced, to the criminal. Soon afterwards, it may be abandoned and eventually recovered (an estimated 13 percent of thefts). Joyriding or temporary transportation: the vehicle is usually abandoned and recovered after a matter of hours or days (estimates ranged from 25 percent up to 68 percent of thefts). Of the million vehicles stolen each year, 200,000 are never recovered. Chop shop operations, export, insurance fraud, and retagging are believed to account for most of the unrecovered vehicles. Before parts marking, passenger cars represented 57 percent of the unrecovered vehicles, but from 1987 through 1995, this has increased to over 62 percent. The number of unrecovered passenger cars has varied from as few as 87,000 in 1985 to over 170,000 in No new surveys have been conducted on the distribution of thefts, by motive. Assuming, for the moment, that the distributions were similar in 1995 and 1988, the estimated counts and costs for chop shop operations, fraud and export in 1995 are as follows: Between 84,000 and 135,000 passenger cars valued from over $600 million to almost $1 billion were stolen to remove parts in chop shops. Fraud of all kinds accounted for anywhere between 75,000 to 320,000 stolen passenger cars, valued from $550 million to $2.4 billion; and
32 Between 30,000 and 123,000 of the 143,000 unrecovered passenger cars are believed to have been stolen for export, with an estimated value of $221 million to S905 million. However, the Customs Service has provided more recent estimates of vehicles stolen for export. They estimated that in 1995 as many as 375,000 (the FBI data indicates that 200,000 is a better estimate of unrecovered vehicles) cars may have been stolen and exported. Using the Customs Service value of recovered stolen cars in 1994 of $13,100, the upper bound estimated value of stolen exported passenger cars could be as much as $4.9 billion. The Customs Service also estimated that 200,000 passenger cars were stolen and exported in 1990 with a market value of $800 million (at a reported average of $4,000 per vehicle in 1990). Exports of stolen vehicles are extremely difficult to estimate. In 1988 and 1989, Customs agents report seizing 1,292 stolen passenger cars, a fraction of the estimated total. The Customs Service has improved its ability to recoup stolen passenger cars and reported 1,700 recovered in 1992 and 2,300 recovered in However, no inferences can be drawn from the trend in recoveries to the number exported and not recovered. While 1992 and 1994 show an improvement in recoveries over 1988 and 1989, there are still tens of thousands of stolen vehicles being exported illegally out of this country. Because law enforcement officials believe most stolen vehicles and parts are exported in sealed containers or crates, two provisions of the Anti Car Theft Act of 1992 specifically address that issue. One provision allows for random customs inspections to detect stolen vehicles being exported, and the other authorizes a pilot study of a nondestructive inspection system. The 1991 report estimates that almost 32 million passenger cars during 1988 had crash damage which cost an estimated $28.6 billion in parts to repair. The used/rebuilt portion of the parts market in 1988 was thought to be 4 to 5 percent or $1.6 billion at that time. That portion appears to have grown over time. A survey of repair shops in 1989 indicated that used parts were employed in making repairs about 10 percent of the time; a similar survey in 1996 indicates that used parts comprise 14 percent of the repair parts. Assuming that the same number of cars as in 1988 need repair today and using current dollars, the estimated portion for used/rebuilt repair parts is about $5.3 billion. Stolen parts comprise a portion of that used parts market.
33 The lack of information for making good estimates on the motives for auto theft results in broad and sometimes overlapping ranges. Thus, in the remainder of this evaluation, vehicle thefts and recoveries are analyzed only in the aggregate, without identifying the motives. Thefts. Theft Rates, and Recovery Rates The FBI's National Crime Information Center (NCIC), once again is the source of theft and recovery data for this report as it was for the 1991 report. Theft data from 1984 through 1995 were available. Because of differences in screening, vehicle definitions, and aggregating the data, totals shown for 1984 through 1988 are slightly different from the 1991 report. The NCIC information is considered the most accurate and precise available. Each record contains the make, line, theft and recovery dates of individual stolen motor vehicles. The summary information compiled from the Uniform Crime Reports (UCR), which are based on reports by local police agencies, is not presented here, as it had been in the 1991 report. Comparisons were made between the NCIC and UCR data bases in the 1991 report, and the NCIC data base was found to be more definitive for analysis purposes. The UCR data base includes attempted thefts as well as successful thefts. Thefts: The principal finding of this evaluation is that the auto theft problem, which was growing during the mid 1980's, leveled off or even began to decline after In 1995, there were 1,179,856 motor vehicles stolen, a rise of 39 percent since 1984, but a decline of 7 percent since In 1995, passenger cars account for 71 percent of all motor vehicle thefts; light trucks - i.e., pickup trucks, vans and sport utility vehicles (SUV's) account for 24 percent. The remaining five percent are thefts of heavy trucks, buses and motorcycles. Total thefts increased steadily from 830,545 in 1984 to 1,234,088 in 1989, an 8 percent annual rate of increase. They leveled off in the early 1990's, with a reduction from 1,227,768 in 1994 to 1,179,856 in The sharp increase in thefts of pickup trucks, vans and SUV's throughout this period is proportionate to their increasing share of the vehicles on the road. Annual thefts of motor vehicles from 1984 through 1995 are shown in Table 1 and Figures 1A and IB.
34 Theft rates (Thefts per 100,000 registered vehicles 2 ) are shown in Table 2 and Figures 2A and 2B. The theft rate for all types of vehicles has the same trend as overall thefts. The theft rate increased from 543 in 1984 to 714 in It has declined to 597 by The rates for passenger cars and light trucks show a similar pattern. (Even though thefts of light trucks have increased, their registrations grew even more rapidly, so the theft rate declined after 1989.) Theft rates for heavy trucks, buses and motorcycles have experienced even larger reductions. Recovery rates: The number of recoveries have kept pace with thefts over the years. The recovery rate (recoveries/thefts) has remained stable. Table 3 and Figures 3 A and 3B indicate that overall recovery rates during have ranged from a low of 78 percent to a high of 87 percent but the trend has been neither increasing nor decreasing: the rate has been consistently close to 83 percent. NCIC recovery data for 1995 was still incomplete at the time of this study. The 1995 rates in Table 3 can be expected to increase if vehicles stolen in 1995 and recovered in 1996 (after the cutoff date for the file used in this study) were to be included. Passenger cars have slightly higher recovery rates than pickup trucks/vans/suv's or heavy trucks. Motorcycles have substantially lower recovery rates, and they have gotten worse. After 1990, recovery rates for all types of vehicles tend to be higher in the even years than the odd years. The reason for that pattern is unknown. Registered vehicles are the number of vehicles registered by the states and reflects the fleet of vehicles on the road. The data comes from the R. L. Polk Co. which compiles the information obtained from the states usually at the end of June which is the fiscal year for most states. Registered vehicle data is essential since it can be separated by model year.
35
36
37
Why the Integrated Municipal Provincial
 Why the Integrated Municipal Provincial Auto Crime Team (IMPACT) Darryl Plecas, Jennifer Armstrong, Tara Haarhoff, Amanda V. McCormick, & Irwin M. Cohen Why the Integrated Municipal Provincial Auto Crime
Review of Considerations and Requirements for Automated Enforcement
 Review of Considerations and Requirements for Automated Enforcement Summary: The purpose of this report is to provide information related to expanding the use of automated enforcement in the City of Toronto,
FIREARMS RECOVERY PROTOCOL
 INTERPOL ILLICIT ARMS RECORDS AND TRACING MANAGEMENT SYSTEM FUNDED BY: FIREARMS RECOVERY PROTOCOL Gather, share and analyse all criminal-related firearm information to combat terror, violent offenders
Equine Business Year in Review 2003 Dean, Dorton & Ford, P.S.C. Page 1
 is published by Dean, Dorton & Ford's Equine Industry Group. We hope you find the information we present regarding thoroughbreds to be interesting and helpful. We welcome your feedback. Located in the
Statement before the Maryland Senate Committee on Judicial Proceedings on Senate Bill 277. Research on Automated Speed Enforcement. Stephen L.
 Statement before the Maryland Senate Committee on Judicial Proceedings on Senate Bill 277 Research on Automated Speed Enforcement Stephen L. Oesch The Insurance Institute for Highway Safety is a nonprofit
SPECIAL ORDER DISTRICT OF COLUMBIA I. BACKGROUND
 SPECIAL ORDER DISTRICT OF COLUMBIA Title Bicycle Recovery Procedures Topic/Number SO-08-07 Effective Date July 2, 2008 Rescinds: General Order 303.4 (Inspection and Registration of Bicycles) Effective
ANNUAL REVIEW OF INDUSTRY EXPERIENCE - FINAL REPORT AS OF DECEMBER 31, 2016 COMMERCIAL VEHICLES ALBERTA AUTO INSURANCE RATE BOARD 29 SEPTEMBER 2017
 ANNUAL REVIEW OF INDUSTRY EXPERIENCE - FINAL REPORT AS OF DECEMBER 31, 2016 COMMERCIAL VEHICLES ALBERTA AUTO INSURANCE RATE BOARD 29 SEPTEMBER 2017 ANNUAL REVIEW OF INDUSTRY EXPERIENCE AS OF DECEMBER 31,
Traffic Calming Policy
 Article I. Purpose and Goal. The purpose of this policy is to establish criteria and procedures the City will use to evaluate requests for, and if appropriate, implement traffic calming measures. Neighborhood
Car Theft in Australia IAATI Training Seminar. Ray Carroll Executive Director
 Car Theft in Australia 2018 IAATI Training Seminar Ray Carroll Executive Director Overview Dimensions of current theft trends Key observations What the NMVTRC is doing in response to these threats Trend
See Summary below for explanation of exception to calendar requirement. Michael Vukcevich, Deputy Director. New Jersey Racing Commission
 LAW & PUBLIC SAFETY NEW JERSEY RACING COMMISSION Horse Racing Out-of-Competition Testing (on Non-Race Days and on Race Days Pre-Race) of Racehorses for Erythropoietin (Epogen, EPO), DarbEPO, or Other Blood
Mission: The mission of FARS is to make vehicle crash information accessible and useful so that traffic safety can be improved
 Mission: The mission of FARS is to make vehicle crash information accessible and useful so that traffic safety can be improved NHTSA created FARS in 1975 National Center for Statistics and Analysis (NCSA)
ALBERTA AUTOMOBILE INSURANCE RATE BOARD
 ANNUAL REVIEW OF INDUSTRY EXPERIENCE FINAL REPORT AS OF JUNE 30, 2017 PRIVATE PASSENGER VEHICLES ALBERTA AUTOMOBILE INSURANCE RATE BOARD 27 MARCH 2018 ANNUAL REVIEW OF INDUSTRY EXPERIENCE AS OF JUNE 30,
Code(s) DOT 49 CFR 173.3:
 DOT 49 CFR 173.3:") Code(s) DOT 49 CFR 173.3: (c) Packages of hazardous materials that are damaged or found leaking and hazardous materials that have been spilled or leaked may be placed in a metal removable head salvage
Code(s) DOT 49 CFR 173.3: (c) Packages of hazardous materials that are damaged or found leaking and hazardous materials that have been spilled or leaked may be placed in a metal removable head salvage
Briefing: The free bus pass
 Briefing: The free bus pass This briefing note provides information about the free bus pass in England and explains Age UK s views. (Policy on the bus pass is devolved to local administrations in Scotland,
Figure 1. Indiana fatal collisions by young driver involvement,
 INDIANA TRAFFIC SAFETY FACTS YOUNG DRIVERS 2016 MAY 2017 ISSUE 17-C06 IN 2016: In 2016, 13.4 percent of all drivers involved in Indiana collisions were young drivers. Young drivers were involved in 105
EFFECTIVE BICYCLE REGISTRATION TO DECREASE BICYCLE THEFTS AND BICYCLE CHOP SHOPS
 EFFECTIVE BICYCLE REGISTRATION TO DECREASE BICYCLE THEFTS AND BICYCLE CHOP SHOPS Over the last few years, criminals have become knowledgeable of how to sell and where to sell bicycles without questioning.
City of Elizabeth City Neighborhood Traffic Calming Policy and Guidelines
 City of Elizabeth City Neighborhood Traffic Calming Policy and Guidelines I. Purpose: The City of Elizabeth City is committed to ensure the overall safety and livability of residential neighborhoods. One
NEIGHBORHOOD TRAFFIC CALMING PROGRAM. Policy and Procedure. Roswell Department of Transportation (770)
") NEIGHBORHOOD TRAFFIC CALMING PROGRAM Policy and Procedure Roswell Department of Transportation (770) 594 6420 Approved by M&CC on December 19, 2011 Table of Contents 1. Application and Intent 2. Program
NEIGHBORHOOD TRAFFIC CALMING PROGRAM Policy and Procedure Roswell Department of Transportation (770) 594 6420 Approved by M&CC on December 19, 2011 Table of Contents 1. Application and Intent 2. Program
80th OREGON LEGISLATIVE ASSEMBLY Regular Session. House Bill 2352 SUMMARY
 0th OREGON LEGISLATIVE ASSEMBLY--0 Regular Session House Bill Sponsored by Representatives POWER, HELM (Presession filed.) SUMMARY The following summary is not prepared by the sponsors of the measure and
SAN FRANCISCO MUNICIPAL TRANSPORTATION AGENCY
 THIS PRINT COVERS CALENDAR ITEM NO. : 12 DIVISION: Sustainable Streets BRIEF DESCRIPTION: SAN FRANCISCO MUNICIPAL TRANSPORTATION AGENCY Approving the traffic modifications associated with the Dolores Street
Specifically, the bill addresses:
 Weapons Firearms Transfer; Concealed Carry; Open Carry; Regulation by Local Government; Forfeiture, Return, and Buyback of Firearms; Criminal Use; Criminal Possession; HB 2578 HB 2578 creates new law concerning
Gun Violence in America: One Week, Six Cities, and the. Washington, DC g, April 26, 2012
 Gun Violence in America: One Week, Six Cities, and the Implications Washington, DC g, April 26, 2012 PERF Gun Violence Initiative: ii i National Spotlight on Gun Violence Project Two tiered investigation
JONESBORO HIGHWAY 63 HIGHWAY 18 CONNECTOR STUDY
 JONESBORO HIGHWAY 63 HIGHWAY 18 CONNECTOR STUDY Craighead County May 2007 JONESBORO HIGHWAY 63 HIGHWAY 18 CONNECTOR STUDY Craighead County May 2007 Prepared by Planning and Research Division Arkansas State
ANALYZING THE SHIP DISPOSAL OPTIONS
 Chapter Six ANALYZING THE SHIP DISPOSAL OPTIONS Chapters Two through Five examined the option of long-term storage and the three ship-disposal options: domestic recycling, overseas recycling, and reefing.
REPORT ON RED-LIGHT MONITORING SYSTEMS
 REPORT ON RED-LIGHT TRAFFIC CONTROL SIGNAL MONITORING SYSTEMS Prepared by the New Jersey Department of Transportation November 2011 Executive Summary Public Law 2007, Chapter 348 (P.L. 2007, c.348), signed
Statement before the Maryland House Environmental Matters Committee. HB 443 Automated Speed Enforcement. Stephen L. Oesch
 Statement before the Maryland House Environmental Matters Committee HB 443 Automated Speed Enforcement Stephen L. Oesch The Insurance Institute for Highway Safety is a nonprofit research and communications
Road Safety Strategy
 Road Safety Strategy January 2015 Authorising Officer: Author: Date: Security Classification: Commissioner of Police, Michael A. DeSilva CPM FCMI Inspector Robert W. Cardwell MSc MCMI This document is
BIKE PLAN CONTENTS GATEWAY
 CONTENTS Acknowledgments...vii Great Rivers Greenway District Board of Directors... vii Great Rivers Greenway District Staff... vii Project Consultants... vii Committees... viii Citizens Advisory Committee
MANUFACTURING TECHNICAL INSTRUCTIONS - SAFETY FALL HAZARD CONTROL REQUIREMENTS SERIES & NO. SMI - 157
 1 of 6 1.0 PURPOSE To establish minimum requirements and guidelines for controlling hazardous exposure of personnel to falls from working elevations in conformance with Federal and State OSHA rules and
Statement before the Maryland Senate Judicial Proceedings Committee. Automated Speed Enforcement. Stephen L. Oesch
 Statement before the Maryland Senate Judicial Proceedings Committee Automated Speed Enforcement Stephen L. Oesch The Insurance Institute for Highway Safety is a nonprofit research and communications organization
Occ c u c pa p n a t pro r t O ec e t c i t O i n
 Occupant Protection Occupant Protection Introduction Buckling up or being buckled in is the most effective protection during a car crash. The simple truth is that the great majority of people ejected from
June 23, Re: Docket No. FSIS To Whom It May Concern:
 June 23, 2011 Docket Clerk U.S. Department of Agriculture Food Safety and Inspection Service Room 2-2127 George Washington Carver Center 5601 Sunnyside Avenue Beltsville, MD 20705 Re: Docket No. FSIS-2008-0031
Community Perceptions of Speeding
 Community Perceptions of Speeding Nigel McDonald Crash Reduction Program Manager NRMA Member Services Abstract Community perceptions and attitudes to the speeding problem are important determinants in
SUMMARY APPROACH. xiii
 SUMMARY The U.S. Navy and the U.S. Maritime Administration (MARAD) together preside over a fleet of some 450 retired naval vessels and merchant ships that grows each month as ship retirements continue.
Crash Patterns in Western Australia. Kidd B., Main Roads Western Australia Willett P., Traffic Research Services
 Crash Patterns in Western Australia Kidd B., Main Roads Western Australia Willett P., Traffic Research Services Abstract Examination of crash patterns is one way of identifying key factors on which focus
5 AUTOMATED SPEED ENFORCEMENT PROPOSAL
 5 AUTOMATED SPEED ENFORCEMENT PROPOSAL The Transportation and Works Committee recommends the adoption of the recommendations contained in the following report, September 20, 2006, from the Commissioner
FORMERLY THE NATIONAL COALITION FOR MARINE CONSERVATION (NCMC) Billfish Conservation Act Implementing Regulations; NOAA-NMFS
 Billfish Conservation Act Implementing Regulations; NOAA-NMFS") FORMERLY THE NATIONAL COALITION FOR MARINE CONSERVATION (NCMC) Kim Marshall Fishery Policy Analyst National Marine Fisheries Service 1315 East-West Highway, SSMC3 Silver Spring, MD 20910 July 3, 2013 Subject:
FORMERLY THE NATIONAL COALITION FOR MARINE CONSERVATION (NCMC) Kim Marshall Fishery Policy Analyst National Marine Fisheries Service 1315 East-West Highway, SSMC3 Silver Spring, MD 20910 July 3, 2013 Subject:
City of Tamarac, Florida Traffic Calming Policy
 City of Tamarac, Florida Traffic Calming Policy Temp. Reso. 12614 Exhibit 1 I. Introduction: The City of Tamarac recognizes that the conditions of residential streets can greatly affect neighborhood livability
1999 On-Board Sacramento Regional Transit District Survey
 SACOG-00-009 1999 On-Board Sacramento Regional Transit District Survey June 2000 Sacramento Area Council of Governments 1999 On-Board Sacramento Regional Transit District Survey June 2000 Table of Contents
ADOT Statewide Bicycle and Pedestrian Program Summary of Phase IV Activities APPENDIX B PEDESTRIAN DEMAND INDEX
 ADOT Statewide Bicycle and Pedestrian Program Summary of Activities APPENDIX B PEDESTRIAN DEMAND INDEX May 24, 2009 Pedestrian Demand Index for State Highway Facilities Revised: May 29, 2007 Introduction
CASE STUDY. Compressed Air Control System. Industry. Application. Background. Challenge. Results. Automotive Assembly
 Compressed Air Control System Industry Automotive Assembly Application Savigent Platform and Industrial Compressed Air Systems Background This automotive assembly plant was using over 40,000 kilowatt hours
CITY OF VISTA TRAFFIC CALMING PROGRAM
 CITY OF VISTA TRAFFIC CALMING PROGRAM The purpose of the Vista Traffic Calming Program is to reduce speeds of motorists driving through residential neighborhoods. The program does not apply to nonresidential
CITY OF COCONUT CREEK IMPLEMENTATION GUIDELINES FOR TRAFFIC CALMING
 CITY OF COCONUT CREEK IMPLEMENTATION GUIDELINES FOR TRAFFIC CALMING I. Introduction: The City of Coconut Creek recognizes that the conditions of residential streets can greatly affect neighborhood livability;
CITY OF WEST KELOWNA COUNCIL POLICY MANUAL
 CITY OF WEST KELOWNA COUNCIL POLICY MANUAL Page 1 of 7 DEPARTMENT: Engineering Services SUBJECT: Traffic Calming Policy (Revised June 6, 2017) Policy Statement: The provision of traffic calming measures
The Florida Bicycle and Pedestrian Partnership Council
 The Florida Bicycle and Pedestrian Partnership Council Input to the Update of the Florida Transportation Plan March 2015 This document presents input from the Florida Bicycle and Pedestrian Advisory Council
[ Fundación PONS ] [ Fundación PONS ] [ Expertise PONS ] Investing in road safety
![[ Fundación PONS ] [ Fundación PONS ] [ Expertise PONS ] Investing in road safety](/thumbs/73/68505603.jpg "[ Fundación PONS ] [ Fundación PONS ] [ Expertise PONS ] Investing in road safety") With more than 60 years experience, PONS is a leading company in the fields of road safety and sustainable transportation planning, providing worldwide support with auditing, consultancy and training services,
With more than 60 years experience, PONS is a leading company in the fields of road safety and sustainable transportation planning, providing worldwide support with auditing, consultancy and training services,
CARJACKING. in New Jersey FOR THE YEAR ENDING DECEMBER 31, 2015 NEW JERSEY STATE POLICE UNIFORM CRIME REPORTING UNIT
 2015 CARJACKING in New Jersey FOR THE YEAR ENDING DECEMBER 31, 2015 NEW JERSEY STATE POLICE UNIFORM CRIME REPORTING UNIT TWENTY-THIRD ANNUAL CARJACKING OFFENSE REPORT 2015 Honorable Christopher S. Porrino
Quassapaug Sailing Center Rules for Buildings and Grounds Amended January 2017
 Quassapaug Sailing Center Rules for Buildings and Grounds Amended January 2017 I. Buildings and Grounds Committee 1. The Buildings and Grounds Rules shall be enacted and enforced by the Board of Directors.
Frequently asked questions
 Frequently asked questions Improving recreational boating safety Who will be most affected by these reforms? The primary focus of the reforms is the estimated 676 000 recreational marine licence holders
PRELIMINARY DRAFT FIRST AMENDMENT TO VISION 2050: A REGIONAL LAND USE AND TRANSPORTATION PLAN FOR SOUTHEASTERN WISCONSIN
 PRELIMINARY DRAFT FIRST AMENDMENT TO VISION 2050: A REGIONAL LAND USE AND TRANSPORTATION PLAN FOR SOUTHEASTERN WISCONSIN ESTABLISHING TARGETS FOR FEDERAL PERFORMANCE MEASURES: HIGHWAY SAFETY SOUTHEASTERN
2013 Asia Pacific Cargo Theft Report
 2013 Asia Pacific Cargo Theft Report Introduc on Summary 2013 ASIA PACIFIC CARGO THEFT REPORT Introduc on TAPA records cargo the ac vity around the globe, categorizing stolen loads under 27 different product
CARJACKING. in New Jersey
 CARJACKING in New Jersey 2 01 6 TWENTY-FOURTH ANNUAL CARJACKING OFFENSE REPORT 2016 Honorable Gurbir S. Grewal Attorney General State of New Jersey Patrick J. Callahan Colonel New Jersey State Police Major
National Oceanic and Atmospheric Administration. Fisheries of the Caribbean, Gulf of Mexico, and South
 This document is scheduled to be published in the Federal Register on 07/13/2016 and available online at http://federalregister.gov/a/2016-16510, and on FDsys.gov Billing Code: 3510-22-P DEPARTMENT OF
METHODOLOGY. Signalized Intersection Average Control Delay (sec/veh)
") Chapter 5 Traffic Analysis 5.1 SUMMARY US /West 6 th Street assumes a unique role in the Lawrence Douglas County transportation system. This principal arterial street currently conveys commuter traffic
Chapter 5 Traffic Analysis 5.1 SUMMARY US /West 6 th Street assumes a unique role in the Lawrence Douglas County transportation system. This principal arterial street currently conveys commuter traffic
CHAPTER 10 TOTAL RECREATIONAL FISHING DAMAGES AND CONCLUSIONS
 CHAPTER 10 TOTAL RECREATIONAL FISHING DAMAGES AND CONCLUSIONS 10.1 INTRODUCTION This chapter provides the computation of the total value of recreational fishing service flow losses (damages) through time
Cargo Theft IN ASIA 2013 SUPPLY CHAIN INTELLIGENCE CENTER:
 SUPPLY CHAIN INTELLIGENCE CENTER: Cargo Theft IN ASIA 213 FreightWatch International 51 Capital of Texas Hwy, Suite A2 Austin, Texas 78731 512.225.649 www.freightwatchintl.com INTRODUCTION FreightWatch
ENHANCED PARKWAY STUDY: PHASE 2 CONTINUOUS FLOW INTERSECTIONS. Final Report
 Preparedby: ENHANCED PARKWAY STUDY: PHASE 2 CONTINUOUS FLOW INTERSECTIONS Final Report Prepared for Maricopa County Department of Transportation Prepared by TABLE OF CONTENTS Page EXECUTIVE SUMMARY ES-1
Utilization of the spare capacity of exclusive bus lanes based on a dynamic allocation strategy
 Urban Transport XX 173 Utilization of the spare capacity of exclusive bus lanes based on a dynamic allocation strategy X. Wang 1 & Q. Li 2 1 Department of Transportation Management Engineering, Zhejiang
Evan Johnson, Tindale Oliver & Associates. Alan Danaher, P.E., PTOE, AICP, PTP
 To: Copies: From: Evan Johnson, Tindale Oliver & Associates Matt Muller, RTS Jesus Gomez, RTS Alan Danaher, P.E., PTOE, AICP, PTP Date: January 14, 2014 Subject: Ridership Projections Gainesville Streetcar
ISSUING AGENCY: New Mexico Department of Game and Fish. [ NMAC - Rp, NMAC, 01/01/2018]
![ISSUING AGENCY: New Mexico Department of Game and Fish. [ NMAC - Rp, NMAC, 01/01/2018]](/thumbs/92/108503268.jpg "ISSUING AGENCY: New Mexico Department of Game and Fish. [ NMAC - Rp, NMAC, 01/01/2018]") TITLE 19 CHAPTER 30 PART 8 NATURAL RESOURCES AND WILDLIFE WILDLIFE ADMINISTRATION GUIDE AND OUTFITTER REGISTRATION 19.30.8.1 ISSUING AGENCY: New Mexico Department of Game and Fish. [19.30.8.1 NMAC - Rp,
TITLE 19 CHAPTER 30 PART 8 NATURAL RESOURCES AND WILDLIFE WILDLIFE ADMINISTRATION GUIDE AND OUTFITTER REGISTRATION 19.30.8.1 ISSUING AGENCY: New Mexico Department of Game and Fish. [19.30.8.1 NMAC - Rp,
CHAPTER 71: TRAFFIC RULES. Operation Generally. Accidents. Prohibitions
 CHAPTER 71: TRAFFIC RULES Section 71.01 Obstructing traffic 71.02 Reverse or U turns 71.03 Backing vehicles 71.04 Vehicles crossing sidewalks 71.05 Speed limits 71.15 Duty of operator 71.16 Accident report
2012 TOWN OF CASTLE ROCK MOTOR VEHICLE ACCIDENT FACTS PREPARED BY THE PUBLIC WORKS DEPARTMENT
 ATTACHMENT A 2012 TOWN OF CASTLE ROCK MOTOR VEHICLE ACCIDENT FACTS PREPARED BY THE PUBLIC WORKS DEPARTMENT ACKNOWLEDGEMENTS This report was assembled from data provided by the Castle Rock Police Department
Compression Study: City, State. City Convention & Visitors Bureau. Prepared for
 : City, State Prepared for City Convention & Visitors Bureau Table of Contents City Convention & Visitors Bureau... 1 Executive Summary... 3 Introduction... 4 Approach and Methodology... 4 General Characteristics
A Preliminary Examination of Marcellus Shale Drilling Activity and Crime Trends in Pennsylvania
 A Preliminary Examination of Marcellus Shale Drilling Activity and Crime Trends in Pennsylvania Prepared by: Lindsay Kowalski, MA Research Associate Justice Center for Research The Pennsylvania State University
Actuarial Analysis for Industry-Wide Rate Adjustment November 1, 2007
 31 May 2007 Actuarial Analysis for Industry-Wide Rate Adjustment November 1, 2007 Prepared for the MOWDoc Contents Introduction Data and Reliances...1 Limitations...2 Summary of Findings...3 Recent Legislative
NOPD Crime Prevention Report. Prepared By: Sgt. Rene C. Benjamin Commander, Lakeview Crime Prevention District
 NOPD Crime Prevention Report Prepared By: Sgt. Rene C. Benjamin Commander, Lakeview Crime Prevention District TABLE OF CONTENTS INTRODUCTION... 02 OCTOBER 2018 UNIFORM CRIME BREAKDOWN... 03 OCTOBER 2018
2012 Asia Cargo Theft Report
 2012 Asia Cargo Theft Report 27 th March 2013 Introduction *Due to fluctuations in the rate of incident reporting in the Asia Pacific region, data for the region suffers a degree of fragmentation. Trends
Local Government Road Safety Summit - 9 April 2018
 Local Government Road Safety Summit - 9 April 2018 Report on outcomes The Associate Minister of Transport, Hon Julie Anne Genter held the Local Government Road Safety Summit in Wellington on 9 April 2018.
Pedestrian Safety Initiatives National Highway Traffic Safety Administration (NHTSA)
") Pedestrian Safety Initiatives National Highway Traffic Safety Administration (NHTSA) Report to the Transportation Research Board Pedestrian Safety Committee January 2010 Leah Walton Safety Countermeasures
Pedestrian Safety Initiatives National Highway Traffic Safety Administration (NHTSA) Report to the Transportation Research Board Pedestrian Safety Committee January 2010 Leah Walton Safety Countermeasures
VILLAGE OF NILES TRAFFIC CALMING POLICY
 INTRODUCTION There is increasing interest across the country in developing new strategies to reduce the speed and amount of traffic in residential neighborhoods. Measurement of speeds, traffic volumes,
THE CITY OF BAKERSFIELD BAKERSFIELD POLICE DEPARTMENT SMILE, YOU RE ON RED LIGHT CAMERA
 THE CITY OF BAKERSFIELD BAKERSFIELD POLICE DEPARTMENT SMILE, YOU RE ON RED LIGHT CAMERA SUMMARY: Red Traffic Light cameras (RTL) were first developed in the Netherlands in 1965. In 1967, an All In One
August 12, The Honorable Edmund G. Brown Jr. Governor, State of California State Capitol Sacramento, CA Dear Governor Brown:
 August 12, 2014 The Honorable Edmund G. Brown Jr. Governor, State of California State Capitol Sacramento, CA 95814 Dear Governor Brown: The (VTA) supports AB 1720 (Bloom) and respectfully requests that
A Dialogue on Handguns and Assault Weapons
 Reducing Violent Crime: A Dialogue on Handguns and Assault Weapons Engagement Paper Context The Government of Canada has committed to get handguns and assault rifles off our streets. In support of this,
Controlled Take (Special Status Game Mammal Chapter)
") Controlled Take (Special Status Game Mammal Chapter) Background of issue: The current Plan contains standards including the use of controlled take as a management response tool to assist in some situations
Controlled Take (Special Status Game Mammal Chapter) Background of issue: The current Plan contains standards including the use of controlled take as a management response tool to assist in some situations
Carjacking Offense Report
 NEW JERSEY STATE POLICE 1921 STATE OF NEW JERSEY Carjacking Offense Report For the year ending December 31, 2007. New Jersey State Police Uniform Crime Reporting Unit 2007 FIFTEENTH ANNUAL CARJACKING OFFENSE
CDRT. Child Death Review Team Dallas County. Brief Report Traffic-related Child Deaths OVERVIEW
 Dallas County CDRT Child Death Review Team 2013 Brief Report Traffic-related Child Deaths 2006-2011 OVERVIEW In Dallas County, traffic-related injury death rates among children are typically less than
Evaluating the Influence of R3 Treatments on Fishing License Sales in Pennsylvania
 Evaluating the Influence of R3 Treatments on Fishing License Sales in Pennsylvania Prepared for the: Pennsylvania Fish and Boat Commission Produced by: PO Box 6435 Fernandina Beach, FL 32035 Tel (904)
CARJACKING. In New Jersey FOR THE YEAR ENDING DECEMBER 31, 2010 NEW JERSEY STATE POLICE UNIFORM CRIME REPORTING UNIT
 2010 CARJACKING In New Jersey FOR THE YEAR ENDING DECEMBER 31, 2010 NEW JERSEY STATE POLICE UNIFORM CRIME REPORTING UNIT EIGHTEENTH ANNUAL CARJACKING OFFENSE REPORT 2010 Honorable Paula T. Dow Attorney
Prepared By: Town of Waxhaw Traffic Calming Policy
 Policy For Resolutions for Town Meetings Prepared By: Town Manager Michael McLaurin Director Greg Mahar CPD Waxhaw N.C. Community Planning &Development Administrative Department Department: Date Approved
TRAFFIC STUDY GUIDELINES Clarksville Street Department
 TRAFFIC STUDY GUIDELINES Clarksville Street Department 9/1/2009 Introduction Traffic studies are used to help the city determine potential impacts to the operation of the surrounding roadway network. Two
An Application of Signal Detection Theory for Understanding Driver Behavior at Highway-Rail Grade Crossings
 An Application of Signal Detection Theory for Understanding Driver Behavior at Highway-Rail Grade Crossings Michelle Yeh and Jordan Multer United States Department of Transportation Volpe National Transportation
Carjacking IN NEW JERSEY FOR THE YEAR ENDING DECEMBER 31, 2013 NEW JERSEY STATE POLICE UNIFORM CRIME REPORTING UNIT
 Carjacking IN NEW JERSEY FOR THE YEAR ENDING DECEMBER 31, 2013 NEW JERSEY STATE POLICE 2013 UNIFORM CRIME REPORTING UNIT TWENTY-FIRST ANNUAL CARJACKING OFFENSE REPORT 2013 Honorable John J. Hoffman Acting
CARJACKING. in New Jersey. New Jersey State Police Uniform Crime Reporting Unit. For the year ending December 31, 2008
 2008 CARJACKING in New Jersey For the year ending December 31, 2008 New Jersey State Police Uniform Crime Reporting Unit NEW JERSEY STATE POLICE 1921 SIXTEENTH ANNUAL CARJACKING OFFENSE REPORT 2008 Honorable
Carjacking IN NEW JERSEY FOR THE YEAR ENDING DECEMBER 31, 2012 NEW JERSEY STATE POLICE UNIFORM CRIME REPORTING UNIT
 2012 Carjacking IN NEW JERSEY FOR THE YEAR ENDING DECEMBER 31, 2012 NEW JERSEY STATE POLICE UNIFORM CRIME REPORTING UNIT TWENTIETH ANNUAL CARJACKING OFFENSE REPORT 2012 Honorable John J. Hoffman Acting
The Local Area Crime Survey:
 U.S. Department of Justice Office of Justice Programs The Local Area Crime Survey: A Companion to the National Crime Victimization Survey Grace Kena Association of State Uniform Crime Reporting Programs
7. Catch Balancing. 7.1 Catch Balancing
 7. Catch Balancing While ITQ based systems focus on individual species management, many species are caught simultaneously. Individual fishers can target multiple species at once while in other cases a
Operating Engineers Agreement
 2014-2016 Operating Engineers Agreement TABLE OF CONTENTS Click on any heading below to view text Section Page Parties to Agreement... 1 Purpose... 1 Article I- General Provisions... 1 Definitions... Par.
Bicycle and Pedestrian Level of Service Evaluation
 Bicycle and Pedestrian Level of Service Evaluation June 214 Florida Department of Transportation Bicycle and Pedestrian Evaluation Prepared by Sprinkle Consulting Cambridge Systematics For the Florida
2001 REVIEW OF THE ATLANTIC STATES MARINE FISHERIES COMMISSION FISHERY MANAGEMENT PLAN FOR WEAKFISH (Cynoscion regalis)
") 2001 REVIEW OF THE ATLANTIC STATES MARINE FISHERIES COMMISSION FISHERY MANAGEMENT PLAN FOR WEAKFISH (Cynoscion regalis) Plan Review Team Rick Cole, DE Louis Daniel, NC Charles Lesser, DE Rob O Reilly,
2001 REVIEW OF THE ATLANTIC STATES MARINE FISHERIES COMMISSION FISHERY MANAGEMENT PLAN FOR WEAKFISH (Cynoscion regalis) Plan Review Team Rick Cole, DE Louis Daniel, NC Charles Lesser, DE Rob O Reilly,
Prepared By: Environmental Preservation Committee REVISED: 3/29/05. Please see last section for Summary of Amendments
 SENATE STAFF ANALYSIS AND ECONOMIC IMPACT STATEMENT (This document is based on the provisions contained in the legislation as of the latest date listed below.) BILL: SB 1866 Prepared By: Environmental
We believe the following comments and suggestions can help the department meet those goals.
 The Honorable Secretary Anthony Foxx The Secretary of Transportation United States Department of Transportation 1200 New Jersey Avenue, SE Washington, DC 20590 August 30, 2013 Dear Secretary Foxx, Thank
The Party Is Over U.S. Automotive Outlooks
 The Party Is Over U.S. Automotive Outlooks Yen Chen Senior Research Economist Center for Automotive Research Federal Reserve Bank of Chicago Economic Outlook Symposium December 1, 2017 U.S. Light Vehicle
CITES Management Authority
 SC70 Doc. 56 Annex 7 Notification to the Parties No. 2018/040 Annex naire on the implementation of Resolution Conf. 9.14 (Rev. CoP17) and measures to prevent and combat rhinoceroses poaching and trafficking
COMMERCIAL AND FARM VEHICLE THEFT IN URBAN AND RURAL AUSTRALIA HEDYEH HEDAYATI
 SOUTHERN RURAL SOCIOLOGY, 23(2), 2008, pp. 54-77 Copyright by the Southern Rural Sociological Association COMMERCIAL AND FARM VEHICLE THEFT IN URBAN AND RURAL AUSTRALIA HEDYEH HEDAYATI NATIONAL CARS PROJECT
Reduction of Speed Limit at Approaches to Railway Level Crossings in WA. Main Roads WA. Presenter - Brian Kidd
 Australasian College of Road Safety Conference A Safe System: Making it Happen! Melbourne 1-2 September 2011 Reduction of Speed Limit at Approaches to Railway Level Crossings in WA Radalj T 1, Kidd B 1
Briefing Paper #1. An Overview of Regional Demand and Mode Share
 2011 Metro Vancouver Regional Trip Diary Survey Briefing Paper #1 An Overview of Regional Demand and Mode Share Introduction The 2011 Metro Vancouver Regional Trip Diary Survey is the latest survey conducted
K-10 in Douglas and Johnson Counties
 KANSAS DEPARTMENT OF TRANSPORTATION K-10 in Douglas and Johnson Counties 2014 Corridor Review - Final Report Kansas Department of Transportation 12/8/2014 In response to concerns about median crossover
Department of Legislative Services Maryland General Assembly 2007 Special Session FISCAL AND POLICY NOTE
 Department of Legislative Services Maryland General Assembly 2007 Special Session HB 45 FISCAL AND POLICY NOTE House Bill 45 Ways and Means (Delegate G. Clagett) Public School Construction - Funding -
Traffic Engineer s Annual Report
 Traffic Engineer s Annual Report Fiscal Year Ended June 30, 2012 STATE OF FLORIDA DEPARTMENT OF TRANSPORTATION Florida Department of Transportation January 22, 2013 Mrs. Nicola A. Liquori, C.P.A. Chief
Comprehensive Measures to Reduce Traffic Accident Fatalities
 Comprehensive Measures to Reduce Traffic Accident Fatalities Outcomes: 4,621 people died as a result of traffic accidents in 2015. It represents 4% decrease compared to 2014. Year 2012 2013 2014 2015 Traffic