DRAFT Step 3 Roundabout Evaluation
|
|
|
- Leslie Stephens
- 6 years ago
- Views:
Transcription

1 DRAFT Step 3 Roundabout Evaluation Geometric and Operational Analysis SR 655 (Recker Highway) at Thornhill Road Polk County, Florida Financial Management Number: Federal-Aid Project Number: N/A District 1 August 2017 Date Fl. Professional Engineer #73812 Michael F. Sasse, PE Patel, Greene & Associates, PLLC 400 W. Morse Blvd., Suite 103 Winter Park, Florida Certificate of Authorization No
2 FPID SR 655 (Recker Highway) Submitted By: Patel, Greene & Associates, PLLC Date: August 2017 TABLE OF CONTENTS Step 3 Roundabout Summary Report 1 Fastest Path Calculations 2-3 Roundabout Concept 4 Fastest Paths Analysis 5-7 WB-62FL Analysis 8-10 Stopping Sight Distance 11 Intersection Sight Distance BACKGROUND AND SUPPORT INFORMATION Appendix A-A Appendix B-B Appendix C-C Appendix D-D Step 1 & Step 2 Roundabout Evaluation Roundabout Movement Summary NCHRP 672 Reference Materials Wisconsin DOT: Creating Roundabout Fastest Paths (Spline Curves) in Microstation Version 8i
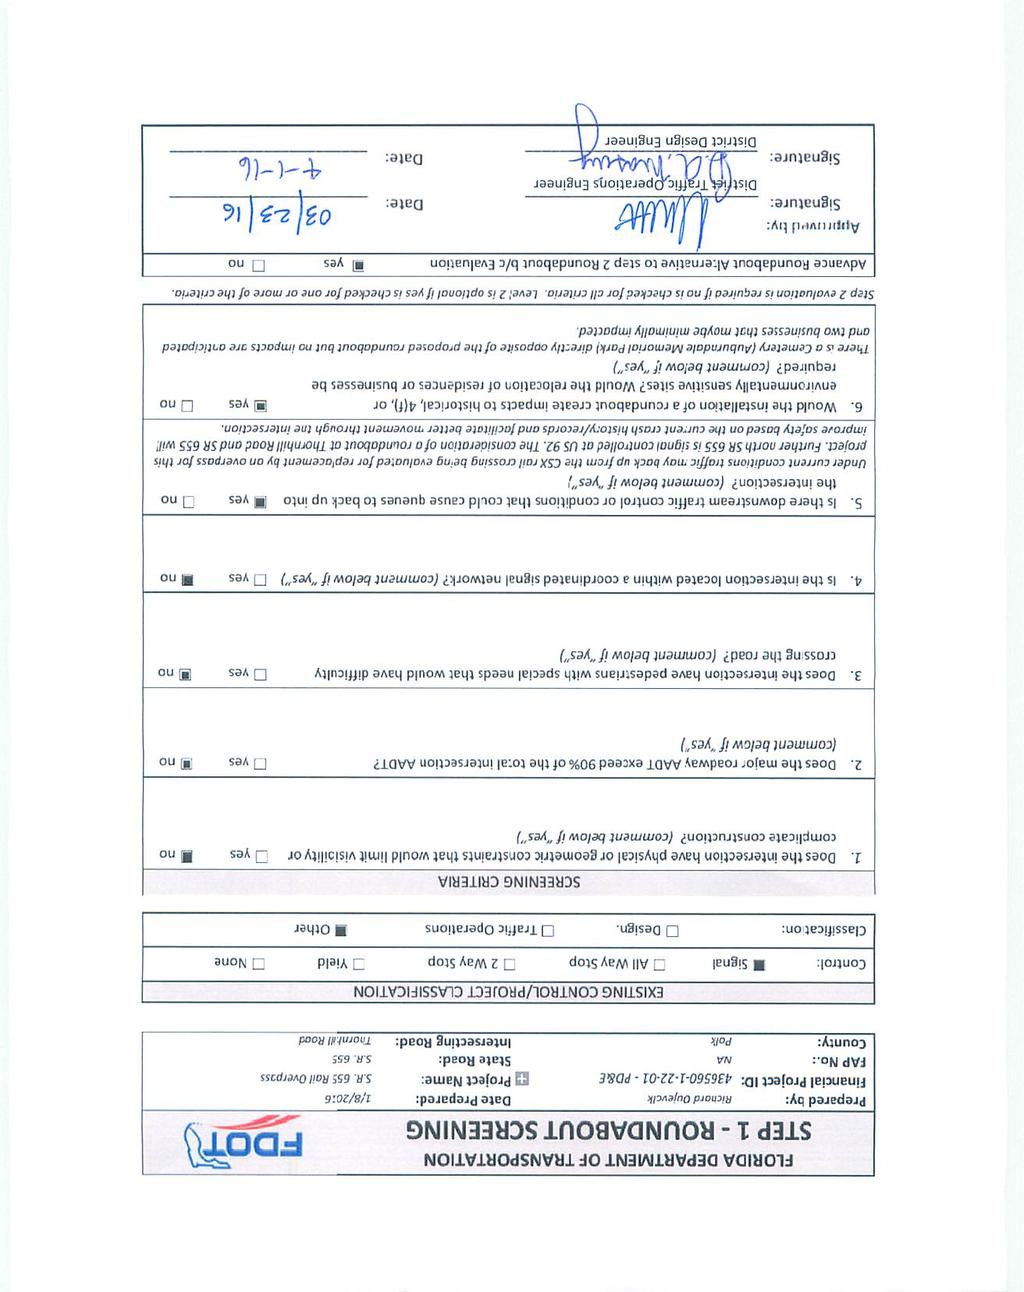
3 FLORIDA DEPARTMENT OF TRANSPORTATION STEP 3 ROUNDABOUT SUMMARY REPORT Prepared by: Financial Project No: FAP No.: County: Date Prepared: Project Name: State Road: Intersecting Road: Michael Sasse, PE N/A Polk County August 2017 SR 655 Thornhill Road PURPOSE AND NEED The Florida Department of Transportation is conducting an Environmental Impact Report for SR 655 (Recker Highway) in Polk County, FL. As part of this assessment, and in accordance with Section of the PPM, Volume 1, a roundabout alternative at the intersection of Thornhill Road must be evaluated as part of this reconstruction project. Roundabouts encourage lower speeds on the approach to and within the circulatory roadway, thereby enhancing safety. Step 1 - Roundabout Screening Summary: Results from the Step 1 screening showed that a roundabout at Thornhill Road is a viable alternative. Based on the favorable results of the screening criteria the District Traffic Operations and District Design Engineer have approved the decision to advance the roundabout to a Step 2 b/c Evaluation. Step 2 - Roundabout b/c Evaluation: Two different alternatives were evaluated during the Step 2 analysis. The benefit to cost ratio for roundabout Alt 1 and Alt 2 are 4.3 and 4.4 respectively showing that a roundabout has a higher benefit (in terms of safety) than a signalized intersection. The District Traffic Operations Engineer and District Design Engineer approved the decision to advance the roundabout screening to Step 3. Upon further review by the Department, it was determined to evaluate Alt 2 for Geometric and Operational Analysis. OPERATIONAL ANALYSIS RESULTS Direction Street Name No. Entry Lanes Control Delay (s) LOS SB (AM) SR 655 (Recker Highway) A NB (AM) SR 655 (Recker Highway) A WB (AM) Thornhill Road C SB (PM) SR 655 (Recker Highway) A NB (PM) SR 655 (Recker Highway) A WB (PM) Thornhill Road C GEOMETRIC PERFORMANCE CHECK RESULTS Swept Path of Design Vehicle Accommodated yes no Intersection Sight Distance Satisfied yes no Fastest Path Operating Speed between 20 and 25 mph yes no Fastest Path Operation Speed between 25 and 30 mph for multilane roundabouts (per NCHRP 672) Advance Roundabout to Final Design District Traffic Operations Engineer Date: yes and no District Design Engineer Date Page 1
4 FASTEST PATH CALCULATIONS Project: SR 655 (Recker Highway) at Thornhill Road FPID: Date: 08/01/2017 Designer: Michael F. Sasse, PE Exhibit 6 46 from NCHRP 672 illustrates the five critical path radii that must be checked for each approach. R1, the entry path radius, is the minimum radius on the fastest through path prior to the entrance line. R2, the circulating path radius, is the minimum radius on the fastest though path around the central island. R3, the exit path radius, is the minimum radius on the fastest though path into the exit. R4, the left turn path radius, is the minimum radius on the path of the conflicting left turn movement. R5, the right turn path radius, is the minimum radius on the fastest path of a right turning vehicle. It is important to note that these vehicular path radii are not the same as the curb radii. The R1 through R5 radii measured in this procedure represent the vehicle centerline in its path though the roundabout. NCHRP 672 Exhibit 6 47 Page 2
5 SR 655 (Recker Highway) at Thornhill Road Roundabout Fastest Path Performance Check Approach Eastbound (Thornhill Rd.) Northbound (SR 655) Critical Path Critical Path Radius (FT) Vehicle Speed in MPH (NCHRP Eq 6 2) Max Entry Speed between mph (NCHRP Ex 6 47) R YES R R3 N/A N/A R R R R R R4 N/A N/A R Dist. between mid. R2 & and crosswalk location at R3 Vehicle Exit Speed in MPH (NCHRP Eq 6 4) N/A N/A YES R1 R2 Westbound N/A R3 R4 R5 Southbound (SR 655) R1 R2 R3 R4 R N/A N/A YES Page 3
6 1" = 60' N S R 10 ' R 1 20' 2 2 ' 2 2 ' 7 ' ' 7 ' 2 2 ' ' R ' 100 ' 5' 11 ' 14 R R ' 70 R 7' 1 6 ' R ' 14 22' ' 1 4 ' 10' 7' ' 80 R 1 10' 11' 22' 0' 10 SR ' 1 1 ' 5 1 ' 1 1 D R H T H N R O L IL REVISIONS DATE DESCRIPTION DATE STATE OF FLORIDA DESCRIPTION DEPARTMENT OF TRANSPORTATION ROAD NO. COUNTY SHEET SR 655 AT THORNHILL RD ROUNDABOUT CONCEPT SR 655 NO. FINANCIAL PROJECT ID POLK Mike.Sasse 8/17/2017 3:14:41 PM 4 C:\Users\mike.sasse\Desktop\ Recker Hwy\roadway\PLANRD00.DGN
7 5' 5' SR 655 N R4 = 65 FT V = 16 MPH Feet 5' 5' R1 = 290 FT V = 28 MPH 5' R2 = 78 FT V = 17 MPH 5' 5' 5' SR 655 5' 5' R3 = 350 FT V = 30 MPH 5' THORNHILL RD SOUTHBOUND APPROACH DATE DESCRIPTION REVISIONS DATE DESCRIPTION STATE OF FLORIDA DEPARTMENT OF TRANSPORTATION SR 655 AT THORNHILL RD SHEET NO. ROAD NO. SR 655 COUNTY POLK FINANCIAL PROJECT ID FASTEST PATHS 5 Mike.Sasse 8/20/2017 9:34:30 PM C:\Users\mike.sasse\Desktop\ Recker Hwy\roadway\PLANRD01.DGN
8 5' SR 655 N Feet 5' 5' R5 = 113 FT V = 20 MPH R4 = 67 FT V = 16 MPH 5' 5' R2 = 80 FT V = 17 MPH 5' 5' SR 655 5' 5' THORNHILL RD R1 = 220 FT V = 25 MPH 5' 5' EASTBOUND APPROACH DATE DESCRIPTION REVISIONS DATE 5' DESCRIPTION STATE OF FLORIDA DEPARTMENT OF TRANSPORTATION SR 655 AT THORNHILL RD SHEET NO. ROAD NO. SR 655 COUNTY POLK FINANCIAL PROJECT ID FASTEST PATHS 6 Mike.Sasse 8/20/2017 9:34:31 PM C:\Users\mike.sasse\Desktop\ Recker Hwy\roadway\PLANRD02.DGN
9 5' 5' SR 655 R3 = 689 FT V = 38 MPH N Feet R2 = 350 FT V = 30 MPH 5' 5' R1 = 226 FT V = 25 MPH 5' SR 655 5' 5' 5' 5' THORNHILL RD 5' R5 = 325 FT V = 29 MPH NORTHBOUND APPROACH DATE DESCRIPTION REVISIONS DATE DESCRIPTION STATE OF FLORIDA DEPARTMENT OF TRANSPORTATION SR 655 AT THORNHILL RD SHEET NO. ROAD NO. SR 655 COUNTY POLK FINANCIAL PROJECT ID FASTEST PATHS 7 Mike.Sasse 8/20/2017 9:34:31 PM C:\Users\mike.sasse\Desktop\ Recker Hwy\roadway\PLANRD03.DGN
10 (c) 2016 Transoft Solutions, Inc. All rights reserved. (c) 2016 Transoft Solutions, Inc. Al rights reserved. WB- 62L FL PPM 2013 (US) 1" = 60' WB- 62L FL PPM 2013 (US) N SR 655 SR 655 (c) 2016 Transoft Solutions, Inc. All rights reserved. WB-62L FL PPM 2013 (US) THORNHILL RD WB-62L (c) 2016 Transoft Solutions, Inc. All rights reserved. FL PPM 2013 (US) DATE DESCRIPTION REVISIONS DATE DESCRIPTION STATE OF FLORIDA DEPARTMENT OF TRANSPORTATION ROAD NO. COUNTY FINANCIAL PROJECT ID SR 655 POLK SR 655 AT THORNHILL RD WB-62FL ANALYSIS SHEET NO. 8 Mike.Sasse 8/17/2017 3:09:21 PM C:\Users\mike.sasse\Desktop\ Recker Hwy\roadway\PLANRD04.DGN
11 FL PPM 2013 (US) (c) 2016 Transoft Solutions, Inc. All rights reserved. WB-62L (c) 2016 Transoft Solutions, Inc. All rights reserved. FL PPM 2013 (US) P (c) 2016 Transoft Solutions, Inc. All rights reserved. AASHTO 2011 (US) WB-62L FLPPM 2013 (US) (c) 2016 Transoft Solutions, Inc. All rights reserved. (c) 2016 Transoft Solutions, Inc. Al rights reserved. AASHTO 2011 (US) (c) 2016 Transoft Solutions, Inc. Al rights reserved. 1" = 60' N WB- 62L SR 655 P SR 655 WB-62L FLPPM 2013 (US) THORNHILL RD DATE DESCRIPTION REVISIONS DATE DESCRIPTION STATE OF FLORIDA DEPARTMENT OF TRANSPORTATION ROAD NO. COUNTY FINANCIAL PROJECT ID SR 655 POLK SR 655 AT THORNHILL RD WB-62FL ANALYSIS SHEET NO. 9 Mike.Sasse 8/17/2017 3:09:21 PM C:\Users\mike.sasse\Desktop\ Recker Hwy\roadway\PLANRD05.DGN
12 WB-62L (c) 2016 Transoft Solutions, Inc. Al rights reserved. FLPPM 2013 (US) (c) 2016 Transoft Solutions, Inc. All rights reserved. FLPPM 2013 (US) 1" = 60' N SR 655 SR 655 WB-62L WB-62L (c) 2016 Transoft Solutions, Inc. Al rights reserved. FL PPM 2013 (US) THORNHILL RD WB-62L (c) 2016 Transoft Solutions, Inc. All rights reserved. FL PPM 2013 (US) DATE DESCRIPTION REVISIONS DATE DESCRIPTION STATE OF FLORIDA DEPARTMENT OF TRANSPORTATION ROAD NO. COUNTY FINANCIAL PROJECT ID SR 655 POLK SR 655 AT THORNHILL RD WB-62FL ANALYSIS SHEET NO. 10 Mike.Sasse 8/17/2017 3:09:22 PM C:\Users\mike.sasse\Desktop\ Recker Hwy\roadway\PLANRD06.DGN
13 P AASHTO 2011 (US) P AASHTO 2011 (US) P AASHTO 2011 (US) AASHTO 2011 (US) 1" = 60' AASHTO 2011 (US) P SR 655 N CIRCULATOR SPEED = 17 MPH PER R4 FASTEST PATH ANALYSIS SSD = 90.4 FT SR SOUTHBOUND APPROACH DESIGN SPEED = 35 MPH STOPPING SIGHT DISTANCE PER NCHRP 672 (EQ 6-5) SSD = FT SR NORTHBOUND APPROACH DESIGN SPEED = 35 MPH STOPPING SIGHT DISTANCE PER NCHRP 672 (EQ 6-5) SSD = FT P AASHTO 2011 (US) P P AASHTO 2011 (US) SR 655 SR EASTBOUND APPROACH DESIGN SPEED = 35 MPH STOPPING SIGHT DISTANCE PER NCHRP 672 (EQ 6-5) SSD = FT THORNHILL RD P AASHTO 2011 (US) P AASHTO 2011 (US) SSD ON THE APPROACHES AND CIRCULATORY ROADWAY DATE DESCRIPTION REVISIONS DATE DESCRIPTION STATE OF FLORIDA DEPARTMENT OF TRANSPORTATION ROAD NO. COUNTY FINANCIAL PROJECT ID SR 655 POLK SR 655 AT THORNHILL RD STOPPING SIGHT DISTANCE SHEET NO. 11 Mike.Sasse 8/22/2017 1:33:37 PM C:\Users\mike.sasse\Desktop\ Recker Hwy\roadway\PLANRD07.DGN
14 P AASHTO 2011 (US) P AASHTO 2011 (US) 1" = 60' SR 655 N SR SOUTHBOUND APPROACH CHECK OF TWO CONFLICTING TRAFFIC STREAMS: ENTERING STREAM SPEED (AVE. R1 & R2) = N/A (THERE IS NO WB APPROACH) ENTERING SIGHT DISTANCE (NCHRP 672 EQ 6-6) = N/A (THERE IS NO WB APPROACH) CIRCULATING STREAM SPEED (R4) = 17 MPH CIRULATING STREAM DISTANCE (NCHRP 672 EQ 6-7) = 125 FT 125 FT SR NORTHBOUND APPROACH CHECK OF TWO CONFLICTING TRAFFIC STREAMS: ENTERING STREAM SPEED (AVE. R1 & R2) = 21 MPH ENTERING SIGHT DISTANCE (NCHRP 672 EQ 6-6) = 155 FT CIRCULATING STREAM SPEED (R4) = 17 MPH CIRULATING STREAM DISTANCE (NCHRP 672 EQ 6-7) = 125 FT 125 FT 155' SR 655 THORNHILL RD DATE DESCRIPTION REVISIONS DATE DESCRIPTION STATE OF FLORIDA DEPARTMENT OF TRANSPORTATION SR 655 AT THORNHILL RD SHEET NO. ROAD NO. SR 655 COUNTY POLK FINANCIAL PROJECT ID INT. SIGHT DISTANCE 12 Mike.Sasse 8/22/2017 1:33:38 PM C:\Users\mike.sasse\Desktop\ Recker Hwy\roadway\PLANRD08.DGN
15 P 1" = 60' SR 655 N 170 FT 125 FT SR 655 AASHTO 2011 (US) SR EASTBOUND APPROACH CHECK OF TWO CONFLICTING TRAFFIC STREAMS: ENTERING STREAM SPEED (AVE. R1 & R2) = 23 MPH ENTERING SIGHT DISTANCE (NCHRP 672 EQ 6-6) = 170 FT THORNHILL RD CIRCULATING STREAM SPEED (R4) = 17 MPH CIRULATING STREAM DISTANCE (NCHRP 672 EQ 6-7) = 125 FT DATE DESCRIPTION REVISIONS DATE DESCRIPTION STATE OF FLORIDA DEPARTMENT OF TRANSPORTATION ROAD NO. COUNTY FINANCIAL PROJECT ID SR 655 POLK SR 655 AT THORNHILL RD INT. SIGHT DISTANCE SHEET NO. 13 Mike.Sasse 8/22/2017 1:33:38 PM C:\Users\mike.sasse\Desktop\ Recker Hwy\roadway\PLANRD09.DGN
16 APPENDIX A-A Step 1 & Step 2 Roundabout Evaluation
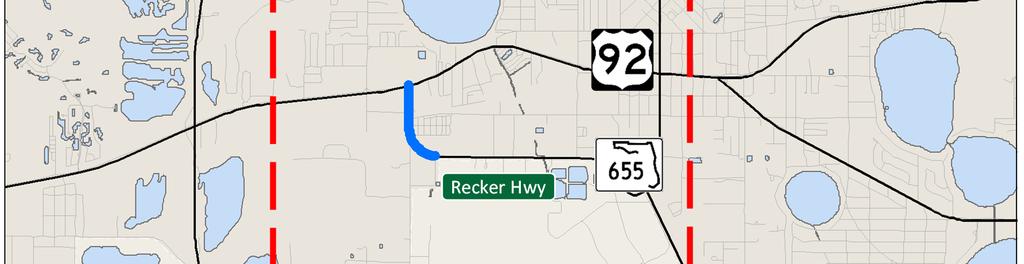
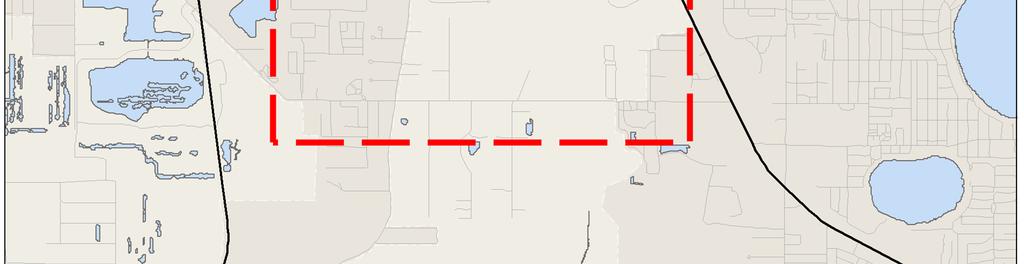
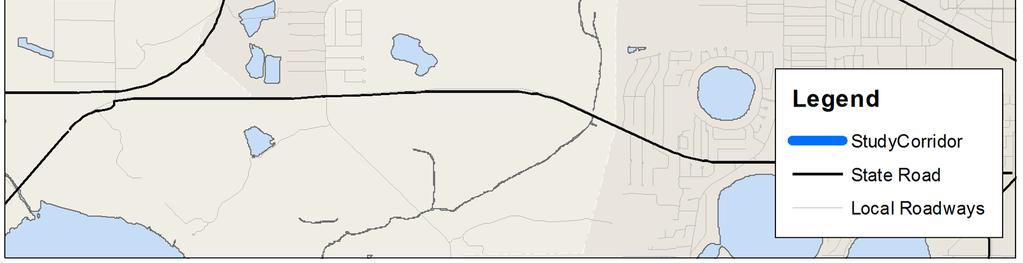
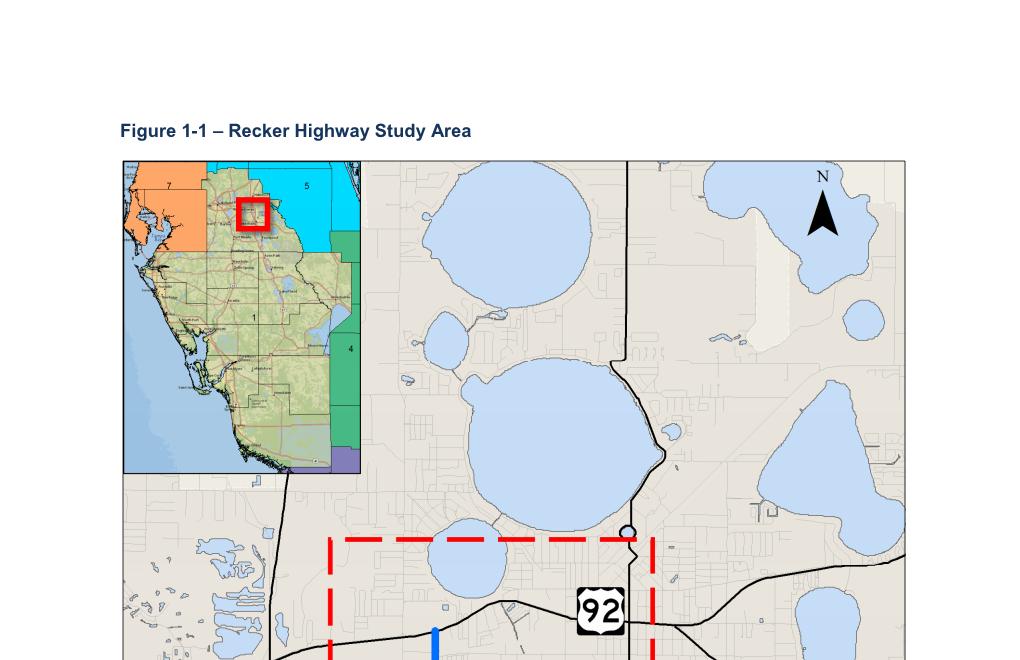
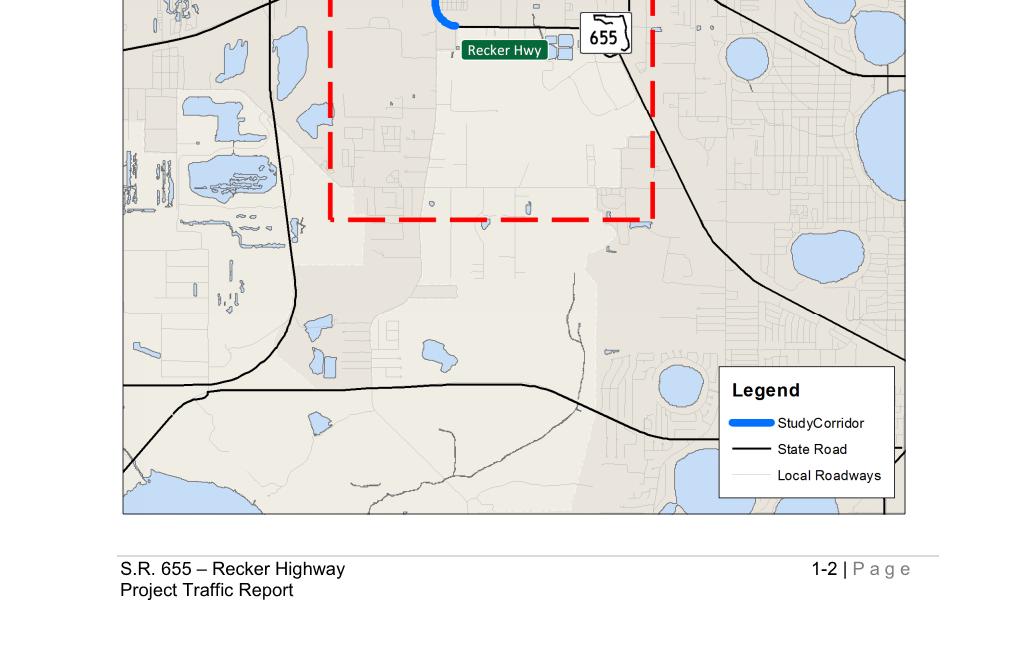
17 101 West Main Street Suite 240 Lakeland, FL Phone Fax Date: January 16, 2017 To: Tyler Wallum, Volkert PM Patrick Bateman, PM FDOT From: Dawn Carlson-RK&K CC: RK&K Daniel Miller, Charles Bleam Re: SR 655 (Recker Highway) Step 2 - Roundabout Evaluation FINAL Introduction The Florida Department of Transportation is conducting an Environmental Impact Report for SR 655 (Recker Highway) in Auburndale, Florida. As part of this assessment in accordance with FDOT policy stated within Section of the Plans Preparation Manual and Design Bulletins (Roadway)/02-15 (Traffic Operations) an analysis was conducted for roundabouts at the following intersections within the project: Thornhill Road (existing traffic signal M.P ) US 92/SR 600 (existing traffic signal M.P ) The initial Step 1 Roundabout Screening was completed in February 2016 (See Appendix A: Roundabout Evaluation Technical Memorandum) to determine if roundabouts are viable at the subject locations. Figure 1 shows the project location. Figure 2 shows the two subject intersections. Results from Step 1 showed that traffic volumes at the US 92/SR 600 intersection exceeded the thresholds for roundabout traffic volumes. Therefore, the US 92 intersection was removed from further study, and a roundabout at Thornhill Road is viable and a Benefit/Cost Analysis (Step 2) should be conducted for the Thornhill Road intersection. The purpose of this memorandum is to document the Step 2 analysis performed for the Recker Highway and Thornhill Road intersection. Step 2 Roundabout Benefit Cost (BC) Analysis for the Recker Highway/Thornhill Road intersection The Step 2 Roundabout BC Evaluation Spreadsheet dated March 2015 from the Florida Department of Transportation was used to compare roundabout costs to an improved traffic signal intersection at Thornhill Road. Figure 3 through Figure 5 show the layouts for Roundabout Alternative A, Roundabout Alternative B, and for an improved traffic signal intersection. With the proposed railroad overpass, Recker Highway will be a four lane highway through the Thornhill intersection becoming a two lane highway southeast of the intersection.
18 Roundabout Alternative A (Alt A) has two circulating lanes and utilizes short lanes for both north and southbound traffic southeast of Thornhill Road to change Recker Highway from two lanes to four lanes southeast of the proposed roundabout at Thornhill. Thornhill Road is a two lane road with an additional exit lane for right turns from southbound Recker Highway. For Roundabout Alternative B (Alt B), the roundabout has essentially one circulating lane with an additional lane for northbound traffic. Recker Highway is two lanes southeast of the roundabout with only the northbound direction having an additional short lane giving Recker Highway two lanes northbound through the roundabout. Southbound Recker highway is two lanes but at the roundabout, the right lane becomes a right turn only lane while only the left lane continues through the roundabout. Thornhill Road is two lanes with no additional exit lane. An improved signalized intersection at Recker Highway and Thornhill Road would have a four lane Recker Highway with an additional left turn lane for northbound traffic turning onto Thornhill Road and an additional right turn lane for southbound traffic turning onto Thornhill Road. Thornhill Road is two lanes with an additional left turn lane for traffic turning north onto Recker Highway. The Step 2 Roundabout BC Evaluation Spreadsheet requires the inputs discussed separately below. Benefit Cost Inputs To compare the benefit/costs of a traditional intersection option versus a roundabout option, costs associated with safety, delay to persons in vehicles, operations and maintenance, and capital construction are incorporated into the spreadsheet for comparison. Operations and Maintenance: The intersection was defined as a three leg Urban and Suburban Arterial with a Suburban area type having an existing traffic signal. For this analysis, Recker Highway has two thru lanes northbound and two thru lanes southbound, a four lane highway, for the proposed railroad overpass. For the traffic signal option, Recker Highway has an additional left turn lane northbound and an additional right turn lane southbound. Thornhill Road has one left turn lane and one right turn lane. Roundabout Alt A has two circulating lanes and Roudnabout Alt B has one circulating lane except for the northbound side of Recker Highway. Lighting is included in all alternatives. There are no red light cameras or right turn on red prohibitions. No schools, bus stops or alcohol sales establishments are within 1000 feet of the intersection. The maximum number of lanes that a pedestrian needs to cross is four. Safety Inputs: The safety inputs used in the analysis include the AADTs for Opening Year (2020) and Design Year (2040) shown in Table 1 below from the previously completed and accepted Project Development and Environment Study, S.R. 655 (Recker Highway) Project Traffic Report, June 2016 (Project Traffic Report). Table 1 Future Traffic Volumes 2020 AADT 2040 AADT Major road - Recker Highway 14,100 20,200 Minor road - Thornhill Road 7,600 11,100 Crash data from the past 6 years (November 1, 2009 through October 31, 2015) was downloaded from Signal Four Analytics crash database. Although the search parameters were from 2009 to 2015, the dates of the crashes at the existing Thornhill Road intersection location are all between September 2010 and October 2015 after the intersection was redesigned. Details of the 20 crashes at the intersection are presented in Table 2. Locations are shown in Figure 6. Pedestrian traffic is minimal at this location so an estimate of 10 pedestrians per day was used in the analysis. Page 2
19 Table 2 Crash Data and Crash Type Summaries Intersection Single Vehicle Multi- Vehicle Property Injury Fatality Pedestrial Bicycle Recker at Thornhill Intersection Rear End Left Turn Backed Into Off Road Sideswipe Rollover Animal Other Recker at Thornhill Capital Cost Inputs: Construction costs for completing the different roundabout alternatives and signalized intersection alternative were obtained from FDOT in the form of LREs and are attached in Appendix B. Estimated rightof-way costs for both roundabout alternatives were also obtained from FDOT and are listed in Appendix C. Right-of-way costs for the traffic signal intersection were estimated using the average ratio (0.828) of the ratio of Right-of-way costs to Construction costs for the roundabouts and applying that ratio to the traffic signal construction costs to estimate the traffic signal ROW cost. Preliminary engineering costs were estimated from previous roundabout construction projects completed in Polk County. All cost values are shown in Table 3. Table 3 Capital Costs Costs Signal Roundabout A Roundabout B Comments Prelim. Engineering $98,905 $220,000 $220,000 Right-of-way $428,238 $874,000 $886,000 Construction $659,368 $1,061,943 $1,061,943 From LREs TOTAL $1,186,511 $2,155,943 $2,167,943 Delay Inputs: Delays for the roundabout were calculated using SIDRA Intersection 6.1 Plus software with the District 1 standard roundabout inputs and the 2020 and 2040 Build AM and PM Directional Design Hour Volumes (DDHV) from the Project Traffic Report. Traditional signal intersection delays were taken from the Synchro outputs used in the Project Traffic Report. Delay results are shown in Table 4. SIDRA outputs for the roundabout alternatives are in Appendix D and Synchro outputs from the PTR are provided in Appendix E. Table 4 Intersection Delays and Hourly Traffic Entering Intersection Delay in seconds Hourly Traffic Entering Intersection Recker Hwy at Thornhill Rd AM PM AM PM AM PM AM PM Roundabout Alt A Roundabout Alt B Signal Page 3
20 Benefit Cost Results The benefit to cost ratio for roundabout Alt 1 and Alt 2 are 4.3 and 4.4 respectively showing that a roundabout is a higher benefit (in terms of safety) than a signalized intersection at the Recker Highway / Thornhill Road intersection. The Benefit Cost results and Life Cycle Costs for each alternative are shown in Appendix F. Our recommendation is to continue with roundabout design and the Step 3 Roundabout Summary Report shown in Figure 7. Page 4


21 Figure 1 Project Location Page 5

22 Figure 2 Intersection Locations Page 6
23 Figure 3 Roundabout Alternative A Page 7
24 Figure 4 Roundabout Alternative B Page 8
25 Figure 5 Traffic Signal Alternative Page 9

26 Figure 6 Signal Four Analytics Crash Locations 20 Crashes Reported at this Intersection from Nov. 1, 2009 to Oct. 31, HSMV Report #s Exported data from Signal Four Analytics detailing these crashes is provided as a separate file accompanying this report. Page 10


27 Figure 7 Step 3 Roundabout Summary Report Page 11
28 APPENDIX A Roundabout Evaluation Technical Memorandum (Step 1) Page 12
29 101 West Main Street Suite 240 Lakeland, FL Phone Fax Date: February 19, 2016, Revised March 3, 2016 To: Tony Sherrard PM FDOT Patrick Bateman Nicole Harris, Volkert PM From: OJ (Richard) Oujevolk-RK&K CC: RK&K Daniel Miller, Charles Bleam Re: SR 655 (Recker Highway) Roundabout Evaluation Introduction The Florida Department of Transportation is conducting an Environmental Impact Report for SR 655 (Recker Highway) in Auburndale, Florida. As part of this assessment in accordance with FDOT policy stated within Section of the Plans Preparation Manual and Design Bulletins (Roadway)/02-15 (Traffic Operations) an analysis was conducted for the following intersections within the project: Thornhill Road (existing traffic signal M.P ) US 92/SR 600 (existing traffic signal M.P ) Other non-signalized intersections were not considered since the proposed improvement is a bridge overpass of the CSX railroad located at M.P and would change access for the local cross streets via service roads. Figure 1-1 shows the project location. Figure 1-2 provides a reduced version of the RCI map for SR 655 and an enlargement of the two subject intersections. Two Alternatives (1 and 2) where considered. Although very similar, the primary differences between Alternative 1 and 2 are the curb returns for the SR 655 connection to Thornhill Road. If a roundabout is chosen for this location, the roundabout design geometry will have an impact to these curb return radii. Alternative 2 is the configuration preferred with the roundabout if it advances to step 2. The initial step in the process (Step 1) is to determine if a roundabout is viable for the subject locations. Roundabout Analysis As cited within Design Bulletin 15-07,
30 Under this initial criteria, the intersection of US 92/SR 600 can be dropped from further analysis as the total entering volume at this location is 56,900 vehicles per day in the 2040 design year for the project. The SR 655/Thornhill Road intersection is under this threshold (2040 design year volume is 21,850 vpd) and will be further analyzed using the Step 1 criteria. Estimated year 2040 volumes are shown in Figure 1-3. Step 1 Roundabout Screening The Roundabout Form Step 1 Roundabout Screening was completed for the intersection. The evaluation criteria consists of six screening criteria that preclude proceeding to Step 2. The analysis is provided at the end of this report for either approval or denial by the District Design or Traffic Operations Engineer. Based on the 6 criteria cited in Step 1, Criteria 5 and 6 need further consideration. Criteria 5: Is there a downstream traffic control device that could cause queues to back up into the intersection? Yes. Under current conditions traffic may back up from the intersection of SR 655 and US 92/SR 600. Queuing analysis for that signalized intersection indicates 95 percentile queues require 275 feet plus deceleration taper. This distance will not impact the intersection but the possibility exists that under extreme conditions it may occur. Criteria 6: Would the installation of a roundabout create impacts to historical, 4(f), or environmentally sensitive sites? Yes. Would the relocation of residences or businesses be required? No. There is a cemetery (Auburndale Memorial Park) is directly opposite of the proposed roundabout but no impacts are anticipated. In addition, two businesses may have minor impacts but no relocations are anticipated. Preliminary roundabout layouts (just inscribed circles) where drawn at this location and should avoidance of the Cemetery and minor impacts to adjacent property owners. See Figures 1-4 and 1-5. Although, Criteria 5 and 6 are answered Yes, project information indicates Criteria 5 (queuing) will not impact the proposed roundabout location however, 95 th percentile queues do not indicate an impact. Criteria 6 (environmental impacts/residential and business impacts) indicate only minor impacts. It is recommended that the SR 655 at Thornhill Road intersection move forward to Step 2 (Benefit/Cost) and the concept be refined to determine if roundabout is feasible at this location.
31
32 Figure 1-2 Roundabout Analysis Locations N NTS SR SR 600 (US 92) Existing Traffic Signal M.P Road ID Step 1 Analysis Not Recommended Approved by District Design/Traffic Operations Eng. Yes: No: SR Thornhill Road Existing Traffic Signal M.P Road ID Step 1 Analysis Recommended Approved by District Design/Traffic Operations Eng. Yes: No: Existing Traffic Signal

33 Figure 1-3 Design Year 2040 AADT

34 Figure 1-4 Preliminary Roundabout Concept 1

35 Figure 1-5 Preliminary Roundabout Concept 1
36
37 APPENDIX B LRE for Roundabout LRE for Signal Page 13
38
39
40
41
42 Cost Estimates for Traffic Signal Pages from
43
44
45
46 APPENDIX C Right-of-Way Cost Estimates for Roundabout Alternatives Page 14
47 CONCEPTUAL ESTIMATE, ALTERNATES / SEGMENTS: PHASE COSTS SUMMARY The basis for this estimate is "cost" not market value ** EXEMPT FROM PUBLIC DISCLOSURE - FS: ** ITEM SEG: , COUNTY: POLK, LIMITS: COST ESTIMATE NUMBER: FOR: BY: Alternate / Segment: Tony Sherrard WS Sullivan DATE: Alternatives one and two SR 655 from Bridge Spanning CSX RR Track 6/27/2016 Description: Size Sq.Ft: Parcels Relo.Cnt Phase: 4B Phase: 41 Phase: 42 Phase: 43 Phase: 45 Total: Altternative 1 123, $78,000 $36,000 $0 $760,000 $0 $874,000 Altternative 2 126, $78,000 $36,000 $0 $772,000 $0 $886,000 $0 $0 $0 $0 $0 $0 $0 $0 $0 $0 $0 $0 $0 $0 $0 $0 $0 Total All Sheets: 250, $156,000 $72,000 $0 $1,532,000 $0 $1,760,000 #N/A
48 APPENDIX D SIDRA Delay Outputs for Roundabouts Alternative A 2020 AM 2020 PM 2040 AM 2040 PM Alternative B 2020 AM 2020 PM 2040 AM 2040 PM Synchro/HCS Delay Outputs for Traffic Signal Alternative Page 15
49 DELAY (CONTROL) Average control delay per vehicle, or average pedestrian delay (seconds) Site: Recker at Thornhill Alt 2A 2020 AM Roundabout Roundabout All Movement Classes South North West Intersection LOS A A B A Colour code based on Level of Service LOS A LOS B LOS C LOS D LOS E LOS F Continuous Level of Service Method: Delay & v/c (HCM 2010) LOS F will result if v/c > 1 irrespective of movement delay value (does not apply for approaches and intersection). Roundabout Level of Service Method: Same as Sign Control SIDRA Standard Delay Model is used. Control Delay includes Geometric Delay. SIDRA INTERSECTION 6.1 Copyright Akcelik and Associates Pty Ltd sidrasolutions.com Organisation: RUMMEL KLEPPER & KAHL LLP Processed: Monday, January 09, :03:26 PM Project: C:\Project Files\D1\SR 655 Recker Hwy\Files for Roundabout Resubmittal\Sidra Files\with 10 percent trucks\roundabout Alt 2A at Recker and
50 Thornhill 2020 AM Revised sip6
51 DELAY (CONTROL) Average control delay per vehicle, or average pedestrian delay (seconds) Site: Recker at Thornhill Alt 2A 2020 PM Roundabout Roundabout All Movement Classes South North West Intersection LOS A A B A Colour code based on Level of Service LOS A LOS B LOS C LOS D LOS E LOS F Continuous Level of Service Method: Delay & v/c (HCM 2010) LOS F will result if v/c > 1 irrespective of movement delay value (does not apply for approaches and intersection). Roundabout Level of Service Method: Same as Sign Control SIDRA Standard Delay Model is used. Control Delay includes Geometric Delay. SIDRA INTERSECTION 6.1 Copyright Akcelik and Associates Pty Ltd sidrasolutions.com Organisation: RUMMEL KLEPPER & KAHL LLP Processed: Monday, January 09, :05:01 PM Project: C:\Project Files\D1\SR 655 Recker Hwy\Files for Roundabout Resubmittal\SidraFiles\with 10 percent trucks\roundabout Alt 2A atrecker and
52 Thornhill 2020 PM Revised sip6
53 DELAY (CONTROL) Average control delay per vehicle, or average pedestrian delay (seconds) Site: Recker at Thornhill 2040 AM Roundabout Roundabout All Movement Classes South North West Intersection LOS A A C A Colour code based on Level of Service LOS A LOS B LOS C LOS D LOS E LOS F Continuous Level of Service Method: Delay & v/c (HCM 2010) LOS F will result if v/c > 1 irrespective of movement delay value (does not apply for approaches and intersection). Roundabout Level of Service Method: Same as Sign Control SIDRA Standard Delay Model is used. Control Delay includes Geometric Delay. SIDRA INTERSECTION 6.1 Copyright Akcelik and Associates Pty Ltd sidrasolutions.com Organisation: RUMMEL KLEPPER & KAHL LLP Processed: Monday, January 09, :07:36 PM Project: C:\Project Files\D1\SR 655 Recker Hwy\Files for Roundabout Resubmittal\Sidra Files\with 10 percent trucks\roundabout Alt 2A at Recker and
54 Thornhill 2040 AM revised sip6
55 DELAY (CONTROL) Average control delay per vehicle, or average pedestrian delay (seconds) Site: Recker at Thornhill 2040 PM Roundabout Roundabout All Movement Classes South North West Intersection LOS A A C B Colour code based on Level of Service LOS A LOS B LOS C LOS D LOS E LOS F Continuous Level of Service Method: Delay & v/c (HCM 2010) LOS F will result if v/c > 1 irrespective of movement delay value (does not apply for approaches and intersection). Roundabout Level of Service Method: Same as Sign Control SIDRA Standard Delay Model is used. Control Delay includes Geometric Delay. SIDRA INTERSECTION 6.1 Copyright Akcelik and Associates Pty Ltd sidrasolutions.com Organisation: RUMMEL KLEPPER & KAHL LLP Processed: Monday, January 09, :09:19 PM Project: C:\Project Files\D1\SR 655 Recker Hwy\Files for Roundabout Resubmittal\Sidra Files\with 10 percent trucks\roundabout Alt 2A at Recker and
56 Thornhill 2040 PM Revised sip6
57 DELAY (CONTROL) Average control delay per vehicle, or average pedestrian delay (seconds) Site: Recker at Thornhill Alt 2B 2020 AM Roundabout Roundabout All Movement Classes South North West Intersection LOS A A B A Colour code based on Level of Service LOS A LOS B LOS C LOS D LOS E LOS F Continuous Level of Service Method: Delay & v/c (HCM 2010) LOS F will result if v/c > 1 irrespective of movement delay value (does not apply for approaches and intersection). Roundabout Level of Service Method: Same as Sign Control SIDRA Standard Delay Model is used. Control Delay includes Geometric Delay. SIDRA INTERSECTION 6.1 Copyright Akcelik and Associates Pty Ltd sidrasolutions.com Organisation: RUMMEL KLEPPER & KAHL LLP Processed: Monday, January 09, :16:51 PM Project: C:\Project Files\D1\SR 655 Recker Hwy\Files for Roundabout Resubmittal\Sidra Files\with 11.5 percent trucks\roundabout Alt 2B at Recker
58 and Thornhill 2020 AM Revised sip6
59 DELAY (CONTROL) Average control delay per vehicle, or average pedestrian delay (seconds) Site: Recker at Thornhill Alt 2B 2020 PM Roundabout Roundabout All Movement Classes South North West Intersection LOS A A B A Colour code based on Level of Service LOS A LOS B LOS C LOS D LOS E LOS F Continuous Level of Service Method: Delay & v/c (HCM 2010) LOS F will result if v/c > 1 irrespective of movement delay value (does not apply for approaches and intersection). Roundabout Level of Service Method: Same as Sign Control SIDRA Standard Delay Model is used. Control Delay includes Geometric Delay. SIDRA INTERSECTION 6.1 Copyright Akcelik and Associates Pty Ltd sidrasolutions.com Organisation: RUMMEL KLEPPER & KAHL LLP Processed: Monday, January 09, :20:01 PM Project: C:\Project Files\D1\SR 655 Recker Hwy\Files for Roundabout Resubmittal\Sidra Files\with 11.5 percent trucks\roundabout Alt 2B at Recker
60 and Thornhill 2020 PM Revised sip6
61 DELAY (CONTROL) Average control delay per vehicle, or average pedestrian delay (seconds) Site: Recker at Thornhill Alt 2B 2040 AM Roundabout Roundabout All Movement Classes South North West Intersection LOS A A C A Colour code based on Level of Service LOS A LOS B LOS C LOS D LOS E LOS F Continuous Level of Service Method: Delay & v/c (HCM 2010) LOS F will result if v/c > 1 irrespective of movement delay value (does not apply for approaches and intersection). Roundabout Level of Service Method: Same as Sign Control SIDRA Standard Delay Model is used. Control Delay includes Geometric Delay. SIDRA INTERSECTION 6.1 Copyright Akcelik and Associates Pty Ltd sidrasolutions.com Organisation: RUMMEL KLEPPER & KAHL LLP Processed: Monday, January 09, :22:30 PM Project: C:\Project Files\D1\SR 655 Recker Hwy\Files for Roundabout Resubmittal\SidraFiles\with 11.5 percent trucks\roundabout Alt 2B at Recker
62 and Thornhill 2040 AM revised sip6
63 DELAY (CONTROL) Average control delay per vehicle, or average pedestrian delay (seconds) Site: Recker at Thornhill Alt 2B 2040 PM Roundabout Roundabout All Movement Classes South North West Intersection LOS A A C A Colour code based on Level of Service LOS A LOS B LOS C LOS D LOS E LOS F Continuous Level of Service Method: Delay & v/c (HCM 2010) LOS F will result if v/c > 1 irrespective of movement delay value (does not apply for approaches and intersection). Roundabout Level of Service Method: Same as Sign Control SIDRA Standard Delay Model is used. Control Delay includes Geometric Delay. SIDRA INTERSECTION 6.1 Copyright Akcelik and Associates Pty Ltd sidrasolutions.com Organisation: RUMMEL KLEPPER & KAHL LLP Processed: Monday, January 09, :23:51 PM Project: C:\Project Files\D1\SR 655 Recker Hwy\Files for Roundabout Resubmittal\Sidra Files\with 11.5 percent trucks\roundabout Alt 2B at Recker
64 and Thornhill 2040 PM Revised sip6
65 Lanes, Volumes, Timings 9: Recker Hwy & Thornhill Rd. SignalTimed AM - BuildOverpass.syn 6/16/2016 Lane Group EBL EBR NBL NBT SBT SBR Lane Configurations Traffic Volume (vph) Future Volume (vph) Ideal Flow (vphpl) Storage Length (ft) Storage Lanes Taper Length (ft) Satd. Flow (prot) Flt Permitted Satd. Flow (perm) Right Turn on Red Yes Yes Satd. Flow (RTOR) Link Speed (mph) Link Distance (ft) Travel Time (s) Peak Hour Factor Adj. Flow (vph) Shared Lane Traffic (%) Lane Group Flow (vph) Turn Type Prot Perm Perm NA NA Perm Protected Phases Permitted Phases Total Split (s) Total Lost Time (s) Act Effct Green (s) Actuated g/c Ratio v/c Ratio Control Delay Queue Delay Total Delay LOS C A B B B A Approach Delay Approach LOS C B B Queue Length 50th (ft) Queue Length 95th (ft) Internal Link Dist (ft) Turn Bay Length (ft) Base Capacity (vph) Starvation Cap Reductn Spillback Cap Reductn Storage Cap Reductn Reduced v/c Ratio Intersection Summary Area Type: Other Cycle Length: 110 Actuated Cycle Length: 110 Offset: 0 (0%), Referenced to phase 2:SBT and 6:NBTL, Start of Green Control Type: Pretimed Baseline Synchro 9 Report Page 3
66 Lanes, Volumes, Timings 9: Recker Hwy & Thornhill Rd. SignalTimed AM - BuildOverpass.syn 6/16/2016 Maximum v/c Ratio: 0.42 Intersection Signal Delay: 15.1 Intersection Capacity Utilization 50.7% Analysis Period (min) 15 Intersection LOS: B ICU Level of Service A Splits and Phases: 9: Recker Hwy & Thornhill Rd. Baseline Synchro 9 Report Page 4
67 Lanes, Volumes, Timings 9: Recker Hwy & Thornhill Rd. SignalTimed PM - BuildOverpass.syn 6/16/2016 Lane Group EBL EBR NBL NBT SBT SBR Lane Configurations Traffic Volume (vph) Future Volume (vph) Ideal Flow (vphpl) Storage Length (ft) Storage Lanes Taper Length (ft) Satd. Flow (prot) Flt Permitted Satd. Flow (perm) Right Turn on Red Yes Yes Satd. Flow (RTOR) Link Speed (mph) Link Distance (ft) Travel Time (s) Peak Hour Factor Adj. Flow (vph) Shared Lane Traffic (%) Lane Group Flow (vph) Turn Type Prot Perm Perm NA NA Perm Protected Phases Permitted Phases Total Split (s) Total Lost Time (s) Act Effct Green (s) Actuated g/c Ratio v/c Ratio Control Delay Queue Delay Total Delay LOS C A B B B A Approach Delay Approach LOS C B B Queue Length 50th (ft) Queue Length 95th (ft) Internal Link Dist (ft) Turn Bay Length (ft) Base Capacity (vph) Starvation Cap Reductn Spillback Cap Reductn Storage Cap Reductn Reduced v/c Ratio Intersection Summary Area Type: Other Cycle Length: 110 Actuated Cycle Length: 110 Offset: 0 (0%), Referenced to phase 2:SBT and 6:NBTL, Start of Green Control Type: Pretimed Baseline Synchro 9 Report Page 3
68 Lanes, Volumes, Timings 9: Recker Hwy & Thornhill Rd. SignalTimed PM - BuildOverpass.syn 6/16/2016 Maximum v/c Ratio: 0.53 Intersection Signal Delay: 16.9 Intersection Capacity Utilization 52.5% Analysis Period (min) 15 Intersection LOS: B ICU Level of Service A Splits and Phases: 9: Recker Hwy & Thornhill Rd. Baseline Synchro 9 Report Page 4
69 Lanes, Volumes, Timings 9: Recker Hwy & Thornhill Rd. SignalTimed AM - BuildOverpass.syn 6/16/2016 Lane Group EBL EBR NBL NBT SBT SBR Lane Configurations Traffic Volume (vph) Future Volume (vph) Ideal Flow (vphpl) Storage Length (ft) Storage Lanes Taper Length (ft) Satd. Flow (prot) Flt Permitted Satd. Flow (perm) Right Turn on Red Yes Yes Satd. Flow (RTOR) Link Speed (mph) Link Distance (ft) Travel Time (s) Peak Hour Factor Adj. Flow (vph) Shared Lane Traffic (%) Lane Group Flow (vph) Turn Type Prot Perm Perm NA NA Perm Protected Phases Permitted Phases Total Split (s) Total Lost Time (s) Act Effct Green (s) Actuated g/c Ratio v/c Ratio Control Delay Queue Delay Total Delay LOS C A B B B A Approach Delay Approach LOS C B B Queue Length 50th (ft) Queue Length 95th (ft) Internal Link Dist (ft) Turn Bay Length (ft) Base Capacity (vph) Starvation Cap Reductn Spillback Cap Reductn Storage Cap Reductn Reduced v/c Ratio Intersection Summary Area Type: Other Cycle Length: 110 Actuated Cycle Length: 110 Offset: 0 (0%), Referenced to phase 2:SBT and 6:NBTL, Start of Green Control Type: Pretimed Baseline Synchro 9 Report Page 3
70 Lanes, Volumes, Timings 9: Recker Hwy & Thornhill Rd. SignalTimed AM - BuildOverpass.syn 6/16/2016 Maximum v/c Ratio: 0.50 Intersection Signal Delay: 15.7 Intersection Capacity Utilization 55.7% Analysis Period (min) 15 Intersection LOS: B ICU Level of Service B Splits and Phases: 9: Recker Hwy & Thornhill Rd. Baseline Synchro 9 Report Page 4
71 Lanes, Volumes, Timings 9: Recker Hwy & Thornhill Rd. SignalTimed PM - BuildOverpass.syn 6/16/2016 Lane Group EBL EBR NBL NBT SBT SBR Lane Configurations Traffic Volume (vph) Future Volume (vph) Ideal Flow (vphpl) Storage Length (ft) Storage Lanes Taper Length (ft) Satd. Flow (prot) Flt Permitted Satd. Flow (perm) Right Turn on Red Yes Yes Satd. Flow (RTOR) Link Speed (mph) Link Distance (ft) Travel Time (s) Peak Hour Factor Adj. Flow (vph) Shared Lane Traffic (%) Lane Group Flow (vph) Turn Type Prot Perm Perm NA NA Perm Protected Phases Permitted Phases Total Split (s) Total Lost Time (s) Act Effct Green (s) Actuated g/c Ratio v/c Ratio Control Delay Queue Delay Total Delay LOS C A B B B A Approach Delay Approach LOS C B B Queue Length 50th (ft) Queue Length 95th (ft) Internal Link Dist (ft) Turn Bay Length (ft) Base Capacity (vph) Starvation Cap Reductn Spillback Cap Reductn Storage Cap Reductn Reduced v/c Ratio Intersection Summary Area Type: Other Cycle Length: 110 Actuated Cycle Length: 110 Offset: 0 (0%), Referenced to phase 2:SBT and 6:NBTL, Start of Green Control Type: Pretimed Baseline Synchro 9 Report Page 3
72 Lanes, Volumes, Timings 9: Recker Hwy & Thornhill Rd. SignalTimed PM - BuildOverpass.syn 6/16/2016 Maximum v/c Ratio: 0.63 Intersection Signal Delay: 17.8 Intersection Capacity Utilization 57.9% Analysis Period (min) 15 Intersection LOS: B ICU Level of Service B Splits and Phases: 9: Recker Hwy & Thornhill Rd. Baseline Synchro 9 Report Page 4
73 Lanes, Volumes, Timings 9: Recker Hwy & Thornhill Rd. SignalTimed AM - BuildOverpass.syn 6/16/2016 Lane Group EBL EBR NBL NBT SBT SBR Lane Configurations Traffic Volume (vph) Future Volume (vph) Ideal Flow (vphpl) Storage Length (ft) Storage Lanes Taper Length (ft) Satd. Flow (prot) Flt Permitted Satd. Flow (perm) Right Turn on Red Yes Yes Satd. Flow (RTOR) Link Speed (mph) Link Distance (ft) Travel Time (s) Peak Hour Factor Adj. Flow (vph) Shared Lane Traffic (%) Lane Group Flow (vph) Turn Type Prot Perm Perm NA NA Perm Protected Phases Permitted Phases Total Split (s) Total Lost Time (s) Act Effct Green (s) Actuated g/c Ratio v/c Ratio Control Delay Queue Delay Total Delay LOS C A B B B A Approach Delay Approach LOS C B B Queue Length 50th (ft) Queue Length 95th (ft) Internal Link Dist (ft) Turn Bay Length (ft) Base Capacity (vph) Starvation Cap Reductn Spillback Cap Reductn Storage Cap Reductn Reduced v/c Ratio Intersection Summary Area Type: Other Cycle Length: 110 Actuated Cycle Length: 110 Offset: 0 (0%), Referenced to phase 2:SBT and 6:NBTL, Start of Green Control Type: Pretimed Baseline Synchro 9 Report Page 3
74 Lanes, Volumes, Timings 9: Recker Hwy & Thornhill Rd. SignalTimed AM - BuildOverpass.syn 6/16/2016 Maximum v/c Ratio: 0.59 Intersection Signal Delay: 16.4 Intersection Capacity Utilization 61.2% Analysis Period (min) 15 Intersection LOS: B ICU Level of Service B Splits and Phases: 9: Recker Hwy & Thornhill Rd. Baseline Synchro 9 Report Page 4
75 Lanes, Volumes, Timings 9: Recker Hwy & Thornhill Rd. SignalTimed PM - BuildOverpass.syn 6/16/2016 Lane Group EBL EBR NBL NBT SBT SBR Lane Configurations Traffic Volume (vph) Future Volume (vph) Ideal Flow (vphpl) Storage Length (ft) Storage Lanes Taper Length (ft) Satd. Flow (prot) Flt Permitted Satd. Flow (perm) Right Turn on Red Yes Yes Satd. Flow (RTOR) Link Speed (mph) Link Distance (ft) Travel Time (s) Peak Hour Factor Adj. Flow (vph) Shared Lane Traffic (%) Lane Group Flow (vph) Turn Type Prot Perm Perm NA NA Perm Protected Phases Permitted Phases Total Split (s) Total Lost Time (s) Act Effct Green (s) Actuated g/c Ratio v/c Ratio Control Delay Queue Delay Total Delay LOS D A B B B A Approach Delay Approach LOS C B B Queue Length 50th (ft) Queue Length 95th (ft) Internal Link Dist (ft) Turn Bay Length (ft) Base Capacity (vph) Starvation Cap Reductn Spillback Cap Reductn Storage Cap Reductn Reduced v/c Ratio Intersection Summary Area Type: Other Cycle Length: 110 Actuated Cycle Length: 110 Offset: 0 (0%), Referenced to phase 2:SBT and 6:NBTL, Start of Green Control Type: Pretimed Baseline Synchro 9 Report Page 3
76 Lanes, Volumes, Timings 9: Recker Hwy & Thornhill Rd. SignalTimed PM - BuildOverpass.syn 6/16/2016 Maximum v/c Ratio: 0.74 Intersection Signal Delay: 19.1 Intersection Capacity Utilization 63.6% Analysis Period (min) 15 Intersection LOS: B ICU Level of Service B Splits and Phases: 9: Recker Hwy & Thornhill Rd. Baseline Synchro 9 Report Page 4
77 APPENDIX E Benefit Costs Evaluation Life Cycle Costs and Results for Roundabout Alternatives A and B Page 16
78 FDOT Level 2 Roundabout b/c Evaluation Annual Costs Roundabout Traffic Signal Safety Predicted Annual Crashes Safety Cost Predicted Annual Crashes Safety Cost Predicted Fatal/Injury Crashes 0.24 $ 88, $ 305,398 Predicted PDO Crashes 1.76 $ 13, $ 12,432 Annual Costs of Predicted Crashes $ 101,956 Annual Costs of Predicted Crashes $ 317,830 Delay Annual Intersection Delay (person-hrs) Delay Cost Annual Intersection Delay (person-hrs) Delay Cost Average Annual Person (in Vehicle) Delay 3341 $ 40, $ 80,664 Operation and Maintenance Operation and Maintenance O&M Cost Operation and Maintenance O&M Cost Annualized Cost of Signal Retiming $ - Signal Retiming Every 3 Years $ 1,667 Annual Cost of Illumination Intersection Illumination $ 750 Intersection Illumination $ 750 Annual Cost of Maintenance Landscaping Costs $ 2,000 Signal Maintenance Costs (power outage, detection, etc.) $ 3,100 Total Annual Operation and Maintenance Costs $ 2,750 Total Annual Operation and Maintenance Costs $ 5,517 Initial Capital Costs Total Capital Costs Cost Total Capital Costs Cost Preliminary Engineering $ 220,000 $ 98,905 Right-of-way and Utilities $ 886,000 $ 428,238 Construction $ 1,061,943 $ 659,368 *Delay cost is based upon a 2 hour analysis period. Total Discounted Life Cycle Costs ( ) Roundabout Traffic Signal Safety Total Predicted Crashes Safety Cost Total Predicted Crashes Safety Cost Predicted Fatal/Injury Crashes 4.87 $ 1,317, $ 4,543,556 Predicted PDO Crashes $ 199, $ 184,958 Total Costs of Predicted Crashes $ 1,516,849 Total Costs of Predicted Crashes $ 4,728,513 Delay Total Intersection Delay (person-hrs) Delay Cost Total Intersection Delay (person-hrs) Delay Cost Total Person (in Vehicle) Delay $ 856, $ 1,693,951 Operation and Maintenance Operation and Maintenance O&M Cost Operation and Maintenance O&M Cost Annualized Cost of Signal Retiming $ - Signal Retiming Every 3 Years $ 24,796 Annual Cost of Illumination Intersection Illumination $ 11,158 Intersection Illumination $ 11,158 Annual Cost of Maintenance Landscaping Costs $ 29,755 Signal Maintenance Costs (power outage, detection, etc.) $ 46,120 Total Annual Operation and Maintenance Costs $ 40,913 Total Annual Operation and Maintenance Costs $ 82,074 Initial Capital Costs Total Capital Costs Cost Total Capital Costs Cost Preliminary Engineering $ 220,000 $ 98,905 Right-of-way and Utilities $ 886,000 $ 428,238 Construction $ 1,061,943 $ 659,368 Total Initial Capital Costs $ 2,167,943 Total Initial Capital Costs $ 1,186,512 Total Life Cycle Costs (Opening Year $) Net Present Value $ 4,582,495 Net Present Value $ 7,691,050 *Delay cost is based upon a 2 hour analysis period. Roundabout Traffic Signal Life Cycle Benefit/Cost Ratio Safety Benefit of a Roundabout $ 3,211,664 Delay Reduction Benefit of a Roundabout $ 837,161 Total Benefits $ 4,048,825 Added Operations&Maintenance Costs of a Roundabout $ (41,161) Added Capital Costs of a Roundabout $ 981,431 Total Costs $ 940,270 Life Cycle Benefit/Cost Ratio 4.3 Roundabout Compared to Traffic Signal Roundabout Preferred
79 FLORIDA DEPARTMENT OF TRANSPORTATION STEP 2 -b/c EVALUATION Prepared by: Financial Project ID: FAP No.: County: Daniel R. Miller, P.E Polk Date Prepared: Project Name: State Road: Intersecting Rd: 1/6/2017 Recker Highway 655 Thornhill Road ANNUAL COSTS Roundabout Traffic Signal Safety Cost (Crashes) $ 101,956 $ 317,830 Delay Cost $ 40,800 $ 80,664 O & M Cost $ 2,750 $ 5,517 Initial Capital Cost Preliminary Engineering $ 220,000 $ 98,905 Right-of-way and Utilities $ 886,000 $ 428,238 Construction $ 1,061,943 $ 659,368 TOTAL DISCOUNTED LIFE CYCLE COSTS (OPENING YEAR) Roundabout Traffic Signal Safety Cost (Crashes) $ 1,516,849 $ 4,728,513 Delay Cost $ 856,790 $ 1,693,951 O & M Cost $ 40,913 $ 82,074 Initial Capital Cost $ 2,167,943 $ 1,186,512 Total Life Cycle Costs $ 4,582,495 $ 7,691,050 LIFECYCLE BENEFIT/COST RATIO Safety Benefit of a Roundabout $ 3,211,664 Delay Reduction Benefit of a Roundabout $ 837,161 Total Benefit $ 4,048,825 Added O & M Costs of a Rondabout $ (41,161) Added Capital Costs of a Roundabout $ 981,431 Total Cost $ 940,270 Life Cycle Benefit/Cost Ratio 4.3 Advance to Level 3 Geometric and Operational Analysis: YES NO Approved by: DDE or DTOE Signature: Date:
80 FDOT Level 2 Roundabout b/c Evaluation Annual Costs Roundabout Traffic Signal Safety Predicted Annual Crashes Safety Cost Predicted Annual Crashes Safety Cost Predicted Fatal/Injury Crashes 0.24 $ 88, $ 305,398 Predicted PDO Crashes 1.76 $ 13, $ 12,432 Annual Costs of Predicted Crashes $ 101,956 Annual Costs of Predicted Crashes $ 317,830 Delay Annual Intersection Delay (person-hrs) Delay Cost Annual Intersection Delay (person-hrs) Delay Cost Average Annual Person (in Vehicle) Delay 3136 $ 38, $ 80,664 Operation and Maintenance Operation and Maintenance O&M Cost Operation and Maintenance O&M Cost Annualized Cost of Signal Retiming $ - Signal Retiming Every 3 Years $ 1,667 Annual Cost of Illumination Intersection Illumination $ 750 Intersection Illumination $ 750 Annual Cost of Maintenance Landscaping Costs $ 2,000 Signal Maintenance Costs (power outage, detection, etc.) $ 3,100 Total Annual Operation and Maintenance Costs $ 2,750 Total Annual Operation and Maintenance Costs $ 5,517 Initial Capital Costs Total Capital Costs Cost Total Capital Costs Cost Preliminary Engineering $ 220,000 $ 98,905 Right-of-way and Utilities $ 886,000 $ 428,238 Construction $ 1,061,943 $ 659,368 *Delay cost is based upon a 2 hour analysis period. Total Discounted Life Cycle Costs ( ) Roundabout Traffic Signal Safety Total Predicted Crashes Safety Cost Total Predicted Crashes Safety Cost Predicted Fatal/Injury Crashes 4.87 $ 1,317, $ 4,543,556 Predicted PDO Crashes $ 199, $ 184,958 Total Costs of Predicted Crashes $ 1,516,849 Total Costs of Predicted Crashes $ 4,728,513 Delay Total Intersection Delay (person-hrs) Delay Cost Total Intersection Delay (person-hrs) Delay Cost Total Person (in Vehicle) Delay $ 806, $ 1,693,951 Operation and Maintenance Operation and Maintenance O&M Cost Operation and Maintenance O&M Cost Annualized Cost of Signal Retiming $ - Signal Retiming Every 3 Years $ 24,796 Annual Cost of Illumination Intersection Illumination $ 11,158 Intersection Illumination $ 11,158 Annual Cost of Maintenance Landscaping Costs $ 29,755 Signal Maintenance Costs (power outage, detection, etc.) $ 46,120 Total Annual Operation and Maintenance Costs $ 40,913 Total Annual Operation and Maintenance Costs $ 82,074 Initial Capital Costs Total Capital Costs Cost Total Capital Costs Cost Preliminary Engineering $ 220,000 $ 98,905 Right-of-way and Utilities $ 886,000 $ 428,238 Construction $ 1,061,943 $ 659,368 Total Initial Capital Costs $ 2,167,943 Total Initial Capital Costs $ 1,186,512 Total Life Cycle Costs (Opening Year $) Net Present Value $ 4,532,364 Net Present Value $ 7,691,050 *Delay cost is based upon a 2 hour analysis period. Roundabout Traffic Signal Life Cycle Benefit/Cost Ratio Safety Benefit of a Roundabout $ 3,211,664 Delay Reduction Benefit of a Roundabout $ 887,292 Total Benefits $ 4,098,956 Added Operations&Maintenance Costs of a Roundabout $ (41,161) Added Capital Costs of a Roundabout $ 981,431 Total Costs $ 940,270 Life Cycle Benefit/Cost Ratio 4.4 Roundabout Compared to Traffic Signal Roundabout Preferred
81 FLORIDA DEPARTMENT OF TRANSPORTATION STEP 2 -b/c EVALUATION Prepared by: Financial Project ID: FAP No.: County: Daniel R. Miller, P.E Polk Date Prepared: Project Name: State Road: Intersecting Rd: 1/6/2017 Recker Highway 655 Thornhill Road ANNUAL COSTS Roundabout Traffic Signal Safety Cost (Crashes) $ 101,956 $ 317,830 Delay Cost $ 38,412 $ 80,664 O & M Cost $ 2,750 $ 5,517 Initial Capital Cost Preliminary Engineering $ 220,000 $ 98,905 Right-of-way and Utilities $ 886,000 $ 428,238 Construction $ 1,061,943 $ 659,368 TOTAL DISCOUNTED LIFE CYCLE COSTS (OPENING YEAR) Roundabout Traffic Signal Safety Cost (Crashes) $ 1,516,849 $ 4,728,513 Delay Cost $ 806,659 $ 1,693,951 O & M Cost $ 40,913 $ 82,074 Initial Capital Cost $ 2,167,943 $ 1,186,512 Total Life Cycle Costs $ 4,532,364 $ 7,691,050 LIFECYCLE BENEFIT/COST RATIO Safety Benefit of a Roundabout $ 3,211,664 Delay Reduction Benefit of a Roundabout $ 887,292 Total Benefit $ 4,098,956 Added O & M Costs of a Rondabout $ (41,161) Added Capital Costs of a Roundabout $ 981,431 Total Cost $ 940,270 Life Cycle Benefit/Cost Ratio 4.4 Advance to Level 3 Geometric and Operational Analysis: YES NO Approved by: DDE or DTOE Signature: Date:
82 APPENDIX B-B Roundabout Movement Summary
83 MOVEMENT SUMMARY Site:Recker at Thornhill Alt A 2020 AM Roundabout Roundabout Movement Performance - Vehicles Mov OD Demand Flows Deg. Average Level of 95% Back of Queue Prop. Effective Average ID Mov Total HV Satn Delay Service Vehicles Distance Queued Stop Rate Speed veh/h % v/c sec veh ft per veh mph South: Recker Hwy 3 L LOS B T LOS A Approach LOS A North: Recker Hwy 4 T LOS A R LOS A Approach LOS A West: Thornhill Road 5 L LOS B R LOS A Approach LOS B All Vehicles LOS A Level of Service (LOS) Method: Delay & v/c (HCM 2010). Roundabout LOS Method: Same as Sign Control. Vehicle movement LOS values are based on average delay and v/c ratio (degree of saturation) per movement LOS F will result if v/c > 1 irrespective of movement delay value (does not apply for approaches and intersection). Intersection and Approach LOS values are based on average delay for all movements (v/c not used as specified in HCM 2010). Roundabout Capacity Model: SIDRA Standard. SIDRA Standard Delay Model is used. Control Delay includes Geometric Delay. Gap-Acceptance Capacity: SIDRA Standard (Akçelik M3D). HV (%) values are calculated for All Movement Classes of All Heavy Vehicle Model Designation. SIDRA INTERSECTION 6.1 Copyright Akcelik and Associates Pty Ltd sidrasolutions.com Organisation: RUMMEL KLEPPER & KAHL LLP Processed: Monday, January 09, :03:26 PM Project: C:\Project Files\D1\SR 655 Recker Hwy\Files for Roundabout Resubmittal\SidraFiles\with 11.5 percent trucks\roundabout Alt 2A at Recker and Thornhill 2020 AM Revised sip6
84 MOVEMENT SUMMARY Site:Recker at Thornhill Alt A 2020 PM Roundabout Roundabout Movement Performance - Vehicles Mov OD Demand Flows Deg. Average Level of 95% Back of Queue Prop. Effective Average ID Mov Total HV Satn Delay Service Vehicles Distance Queued Stop Rate Speed veh/h % v/c sec veh ft per veh mph South: Recker Hwy 3 L LOS B T LOS A Approach LOS A North: Recker Hwy 4 T LOS A R LOS A Approach LOS A West: Thornhill Road 5 L LOS B R LOS A Approach LOS B All Vehicles LOS A Level of Service (LOS) Method: Delay & v/c (HCM 2010). Roundabout LOS Method: Same as Sign Control. Vehicle movement LOS values are based on average delay and v/c ratio (degree of saturation) per movement LOS F will result if v/c > 1 irrespective of movement delay value (does not apply for approaches and intersection). Intersection and Approach LOS values are based on average delay for all movements (v/c not used as specified in HCM 2010). Roundabout Capacity Model: SIDRA Standard. SIDRA Standard Delay Model is used. Control Delay includes Geometric Delay. Gap-Acceptance Capacity: SIDRA Standard (Akçelik M3D). HV (%) values are calculated for All Movement Classes of All Heavy Vehicle Model Designation. SIDRA INTERSECTION 6.1 Copyright Akcelik and Associates Pty Ltd sidrasolutions.com Organisation: RUMMEL KLEPPER & KAHL LLP Processed: Monday, January 09, :05:01 PM Project: C:\Project Files\D1\SR 655 Recker Hwy\Files for Roundabout Resubmittal\SidraFiles\with 11.5 percent trucks\roundabout Alt 2A at Recker and Thornhill 2020 PM Revised sip6
85 MOVEMENT SUMMARY Site: Recker at Thornhill Alt A 2040 AM Roundabout Roundabout Movement Performance - Vehicles Mov OD Demand Flows Deg. Average Level of 95% Back of Queue Prop. Effective Average ID Mov Total HV Satn Delay Service Vehicles Distance Queued Stop Rate Speed veh/h % v/c sec veh ft per veh mph South: Recker Hwy 3 L LOS B T LOS A Approach LOS A North: Recker Hwy 4 T LOS A R LOS A Approach LOS A West: Thornhill Road 5 L LOS C R LOS C Approach LOS C All Vehicles LOS A Level of Service (LOS) Method: Delay & v/c (HCM 2010). Roundabout LOS Method: Same as Sign Control. Vehicle movement LOS values are based on average delay and v/c ratio (degree of saturation) per movement LOS F will result if v/c > 1 irrespective of movement delay value (does not apply for approaches and intersection). Intersection and Approach LOS values are based on average delay for all movements (v/c not used as specified in HCM 2010). Roundabout Capacity Model: SIDRA Standard. SIDRA Standard Delay Model is used. Control Delay includes Geometric Delay. Gap-Acceptance Capacity: SIDRA Standard (Akçelik M3D). HV (%) values are calculated for All Movement Classes of All Heavy Vehicle Model Designation. SIDRA INTERSECTION 6.1 Copyright Akcelik and Associates Pty Ltd sidrasolutions.com Organisation: RUMMEL KLEPPER & KAHL LLP Processed: Monday, January 09, :07:36 PM Project: C:\Project Files\D1\SR 655 Recker Hwy\Files for Roundabout Resubmittal\SidraFiles\with 11.5 percent trucks\roundabout Alt 2A at Recker and Thornhill 2040 AM revised sip6
86 MOVEMENT SUMMARY Site: Recker at Thornhill Alt A 2040 PM Roundabout Roundabout Movement Performance - Vehicles Mov OD Demand Flows Deg. Average Level of 95% Back of Queue Prop. Effective Average ID Mov Total HV Satn Delay Service Vehicles Distance Queued Stop Rate Speed veh/h % v/c sec veh ft per veh mph South: Recker Hwy 3 L LOS B T LOS A Approach LOS A North: Recker Hwy 4 T LOS A R LOS A Approach LOS A West: Thornhill Road 5 L LOS C R LOS C Approach LOS C All Vehicles LOS B Level of Service (LOS) Method: Delay & v/c (HCM 2010). Roundabout LOS Method: Same as Sign Control. Vehicle movement LOS values are based on average delay and v/c ratio (degree of saturation) per movement LOS F will result if v/c > 1 irrespective of movement delay value (does not apply for approaches and intersection). Intersection and Approach LOS values are based on average delay for all movements (v/c not used as specified in HCM 2010). Roundabout Capacity Model: SIDRA Standard. SIDRA Standard Delay Model is used. Control Delay includes Geometric Delay. Gap-Acceptance Capacity: SIDRA Standard (Akçelik M3D). HV (%) values are calculated for All Movement Classes of All Heavy Vehicle Model Designation. SIDRA INTERSECTION 6.1 Copyright Akcelik and Associates Pty Ltd sidrasolutions.com Organisation: RUMMEL KLEPPER & KAHL LLP Processed: Monday, January 09, :09:19 PM Project: C:\Project Files\D1\SR 655 Recker Hwy\Files for Roundabout Resubmittal\SidraFiles\with 11.5 percent trucks\roundabout Alt 2A at Recker and Thornhill 2040 PM Revised sip6
87 MOVEMENT SUMMARY Site: Recker at Thornhill Alt B 2020 AM Roundabout Roundabout Movement Performance - Vehicles Mov OD Demand Flows Deg. Average Level of 95% Back of Queue Prop. Effective Average ID Mov Total HV Satn Delay Service Vehicles Distance Queued Stop Rate Speed veh/h % v/c sec veh ft per veh mph South: Recker Hwy 3 L LOS B T LOS A Approach LOS A North: Recker Hwy 4 T LOS A R LOS A Approach LOS A West: Thornhill Road 5 L LOS B R LOS A Approach LOS B All Vehicles LOS A Level of Service (LOS) Method: Delay & v/c (HCM 2010). Roundabout LOS Method: Same as Sign Control. Vehicle movement LOS values are based on average delay and v/c ratio (degree of saturation) per movement LOS F will result if v/c > 1 irrespective of movement delay value (does not apply for approaches and intersection). Intersection and Approach LOS values are based on average delay for all movements (v/c not used as specified in HCM 2010). Roundabout Capacity Model: SIDRA Standard. SIDRA Standard Delay Model is used. Control Delay includes Geometric Delay. Gap-Acceptance Capacity: SIDRA Standard (Akçelik M3D). HV (%) values are calculated for All Movement Classes of All Heavy Vehicle Model Designation. SIDRA INTERSECTION 6.1 Copyright Akcelik and Associates Pty Ltd sidrasolutions.com Organisation: RUMMEL KLEPPER & KAHL LLP Processed: Monday, January 09, :16:51 PM Project: C:\Project Files\D1\SR 655 Recker Hwy\Files for Roundabout Resubmittal\SidraFiles\with 11.5 percent trucks\roundabout Alt 2B at Recker and Thornhill 2020 AM Revised sip6
88 MOVEMENT SUMMARY Site: Recker at Thornhill Alt B 2020 PM Roundabout Roundabout Movement Performance - Vehicles Mov OD Demand Flows Deg. Average Level of 95% Back of Queue Prop. Effective Average ID Mov Total HV Satn Delay Service Vehicles Distance Queued Stop Rate Speed veh/h % v/c sec veh ft per veh mph South: Recker Hwy 3 L LOS B T LOS A Approach LOS A North: Recker Hwy 4 T LOS A R LOS A Approach LOS A West: Thornhill Road 5 L LOS B R LOS A Approach LOS B All Vehicles LOS A Level of Service (LOS) Method: Delay & v/c (HCM 2010). Roundabout LOS Method: Same as Sign Control. Vehicle movement LOS values are based on average delay and v/c ratio (degree of saturation) per movement LOS F will result if v/c > 1 irrespective of movement delay value (does not apply for approaches and intersection). Intersection and Approach LOS values are based on average delay for all movements (v/c not used as specified in HCM 2010). Roundabout Capacity Model: SIDRA Standard. SIDRA Standard Delay Model is used. Control Delay includes Geometric Delay. Gap-Acceptance Capacity: SIDRA Standard (Akçelik M3D). HV (%) values are calculated for All Movement Classes of All Heavy Vehicle Model Designation. SIDRA INTERSECTION 6.1 Copyright Akcelik and Associates Pty Ltd sidrasolutions.com Organisation: RUMMEL KLEPPER & KAHL LLP Processed: Monday, January 09, :20:01 PM Project: C:\Project Files\D1\SR 655 Recker Hwy\Files for Roundabout Resubmittal\SidraFiles\with 11.5 percent trucks\roundabout Alt 2B at Recker and Thornhill 2020 PM Revised sip6
89 MOVEMENT SUMMARY Site: Recker at Thornhill Alt B 2040 AM Roundabout Roundabout Movement Performance - Vehicles Mov OD Demand Flows Deg. Average Level of 95% Back of Queue Prop. Effective Average ID Mov Total HV Satn Delay Service Vehicles Distance Queued Stop Rate Speed veh/h % v/c sec veh ft per veh mph South: Recker Hwy 3 L LOS B T LOS A Approach LOS A North: Recker Hwy 4 T LOS A R LOS A Approach LOS A West: Thornhill Road 5 L LOS C R LOS B Approach LOS C All Vehicles LOS A Level of Service (LOS) Method: Delay & v/c (HCM 2010). Roundabout LOS Method: Same as Sign Control. Vehicle movement LOS values are based on average delay and v/c ratio (degree of saturation) per movement LOS F will result if v/c > 1 irrespective of movement delay value (does not apply for approaches and intersection). Intersection and Approach LOS values are based on average delay for all movements (v/c not used as specified in HCM 2010). Roundabout Capacity Model: SIDRA Standard. SIDRA Standard Delay Model is used. Control Delay includes Geometric Delay. Gap-Acceptance Capacity: SIDRA Standard (Akçelik M3D). HV (%) values are calculated for All Movement Classes of All Heavy Vehicle Model Designation. SIDRA INTERSECTION 6.1 Copyright Akcelik and Associates Pty Ltd sidrasolutions.com Organisation: RUMMEL KLEPPER & KAHL LLP Processed: Monday, January 09, :22:30 PM Project: C:\Project Files\D1\SR 655 Recker Hwy\Files for Roundabout Resubmittal\SidraFiles\with 11.5 percent trucks\roundabout Alt 2B at Recker and Thornhill 2040 AM revised sip6
90 MOVEMENT SUMMARY Site: Recker at Thornhill Alt B 2040 PM Roundabout Roundabout Movement Performance - Vehicles Mov OD Demand Flows Deg. Average Level of 95% Back of Queue Prop. Effective Average ID Mov Total HV Satn Delay Service Vehicles Distance Queued Stop Rate Speed veh/h % v/c sec veh ft per veh mph South: Recker Hwy 3 L LOS B T LOS A Approach LOS A North: Recker Hwy 4 T LOS A R LOS A Approach LOS A West: Thornhill Road 5 L LOS C R LOS B Approach LOS C All Vehicles LOS A Level of Service (LOS) Method: Delay & v/c (HCM 2010). Roundabout LOS Method: Same as Sign Control. Vehicle movement LOS values are based on average delay and v/c ratio (degree of saturation) per movement LOS F will result if v/c > 1 irrespective of movement delay value (does not apply for approaches and intersection). Intersection and Approach LOS values are based on average delay for all movements (v/c not used as specified in HCM 2010). Roundabout Capacity Model: SIDRA Standard. SIDRA Standard Delay Model is used. Control Delay includes Geometric Delay. Gap-Acceptance Capacity: SIDRA Standard (Akçelik M3D). HV (%) values are calculated for All Movement Classes of All Heavy Vehicle Model Designation. SIDRA INTERSECTION 6.1 Copyright Akcelik and Associates Pty Ltd sidrasolutions.com Organisation: RUMMEL KLEPPER & KAHL LLP Processed: Monday, January 09, :23:51 PM Project: C:\Project Files\D1\SR 655 Recker Hwy\Files for Roundabout Resubmittal\SidraFiles\with 11.5 percent trucks\roundabout Alt 2B at Recker and Thornhill 2040 PM Revised sip6
91 APPENDIX C-C NCHRP 672 Reference Materials
92 Roundabouts: An Informational Guide Exhibit 6-46 Vehicle Path Radii Recommended maximum theoretical entry design speeds for roundabouts at various intersection site categories are provided in Exhibit Exhibit 6-47 Recommended Maximum Entry Design Speeds Site Category Mini-Roundabout Single Lane Multilane Recommended Maximum Theoretical Entry Design Speed 20 mph (30 km/h) 25 mph (40 km/h) 25 to 30 mph (40 to 50 km/h) Roundabout speed is determined by the fastest path allowed by the geometry. Through movements are usually the fastest path, but sometimes right-turn paths are more critical. Draw the fastest path for all roundabout approaches Construction of Vehicle Paths To determine the speed of a roundabout, the fastest path allowed by the geometry is drawn. This is the smoothest, flattest path possible for a single vehicle, in the absence of other traffic and ignoring all lane markings, traversing through the entry, around the central island, and out the exit. The design speed of the roundabout is determined from the smallest radius along the fastest allowable path. The smallest radius usually occurs on the circulatory roadway as the vehicle curves to the left around the central island. A vehicle is assumed to be 6 ft (2 m) wide and maintain a minimum clearance of 2 ft (0.5 m) from a roadway centerline or concrete curb and flush with a painted edge line (3). Thus the centerline of the vehicle path is drawn with the following distances to the particular geometric features: 5 ft (1.5 m) from a concrete curb, 5 ft (1.5 m) from a roadway centerline, and 3 ft (1.0 m) from a painted edge line. Exhibit 6-48 and Exhibit 6-49 illustrate the construction of the fastest vehicle paths at a single-lane roundabout and at a multilane roundabout, respectively. Exhibit 6-50 provides an example of an approach at which the right-turn path is Page 6-54 Chapter 6/Geometric Design
93 Roundabouts: An Informational Guide Vehicle Speed Estimation The relationship between travel speed and horizontal curvature is documented in the AASHTO Green Book (4). Both superelevation and the side friction factor affect the speed of a vehicle. Side friction varies with vehicle speed and can be determined in accordance with AASHTO guidelines. The most common superelevation values encountered are and 0.02, corresponding to 2% cross slope. Equation 6-1 and Equation 6-2 provide a simplified relationship between speed and radius for these two common superelevation rates that incorporates the AASHTO relationship and side friction factors. Exhibit 6-52 illustrates the speed radius relationship in a graphical format. Additional information regarding the relationship of speed to superelevation and side friction is provided in Appendix D. V = R , for e= V = R , for e= Equation 6-1 Equation 6-2 where V = predicted speed, mph; R = radius of curve, ft; and e = superelevation, ft/ft Exhibit 6-52 Speed Radius Relationship 30 Speed (mph) Radius (ft) e=+0.02 e=-0.02 The speed radius relationship given above generally provides a reasonable prediction for the left-turn and through movement circulating speeds. However, this method does not consider the effects of deceleration and acceleration and therefore may overpredict entry and exit speeds in cases where the path radius is large (1). To better predict actual entry speeds, Equation 6-3 may be used to account for deceleration of vehicles from the entering (R 1 ) speed to the circulating (R 2 ) Chapter 6/Geometric Design Page 6-57
94 Roundabouts: An Informational Guide speed. Analysts should use caution in using deceleration as a limiting factor to establish entry speeds for design. To promote safe design, deflection of the R 1 path radius should be the primary method for controlling entry speed. Therefore, while Equation 6-3 may provide an improved estimate of actual speed achieved at entry, for design purposes it is recommended that predicted speeds from Equation 6-1 be used. Equation 6-3 V 1 V1 = min pbase 2 ( 2 ) V 2a d where V 1 = entry speed, mph; V 1pbase = V 1 speed predicted based on path radius, mph; V 2 = circulatory speed for through vehicles predicted based on path radius, mph; a 12 = deceleration between the point of interest along V 1 path and the midpoint of V 2 path = 4.2 ft/s 2 ; and d 12 = distance along the vehicle path between the point of interest along V 1 path and the midpoint of V 2 path, ft. When identifying the predicted speed for the exit radius, R 3, the acceleration effects of vehicles can have a more prominent effect on the outcome of the estimated speed. At locations with a large radius or tangential exit, the measured R 3 radius will be so large that the acceleration characteristics of the vehicle will govern the actual speeds that can be achieved. Therefore, tangential exits do not inherently result in excessive exit speeds as compared to exits with some curvature, provided that circulating speeds are low and the distance to the point of interest on the exit (typically the crosswalk) is short. While it is desirable to provide some degree of curvature on the exit to reduce the visual appearance of a straight shot, recent U.S. research indicates that such curvature does not appear to always be the controlling factor for exit speeds (1). Exit speed can be estimated using Equation 6-4. Equation 6-4 V 3 V3 = min pbase 2 ( 2 ) V 2a d where V 3 = exit speed, mph; V 3pbase = V 3 speed predicted based on path radius, mph; V 2 = circulatory speed for through vehicles predicted based on path radius, mph; a 23 = acceleration between the midpoint of V 2 path and the point of interest along V 3 path = 6.9 ft/s 2 ; and d 23 = distance along the vehicle path between midpoint of V 2 path and point of interest along V 3 path, ft. Page 6-58 Chapter 6/Geometric Design
95 APPENDIX D-D Wisconsin DOT: Creating Roundabout Fastest Paths (Spline Curves) in Microstation Version 8i
 in Microstation Version 8i Creating Roundabout Fastest Paths (Spline Curves) in Microstation Version 8i Step 1: Copy Curb Offsets Create the curb")
96 FDM Attachment 50.2 Creating Roundabout Fastest Paths (Spline Curves) in Microstation Version 8i Creating Roundabout Fastest Paths (Spline Curves) in Microstation Version 8i Step 1: Copy Curb Offsets Create the curb offsets as shown in FDM , Figure 1 using the move/copy parallel function. Figure 1 Move/Copy Parallel A. 5 from left side face of curb (or 3 from painted C/L or flange line of curb & gutter) on each approach. B. 5 from face of curb on driver s right side at each entry and exit. C. 5 from central island face of curb. Face of curb for the Type R and T is 6-inches from the back of curb. D. Not less than 165 from roundabout Inscribed Circle Diameter (ICD). Typically this distance may be 165 but could be more depending on how a driver would approach the yield line at high speed. To determine the speed of a roundabout, the fastest path allowed by the geometry is drawn. This is the most realistic, smoothest path possible for a single vehicle, in the absence of other traffic and ignoring all lane markings, traversing through the entry, around the central island and out the exit (R1). Figure 2 Offsets for Fastest Path Step 2: Draw Spline Curve There are a couple different ways to set up spline functions as shown below: March 4, 2013 Attachment 50.2 Page 1
 in Microstation Version 8i Figure 3 Place B-spline Curve Draw the spline curve for the through movement as shown below, using near snaps for all")
.")
97 FDM Attachment 50.2 Creating Roundabout Fastest Paths (Spline Curves) in Microstation Version 8i Figure 3 Place B-spline Curve Draw the spline curve for the through movement as shown below, using near snaps for all points picked: Figure 4 Spline Curve through movement Clicking sequence: 1. Choose points A through C on the first 5 curb offset from splitter island (tentative snap, then left click to accept). Choose 3 points that are approximately 25 feet apart that will approximate the path of an approaching vehicle. It is advisable to choose two points outside of the 165 line and one on the 165 line. 2. Choose point D on the 5 curb offset from entry curve (tentative snap, then left click to accept). 3. Choose point E on the 5 curb offset from central island (tentative snap, then left click to accept). 4. Choose point F on the 5 curb offset from exit curve (tentative snap, then left click to accept). 5. Choose points G through I, or G 1 through I 1,on the 5 offset from the right side exit curb (tentative snap, then left click to accept). There may be times when it is appropriate to check the left side instead of the right side. The side is dependent on the anticipated driving path of the vehicle and the roadway alignment. Choose 3 points that are approximately 5 feet apart that will approximate the path of an exiting vehicle. Two points should be outside the 165 line and one point inside of the 165 line. 6. Right click to end the spline curve. MicroStation will then jump back to the start of the curve. 7. Snap to a point just upstream from the start of the spline at point J (tentative snap, then left click to accept). This forces the beginning of the spline to be tangent to the splitter island curb. 8. Microstation will then jump to the end of the curve. 9. Snap to a point just downstream from the end of the spline at point K (tentative snap, then left click to accept). This forces the end of the spline to be tangent to the splitter island curb. March 4, 2013 Attachment 50.2 Page 2
 in Microstation Version 8i Step 3: Modify Spline Curve Check the spline created in Step 2 above to see if it violates the 5 curb offsets.")
98 FDM Attachment 50.2 Creating Roundabout Fastest Paths (Spline Curves) in Microstation Version 8i Step 3: Modify Spline Curve Check the spline created in Step 2 above to see if it violates the 5 curb offsets. This can be done two different ways. One with the Measure Distance tool using the Minimum Between function. Measure the distance between the face of curb and the spline curve at points A through I shown above. Figure 5 Measure Distance The second is to zoom into the areas of points A through I and visually inspect whether the spline curve violates the curb offsets. In most cases, the spline may slightly violate the 5 curb offset. Use engineering judgment to determine if the spline will need to be modified. As shown, the spline should be modified. Modify the spline: If the spline is between the curb offset and the curb or outside of the curb offset, it will need to be modified. Figure 6 Spline curve between curb offset and the curb Using the tool Modify Element shown below grab the spline curve and pull it to a desired location on top of the curb offset. This may need to be done a few times before the spline is on top of all the curb offsets. Figure 7 Modify Element Evaluate the spline as a whole to see if it looks like it is the path that a vehicle would use. Oftentimes, the beginning or end of the spline may need to be pulled further away from the roundabout itself. March 4, 2013 Attachment 50.2 Page 3

99 FDM Attachment 50.2 Creating Roundabout Fastest Paths (Spline Curves) in Microstation Version 8i Step 4: Measure R-values 1. Once an acceptable spline is created, fit arcs to the spline to measure the R-values using the Place Arc tool with the Edge method. Figure 8 Place Arc 2. Using Near snaps, fit an arc onto the spline at a point that appears to be the tightest portion of the spline. This should occur prior to the yield line and not more than 165 from the yield line. 3. Check the length of the arc. Per FDM 11-26, Figure 30.2 if the arc is not 65 to 80 feet long, recreate it to try to get an arc that is 65 to 80 feet long. 4. Measure the radius of the arc. 5. Repeat to find R-values for R-1, R-2, and R To find R-4, simply measure the radius of the 5 curb offset from the central island. 7. To find R-5, create a spline that is tangential to the three curb offsets that define the R5 path (the 5 splitter island offset on the entry, the 5 offset on the inside of the right turn, and the 5 splitter island offset on the exit). Check that the arc does not cross any curb offsets, especially when the geometry of the right turn movement is created with multiple arcs. Below is a diagram of a typical R5 spline. Figure 9 Example R5 Spline March 4, 2013 Attachment 50.2 Page 4
REDEVELOPMENT TRAFFIC IMPACT STUDY
 REDEVELOPMENT TRAFFIC IMPACT STUDY For Wendy s Parker, Colorado January 215 Prepared for: Sterling Design Associates, LLC 29 W. Littleton Boulevard #3 Littleton, Colorado 812 Prepared by: 1233 Airport
ENKA INTERMEDIATE SCHOOL
 TRANSPORTATION IMPACT ANALYSIS Prepared for Buncombe County Schools ENKA INTERMEDIATE SCHOOL Asheville, NC Project Number: 13-71 8/1/13 www.davenportworld.com DAVENlORT Transportation Impact Analysis Enka
James M. Moore, Director of Planning & Building Services, Town of Fairfax. Victory Village Senior Housing Development Traffic Study
 Traffic Study To: From: James M. Moore, Director of Planning & Building Services, Town of Fairfax David Parisi, PE, TE, Parisi Transportation Consulting Date: October 14, 216 Subject: Victory Village Senior
Syracuse University University Place Road Closure
 Transportation Impact Study for the proposed Syracuse University University Place Road Closure City of Syracuse, Onondaga County, NY March 216 Project No. 3613 Prepared For: Syracuse University Office
Technical Memo. Steve Gramm, SDDOT. RE: Phase 1, Task 100: Baseline Analysis. To: From: Steve Hoff, HDR Engineering, Inc.
 Technical Memo To: Steve Gramm, SDDOT From: Steve Hoff, Engineering, Inc. Project: I-190/Silver Street Study CC: Date: 6//010 Job No: DOT Contract 41044, Order PD-0-09 RE: Phase 1, Task 100: Baseline Analysis
BOSTON REGION METROPOLITAN PLANNING ORGANIZATION
 PLANNING ORGANIZATIO BOSTON REGION MPO NMETROPOLITAN BOSTON REGION METROPOLITAN PLANNING ORGANIZATION Richard A. Davey, MassDOT Secretary and CEO and MPO Chairman Karl H. Quackenbush, Executive Direcr,
4. Include the associated years anticipated for the short term and long term analysis in the
 2nd DE Review SM ROCHA, LLC responses to City comments are provided within. 8. Trip distribution is displayed in Figure 6. Distribution assumes SFA and commercial traffic combined for most conservative
Traffic Impact Study WestBranch Residential Development Davidson, NC March 2016
 Traffic Impact Study WestBranch Residential Development Davidson, NC March 216 TRAFFIC IMPACT STUDY FOR THE WestBranch Residential Development LOCATED IN DAVIDSON, NC Prepared For: Lennar Carolinas, LLC
Traffic Impact Study. Crestline Piggly Wiggly Mountain Brook, Alabama. Goodwyn, Mills and Cawood, Inc. Birmingham, Alabama.
 Traffic Impact Study Crestline Piggly Wiggly Mountain Brook, Alabama Prepared for: Goodwyn, Mills and Cawood, Inc. Birmingham, Alabama September 214 Revision 1 October 214 Crestline Piggly Wiggly Mountain
Figure 1: Vicinity Map of the Study Area
 ARIZONA TEXAS NEW MEXICO OKLAHOMA May 5, 2016 Mr. Anthony Beach, P.E. BSP Engineers 4800 Lakewood Drive, Suite 4 Waco, Texas 76710 Re: Intersection and Access Analysis along Business 190 in Copperas Cove
Design Traffic Technical Memorandum
 State Road 7 Extension PD&E Study Design Traffic Technical Memorandum Palm Beach County, FL October 2010 State Road 7 Extension PD&E Study Design Traffic Technical Memorandum Palm Beach County, FL Prepared
Traffic Impact Analysis Chatham County Grocery Chatham County, NC
 Chatham County Grocery Chatham County, NC TABLE OF CONTENTS 1. INTRODUCTION... 1 1.1. Location and Study Area... 1 1.2. Proposed Land Use and Access... 2 1.3. Adjacent Land Uses... 2 1.4. Existing ways...
Michigan Avenue Traffic Study
 City of Sarnia Michigan Avenue Traffic Study Final Report November 29, 218 B17 SUBMITTED BY CIMA CANADA INC. 4 327 Harvester Road Burlington, ON L7N 3G7 T 289 288-287 F 289 288-285 cima.ca CONTACT Stephen
INDUSTRIAL BUILDING 3009 HAWTHORNE ROAD CITY OF OTTAWA TRANSPORTATION OVERVIEW REVISED. Prepared for: Canada Inc.
 INDUSTRIAL BUILDING 3009 HAWTHORNE ROAD CITY OF OTTAWA TRANSPORTATION OVERVIEW REVISED Prepared for: 7849648 Canada Inc. Octiober 1, 2015 114-598 Overview_2.doc D. J. Halpenny & Associates Ltd. Consulting
Roundabout Feasibility Memorandum
 Roundabout Feasibility Memorandum To From Gwen Pipkin Bill Howell Date June 18, 2013 Subject Roundabout Feasibility Study SR 29 PD&E Study From Oil Well Road to SR 82 Collier County, FL FPID 417540-1-22-01
George Street Transportation Impact Study. Paradigm Transportation Solutions Limited
 George Transportation Impact Study Paradigm Transportation Solutions Limited January 217 Project Summary Project Number 16191 January 217 Client Wastell Homes 5-1895 Blue Heron Drive London ON N6H 5L9
OFFICE/RETAIL DEVELOPMENT 1625 BANK STREET OTTAWA, ONTARIO TRANSPORTATION BRIEF. Prepared for: Canada Inc.
 OFFICE/RETAIL DEVELOPMENT 1625 BANK STREET OTTAWA, ONTARIO TRANSPORTATION BRIEF Prepared for: 9402209 Canada Inc. December 15, 2015 115-625 Report_2.doc D. J. Halpenny & Associates Ltd. Consulting Transportation
MEMO DRAFT VIA . Mr. Terry Bailey Foremost Development Company. To: Michael J. Labadie, PE Steven J. Russo, E.I.T. Fleis & VandenBrink.
 MEMO DRAFT VIA EMAIL To: From: Mr. Terry Bailey Foremost Development Company Michael J. Labadie, PE Steven J. Russo, E.I.T. Fleis & VandenBrink Date: August 29, 214 Re: Proposed Apartments City of Walled
Traffic Impact Analysis Walton Acres at Riverwood Athletic Club Clayton, NC
 Traffic Impact Analysis Walton Acres at Riverwood Athletic Club Clayton, NC 1. TABLE OF CONTENTS INTRODUCTION...1 1.1. Site Location and Study Area...1 1.2. Proposed Land Use and Site Access...2 1.3.
Walmart (Store # ) 60 th Street North and Marion Road Sioux Falls, South Dakota
 60 th Street North and Marion Road Sioux Falls, South Dakota") Walmart (Store #4865-00) 60 th Street North and Marion Road Sioux Falls, South Dakota Prepared for: Wal-Mart Stores, Inc. Bentonville, Arkansas Prepared by: Kimley-Horn and Associates, Inc. ã2013 Kimley-Horn
Walmart (Store #4865-00) 60 th Street North and Marion Road Sioux Falls, South Dakota Prepared for: Wal-Mart Stores, Inc. Bentonville, Arkansas Prepared by: Kimley-Horn and Associates, Inc. ã2013 Kimley-Horn
Re: Tanger Retail Outlets - Phase 2 Addendum #1 to Phase 1 CTS/TIS
 1223 Michael Street, Suite 100 Ottawa, Ontario K1J 7T2 (613) 738-4160 Fax: (613) 739-7105 www.parsons.com 8 December 2014 OUR REF: TO3186TOA RioCan Management Inc. Yonge Eglinton Centre 2300 Yonge Street
Public Information Meeting. Orange Camp Road. Dr. Martin Luther King Jr. Beltway to I-4. Presented by: Volusia County August 2, 2018
 Public Information Meeting Orange Camp Road Dr. Martin Luther King Jr. Beltway to I-4 Presented by: Volusia County August 2, 2018 1 Project Goals To improve the operations and safety for Orange Camp Road
I-95/Temple Avenue Interchange
 Roundabout Peer Review I-95/Temple Avenue Interchange Colonial Heights, Virginia January 2013 Roundabout Peer Review I 95/Temple Avenue Interchange Colonial Heights, Virginia Prepared for: Robert E. Vilak,
PRELIMINARY DRAFT WADDLE ROAD / I-99 INTERCHANGE PROJECT ALTERNATIVE ANALYSIS FINAL TRAFFIC SUMMARY REPORT
 PRELIMINARY DRAFT WADDLE ROAD / I-99 INTERCHANGE PROJECT ALTERNATIVE ANALYSIS FINAL TRAFFIC SUMMARY REPORT Prepared by: In Association with: November 2013 EXECUTIVE SUMMARY Patton Township, in partnership
Road Conversion Study Plumas Street
 Plumas Street Phase I Submitted to The Regional Transportation Commission of Washoe County Submitted by Zong Tian, Ph.D., P.E. Saeedeh Farivar Haiyuan Li, Ph.D. Center for Advanced Transportation Education
9 Leeming Drive Redevelopment Ottawa, ON Transportation Brief. Prepared By: Stantec Consulting Ltd.
 9 Leeming Drive Redevelopment Ottawa, ON Transportation Brief Prepared By: Stantec Consulting Ltd. TIA GUIDELINES CHECKLIST Report Context Municipal Address Comment: Section 1.1 Location relative to major
CENTRAL TRANSPORTATION PLANNING STAFF MEMORANDUM
 CTPS CENTRAL TRANSPORTATION PLANNING STAFF Staff to the Boston Region Metropolitan Planning Organization MEMORANDUM To: Thomas Cummings February 17, 2011 Holbrook Public Works Superintendent From: Re:
February 13, Mr. Chuck Marshall Stewart's Shops Corp. PO Box 435 Saratoga Springs, NY 12866
 February 13, 2017 Mr. Chuck Marshall Stewart's Shops Corp. PO Box 435 Saratoga Springs, NY 12866 Re: Modified Entrance Layout - Revised Traffic Assessment and Sight Distance Analysis Proposed Stewart's
CENTRAL TRANSPORTATION PLANNING STAFF MEMORANDUM
 CTPS CENTRAL TRANSPORTATION PLANNING STAFF Staff to the Boston Region Metropolitan Planning Organization MEMORANDUM To: Martha White, Natick Town Administrator February 17, 2011 Eric Nascimento, MassDOT
HUMC/Mountainside Hospital Redevelopment Plan
 Traffic and Parking Analysis HUMC/Mountainside Hospital Redevelopment Plan in Glen Ridge Borough and Montclair Township PREPARED FOR H2M 119 Cherry Hill Road, Suite 11 Parsippany, NJ 754 862.27.59 PREPARED
TRAFFIC IMPACT REPORT CASTLE PINES APARTMENTS CASTLE PINES, COLORADO
 TRAFFIC IMPACT REPORT CASTLE PINES APARTMENTS CASTLE PINES, COLORADO APRIL 12, 218 REV. JULY 16, 218 Prepared for: Davis Development 43 Corporate Center Dr Suite 21 Stockbridge, GA 3281 Prepared by: 112
S. Johnston (IBI Group)
") IBI GROUP 100 175 Galaxy Boulevard Toronto ON M9W 0C9 Canada tel 416 679 1930 fax 416 675 4620 ibigroup.com Memorandum To/Attention Project File Date October 15, 2013 From A. Ortlieb Project No 24RX12.0246.00
IBI GROUP 100 175 Galaxy Boulevard Toronto ON M9W 0C9 Canada tel 416 679 1930 fax 416 675 4620 ibigroup.com Memorandum To/Attention Project File Date October 15, 2013 From A. Ortlieb Project No 24RX12.0246.00
Evaluation of M-99 (Broad Street) Road Diet and Intersection Operational Investigation
 Road Diet and Intersection Operational Investigation") Evaluation of M-99 (Broad Street) Road Diet and Intersection Operational Investigation City of Hillsdale, Hillsdale County, Michigan June 16, 2016 Final Report Prepared for City of Hillsdale 97 North Broad
Evaluation of M-99 (Broad Street) Road Diet and Intersection Operational Investigation City of Hillsdale, Hillsdale County, Michigan June 16, 2016 Final Report Prepared for City of Hillsdale 97 North Broad
TECHNICAL MEMORANDUM VDOT Central Region On Call Task Order
 Kittelson & Associates, Inc. T R A N S P O R T A T I O N E N G I N E E R I N G / P L A N N I N G 1850 Centennial Park Drive, Suite 130, 20191 P 703-885-8970 F 703-885-8971 TECHNICAL MEMORANDUM VDOT Central
25 May 2018 OUR REF:
 25 May 2018 OUR REF: 476088-01000 Roderick Lahey Architect Inc. 56 Beech Street Ottawa, ON K1S 3J6 Attention: Robert Verch Dear Rob: Re: 929 Richmond Road Transportation Impact Assessment Addendum #1 1.
Student Housing Development
 Traffic Impact Study for the proposed Student Housing Development City of Oneonta Otsego County, New York Project No. 3259 December 212 Revised February 13, 212 Prepared For: Newman Development Group,
DUNBOW ROAD FUNCTIONAL PLANNING
 DUNBOW ROAD FUNCTIONAL PLANNING Final Report August 3, 216 #31, 316 5th Avenue NE Calgary, AB T2A 6K4 Phone: 43.273.91 Fax: 43.273.344 wattconsultinggroup.com Dunbow Road Functional Planning Final Report
FORM A PASCO COUNTY ACCESS CONNECTION PERMIT APPLICATION
 FORM 901.3.A PASCO COUNTY ACCESS CONNECTION PERMIT APPLICATION The following information is required from all applicants directly or indirectly accessing any collector or arterial road or as otherwise
MEDICAL/OFFICE BUILDING 1637 BANK STREET OTTAWA, ONTARIO TRANSPORTATION OVERVIEW. Prepared for:
 MEDICAL/OFFICE BUILDING 1637 BANK STREET OTTAWA, ONTARIO TRANSPORTATION OVERVIEW Prepared for: 2434984 Ontario Inc. 13-5510 Canotek Road Ottawa, Ontario K1J 9J5 June 4, 2015 115-613 Report_2.doc D. J.
Arterial Traffic Analysis Some critical concepts. Prepared by Philip J. Tarnoff
 Arterial Traffic Analysis Some critical concepts Prepared by Philip J. Tarnoff Agenda Fundamentals Signal timing concepts Actuated signal controllers Developing timing plans Types of signal control First
Glenn Avenue Corridor Traffic Operational Evaluation
 Glenn Avenue Corridor Traffic Operational Evaluation PREPARED FOR: THE CITY OF AUBURN PREPARED BY: DECEMBER 2007 Glenn Avenue Corridor Study--Auburn, Alabama TABLE OF CONTENTS Introduction... 1 Background
Traffic Impact Study Little Egypt Road Development Denver, North Carolina June 2017
 Traffic Impact Study Little Egypt Road Development Denver, North arolina June 2017 N. Little Egypt Road DQ\ QDQFLQJ VDOHV RU RWKHU SHUIRUPDQFH EDVHG FULWHULD Proposed Site Driveways Site Driveway 1 TRAFFI
INDUSTRIAL BUILDING 1660 COMSTOCK ROAD CITY OF OTTAWA TRANSPORTATION OVERVIEW. Prepared for:
 INDUSTRIAL BUILDING 1660 COMSTOCK ROAD CITY OF OTTAWA TRANSPORTATION OVERVIEW Prepared for: Simluc Contractors Limited 2550 Blackwell Street, Ottawa K1B 5R1 October 18, 2013 113-584 Overview_1.doc D. J.
PennDOT ICE Policy An Introduction
 PennDOT ICE Policy An Introduction January 2018 What is Intersection Control Evaluation (ICE)? Purpose: To consistently consider and screen among many proven combinations of geometry and traffic control
Multnomah County Courthouse Relocation. Transportation Alternatives Analysis Technical Memorandum: FINAL
 Multnomah County Courthouse Relocation Portland, Oregon Transportation Alternatives Analysis Technical Memorandum: FIL Prepared for Multnomah County Facilities and Property Management Division 41 N Dixon
5858 N COLLEGE, LLC N College Avenue Traffic Impact Study
 5858 N COLLEGE, LLC nue Traffic Impact Study August 22, 2016 Contents Traffic Impact Study Page Preparer Qualifications... 1 Introduction... 2 Existing Roadway Conditions... 5 Existing Traffic Conditions...
FINAL DESIGN TRAFFIC TECHNICAL MEMORANDUM
 FINAL DESIGN TRAFFIC TECHNICAL MEMORANDUM July 2014 FINAL (SR 43) Project Development and Environment Study From State Road 60 (Adamo Drive) to I-4 (SR 400) Hillsborough County, Florida Work Program Item
December TRANSPORTATION BRIEF 1-19 Beechwood Avenue, Ottawa, ON TRANSPORTATION INFORMATION TE WATER
 December 2012 TRANSPORTATION BRIEF 1-19 Beechwood Avenue, Ottawa, ON TRANSPORTATION INFORMATION TE WATER 1-19 Beechwood Avenue Mixed Use Development Transportation Brief prepared for: Minto Communities
Travel Demand Management Plan
 Travel Demand Management Plan Linden Corner at 43 rd Street & Upton Avenue South AUTHORIZED PROPERTY REPRESENTATIVE: By Dated: Mark Dwyer Linden Hills Redevelopment, LLC 4632 Washburn Avenue South Minneapolis,
Lyons Avenue/Dockweiler Road Extension Project Draft Environmental Impact Report. Appendix I Traffic Impact Study
 Lyons Avenue/Dockweiler Road Extension Project Draft Environmental Impact Report Appendix I Traffic Impact Study Street 0 80-1947 500.4501 RITA ld Court 0 91355-1096 400.7401 LA n Avenue 0 590-3745 300-9301
Roundabout Prequalification Training. March 11, 2015
 Roundabout Prequalification Training March 11, 2015 Presenters American Structurepoint, Inc. Jeromy Grenard, PE, PTOE Craig Parks, PE Why Roundabouts? Everybody else is building them? They look cool? Circles
ATTACHMENT A EXISTING TRAFFIC ENVIRONMENT
 ATTACHMENT A EXISTING TRAFFIC ENVIRONMENT a partnership of EXISTING CONDITIONS AND OPPORTUNITIES REPORT Public Review Draft December 217 Bascom Avenue Complete Streets Study Existing Data Review: Traffic
133 rd Street and 132 nd /Hemlock Street 132 nd Street and Foster Street MINI ROUNDABOUTS. Overland Park, Kansas
 133 rd Street and 132 nd /Hemlock Street 132 nd Street and Foster Street MINI ROUNDABOUTS Overland Park, Kansas September 1, 2017 TABLE OF CONTENTS 1. INTRODUCTION... 1 2. LITERATURE REVIEW... 1 3. CONCEPT
192 & 196 Bronson Avenue / 31 Cambridge Street
 Bronson Inc. July 213 192 & 196 Bronson Avenue / 31 Cambridge Street TRANSPORTATION BRIEF Prepared by: Study 192 Bronson Type Avenue July 213 Study Transportation Name Brief February 211 TB Check List
joint access drive. will be
 Date: To: From: Subject: June 22, 2015 Bradley Reiner, PE Bowman Consulting David R. Kline, PE, PTOE, Incline Associates Thornton Self-Storage Traffic Analysis (DRAFT) - Thornton, Colorado INTRODUCTION
Intersection Control Evaluation
 Intersection Control Evaluation Lor Ray Drive at Howard Drive in North Mankato, Nicollet County, Minnesota Mankato/North Mankato Area Planning Organization October 2016 SRF No. 016 09243 Table of Contents
APARTMENT BUILDING DEVELOPMENT 1161 HERON ROAD OTTAWA, ONTARIO TRANSPORTATION IMPACT STUDY. Prepared for:
 APARTMENT BUILDING DEVELOPMENT 1161 HERON ROAD OTTAWA, ONTARIO TRANSPORTATION IMPACT STUDY Prepared for: 1649362 Ontario Inc. c/o Manor Park Management 231 Brittany Drive, Suite D Ottawa ON K1K 0R8 July
HOLIDAY INN HOTEL 235 KING EDWARD AVENUE CITY OF OTTAWA TRANSPORTATION BRIEF. Prepared for:
 HOLIDAY INN HOTEL 235 KING EDWARD AVENUE CITY OF OTTAWA TRANSPORTATION BRIEF Prepared for: Momentum Planning & Communications 1165 Greenlawn Crescent Ottawa, ON K1L 6C2 June 29, 2015 115-618 Brief_1.doc
TRAFFIC IMPACT ANALYSIS
 TRAFFIC IMPACT ANALYSIS FOR THE CHAMPAIGN UNIT#4 SCHOOL DISTRICT PROPOSED HIGH SCHOOL (SPALDING PARK SITE) IN THE CITY OF CHAMPAIGN Final Report Champaign Urbana Urbanized Area Transportation Study 6/24/2014
HILTON GARDEN INN HOTEL HOTEL EXPANSION 2400 ALERT ROAD, OTTAWA TRANSPORTATION BRIEF. Prepared for:
 HILTON GARDEN INN HOTEL HOTEL EXPANSION 2400 ALERT ROAD, OTTAWA TRANSPORTATION BRIEF Prepared for: Bona Building & Management Co. Ltd. Place Vanier, 333 North River Road Vanier, Ontario K1L 8B9 October
Draft Report. Traffic Impact Study. Superstore, Wal-Mart, and Kent Development. Yarmouth, Nova Scotia. Prepared for
 oad & Traffic Management Road & Traffic Management R Atlantic Traffic Engineering Specialists Draft Report Traffic Impact Study Superstore, Wal-Mart, and Kent Development Yarmouth, Nova Scotia Prepared
Prepared for Lutheran Services Carolinas. Project Number: /07/2017. Trinity Landing. New Hanover County, NC
 Prepared for Lutheran Services Carolinas Project Number: 16273 4/7/217 Trinity Landing New Hanover County, NC Trinity Landing Transportation Impact nalysis Prepared for Lutheran Services Carolinas New
ORANGE COUNTY PUBLIC WORKS TRAFFIC INVESTIGATIONS
 ORANGE COUNTY PUBLIC WORKS TRAFFIC INVESTIGATIONS STAFF REPORT OF: January 6, 2019 SUPERVISORIAL DISTRICT: 5 SUBJECT: LOCATION: INVESTIGATOR: O Neill Drive at Roanoke Drive; Ladera Ranch; TB 922-E6 Clever
ALLEY 24 TRAFFIC STUDY
 ALLEY 24 TRAFFIC STUDY in City of Frostburg, Maryland January 2013 3566 Teays Valley Road Hurricane, WV Office: (304) 397-5508 www.denniscorporation.com Alley 24 Traffic Study January 2013 Frostburg, Maryland
Intersection of Massachusetts Avenue and Maple Street in Lexington Signalized Intersection and Roundabout Comparison
 Intersection of Massachusetts Avenue and Maple Street in Lexington Signalized Intersection and Roundabout Comparison Michael Wallwork, Roundabout Expert, Orange Park, Florida Tom Bertulis (MS, PE, PTOE),
TENW Transportation Engineering NorthWest
 DRAFT FOR CLIENT REVIEW ONLY TENW Transportation Engineering NorthWest MEMORANDUM DATE: August 22, 2017 TO: FROM: SUBJECT: Patrick Yamashita City of Mercer Island Chris Forster, P.E. TENW Trip Generation
Project Report. South Kirkwood Road Traffic Study. Meadows Place, TX October 9, 2015
 Meadows Place, TX October 9, 2015 Contents 1 Introduction... 1 2 Data Collection... 1 3 Existing Roadway Network... 2 4 Traffic Volume Development... 2 5 Warrant Analysis... 3 6 Traffic Control Alternative
EXECUTIVE SUMMARY. Page 1 of 6
 EXECUTIVE SUMMARY The purpose of this report is to identify conformance with the original traffic impact study for the proposed retail development on Lot 5 of Riverdale Retail Filing No. 1 located on the
MEETING FACILITY 2901 GIBFORD DRIVE CITY OF OTTAWA TRANSPORTATION BRIEF. Prepared for: Holiday Inn Express 2881 Gibford Drive Ottawa, ON K1V 2L9
 MEETING FACILITY 2901 GIBFORD DRIVE CITY OF OTTAWA TRANSPORTATION BRIEF Prepared for: Holiday Inn Express 2881 Gibford Drive Ottawa, ON K1V 2L9 December 18, 2012 112-566 Brief_1.doc D. J. Halpenny & Associates
Roundabouts. By: Nezamuddin, Valparaiso University. February 19, 2015
 Roundabouts By: Nezamuddin, Valparaiso University February 19, 2015 Outline 1. Background on Roundabouts 2. Silhavy Rd. Corridor Improvement Project in Valparaiso, IN 3. 5-points Roundabout in Valparaiso,
Kanata North Catholic Elementary School
 December 216 Kanata North Catholic Elementary School Transportation Brief SITE Potential Future Development Trillium Woods Prepared for: Bryden Martel Architects Inc Prepared by: KANATA NORTH CATHOLIC
Update to DOTD Roundabout Design Policy
 Update to DOTD Roundabout Design Policy Roundabout In Louisiana Louisiana has 18 roundabouts in operation and 53 proposed History EDSM s or Engineering Directives and Standards set DOTD policies, procedures,
Truck Climbing Lane Traffic Justification Report
 ROUTE 7 (HARRY BYRD HIGHWAY) WESTBOUND FROM WEST MARKET STREET TO ROUTE 9 (CHARLES TOWN PIKE) Truck Climbing Lane Traffic Justification Report Project No. 6007-053-133, P 101 Ι UPC No. 58599 Prepared by:
QUICKIE C STORE AND GAS BAR 1780 HERON ROAD OTTAWA, ONTARIO TRANSPORTATION BRIEF. Prepared for:
 QUICKIE C STORE AND GAS BAR 1780 HERON ROAD OTTAWA, ONTARIO TRANSPORTATION BRIEF Prepared for: Quickie Convenience Stores Larny Holdings Ltd. c/o PBC Group April 15, 2015 115-615 Report_1.doc D. J. Halpenny
1609 E. FRANKLIN STREET HOTEL TRAFFIC IMPACT STUDY EXECUTIVE SUMMARY
 1609 E. FRANKLIN STREET HOTEL TRAFFIC IMPACT STUDY EXECUTIVE SUMMARY Prepared for: The Town of Chapel Hill Public Works Department Traffic Engineering Division Prepared by: HNTB North Carolina, PC 343
Traffic Impact Study, Premier Gold Mines Limited, Hardrock Property
 Traffic Impact Study, Premier Gold Mines Limited, Hardrock Property Prepared for: Premier Gold Mines Limited Prepared by: Stantec Consulting Ltd. November 2014
Roundabout Evaluations in Virginia: US 15/US 50 Gilberts Corner, VA SR 106/SR 634 Prince George County, VA
 Roundabout Evaluations in Virginia: US 15/US 50 Gilberts Corner, VA SR 106/SR 634 Prince George County, VA VDOT & FHWA Roundabout Workshop September 17, 2013 Chris Tiesler, PE Presentation Outline US 15/US
February 8, Ms. Jamie Jun, Esq. Fromhold Jaffe & Adams 789 East Lancaster Avenue, Suite 220 Villanova, PA 19085
 WWW.TRAFFICPD.COM February 8, 2016 Ms. Jamie Jun, Esq. Fromhold Jaffe & Adams 789 East Lancaster Avenue, Suite 220 Villanova, PA 19085 Re: Kohelet Yeshiva School Lower Merion Township, Montgomery County,
FAIRFIELD INN & SUITES HOTEL 135 THAD JOHNSON PRIVATE OTTAWA TRANSPORTATION BRIEF. Prepared for:
 FAIRFIELD INN & SUITES HOTEL 135 THAD JOHNSON PRIVATE OTTAWA TRANSPORTATION BRIEF Prepared for: Bona Building & Management Co. Ltd. Place Vanier, 333 North River Road Vanier, Ontario K1L 8B9 August 12,
Route 28 (South Orleans Road)/Route 39 (Harwich Road)/Quanset Road Intersection
/Route 39 (Harwich Road)/Quanset Road Intersection") TRAFFIC FEASIBILITY STUDY Route 28 (South Orleans Road)/Route 39 (Harwich Road)/Quanset Road Intersection Orleans, Massachusetts Prepared for: Town of Orleans Prepared by: Fay, Spofford & Thorndike, LLC
TRAFFIC FEASIBILITY STUDY Route 28 (South Orleans Road)/Route 39 (Harwich Road)/Quanset Road Intersection Orleans, Massachusetts Prepared for: Town of Orleans Prepared by: Fay, Spofford & Thorndike, LLC
Northwest Corridor Project Interchange Modification, Interchange Justification and System Analysis Report Reassessment (Phase I)
") Northwest Corridor Project Interchange Modification, Interchange Justification and System Analysis Report Reassessment (Phase I) Introduction The Georgia Department of Transportation (GDOT) prepared a
Northwest Corridor Project Interchange Modification, Interchange Justification and System Analysis Report Reassessment (Phase I) Introduction The Georgia Department of Transportation (GDOT) prepared a
Design Criteria. Design Criteria
 F Design Criteria Design Criteria Ministry of Transportation Ministère des Transports DESIGN CRITERIA Page: 1 of 13 WORK PROJECT NO. N/A GO Bloomington Station TYPE OF PROJECT LOCATION Bloomington Road
I-95 Northbound at US 1 (Exit 126) Design and Study Final Report
 Design and Study Final Report") I-95 Northbound at US 1 (Exit 126) Design and Study Final Report July 2018 Prepared by: Prepared for: TABLE OF CONTENTS 1 Introduction... 1 Study Area Limits... 1 Purpose and Need of the Study... 1 Safety
I-95 Northbound at US 1 (Exit 126) Design and Study Final Report July 2018 Prepared by: Prepared for: TABLE OF CONTENTS 1 Introduction... 1 Study Area Limits... 1 Purpose and Need of the Study... 1 Safety
POWELL BUTTE HIGHWAY/NEFF ROAD INTERSECTION Interim Report: Existing Conditions, Needs, and Alternatives Review
 POWELL BUTTE HIGHWAY/NEFF ROAD INTERSECTION Interim Report: Existing Conditions, Needs, and Alternatives Review Date: December 30, 2013 Project #: 13963.0 To: Chris Doty PE and George Kolb, Deschutes County
Signal Warrant Studies
 Signal Warrant Studies Seven Locations Piqua, Ohio December 12, 217 Signal Warrant Studies Seven Locations Piqua, Ohio TABLE OF CONTENTS Executive Summary... 3 Introduction... 5 Study Location... 5 Data
Street / Bob Billings Parkway Lawrence, Kansas CFS Project No
 Drive Improvements 6 th Street to 15 th Street / Bob Billings Parkway Lawrence, Kansas 6644 CFS Project No. 15-56 Traffic Impact Study July 15, 15 Prepared for: City of Lawrence Public Works Department
Practical Application of Turn Lane Design Criteria in Developing Suburban & Urban Corridors
 Practical Application of Turn Lane Design Criteria in Developing Suburban & Urban Corridors Presented by Gilmer D. Gaston, P.E., PTOE October 14, 2014 San Antonio Austin Houston Fort Worth Dallas When
TRAFFIC SIGNALS OR ROUNDABOUT AT THIS UNUSUAL INTERSECTION?
 TRAFFIC SIGNALS OR ROUNDABOUT AT THIS UNUSUAL INTERSECTION? Presenting Author Phil Weber, P.Eng. GHD Inc. (The Home of Ourston Engineering) 11 Allstate Parkway, Suite 310 Markham, ON L3R 9T8 Phone (905)
COMMERCIAL DEVELOPMENT 2015 ROBERTSON ROAD OTTAWA, ONTARIO TRANSPORTATION BRIEF. Prepared for:
 COMMERCIAL DEVELOPMENT 2015 ROBERTSON ROAD OTTAWA, ONTARIO TRANSPORTATION BRIEF Prepared for: First Bay Properties Inc. 311 Richmond Road, Suite 203 Ottawa, ON K1Z 6X3 August 8, 2017 117-663 Brief_1.doc
Bank Street Retail/Hotel Development
 M a y 214 89-9 Bank Street Retail/Hotel Development Transportation Brief Google 214 Bing 214 Prepared for: Prepared by: Study 89-9 Type Bank Street May 214 Study Retail/Hotel Name Development February
Bistro 6. City of Barrie. Traffic Impact Study for Pratt Hansen Group Inc. Type of Document: Final Report. Project Number: JDE 1748
 City of Barrie Traffic Impact Study for Pratt Hansen Group Inc. Type of Document: Final Report Project Number: JDE 1748 Date Submitted: June 12 th, 2017 06/12/17 John Northcote, P.Eng. Professional License
Roundabout Design Aid PREPARED BY TRAFFIC AND SAFETY
 Roundabout Design Aid PREPARED BY TRAFFIC AND SAFETY May 2018 Engineering Manual Preamble This manual provides guidance to administrative, engineering, and technical staff. Engineering practice requires
SUNY Uptown Campus and Harriman State Office Campus Traffic Impact Study for the Emerging Technology and Entrepreneurship Complex (ETEC) Building
 Building") SUNY Uptown Campus and Harriman State Office Campus Traffic Impact Study for the Emerging Technology and Entrepreneurship Complex (ETEC) Building State University of New York at Albany City of Albany,
SUNY Uptown Campus and Harriman State Office Campus Traffic Impact Study for the Emerging Technology and Entrepreneurship Complex (ETEC) Building State University of New York at Albany City of Albany,
Capital Region Council of Governments
 March 23, 2018 Capital Region Council of Governments PROJECT CONCEPT REPORT Realignment of Swamp and Northfield Road s approaches to Route 44 (Boston Turnpike) Town of Coventry SUMMARY: The Town of Coventry
Lake Whitney Elementary School
 Lake Whitney Elementary School SCHOOL ROUTE PLAN For LAKE WHITNEY ELEMENTARY SCHOOL LOCATION 18 ORANGE COUNTY Prepared for: ORANGE COUNTY SCHOOL ASSESSMENT PROGRAM ORANGE COUNTY PUBLIC WORKS Traffic Engineering
Transportation Advisory Board
 C I T Y O F WEATHERFORD Transportation Advisory Board AGENDA REPORT Meeting Date: October 15,2015 Staff Contact: Manny Palacios Jr. Phone: E-mail: 817-598-4296 mpalacios@weatherfordtx.gov SUBJECT: Discuss
OTTAWA TRAIN YARDS PHASE 3 DEVELOPMENT CITY OF OTTAWA TRANSPORTATION IMPACT STUDY. Prepared for:
 OTTAWA TRAIN YARDS PHASE 3 DEVELOPMENT CITY OF OTTAWA TRANSPORTATION IMPACT STUDY Prepared for: The Ottawa Train Yards Inc. 223 Colonnade Road South, Suite 212 Nepean, Ontario K2E 7K3 January 17, 2012
Roundabout Design 101: Roundabout Capacity Issues
 Design 101: Capacity Issues Part 2 March 7, 2012 Presentation Outline Part 2 Geometry and Capacity Choosing a Capacity Analysis Method Modeling differences Capacity Delay Limitations Variation / Uncertainty
Modern Roundabouts: a guide for application
 Modern Roundabouts: a guide for application Kentucky Community Transportation Innovation Academy 2005 The contents of this booklet reflect the views of the authors who are responsible for the facts and
Traffic Impact Study. Roderick Place Columbia Pike Thompson s Station, TN. Transportation Group, LLC Traffic Engineering and Planning
 F i s c h b a c h Transportation Group, LLC Traffic Engineering and Planning Traffic Impact Study Roderick Place Columbia Pike Thompson s Station, TN Prepared March 2016 Ms. Gillian L. Fischbach, P.E.,