Innovative Management Solutions To Transport Problems
|
|
|
- Leonard Singleton
- 6 years ago
- Views:
Transcription


1 Innovative Management Solutions To Transport Problems Todd Litman Victoria Transport Policy Institute Presented at the SSTI Community of Practice Minneapolis 24 September 2010

2 Creating Paradise Paradise is not a distant destination, it is something we create in our own communities.

3 Sustainable Planning Sustainability emphasizes the integrated nature of human activities and therefore the need to coordinate planning among different sectors, jurisdictions and groups. 9/30/2010

4 Preventing Problems Sustainability planning is to development what preventive medicine is to health: it anticipates and manages problems rather than waiting for crises to develop.

5 Sustainabile Transportation? Is a transport system sustainable if all vehicles are electric powered?


6 Electric Power Does Not: Reduce traffic congestion Reduce accidents Reduce roadway costs Reduce parking facility costs Reduce vehicle purchase costs Improve mobility for non-drivers Improve social equity Improve public fitness and health Reduce sprawl Protect threatened habitat


7 Paradigm Shifts Growth - expanding, doing more. Development - improving, doing better. Mobility - physical movement. Accessibility - obtaining desired goods, services and activities.


8 Past Visions of Future Transport 1949 ConvAIRCAR Flying Car 1958 Firebird Segways Supersonic Concord

9 2001 A Space Odyssey

10 Wheeled Luggage

11 Per Capita Annual Vehicle Mileage Trends Supporting Multi-Modalism Motor vehicle saturation. 12,000 Aging population. 10,000 US UK Rising fuel prices. Increased urbanization. 8,000 6,000 Increased traffic and parking congestion. 4,000 2, Year Rising roadway construction costs and declining economic return from increased roadway capacity. Environmental concerns. Health Concerns
12 Annual Passenger Kms Per Capita OECD Travel Trends 25,000 20,000 15,000 10,000 5, Year U.S. Belgium Denmark Finland France Germany Greece Ireland Italy Netherlands Norw ay Portugal Spain Sw eden Sw itzerland U.K.
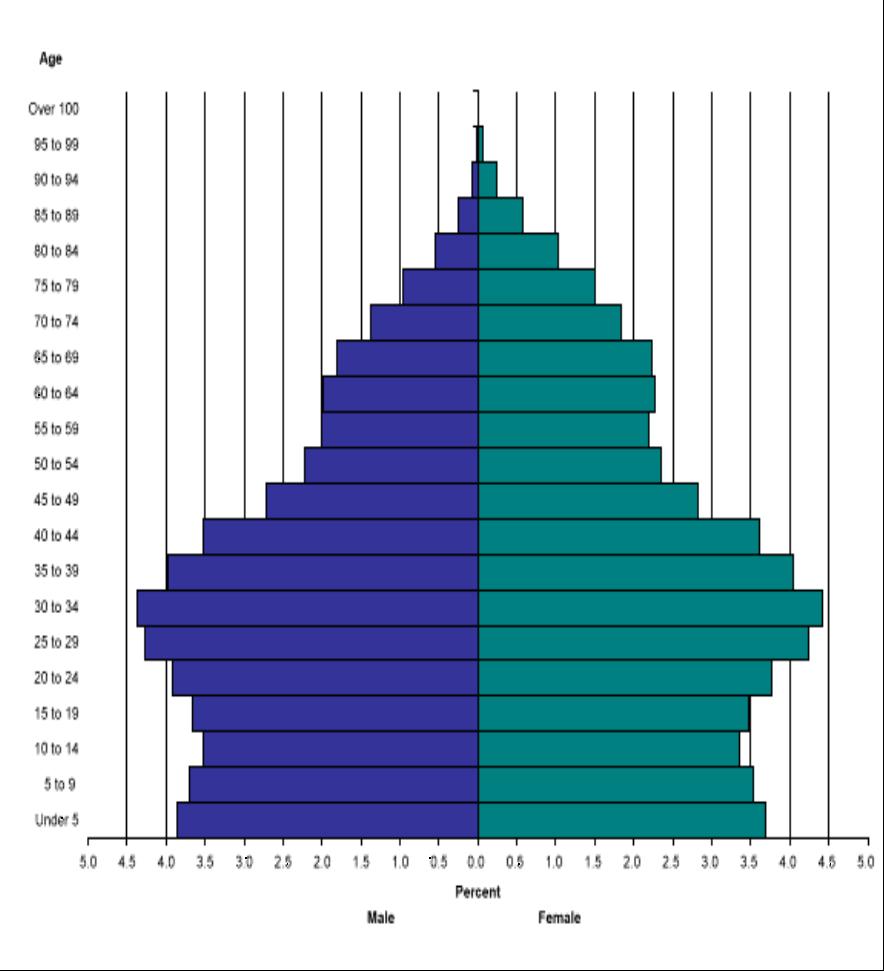
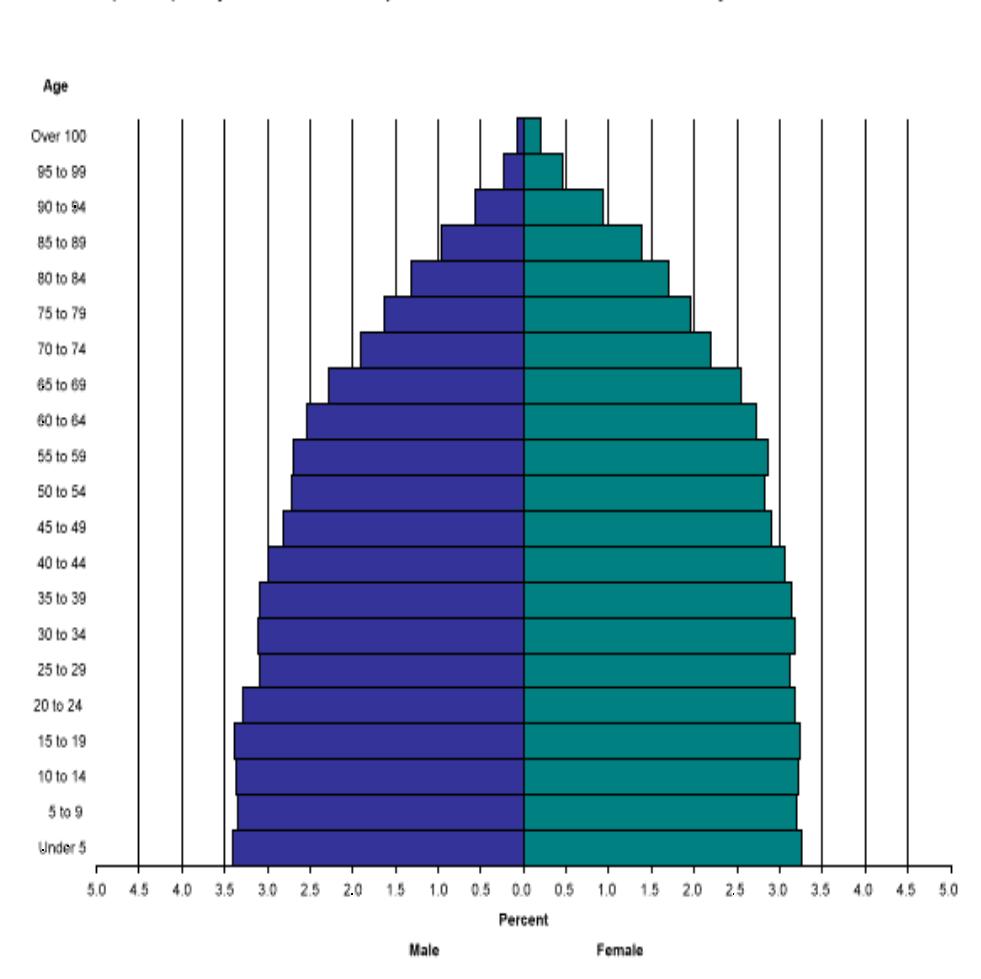
13 The Population is Aging

14 Portion of Total Population Urbanization Between the 1940s and 1980s the population became more suburbanized. Now, about half of North Americans live in suburbs. 90% 80% 70% 60% 50% 40% 30% 20% Suburban 10% Central City 0% Year

15 Tradeoffs Automobile-oriented improvements often degrade active transportation conditions. Undervaluing nonmotorized transport tends to bias planning decisions toward automobile dependency and away from multimodal accessibility.

16 Optimal Modal Split Small shifts from automobile to alternative modes causes large increases in walking, cycling and public transit demand. For example, a 5-point shift can increase use of alternative modes by 50%. 16
17 Total Travel Trends During the last century automobile travel grew significantly while travel by alternative modes stayed stagnant. During the next century automobile travel growth will decline while use of other modes will increase. Walking and Bicycling Public Transit Automobile
18 Average Daily Vehicle-Miles Per Capita US Daily Vehicle Travel Sacramento Portland Buffalo Honolulu Colorado Sp. Pittsburgh San Jose Salt Lake City San Diego Seattle Denver-Aurora Louisville Dallas-Ft Worth Detroit Atlanta St. Louis Davis, CA Eugene, OR (FHWA. 2007) Houston Charlotte Raleigh Birmingham
19 Mode Split International Mode Split 70% 60% 50% Transit Bike Walk 40% 30% 20% 10% 0% (Bassett, et al. 2008) 19


20 Commute Share US Mode Split 50% 40% 30% Work at Home Public Transport Bicycle Walk 20% 10% 0% New York San Francisco Boston Chicago Seattle Madison Honolulu, HI Portland Durham Akron Detroit Toledo Winston-Salem Rockford Knoxville Fort Wayne Jackson, MS Birmingham, AL Flint 21

21 What is The Transportation Problem? Traffic congestion? Road construction costs? Parking congestion or costs? Excessive costs to consumers? Traffic crashes? Lack of mobility for non-drivers? Poor freight services? Environmental impacts? Inadequate physical activity? Others?
22 Current Transport Planning Current planning tends to be reductionist: each problem is assigned to a single agency with narrowly defined responsibilities. For example: Transport agencies deal with congestion. Environmental agencies deal with pollution. Welfare agencies deal with the needs of disadvantaged people. Public health agencies are concerned with community fitness. Etc.


23 Reductionist Decision-Making Reductionist planning can result in public agencies implementing solutions to one problem that exacerbate other problems facing society, and tends to undervalue strategies that provide multiple but modest benefits.
24 Win-Win Solutions Put another way, more comprehensive planning helps identify Win-Win strategies: solutions to one problem that also help solve other problems facing society. Ask: Which congestion-reduction strategy also reduces parking costs, saves consumers money, and improves mobility options for non-drivers.
25 Comparing Benefits Planning Objectives Expand Roadways Efficient and Alt. Fuel Vehicles Shifts from Auto Alternative Modes Vehicle Travel Impacts Increased VMT Increased VMT Reduced VMT Reduce traffic congestion Roadway cost savings Parking cost savings Consumer cost savings Improve mobility options Improve traffic safety Energy conservation Pollution reduction Land use objectives Public fitness & health
26 Conventional Evaluation Generally Considered Congestion impacts Vehicle operating costs Per-mile crash impacts Per-mile pollution emissions. Often Overlooked Parking costs Total consumer costs Downstream congestion Crash, energy & pollution impacts of changes in mileage Land use impacts Impacts on mobility options for non-drivers/equity impacts Changes in active transport and related health impacts 27
27 Dollars Per Vehicle Mile Comparing Costs $0.30 $0.25 $0.20 Often Overlooked Generally Considered $0.15 $0.10 $0.05 $
28 Cost Per P assenger-mile Vehicle & Facility Costs $1.80 $1.60 $1.40 $1.20 $1.00 $0.80 $0.60 $0.40 $0.20 Parking Costs Roadway Costs Vehicle Operation $0.00 Bus Heavy Rail Commuter Rail Light Rail Automobile - Small City Auto - Medium City Auto - Large City

29 Monthly Household Expenditures Affordability $2,000 $1,800 $1,600 Transport Housing $1,400 $1,200 $1,000 $800 $600 $400 $200 $0 Urban Inner Suburb Outer Suburb Exurban 30
30 Transprot Portion of Household Expenditures Transportation Affordability 25% 20% Automobile Dependent Muti-Modal 15% 10% 5% 0% ,000 1,200 Per-Capita Annual Transit Passenger-Miles


31 Housing Foreclosures Housing foreclosure rates are much higher in automobiledependent locations. Denver Houston
32 Annual Transport Expenditures Per Capita Raise My Taxes, Please! $6,000 $5,000 $4,000 $3,000 $2,000 Transit fares Transit subsidies Roads Parking Vehicles High quality public transit typically requires about $268 in additional subsidies and $104 in additional fares annually per capita, but provides vehicle, parking and road cost savings averaging $1,040 per capita, plus other benefits: Congestion reductions $1,000 Accident reductions $0 Current Average Improved Transit Service Pollution reductions Improved mobility for non-drivers, Improved fitness and health
33 Traffic Fatalities Per 100,000 Pop. U.S. Crash Rates Rural Urban ,000 20,000 30,000 40,000 50,000 60,000 Per Capital Annual Vehicle Mileage 34
34 Traffic Fatalities Per 100,000 Residents Traffic Fatalities Automobile Dependent Multi-Modal ,000 1,200 Annual Per Capita Transit Passenger-Miles


35 Smart Growth Safety Impacts

36 What Gets People Moving? Recommended minimum: 20 minutes of moderate exercise a day. Although there are many ways to be physically active, active transportation is one of the most common, and improving active transportation conditions is a practical way to increase physical activity.
37 Average Daily Minutes Land Use Impacts On Travel Automobile Transit Walk Auto Dependent Mixed Multi-Modal Urban Index Rating 38
38 Jobs Created Per $1 million Expenditure Community Economic Impacts Project employment impacts Reducing business transport costs (congestion, parking, taxes) increases productivity and competitiveness. Reducing vehicle expenditures and expanding transit service increases regional employment and business activity. Agglomeration efficiencies. 5 Supports strategic land use development objectives. 0 Petroleum General Automobile Expenses General Consumer Expenditures Public Transit Increases affordability, allowing businesses to attract employees in areas with high living costs. Changes in household expenditures on vehicles and fuel.
39 Per Capita Annual GDP (2004) Per Capita GDP and VMT $60,000 $50,000 Productivity tends to decline with increased mobility. (Each dot is a U.S. urban region.) Bureau of Economic Analysis and FHWA data $40,000 $30,000 $20,000 $10,000 $0 R 2 = ,000 10,000 15,000 20,000 Per Capita Annual Mileage (2005)
40 Per Capita Annual GDP Per Capita GDP and Transit Ridership $90,000 $80,000 Productivity tends to increase with transit ridership. (Each dot is a U.S. urban region.) Bureau of Economic Analysis and FHWA data $70,000 $60,000 $50,000 $40,000 $30,000 $20,000 $10,000 $0 R 2 = ,000 1,200 1,400 Per Capita Annual Transit Passenger-Miles
41 Per Capita GDP and Urban Density Productivity tends to increase with population density. (Each dot is a U.S. urban region.) Bureau of Economic Analysis and Bureau of Transportation Statistics Data


42 Per Capita GDP and Lane-Miles Productivity tends to decline with increased roadway supply. (Each dot is a U.S. urban region.) Bureau of Economic Analysis and FHWA data
43 Annual Economic Returns Value of Highway Expansion Now that the highway system is mature, economic returns from further expansion have declined. 38% 33% 28% 23% 18% 13% 8% Highway Capital Private Capital 3% -2%
44 Annual Transport Expenditurs Sprawl Is Costly Increases infrastructure and public service costs. Increases transportation costs and reduces travel options. Environmental costs (reduced greenspace and wildlife habitat). $10,000 $8,000 $6,000 $4,000 $2,000 $- Smart Growth Sprawl 45
45 Smart Growth Benefits Economic Increased resource efficiency Lower development costs Lower public service costs Road and parking cost savings Economies of agglomeration More efficient transportation Social Improved transport options, particularly for nondrivers Improved housing options Community cohesion Preserves unique cultural resources More opportunities to exercise Environmental Greenspace & habitat preservation Reduced air pollution Increased energy efficiency Reduced water pollution Reduced heat island effect

46 Social Equity Equity objectives: An equal share of public resources for people with equal needs. Savings and benefits to lowerincome people. Increased opportunity to people who are physically, socially or economically disadvantaged. Basic mobility.
47 Choosing Transportation Futures Past Trends Basic Plan Moderate Enhancements Major Enhancements Walking/cycling programs Transit service Transit-oriented development Parking management & pricing Commute trip reduction School transport management Smart growth policies PAYD insurance Road pricing
48 Conventional Transport Indicators Roadway Level-of-Service (LOS) Average traffic speeds. Per capita congestion delay. Parking occupancy rates. Traffic fatalities per billion vehicle-miles. Traffic fatalities per 100,000 population. 49

49 Conventional Transport Indicators Roadway Level-of-Service (LOS) Average traffic speeds. Per capita congestion delay. Parking occupancy rates. Traffic fatalities per billion vehicle-miles. Traffic fatalities per 100,000 population. 50


, vehicle and waiting area")

50 Multi-Modal Level-Of-Service (LOS) Mode Walking Cycling Ridesharing Public transit Automobile Telework Delivery services Level of Service Factors Sidewalk/path quality, street crossing conditions, land use conditions, security, prestige. Path quality, street riding conditions, parking conditions, security. Ridematching services, chances of finding matches, HOV priority. Service coverage, frequency, speed (relative to driving), vehicle and waiting area comfort, user information, price, security, prestige. Speed, congestion delay, roadway conditions, parking convenience, safety. Employer acceptance/support of telecommuting, Internet access. Coverage, speed, convenience, affordability.


51 Multi-Modal LOS (Jacksonville) Cycling LOS Pedestrian LOS 52


52 Multi-Modal Prioritization Cycling Improvements Pedestrian Improvements 53
53 What Mode is Most Important? Conventional transport evaluation indicates that automobile travel is far more important than active transportation, providing 15 times as many person-trips and 50 times as many person-miles. From this perspective, walking and cycling are minor modes of travel, and so deserves only modest public support.
54 Counting All Walking NMT Transit Auto More comprehensive travel surveys typically increase the portion of nonmotorized travel 2-6 times by counting currently overlooked walking and cycling trips. Conventional Comprehensive
55 Mode Split Trips (UK Data) 90% 80% 70% Distance Time 60% 50% 40% 30% 20% 10% 0% Walk/Bike Automobile A small portion of distance but a large portion of travel time.


56 Win-Win Transportation Solutions Market reforms justified on economic principles that help provide various economic, social and environmental benefits. Improved travel options. Incentives to use travel alternatives. Accessible land use. Policy and market reforms.

57 Efficient Transportation 1. Consumer options (good walking, cycling, public transit, taxi, delivery services. 2. Cost-based pricing. 3. Neutral public policies (they do not arbitrarily favor automobile travel).


58 Mode Shifts How do we convince people who drive luxury cars to shift mode? 9/30/2010
. Low fares.")
. Convenient information.")
59 Attracting Discretionary Riders Quality service (convenient, fast, comfortable). Low fares. Support (walkable communities, park & ride facilities, commute trip reduction programs). Convenient information. Incentives such as parking cash out. Integrated with special events. Positive Image.
60 Annual Subway Trips (millions) Transit Fare Innovations 1,400 1,200 1, MetroCard and Integrated Fares Introduced Trend Line Impacts increase over time. Transfers. Electronic fares. Bulk discounts to groups (college students, employees, etc.) Off-peak discounts. Debit cards.

61 Daily Vehicle Travel Per Capita
")
 Accessible (walkability,")
 Services (refreshments,")
62 Transit Station Level-Of-Service Clean Comfort (seating, temperature, quiet) Convenience (real-time user information, easy fare payment) Accessible (walkability, bike parking, nearby housing, employment, nearby shops) Services (refreshments, periodicals, etc.) Security


63 Information Provide information when and were users need it: Walking, cycling and driving directions. Transit route, schedule, fare and real-time arrival. Travel times for various modes (e.g., transit vs. driving). Special problems (warnings of delays). On-board wifi services. Parking availability and price. Discounts and incentives.

64 Connected Bus ( Automatic Vehicle Location: Increases schedule accuracy, reliability and traffic management. Signal Priority: Transmits data to give buses priority through traffic signals. User Information: Transit routes, schedules, arrival times, fares, destinations and wayfinding. WiFi: Wireless Internet access for passengers at bus stop and on buses. Automated Announcements: Digital announcements assist passengers and reduce driver stress. Automatic Fare Collection and Passenger Counter: Transmits fare collection and passenger load information to central database. Vehicle Health Monitor: Tracks engine performance data to help identify potential problems. Safety and Security Monitoring: Transmits video to central operations location. Operator Training and Performance: Collects data to monitor operator performance.


65 Ridesharing Market studies suggest that a third of suburban automobile commuters would consider vanpooling, if it had: Flexibility. High Occupant Vehicle priority lanes and parking. Financial incentives. Integration with public transit. Employer support.

66 Employee Trip Reduction Programs Employers encourage employees to walk, bicycle, carpool, ride transit and telework rather than drive to work.
 contract services. Transport information and referral.")
67 Transport Management Association Ride-On in San Luis Obispo County: develop and implement creative solutions to transportation and mobility issues. It provides: Shuttle bus services. School transportation. Special event transportation. Employee lunchtime shuttle. Employee Transportation Coordinator (ETC) contract services. Transport information and referral. Commuter baseline survey. Guaranteed/Emergency Ride Home.

68 Walking and Cycling Improvements More investment in sidewalks, crosswalks, paths and bike lanes. Improved roadway shoulders. More traffic calming. Bicycle parking and changing facilities. Encouragement, education and enforcement programs.

69 School & Campus Transport Management Programs that encourage parents and students to use alternative modes to travel to schools, colleges and universities.

.")
70 Logistics: Freight Management Improve rail and marine transport services. Efficiently price road use (higher rates per mile for heavy vehicles). Encourage more efficient local delivery services. Reduce total goods volumes.

71 Raise My Prices, Please! Of course, motorists do not like to pay more for roads and parking, but unpriced facilities are not really free, consumers ultimately pay through higher taxes and retail prices. The choice is actually between paying directly or indirectly.
72 Paying Directly Returns Savings To Motorists Paying directly is more equitable and efficient, since users pay in proportion to the costs they impose. Free facilities force everybody to pay, including non-drivers and motorists who reduce their vehicle use. Paying directly gives individual consumers the savings that result when they drive less, providing a new opportunity to save money. Motorist Reduces Mileage Reduced Congestion, Road & Parking Facility Costs, Reduced Crashes, etc. Economic Savings


73 Cost-Based Pricing Rank Category Examples Best Second Best Time- and locationspecific road and parking pricing Mileage-pricing Variable road pricing, location-specific parking management, location-specific emission charges. Weight-distance charges, mileage-based vehicle insurance, prorated MVET, mileage based emission charges. Third Best Fuel charges Increase fuel tax, apply general sales tax to fuel, pay-at-the-pump insurance, carbon tax, increase Hazardous Sub. Tax. Bad Fixed vehicle charges Current MVET, vehicle purchase and ownership fees. Worst External costs (not charged to motorists) General taxes paying for roads and traffic services, parking subsidies, uncompensated external costs.


74 Road Pricing Charge motorists directly for using specific roads, based on use. Charge tolls, with higher rates during congested periods and lower rates during off-peak. Use electronic pricing systems that eliminate the need for tollbooths.

75 Gasoline Price (US$/Liter) Fuel Taxes $1.80 $1.60 $1.40 $1.20 $1.00 $0.80 $0.60 $0.40 $0.20 $0.00 Canada 0 5,000 10,000 15,000 20,000 25,000 Average Annual Vehicle Kilometers United States Canada Denmark France Germany Italy Japan Netherlands Norway Spain Sweden Switzerland United Kingdom United States

76 Parking Management More flexible parking requirements. Share parking spaces rather than having assigned spaces. Charge users directly for parking, rather than indirectly through taxes and rents. Parking Cash Out (Employees who current receive free parking are able to choose a cash benefit or transit subsidy instead.)

77 Parking Pricing and Cash Out Parking is never really free, consumers either pay directly or indirectly. Paying directly tends to be more fair and efficient, and typically reduces parking demand about 20%.


78 Distance-Based Pricing Motorists pay by the vehiclekilometre, so a $600 annual premium becomes 3 /km and a $2,000 annual premium becomes 10 /km. This gives motorists a significant financial incentive to drive less, but is not a new fee at all, simply a different way to pay existing fees.


79 Carsharing Automobile rental services intended to substitute for private vehicle ownership. 80
 Building")
80 Roadway Design Traffic lanes Parking lanes Bus or HOV lanes Bus stops Bike lanes Sidewalks and crosswalks Traffic speeds and volumes Landscaping (especially shade trees) Building orientation

81 Smart Growth Development Compact (density) Mixed development (proximity) Urban villages Connectivity Walkability/bikability Public transport Public realm Parking management 82
.")
. Reduced parking requirements.")
82 Location-Efficient Development Locate affordable housing in accessible areas (near services and jobs, walkable, public transit). Diverse, affordable housing options (secondary suites, rooms over shops, loft apartments). Reduced parking requirements. Reduces property taxes and utility fees for clustered and infill housing.

83 Change Is Possible In many situations, consumers are happy to change their habits, given suitable support. Many travelers want to drive more safely or use alternative mode. But they need information, resources and encouragement. 9/30/2010
. Effects of pricing and affinity products. Barriers to mode shifting.")
84 Puget Sound Vanpool Market Plan Telephone survey of commuters and employers in target areas. Current commute distance & mode. Level of interest in vanpooling (have you considered vanpooling in the last year?). Effects of pricing and affinity products. Barriers to mode shifting. 9/30/2010 Results identify cost-effective interventions and predict their impacts. Potential for doubling or tripling vanpool ridership. Being developed into a plan with specific goals, objectives and programs.
. Poverty and inflation affordable housing in accessible, multi-modal locations. Higher energy prices improve efficient modes (walking, cycling and public transport).")
85 Memo From Future Self Hope for the best but prepare for the worst: Physical disability diverse and integrated transport with universal design (accommodates people with disabilities and other special needs). Poverty and inflation affordable housing in accessible, multi-modal locations. Higher energy prices improve efficient modes (walking, cycling and public transport). Isolation and loneliness community cohesion (opportunities for neighbors to interact in positive ways).

86 Changes Required Educate decision makers concerning smart growth benefits and strategies. Change the way we think about and solve transport problems. New funding and development practices. New organizational relationships to create more integrated transport and land use planning.

87 Supported by Professional Organizations Institute of Transportation Engineers. American Planning Association. American Farmland Trust. Federal, state, regional and local planning and transportation agencies. International City/County Management Association National Governor s Association Health organizations. And much more...

88 Motorists Benefit Too More balanced transport policy is no more anti-car than a healthy diet is anti-food. Motorists have every reason to support these reforms: Reduced traffic and parking congestion. Improved safety. Improved travel options. Reduced chauffeuring burden. Often the quickest and most cost effective way to improve driving conditions.

89 Comprehensive Transportation Evaluation Framework Introduction to Multi-Modal Transportation Planning Smart Transportation Economic Stimulation Transportation Cost and Benefit Analysis Smart Transport Emission Reduction The Future Isn t What It Used To Be Online TDM Encyclopedia and more...

90 Phone & Fax: Rudlin Street Victoria, BC, V8V 3R7, CANADA Specializing in Progressive Transportation Decision Making Theory and Practice: Innovative Solutions Full Cost Analysis Mobility Management Transport and Land Use Interactions Environmental and Social Impact Assessment Public Transit Evaluation Transport Equity Sustainable Transport Planning Comprehensive Evaluation and Planning Bicycle & Pedestrian Planning Innovative Management Solutions To Transport Problems Information Resources Cambridge Systematics (2009), Moving Cooler: Transportation Strategies to Reduce Greenhouse Gas Emissions ( Karen Chapple and Carrie Makarewicz (2010), Restricting New Infrastructure: Bad for Business in California?, Access 36 ( Spring 2010, pp. 8-13; at Sisinnio Concas and Philip Winters (2007), Economics of Travel Demand Management: Comparative Cost Effectiveness and Public Investment, Center for Urban Transportation Research ( at Joe Cortright (2007), Portland s Green Dividend, CEOs for Cities ( at CTOD (2008), Capturing the Value of Transit, Center for Transit-Oriented Development, Reconnecting America ( for the U.S. Department of Transportation; at Robert Gosier, David Simchi-Levi, Jonathan Wright, and Brooks A. Bentz (2008), Past The Tipping Point: Record Oil Prices Require New Supply Chain Strategies To Enable Future High Performance, Accenture ( IEDC (2006), Economic Development and Smart Growth: Case Studies on the Connections Between Smart Growth Development and Jobs, Wealth, and Quality of Life in Communities, International Economic Development Council ( at Kaydee Kirk, et al. (2010), Framework for Measuring Sustainable Regional Development for the Twin Cities Region, Center for Urban & Regional Affairs, University of Minnesota ( at Todd Litman (2005), Evaluation Public Transit Benefits and Costs, VTPI ( at Todd Litman (2006), Changing Travel Demand: Implications for Transport Planning, ITE Journal, Vol. 76, No. 9, ( September, pp ; at Todd Litman (2007), Smart Transportation Investments: Reevaluating The Role Of Highway Expansion For Improving Urban Transportation, VTPI ( at Todd Litman, Executive Director
91 Victoria Transport Policy Institute Todd Litman (2008), Win-Win Transportation Solutions: Cooperation for Economic, Social and Environmental Benefits, Victoria Transport Policy Institute ( at Todd Litman (2009), Transportation Cost and Benefit Analysis, VTPI ( Todd Litman (2009), Where We Want To Be: Home Location Preferences And Their Implications For Smart Growth, Victoria Transport Policy Institute ( at Todd Litman (2010), Raise My Taxes, Please! Evaluating Household Savings From High Quality Public Transit Service, VTPI ( at Todd Litman (2010), Evaluating Transportation Economic Development Impacts, VTPI ( at Todd Litman (2010), Affordable-Accessible Housing In A Dynamic City: Why and How To Support Development of More Affordable Housing In Accessible Locations, Victoria Transport Policy Institute ( at Mark Muro and Robert Puentes (2004), Investing In A Better Future: A Review Of The Fiscal And Competitive Advantages Of Smarter Growth Development Patterns, Brookings Institute ( at MTC (2007), Developing Parking Policies to Support Smart Growth in Local Jurisdictions: Best Practices, Metropolitan Transportation Commission ( at NRDC (2010), Reducing Foreclosures and Environmental Impacts through Location-Efficient Neighborhood Design, Natural Resources Defense Council ( at Jeffery J. Smith and Thomas A. Gihring (2004), Financing Transit Systems Through Value Capture: An Annotated Bibliography, Geonomy Society ( at originally published as Financing Transit Systems Through Value Capture: An Annotated Bibliography, American Journal of Economics and Sociology, Volume 65, Issue 3, July 2006, p Transit Score ( measures how well a location is served by public transit based on the distance to the nearest transit stop and the quality of transit service. ULI and Ernst & Young (2009), Infrastructure 2009: Pivot Point, Urban Land Institute ( at ucture/infrastructure% ashx. VTPI (2010), Online TDM Encyclopedia, Victoria Transport Policy Institute ( WalkScore ( calculates the walkability of a location based on proximity to public services such as stores, schools and parks. Chris Webber and Glenn Athey (2007), The Route To Growth: Transport, Density And Productivity, Briefing Paper No. 4, Centre For Cities ( at 2
Win-Win Transportation Solutions
 Win-Win Transportation Solutions Todd Litman Victoria Transport Policy Institute Presented Lipinski Symposium on Transportation Policy Chicago, Illinois 15 October 2007 What is The Transportation Problem?
Cities Connect. Cities Connect! How Urbanity Supports Social Inclusion
 Cities Connect! How Urbanity Supports Social Inclusion Todd Litman Victoria Transport Policy Institute Metropolis Toronto, Canada - 14 June 2006 Cities Connect People with people. People with jobs. People
How To Encourage More Efficient Transportation in Brazilian Cities
 How To Encourage More Efficient Transportation in Brazilian Cities Todd Litman Victoria Transport Policy Institute Presented Seminar on Discouraging The Use Of Cars São Paulo, Brazil 3 September 2013 Creating
Economics of Highway Spending and Traffic Congestion. Todd Litman Victoria Transport Policy Institute Presented Strong Towns Webinar 3 February 2016
 Economics of Highway Spending and Traffic Congestion Todd Litman Victoria Transport Policy Institute Presented Strong Towns Webinar 3 February 2016 Motor Vehicle Travel is Peaking Annual Vehicle Mileage
A Vision For the Future The Role of Public Transportation in Central Oregon
 A Vision For the Future The Role of Public Transportation in Central Oregon Todd Litman Victoria Transport Policy Institute Presented Moving To The Future: Envisioning Better Public Transit For Central
Victoria Transport Policy Institute 1250 Rudlin Street, Victoria, BC, V8V 3R7, CANADA Phone & Fax
 1250 Rudlin Street, Victoria, BC, V8V 3R7, CANADA www.vtpi.org info@vtpi.org Phone & Fax 250-360-1560 Efficiency - Equity - Clarity How Urbanity Helps Achieve Social Inclusion Objectives by Todd Litman
Congestion Evaluation Best Practices
 Congestion Evaluation Best Practices Todd Litman Victoria Transport Policy Institute Presented International Transportation and Economic Development Conference 10 April 2014 Congestion Indicators Indicator
Measuring Transportation: Traffic, Mobility and Accessibility
 Measuring Transportation: Traffic, Mobility and Accessibility THIS FEATURE COMPARES THREE APPROACHES TO MEASURING TRANSPORTATION SYSTEM PERFORMANCE. TRAFFIC-BASED MEASUREMENTS EVALUATE MOTOR VEHICLE MOVEMENT;
BUILDING THE CASE FOR TRAVEL OPTIONS IN WASHING TON COUNTY. Image: Steve Morgan. Image: Steve Morgan
 BUILDING THE CASE FOR TRAVEL OPTIONS IN WASHING TON COUNTY Image: Steve Morgan Image: Steve Morgan Image: TriMet Image: TriMet WHAT ARE TRAVEL OPTIONS PROGRAMS? Travel options programs encourage residents,
Sustainable Transportation Planning in the Portland Region
 Sustainable Transportation Planning in the Portland Region Jennifer Dill, Ph.D. Associate Professor School of Urban Studies & Planning jdill@pdx.edu http://web.pdx.edu/~jdill/ Outline Elements of a sustainable
Complete Streets 101: The Basics
 Complete Streets 101: The Basics Michigan Municipal League - Capital Conference March 21, 2017 Chip Smith, AICP - Senior Planner - Wade Trim Inc. and City Council member City of Ann Arbor 2017 MML Capital
Integrating Public Health Objectives in Transportation Decision-Making
 Victoria Transportation Policy Institute 1250 Rudlin Street, Victoria, BC, V8V 3R7, CANADA www.vtpi.org info@vtpi.org Phone & Fax 250-360-1560 Efficiency - Equity - Clarity Integrating Public Health Objectives
Public Transport and Development: Making It Work
 Public Transport and Development: Making It Work Robert T. Dunphy Urban Land Institute World Bank Transport Forum 2006 March 28, 2006 Transportation Development Disconnect Now Few Then places w/o car Many
Balboa Area Transportation Demand Management
 Balboa Area Transportation Demand Management April 2016 Presented by: Jeff Tumlin What Are We Aiming For? Transportation is not an end in itself. It is merely a means by which we support the community.
SUSTAINABILITY, TRANSPORT, & HEALTH. Ralph Buehler, Virginia Tech
 SUSTAINABILITY, TRANSPORT, & HEALTH Ralph Buehler, Virginia Tech Prepared for National Academies Roundtable on Science and Technology for Sustainability 6 December 2013 Overview Trends in Motorization
Travel Behavior, Transport Policy, and Sustainable Transport in Germany and the USA
 Travel Behavior, Transport Policy, and Sustainable Transport in Germany and the USA Similarities between Germany and the USA Federal system of government, tradition of local self-government Strong economy,
Transportation Master Plan Advisory Task Force
 Transportation Master Plan Advisory Task Force Network Alternatives & Phasing Strategy February 2016 BACKGROUND Table of Contents BACKGROUND Purpose & Introduction 2 Linking the TMP to Key Council Approved
FACTS AND FIGURES: MAKING THE CASE FOR COMPLETE STREETS IN LEE COUNTY
 FACTS AND FIGURES: MAKING THE CASE FOR COMPLETE STREETS IN LEE COUNTY Safety: Close to 5,000 pedestrians and bicyclists die each year on U.S. roads, and more than 70,000 are injured. [Mean Streets, Surface
Canada. UK France. Walk, Bike, Transit Share of Trips
 1950s 1960s Today Relationship between Share of Urban Trips by Transit, Bicycle, and Foot and Per Capita Annual CO 2 Emissions from Road and Rail Transport in Australia, Canada, the USA and EU Countries,
2. Context. Existing framework. The context. The challenge. Transport Strategy
 Transport Strategy Providing quality connections Contents 1. Introduction 2. Context 3. Long-term direction 4. Three-year priorities 5. Strategy tree Wellington City Council July 2006 1. Introduction Wellington
Performance Criteria for 2035 Long Range Transportation Plan
 Minimizing Impacts on Natural, Historic, Cultural or Archeological Resources 2035 LRTP Weighting Factor: 7% Objective 1.1: Use appropriate planning and design criteria to protect and enhance the built
WELCOME. City of Greater Sudbury. Transportation Demand Management Plan
 WELCOME City of Greater Sudbury Transportation Demand Management Plan Public Consultation Session St. Andrew s Place, Activity Hall 111 Larch Street Wednesday September 13, 2017 6:00 to 8:00 pm Welcome
Public Consultation Centre For. Transportation Master Plan Update. Information Package
 Public Consultation Centre For Transportation Master Plan Update Information Package Date Location Hours Tuesday, September 12, 2017 Wednesday, September 13, 2017 Tuesday, September 19, 2017 Cambridge
What s Health Got to Do With It? Health and Land Use Planning
 What s Health Got to Do With It? Health and Land Use Planning CANDACE RUTT, PH.D. EXECUTIVE DIRECTOR APRIL 13 TH, 2016 Planning and Public Health Planning + Public Health Healthy Communities Healthier
Multimodal Transportation Plan
 Multimodal Transportation Plan The Multimodal Transportation Plan will accommodate MILLENIALS ARE DRIVING LESS. WE CANNOT BUILD OUR WAY all modes of transportation by keeping pedestrians, OUT OF CONGESTION.
Proposed. City of Grand Junction Complete Streets Policy. Exhibit 10
 Proposed City of Grand Junction Complete Streets Policy Exhibit 10 1 City of Grand Junction Complete Streets Policy Vision: The Complete Streets Vision is to develop a safe, efficient, and reliable travel
Measuring the Distribution and Costs of Congestion. Tim Lomax Texas Transportation Institute
 Measuring the Distribution and Costs of Congestion Tim Lomax Texas Transportation Institute http://mobility.tamu.edu The Congestion Measurement Story Travel time, variations, compare to goals WHAT? WHY?
Berkeley Strategic Transportation Plan A-76
 Berkeley Strategic Transportation Plan A-76 Appendices 1. A Team Effort 2. Where We ve Been A-11 Berkeley Strategic Transportation Plan Alameda County Transportation Plan Alameda County will be served
MCTC 2018 RTP SCS and Madera County RIFP Multi-Modal Project Eval Criteria GV13.xlsx
 MCTC 8 RTP SCS and Madera County RIFP Multi-Modal Project Eval Criteria GV.xlsx Madera County Transportation Commission Regional Transportation Plan / Sustainable Communities Strategy Multi-Modal Project
Congestion Management in Singapore. Assoc Prof Anthony TH CHIN Department of Economics National University of Singapore
 Congestion Management in Singapore Assoc Prof Anthony TH CHIN Department of Economics National University of Singapore anthonychin@nus.edu.sg Introduction 2 Introduction and What is Traffic Congestion?
Regional Transportation Needs Within Southeastern Wisconsin
 Regional Transportation Needs Within Southeastern Wisconsin #118274 May 24, 2006 1 Introduction The Southeastern Wisconsin Regional Planning Commission (SEWRPC) is the official areawide planning agency
Arnold Hinojosa
 Policy Analysis of the Mass Transit Challenges Facing Rapidly Growing Southern and Western Cities and How These Challenges Can Be Addressed Using the Model Set by Chicago Arnold Hinojosa ahinojosa@kentlaw.edu
Typical Rush Hour Commute. PennyforTransportation.com
 Typical Rush Hour Commute In the News Overview of the Plan Collaborative plan with projects in every community Prioritizing connectivity and congestion relief Dedicated transportation-specific funding;
Concept of Sustainable Transport and integrated Land Use Planning- An Overview. Manfred Breithaupt GIZ Water, Energy, Transport
 Concept of Sustainable Transport and integrated Land Use Planning- An Overview Manfred Breithaupt GIZ Water, Energy, Transport The adverse impacts of growth in motorization - in economic, environmental
WILMAPCO Public Opinion Survey Summary of Results
 Wilmington Area Planning Council WILMAPCO Public Opinion Survey Summary of Results Prepared by: 2955 Valmont Road, Suite 300 Boulder, Colorado 80301 t: 303-444-7863 f: 303-444-1145 www.n-r-c.com Table
Purpose and Need. Chapter Introduction. 2.2 Project Purpose and Need Project Purpose Project Need
 Chapter 2 Purpose and Need 2.1 Introduction The El Camino Real Bus Rapid Transit (BRT) Project (Project) would make transit and other transportation improvements along a 17.6-mile segment of the El Camino
Performance measures for nonmotorized
 Performance measures for nonmotorized transportation May 2, 2014 Performance measures for non-motorized transportation Today s Speakers Robbie Webber State Smart Transportation Initiative Craig Williams
Real-Life Cost of Incomplete Streets
 Real-Life Cost of Incomplete Streets Presented by: Sheree Davis New Jersey Department of Transportation State Bicycle & Pedestrian Coordinator 609.530.6551 sheree.davis@dot.state.nj.us 2011 New Jersey
Todd Alexander Litman Victoria Transport Policy Institute
 Todd Alexander Litman Victoria Transport Policy Institute Abstract This paper describes ways to quantify the value of walking (the activity) and walkability (the quality of walking conditions, including
About the Active Transportation Alliance
 About the Active Transportation Alliance Chicagoland s voice for better biking, walking and transit Founded 1985 7,000 members, ~33 full time staff Serve Chicago metro region 1 More Cars, More Driving
Chapter 4 Transportation Strategies to Support Growth
 City of Brantford Chapter 4 Transportation Strategies to Support Growth TABLE OF CONTENTS 4.1 DESIGNING A TRANSPORTATION STRATEGY... 1 4.2 STRATEGIES TO INCREASE SUPPLY... 2 4.2.1 Optimizing the Existing
METRO RTA TRANSIT MASTER PLAN. May 25-26, 2011
 METRO RTA TRANSIT MASTER PLAN May 25-26, 2011 WHAT IS THE TRANSIT MASTER PLAN? A twenty-year plan for METRO RTA What will METRO look like in 2031? 1 TRANSIT TECHNOLOGIES 2 TRANSIT TECHNOLOGIES Transit
AMATS Complete Streets Policy
 AMATS Complete Streets Policy Table of Contents: Section 1. Definition of Complete Streets Section 2. Principles of Complete Streets Section 3. Complete Streets Policy Section 4. Consistency Section 5.
Nomination. Halton Region in Context
 Transportation Association of Canada Sustainable Urban Transportation Award Nomination of: Region of Halton Regional Transportation Master Plan Study March 2005 Nominated by: Nomination The TAC Sustainable
CITY OF BLOOMINGTON COMPLETE STREETS POLICY
 CITY OF BLOOMINGTON COMPLETE STREETS POLICY POLICY OBJECTIVE: The City of Bloomington will enhance safety, mobility, accessibility and convenience for transportation network users of all ages and abilities,
City of Novi Non-Motorized Master Plan 2011 Executive Summary
 City of Novi Non-Motorized Master Plan 2011 Executive Summary Prepared by: February 28, 2011 Why Plan? Encouraging healthy, active lifestyles through pathway and sidewalk connectivity has been a focus
Chapter 2. Bellingham Bicycle Master Plan Chapter 2: Policies and Actions
 Chapter 2 Bellingham Bicycle Master Plan Chapter 2: Policies and Actions Chapter 2: Policies and Actions The Bicycle Master Plan provides a road map for making bicycling in Bellingham a viable transportation
Living Streets response to the Draft London Plan
 Living Streets response to the Draft London Plan Contents Living Streets response to the Draft London Plan... 1 About Living Streets... 2 Summary... 2 Consultation response... 3 Chapter 1: Planning London
Transportation and Parking Management Plan Executive Summary. By Todd Litman Victoria Transport Policy Institute
 Transportation and Parking Management Plan Executive Summary By Todd Litman 2009 Camosun College Transportation and Parking Management Plan Executive Summary Revised 2010 By Todd Litman For Camosun College
Develop a Multi-Modal Transportation Strategy (Theme 6)
") DEVELOP A MULTI-MODAL TRANSPORTATION STRATEGY (THEME 6) WHY IS THIS THEME ADDRESSED? Develop a Multi-Modal Transportation Strategy (Theme 6) Statement of Ideal Reduce resident and visitor reliance on single
DEVELOP A MULTI-MODAL TRANSPORTATION STRATEGY (THEME 6) WHY IS THIS THEME ADDRESSED? Develop a Multi-Modal Transportation Strategy (Theme 6) Statement of Ideal Reduce resident and visitor reliance on single
Preview. Tables in your paper Mass Transit as alternative to auto California s problems in urban transportation
 Preview Tables in your paper Mass Transit as alternative to auto California s problems in urban transportation Integrating tables in your writing Commuting in Urban Areas Last time auto and congestion
Dear City Council Members,
 From: Bob Kenyon [mailto: ] Sent: Monday, February 08, 2016 10:20 AM To: City Clerk Subject: Please prioritize Caltrain and a complete transit network Thank you for prioritizing bringing BART to San Jose
North Coast Corridor:
 North Coast Corridor: Connecting People, Transportation & Environment Legislative Hearing: 11.8.10 1 North Coast Corridor Region s Lifeline A Regional Strategy Mobility, Economy & Environment North Coast
TOWARDS A BIKE-FRIENDLY CANADA A National Cycling Strategy Overview
 TOWARDS A BIKE-FRIENDLY CANADA A National Cycling Strategy Overview NationalCyclingStrategFrameworkv3.indd 1 Potential for this modal shift can be found in municipalities of all sizes, in every population
INFRASTRUCTURE: Using the Grid to Create a more Self-Sustaining Downtown. Studio Spring 2013
 EMERGENT FUTURES The San Diego Section of the American Society of Civil Engineers (ASCE) released a new report, the 2012 San Diego County Infrastructure Report Card. Since the last San Diego Report Card
Appendix T 1: Additional Supporting Data
 Appendix T 1: Additional Supporting Data Project Delivery Delays with the implementation of the 2000 TIP became apparent early in the decade. In response to direction among policy officials, ARC began
Fiscal Year Budget Overview
 Fiscal Year 2015-2016 Budget Overview Investing in Transportation for Today and Tomorrow Ed Reiskin Director of Transportation APRIL 1, 2014 San Francisco: great city, excellent transportation choices
Public Works AGENDA ITEM D-2 STAFF REPORT
 AGENDA ITEM D-2 Public Works STAFF REPORT Transportation Master Plan Oversight and Outreach Committee Meeting Date: 10/30/2017 Staff Report Number: 17-001-TMP Regular Business: Provide feedback on Performance
We believe the following comments and suggestions can help the department meet those goals.
 The Honorable Secretary Anthony Foxx The Secretary of Transportation United States Department of Transportation 1200 New Jersey Avenue, SE Washington, DC 20590 August 30, 2013 Dear Secretary Foxx, Thank
4 Ridership Growth Study
 Clause 4 in Report No. 15 of Committee of the Whole was adopted, without amendment, by the Council of The Regional Municipality of York at its meeting held on November 16, 2017. 4 Ridership Growth Study
CONNECTING PEOPLE TO PLACES
 CONNECTING PEOPLE TO PLACES 82 EAST BENCH MASTER PLAN 07 Introduction The East Bench transportation system is a collection of slow moving, treelined residential streets and major arteries that are the
Appendix C 3. Bicycle / Pedestrian Planning
 Appendix C 3. Bicycle / Pedestrian Planning BICYCLE/PEDESTRIAN PLANNING 2005 Master Plan GOAL: Provide for safe and convenient bicycle and pedestrian circulation throughout the City. Develop a city-wide
Preview. Second midterm Tables in your paper Mass Transit as alternative to auto California s problems in urban transportation
 Preview Second midterm Tables in your paper Mass Transit as alternative to auto California s problems in urban transportation Score Distribution 1 st Midterm 2 nd Midterm 3.5-4.0 8% 21% 3.0-3.5 23% 34%
Governor s Transportation Vision Panel
 Office of Governor Kate Brown Governor s Transportation Vision Panel JLA Public Involvement Project Overview The is a yearlong effort to develop a series of recommendations for the Governor that address
A Federal Perspective on Congestion Pricing. Wayne Berman Federal Highway Administration July 8, 2010
 A Federal Perspective on Congestion Pricing Wayne Berman Federal Highway Administration July 8, 2010 Overview Background on Congestion Pricing Benefits and Experiences of Pricing Case Study Miami I-95
modes, the increased roadway capacity is the implied solution, which, in turn, has been shown to lead to more driving (induced demand).
.") EXECUTIVE SUMMARY A. Introduction The San Francisco Congestion Management Program (CMP) is a biennial program conducted in accordance with state law to monitor congestion and adopt plans for mitigating
EXECUTIVE SUMMARY A. Introduction The San Francisco Congestion Management Program (CMP) is a biennial program conducted in accordance with state law to monitor congestion and adopt plans for mitigating
Perryville TOD and Greenway Plan
 Perryville TOD and Greenway Plan Greenway Glossary Pathway: A bicycle and pedestrian path separated from motorized vehicular traffic by an open space, barrier or curb. Multi-use paths may be within the
Incorporating Health in Regional Transportation Planning
 Mayor Karl Dean, Chairman Incorporating Health in Regional Transportation Planning Leslie A. Meehan, AICP Center TRT Intervention Webinar January 29, 2013 Objectives for Today Background About the Nashville
Ranking Walkable Urbanism in America s Largest Metros
 Ranking Walkable Urbanism in America s Largest Metros The Largest 30 Metros in the United States SHARE OF U.S. POPULATION SHARE OF U.S. GDP 54% 46% 42% 58% LARGEST 30 METROS REST OF U.S. The Old Dichotomy
October 29, Modern traffic mitigation for development in cities: Moving beyond LOS
 Modern traffic mitigation for development in cities: Moving beyond LOS October 29, 2018 Modern traffic mitigation for development in cities: Moving beyond LOS State Smart Transportation Initiative Practical
Economic Value of Walkability
 www.vtpi.org Info@vtpi.org 250-360-1560 Economic Value of Walkability 1 February 2011 By Todd Alexander Litman Abstract This paper describes ways to evaluate the value of walking (the activity) and walkability
Konstantin Glukhenkiy Economic Affairs Officer
 Konstantin Glukhenkiy Economic Affairs Officer Rapid growth of urban areas Very rapid increase in motorisation Substantial increases in traffic congestion Relative decline of public transport usage and
Community Task Force July 25, 2017
 Community Task Force July 25, 2017 Welcome and Introductions Project Partners Regional Transportation District (RTD) Colorado Department of Transportation (CDOT) Denver Regional Council of Governments
Prioritizing Transportation Policy and Funding for Active Transportation, Safety, Equity and Health
 Mayor Karl Dean, Chairman Prioritizing Transportation Policy and Funding for Active Transportation, Safety, Equity and Health Leslie A. Meehan, AICP Planning and Implementing the Active Community Webinar
Stakeholder Meeting Handouts. January 2013
 January 2013 Stakeholder Meeting Handouts The Case FOR Parking Minimum Requirements Reduce street congestion around the development site Avoid parking spillover Create orderly development patterns Anticipate
Creating Complete Streets to Accommodate All Users
 Creating Complete Streets to Accommodate All Users Peter Lagerwey, Toole Design Group plagerwey@tooledesign.com Brian Dougherty, Seattle DOT brian.dougherty@seattle.gov International Conference on Urban
TOWN OF PORTLAND, CONNECTICUT COMPLETE STREETS POLICY
 TOWN OF PORTLAND, CONNECTICUT COMPLETE STREETS POLICY I. VISION, GOALS & PRINCIPLES VISION To improve the streets of Portland making them safer and more accessible for all users including pedestrians,
Beyond First First Last Last Mile Strategies. APA National Conference April 3, 2016 Chelsea Richer, AICP Fehr & Peers
 Beyond First First Last Last Mile Strategies APA National Conference April 3, 2016 Chelsea Richer, AICP Fehr & Peers 1 Beyond First Last Mile Strategies APA National Conference Jeremy Klop, AICP, Fehr
Managed Lanes: A National Perspective Managed Lane Strategies
 Managed Lanes: A National Perspective Managed Lane Strategies Use the following control strategies to manage a lane(s) to provide a reliable transportation option: Eligibility/occupancy Access control
A Holistic Approach to Community Connectivity. 50 th International Making Cities Livable Conference Portland, OR June 2013
 A Holistic Approach to Community Connectivity 50 th International Making Cities Livable Conference Portland, OR June 2013 Founded 2008 About GP RED Research Education Advocacy Focus on Health, Recreation
Evaluating Non-Motorized Transportation Benefits and Costs
 www.vtpi.org Info@vtpi.org 250-360-1560 Evaluating Non-Motorized Transportation Benefits and Costs 16 May 2011 Todd Litman Abstract This report describes methods for evaluating non-motorized transport
Appendix A-K Public Information Centre 2 Materials
 Appendix A-K Public Information Centre 2 Materials Our Rapid Transit Initiative Make an impact on the future of transit Join the discussion on Rapid Transit in London You re invited to a Public Information
13,351. Overall Statewide Results. How was the survey taken? Do you own or lease a personal vehicle? What is your primary means of transportation?
 Overall Statewide Results 3 1 Houston 2 Dallas 3 Fort Worth 4 San Antonio 2 11 12 Austin 6 Laredo / Pharr 7 Corpus Christi / Yoakum 8 Bryan / Waco 9 Atlanta / Beaumont / Lufkin / Paris / Tyler Amarillo
APPENDIX C. Systems Performance Report C-1
 APPENDIX C Systems Performance Report C-1 System Performance Report & Requirements According to the FAST Act, a long range transportation plan needs to include a system performance report and subsequent
NM-POLICY 1: Improve service levels, participation, and options for non-motorized transportation modes throughout the County.
 Transportation PRINCE WILLIAM COUNTY 2008 COMPREHENSIVE PLAN NON-MOTORIZED PLAN CONTENTS Goals, Policies, and Action Strategies Table 4 (Bike Facility Classifications and Descriptions) Table 5 (Bike Facility
Exhibit 1 PLANNING COMMISSION AGENDA ITEM
 Exhibit 1 PLANNING COMMISSION AGENDA ITEM Project Name: Grand Junction Circulation Plan Grand Junction Complete Streets Policy Applicant: City of Grand Junction Representative: David Thornton Address:
Attachment A: Columbus Area Metropolitan Transportation Plan Objectives, Performance Measures, and Targets
 OBJECTIVE: Reduce the percentage of commuters driving alone, and increase the percentage of commuters riding transit, ing Reducing single occupancy auto commutes and increasing commuters using alternative
ORDINANCE NO
 1 Sponsored by: Councilmembers Stan Flemming, Connie Ladenburg, and Rick Talbert 2 Requested by: Executive/Public Works and Utilities - Transportation Services 3 4 5 6 7 10 11 ORDINANCE NO. 2014-445 12
Transportation and Equity: A 2017 Agenda for Candidates
 In New York, mobility is opportunity. We have succeeded as a global leader in social justice, economic growth and environmental sustainability by investing for more than a century in comprehensive, reliable
PUBLIC TRANSPORTATION PLAN FOR THE CITY OF GEORGETOWN
 PUBLIC TRANSPORTATION PLAN FOR THE CITY OF GEORGETOWN PRESENTATION TO CITY COUNCIL JANUARY 22, 2008 PUBLIC TRANSIT FOR THE CITY OF GEORGETOWN LOCAL SERVICE For Georgetown residents to Georgetown destinations.
Capital and Strategic Planning Committee. Item III - B. April 12, WMATA s Transit-Oriented Development Objectives
 Capital and Strategic Planning Committee Item III - B April 12, 2018 WMATA s Transit-Oriented Development Objectives Page 24 of 76 Washington Metropolitan Area Transit Authority Board Action/Information
Access BART: TOD and Improved Connections. October 29, 2008
 Access BART: TOD and Improved Connections October 29, 2008 1 Access BART Study Goals Evaluate at the system-level land use and access scenarios to optimize ridership Identify station clusters that provide
Active Transportation Infrastructure Investment A Business Case
 Active Transportation Infrastructure Investment A Business Case In 2016, the Real Estate Foundation awarded the Capital Regional District a $50,000 grant for Shifting Gears: Land Use Change through Active
Welcome. Background. Goals. Vision
 Welcome The formal Public Information Centre (PIC) for the Transportation Master Plan How We GO will be held in early 2017. At that time we will present the recommended transportation system for Niagara
Solana Beach Comprehensive Active Transportation Strategy (CATS)
") Solana Beach Comprehensive Active Transportation Strategy (CATS) 3.0 Goals & Policies The Solana Beach CATS goals and objectives outlined below were largely drawn from the Solana Beach Circulation Element
Solana Beach Comprehensive Active Transportation Strategy (CATS) 3.0 Goals & Policies The Solana Beach CATS goals and objectives outlined below were largely drawn from the Solana Beach Circulation Element
 Time of Change We Are Growing We Are An Attractive Place To Live We Are Age Diverse + Living Longer 50000 40000 30000 20000 10000 0 2010 Census Job Density Housing Sheds Transit Sheds The Project FUNDING
Chapter 7. Transportation. Transportation Road Network Plan Transit Cyclists Pedestrians Multi-Use and Equestrian Trails
 Chapter 7 Transportation Transportation Road Network Plan Transit Cyclists Pedestrians Multi-Use and Equestrian Trails 7.1 TRANSPORTATION BACKGROUND The District of Maple Ridge faces a number of unique
Moving Towards Complete Streets MMLOS Applications
 Moving Towards Complete Streets MMLOS Applications Transportation Education Series May 18 th, 2012 It s not just for cars! Presentation Overview The Complete Streets Movement What is Multi-Modal Level
VILNIUS SUMP. Gintarė Krušinskaitė International project manager place your logo here
 VILNIUS SUMP Gintarė Krušinskaitė International project manager Gintare.krusinskaite@vilniustransport.lt place your logo here 19 April, 2017 WHERE DID WE CAME FROM? Mobility management and mobility planning
T1-A - Service Reduction (Re-sizing)
") Key T1-A Choice A Key T1-B Choice B Key T1-C Choice C Key T1-D Choice D Key T1-E Choice E Key T1-F Choice F Key Choice G T2 T1-A - Service Reduction (Re-sizing) Description This key choice would represent
Key T1-A Choice A Key T1-B Choice B Key T1-C Choice C Key T1-D Choice D Key T1-E Choice E Key T1-F Choice F Key Choice G T2 T1-A - Service Reduction (Re-sizing) Description This key choice would represent