Mia Birk, Bicycle Program Manager Robert Burchfield, Principal Engineer Jonathon Flecker, Senior Traffic Engineer
|
|
|
- Chester Gregory
- 6 years ago
- Views:
Transcription

1
2 CITY OF PORTLAND, OFFICE OF TRANSPORTATION Charlie Hales, Commissioner Vic Rhodes, Director PROJECT STAFF Mia Birk, Bicycle Program Manager Robert Burchfield, Principal Engineer Jonathon Flecker, Senior Traffic Engineer UNIVERSITY OF NORTH CAROLINA HIGHWAY SAFETY RESEARCH CENTER William W. Hunter David L. Harkey J. Richard Stewart This project was funded through a grant from the Oregon Department of Transportation Bicycle and Pedestrian Program. Special thanks to the German Marshall Fund Environmental Fellowship Program, which funded Bicycle Program Manager Mia Birk s 1996 research tour of bicycle-friendly European cities.


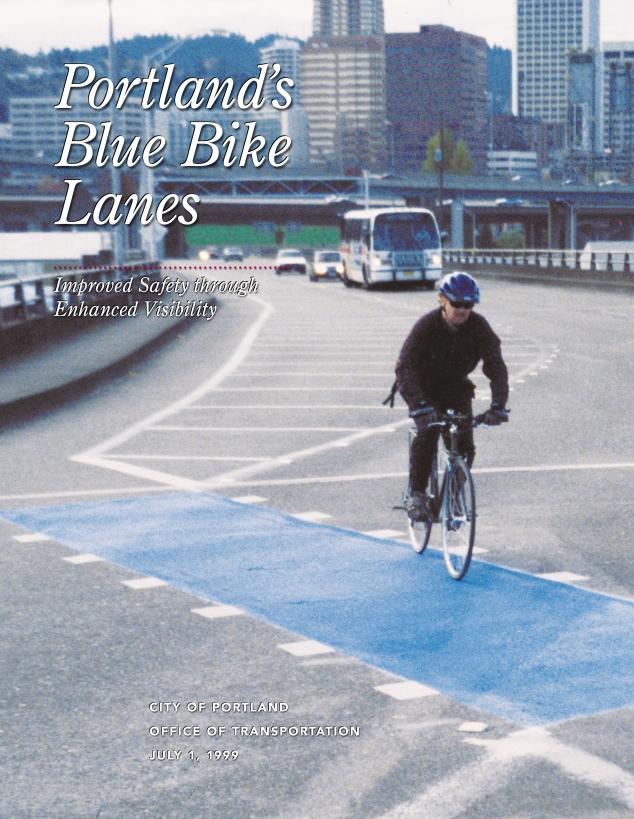
3 Portland s Blue Bike Lanes Improved Safety through Enhanced Visibility Other studies Evidence shows that the use of colored pavement helps improve safety. References for these studies are listed at the back of this report. INTRODUCTION The City of Portland has over 100 miles of bicycle lanes; most were installed within the last decade. As a result of this and other factors, many more residents are riding bicycles for all types of trips. For example, in 1975 about 200 cyclists rode the Hawthorne Bridge daily; today, that number is over Staff have recorded similar increases throughout the City, especially in areas with new bicycle lanes. Bicycle lanes provide enormous benefits to all transportation users. They define a space in which to ride, eliminating the need to weave in and out of traffic or parked cars. They help novice cyclists feel more confident and increase cyclist visibility. Bicycle lanes also help motorists predict where to expect cyclists. However, motorists are often unaware that they must yield to cyclists when crossing a bicycle lane. As a result, many cyclists worry about the safety of these crossing areas. Many European cities use colored markings at bicycle-motor vehicle crossings to reduce conflicts. The colors range from red (the Netherlands, Germany, Sweden, Denmark, Switzerland, Belgium and others) to blue (Denmark), yellow (Switzerland), and green (Germany and France). Thus far, American cities have not used this technique. To determine whether such colored markings help improve safety at bicycle-motor vehicle crossings, the City of Portland has been experimenting with blue pavement markings to delineate selected conflict areas. The University of North Carolina Highway Safety Research Center (UNCHSRC) under contract to the Federal Highway Administration analyzed the project data. Offenberg, Germany Photo by Eric Stachon A Swedish study found the use of colored markings increased safety per bicyclist by 20 percent. Denmark found the use of blue markings reduced bikemotor vehicle collisions by 38 percent and fatalities and serious injuries by 71 percent. Studies in England showed colored markings to be effective at reducing conflicts. Troisdorf, Germany Photo by Eric Stachon A 1996 study in Montreal, Quebec found the use of blue markings at five intersections resulted in a small but significant decrease in conflicts. The study also found that cyclists exercised greater caution after the installation of colored markings and significantly increased the number of cyclists following the delineated path. 1

4 Why blue? Conflicting meanings for other colors Throughout the American transportation system, yellow is used for centerline stripes. Red and green both have very distinct meanings: red signifies do not go here and green means go. The only meaning for blue is disabled parking stalls. Color blindness Many people have a limited ability to differentiate colors. In particular, many color blind or impaired individuals find it difficult to see red and other earth tones, as well as green. In low light and wet conditions, blue shows up relatively well. Public support Prior to the start of the project, Bicycle Program staff presented the color options to dozens of local community groups, including neighborhood and business associations, transportation professionals, bicycle advisory committees in Oregon and Washington, and bicycling and other interested community groups. Participants overwhelmingly preferred blue. PROJECT GOAL The project goal is to investigate the effectiveness of colored pavement markings in reducing bicyclist-motorist conflicts at designated crossing areas. Staff designed the study to answer the following: 1 Did motorists appear to yield more frequently to cyclists after the pavement was colored blue? 2 Did motorists appear to look for cyclists before crossing the bike lane more frequently than before? 3 Did motorists modify their behavior in any significant ways? 4 Did cyclists tend to look more frequently for motorists before proceeding through the painted area? 5 Did cyclists modify their behavior in any significant ways? 6 Did the number of conflicts, near conflicts, and reported crashes change? Test sites selection and characteristics Staff selected ten conflict areas with a high level of cyclist and motorist interaction, as well as a history of complaints. All of the sites are locations where the cyclist travels straight while the motorist crosses the bicycle lane. Sites with similar characteristics are grouped as follows: GROUP ONE (Sites 1-4): Exit ramp The cyclist travels straight ahead and the motorist crosses the path of the cyclist to exist a roadway, such as an off-ramp situation. These sites are Broadway/Williams; Beaverton-Hillsdale/Bertha; Multnomah/ Garden Home; and the Hawthorne Bridge eastbound. GROUP TWO (Sites 5-8): Right-turn lane The cyclist travels straight and the motorist crosses over the cyclist path to enter a right turn lane. These sites are Madison/Grand; 7th/Morrison; Broadway/Larrabee; and Terwilliger/I-5. Copenhagen, Denmark Photo by Eric Stachon Evidence from Denmark and Montreal Studies in Denmark and Montreal demonstrate the benefits of using blue markings. GROUP THREE (Sites 9-10): Entrance ramp The cyclist travels straight and the motorist crosses the bicycle lane to merge onto a street from a ramp. These sites are Broadway/ Interstate and Weidler/Victoria. Site descriptions can be found in Table 1 and the schematics and photos of each site found on pages
5 Table 1. Blue bike lane sites GROUP 1: Exit ramps AVERAGE SITE DESCRIPTION: PHASE PHASE SITE CONFLICT AREA DAILY TRAFFIC EXIT RAMP NE Broadway, westbound at Williams 35,000 Bicyclist heading west. (I-5 northbound entrance ramp) Motorist crosses bicycle lane to access I-5 northbound entrance ramp. 2 SW Beaverton-Hillsdale Highway 14,500 Bicyclist heading east. eastbound at Bertha Motorist crosses bicycle lane while veering off to Bertha Blvd. 3 SW Multnomah Blvd, eastbound 10,000 Bicyclist heading east. at Garden Home Rd Motorist crosses bicycle lane while veering off to Garden Home Rd. 4 The Hawthorne Bridge, east end, 13,200 Bicyclist heading east. eastbound at the McLoughlin Motorist exiting Hawthorne off-ramp Bridge eastbound viaduct onto McLoughlin Blvd. GROUP 2: Right-turn lanes AVERAGE SITE DESCRIPTION: PHASE PHASE SITE CONFLICT AREA DAILY TRAFFIC RIGHT-TURN LANE SE Madison, eastbound, between 10,500 Bicyclist heading west. Sixth and Grand Motorist crosses bicycle lane into right-turn only lane onto northbound Grand Ave. 6 SE 7th, southbound at Morrison 8,300 Bicyclist heading south. Motorist crosses bicycle lane into right-turn only lane onto SE Morrison. 7 East end of the Broadway Bridge, 15,200 Bicyclist heading east comes eastbound at Larrabee off sidewalk of Broadway Bridge onto roadway bicycle lane. Motorist crosses bicycle lane into right-turn only lane onto NE Larrabee. 8 SW Terwilliger, northbound at <7,000 Bicyclist heading north. I-5 entrance ramp Motorist crosses bicycle lane into right-turn only lane onto I-5. GROUP 3: Entrance ramps AVERAGE SITE DESCRIPTION: PHASE PHASE SITE CONFLICT AREA DAILY TRAFFIC ENTRANCE RAMP East end of the Broadway Bridge, 32,000 Bicyclist heading west westbound at Interstate from roadway bicycle lane onto Broadway Bridge sidewalk. Two lanes of motorists from N. Interstate cross bicycle lane to use Broadway Bridge westbound. 10 NE Weidler, eastbound at Victoria 40,300 Bicyclist heading east. (I-5 north bound off-ramp) Motorist exits I-5, crosses bicycle lane as she/he enters eastbound NE Weidler St. 3
6 BLUE MARKING INSTALLATION The sites had previously been defined with white dashed lines as well as, in most cases, signs directing motorists to yield to cyclists. A great deal of research went into the blue marking material selection. The aspects considered included cost, durability, and color availability. These aspects are discussed in Table 2. The utility of the blue markings was tested in two phases. In Phase 1, October 1997, crews painted seven of the conflict areas (sites 1, 2, 4, 5, 7, 9, 10). Two sites (4, 5) were subsequently dropped due to the year-long closure of the Hawthorne Bridge. Phase 1 sites were marked with paint. As expected, the paint wore off quickly during the subsequent winter. In Phase 2, August 1998, crews applied thermoplastic 1 to mark eight conflict areas, of which five had been included in Phase 1 (sites 1, 2, 7, 9, 10) and three were new sites (3, 6, 8). As of this writing, the plastic has been in place for almost a year and is holding up well at six of eight sites. Of the remaining two, one is in fair and the other is in poor condition; the disintegration of the plastic is likely due to incorrect installation. Although the blue appears quite bright, it is not as visible as anticipated in low light conditions. Cyclists are pleased, however, with the texture; it is not slippery. At each site, crews mounted an accompanying sign depicting the conflict situation (see Figure 1 for sign examples). The blue area and its accompanying sign are intended to remind motorists that they are crossing a bicycle lane and need to yield to through cyclists. Table 2. Materials considerations* APPROXIMATE MATERIALS COST (NOT INCLUDING AVAILABILITY MATERIAL KNOWN VENDORS INSTALLATION) DURABILITY OF COLORS Paint Local paint $.04-$.10/ Poor Wide variety supply stores lineal foot Thermoplastic Flint Trading $2.66/sq.ft Good. Withstands Blue, red, (Premark ) 1 significant volume yellow, white & turning movements Methyl Morton Traffic Markings $.50-$.60/ Potentially good Yellow, white, methacrylate- (Dura Stripe ) lineal foot red based marking Cold plastic 3M (Stamark ) $4.50 sq.ft. Durable with inlay, Blue, red, not as good with yellow, white existing asphalt; unlikely to hold up to heavy turning volumes Dyed asphalt Asphacolor Very costly. Excellent Earth-tones Must apply fresh, treated asphalt. Imprinted and Integrated Paving Costly. Must apply Unknown Earth-tones sealed asphalt Concepts (Street Print) fresh asphalt Colored Traffic Safety Systems Unknown Potentially good Blue, green, acrylic coating (Zebraflex ) red, yellow * All statements on this table are based on research for this project. Actual costs may vary widely depending on quantities, etc. Installation costs are not included. Other vendors may sell similar products. 4 1 The specifications for the thermoplastic are: Blue Premark 20/20 Flex 125 mil. Highly skid resistant. 60 BPN. Material suppled by Flint Trading Inc. P.O. Box 160, Thomasville NC Phone:
7 Figure 1. Accompanying signs 30" 36" 36" 18" GROUP 1: Right-turn exit ramps Motorists yield to cyclists as they turn right to exit roadway. GROUP 1: Right-turn exit ramps Unique sign for Broadway/Williams. 30" 36" 18" GROUP 2: Right-turn lanes Motorist entering right-turn lane yields to cyclist. GROUP 3: Entrance ramps Motorist yield to cyclists as they turn right to enter roadway. 5
8 GROUP 1: Exit ramps Motorists can either turn right as they exit the roadway or continue straight from the right lane. Right-turning exiting vehicles cross the bicycle lane. SCHEMATICS (not to scale) Site 1 Broadway / Williams / I-5 entrance BIKE LANE BIKE LANE Site 2 Site 4 Beaverton-Hillsdale Highway / Bertha Hawthorne Bridge / McLoughlin off-ramp BIKE LANE BIKE LANE Site 3 Multnomah / Garden Home BIKE LANE BIKE LANE 6


9 GROUP 1: Exit ramps SITE PHOTOS BEFORE AFTER Site 1 NE Broadway, westbound at Williams Site 2 SW Beaverton-Hillsdale Highway, eastbound at Bertha Site 3 SW Multnomah Blvd, eastbound at Garden Home Road photo not available Site 4 The Hawthorne Bridge, east end, eastbound at the McLoughlin off-ramp 7
10 GROUP 2: Right-turn lanes Motorists cross the bicycle lane as they turn to enter the rightturn only lane. The bicyclist proceeds straight in the bicycle lane, to the left of the right-turn lane. SCHEMATICS (not to scale) Sites 5 8 SE Madison / Grand, SE 7th / Morrison, east end of Broadway Bridge / Larrabee, and SW Terwilliger / I-5 entrance BIKE LANE BIKE LANE parking 8


11 GROUP 2: Right-turn lanes SITE PHOTOS BEFORE AFTER Site 5 SE Madison, eastbound, between Sixth and Grand Site 6 SE 7th, southbound at Morrison Site 7 East end of the Broadway Bridge, eastbound at Larrabee Site 8 SW Terwilliger, northbound at I-5 entrance ramp 9
12 GROUP 3: Entrance ramps Motorists cross the bicycle lane as they turn right to enter the roadway from a ramp. SCHEMATICS (not to scale) Site 9 Broadway Bridge / Interstate Ave. BIKE LANE BIKES ON BRIDGE SIDEWALK Site 10 NE Weidler / Victoria / I-5 off ramp BIKE LANE BIKE LANE 10


13 GROUP 3: Entrance ramps SITE PHOTOS BEFORE AFTER Site 9 East end of the Broadway Bridge, westbound at Interstate photo not available Site 10 NE Weidler, eastbound at Victoria (I-5 northbound off-ramp) 11
14 DATA COLLECTION At each site, a videographer taped cyclist-motorist interactions both before and after the blue application. At all 10 sites, she taped bicyclist-motorist interactions for two hours before the blue marking application. The taping was done from seven to nine a.m., or four to six p.m., depending on peak directional flow. As noted in Table 1, she taped five sites once after the blue application (for two hours, same time of day as the before taping) and five sites twice after the blue application. The total time for videotaping before the blue marking was 10 hours; after videotaping totaled 30 hours. In the before period, the videotapes captured 846 bicyclists; in the after period, The videographer taped the seven Phase 1 intersections in September 1997 before the October 1997 blue paint application; Phase 1 after videotaping occurred on dry days from December 2nd to 12th, She recorded the three additional Phase 2 intersections in July 1998 before the blue plastic application in August 1998; Phase 2 after videotaping occurred on dry days from August 18th to September 3rd, In addition, staff conducted a field survey of cyclists and a mail survey of motorists. Staff administered the cyclist survey on September 2nd and 23rd, 1998, collecting 216 surveys from cyclists who had just traveled through the Broadway/Larrabee site. Staff recorded license plate numbers of eastbound motorists driving through or past the Broadway/Larrabee site in late February They matched license plate numbers with Driver and Motor Vehicle Services (DMV) records and then mailed the motorist survey to approximately 1200 motorists, of which 222 returned surveys. 12
15 PROJECT RESULTS The key results fall into five main areas: Motorist and cyclist behavior, motorist and cyclist viewpoints, and conflicts. Analysts examined three levels of data to assess before to after changes in bicyclist and motorist behaviors. At the most aggregated level, they pooled the data over all sites. At an intermediate level, they analyzed data by site groupings (exit ramps, right-turn lanes, and entrance ramps). At the third level, they looked for significant behavior changes at each site. 2 A comparison of these analyses are presented in Table 3. It is important to note that the word significant used here means that there is a low probability that the observed change was the result of chance. In other words, the change is likely the result of the blue marking and/or yield to bikes sign. Table 3. Summary of before-to-after changes in bicyclist/motorist behaviors from three levels of analysis. LEVEL OF ANALYSIS DATA POOLED DATA COMBINED BEHAVIOR OVER ALL SITES INTO 3 GROUPS* SITE-BY-SITE ANALYSIS** Bicyclist followed increase in percent G1 increase increase at sites 4,10 indicated path following path G2 decrease decrease at sites 5,7 G3 decrease overall increase Bicyclist turned decrease in percent G1 decrease increase at site 7 head turning head G2 increase decrease at sites 9,10 G3 decrease overall decrease Bicyclist used decrease in percent G1 decrease overall non-significant hand gesture using hand gesture G2 non-significant G3 non-significant Bicyclist slowed decrease in percent G1 decrease decrease at sites 7,10 or stopped slowing/stopping G2 non-significant overall decrease G3 decrease Motorist used decrease in percent G1 non-significant increase at site 5 turn signal using turn signal G2 increase overall non-significant G3 no data Motorist slowed increase in percent non-significant overall non-significant or stopped slowing/stopping Motorist yielded increase in percent G1 increase increase at sites 7,10 to bicyclist yielding G2 non-significant overall increase G3 increase * Group 1 (sites 1-4): Exit ramps Group 2 (sites 5-8): Right-turn lanes Group 3 (sites 9-10): Entrance ramps All noted increases or decreases were statistically significant. **See Table 1 for site descriptions. 2 Contingency tables and x 2 -tests were used to identify significant changes in behaviors for the first two levels of aggregation. For the third level, contingency tables were developed for each site. Significant behavior changes at a site were assessed by either a x 2 -statistic or a Fishers exact test when cell frequencies were too small. A Cochran-Mantel-Haenszel (CMH) x 2 -statistic was also computed to test for overall association across the tables. This test is particularly sensitive to consistency of relationships across the sites. 13
. The percentage of cyclists yielding decreased to eight percent.")
16 Motorist behaviors: In the before period, 72 percent of motorists yielded to cyclists while 28 percent of cyclists yielded to motorists. In the after period, the percentage of motorists yielding increased to 92 percent, a 27 percent increase (see Figure 2). The percentage of cyclists yielding decreased to eight percent. The increase in motorist yielding was consistent at all levels of analysis. Significant change was noted at Broadway/Larrabee and Weidler/Victoria. Significantly more motorists slowed or stopped when approaching the blue area: 71 percent before and 87 percent after installation, a 23 percent increase (see Figure 3). However, when analyzed at the group and individual levels, no significant changes were found. In contrast, 25 percent fewer motorists used a turn signal (84 percent before versus 63 percent after see Figure 3), with the exit ramp group experiencing an insignificant change and the right-turn lane group an increase in slowing or stopping. Cyclist behaviors: Fewer bicyclists approaching the conflict area turned their head to look for a motor vehicle after the blue pavement was put in place (43 percent before versus 26 percent after see Figure 4). The exit ramp and right-turn lane groups also experienced a decreased in head turning, while the entrance ramp group experienced an increase. Among individual sites, an increase in head turning was noted at Broadway/Larrabee and a decrease noted at Broadway/Interstate and Weidler/Victoria. Similarly, fewer bicyclists used a hand gesture to signal their movement through the conflict area after the blue marking application (11 percent before versus five percent after see Figure 4). Only the exit ramp group experienced a significant decrease; changes in the other two groups and at individual sites were not significant. However, cyclists are not required by law to use a hand gesture at any of the sites since the cyclist is making a through movement rather than a turn. 14


17 Overall, more cyclists followed the recommended path after the blue marking: 87 percent before versus 94 percent after (see Figure 4). At the group level, more cyclists did so in the exit ramp group, while fewer did in the right-turn and entrance ramp groups. Increased use of the recommended path was found at the Hawthorne Bridge and Weidler/Victoria, and decreased use at Madison/Grand and Broadway/Larrabee. When cyclists did not follow the recommended path, they usually opted for a straight rather than angled path at sites like the Hawthorne Bridge where the marked path is angled to shorten the conflict zone. Additionally, fewer cyclists slowed or stopped when entering the blue pavement (11 percent before versus four percent after see Figure 4). Decreased slowing or stopping was found in both the exit and entrance ramp groups and at Broadway/Larrabee and Weidler/Victoria. Motorist viewpoints: The motorist survey respondents were 54 percent female with an average age of 46 years. Eighty-five percent said that they used this route regularly, to travel to work (52 percent), the store (17 percent), visit friends (four percent), and other places (six percent). About 70 percent of the respondents noticed the blue areas and 59 percent noticed the accompanying sign. Of those on their regular route who noticed the blue area, 62 percent noticed the signs. Of the respondents who noticed the sign, 55 percent said the blue area meant yield to cyclist, and 45 percent said it meant, be careful. Of those who did not notice the sign, only 38 percent said it meant yield to cyclist, and 43 percent be careful (see Figure 5). 15


18 Overall, almost 50 percent felt the areas were safer; another 40 percent said they were about as safe as before or were not sure (Figure 6). Of those who noticed the signs, 55 percent felt the areas were safer. Motorists had a variety of comments, ranging from, this is a good idea, to needless expenditure. Several thought the blue helped increase awareness, while others were concerned about creating a false sense of security. Several had concerns about the safety and design of the crossing area at Broadway/Larrabee. Cyclist viewpoints: The bicycle riders surveyed were 75 percent male, on average 35 years old and riding 59 miles per week. Almost 80 percent of the riders wore helmets and 72 percent considered themselves to be experienced bicycle riders. The overwhelming majority (76 percent) felt that the locations were safer since the installation of blue pavement (Figure 7). Fifty-eight percent felt that motorists were yielding more than before, and 27 percent the same as before (Figure 8). There were a few negative comments, including one concern that bicyclists are lulled into a false sense of security. Typical positive comments were that the blue pavement made a big difference, that bicyclists were more visible to drivers and that drivers were more aware of bicyclists. 16

19 Conflicts: There were no DMV reported bicycle-motor vehicle crashes during the five year period from 1992 to 1997 at any of the sites. DMV crash data subsequent to the installation of blue is not yet available. On the videotapes, researchers noted conflicts defined as interactions forcing at least one of the parties to make a sudden change in speed or direction. Conflicts were infrequent, with eight in the before period and six in the after period. Conflict rates were similarly small, decreasing from.95 per 100 to.59 per 100 (Figure 9). Analysts judged all of the conflicts in the before period to be minor in nature, with one serious conflict in the after period. Five of the before conflicts occurred with bicyclists traveling eastbound on the Hawthorne Bridge. Four of the six after conflicts occurred at Weidler/Victoria, where motorists merge onto the street from a freeway offramp. Four of the eight before conflicts occurred in the uncolored bicycle lane, while five of the six after conflicts were in the blue pavement area. Unfortunately, several cyclists have informed staff of recent crashes occurring at Broadway/ Williams. Transportation engineers are investigating the potential problems and solutions. 17
20 CONCLUSIONS AND RECOMMENDATIONS The blue bike lane study has had promising results. To recap, researchers found the following results: 1 Did motorists appear to yield more frequently to cyclists after the blue pavement application? YES: a statistically significant increase in motorists yielding to cyclists. 2 Did motorists appear to look for cyclists before crossing the bike lane more frequently than before? YES: a statistically significant increase in motorists slowing or stopping when approaching conflict areas. 3 Did motorists modify their behavior in any significant ways? YES: in addition to the increased slowing, a statistically significant decrease in turn signal use. 4 Did cyclists tend to look more frequently for motorists before proceeding through the painted area? NO: a statistically significant decrease in head turning and hand signaling. 5 Did cyclists modify their behavior in any significant ways? YES: in addition to the decreased head turning and hand signaling, a statistically significant increased use of the recommended path and decreased slowing when entering the conflict areas. 6 Did the number of conflicts and reported crashes change? YES, AND UNKNOWN: The number of conflicts decreased, although the numbers are small. Data on reported crashes subsequent to the blue markings is not yet available. In addition, the overwhelming majority of cyclists and close to a majority of motorists felt the blue areas enhanced safety. 18
21 Most behavior changes were positive. In particular, significantly more motorists yielded to cyclists and slowed or stopped before entering the blue areas. The increased cyclist use of the recommended path is also encouraging, since it should be the safest route through a conflict area. However, coupled with and perhaps resulting from the perception of increased safety appears to be declining cyclist caution (fewer cyclists turning their heads and signaling). (The decrease in conflicts is based on such a small number that we cannot conclusively state a positive result.) While improving cyclist confidence is important to the City s goal of increasing the use of bicycles for transportation, it is also important to avoid creating a false sense of security. These results are similar to those found by the City of Montreal in They found a small but statistically relevant decrease in conflicts, an increase in motorists yielding, and decreases in bicyclists slowing and turning their heads. The accompanying sign appears to be a crucial part of conflict area design, given that substantially more motorists who noticed the sign correctly identified the meaning of the blue area. Some have suggested that the sign is in fact more important than the blue pavement, noting that the sign clarifies the regulatory message by clearing assigning priority right-of-way. This should be an area for more research, including additional surveys and analysis. The City of Portland recommends that blue continue to be used to bring visibility to bicyclemotor vehicle conflict areas and that the blue areas be further monitored with additional videotaping and data analysis. 19
22 References Coates, Nigel, The Safety Benefits of Cycle Lanes, presented at Velo City 97 10th International Bicycle Planning Conference, Barcelona, Spain, Hunter, Bill, et.al., Evaluation of Colored Pavement Used in Bicycle-Motor Vehicle Conflict Areas, Report prepared for the Federal Highway Administration, February, Jensen, S.U., et. al., Junctions and Cyclists, Proceedings of Velo City 97 10th International Bicycle Planning Conference, Barcelona, Spain, 1997, insert. Jensen, S.U., et. al., The Marking of Bicycle Crossings at Signalized Intersections, Nordic Road and Transport Research No. 1, 1997, p. 27. Leden, Lars, Has the City of Gothenburg Found the Concept to Encourage Bicycling by Improving Safety for Bicyclists? Proceedings of Velo City 97 10th International Bicycle Planning Conference, Barcelona, Spain, pp Leden, Lars, Gårder, Per, and Pulkkinen, Urho, Measuring the Safety Effect of Raised Bicycle Crossings Using a New Research Methodology, Presented at the 77th Annual Transportation Research Board Conference, Washington, D.C., Pronovost, Jean-François, et.al., Bicycle Intersection Treatment: The Case for Blue Crossings, Velo Quebec, March Pronovost, Jean-François and Lusigan, Marc, Behavior of Road Users Following the Application of a Special Bikeway Crossing Marking, Resource Book, 1996 Pro-Bike/Pro-Walk Conference, Portland, Maine, September 1996, pp
23
24 City of Portland Bicycle Program 1120 SW 5th Ave., Room 730 Portland OR Phone: Fax: /6/99
EVALUATION OF A GREEN BIKE LANE WEAVING AREA IN ST. PETERSBURG, FLORIDA. William W. Hunter Senior Research Scientist
 EVALUATION OF A GREEN BIKE LANE WEAVING AREA IN ST. PETERSBURG, FLORIDA William W. Hunter Senior Research Scientist Raghavan Srinivasan Senior Transportation Research Engineer Carol A. Martell Senior Applications
Colored Bike Lanes Request to Experiment
 Coloured Lane 1 of 5 Colored Bike Lanes Request to Experiment I. Background Since the publication of Chicago s Bike Lane Design Guide in 2002, Chicago has been considered by many to be at the forefront
Evaluation of Bike Boxes at Signalized Intersections [Presentation]
![Evaluation of Bike Boxes at Signalized Intersections [Presentation]](/thumbs/89/98792206.jpg "Evaluation of Bike Boxes at Signalized Intersections [Presentation]") Portland State University PDXScholar Urban Studies and Planning Faculty Publications and Presentations Nohad A. Toulan School of Urban Studies and Planning 10-1-2010 Evaluation of Bike Boxes at Signalized
Portland State University PDXScholar Urban Studies and Planning Faculty Publications and Presentations Nohad A. Toulan School of Urban Studies and Planning 10-1-2010 Evaluation of Bike Boxes at Signalized
FEDERAL HIGHWAY ADMINISTRATION APPLICATION
 FEDERAL HIGHWAY ADMINISTRATION APPLICATION REQUEST FOR PERMISSION TO EXPERIMENT WITH A BICYCLE BOX INTERSECTION TREATMENT Submitted by: City of Columbus Department of Public Service Date: June 26, 2009
Evaluation of a Combined Bicycle Lane/Right Turn Lane in Eugene, Oregon
 Evaluation of a Combined Bicycle Lane/Right Turn Lane in Eugene, Oregon PUBLICATION NO. FHWA-RD-00-151 August 2000 U.S. Department of Transportation Federal Highway Administration Research and Development
Evaluation of Innovative Bicycle Facilities:
 Evaluation of Innovative Bicycle Facilities: SW Broadway Cycle Track & SW Stark/Oak Street Buffered Bike Lanes FINAL REPORT Prepared for: City of Portland Bureau of Transportation by: Christopher Monsere,
Bicycle - Motor Vehicle Collisions on Controlled Access Highways in Arizona
 Bicycle - Motor Vehicle Collisions on Controlled Access Highways in Arizona Analysis from January 1, 1991 to June 30, 2002 Richard C. Moeur, PE Traffic Design Manager, Northern Region Michelle N. Bina
The Transformation of Portland into a Two-Wheeled Mecca. Mia Birk, Principal, Alta Planning + Design
 The Transformation of Portland into a Two-Wheeled Mecca Mia Birk, Principal, Alta Planning + Design Development of Portland s Bikeway Network 1990 Early 1990s Infrastructure Growing Public Support Growing
LINCOLNWOOD POLICE DEPARTMENT
 LINCOLNWOOD POLICE DEPARTMENT 6900 N. Lincoln Avenue, Lincolnwood, IL 60712 (847) 673-2167 Robert LaMantia Chief of Police September 19, 2017 Illinois Department of Transportation Traffic Operations Bureau
Simulation Analysis of Intersection Treatments for Cycle Tracks
 Abstract Simulation Analysis of Intersection Treatments for Cycle Tracks The increased use of cycle tracks also known as protected bike lanes has led to investigations of how to accommodate them at intersections.
Appendix C. TRAFFIC CALMING PROGRAM TOOLBOX
 Appendix C. TRAFFIC CALMING PROGRAM TOOLBOX PHASE I...2 Do Not Enter Sign...3 One-Way Sign...4 Turn Prohibition...5 Pavement Markings...6 Speed Monitoring Trailer...7 Neighborhood Speed Watch...8 Police
A Summary of Recent Evaluations of Cycling Facilities in Portland, OR
 A Summary of Recent Evaluations of Cycling Facilities in Portland, OR Christopher Monsere, Ph.D., P.E. Civil & Environmental Engineering Jennifer Dill, Ph.D. Urban Studies & Planning Nathan McNeil Center
MEMORANDUM. Charlotte Fleetwood, Transportation Planner
 MEMORANDUM Date: Updated August 22, 2017 To: Organization: Charlotte Fleetwood, Transportation Planner Boston Transportation Department From: Jason DeGray, P.E., PTOE, Regional Director of Engineering
SCHOOL CROSSING PROTECTION CRITERIA
 CITY OF MADISON TRAFFIC ENGINEERING SCHOOL CROSSING PROTECTION CRITERIA January 2016 Adopted as Policy on August 31, 1976, by Common Council by Amended Resolution #29,540 Amended on September 14, 1976,
DEPARTMENT OF ENVIRONMENTAL SERVICES. North Harrison Street (Lee Highway to Little Falls Road) Comparative Analysis. Prepared for:
 Comparative Analysis. Prepared for:") DEPARTMENT OF ENVIRONMENTAL SERVICES North Harrison Street (Lee Highway to Little Falls Road) Comparative Analysis Prepared for: Arlington County Department of Environmental Services 2100 Clarendon Boulevard,
DEPARTMENT OF ENVIRONMENTAL SERVICES North Harrison Street (Lee Highway to Little Falls Road) Comparative Analysis Prepared for: Arlington County Department of Environmental Services 2100 Clarendon Boulevard,
DOWNTOWN TUPELO MAIN STREET: ROAD DIET STUDY
 DOWNTOWN TUPELO MAIN STREET: ROAD DIET STUDY Since mid-2009, RPM Transportation Consultants (RPM) has worked with the Downtown Tupelo Main Street Association to evaluate traffic conditions and potential
Lessons Learned from Cycle Tracks (Class IV Bikeways) Design Practice
 Design Practice") Lessons Learned from Cycle Tracks (Class IV Bikeways) Design Practice By: Min Zhou, P.E., Principal/Vice President KOA Corporation 1 What is a Cycle Track (Class IV) TYPICAL BIKEWAY CLASSIFICATION CLASS
Lessons Learned from Cycle Tracks (Class IV Bikeways) Design Practice By: Min Zhou, P.E., Principal/Vice President KOA Corporation 1 What is a Cycle Track (Class IV) TYPICAL BIKEWAY CLASSIFICATION CLASS
Parental Responsibilities
 Bicycle riding is a fun way to exercise and enjoy the outdoors. To remain safe on Illinois roads, bicyclists must obey the same traffic safety laws that govern vehicle drivers. No amount of bicycle safety
Broad Street Bicycle Boulevard Design Guidelines
 Broad Street Bicycle Boulevard Design Guidelines Building from the strategies introduced in the 2013 Bicycle Transportation Plan and community input received thus far, City Transportation Staff have identified
Who is Toole Design Group?
 2018 AASHTO Bike Guide Status Update NCHRP 15 60 Amalia Leighton Cody, PE, AICP & Kenneth Loen, PE Washington APWA October 4, 2018 Who is Toole Design Group? TDG is a full service engineering, planning
Northbound San Jose Avenue & I-280 Off-Ramp Road Diet Pilot Project
 Project Overview Fed by a two-lane Interstate-280 (I-280) off-ramp, high vehicular volumes and speeds are longstanding issues along San Jose Avenue. Residents in the surrounding neighborhoods have expressed
Welcome! San Jose Avenue Open House August 25, 2015
 Welcome! San Jose Avenue Open House August 25, 2015 Vision Zero The City and County of San Francisco adopted Vision Zero San Francisco Vision Zero High Injury Network as a policy in 2014, committing an
Bridging the Gaps: How the Quality and Quantity of a Connected Bikeway Network Correlates with Increasing Bicycle Use
 Bridging the Gaps: How the Quality and Quantity of a Connected Bikeway Network Correlates with Increasing Bicycle Use July 27, 2005 Word Count: 3,900 Authors: Mia Birk, Principal * Alta Planning + Design
FRICTION AND SURFACE TEXTURE EVALUATION OF GREEN COLORED BIKE LANES
 FRICTION AND SURFACE TEXTURE EVALUATION OF GREEN COLORED BIKE LANES Edward Offei (), Guangming Wang (), Charles Holzschuher (), Bouzid Choubane () (Corresponding Author), and DeWayne Carver () () Florida
Completing the Street: Denning Drive
 Completing the Street: Denning Drive Public Workshop and Walking Audit Winter Park Civic Center May 12, 2016 Completing the Street What Makes This a Complete Street? Completing the Street Complete Streets
Dear Mr. Tweed: Sincerely, Min Zhou, P.E. Vice President
 December 17, 2012 Mr. Steve Tweed City of Long Beach, Department of Public Works Traffic & Transportation Bureau, 10 th Floor City Hall 333 West Ocean Boulevard Long Beach, CA 90802 Subject: Broadway and
Final Report. Evaluation of Flashing Yellow Right Turn Arrow at Silverbell Rd and Cortaro Rd. FHWA Experimentation #4-329(E)
") Final Report Evaluation of Flashing Yellow Right Turn Arrow at Silverbell Rd and Cortaro Rd FHWA Experimentation #4-329(E) Marana, Arizona January 2009 Submitted To: Submitted By: FINAL REPORT EVALUATION
Final Report Evaluation of Flashing Yellow Right Turn Arrow at Silverbell Rd and Cortaro Rd FHWA Experimentation #4-329(E) Marana, Arizona January 2009 Submitted To: Submitted By: FINAL REPORT EVALUATION
California DMV Test. Mark the correct answers
 California DMV Test Mark the correct answers 1. When you leave your lane to pass another vehicle, you know you have enough room to return to your driving lane when you: Have passed the other vehicle's
THE OFFICIAL GUIDE TO CYCLING SAFELY IN PHILADELPHIA
 B IKE NICE THE OFFICIAL GUIDE TO CYCLING SAFELY IN PHILADELPHIA A partnership of the City of Philadelphia and the Bicycle Coalition of Greater Philadelphia ABOUT VISION ZERO & BIKE NICE It s a great day
INTERSECTION DESIGN. Bicycle Facility Workshop Intersections 4-1
 INTERSECTION DESIGN 4-1 Intersections Avoid unusual conflicts Provide direct path for cyclists, close to that of motor vehicles Bicyclists should be visible; their movements should be predictable Simple
Traffic Circulation Study for Neighborhood Southwest of Mockingbird Lane and Airline Road, Highland Park, Texas
 ARIZONA TEXAS NEW MEXICO OKLAHOMA February 13, 2015 Mr. Meran Dadgostar P.E., R.S. Town of Highland Park 4700 Drexel Dr. Highland Park, Texas 75205 Re: Traffic Circulation Study for Neighborhood Southwest
Lessons from the Green Lanes:
 Executive Summary Lessons from the Green Lanes: Evaluating Protected Bike Lanes in the U.S. By Portland State University Chris Monsere Jennifer Dill Nathan McNeil Kelly Clifton Nick Foster Tara Goddard
Do Bike Lane Stripes Calm Motor Traffic? Wayne Pein
 Do Bike Lane Stripes Calm Motor Traffic? Wayne Pein wpein@nc.rr.com January 2008 Introduction Among other alleged benefits, bike lane proponents often claim that narrowing a wide lane with bike lane striping
C/CAG. Sunnybrae Elementary School Walking and Bicycling Audit. San Mateo-Foster City School District JUNE 2013
 Sunnybrae Elementary School Walking and Bicycling Audit JUNE 2013 San Mateo-Foster City School District C/CAG City/County Association of Governments of San Mateo County SUNNYBRAE ELEMENTARY SCHOOL WALKING
FELL STREET AND MASONIC AVENUE INTERSECTION SURVEY REPORT
 FELL STREET AND MASONIC AVENUE INTERSECTION SURVEY REPORT City and County of San Francisco Municipal Transportation Agency Bicycle Program October 2005 Background The intersection of Fell Street with Masonic
When composing the study, our primary source for content analysis was a study
 Denise Arriaga Ibarra Natalie Garcia Vincente Velasco Victor Estrada Jonathan Marin Ignacio Alcaraz Cal Poly Pomona Cyclist Population When composing the study, our primary source for content analysis
Signs. signs, signals and road markings. in this chapter
 3 signs, signals and road markings in this chapter Signs regulatory signs school, playground and crosswalk signs lane use signs turn control signs parking signs reserved lane signs warning signs object
Clybourn Ave. Protected Bike Lane Study Halsted St. to Division St.
 Clybourn Ave. Protected Bike Lane Study Halsted St. to Division St. Nathan Roseberry, Senior Engineer Pam Broviak, Project Manager July 24, 2014 Agenda Project Goals Existing Roadway Conditions Traffic
Pedestrian & Bicycle Safety Innovations & Applications
 Pedestrian & Bicycle Safety Innovations & Applications County Engineers Association of Maryland Spring, 2017 Conference May 25, 2017 George Branyan Pedestrian Program Coordinator District Department of
SCHOOL CROSSING PROTECTION CRITERIA
 CITY OF MADISON TRAFFIC ENGINEERING SCHOOL CROSSING PROTECTION CRITERIA AUGUST 1990 Adopted as Policy on August 31, 1976, by Common Council by Amended Resolution #29,540 Amended on September 14, 1976,
TYPES OF CYCLING. Figure 1: Types of Cycling by Gender (Actual) Figure 2: Types of Cycling by Gender (%) 65% Chi-squared significance test results 65%
 Figure 2: Types of Cycling by Gender (%) 65% Chi-squared significance test results 65%") TYPES OF CYCLING 1,980 responses were received to this question (multiple answers were allowed), 727 female (41%) and 1,242 (71%) from male respondents. The most common responses for both genders were
TYPES OF CYCLING 1,980 responses were received to this question (multiple answers were allowed), 727 female (41%) and 1,242 (71%) from male respondents. The most common responses for both genders were
Bellevue Downtown Association Downtown Bike Series
 Bellevue Downtown Association Downtown Bike Series Meeting 2 Franz Loewenherz Andreas Piller Kyle Potuzak Chris Long October 26, 2017 Today s Agenda: 1) Meeting Purpose 2) 9/28 Meeting Recap 3) Candidate
Lessons from the Green Lanes: Evaluating Protected Bike Lanes
 Lessons from the Green Lanes: Evaluating Protected Bike Lanes http://bit.ly/nitc_583 Christopher M. Monsere @CMonsere Jennifer Dill @JenniferDillPSU Nathan McNeil @NWUrban Portland State University Pro
Active Transportation Facility Glossary
 Active Transportation Facility Glossary This document defines different active transportation facilities and suggests appropriate corridor types. Click on a facility type to jump to its definition. Bike
Comments EXECUTIVE SUMMARY
 Comments 1. Under any Alternatives, MCDOT should provide better at-grade pedestrian crossing of Georgia Avenue and Forest Glen Road, including improved crosswalks with wider medians and adequate signal
Chapter 5: Crossing the Street
 Chapter 5: Crossing the Street Whether walking or bicycling, a student s journey to school will more than likely require crossing one or more streets. Per the Safe Routes to School Guide, maintained by
G AT E WAY PLAN. Community BRIEFING KIT GATEWAY BIKE
 G AT E WAY PLAN GATEWAY BIKE Community BRIEFING KIT PLAN August 2016 TABLE OF CONTENTS INTRODUCTION... 1 THE BENEFITS OF A BIKEABLE COMMUNITY... 2 ECONOMY...2 SAFETY...3 HEALTH...3 HOUSEHOLD SPENDING...3
Bikeway action plan. Bicycle Friendly Community Workshop March 5, 2007 Rochester, MN
 Bikeway action plan Summary The was held on March 5, 2007 at the Rochester Mayo Civic Center. The workshop was hosted by Rochester-Olmsted County Planning Department in collaboration with the League of
Complete Streets 101: The Basics
 Complete Streets 101: The Basics Michigan Municipal League - Capital Conference March 21, 2017 Chip Smith, AICP - Senior Planner - Wade Trim Inc. and City Council member City of Ann Arbor 2017 MML Capital
Bay to Bay Boulevard Complete Streets Project
 Bay to Bay Boulevard Complete Streets Project Dale Mabry Highway to Bayshore Boulevard February 08, 2018 Photo Source: Tampa Bay Times Alessandra Da Pra Meeting Format Introduction Resurfacing Information
Coquitlam Cross-town Bike Route Improving Bicycle Facilities in a Mature Suburban Environment
 Coquitlam Cross-town Bike Route Improving Bicycle Facilities in a Mature Suburban Environment Sarah Rocchi, Vice-President, Projects, Opus International Consultants (Main Presenter) Catherine Mohoruk,
Pedestrian Safety at Roundabouts. Presentation to the Howard-Suamico School Board November 26, 2007
 Pedestrian Safety at Roundabouts Presentation to the Howard-Suamico School Board November 26, 2007 Roundabouts that have replaced stop signs and traffic signals have reduced the number and severity of
Evaluation of M-99 (Broad Street) Road Diet and Intersection Operational Investigation
 Road Diet and Intersection Operational Investigation") Evaluation of M-99 (Broad Street) Road Diet and Intersection Operational Investigation City of Hillsdale, Hillsdale County, Michigan June 16, 2016 Final Report Prepared for City of Hillsdale 97 North Broad
Evaluation of M-99 (Broad Street) Road Diet and Intersection Operational Investigation City of Hillsdale, Hillsdale County, Michigan June 16, 2016 Final Report Prepared for City of Hillsdale 97 North Broad
River Road - Proposed Road Safety Enhancement Measures
 City of Richmond Report to Committee To: From: Re: Public Works and Transportation Committee Victor Wei, P. Eng. Director, Transportation Date: June 6, 2017 River Road - Proposed Road Safety Enhancement
BICYCLE RULES OF THE ROAD
 ILLINOIS ILLINOIS ILLINOIS ILLINOIS ILLINOIS ILLINOIS ILLINOIS ILLINOIS BICYCLE RULES OF THE ROAD Jesse White Secretary of State Bicycle riding is a great way to get into shape and enjoy the outdoors.
Cycle Track Design Best Practices Cycle Track Sections
 Design Best Practices Sections It is along street segments where the separation and protection methods of cycle tracks offer more comfort than conventional bicycle lanes, and are more attractive to a wide
City of Seattle Edward B. Murray, Mayor
 City of Seattle Edward B. Murray, Mayor Department of Transportation Scott Kubly, Director Eastlake Community Council 117 E Louisa St. #1 Seattle, WA 98102-3278 January 28, 2016 RE: Roosevelt to Downtown
An Analysis of Bicycle-Vehicle Interactions at Signalized Intersections with Bicycle Boxes
 Portland State University PDXScholar Dissertations and Theses Dissertations and Theses Winter 3-17-2014 An Analysis of Bicycle-Vehicle Interactions at Signalized Intersections with Bicycle Boxes William
CITY OF LOS ANGELES INTER-DEPARTMENTAL MEMORANDUM
 CITY OF LOS ANGELES INTER-DEPARTMENTAL MEMORANDUM Date: April 1, 219 To: Honorable City Council c/o City Clerk, Room 395, City Hall Attention: Honorable Mike Bonin, Chair, Transportation Committee From:
Bicycle Facilities Planning
 Bicycle Facilities Planning Overview Types of Cyclists Purpose for Riding Types of Facilities Bike Lanes Bicycle Boulevards Cycle Tracks Intersections Signals Signing and Marking Discussion Types of Bicyclists
Department of Transportation
 Department of Transportation I. Internal Scan The number of older drivers in the United States will double over the next 30 years. By 2030 one in five Americans will be age 65 or older. On a licensed-driver
PORTLAND BICYCLE COUNTS 2007
 PORTLAND BICYCLE COUNTS 2007 The Portland Office of Transportation s (PDOT) annual bicycle counts constitute the City s primary means of assessing progress in its efforts to make the bicycle an integral
CITY OF OTTAWA ROADWAY MODIFICATION APPROVAL UNDER DELEGATED AUTHORITY
 RMA-2015-ATM-038 CITY OF OTTAWA ROADWAY MODIFICATION APPROVAL UNDER DELEGATED AUTHORITY DATE: April 22, 2015 SUBJECT Approval of Roadway Modifications Recommended through an Area Traffic Management Study
Town of Mooresville, North Carolina Neighborhood Traffic Calming and Control Device Policy
 Town of Mooresville, North Carolina Neighborhood Traffic Calming and Control Device Policy Adopted January 6, 2014 Town of Mooresville Development Services Department TOWN OF MOORESVILLE NEIGHBORHOOD TRAFFIC
Appendix A. Knoxville TPO Greenway Signage Guidelines. Appendix A: Knoxville TPO Greenway Signage Guidelines Knox to Oak Ridge Greenway Master Plan
 Appendix A Knoxville TPO Greenway Signage Guidelines 75 Overview: Adequate signing and marking are essential on shared-use paths, especially to alert bicyclists to potential conflicts and to convey regulatory
J Street and Folsom Boulevard Lane Conversion Project (T ) Before and After Traffic Evaluation
 Before and After Traffic Evaluation") J Street and Folsom Boulevard Lane Conversion Project (T15125400) Before and After Traffic Evaluation Prepared by Transportation Division June 2014 Executive Summary On February 12, 2013, the City of Sacramento
J Street and Folsom Boulevard Lane Conversion Project (T15125400) Before and After Traffic Evaluation Prepared by Transportation Division June 2014 Executive Summary On February 12, 2013, the City of Sacramento
Summary: Mercer County Princeton Avenue & Spruce Street Study January 2009
 Summary: Several recent studies have assessed potential development and redevelopment opportunities in the Mercer Crossing area of Trenton, Ewing, and Lawrence. This Princeton Avenue and Spruce Street
Peninsula Velo Cycling Club. Riding Etiquette and Expectations on the Road
 Peninsula Velo Cycling Club Riding Etiquette and Expectations on the Road Objectives: 1. Improve safety for cyclists on the road. 2. Improve our relations with car drivers, motorcyclists, pedestrians,
Welcome. Welcome to the second open house on the Downtown Transportation Study.
 Welcome 1 Welcome to the second open house on the Downtown Transportation Study. The purpose of this meeting is to: Recap the study objectives Summarize feedback to date Present information on the alternatives
Date: April 4, Project #: Re: A Street/Binford Street Traffic/Intersection Assessment
 To: Peter Cavanaugh General Electric From: David Bohn, PE Ryan White, PE Date: April 4, 217 Project #: 13421. Re: / Traffic/Intersection Assessment Consistent with the Cooperation Agreement between the
Subject: Bike Project Field Trial Must Validate Bike Safety Claims
 April 12, 2017 To: Menlo Park City Council Subject: Bike Project Field Trial Must Validate Bike Safety Claims A few weeks ago, a collision between my road bike and a white pick-up truck on Woodside Road
APPENDIX D LEVEL OF TRAFFIC STRESS METHODOLOGY
 APPENDIX D LEVEL OF TRAFFIC STRESS METHODOLOGY 01 WHAT IS LEVEL OF TRAFFIC STRESS? When people bicycle on roadways, they encounter varying levels of stress from traffic. A quiet residential street with
CHAPTER 2: SIGNALS, SIGNS AND PAVEMENT MARKINGS
 CHAPTER 2: SIGNALS, SIGNS AND PAVEMENT MARKINGS This chapter provides the information you need to know about Pennsylvania roadways. It covers: Signals Signs Pavement Markings SIGNALS Traffic signals are
Low Level Cycle Signals with an early release Appendices
 Low Level Cycle Signals with an early release Appendices Track trial report This document contains the appendices to accompany the report from the second subtrial of a larger track trial investigating
Bicycles and Pedestrians on ISU Campus. Indiana State University Police
 Bicycles and Pedestrians on ISU Campus Indiana State University Police FASTEST Transportation On Campus There has been an increase in cyclists and pedestrians on campus as student enrollment continues
Sherwood Drive Traffic Circle
 Strathcona County Sherwood Drive Traffic Circle Online Survey Results April 7, 215 I. Executive Summary The Sherwood Drive Traffic Circle Survey was administered in March 215. In total, 2,263 residents
T R A F F I C S K IL L S 101
 page 1/5 GENERAL INSTRUCTIONS Mark your answers on the answer sheet provided. DO NOT make any marks on the test. Please read the following definitions and assumptions carefully before answering the test
Pavement Markings (1 of 3)
") Pavement Markings (1 of 3) DESCRIPTION AND DEFINITION Disadvantages Relatively high cost (over typical Crash reduction as yet unknown painted edge line) No tactile effect The STOP AHEAD pavement marking
Pavement Markings (1 of 3) DESCRIPTION AND DEFINITION Disadvantages Relatively high cost (over typical Crash reduction as yet unknown painted edge line) No tactile effect The STOP AHEAD pavement marking
Central Avenue Bikeway Traffic and Safety Impact Assessment
 FEBRUARY 2018 Lead Agency: San Diego Association of Governments (SANDAG) 401 B Street, Suite 800 San Diego, CA 92101 Contact: Chris Carterette, AICP, Project Manager 619.699.7319 chris.carterette@sandag.org
Draft North Industrial Area-Wide Traffic Plan
 Summary of North Industrial and Hudson Bay Industrial Recommended Improvements Table 1. Summary of s Item Location 1 2 3 4 5 6 7 8 9 10 11 12 Millar Ave north of 51st St Super 8 Motel back lane 400 Block
Complete Street Analysis of a Road Diet: Orange Grove Boulevard, Pasadena, CA
 Complete Street Analysis of a Road Diet: Orange Grove Boulevard, Pasadena, CA Aaron Elias, Bill Cisco Abstract As part of evaluating the feasibility of a road diet on Orange Grove Boulevard in Pasadena,
A Review of Literature:
 A Review of Literature: Intersection Treatments to Improve Bicycle Access and Safety Lynn Weigand, Ph.D. Portland State University Center for Urban Studies Center for Transportation Studies Initiative
What if there were no signs, signals or markings?? Throughout Ch 2 you will learn how signs, signals, and markings help regulate traffic flow.
 What if there were no signs, signals or markings?? Throughout Ch 2 you will learn how signs, signals, and markings help regulate traffic flow. Signs, Signals and Road Markings Purpose: To become acquainted
At each type of conflict location, the risk is affected by certain parameters:
 TN001 April 2016 The separated cycleway options tool (SCOT) was developed to partially address some of the gaps identified in Stage 1 of the Cycling Network Guidance project relating to separated cycleways.
INNOVATIVE INTERSECTION DESIGN
 INNOVATIVE INTERSECTION DESIGN J. Eddie Valtier, P.E. ELP TP&D Director Introduction Why Do We Need To Start Looking For Innovative Intersection Designs? Congestion is worsening and traffic volumes and
Developing a Safer Cycling Strategy for the ACT ACRS Conference August 2012
 Developing a Safer Cycling Strategy for the ACT ACRS Conference 2012 Peter Strang Canberra Manager Sarah Court Transport Consultant 10 August 2012 Presentation Outline Background Data Analysis (Stage 1)
Cycle Tracks: Concept and Design Practices. February 17, 2010
 Cycle Tracks: Concept and Design Practices February 17, 2010 Today s webinar presenters APBP Board Member Host Brett Hondorp, Principal, Alta Planning + Design Guest Moderator Zach Vanderkooy, Bicycling
91
 90 91 92 93 94 95 96 97 98 99 100 101 102 103 104 105 106 As previously depicted in Exhibit 4-J, vehicular accidents are shown along Forrester Road. The contributing factors may be due to its current two
CITY OF WEST LAKE HILLS. Forest View Neighborhood Traffic Calming Study
 CITY OF WEST LAKE HILLS 901 South Mopac Expressway Building V, Suite 220 Austin, Texas 78746 Texas P.E. Firm Registration No. F-929 Klotz Associates Final Report Submittal: March 20, 2015 Revised Final
Pedestrian Safety Action Plan Bicycle Safety Action Plan
 Pedestrian Safety Action Plan Bicycle Safety Action Plan January 24, 2017 VISION: Safe travel for all MISSION STATEMENT: Partner with the community to plan and fund transportation projects and programs
Webinar: A Comprehensive Evaluation of Protected Cycling Facilities: Lessons from Five Cities
 Portland State University PDXScholar TREC Webinar Series Transportation Research and Education Center (TREC) 3-19-2015 Webinar: A Comprehensive Evaluation of Protected Cycling Facilities: Lessons from
2017 North Texas Regional Bicycle Opinion Survey
 2017 North Texas Regional Bicycle Opinion Survey Sustainable Development Program Kevin Kokes, AICP Public Meetings April, 2018 North Central Texas Council of Governments MPO for the Dallas-Fort Worth Region
CITY OF ALBANY TRAFFIC AND SAFETY COMMISSION
 CITY OF ALBANY TRAFFIC AND SAFETY COMMISSION City Hall - Council Chambers 1000 San Pablo Avenue, Albany, CA 94706 Wednesday, November 30, 2016, 7:00 PM 1. CALL TO ORDER The meeting was called to order
Access Management Regulations and Standards
 Access Management Regulations and Standards Efficient highway operation Reasonable property access Concept of Access Management The way to manage access to land development while simultaneously preserving
Project Report. South Kirkwood Road Traffic Study. Meadows Place, TX October 9, 2015
 Meadows Place, TX October 9, 2015 Contents 1 Introduction... 1 2 Data Collection... 1 3 Existing Roadway Network... 2 4 Traffic Volume Development... 2 5 Warrant Analysis... 3 6 Traffic Control Alternative
Traffic Control and Accidents at Rural High-Speed Intersections
 14 TRANSPORTATION RESEARCH RECORD 1160 Traffic Control and Accidents at Rural High-Speed Intersections KENNETH R. AGENT ln many Instances, when rural high-speed highways are constructed, there are a number
Zlatko Krstulich, P.Eng. City of O9awa
 Zlatko Krstulich, P.Eng. City of O9awa 1. Introduction to the Ontario Traffic Manual Series 2. What is OTM Book 18: Bicycle Facilities? 3. Study / Committee Team Members 4. Brief overview of the content
FYG Backing for Work Zone Signs
 Report Title Report Date: 2001 FYG Backing for Work Zone Signs Principle Investigator Name Kamyab, Ali Affiliation Western Transportation Institute Address c/o Caltrans, 1227 O Street, 5th Floor Sacramento,
PEDESTRIAN ACCOMMODATIONS DPS 201 AT INTERCHANGES
 PEDESTRIAN ACCOMMODATIONS DPS 201 AT INTERCHANGES UNDERSTANDING THE ISSUES Intersections of freeway ramp terminals at crossroads are the most critical components of an interchange Challenge: balance mobility
Traffic Signs and Signals
 CHAPTER FOUR Traffic Signs and Signals Traffic signs control traffic flow, making streets and highways safer for drivers, bicyclists and pedestrians. These signs, which are posted by the Indiana Department