Streamline 2012 Business Plan
|
|
|
- Gordon Neal
- 6 years ago
- Views:
Transcription


")
1 Streamline 2012 Business Plan January 6, North Rouse Bozeman, MT (p)
2 Acknowledgements This plan was developed by a team led by Current Transportation Solutions, Missoula, Montana, as part of a project funded in part by the Montana Transportation Department Transit Section. Project team members and their roles are listed below. Lisa Ballard, P.E. and Ted Lange, Current Transportation Solutions, - project management, technical analysis, documentation, and overall project implementation. Steve Earle and John Roseboom, The Bus Man, Missoula, MT on-site review of facilities, equipment, and maintenance. Dr. Pat McGowen, P.E., Montana State University demographics, modeling, and onboard survey supervision. Barb Beck, Beck Consulting, Red Lodge, MT public outreach. Montana State University Institute of Transportation Engineers student chapter onboard surveys and rider tallies. Justin McGowen data entry Board members and staff from Streamline, HRDC, and Karst have dedicated time, information, especially Sunshine Ross and Carol Shannon. Streamline is administered by the Human Resource Development Council (HRDC) in partnership with the Associated Students of Montana State University (ASMSU). Other funding partners include the Federal Transit Administration (FTA), Montana Department of Transportation (MDT), Montana State University (MSU), the City of Bozeman, Bridger Bowl, and Bohart Ranch.
3 Table of Contents iii Table of Contents Acknowledgements... ii Table of Contents... iii Table and Figures... v Executive Summary... ES-1 Value to Riders and the Community... ES-2 Methodology... ES-2 Current Ridership Characteristics & Needs... ES-3 Service Coverage... ES-4 Peer Comparison & Performance Measures... ES-5 Fare Free Service... ES-5 Opportunities for Improvement... ES-6 1 Organizational Profile Implementation Plan Streamline Mission Project Goal Service Changes Short-Range One-Year Actions Long-Range Five-Year Actions Description of Services System-Wide Performance Summary Fare Free Service Benefit Estimations Demographics and Needs Demographics and Modeling Public Outreach Overview of Ridership and Needs User Group Characteristics and Needs Transit Dependent Populations Montana State University Students, Faculty and Staff Coordination with City Planning and Public Works Departments: Commercial Areas & Large Employers
4 iv Streamline Business Plan 4.9 Downtown Infrastructure Funding Opportunities Related to Coordination Tourists, skiers, and recreational travelers Three Forks / Manhattan Scenarios for potential changes Equipment Vehicle Inventory Vehicle Maintenance Program, Documentation and Costs Maintenance Contract Options Equipment Issues Vehicle Replacement Options Organization and Management Options for Public Transportation Entities in Montana Peer Summary Operations and Management Review Staffing Recommendations Marketing, Communications, and Technology Current Marketing Strategies and Costs Outreach opportunities Technology Financial Management Cost Allocation Model Costs for Existing and Proposed Services Works Cited Appendix A. Stakeholder Perspectives... A-1 Appendix B. Survey Results... B-1 Appendix C. Streamline Fleet, Maintenance, & Operations Review & Assessment... C-1 Appendix D. Peer Review... D-1 Appendix E. Recommendations for Staff Responsibilities and Qualifications... E-1 Appendix F. Ridership Demand & Demographics... F-1
5 Table and Figures v Table and Figures Table 2-1: Cost Estimates for New Services Table 3-1: Performance Measures Fixed Route Table 3-2: Performance Measures - Demand Response Table 3-3: Performance by Service Table 3-4: Stops with More than Ten Boardings per Day (October 2012) Table 3-5: Housing and Transportation Costs for a Bozeman Worker ( ) Table 3-6: Benefit per Trip, Wisconsin Table 3-7: Benefit Calculations for Key Sectors Table 4-1: Spatial Statistics for Streamline Table 4-2: Categorization of responses to the open-ended questions Table 4-3: Percent of Population 65 Years and Over, Table 4-4: Public Transportation in Rocky Mountain Ski Towns Table 5-1: Vehicle Inventory Table 5-2: Streamline and Galavan Maintenance Expenses Compared to Peers Table 5-3: Comparison of Maintenance Options Table 5-4: Comparison of Lifespans and Annual Capital Costs for Table 5-5: Streamline Vehicle Replacement Schedule Based on 11-bus fleet Table 6-1: Current full-time Equivalents and Salaries Split between Streamline and Galavan Table 6-2: Organizational Alternatives Table 6-3: Proposed full-time Equivalents and Salaries Split between Streamline and Galavan Table 8-1: Streamline Revenues and Expenses Fiscal Year Table 8-2: Galavan Income and Expenses Fiscal Year Table 8-3: Fixed Route Cost Allocation Formula (FY 2012 Actual Expenditures) Table 8-4: Demand Route Cost Allocation Formula (FY 2012 Actual Expenditures) Table 8-5: Streamline Cost Allocation (FY 2012 Actual Expenditures) Table 8-6: Galavan Cost Allocation (FY 2012 Actual Expenditures) Table 8-7: Fixed Route Cost Allocation Model (2014 Budget) Table 8-8: Costs, Hours, Miles, and Rides for All Services Table 8-9: Costs for Existing Services by Route Table 8-10: Costs for New Services Figure 1-1: Annual Streamline ridership Figure 3-1: Streamline Routes Figure 3-2: Ridership and Passenger-Mile Distribution Figure 3-3: Ridership by day of week Figure 3-4: Ridership by month Figure 3-5: Ridership by hour on the Blueline
6 vi Streamline Business Plan Figure 3-6: Peak hour frequency on the Blueline Figure 3-7: Ridership by hour on the Redline Figure 3-8: Peak hour frequency on the Redline Figure 3-9: Ridership by hour on the Yellowline Figure 3-10: Peak hour frequency on the Yellowline Figure 3-11: Ridership by hour on the Greenline Figure 3-12: Housing + Transportation is lower in transit rich neighborhoods Figure 4-1: Travel Model Study Area Figure 4-2: Streamline Network in the Model Figure 4-3: Streamline service coverage Figure 4-4: Housing unit density at block level, Figure 4-5: Housing unit density at block level, Figure 4-6: What best describes your current status? (Survey questions #6) Figure 4-7: Rider access to vehicle (Survey questions #1) Figure 4-8: If bus service were not available, how would you make this kind of trip? Figure 4-9: Trip purpose (Survey questions #2) Figure 4-10: Age distribution of Bozeman population compared to Streamline ridership Figure 4-11: Rider satisfaction (Survey questions #7) Figure 4-13: Percent of households in poverty Figure 4-14: Percent of population over Figure 4-15: Streamline Bus at the Bridger Park Garage Figure 4-12: Relative commute patterns for three communities Figure 5-1: Streamline Bus Figure 5-2: Fixed route buses at the Butte-Silver Bow Transfer Station Figure 5-3: Most peer communities use 12-year buses Figure 6-1: HRDC/Streamline/Galavan organization chart Figure 6-2: FTA Funding Hierarchy Figure 7-1: Success-comprehensive branding strategy Figure 7-2: Diagram of technology uses Figure 7-3: Sample Timetable from Flagstaff
7 Executive Summary ES-1 Executive Summary The Current Transportation Solutions team has developed a five-year business plan for Streamline focused on the goal of determining how the existing service and organization can be modified to better meet the needs of riders and potential riders in the greater Bozeman area. This plan includes a broad range of recommendations addressing opportunities to improve service for existing riders, increase public awareness of Streamline s services, and serve new riders. The opportunities and challenges facing Streamline are largely a product of Streamline s success and growth in its first six years. In spite of very limited resources compared to most peer communities, Streamline has managed to not only keep pace with growing demand but improve its services at the same time. We believe demand will continue to grow over the next five years as long as Streamline continues to offer quality service, and especially if service quality continues to improve. Continuing to keep pace with this increasing demand will present management with a significant challenge if funding remains static of declines. To meet this challenge, management will need to be creative and will need to engage the community to expand its resources and ensure that opportunities are not missed. Since Streamline was launched in 2006, it has experienced a steady and significant increase in ridership every year and there is no reason to believe this trend will not continue. In fact our peer review indicates that any improvements or expansion in service or marketing are likely to result in ridership increases. Streamline has the lowest investment per capita of any of the peer communities we reviewed. It also has one of the lowest numbers of annual passenger trips less than half the median for peer communities as well as one of the lowest numbers of passenger trips per capita. We believe these statistics are closely related and indicate significant potential for Streamline to increase ridership. This year Streamline celebrated providing over a million rides in its first six years, however the median number of annual passenger trips provided by peers is 0.66 million. 300, , , , ,000 50,000 0 Annual Ridership +14% +5% +4% +30% +86% FY07 FY08 FY09 FY10 FY11 FY12
8 ES-2 Streamline Business Plan Value to Riders and the Community Streamline s high level of success is reflected both by statistics and by comments from riders and stakeholders. In addition to the increasing ridership trend, the overwhelming majority of riders who completed our on-board survey gave high satisfaction ratings for nine aspects of Streamline s service. In all categories for all lines, average satisfaction ratings never fell below 3.4 on a scale of 1 to 5 with 5 being very satisfied. This included safety ratings over 4 on all lines. Overall satisfaction was also reflected in the high number of complementary comments in the open ended questions (89 comments), as well as many more compliments received during the stakeholder meetings and via . Many of these comments were enthusiastic and included statements such as I don t know what we would do without Streamline and a comment from a Montana State University (MSU) rider who described Streamline s service as priceless and said that funding the service is the best thing that ASMSU does. The bottom line of this success is the value Streamline provides to the communities it serves. Most significant is the value Streamline provides to Montana State University which is the area s largest employer and a cornerstone of the community. Streamline is heavily used and highly valued by students, staff and faculty who make up 63% of ridership based on our on board surveys. Streamline also provides an essential service to many people who can t drive or don t have a car available 52% of ridership falls into this category. At the same time, 41% of riders own a car but choose to ride Streamline. This statistic shows that Streamline is achieving a meaningful reduction in number of cars on the road by offering a convenient, safe, high quality alternative to driving. Finally, Streamline s value is reflected in the fact that current riders overwhelmingly want more service. Frequency of service received the lowest satisfaction scores, and the majority of open ended question responses (357 comments out of a total of 623 comments) requested some form of expanded service increased frequency, geographic expansion, longer hours or weekend service. Another measure of Streamline s value to the community is that an estimate for the first ten months of FY 2009 showed that the transit service resulted in a net savings of 1,041,642 pounds of CO2 based on trips not taken by automobile. Methodology Our methodology for developing this plan included several different market research efforts; analysis of transit services in peer communities; analysis of standard industry performance measures; a review and assessment of Streamline s maintenance and operations practices; and research and analysis of options for upgrading Streamline s fleet and technology. To understand the market for Streamline s services and the needs of existing and potential riders, the team conducted market research efforts including collecting information directly from riders and stakeholders; modeling conducted by Dr. Pat McGowen; analysis of Streamline s ridership data and other information. Rider and stakeholder outreach included 565 rider surveys collected onboard the four daytime routes and the Livingston route; stakeholder meetings with the
9 Executive Summary ES-3 Transportation Advisory Committee (TAC), MSU students/staff/faculty, and local government and business leaders; as well as several one-on-one interviews with important stakeholders. Current Ridership Characteristics & Needs Current Transportation broadly classifies transit services as safety net services or community services. A safety net service primarily serves populations with no other transportation options including low income, people with disabilities and seniors. The transit systems in Butte and Helena fall into this category. In contrast, transit systems such as Streamline and Missoula s Mountain Line are clearly community services that serve a much broader cross section of the community while still providing a safety net function. The on-board surveys provide the following picture of Streamline s ridership overall, though there are significant differences between routes: Riders are overwhelmingly MSU students, faculty and staff. This is both because universities tend to generate significant ridership, and because Streamline s service is MSU-centric, with routes and schedules designed to serve MSU students and employees. More than half of riders (52%) cannot drive or do not have a car available. This includes transit dependent who do not have a choice of driving a car, students who are able to attend MSU without the expense of car ownership, and households that choose to use Streamline to reduce transportation expenses. Large percentages are choice riders who own cars but choose to ride Streamline, especially on the Belgrade and Livingston services. Riders are overwhelmingly using Streamline to travel to and from work or school. Only 13% of riders using the service to access commercial areas for shopping. Streamline s ridership age distribution tracks Bozeman s age distribution very closely. As predicted by national statistics, Streamline s ridership includes a higher percentage of young adults. However, in contrast to national trends ridership by seniors is very low. Comments from MSU students, faculty and staff expressed strong support for Streamline s services including the Latenight service along with strong interest in expanded services. MSU comments also emphasized the following issues and needs: The importance of coordinating schedules with class times. Strong support for keeping the service fare free. Interest in airport shuttle service. Desire for improved bus stop amenities including shelters, better ADA access, bike racks, and a park and ride facility in Belgrade. The need for improved marketing and communications in particular the need to increase awareness of the real time tracking features and to make the schedules easier to understand.
10 ES-4 Streamline Business Plan While Streamline currently has routes and stops serving the community s large commercial areas and largest employers, comments from business community leaders indicated a disconnect between the business community and Streamline. This is an important area for improvement because for many transit services large employers are important funding partners. Additionally, regardless of whether businesses help to directly fund transit services, their political support is important for maintaining local government funding. The following issues, needs and opportunities were identified in comments from participants in our Business and Community Leaders Stakeholders Meeting as well as on-board survey results from tourists and visitors. Some Employers are interested in partnering financially or otherwise to provide improved service for their employees and customers. There is need for transportation services for employees and customers living in the county and nearby communities as well as for employees living in the city who work outside city limits. There are opportunities that are being missed to better serve the community s commercial areas. These include needs for better connections between Downtown, the Gallatin Valley Mall (which is connected to Big Sky via the Skyline Bus), the high concentration of large hotels on 19 th, and the airport. There needs to be better marketing and communication so that residents, visitors, employees and employers have greater awareness of Streamline s services and the opportunities those services offer. Service Coverage As summarized in the following table, Streamline s service covers only a small portion of the study area, yet a large portion of the population, houses and job sites are covered. Coverage was estimated using GIS analysis that included all areas within a ¼-mile radius of each stop on the system, representing the low-end of expected walking distance for most riders, and ½-mile, representing the high-end of expected walking distances. As illustrated in Section 4.1, the study area includes the heart of the Gallatin Valley and most of Bridger Canyon. This table does not include the Livingston route and only includes daytime service. Spatial Statistics for Streamline: ½ Mile Distance and ¼ Mile Distance from Stops ½ Mile Distance ¼ Mile Distance Study Area Streamline % Covered Streamline % Covered Area (sq. mi.) % 8.8 1% 2010 Population 82,462 38,994 47% 29,405 36% 2010 Housing 32,344 15,686 48% 11,242 35% 2010 Job Locations 53,366 34,863 65% 28,488 53% 2030 Housing 45,478 18,949 42% 12,762 28% 2030 Job Locations 89,506 48,943 55% 36,669 41%
11 Executive Summary ES-5 If the area of coverage does not increase with time these proportions of coverage will likely decrease as population grows in the area, particularly if growth occurs away from the core areas. Peer Comparison & Performance Measures A peer system analysis, used commonly throughout the industry, provides important benchmarks and comparisons for planners and local policy makers. Our peer review included both rural systems and small urban systems similar to Bozeman and Streamline. The urban systems were included in part because of the much higher quality data available from the Integrated National Transit Database Analysis System and also because this group included very relevant peers such as Missoula s Mountain Line. We selected 14 rural systems serving micropolitan areas with universities, and seven systems serving small metropolitan areas with universities. We did not include resort communities because their investment in transit is generally disproportionately high. Of the 21 peers we reviewed, five stand out because of their strong performance and their close similarity to Bozeman: Boone, NC; Arcata/Eureka, CA (technically two transit systems in adjacent communities, but operated as a single system); Pullman, WA; Logan, UT; and Missoula, MT. Missoula is particularly significant because it operates with many of the same funding restraints that face Streamline. Table 3-1 presents standard industry performance measures for Streamline compared to peers. These performance measures are discussed in detail in Section 3.2 along with suggestions for improving Streamline s data tracking to significantly improve the accuracy of this information. Overall, Streamline is performing well for a new system, however the comparison shows that as Streamline continues to mature there is lots of potential for improvement relative to peer communities. Passenger trips per capita is one of the most important measures of a transit system s value to the community and this is clearly an area where Streamline has potential to improve. In FY 2012, Streamline s average number of rides per day was over 1,000; the average number of miles per month was 23,121; and the average number of hours of operation was 1,320 per month. The cost efficiency performance measures for these services are not as good as those for FY During FY 2012, Streamline had an average cost of $3.95 per mile; an average ride cost of $3.99; and an average cost per hour of operation of $70. We believe the primary reason for this change is that these FY 2012 number reflect a more accurate allocation of costs between Streamline, Galavan and coordinated services. Fare Free Service Continuing to operate a fare free system is both viable and preferable to introducing fares. Switching to a fare-based service would be costly and time-consuming, with many other significant downsides and minimal (if any) benefits. Charging fares is unlikely to increase revenue, likely to result in reduced service, and guaranteed to reduce ridership. Focusing on developing new partnerships is a far more effective strategy for increasing revenue while also
12 ES-6 Streamline Business Plan expanding service and increasing ridership. The pros and cons of introducing fares are discussed in more detail in section??. Opportunities for Improvement Streamline has many opportunities to improve its service and operations over the next five years to better meet the needs of riders and potential riders in the greater Bozeman area. Areas where opportunities exist are listed below, and action steps for each of these areas are included in the Implementation Plan in Chapter 2. Improvement opportunities include the following areas: Increasing service (frequency / hours / geography) Data tracking for performance metrics/better board reports Vehicle quality and capacity Maintenance Bus stop infrastructure Community outreach/partnerships Organizational structure Communication / marketing Technology Policies and procedures (including driver training) Record keeping and regulatory compliance The overarching theme for the next five years was well stated by one of the participants in the TAC meeting who commented that while it was not realistic to launch a perfect transit system in 2006, everyone involved has worked hard using the resources available over the last six years to build a successful system that is achieving much of its mission; and Our goal now should be to keep maturing so that over time we will achieve performance measures comparable to peer communities.
13 Organizational Profile Organizational Profile Streamline s fixed route bus service and Galavan paratransit provide public transportation in Bozeman, the Gallatin Valley, Bridger Canyon, and Livingston, Montana. Streamline is administered by the Human Resource Development Council (HRDC) in partnership with the Associated Students of Montana State University (ASMSU). Streamline operates three in-city routes five days a week; commuter routes to Belgrade and Livingston five days a week; two Latenight in-town routes Thursday through Saturday nights; two in-town routes on Saturdays; and a weekend route to Bridger Bowl and Bohart Ranch during ski season (see Figure 1-1). Streamline also connects with the Skyline Big Sky service. Streamline, Galavan, and Coordinated Services: Streamline and Galavan are managed by Lee Hazelbaker, HRDC Transportation Program Director. Streamline is operated under contract to Karst Stage. HRDC directly operates Galavan. Streamline and Galavan have an active board with representatives Annual Operating Budget $1,445,102 Annual Number of Riders 343,214 Annual Miles Driven 511,838 Annual Hours of Operation 24,157 Annual Savings in CO2 Omissions 1,000,000+ pounds Percent Rides on Streamline 92% Percent Budget for Streamline 77% from ASMSU, riders, local businesses, the City of Bozeman, and the community. Galavan began demand response service in HRDC added Streamline fixed route service in August 2006 via partnerships with ASMSU and the Montana Department of Transportation.
14
15 Implementation Plan Implementation Plan The purpose of this business plan is to create a document that will guide the direction of HRDC s transportation program, with a focus on Streamline. It assesses the current situation, identifies short and long-term goals, and provides a context for business decisions to be measured. Streamline/HRDC management and board will use this document to identify opportunities for improving both internal and public elements of Streamline s operations. The financial manager will use the data and goals in this plan to evaluate fiscal reports, set budgets, and prioritize expenditures under the guidance of management. Finally, this document will support Streamline s requests for operating assistance from MDT, as well as helping other potential funding partners understand Streamline s value to the community. The projections contained in this plan should be updated as changes are made, when new data becomes available, and when new issues and opportunities arise. The main body of this business plan is supported by detailed information in the appendices. 2.1 Streamline Mission Streamline s mission is stated on the Streamline website ( To be the provider of mobility services and alternatives to the single occupancy vehicle in southwest Montana. Streamline will accomplish its mission by providing alternative modes of transportation, including the following: Fixed Route Transportation Demand-Responsive Transportation Van Pools Carpooling services Streamline will accomplish its mission by providing services to the following clientele: Montana State University Students Montana State University Faculty and Staff Senior Citizens General Public Persons with Disabilities Person with Low Incomes Non-driving high school and middle school students Downtown shoppers and workers Bozeman s slogan is The Most Livable Place, and in developing the recommendations presented below the project team has focused on linking Streamline s services to the
16 2-2 Streamline Business Plan community s livability, in keeping with the planning vision described on the Streamline website: Since the beginning, the needs of the people in our community have driven the planning process of a Bozeman transportation system. What s more, those evolving needs will still guide us as we expand our routes and services. Funding levels, ridership trends, locations of new neighborhoods, roads, facilities and public input will all contribute to shaping our future routes and services. This is just the beginning. Streamline is committed to serving you over the long term changing with your needs, evolving with our community. Streamline has already implemented a number of effective strategies to achieve its mission, and these strategies offer models for some of the goals, objectives and implementation steps recommended in this plan. This plan emphasizes the importance of strengthening and broadening Streamline s partnerships, building on successful strategies including: Streamline s coordination with the Skyline bus system serving Big Sky. Partnerships with Bridger Bowl and Bohart Ranch to provide public transportation to these heavily used local ski areas. Partnering with ASMSU to design and operate Latenight routes to reduce drunk driving. Streamline s past performance has been exceptional given the limited staffing. However, existing staffing capacity is inadequate to implement many of the identified actions to ensure Streamline continues to move forward providing the high quality services that riders have come to depend on while also engaging the community to take advantage of opportunities to ensure future success. 2.2 Project Goal This document represents the first investment in a multi-year planning effort since Streamline started service. As stated in the project Request for Proposals, The goal of this project is to determine how the existing service of HRDC/Streamline could be modified to better meet the needs of riders and potential riders in the greater Bozeman area. Streamline has been highly successful in its first six years (Figure 1-1). The central challenge facing the organization over the next five years will be to meet increasing demand. Streamline has experienced a steady and significant increase in ridership every year and based on the past this trend will continue. At the same time, rider surveys and stakeholder outreach have identified a number of potential opportunities to improve service for existing riders, increase awareness of the services Streamline currently offers, and serve new riders. To meet these challenges, management will need to be creative and engage the community to improve services, find new resources, and ensure that opportunities are not missed.
17 Implementation Plan 2-3 Annual Ridership 300, , , % +5% +4% +14% 150, % 100,000 50,000 0 FY07 FY08 FY09 FY10 FY11 FY12 Figure 1-1: Annual Streamline ridership As reflected in national trends as well as the operations and management of many of the peer communities, public transit providers in communities of all sizes are moving away from a narrow focus on just running buses. They are designing and implementing strategies that focus on being part of the community in order to provide community transportation that meets the needs of as many people as possible. Public transportation is transitioning away from a focus on running buses to a focus on moving people. To achieve this goal, many transit providers are operating more like a business. This means a strong emphasis on marketing and an organizational structure that incorporates three key elements: management that focuses on running the organization efficiently on a day to day basis; technicians who do the actual work of the organization; and entrepreneurs who plan and build the partnerships needed to meet the needs of the future. 2.3 Service Changes The team recommends no major service changes for August Instead Streamline can focus on non-service actions outlined in Section 2.3 while initiating a process for prioritizing service change options and developing routes and timetables. Staff and the operations committee can use findings, stakeholder and rider feedback, and survey and modeling results in this report to inform future service changes. Final decisions on changes will require further assessment, design and community outreach. Many of the options presented here are possible only with success in increasing non-federal funds. Costs and estimates for the services the project team considered are included in Table 2-1. The team s recommended service changes in order of priority are:
18 2-4 Streamline Business Plan 1. Fourth in-town route, and redesign routes. The current route structure provides good connections from MSU to the other major in-town destinations (downtown, mall, hospital, North 7 th and North 19 th shopping), but downtown is not well connected to the hospital and the mall. The Blueline and Yellow West routes function well but the Redline and Yellow East circular loops lead to a lower quality of service between the hospital, downtown, and the mall. A fourth in-town route can improve this. Options include a linear route between the mall, downtown, and the hospital; or a downtown-mall-northwest route with two buses on Yellow East in opposite directions. Rider comments related to route tweaks can be reviewed at the same time as this redesign. (FY 2015) 2. Improve service to Four Corners and/or Kagy & 19 th if funding arrangements with businesses can be established. Specific businesses at these locations have expressed interest for employees or customers. Improved Four Corners service can also improve connections between downtown and Big Sky via the Skyline Link. (FY 2015) 3. Support arrangements for an affordable airport shuttle from Bozeman. In lieu of providing fixed route bus service, the downtown business association, the Bozeman Economic Development community, and ASMSU may wish to pursue an arrangement with a private shuttle company or taxi service to offer guaranteed minimum financial support in exchange for an airport shuttle with reasonable charge. The agreements for new air service and the FTA 5311(f) intercity bus program are two possible models for this type of public-private partnership. (FY 2016) 4. Improved frequency to Belgrade, Livingston, and Bridger Bowl if funding arrangements with the appropriate organizations (City of Belgrade, Gallatin County, City of Livingston, Park County, Bridger Bowl, Gallatin National Forest) can be established. (FY 2016) 5. Expand 30-minute peak hour frequency to all in-town routes, morning and evening. (FY ) 6. Fifth in-town route - Incorporate the southside neighborhood, Eagle Mount, Sacajawea Middle School, and the newest northwest neighborhoods, Chief Joseph middle school, and the regional park. Restructure other routes to better serve the entire 19 th Street corridor. (FY 2017) 7. Experiment with Saturday service on all routes, Sunday service, and longer hours. Riders widely express interest in expanded hours and more days of service, and off hour service can be vital for people with limited transportation options for travel to work and other purposes. However, cost per ride on weekends and after 7pm tends to be high because the number of riders is much lower (50-70% of daytime use). During these off hours, alternatives to fixed route can be a cost effective solution, including general public demand response, taxi vouchers, and car share programs. (FY 2018)
19 Implementation Plan 2-5 Table 2-1: Cost Estimates for New Services New Service Alternatives Hours per Run Miles per Run Days Annual Hours Annual Miles Variable Cost Fully Allocated Cost Variable Cost Fully Allocated Cost In Town Route hrs/day) 1: ,290 42,765 $137,385 $201,136 $145,752 $213,386 More In Town (per hour) 1: ,341 $10,733 $15,714 $11,387 $16,671 Peak Hour Frequency per route (Bozeman routes at 1/2 hour frequency during peak hours, 4 hrs/day) 1: ,684 $27,898 $40,844 $29,597 $43,331 Sunday Service (@ 10 hrs/day) Yellow 1: ,360 $22,849 $33,452 $24,241 $35,489 Blue 1: ,207 $23,277 $34,078 $24,694 $36,154 Sunday 52 1,095 14,567 $46,126 $67,530 $48,935 $71,643 Airport Service (@ 5 hrs per day) 1: ,825 40,150 $95,136 $139,283 $100,930 $147,765 Additional Belgrade (per 1.25 hr run) 1: ,402 $17,131 $25,081 $18,175 $26,608 Additional Livingston (per 1.5 hr run) 1: ,420 $28,088 $41,122 $29,799 $43,627 Three Forks/Manhattan (per 1.7 hr run) 1: ,850 $31,945 $46,769 $33,891 $49,617 [Streamline Hours and Cost Allocations by Route.xlsx]Hours & Miles
20 2-6 Streamline Business Plan 2.4 Short-Range One-Year Actions The following set of actions is those which the project team recommends in the first year. These actions are broad-ranging and address everything from equipment to infrastructure to staffing and documentation. It is important to initiate these actions in the coming year even if they are not completed in year one. All costs are minimal and can be accomplished within the current budget and way of doing business unless otherwise noted. Action One: Assess Streamline s organizational structure and skill mix relative to peer communities to maximize the organization s ability to deliver high quality service and plan for the future. Also, take steps to clearly define the roles and responsibilities of Streamline management and Karst to ensure that oversight by Streamline management meets FTA standards. Organizational and staffing recommendations are documented in Section 6-5 and Appendix E. Our main recommendations realign staff responsibilities and qualifications to better match industry and peer community standards. Over the next five years, we recommend increasing administrative Full-time equivalents (FTE s) from 2.7 to 4.1, and increasing operations FTE s from 9.2 to 11. We estimate an additional cost of $125,000 per year if all changes were implemented. Begin this transition in Year 1: Action 1.1 Conduct a process involving management and board members to determine: Which of the organizational needs identified in this planning process are highest priority and to what extent they can be addressed with the current staff and organizational structure. Whether additional staffing capacity can be funded to address needs identified in this plan. How new staffing capacity should be incorporated into Streamline s organizational structure. Whether the organizational structure should be modified (regardless of whether new staffing capacity is added), to more closely match the standards for structure, job descriptions, salaries, and qualifications used by peer communities with fixed route systems. Action 1.2 Assign staff to provide service supervision as described in Appendix C.
21 Implementation Plan 2-7 Action Two: Action 2.1 Begin transition to 12-year buses that provide a higher quality of service. Initiate discussions with MDT to obtain their support for one of the three fleet improvement options presented in the equipment chapter. Action Three: Improve technology and data processes to better serve customers and collect and analyze needed data. Action 3.1 Action 3.2 Action 3.3 Action 3.4 Action 3.5 Action 3.6 Improve RideSystems capabilities to get the full value out of the high quality data it is already collecting. The developer can solve these problems by restructuring the database and using the General Transit Feed Specification (GTFS) to describe the routes. Additionally, some changes should be made to the bus drivers user interface Implement GTFS, add the Google Trip Planner to the Streamline website, and make GTFS data available to third parties. Improve data collection and management procedures to produce better performance measures reports and streamline efforts such as producing timetables. Develop a monthly, quarterly, and annual performance report for the Advisory Board. Revise how schedules are presented in brochures, on signs, and on the website to minimize riders confusion. Design online timetables in a manner that facilitates interpretation by assistive reading tools used by people with low vision. Add Google Translator to the website for use by non-english speakers and as required in updated FTA civil rights guidance. Improve functionality of the website by making it easier to find and view route maps and timetables, and by more clearly featuring and explaining real time bus tracking to encourage its use. Action Four: Action 4.1 Address issues with bus stop infrastructure and facilities to better serve riders. Implement a five-year plan for improving bus stop infrastructure such as shelters and ADA access.
22 2-8 Streamline Business Plan Action 4.2 Action 4.3 Action 4.4 Begin working more closely with the City on policies, procedures and engineering standards for bus stop infrastructure. Support adoption of these standards by the city. Work with developers and the city to incorporate transit and transit infrastructure into new development proposals. Address problems with the Downtown Transfer Center (signage and visibility.) Action Five: Action 5.1 Action 5.2 Begin addressing maintenance recommendations contained in the Operations Review and Assessment. Develop Management Plan and other guidance, policy and procedure documents recommended in the Operations Review and Assessment (Appendix C, page C-11). Implement policies and procedures documented in these plans. Pursue wheel end failures fleet defect with equipment contractor. Action Six: Rebrand Yellowline East to Orangeline to lessen rider confusion. 2.5 Long-Range Five-Year Actions Long-range Actions include actions that while important, are less immediate needs than the short-term or one-year actions listed above. Many of the five-year actions build upon actions initiated in your one. Implementing the five-year Actions will ensure that Streamline responds to growing demand, remains on firm financial footing, works effectively with its partners, and captures anticipated opportunities. Action Seven: Operate Streamline with vehicles that provide safe, efficient, and quality service. Action 7.1 If moving forward with recommendations to purchase 12-year buses, work with MDT on specifications for the purchase of 12-year buses on replacement cycle of two twelve-year vehicles per year for a six year period. Action Eight: Continue to improve Streamline s operations management Action 8.1 Implement any staffing expansion and/or reorganization agreed to through the management/board process in year one.
23 Implementation Plan 2-9 Action 8.2 Action 8.3 Continue to contract operations and maintenance to Karst. Reassess the arrangements in five years. Periodically evaluate cost-effectiveness of maintenance contract with Karst to ensure costs are reasonable and operations are reliable and effectively managed. Action 8.4 Monitor performance to stay below maintenance cost benchmarks of $.96 expense per revenue mile and 19% of total operating expenses for the fixed route service. Action 8.5 Every five reassess whether Streamline should continue to be managed by HRDC vs. the City of Bozeman, or whether a coalition of stakeholders should pursue the creation of a UTD. Action Nine: Improve technology, marketing, and communications with the public. Action 9.1 Action 9.2 Update marketing plan and branding for consistency with fleet and other changes. Cost: $15,000-$30,000 Consider other technology options presented in this plan, or that become available over the next five years. Action Ten: Action 10.1 Action 10.2 Action 10.3 Action 10.4 Action 10.5 Position Streamline to meet growing demand for services and to become more integrated into the community. Strengthen existing partnerships and establish new partnerships with large employers and other stakeholders to diversify funding base and build understanding of Streamline s role in the community. Evaluate potential to charge a modest fare for service to Belgrade and Livingston (or other outlying areas). Develop a Transportation Demand Management (TDM) function, working with major employers to encourage employees to commute using options other than driving alone. Include vanpool service to/from Three Forks/Manhattan. Strengthen Mobility Management functions, working with human service agencies to coordinate rides for their constituents. Participate in planning related to parking management.
24 2-10 Streamline Business Plan Action 10.6 Action 10.7 Develop a process for regular communication with the business community to look into services to the airport, connections to from Big Sky to downtown and other opportunities/needs. Consider a petition to place an Urban Transportation District (UTD) with millage on the ballot. Alternatively, work with the university, local governments, and private organizations to significantly increase contributions. The 2010 median investment from federal, state, and local sources among Bozeman s peer group was $52 per capita 1. Missoula s city bus costs $56 per capita; the separate university bus system cost $33 per student. By comparison, the 2010 investment into Streamline, Galavan, and coordinated services was equal to $20 per Bozeman resident. The combined FY 2012 contribution from ASMSU and MSU was approximately $16. Streamline uses its funding efficiently, but it cannot provide the level of service that peer communities offer without additional non-federal investment. 1 Per capita investment was calculated by dividing 2010 National Transit Database (NTD) operations and maintenance costs by the population of the largest city in the service area. The Associated Students of the University of Montana calculation uses student enrollment.
25 Description of Services Description of Services This chapter summarizes Streamline s current routes as well as overall performance, the benefits, costs and needs of the areas served by Streamline s current routes. The following data sources were used for the analysis in this chapter and in the other sections of this plan. In every instance we used the best data available for the specific analysis we were conducting. However, there is considerable variability in these data sources for a variety of reasons the year the data was collected, the geographic area covered, the methodology used to collect data, etc. Consequently, calculations are not entirely consistent. Census data and estimates from the American Community Survey, Census 2010, and the 2011 Economic Survey. National Transit Database (NTD) rural and urban data from the most recently available year, 2010 Streamline and Galavan budgets and ridership from Fiscal Year 2012 (July 1, 2011-June 30, 2012) Hours and miles from schedules starting August 2012 October 2012 ridership data from RideSystem On board boarding and debarking tallies from select dates in October 2012 On board surveys from October housing and population projections used in the Greater Bozeman Transportation Plan 2007 Update Between its core Daytime services, Latenight, Saturday, and Bridger/Bohart, at least one Streamline bus is on Bozeman roads almost every day of the year. Daytime and Livingston operate Monday Friday except holidays, about 257 days per year. Latenight operates Thursday through Saturday nights until 3am Friday through Sunday mornings. Bridger/Bohart operates Saturdays and Sundays during ski season. As of August 2012 Streamline operates the routes shown in Figure 3-1.
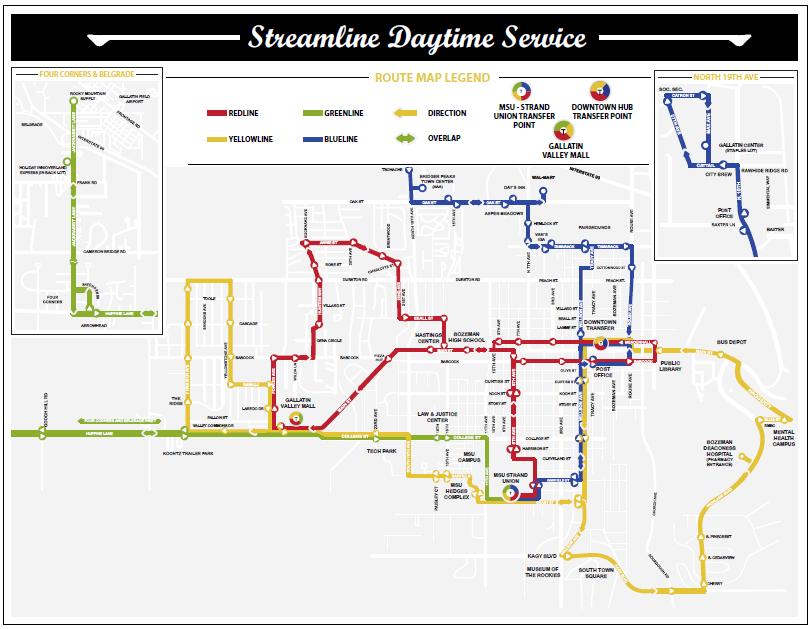

26 3-2 Streamline Business Plan Figure 3-1: Streamline Routes
27 Description of Services System-Wide Performance Summary Table 3-1 and Table 3-2 present standard industry performance measures for Streamline and Galavan relative to peer communities. These performance measure categories, and the performance measures themselves are based on TCRP Report 141 (Ryus & et.al., 2010). During FY 2012, Streamline had an average cost of $3.95 per mile and $3.99 per ride. With 1,320 hours of operation per month, the cost per hour is $70. The average number of rides per day was over 1,000. The average number of miles per month was 23,121. For peer communities, the table presents the data they reported to the National Transit Database (NTD) in It is important to note that for rural communities such as Boone, NC the quality of the NTD data is much lower and more variable than the quality of data reported by urban peers such as Missoula. Nonetheless, the quality of data is adequate to provide general benchmarks for Streamline and Galavan s performance. For Streamline and Galavan, the 2010 NTD data column shows the data Streamline reported to the Montana Department of Transportation and the National Transit Database. The 2012 column shows data Current Transportation developed from Streamline budgets and ridership data. In many cases we used a different slicing of ridership, budget, miles, and hours to improve accuracy. We recommend that Streamline s management and board update and review performance measures on a regular basis. It is important for HRDC to use data collection and management procedures that ensure the accuracy and standardization of these performance measures. Without good data quality control it is difficult to make accurate comparisons to transit services in peer communities, and to make management decisions using peer-based performance benchmarks. Appendix D includes notes summarizes the importance of each performance measure, Streamline s current ability to generate accurate data, and steps needed to improve data quality. Most of the recommendations can be accomplished with improved procedures and will not require investing in new technology.
28 3-4 Streamline Business Plan Community Description Table 3-1: Performance Measures Fixed Route Fixed Route Median (Peer Communities 2010 NTD) 2010 NTD Bozeman 2010 Percentile 2012 Service Area Population [City] 27,554 38,025 62% 38,025 Revenue General Information Operating Ratios (urban only) Service Supply Service Consumption Operating + Maintenance Expense (FR & DR) $2,587,269 $1,149,411 24% $1,445,102 FTA Contribution $544,813 $670,571 57% $819,604 Non-FTA Revenue $1,011,101 $478,840 29% $654,012 State Contribution $119,001 $0 29% $57,500 Local Contribution $338,988 $401,323 43% $580,826 Passenger Fare Revenues $62,738 $17,517 36% $15,686 Farebox Recovery (%) 13% 1.5% 28% 1.1% Non-Federal Revenue Per Operating Expense (%) 73% 41.7% 21% 45% Passenger Trips 664, ,879 24% 277,454 Passenger Miles (urban only) 2,738,311 n/a 1,372,271 Revenue Miles 373, ,289 57% 280,364 Revenue Hours 26,949 14,400 10% 15,848 Ops + Maint Expense $2,092,004 $759,244 19% $1,106,778 Mode % of Budget 85% 66% 14% 77% Admin FTE per Total FTE 13% n/a n/a Maint FTE per Total FTE 12% n/a n/a Total Employee FTEs 36.6 n/a n/a Employee Operating FTEs 25.7 n/a n/a Maintenance Employee FTEs 3.3 n/a n/a Administrative Employee FTEs 4.9 n/a n/a see Section 7: Organization & Management Vehicle Miles Per Capita % 7.37 Passenger Trips Per Capita % 7.30 Pass Trips Per Rev Mile % 0.99 Pass Trips Per Rev Hour % 17.5 Pass Trips Per Rev Hour (Total FR & DR) % 12.5 Cost Ops Expense Per Capita 52 $ % $29.11 Efficiency Ops Expense Per Pass Trip $3.07 $ % $3.99 Ops Expense Per Pass Mile $1.14 n/a n/a $0.81 Ops Expense Per Rev Mile $4.87 $1.95 0% $3.95 Ops Expense Per Rev Hour $63 $53 33% $69.84 Maint Expense Per Rev Mile $0.96 n/a n/a $0.61 % Miles (This Mode) 67% 75% 50% 71% % Trips (This Mode) 98% 92% 0% 92% % Hours (This Mode) 100% 66% 14% 66% Average Fare $0.59 $0.00 n/a $0.00 [Cost-based Performance Measures.xlsx]Performance Measures
29 Description of Services 3-5 Table 3-2: Performance Measures - Demand Response Peer Median (2010) Demand Response Bozeman 2010 NTD 2010 Percentile Other (Pass Through, Capital) Community Description Service Area Population [City] Revenue General Information Operating Ratios (urban only) Operating + Maintenance Expense (FR & DR) FTA Contribution Non-FTA Revenue State Contribution Local Contribution Passenger Fare Revenues Farebox Recovery (%) Non-Federal Revenue Per Operating Expense (%) Passenger Trips 25,238 25,238 45% 24,701 41,059 Passenger Miles (urban only) 111,831 Revenue Miles 104, ,763 55% 112,097 Revenue Hours 8,177 7,400 36% 8,309 Ops + Maint Expense $535,882 $390,167 18% $302,400 $110,923 Mode % of Budget 25% 34% 73% 21% 8% Admin FTE per Total FTE 26% n/a n/a Maint FTE per Total FTE 6% n/a n/a Total Employee FTEs 6.7 n/a n/a Employee Operating FTEs 4.7 n/a n/a Maintenance Employee FTEs 0.3 n/a n/a Administrative Employee FTEs 1.7 n/a n/a Service Supply Vehicle Miles Per Capita % 2.95 Service Passenger Trips Per Capita % 0.65 Consumption Pass Trips Per Rev Mile % 0.22 Pass Trips Per Rev Hour % 3.0 Pass Trips Per Rev Hour (Total FR & DR) % Cost Efficiency Ops Expense Per Capita 13 $ % $7.95 Ops Expense Per Pass Trip 26 $ % $12.24 Ops Expense Per Pass Mile $4.96 $0.00 n/a n/a Ops Expense Per Rev Mile $5.21 $ % $2.70 Ops Expense Per Rev Hour $61 $53 36% $36.39 Maint Expense Per Rev Mile $0.41 $0.00 n/a $0.16 % Miles (This Mode) 9% 25% 64% 29% % Trips (This Mode) 1% 8% 91% 8% % Hours (This Mode) 16% 34% 82% 34% Average Fare $7.07 $0.00 n/a [Cost-based Performance Measures.xlsx]Performance Measures same as fixed route see Section 7: Organization & Management same
30 3-6 Streamline Business Plan The cost per ride varies between services and routes depending on the average distance a rider travels and the cost effectiveness of the service. As shown in Table 3-3, the highest cost per ride is on the Galavan curb-to-curb service. Bridger Bowl and Livingston have higher costs than daytime because of the travel distance. Table 3-3: Performance by Service Service Hours Miles Rides Cost per Ride Daytime 11, , ,679 $3.68 Latenight 1,484 28,184 19,710 $6.00 Saturday 1,177 12,760 19,339 $3.50 Livingston 1,041 23,543 11,809 $6.82 Bridger 206 3,918 1,917 $7.65 Total Streamline 15, , ,454 $3.99 Galavan 8, ,097 24,701 $12.24 Characteristics by route were calculated using annual trip counts and October data from the RideSystem technology (further discussed in Section 7.3). Figure 3-2 illustrates the distribution of ridership by route and offers a comparison to the distribution of passenger-mile per route. The first row shows all Streamline routes, while the second row shows just Daytime and Livingston routes. This graph shows that Yellow has the highest percent of rides, but Livingston has the highest percent of passenger-miles.
31 Description of Services 3-7 Ridership by Route FY 2012 Passenger-Mile Distribution FY 2012 Livingston 4% Latenight 7% Saturday 7% Yellow 32% Blue 23% Bridger Bowl/ Bohart 1% Green - Belgrade 6% Red 20% Latenight 5% Livingston 23% Yellow 16% Saturday 5% Bridger Bowl/ Bohart 3% Red 14% Blue 19% Green - Belgrade 15% (a) Ridership by Route (Daytime + Livingston) FY 2012 Livingston 5% Yellow 37% Blue 27% Red 23% Green - Belgrade 8% Livingston 27% Passenger-Mile Distribution (Daytime + Livingston) FY 2012 Yellow 18% Figure 3-2: Ridership and Passenger-Mile Distribution (a) all routes (b) Daytime and Livingston only Red 16% Blue 22% Green - Belgrade 17% (b)
32 3-8 Streamline Business Plan As shown in Figure 3-3, weekday ridership is higher than Saturday service, with ridership trailing off on Thursday and Friday. Saturday ridership, including Latenight, is about 40% of ridership on Monday through Wednesday. Figure 3-4 shows monthly ridership. Use is highest when school is in session and in inclement weather. 6,000 5,000 4,000 3,000 2,000 1,000 0 Ridership by Day of Week (All Routes) October 2012 Sun Mon Tue Wed Thu Fri Sat [ Ridership Analysis.xlsx]Overview Figure 3-3: Ridership by day of week Daily Rides 1,500 1, Ridership by Month - All Routes (FY 2012) 1,141 1, ,006 1,075 1, July Aug Sept Oct Nov Dec Jan Feb Mar Apr May June Figure 3-4: Ridership by month
33 Description of Services 3-9 Figure 3-5 through Figure 3-11 show ridership by hour for each of the daytime routes. The data shows that the Yellowline has a larger morning peak while the Blueline has a larger evening peak. The data does not offer any clarity about the effectiveness of peak-hour frequency. Because of limitations in the data structure, the peak-hour frequency data is very difficult to organize, and data can only be used from common days where the same two vehicles are on the different runs Boardings by Hour - Blue October :00 7:00 8:00 9:00 10:00 11:00 12:00 13:00 14:00 15:00 16:00 17:00 18:00 19:00 [ Ridership Analysis.xlsx]Blue Figure 3-5: Ridership by hour on the Blueline. Highest ridership occurs in the 4pm hour. Boardings by Vehicle and Time of Day - Blue Sampled from October % 12% 10% 8% 6% Bus 602 4% 2% Bus 610 0% 6:00 7:00 8:00 9:00 10:00 11:00 12:00 13:00 14:00 15:00 16:00 17:00 18:00 19:00 [ Ridership Analysis.xlsx]Blue Figure 3-6: Peak hour frequency on the Blueline
34 3-10 Streamline Business Plan Boardings by Hour - Red October 2012 [ Ridership Analysis.xlsx]Red Figure 3-7: Ridership by hour on the Redline Highest ridership occurs in the 8am and 4pm hours. 14% 12% 10% 8% 6% 4% 2% 0% Boardings by Vehicle and Time of Day - Red Sampled from October 2012 Bus 603 Bus 610 [ Ridership Analysis.xlsx]Blue Figure 3-8: Peak hour frequency on the Redline.
35 Description of Services 3-11 Boardings by Hour - Yellow October % 14% 12% 10% 8% 6% 4% 2% 0% 6:00 7:00 8:00 9:00 10:00 11:00 12:00 13:00 14:00 15:00 16:00 17:00 18:00 19:00 [ Ridership Analysis.xlsx]Yellow Figure 3-9: Ridership by hour on the Yellowline. highest ridership occurs between 7am and 10am. Boardings by Vehicle and Time of Day - Yellow Sampled from October % 12% 10% 8% 6% 4% 2% 0% 6:00 7:00 8:00 9:00 10:00 11:00 12:00 13:00 14:00 15:00 16:00 17:00 18:00 19:00 Bus 607 Bus 611 [ Ridership Analysis.xlsx]Yellow Figure 3-10: Peak hour frequency on the Yellowline The second bus carries more passengers than the first bus in the morning.
36 3-12 Streamline Business Plan Boardings by Hour - Green October [ Ridership Analysis.xlsx]Green Figure 3-11: Ridership by hour on the Greenline Highest ridership occurs in the morning. Table 3-3 lists the top stops as recorded by the RideSystem in October. Note the system does not differentiate between stops on opposite sides of the street, nor can data be tied to the routes being used. These stops are candidates for benches and shelters Table 3-4: Stops with More than Ten Boardings per Day (October 2012) Stop Daily Average 1 MSU SUB Transfer Ctr MSU SUB Walmart Gallatin Mall Pamida Staples Smith & Missoula Ave Bridger Peaks Quality Inn Oak/15th Senior Center College/23rd Gallatin Mall Social Security Bozeman HS Main and Rouse th/Beall Main and Wallace nd/Charlotte [ Ridership Analysis.xlsx]Ridership by stops
37 Description of Services Fare Free Service Continuing to operate a fare free system is both viable and preferable to introducing fares. Streamline should be able to continue to develop new partnerships that grow the bus system and increase both revenue and ridership. In the best case scenario we estimate that Streamline could net $29,000 annually by charging a $1 fare. This would earn 2.6% of Streamline s annual budget. A higher net gain is unlikely because of the significant costs involved in charging fares and because our on-board survey results show that approximately 63% of current ridership is MSU students, staff and faculty. All the peer communities we reviewed that charge fares have funding contracts with universities and colleges providing fare-free service for students and usually staff and faculty as well. Because of the strong support for fare free service expressed by MSU riders, we assume that ASMSU and MSU would enter into a similar agreement with Streamline. As a result, any profit would need to come from the remaining 37% of riders. Regardless of whether Streamline succeeded in achieving a small net gain in funding by charging fares, this gain would be outweighed by the many downsides of introducing fares: There is a significant likelihood that introducing fares could cause a net loss of as much as $26,000 per year. Costs to Streamline would include expenses of approximately $21,000 per bus to install fareboxes, plus significant administrative time and expenses to run the program including establishing and maintaining a convenient network of business partners who are willing to sell bus passes. The formula for Federal matching funds subtracts farebox revenue before applying match ratios. In communities that are not over matched, struggling with limited or no local and state taxes to leverage every possible federal dollar, the formula creates a disincentive to charging fares. Consequently, every farebox dollar earned actually only increases revenue by 40 cents. Collecting fares would cause significant time delays requiring Streamline to redesign all current schedules to either reduce service or significantly increase travel times. Charging fares will reduce ridership. A significant portion of Streamline s riders are transportation disadvantaged and are clients of social service programs. Streamline s social service partners would need to create a new bureaucratic process to purchase and distribute bus passes for these clients. Fares would undermine the safety net for Streamline s most vulnerable riders low income riders who have no other reliable transportation options and do not participate in any social service programs. Lack of reliable and affordable transportation is a significant factor in chronic unemployment in low income populations.
38 3-14 Streamline Business Plan 3.3 Benefit Estimations The benefits of public transportation can be classified into the categories of mobility, efficiency, land use, and economic development. Some of the benefits are to an individual rider, while governmental agencies or the society incur other benefits. Quantifying benefits is notoriously hard, and putting a monetary value is even more difficult, but some studies have succeeded in quantifying some. Methods quantifying the underlined benefits in the following list are described in this section. Mobility Access to jobs/education Independent living Medical care savings Support and savings to Human Services, Education, Labor, etc. Equity Option value / emergency response Efficiency Vehicle costs Chauffeuring Congestion mitigation Parking Safety, security, and health Roadway costs Energy and emissions Travel time impacts Land use Land dedicated to transportation Land use objectives Economic Development Direct jobs and business activity created by transit expenditures Shifted expenditures Agglomeration economies Transportation efficiencies Land value impacts Housing and Transportation Affordability America s families spend more than 19 cents out of every dollar earned on transportation, an expense second only to housing and greater than food and health care combined. Households with good access to transit spend just 9 percent, while households in auto-dependent neighborhoods spend 25 percent. While housing costs may decrease with distance from the central city, the combined housing and transportation costs remain steady or increase. (Center for Neighborhood Technology / Brookings Institute, 2006)

39 Description of Services % 51 % 57 % Figure 3-12: Housing + Transportation is lower in transit rich neighborhoods The situation in Bozeman is consistent with these national trends. When comparing housing and transportation costs for a Bozeman worker commuting by single-occupancy-vehicle from different southwest Montana communities, the Bozeman resident saves money. Transportation savings outweigh higher housing costs. A community served by Streamline can offer its residents up to a 25% savings according to the national statistics. Using local statistics, if a household in Bozeman, Belgrade, or Livingston is able to reduce the number of cars from two to one by relying on Streamline, walking, and biking, it can save between $6,800 and $9,500 per year. (Ballard & Philip, 2008) Table 3-5: Housing and Transportation Costs for a Bozeman Worker ( ) Commuting Costs Belgrade Three Forks Manhattan Ennis Livingston Big Sky Bozeman Housing & Marginal Car Costs per month median gross rent, 2007* $743 $699 $645 $579 $607 $753 $713 commute costs** ($2.94/gallon) $100 $277 $178 $465 $233 $369 $28 Housing + commute at $2.94*** $843 $976 $823 $1,044 $840 $1,122 $741 Additional Cost of Car Ownership** per year full-coverage insurance $943 $943 $943 $943 $943 $944 $943 license, registration, taxes $554 $554 $554 $554 $554 $554 $554 depreciation (15,000 mi/yr) $3,321 $3,321 $3,321 $3,321 $3,321 $3,321 $3,321 finance charge $758 $758 $758 $758 $758 $758 $758 Total $5,576 $5,576 $5,576 $5,576 $5,576 $5,577 $5,576 Total Annual Cost of $7,835 $9,966 $8,767 $12,214 $9,430 $11,068 $6,775
40 3-16 Streamline Business Plan Commuting Costs Ownership Belgrade Three Forks Manhattan Ennis Livingston Big Sky Bozeman Potential savings: 1 less car per household $7,835 $9,966 $8,767 $12,214 $9,430 $11,068 $6,775 ** source: ** AAA Your Driving Costs 2008 Addition ***Housing + marginal car costs do NOT include the fixed costs of insurance, taxes, depreciation, and finance costs associated with owning an automobile Parking and Roadway Costs Community decisions that encourage Streamline, walking, and biking can reduce the need for parking spaces and result in a more productive land use. Because of this connection, best practice in communities such as Missoula and Pasadena, CA tie parking management to transit and traveler demand management. For example, one of the purposes of Missoula in Motion is to reduce parking use by downtown employees by using alternative transportation, so parking spots a are freed up for customers and the vibrant downtown environment is not broken up by parking lots. In Gallatin County, high demand locations occur at MSU, downtown, Bridger Bowl, Bohart Park, and select other areas souch as South Towne Square. MSU and Bridger/Bohart ridership is in part driven by time, expense, and inconvenience of parking. Based on the cost of the downtown parking garage, Montana State University can save approximately $2,000 per space per year if it can avoid the construction of a parking garage. Using ridership numbers and survey results, we estimate Streamline provides approximately 225 rides to campus per day. If we assume this equates to 100 parking spaces not being used that would have to be accommodated by a parking garage, MSU is saving $200,000 per year in reduced facility costs because of Streamline. Reduction in Vehicle Miles Travelled Parking garage: $2,000/yr Daily trips to campus: ~225 Assumption in saved parking: 100 spaces MSU Facility Savings: $200,000/yr Reduction in vehicle miles traveled also leads to congestion savings and reduced road construction and maintenance costs. Estimated construction costs for one lane mile of arterial road in Bozeman is currently $1 million, or $4 million for 1 mile of 4-lane road Societal Benefits Although not inclusive of all costs, economic benefit estimations from state and TCRP studies provide a credible, conservative methodology for comparing public transportation options to other transportation solutions and conducting benefit/cost analysis. The Wisconsin DOT study
41 Description of Services 3-17 offers a good comparison for Montana. Estimated savings include benefits to transit riders, home healthcare cost savings, reduction in public assistance spending and other work supported programs, and shopping expenditures. This study estimates the average benefit per Wisconsin transit trip was $7.38 in 2002 dollars (Table 3-5), (HLB Decision Economics, Inc., 2003). When applied to Streamline and adjusted to 2012 dollars, the benefits in these sectors were $2.1 million (see Table 3-6 and Table 3-7). Table 3-6: Benefit per Trip, Wisconsin 2002 Wisconsin Calculated Benefits per Trip (2002 dollars healthcare, work, education, retail, recreation, tourism) Work: $6.96 Service (shopping, recreation): $6.27 Education: $4.03 Medical: $18.52 Average: $ Streamline/Galavan Benefits for Key Sectors $2.1 million Trip Purpose Table 3-7: Benefit Calculations for Key Sectors Percent of Trips (Oct 2012 Survey) 2012 rides Benefit per ride (2002, Wisconsin) Annual benefit Work/ workrelated 36% 99,232 $6.96 $690,653 Medical 6% 15,304 $18.52 $283,438 Recreation 4% 10,367 $6.27 $65,004 School 38% 104,662 $4.03 $421,789 Shopping 13% 35,546 $6.27 $222,872 Other 4% 12,342 $7.38 $91,086 Totals 100% 277,454 $6.40 $1,774, Dollars using CPI: $2,271,295 Finally, the highest transportation-sector energy and carbon savings can be accomplished not through high fuel-efficient vehicles, but rather from taking transit, carpooling, walking, biking, reducing the number of trips, and reducing the length of trips. Streamline is a significant contributor to carbon savings in the Gallatin Valley, contributing a net savings of 1,041,642 pounds of CO2 based on trips not taken by automobile during the first ten months of FY 2009.
42
43 Demographics and Needs Demographics and Needs This chapter summarizes the Current Transportation team s analysis of current and potential ridership and community need for Streamline s services. The team conducted several different market research efforts to understand the market for Streamline s services and the needs of existing and potential riders. These included collecting information directly from riders and stakeholders; demographic analysis and ridership modeling; and analysis of Streamline s ridership data and other information. To offer a broad understanding of the market for Streamline, the following sections present this information from a variety of perspectives including the geography and demographic characteristics of population density; current and future development and growth patterns; the needs of specific populations such as people with disabilities; and the needs of important stakeholders including MSU and the business community. People use the travel mode that has lowest cost from their perspective. This includes driving costs, time value, parking costs, and convenience. For the different populations of riders and potential riders discussed in this chapter, travel choices are determined by are variety of factors including travel time compared to alternatives, frequency and hours of service, geographic coverage, and parking availability. 4.1 Demographics and Modeling The team s analysis utilized U.S. Census data, the Greater Bozeman Area Transportation Plan demand model, Streamline route and ridership data, and modeling techniques to assess spatial and ridership data for 2010 and 2030, and to estimate ridership under different scenarios Demographics of the Study Area The Travel Model Study Area shown in the following map covers the Gallatin Valley and 90% of the Gallatin County population. The Study Area has the following attributes: o 38,025 population in Bozeman (2011) o Approximately 43,000 in the recently updated urban cluster boundary as defined by MDT based on 2010 census o 82,462 people for study area (2010) o 91,377 population for Gallatin County (2011) o 14,153 MSU enrollment (2012) o 367 square miles, o Over 4,000 zones

44 4-2 Streamline Business Plan Figure 4-1: Travel Model Study Area Bozeman is the urban cluster at the core of the Bozeman, MT Micropolitan Statistical Area. The micropolitan area encompasses all of Gallatin County. Because the urban cluster has fewer than 50,000 people, it is classified by the Congressional Budget Office, the Census Bureau, and FTA as non-urbanized, which the industry generally refers to as rural. By 2020, Bozeman can expect to cross the 50,000 threshold. Assuming no change in law, it will be reclassified as urbanized with a Metropolitan Statistical Area and Metropolitan Planning Organization. The 2030 MSU enrollment is estimated to be 18,090. Year 2030 county population is expected to be 135,990, a 49% increase over 20 years (Robert Peccia and Associates, 2007). Appendix F includes a series of maps showing Streamline s current routes overlaid on: Population density (block groups 2010) Percent of households in poverty

45 Demographics and Needs 4-3 Percent of population over 65 Percent of workers who walk to work Mean travel time to work Percent of workers who carpool Percent of workers who work from home Spatial Coverage of Streamline Routes To conduct demographics and spatial analysis and to incorporate transit into the travel model, the Streamline bus system was coded into modeling software. The paths and physical stops are shown in the following map (note not all of Green Route is shown). Assumed populations and walking distances are based on the centroid of a census block (shown as green dots) and the distance to a nearby bus stop. Figure 4-2: Streamline Network in the Model Estimations of service area coverage are based on half mile and quarter-mile radius bands placed around each stop on the system as shown in the following two maps. This represents the high-end and low-end of expected walking distance to bus stops for most riders.
46 4-4 Streamline Business Plan Note, this does not include the Livingston route, only includes daytime service, and the study area does not include the entire county. The following table summarizes the coverage Streamline currently achieves based on this one-half mile distance. Table 4-1: Spatial Statistics for Streamline ½ Mile Distance and ¼ Mile Distance from Stops ½ Mile Distance ¼ Mile Distance Study Area Streamline % Covered Streamline % Covered Area (sq. mi.) % 8.8 1% 2010 Population 82,462 38,994 47% 29,405 36% 2010 Housing 32,344 15,686 48% 11,242 35% 2010 Job Locations 53,366 34,863 65% 28,488 53% 2030 Housing 45,478 18,949 42% 12,762 28% 2030 Job Locations 89,506 48,943 55% 36,669 41% Only a small physical area is covered by Streamline, yet a large portion of the population, houses and job sites are covered. These proportions of coverage will likely decrease as population grows in the area, particularly if growth occurs away from the core areas. The housing unit density map in Figure 4-4 and Figure 4-5 also illustrates the current situation and projected density in Under the current situation, routes cover most of the areas of highest density with the exception of River Rock, southern Bozeman, and pockets of northwest Bozeman. In the future, demand can be expected to grow in these areas along with North Rouse, South 19 th and Huffine. Appendix F includes a series of other maps showing Streamline s current routes overlaid on: Population density (block groups 2010) Percent of households in poverty Percent of population over 65 Percent of workers who walk to work Mean travel time to work Percent of workers who carpool Percent of workers who work from home
 and")

47 Figure 4-3: Streamline service coverage based on ½ mile (top) and ¼ mile (bottom) walking distance to bus stops Demographics and Needs 4-5
48 4-6 Streamline Business Plan Figure 4-4: Housing unit density at block level, 2010

49 Figure 4-5: Housing unit density at block level, 2030 Demographics and Needs 4-7
50 4-8 Streamline Business Plan Ridership Demand Estimations and Modeling Modeling is a valuable tool that should be incorporated into the planning process for service changes and expansions. It is most valuable for generating relative comparisons of potential ridership for different route options. However, modeling is not an adequately precise tool for projecting performance measures such as cost per ride. There is a difference between actual ridership and demand ridership for transit. The current ridership numbers provide insight on how many people use transit and, based on differences in ridership between different transit lines, where there might be more demand. However, this does not give a complete picture of ridership demand. Dr. McGowen s modeling focused on exploring: Unserved Demand There will be unserved demand that cannot be measured by ridership. Unserved demand could result from having major areas with no transit service or lack of good connections between desired travel paths. Future Ridership Demand will increase as growth occurs. Demand models can be used to estimate future ridership numbers for Streamline and to help plan to accommodate this demand. Future total daily ridership was estimated based on Streamline s current service. For all models, trips are defied as one-way trips over a given time period (typically one day). In most of the models a trip with a transfer is counted twice. This is consistent with how ridership data is collected in terms of total boardings. Two methods were used to estimate ridership, a single number model and a spatial transit demand model. Single Number Model The Single Number Model generates an overall ridership projection for the entire service area. Estimates generated by this tool can be useful for planning efforts such as projecting how many buses of what size would be needed for a new route. However, this tool has limited value for designing routes because it does not incorporate spatial data. Equation 1 is the main equation. This formula is adjusted from national research to fit Bozeman data. It is designed for regularly scheduled routes. It is useful for projecting the relative impact on ridership of changes in hours of service and changes in population. (1) rips per Year = 9.89 MSU Enrollment County Population Annual Vehicle Hours of Operation 0.69 County Population Equation 2 is designed for commuter routes that operate limited times per day. The only variable is number of commuters, leaving it insensitive to the amount of service provided.
51 Demographics and Needs 4-9 (2) Commute Trips per Day = Total Commuters Spatial Transit Demand Model This is a much more sophisticated model that can be used for both large scale and focused analysis and can be a valuable tool for planning and designing routes. The effort for spatial modeling is much greater than for a single number model. However, spatial models have the following advantages: It allows for much more precise population estimates based on spatial analysis of route and stop locations. Passenger flows can be estimated by route segment. It can analyze how ridership will be affected by the location of residential areas relative to the location of trip generators such as schools, large employers and commercial centers. It can analyze how ridership will be affected by travel time, including the relative travel of driving compared to riding the bus. The spatial model is built on a model of existing personal travel patterns developed for the Greater Bozeman Area Transportation Plan (Peccia and Associate et al., 2007). Nationally, travel demand modeling conducted for transportation planning is typically a four step process that includes a modal split with estimates for transit demand. However, in Montana and other rural states this step is often skipped. Dr. McGowen s modeling was conducted because this step was not included in Greater Bozeman Area Transportation Plan. This spatial modeling effort included analysis of passenger flows for each link of the Redline; spatial analysis of Streamline s service coverage; and analysis of potential ridership for an additional transit line. While this effort was somewhat exploratory, the estimate of 130 additional rides per day appears more reasonable than Equation 1. Spatial modeling results in Appendix F show the benefits this tool could offer Streamline for planning future service changes and expansions. Missoula s Mountain Line uses spatial transit demand modeling for their transit planning. Compared to most peers, Streamline has a unique resource available in Dr. McGowen and the Western Transportation Institute. Few other rural transit systems have access to this level of expertise and Streamline should continue to take advantage of this resource Demographics and Modeling Conclusions The major findings of spatial analysis and the modeling effort were: Streamline currently does a good job of covering the core areas and connecting major centers. If the Streamline service remains the same and growth occurs in the pattern predicted from the Bozeman Area Transportation Plan, ridership is expected to increase by percent by 2030.
52 4-10 Streamline Business Plan With no increase in service the model predicts the proportion of Bozeman area residents that ride Streamline will decrease as the population increases. However, this trend would be minimized by policies such as complete streets policies that encourage growth and connectivity within the existing core. See Appendix F for more details 4.2 Public Outreach Our public outreach included on-board surveys, three stakeholder meetings and several interviews. The team collected 565 rider surveys onboard the four daytime routes and the Livingston route, primarily on October 8-9, with gaps filled during the remainder of the month. Data entry was completed on November 21. Complete survey results are included in Appendix B. On November 13, 2012 Current Transportation conducted outreach meetings. In addition, comments were received that week, and interviews were completed through December 7. Complete notes from the outreach meetings are included in Appendix A. The following groups had representation at one or more of the meetings. Associated Students of Montana State University Belgrade Chamber of Commerce Bioscience Labs Bozeman City Commission Bozeman Deaconess Hospital Bozeman Street Superintendent Bridger Bowl Board of Directors Career Transitions Childcare Connections Downtown Bozeman Partnership Eagle Mount Gallatin City-County Health Department Gallatin County Planning Department Gallatin Valley Mall Karst Stage MSU Staff Members MSU Students MSU Student Senate Montana Department of Health & Human Services
53 Demographics and Needs 4-11 Montana Association for the Blind Simms Fishing Products Streamline Streamline Board Western Transportation Institute The team conducted the following interviews: Bozeman Planning Department Bozeman Director of Economic Development and Community Relations Downtown Bozeman Partnership 4.3 Overview of Ridership and Needs Data from the rider surveys provides the best picture of who is currently riding Streamline. The surveys, along stakeholder comments also provide a great variety of information about the needs of the populations that are currently being served. However, it important to note that we have far less information about the unmet needs of potential riders who are not currently using Streamline s services. A number of stakeholder comments discussed in the following sections offer some insight into unmet needs, but in most cases these comments are a starting point for future market research. We advise that survey data use should be constrained by its limitations. Riders inherently have a level of satisfaction high enough to use Streamline; non-customers can be assumed to have lower ratings. Additionally, complex issues such as the relative merits of rerouting and the lack of awareness of real time tracking are poorly suited for capturing in the surveys. While issues such as lack of bus stop amenities received relatively small numbers of comments, these issues may still be important Ridership Characteristics Current Transportation broadly classifies transit services as safety net services or community services. A safety net service primarily serves populations with no other transportation options including low income, people with disabilities and seniors. The transit systems in Butte and Helena fall into this category. In contrast, transit systems such as Streamline and Missoula s Mountain Line are clearly community services that serve a much broader cross section of the community while still providing a safety net function. Nationally, data from the 1995 American Travel Survey found that bus riders are more likely to be young adults or seniors, have lower incomes, and lack alternative personal transportation. Previous users of bus, rail, or shared van are more likely to choose a bus for future trips. As the following data shows, Streamline follows this profile in some but not all categories.

54 4-12 Streamline Business Plan The following graphs summarize responses to on-board survey questions about who riders are and why they are using Streamline. Based on this data, several broad characterizations can made about Streamline s ridership: Riders are overwhelmingly MSU students, faculty and staff. This is largely because Streamline s service is MSU-centric, with routes and schedules designed to serve MSU students and employees. (Figure 4-6) A majority of riders are transit dependent (52%) they can t drive (12%) or do not have a car available (40%). Compared to other Montana towns, a large percentage are choice riders who own cars but choose to ride Streamline. (Figure 4-7 and Figure 4-8) Riders are overwhelmingly using Streamline to travel to and from work or school. Only 13% of riders using the service to access commercial areas for shopping. (Figure 4-9) Streamline s ridership age distribution tracks Bozeman s age distribution very closely. As predicted by national statistics, Streamline s ridership includes a higher percentage of young adults. However, in contrast to national trends ridership by seniors is very low. This anomaly is discussed in section below. A significant number of riders use bicycles to travel to and from bus stops. If the bus were not available 21% of riders would have made their trip by bicycle. While conducting on-board surveys we tallied 74 riders transporting bikes on the bus. It is important to note that in all cases there are dramatic differences between the populations served by different routes. Figure 4-6: What best describes your current status? (Survey questions #6)

55 Demographics and Needs 4-13 Figure 4-7: Rider access to vehicle (Survey questions #1) Figure 4-8: If bus service were not available, how would you make this kind of trip? (Survey questions #11) Figure 4-9: Trip purpose (Survey questions #2)
56 4-14 Streamline Business Plan Figure 4-10: Age distribution of Bozeman population compared to Streamline ridership (2010 census) (Survey questions #4 What year were you born? ) Riders Needs The best information about the needs of current riders is summarized in the graph and table below. Figure 4-11 summarizes riders responses rating their satisfaction with nine elements of Streamline s service. Table 4-2 summarizes responses to the survey s two open-ended questions: Question #12: I would use Streamline more often if Question #13: Do you have any additional comments on how Streamline may be able to serve you better? Based on these responses, a number of general conclusions can be drawn regarding the needs of current riders: Average satisfaction ratings fall between 3.4 and 4.5 on a scale of 1 to 5 with 5 being very satisfied. Overall satisfaction was also reflected in the high number of complementary comments in the open ended questions (89 comments). Based on both satisfaction ratings and open ended question responses, greater frequency of service was the greatest need. Frequency scored the lowest satisfaction level, and greater frequency was requested far more often (139 comments) than any other improvement in the open ended questions. On-time performance and comfort had the second lowest satisfaction ratings overall. However, in contrast to frequency, these two areas received relatively low numbers of requests for improvement in the open ended questions. (reliability: 21 comments / bus improvements: 27 comments)
57 Demographics and Needs 4-15 The second highest number of open ended question requests was for expanding service by adding additional stops to existing lines and/or areas that are not currently served. (93 comments) Longer hours of operation (primarily early evening), were requested a significant number of times in the open ended questions. (67 comments) Expanded weekend service was requested less than other forms of expanded service (58 comments). Of those requesting more weekend service, 16 specifically requested Saturday and 32 specifically requested Sunday. The majority of open ended question responses (357 comments out of a total of 623 comments) requested some form of expanded service increased frequency, geographic expansion, longer hours or weekend service. All of these issues are addressed in the sections below along with needs that were identified through other methodologies.
.")

58 4-16 Streamline Business Plan Figure 4-11: Rider satisfaction (Survey questions #7). Riders rated satisfaction on a 1:5 scale where 5 = Very Satisfied and 1 = Dissatisfied. Average ratings are shown.
59 Demographics and Needs 4-17 Table 4-2: Categorization of responses to the open-ended questions Answer Options Description Yellow Blue Green Red Livingston Response Count Frequency Expanded Service Route Design / Travel Time Longer Hours Saturday Saturday explicitely mentioned Sunday Sunday explicitely mentioned Compliments Customer Service Need Based Buses Reliability Better Outreach Additional runs on existing routes. Tweaks to schedule times. NOT new routes. Only geographic expansion / new routes. OR Additional stops on existing routes. Circular routes / Takes too long to get where I want to go. Earlier morning or later in evening. NOT higher frequency. Weekend Saturday, Sunday, or weekends mentioned Positive comments about Streamline as a whole. NOT compliments for specific drivers. Negative and positive comments specifically about customer service - mostly drivers "I would ride bus more if (specific personal circumstance)" Anything about comfort, cleanliness, ADA, or other physical issues with buses Runs early Runs late Don't understand schedule / don't know about real time or texting or those features don't work reliably Amenities ONLY bus stop amenties: benches, shelters, ADA etc % 20% 27% 25% 37% 24% % 19% 15% 16% 3% 16% % 1% 0% 5% 3% 3% % 13% 7% 10% 8% 11% % 1% 6% 4% 8% 3% % 8% 3% 5% 0% 5% % 10% 11% 10% 8% 10% % 13% 17% 15% 21% 15% % 4% 8% 4% 11% 6% % 9% 3% 5% 11% 7% % 5% 6% 5% 8% 5% % 3% 8% 5% 5% 4% % 4% 0% 5% 0% 3% % 3% 7% 1% 0% 3%
60 4-18 Streamline Business Plan 4.4 User Group Characteristics and Needs In-Town Routes / Yellowline, Blueline and Redline The best thing ASMSU does! Yellowline rider from on-board survey The daytime, in-town routes are the core of Streamline s service. While there is much similarity between the ridership on these three routes, each route also has some unique characteristics. All three lines had similar satisfaction levels with some variability in needs. Characteristics: Almost half are choice riders on Yellowline (48%) and Redline (45%). Blueline has significantly higher percentage who can t drive or don t have a car available (67%) Nearly half are students on Yellowline (49%) and Redline (48%), but only 28% of Blueline riders were students. Redline had the highest percentage commuting to work (38%). Blueline had by far the highest percentage accessing shopping (31%) compared to 8% for the other two in-town routes and 0% for the Belgrade and Livingston routes. Yellowline serving Bozeman Deaconess Hospital had 14% accessing medical care. All three lines had similar percentages of riders who identified themselves as MSU students, staff or faculty, with the Yellowline having the highest total percentage (79%). The Blueline had a significantly smaller percentage who were staff or faculty (8%), compared to 14% and 16% for Yellow and Red. The Blueline had a significantly higher percentage who were employed outside MSU (25%). Overwhelmingly, riders walked to access bus stops. Percentages were similar for all three routes with red highest at 91%. Median walking time was 5 minutes or less the for in-town routes. On all three routes, responses where roughly similar when riders were asked how they would make the trip if the bus were not available. The Yellowline had the highest percentage who would drive (31%) and also the highest percentage who would walk (29%). The Blueline had more than twice the percentage who would not make the trip (11%), compared to 5% for each of the other lines. Needs: Expanded Service Riders on all three lines requested expanded service. Frequency Frequency scored lowest satisfaction levels for all in-town routes, with the lowest score on the Redline. Longer Hours All had high numbers of requests for longer hours but Blueline had significantly more.
61 Demographics and Needs 4-19 Sunday Service Blueline had a relatively high number of requests for Sunday service. Travel Time Almost all the comments citing problems with travel time were from the Yellowline and Redline the two circular routes. Because these routes are one-way, with long travel times there are service gaps between downtown and the mall; downtown and the hospital; and the hospital and MSU. Service Coverage We identified several current and future service coverage issues. Current Coverage Based on 2010 data, areas of relatively dense housing without service include: o South 3 rd corridor o Areas to the west of Target and North 19 th o Isolated areas to the north and west of the Yellowline s northwest extent Future Coverage By 2030, most of the growth is projected to be in northwest Bozeman and in existing neighborhoods. In addition, the following areas will see growth: o North Rouse o South 19 th Belgrade & Four Corners / Greenline I really appreciate this service. It has saved us a lot of money. Thank you for making it happen and keeping it running. I don't know what we would do without it. rider comment from onboard survey The Greenline is heavily used and highly valued by its riders. However, currently neither the City of Belgrade nor Gallatin County are contributing funding for this service. While the majority of riders are currently Belgrade residents, there appears to be significant unmet need and opportunity in the Four Corners area. Characteristics: The Greenline has the highest MSU ridership of any route with 69% of riders describing themselves as MSU students, staff or faculty. The percentage of riders who are MSU faculty or staff (39%) is more than twice the percentage of any other route. The percentage of riders who are MSU students (30%) is the lowest of any route approximately half the percentage of the in-town routes. Trips are overwhelmingly for work 62% roughly equal to Livingston and far higher than in-town routes (39% MSU and 27% other employers). Trips for school were 28%, corresponding to the number of MSU students. 54% are choice riders second only to Livingston. 64% would drive (52%) or ride with friend/family (13%) if the bus were not available.
62 4-20 Streamline Business Plan At the same time, 52% said they can t drive or don t have a vehicle available, and Belgrade had by far the highest percentage of riders who would not make the trip if the bus were not available (21% compared to single digits for most other lines and 11% for the Blueline). Almost half drove to access the bus (47%) vs. low single-digits for in-town routes. An equal number (48%) walked or biked. Median travel time for driving and biking was 10 minutes, and for walking it was 5 minutes. Needs A wider range of needs were identified for this line than for other lines. These included significantly lower satisfaction levels than most other lines for frequency, on-time performance, comfort and bus stop locations. Park & Ride Many riders expressed frustration with the lack of a park and ride facility in Belgrade. This need is clear from the high percentage of riders who drove to access the bus; as well as the maps in our demographic analysis showing housing unit density and service coverage based on half mile walking distance from bus stops. Service Coverage Based on 2010 data for Streamline s service area, the largest areas of relatively dense housing without service include Belgrade and River Rock. This is reflected in the survey requests for more and better bus stop locations on this route. On-Time Performance On-time performance was a significant issue on the Greenline, likely due to construction on Jackrabbit Lane. Expanded Service Riders requested more frequency, more coverage, longer hours and weekend service with higher frequency receiving the most requests. Employment Several employers commented that increased service to Belgrade would be beneficial. The representative from Career Transitions, which is based in Belgrade, commented that their clients would be better able to find and hold jobs if there were more transportation options from Belgrade. Four Corners Service Four Corners is expected to be a high-growth area between now and We received a number of comments requesting service south of Four Corners. Additionally, several participants at our Business and Community Leaders Stakeholders meeting cited Four Corners as a location where a high quality, highly visible bus stop would be important, and would be likely to get support from business owners and residents who may be willing to help fund bus stop infrastructure improvements. Park and ride capacity would probably be important at Four Corners. Ideally, this would be coordinated with the Skyline bus service which currently has a park and ride stop at Cardinal Distributing (former Ice Garden). Simms Fishing and Zoot are two large employers located in the Four Corners area.
63 Demographics and Needs Livingston I love the service but last winter people were turned away for a lack of seats and I am last to get on at the hospital. rider comment from on-board survey The Livingston Route is heavily used and highly valued by its riders. However, currently neither the City of Livingston nor Park County are contributing funding for this service. Characteristics All riders were commuting to work (64%) or school (36%). By far the highest percentage of any route who were employed outside of MSU (48%). The lowest combined percentage of MSU students, staff and faculty (52%), with 37% students and 15% staff/faculty. By far the highest number of choice riders of any route (73% own a car), and the highest percentage who drove to access the bus stop (57%). Also the highest percentage who biked (14%). Median travel times were 5 minutes walking, 15 biking, and 8 driving. By far the highest percentage who would drive (72%) if the bus were not available. Also the highest percentage who would ride with friend/family (21%). Needs Seating Capacity This was the only line where riders expressed concern with lack of capacity. Promoting a ride sharing may be a good strategy for addressing this capacity issue: Park & Ride / Rideshare Park and ride capacity is clearly important based on the high numbers of drove to access the bus. However, this need currently appears to be met because riders did not identified it as a problem. At the same time, the high numbers of riders who said they would drive or ride with others indicates that a rideshare program could be a good alternative to Streamline s service if the current service proves not to be financially viable. A designated park and ride location would likely be important for a rideshare program. Expanded Service Riders requested more frequency, more coverage, longer hours and weekend service. The overwhelming majority of these requests were for higher frequency (14 requests) compared to a total of eight requests for all other forms of expanded service.


64 4-22 Streamline Business Plan 4.5 Transit Dependent Populations Transit dependent populations include people with disabilities, seniors, and low-income populations. Our primary sources of data and qualitative information about these populations include census data, on-board survey responses and information shared by Transportation Advisory Committee members Low Income Population In the Bozeman area below, low-income populations include those who are chronically lowincome, as well as a large number of MSU students who are living on very limited incomes with limited or no access to personal vehicles. Figure 4-13 shows the census tracts with high rates of poverty in darker colors People with Disabilities Figure 4-12: Percent of households in poverty Based on 2010 Census data, people with disabilities make up 12.1% of the population nationally, 13.3% in Montana, 8.1% in Gallatin County and 6.4% in Bozeman. The American Community Survey 3-Year Estimate of the disabled population in Bozeman is 2,372 total; 76 under 18 years; 1,331 between 18 to 64 years; and 965 individuals 65 years and over. The TAC member organizations appear to be well connected to populations of people with disabilities and are providing a wide range of services to these populations. For example, Eagle Mount Executive Director Mary Peterson commented that her organization has seen a 24% increase in people using their services. However, there was a general feeling that many people
65 Demographics and Needs 4-23 with disabilities probably the majority of this population are not using Streamline s services. While our on-board surveys did not specifically ask whether riders had disabilities, 14 riders identified themselves as disabled under other for question #6 What best describes your current status? Additionally, our surveyors tallied a total of 4 riders with wheelchairs and walkers who boarded the bus. These are very low numbers for the number of routes that were surveyed and the large number of surveys completed. TAC members felt there were several reasons for low ridership by their constituents and clients. They believe there is a general lack of awareness that can be addressed through targeted outreach and travel training. However, outreach efforts by themselves probably will not achieve the goal of increasing ridership by this population, because for people with disabilities it is essential for them to feel a high comfort level with using Streamline and this will require a combination of better driver training, improved equipment (ADA ramps that are not too steep, handles on both sides of bus doors, bus stop announcements that are visually displayed and clearly audible); bus stop amenities (concrete pads, shelters, etc.); and bus stop maintenance (specifically snow removal). Driver training is particularly important. Karen Benediktson of the Montana Association for the Blind described her personal experience to illustrate this point. She sometimes uses a walker and has routinely had to specifically request that drivers deploy the ramp. The drivers want to lift her walker into the bus instead of deploying the ramp. This does not comply with ADA standards and she said her constituency will give up and go home if that happens because they don t want to feel like a bother. It is also important to note that at the TAC meeting, Tracey Orcutt from DPHHS commented that many of her clients have told her they don t ride Gallavan because of the requested donation Senior Citizens As shown in Table 4-3, Bozeman has a low number of seniors compared to the state and the country, which is typical of college communities. (U.S. Census Bureau). Streamline also has a relatively low use by its seniors, with only 2.5% of people surveyed 65 years and over.. Table 4-3: Percent of Population 65 Years and Over, Geography Percent Bozeman 7.9% Gallatin County 9.5% Montana 14.9% United States 13.1% The low number of seniors riding Streamline is unusual compared to other Montana transit systems. For most transit services, the percentage of ridership by seniors is typically higher than the percentage of seniors in the service area population. Serving the senior population is an

66 4-24 Streamline Business Plan important element of Streamline s mission that is not currently being achieved. It may be worthwhile to conduct additional targeted outreach and research to determine why so few seniors are riding. A combination of the following factors may account for this anomaly: There may be a high level of satisfaction and comfort with Galavan and this service may be meeting much of the demand among this population. The lack of benches, shelters and ADA access at bus stops may be a strong disincentive. Seniors who have a hard time stepping on and off buses may be unwilling to request deployment of the ramp. Also, we received comments that all buses should have two handles (one on each side) of the doorway and this may be a barrier. Difficulty understanding Streamline s printed schedules may be a barrier. There may not have been enough marketing targeted at this population to raise their awareness level and their comfort level with using Streamline s services. Marketing may be particularly important with this population because Streamline is still a relatively new service and seniors are slow to change their behavior. Figure 4-13: Percent of population over 65
67 Demographics and Needs Montana State University Students, Faculty and Staff A significant portion of Streamline s ridership is MSU students, staff and faculty. All of the peer communities we chose have universities that are a significant source of transit system riders. In all cases, this high university-related ridership can be attributed to a combination of route design; fare free service; targeted marketing; limited and tightly regulated on-campus parking opportunities; and the fact that students and staff represent large populations with relatively low-incomes; many of whom have limited or no access to reliable personal vehicles. 64 % of current riders are MSU as shown in Figure 4-6, with large variations by route. MSU Demographics MSU is by far Bozeman s largest employer and faculty and staff numbers in combination with student enrollment represent a very large pool of riders and potential riders. The fall semester of 2012 had a total enrollment of 14,660 students. Of these, 11,167 (76%) attended full time and 3,493 (24%) attended part time. Based on a fall 2012 snapshot of the personnel file, MSU employs 3,054 permanent faculty and staff, and 616 graduate teaching and research assistants. Of the 3,054 permanent employees, 2,334 are full time and 720 are part time; 1,374 are men and 1,680 are women. Total faculty number is 1,154, which includes 781 full-time and 373 part-time faculty and department heads, (includes 917 instructional faculty and 237 faculty in administrative/managerial, research and service positions). Classified, professional, and service staff number 1,900. (Montana State University, 2012) Route Design and Frequency Streamline s current system is very MSU-centric. Based on rider surveys and comments at our MSU focus group meeting students, staff and faculty are generally happy with the current routes. However, they would like greater frequency and longer hours especially early evening hours and Saturday service. There was interest in expanding service south of Four Corners, south of Kagy and on 11 th street. At the focus group meeting, the strongest and most broad-based interest in expanded service was for a connection to the airport. Schedule timing was very important to MSU riders especially the need to coordinate arrivals and departures at the SUB with class time. Students also expressed strong support for the Latenight service. There was also strong interest in improved bus stop amenities including shelters, better ADA access, bike racks, and a park and ride facility in Belgrade. Football Service A number of peers including University of Montana offer shuttle service to football games and see large ridership numbers from this service. Streamline could potentially run a shuttle between downtown and the Kagy & 3 rd (South Towne Square) stop and/or from the Mall. This opportunity would require further research to see how peer communities have structure the service to avoid charter regulations. Fare Free Service MSU riders expressed strong support for fare free service. All the peers we chose are fare free for students. Nationally, university and ski resort communities are most likely
68 4-26 Streamline Business Plan to be fare free for the general public, except in case like California where state rules requiring farebox revenue preclude fare free service. All the peers we chose that operate fare-based systems offer fare-free service for students based on funding partnerships with their local universities. This includes the CA peers because CA rules allow funding contributions such as ASMSU s to be counted as farebox. Marketing and Communications Comment s from MSU riders indicated the need for improved marketing and communications. There appear to be opportunities for improvement at many levels. Riders commented that the schedules on bus stop signs are often not up to date; it is hard to learn about schedule changes; there is no schedule posted prominently in the SUB or anywhere else on campus; the published schedules (hard copy and web) are hard to figure out; it is hard to tell which bus is which from the SUB entrance where riders shelter during bad weather; many were not aware of the texting and real time tracking features or found them unreliable. In summary, Streamline s service is greatly valued by MSU riders, and they would like to see increased service if possible. One rider commented on an on-board survey that The service is priceless the best thing ASMSU does. It is worth noting that one international student who attended the focus group meeting emphasized how valuable the service is for international students who do not have cars and commonly use public transit in their native countries. 4.7 Coordination with City Planning and Public Works Departments: City planning and public works departments are essential partners for installing bus stop infrastructure. They are also important partners for designing routes and ensuring that bus stops are sited in safe locations. Current Transportation s interviews with Bozeman Planning Department staff focused on the communication and information city staff need in order to develop a more productive working relationship with Streamline so that they can work collaboratively to help Streamline succeed. As is typical of new transit systems and systems with very limited funding, Streamline s bus stop infrastructure is substandard or non-existent in most locations. Because of the substantial cost of these amenities, most transit systems develop this infrastructure incrementally over time in partnership with local government, businesses and other partners. New commercial and residential development, road improvement projects, and sidewalk construction all offer opportunities to install important bus stop infrastructure improvements including bus pull-outs, shelters, benches, lighting, bike racks, concrete pads and other features necessary for ADA access. Factors driving the need for these amenities in Bozeman include the area s long, dark winters; the relatively large number of bicyclists riding Streamline; and social service agencies desire to increase ridership by the elderly and people with disabilities as expressed by TAC members.
69 Demographics and Needs 4-27 Additionally, because of Bozeman s rapid growth rate, it is important to plan for future bus routes when larger developments are proposed in high growth areas of the community. For example, it is far easier to design a street with space reserved for a future bus pull-out than to try to retrofit a street by installing a pullout several years after development is complete. Similarly, it is a relatively insignificant condition to require a developer to install a concrete pad for a potential bus stop at the same time that they install other street infrastructure. In contrast, a more involved process as well as a funding source will be required to retrofit a right-of-way after development is complete. It is important to note that some developers and business owners may be enthusiastic about installing bus stop infrastructure that benefits their current or future customers, employees or residents. Detailed notes from this interview are incorporated into Appendix A. 4.8 Commercial Areas & Large Employers Commercial areas and large employers are major trip generators and should be served by transit to the extent possible. For many transit services, large employers are also important funding partners. Additionally, regardless of whether businesses help to directly fund transit services, their political support is important for maintaining local government funding. Streamline s service is designed to serve many of Bozeman s most significant commercial areas and large employers including Downtown, the Gallatin Valley Mall, MSU, Bozeman Deaconess Hospital, commercial centers on 19 th Street, Walmart, and the Hastings Center. However, conversations with business community leaders indicated a disconnect between the business community and Streamline. The City of Bozeman s Economic Development Liaison, Brit Fontenot commented that Streamline never comes up in his conversations with the business community. Additionally, Downtown Bozeman Partnership Executive Director, Chris Naumann commented that Downtown businesses do not feel a strong sense of connection to Streamline s services. Our on-board surveys showed that a large percentage of riders are using Streamline to travel to and from work (36%), and more riders are employed outside MSU (19%) than at MSU (14%). In contrast, a relatively small percentage of riders are using Streamline to travel for shopping (13%). Most of these riders are using the Blueline, which had 31% of riders describing the purpose of their trip as shopping. Our Business, Local-Government and Community Leaders Stakeholders Meeting provided a number of insights into potential opportunities to improve Streamline s service and connection to the business community. Four main themes emerged from this meeting: Employer partnerships Some Employers are interested in partnering financially or otherwise to provide improved service for their employees and customers. Some may even be willing to play a leadership role in the business community.
70 4-28 Streamline Business Plan Need/Demand for Service Beyond City Limits Participants felt there is significant need for transportation services for employees and customers living in the county and nearby communities. Similarly, businesses located outside Bozeman have significant numbers of employees and customers who live in town. The need is particularly great between Bozeman / Four Corners / Belgrade. Serving Commercial Areas vs. MSU While there is universal appreciation for the value of MSU to the area s economy and the importance of Streamline s service for MSU, there is a feeling that while MSU is being well-served, there are opportunities that are being missed to better serve the community s commercial areas. Participants were particularly interested in better connections between Downtown, the Gallatin Valley Mall (which is connected to Big Sky via the Skyline Bus), the high concentration of large hotels on 19 th, and the airport. Participants believed these connections could serve both visitors/tourists and residents. Marketing, Awareness & Community Interaction There needs to be greater awareness of Streamline s services and the opportunities those services offer among residents, visitors, employees and employers. This ranges from basic awareness that Streamline exists to awareness of how employers can partner with Streamline. Participants cited examples including the need for visible, attractive bus stops; the Mall s interest in doing creative marketing to promote Streamline as an option for getting to the Mall for holiday shopping Santa rides Streamline ; and the idea of key businesses being leaders in promoting partnerships with Streamline. 4.9 Downtown Downtown Bozeman is the center of the region s economy, with the highest concentration of jobs, retail, and entertainment. The Bridger Park Garage, with 435 vehicle spaces, 10,000 square feet of commercial space, and a Streamline transfer station, is the second highest used stop in the system. The goals of downtown align with Streamline goals, with the Downtown Bozeman Improvement Plan placing an emphasis on complete streets, environmental sustainability and public transportation. Finally, downtown relies on Streamline to offer transportation alternatives for high attendance special events and for late night The Downtown Bozeman Partnership identified the following priorities: #1 Priority: Airport Connection to Downtown Regardless of whether this service is provided by Streamline it needs to happen someway, somehow. #2 Priority: Better Big Sky Connection to Downtown This could have significant positive economic benefits for downtown. Some Big Sky tourists are very interested in spending time in Downtown Bozeman, but currently the Skyline-Streamline connection to Downtown is not convenient enough. #3 Priority: Better Connection Between Large Hotels and Downtown This is a stretch considering the major hotels all have on-call van shuttles.

71 Demographics and Needs 4-29 Figure 4-14: Streamline Bus at the Bridger Park Garage 4.10 Infrastructure The indoor waiting room space at the Downtown transfer center is underutilized according to Chris Naumann, Executive Director of the Downtown Bozeman Partnership. He believes there are two reasons for this: 1) Many riders are not aware that it is there because the facade of the building angles away from the bus pull-in lane.he recommends installing a sign that sticks out from the front of the building so that someone looking down the sidewalk will see it. 2) Even though the waiting room has a floor-to-ceiling window, the slight westward angle of the façade prevents waiting riders from being able to see buses approaching from the west. At the same time, if drivers don t see anyone waiting they pull in and out very quickly, so riders are understandably that they will miss their bus or cause a delay if they wait indoors. Naumann recommends installing a video screen with the real time bus tracking display, or a much lower-tech approach such as a speaker or just a flashing light to alert riders that a bus is about to arrive. Design Problems: Find opportunities to rework the design. Work with the Downtown Bozeman Partnership and City on any efforts to redesign Mendenhall and develop the old Kenyon Noble facility. The current situation is not ideal because:
72 4-30 Streamline Business Plan o o o o o The island is too narrow in places to deploy the ramp and allow a person in a wheel chair to use the ramp. The narrow lane results in buses regularly hitting the curb, leading to axle problems. The first in, first out configuration does not allow buses to depart until the bus in front of them departs, even if they are ready to go while the other bus must wait. The capacity is limited to three buses. Fixes If there is an opportunity to reconfigure the block for a right-side exit, take it. This could be either if the City chooses to reconfigure the road into a two-way or reverse the direction. The block would be ideal for a transit oriented design and walkable entertainment plaza. Look at configurations in Missoula and Billings, San Luis Obispo for communities with similar downtown configurations Funding Opportunities Related to Coordination Streamline should continue to develop relationships and explore the potential for partnerships with the groups that attended our stakeholder meetings and interviews. Stakeholder comments and discussions identified a number of potential opportunities to expand service and funding. The following list includes key groups. Bicycle groups MSU Skyline Rimrock Trailways (intercity service) Linx Bozeman Deaconess Hospital Montana Association for the Blind Montana Department of Public Health and Human Services Montana Department of Transportation Montana Independent Living Project City and county elected officials Transportation Coordinating Committee Local tourism organizations 4.12 Tourists, skiers, and recreational travelers Nearly 10 million nonresident travelers visited Montana in The largest portion of the estimated annual $2.27 billion nonresident expenditures goes to gasoline and oil (32%). By
73 Demographics and Needs 4-31 comparison, transportation fares comprise only 1% of expenditures. Montana ranked fifth nationally in per-capita tourist receipts in 2008, according to the US Travel Association. The majority of vacationers are drawn to Montana because of the state s mountains, forests and rivers, as well as Glacier and Yellowstone National Parks. Other attractions include open space and un-crowded areas, wildlife, and western culture. Attractions for vacationers during the 3 rd and 4 th quarter are quite similar. (Institute for Toursm and Recreation Research, 2010) The Bozeman area is a gateway to Yellowstone National Park and offers a wealth of all these tourist attractions Tourist Riders Nine out of the 567 rider survey responses came from tourists or people self-identified as visitors, indicating a low tourist use during our survey period. Four on-board survey respondents identified themselves as tourists, while an additional five identified themselves as visitors. The survey was conducted in October, which is at a low point in tourism. Surveys in January and July would offer a better understanding of the current use by this group if Streamline were interested in a better understanding. This group offers a good outsider s perspective on Streamline service. Their responses highlight the value of coordinating with community partners, and help understand how visitors and tourists find information and use daytime routes. Tourists and visitors ranked Streamline lower than the overall ridership in the areas of frequency (3.0 vs. 3.8), bus stop locations (3.3 vs. 4.2) and overall service (4.1 vs. 4.4). In the areas of cleanliness, safety, comfort, availability of seating, on-time performance, and driver courtesy the tourists and visitors ranked Streamline higher. Eight of the nine were on the blue line, while the last rider was on the red line. The responses comments highlight the need for good information distribution and the desire for more service. When asked Where did you look up schedule information for your trip? this group included more diverse sources than regular riders: Greyhound station from talking to people ask drivers Using a printed schedule (5) By phone At the bus stop The open-ended comments suggest improved coordination with the Chamber of Commerce, better bus stops, and more service.
74 4-32 Streamline Business Plan The girl at the Chamber of Commerce doesn't even know where the nearest bus stop is, so I lost a lot of time to find one stop! (Give her the information, please!) the bus stops aren't easy to see. (tried to find bus from Chamber of Commerce) more buses more destinations and more lines more buses Bridger Bowl and Bohart Ranch The ski towns of the Rocky Mountains rank among the top of the 1,500 rural transit systems in measures of ridership, levels of service, investment, and efficiency (see Table 4-4). Investment in transit in ski areas fit so well because of the nature of the destination as a major attractor; an understanding of the customer, many of whom appreciate not having to drive on icy roads or find parking; limitations in the amount of parking; and a commitment among ski areas to do their part in reducing greenhouse gasses. Soon after Skyline started service in and to Big Sky in 2006, Bridger Bowl and Bohart Ranch partnered with Streamline to provide weekend bus service. Bridger Bowl would like to get more people riding the bus, in part because of its limited parking. Assessing the needs of skiers is not within the scope of this project. To dig deeper we recommend an onboard survey during ski season, although one challenge in conducting a survey is that we estimate half of the riders are under 18. Table 4-4: Public Transportation in Rocky Mountain Ski Towns SUB-RECIPIENT NAME City Ops Budget Miles Hours Regular Trips Px/Hr (Tot) Investment per Capita (central city) Big Sky Transportation District Big Sky, MT $756, ,805 9, , $ City of Glenwood Springs Glenwood $1,117, ,413 12, , $ Springs, CO City of Durango Durango, CO $2,587, ,686 33, , $ Southern Teton Area Rapid Jackson, WY $2,358, ,652 30, , $ Transit Town of Breckenridge Breckenridge, CO $2,129, ,114 26, , $ City of Steamboat Springs Steamboat $2,627, ,857 40,088 1,071, $ Springs, CO Mountain Express Crested Butte, CO $1,454, ,531 15, , $ Eagle County Regional Gypsum, CO $6,293,299 1,241,589 53, , $ Transportation Authority Summit County Board of Breckenridge, CO $8,153,986 1,420,151 79,223 1,705, $1, Community Commissioners Park City Municipal Park City, UT $7,865,515 1,224,127 78,182 1,857, $1, Corporation Roaring Fork Transportation Glenwood $20,152,163 2,942, ,438 3,369, $2, Authority Springs, CO Gunnison Valley Crested Butte, CO $431, ,432 3,786 70, $ Transportation Authority Mountain Rides Transportation Authority Ketchum, ID $2,241, ,478 34, , $831.89
75 Demographics and Needs Three Forks / Manhattan The team was asked to assess the demand, benefits, costs, and alternatives for service between Three Forks / Manhattan and Belgrade/Bozeman. Compared to Livingston, Three Forks and Manhattan have about 67% of residents working outside the area and 60% of the jobs within the area. More detailed patterns for Three Forks/Manhattan compared to Bozeman/Belgrade, and Livingston are illustrated in the following table (U.S. Census, Center for Economic Studies, 2012). The following characteristics were identified from the U.S. Census Longitudinal Employer Household Dynamic (LEHD) based on 2010 data 1,735 people of working age live in the Three Forks/Manhattan area compared to 4,324 in Livingston and 35,783 people in the Bozeman/Triangle area. 606 people live in Livingston and work in Gallatin County. Approximately 500 people live in Three Forks/Manhattan and work in the Bozeman/Belgrade area. Because of the high-stress driving conditions on Bozeman Pass and the compact land use of Livingston compared to Three Forks and Manhattan, we expect higher per capita use for transit service from Livingston compared to Bozeman. Using Equation 2 discussed in Chapter 3, modeled ridership for Three Forks would be 12 rides per day, or 2/3 Livingston demand of 18.


76 4-34 Streamline Business Plan Three Forks / Manhattan (based on labor force who LIVE in TF/Manhattan) Bozeman / Triangle (based on labor force who WORK in Bozeman/Triangle) Livingston (analysis based on labor force who LIVE in Livingston) Figure 4-15: Relative commute patterns for three communities Three Forks/Manhattan, the Bozeman triangle, and Livingston
77 Demographics and Needs Scenarios for potential changes Fourth in-town route add a route to improve connections from the hospital to downtown and MSU, and from the mall to downtown. The round-trip distance between the hospital and mall via Haggerty Lane is 8.8 miles; the round trip distance from the hospital to Four Corners via Hagerty Lane is 12.2 miles. Nationally, the average urban bus runs 12.7 miles per hour, making this corridor a good distance for a one-hour route. This new route would allow redesign of the existing Redline and Yellowline east since those two routes currently serve the corridor with inefficient circular routes. Benches and shelters shelters at 15 locations at $8,000 to $10,000 each; benches at 20 additional locations at $1,000 to $3,000 each. Annual update of bus schedules at 100+ stops. Replacement of bus stop signs. Requires establishment of a program to empty trash, remove snow, and keep street furniture clean. Airport Instead of establishing a Streamline route, facilitate coordination between the DBP, Economic Development office, and a private carrier to establish a price guarantee program that allows for transportation by private shuttle between Bozeman and the airport at a price, say $15 per ride. In theory this could be operated as an FTA funded Streamline general public demand response service and can be somewhat tied to the intercity route between Bozeman and West Yellowstone. This is suggested instead of operating Streamline because of the difficulty in matching fixed route schedules to airport customer and employee needs. Fifth in-town route reconfigure routes to cover South 3 rd neighborhood, northwest neighborhood, and the neighborhood west of Target. Increase Belgrade services by 2 hours per day. We recommend not increasing service unless local funding from Belgrade and Gallatin County increases, or a UTD with mill levy is established. Increase Livingston services by 3 hours per day (morning, noon, evening. We recommend not increasing service unless local funding from Livingston and Park County increases, or Livingston is included in a UTD with mill levy. Three Forks/Manhattan Option 1: serve with a vanpool or carpool program. Option 2: commute bus route, which could have the added benefit of improving service through Belgrade and North 19 th. We recommend not increasing service unless local funding from Gallatin County increases, or a UTD with mill levy is established. Transportation options establish a Transportation Demand Management program that promotes transportation options and coordinates vanpools or carpools. Include a guaranteed ride home program. Missoula in Motion offers a good model to emulate. Fares should remain fare free for Bozeman services; consider charging a fare for Livingston and Belgrade in exchange for funding contributions from those communities.
78

79 Equipment Equipment Overall, Streamline s fleet is meeting current needs and maintenance and operations costs compare favorably to peer systems. However, Streamline s buses are substandard compared to most peers and our rider surveys, stakeholder outreach and Maintenance and Operations Review all identified problems and opportunities to improve the current fleet. Additionally, Streamline s ongoing success has resulted in a trend of steadily increasing annual ridership, which means that greater rider capacity will likely be needed within the next five years. These factors all converge on the most challenging question discussed in this section whether it would be realistic to work with MDT to upgrade Streamline s fleet to 12-year, heavy duty transit buses. This section summarizes fleet maintenance and procurement issues based on information provided by Streamline and Karst, our peer review, independent research, rider and stakeholder comments, and the observations and recommendations from the Maintenance and Operations Review and Assessment conducted by Steve Earle and John Roseboom of Missoula (see Appendix C for the full documentation of the review and assessment). 5.1 Vehicle Inventory Streamline has a fleet of 12 vehicles and Galavan has 9 vehicles as shown in Table 5-1. The overall condition of the Streamline fleet is fair, and the body-on-chassis vehicles do not seem robust enough for the job they are required to do. Streamline purchased all of its current vehicles with the Figure 5-1: Streamline Bus assumption that they would be operated for approximately 10 years, 350,000 miles based on the Altoona test category; since then MDT has assigned an 8-year, 300,000 lifespan to this bus category for its capital planning purposes. When these vehicles are due to be replaced, their total costs will most likely fall within the average for transit vehicles rated for a 10-year lifespan. However, these were relatively low-cost vehicles when they were purchased, so Streamline is now experiencing relatively high maintenance costs as the fleet ages. Some of the current costs appear to be due to mechanical failures that are consistent with fleet defects.
80 5-2 Streamline Business Plan GV#5 Cutaway Ford Supreme 168,377 n/a % 84% 9,354 GV#8 Van Chevrolet Goshen Coach 176,554 n/a % 126% 17,655 GV#10 Cutaway Cutaway 151,264 n/a % 76% 21,609 GV#11 Cutaway Chevrolet Goshen Coach 148,576 n/a % 74% 24,763 GV#12 Cutaway International Bus 13,388 n/a % 7% 2,678 GV#13 Minivan Chevrolet Uplander Van 60,721 n/a % 43% 15,180 GV#14 Cutaway Ford Starcraft Allstar 65,219 n/a % 33% 21,740 GV#16 Cutaway Freightliner 19,269 n/a % 10% 6,423 GV#15 Minivan Dodge Sprinter ,253 n/a % 34% 15,751 Table 5-1: Vehicle Inventory SL#7 Bus International TK 104,493 Fair % 35% 14,928 SL#8 Bus International TK 86,023 Fair % 29% 12,289 SL#9 Bus International TK 77,126 Fair % 26% 11,018 SL#10 Bus International TK 59,757 Fair % 20% 8,537 SL#1 Bus International Ameritrans Bus 164,808 Fair % 55% 32,962 SL#2 Bus International Ameritrans Bus 151,832 Fair % 51% 30,366 SL#3 Bus International Ameritrans Bus 147,463 Fair % 49% 29,493 SL#4 Bus International Ameritrans Bus 149,380 Fair % 50% 29,876 SL#5 Bus International Ameritrans Bus 129,434 Fair % 43% 25,887 SL#6 Bus International Ameritrans Bus 118,691 Fair % 40% 23,738 SL#11 Bus ICRP 3,715 Excellent % 1% n/a SL#12 Bus ICRP 6,359 Excellent % 2% n/a ID Vehicle Type Vehicle Length Seating Capacity Manufacture Year Manufacture Model Mileage as of 3/31/12 Condition Lifespan (Years) End of Useful Life % of Lifespan by Years % of Lifespan by Mi Annual Miles [Bozeman Peer Data.xlsx]HRDC Inventory
81 Equipment Vehicle Maintenance Program, Documentation and Costs The Maintenance and Operations Review found that Streamline s fleet is being well maintained at a reasonable cost. The main issues identified involved management and documentation. Maintenance Cost Targets Based on our peer review (Table 5-2 and Appendix C), Streamline s maintenance cost targets should be less than $0.96 per revenue mile and 19% of total operating expenses. With a FY 2012 maintenance cost of $0.61 per revenue mile and 15% of budget, Streamline is currently exceeding these benchmarks Staff should produce periodic reports for the board documenting these benchmarks. Table 5-2: Streamline and Galavan Maintenance Expenses Compared to Peers Expenses % of Operating Expense Peer Median Expense per Mile Peer Median Streamline $171,302 15% 19% $0.61 $0.96 Galavan $17,508 3% 16% $0.16 $0.41 Maintenance Facility Both the shop and the parts room are too small for the equipment being worked on and could be better organized. Documentation Standard Federal Transit Administration documentation regarding maintenance programs could be done more thoroughly. Streamline and Karst have not created a Maintenance Policy and Procedures Manual and some maintenance and inspections records are lacking or could be better designed for transit vehicles. Maintenance Plan The primary maintenance recommendation in the Maintenance and Operations Review is to develop a Maintenance Plan that addresses the documentation issues including the need for a Maintenance Policy and Procedures Manual. Please refer to Appendix C for suggested contents of the plan and outlines for sample documents. 5.3 Maintenance Contract Options The Streamline Board has discussed the option of having the city shop perform some or all of its vehicle maintenance. Table 5-3 summarizes the pros and cons of this maintenance option assuming that the bus service will continue to be operated by a private contractor. In combination, all the factors summarized below strongly indicate that unless there are serious concerns with the operations contractor s maintenance work, the best option is to continue to have the service operator also be responsible for maintenance. The Maintenance and Operations Review states that the overall maintenance costs for the current fleet would increase considerably if Streamline decided to maintain the vehicles at the city shop or if Streamline built a facility capable of conducting maintenance in-house with Galavan.
82 5-4 Streamline Business Plan Table 5-3: Comparison of Maintenance Options Factors to Consider Cost Maintenance facility space Maintenance facility location Adequate care of vehicles Supervision Regulatory record keeping requirements Private Contractor (service operator) Lowest. In FY 2012, maintenance cost was $0.61 per mile, much lower than the peer median of $0.96 per mile. The current maintenance facility and parts room are functional but smaller than they should be. It is more efficient for maintenance and operations to be located in the same facility It is preferable to have the service operator conduct maintenance because of their detailed knowledge of the vehicles, and the strong incentive to ensure that the vehicles are running safely and reliably. City Expected to be higher More space available Physically separating maintenance and operations is likely to create inefficiencies and communication challenges It would be important to assess whether the City s mechanics have an adequate level of expertise and experience to ensure good care of Streamline s specialized vehicles. Also, good working relationships with strong communications between Streamline, the operations contractor and the City would be essential. Supervision by Streamline is important in either scenario to ensure that maintenance standards are being met. We have no basis for asserting that supervision would be more or less challenging under one option or the other. This is an area where oversight by Streamline is essential. Karst is still learning these requirements and needs to improve their record keeping. However, the City has no experience with MDT/FTA record keeping requirements and would also have to learn these requirements and create systems to ensure adequate record keeping. 5.4 Equipment Issues Riders, stakeholders and the Maintenance and Operations Review identified a wide variety of issues with the buses. However, a relatively small percentage of the public comments focused on the buses. Most issues were relatively minor and almost all are related to the low-cost, lowquality buses Streamline has procured through MDT. The most significant issues appear to be recurrent wheel end failures and issues with the ADA ramps on the newer buses. Wheel End Failures Half of the buses are experiencing recurring problems with wheel end failures. Parts are difficult to get and this is a costly repair that removes the bus from service for several days. This appears to be a fleet defect that could be pursued with the equipment contractor.
83 Equipment 5-5 ADA Equipment The wheelchair ramps in the two newer vehicles had very steep and difficult angles, and the ramp controls are located on the outside of the bus, requiring the driver has to get out of the bus in all weather conditions to deploy the ramp. Also, several riders commented on the importance of having two handles one on each side of the door. There are related issues concerning driver training discussed in other sections and in the appendices (Maintenance and Operations Review and TAC meeting notes). Ease of Use In addition to ADA issues, a number of comments focused on improvements that could be made to make it easier to use the buses. These comments included limited bike rack capacity; difficulty differentiating between buses at the MSU SUB; and the need for stop request pull cords on all buses. Comfort By far the largest number of public comments focused on comfort. These included comments about the bus being too hot or too cold; need for better air circulation; comfort of the seats; and the rough ride on the Belgrade route. Capacity Only a few riders cited lack of seating capacity as an issue, but this is an issue that Streamline should monitor closely if ridership continues to increase. Air Conditioning The Maintenance and Operations Review cited issues with frequent air conditioning maintenance needs and the location of the air conditioning units on some buses. Winter Operation The vehicles have very low clearance, which poses problems in the winter with snow. Additionally, the board has expressed concerns with the difficulty of budgeting for maintenance because a high-snowfall winter could result in a spike in maintenance costs. 5.5 Vehicle Replacement Options All the buses in Streamline s fleet are body-on-chassis vehicles that are constructed by building a bus body on a stripped truck chassis. While tested 2 at the 10-year, 350,000-mile lifespan level, for capital planning purposes MDT uses an 8-year, 300,000-mile lifespan. The General Manager at Mountain Line in Morgantown, WV described body-on-chassis buses as maintenance nightmares with frequent breakdowns. In contrast, nearly all the peer systems we reviewed use heavy-duty, 12-year, 500,000-mile buses, especially for their high-use, in-town routes. These buses are custom built from engineering through production for the sole purpose of being a bus, and thus have better usability and robustness. A full discussion with photos of vehicles at peer communities is included in Appendix D. 2 Under the FTA Bus Testing Program, referred to as Altoona Testing because of the location of the facility in Altoona, Pennsylvania, testing is required on all new model buses before they can be purchased with federal funds. There are no minimum performance standards for the tests nor are the tests rated "pass" or "fail. Rather the test results are a decision-making tool for purchasers to compare performance such as the time for common maintenance tasks and the amount and type of unscheduled maintenance activities. The manufacturer chooses the lifespan category; the tests are the same between lifespans, but the test durations change.

84 5-6 Streamline Business Plan Figure 5-2: Fixed route buses at the Butte-Silver Bow Transfer Station The initial cost for a body-on-frame heavy-duty bus is significantly higher than the body-onchassis bus, but the annual cost calculated based on mileage lifespan is approximately the same as illustrated in Table 5-4. Assuming 33,000 miles per year, Streamline can expect a heavy-duty bus to last 15 years compared to 9 years for its current bus. The current MDT estimated purchase price is $320,000 for a heavy-duty body-on-frame bus and $195,000 for the 35- passenger body-on-chassis bus used by Streamline. The calculated annual capital cost for both vehicle types is $21,000 per year. Table 5-4: Comparison of Lifespans and Annual Capital Costs for Altoona categories Lifespan for planning purposes Annualized lifespan mileage Expected 33,000 mi per year Cost Capital cost/year Body-on-frame years, 500,000 year, 500,000 mi mi 41, $320,000 $21,120 Body-on-chassis years; MDT uses year, 350,000 mi 8 years, 300,000 miles 37, $195,000 $21,450 7 year, 200,000 mi 7 year, 200,000 mi 28, year, 140,000 mi 5 year, 140,000 mi 28, Not analyzed 4 year, 100,000 mi 4 year, 100,000 mi 25, [Bozeman Peer Data.xlsx]HRDC Inventory
85 Equipment 5-7 It will be difficult to upgrade Streamline s fleet due to limited funding available from FTA through MDT 3. However, it is important to note that Butte has succeeded in working with MDT to acquire 12-year buses as illustrated in Figure 5-2, and to replace them in We recommend discussing all possible options with MDT. In all cases it will be important to work closely with MDT on designing specifications for new buses that address the issues with Streamline s current buses. Potential options for future bus purchases are: Heavy-Duty, 35-Foot, 12-Year Buses Altoona-tested 12-year vehicles are recommended in the Maintenance and Operations Review. These vehicles hold approximately 75% of the transit market and cost approximately $320,000. Table 5-5 shows a replacement cycle of two twelveyear vehicles per year for a six-year period. Year Seating capacity Table 5-5: Streamline Vehicle Replacement Schedule Based on 11-bus fleet Bus Type Lifespan End of Useful Life ICRP body-on-chassis $372, body-on-chassis already ordered $585, heavy duty 12-year buses $659, heavy duty 12-year buses $699, heavy duty 12-year buses $741, heavy duty 12-year buses $787,119 3% inflation per year with 2013 as base year buses are in operation and 2013 buses have been ordered. [Bozeman Peer Data.xlsx]HRDC Inventory Cost 3 Changes in MAP-21 that eliminate discretionary funding (earmarks and competitive processes) in favor of formula funding results in a small state such as Montana with limited annual budgets to support a relatively large purchase.


86 5-8 Streamline Business Plan Figure 5-3: Most peer communities use 12-year buses. Some use hybrids and vehicles especially suited for their community. Better Specifications for Body-on-Chassis Buses If Streamline s only option is to continue purchasing the type of buses it is now operating, a strong effort should be made to work with MDT to improve the specifications that are being used.
87 Organization and Management Organization and Management Streamline is administered by the Human Resource Development Council (HRDC) in partnership with the Associated Students of Montana State University (ASMSU). Streamline and Galavan are managed by Lee Hazelbaker, HRDC Transportation Program Manager. Streamline is operated under contract to Karst Stage. HRDC directly operates Galavan. Streamline and Galavan have an active board with representatives from ASMSU, riders, local businesses, the City of Bozeman, and the community. An Organizational chart for HRDC Transportation is shown in Figure 6-1. Table 6-1 shows the full-time equivalents and labor costs. HRDC Board of Directors Chief Executive Officer Transportation Advisory Committee Streamline Advisory Board Transportation Director Contracted Fixed Route Manager Dispatch Demand Response Drivers Accountant Contracted Fixed Route Drivers Figure 6-1: HRDC/Streamline/Galavan organization chart

88 6-2 Streamline Business Plan Table 6-1: Current full-time Equivalents and Salaries Split between Streamline and Galavan Position Notes FTE (per organizational chart) Salaries (FY 2012 Expenses) Total SL Gal Total SL Gal Administration HRDC CEO 20% direct charge Accountant / Admin Transportation Director Transportation Coordinator eliminated in FY Administration Subtotal $152,649 $134,539 $18,110 Operations Dispatch/Office Manager 1 FTE/job share Galavan Drivers Operations Subtotal $210,697 $36,279 $193,308 Total $363,346 $170,818 $211,418 [organization.xlsx]organization The largest investment in Streamline and Galavan is through the Federal Transit Administration s (FTA) 5311 Formula Grant for Other than Urbanized Areas, consisting of 55% and 60% of revenue. The Montana Department of Transportation (MDT) administers the 5311 program. Figure 6-2 summarizes the organizational structure for rural transportation that applies to Bozeman. FTA Regulations (MAP 21) Montana DOT Transit Section Administers programs (5309, 5310, 5311,) 5311 Subrecipient: Public or private nonprofit Figure 6-2: FTA Funding Hierarchy 6.1 Options for Public Transportation Entities in Montana Four organizational alternatives exist under FTA regulations and Montana law for the provision of non-urbanized public transportation: county government, city government, Urban Transportation District (UTD), or a private non-profit organization. Viable alternatives as the Gallatin Valley and Streamline continue to grow include remaining as a program of the HRDC, becoming a department of the City of Bozeman, or forming an independent UTD. The advantages and disadvantages for each of these options are summarized in Table 6-2.
89 Organization and Management 6-3 Table 6-2: Organizational Alternatives Alternative Advantages Disadvantages HRDC/Non-Profit Organization City department (e.g. Butte, Helena, Billings) Urban Transportation District (e.g., Missoula, Big Sky, Great Falls, Glendive) Long history providing transportation. Excellent fit with the needs of other HRDC programs; transportation regularly ranks highly in user need surveys at social service programs across the country. Structure is in place to support the business needs of Streamline / Galavan. Organizational culture well-suited for partnerships and mobility management strategies. Can leverage a small millage. The City of Bozeman has shown ongoing political support of Streamline. Organizational support for administrative needs. Opportunity for better integration with other community infrastructure and related departments (streets, planning, engineering, economic development, GIS, vehicle maintenance). Dedicated funding. Establish service area boundaries to match demand. Levying authority sufficient to operate the system (upon voter approval). Dedicated board that can be expected to be better versed on transportation matters than a local government commission. Unable to directly raise millage Not eligible for FTA funding under current law for urbanized areas over 50,000 people. Bozeman is expected to cross this threshold after Census Collaboration with city and county departments such as planning, GIS, street maintenance, and vehicle maintenance more difficult as an outside organization. The governing board is the city commission, which cannot focus on the specific needs or issues related to Streamline. Non-dedicated contributions from the general fund can be unstable. Service outside city limits can be politically challenging and may be limited to 8 miles by state law (MCA Sec , et. seq.) Innovative partnerships and mobility management strategies can be challenging in city government environment. Cost of implementation: requires petition of 20% of the proposed district to put on the ballot. 4 Potentially no administrative support from a larger entity. Collaboration with city and county departments such as planning, GIS, street maintenance, and vehicle maintenance more difficult as an outside organization. 4 The 2002 Bozeman Transit Task Force Report states, Though the statute envisions the need for a citizen petition to begin the process, other county commissions have placed said districts on the ballot without requiring a petition (Missoula, Glendive). Action by County Resolution alone is supported by the statute s legislative history (Committee on Local Government, Hearing, February 7, 1975, page 2). Some interpret that it simply requires approval from the county commission to put it onto the ballot.
90 6-4 Streamline Business Plan Sections , et seq., of the Montana code describes the urban transportation districts to supply services and facilities to district residents and other persons. A UTD is a county initiated entity. The entity need not be countywide, but can have a more limited jurisdiction. Financially, the UTD has the authority to levy on property within the district a tax in mills upon all property within the transportation district sufficient to operate the district. Bonding authority is also created up to 1.51 percent of the total assessed value in the district. (City of Bozeman Transit Task Force, 2002) A petition of 20% of registered voters would require 10,200 to 11,500 signatures, assuming 63,836 registered voters in the county (Malby, 2010) and the UTD boundaries covering 80%-90% of the county population. If Streamline decides to form a UTD the team recommends boundaries limited to the triangle consisting of Bozeman, Belgrade, River Rock, and Four Corners. The team estimates a successful campaign for a UTD petition and vote would require financial support of $30,000 to $40,000. By federal law, no federal funds could be used for this. By the 2020 census, the Bozeman area will most likely exceed the 50,000 population threshold within the urban boundary. This threshold triggers the formation of a Metropolitan Planning Organization, and the transition from the FTA non-urbanized (rural) program to the urbanized program. While the non-urbanized (rural) program names non-profit organizations as eligible recipients, the urbanized program is limited to governmental entities. As an urbanized program, Streamline would report directly to FTA instead of being a subrecipient under the Montana Department of Transportation. There is a chance in the next transportation authorization act that federal law will change to raise the population threshold for new urbanized areas to 200,000, which would leave Bozeman in the non-urbanized, non-mpo classification. There may also be a way to petition FTA to allow HRDC to continue to be the recipient. 6.2 Peer Summary Appendix D and E contain peer data related to organizational structure. Key findings include: Systems can run as city systems, county, non-profits, or transportation district. Three peers are operated as non-profits. Among the 1,500 systems in the rural database, we identified 60 that are operated by community action agencies or human resource development councils. Almost all of these are heavily into coordinated transportation, provide regional transportation, or serve communities smaller than Bozeman. Transit systems like Bozeman s and larger are typically have a general manager whose main focus is the overall direction of the system and building the system for the future. Administrative operating ratios for Galavan are lower than peers. 6.3 Operations and Management Review Stakeholder input and the onsite review conducted by The Bus Man identified the following issues related to organization and management that need more attention:
91 Organization and Management 6-5 High level community outreach / partnerships / contracts City partnership with Planning and Public works departments Broad based community outreach including marketing / web and technology improvements / signage, schedules, etc. Addressing regulatory and legal liabilities identified in busman report Addressing street supervisor needs and other supervision issues identified in busman report These can be addressed over the next year with a half-fte in one of two ways: 1) Have a new employee (or contract position) focus specifically on one or more of these areas 2) Restructure Streamline s management to more closely mirror peer organizational structures, job responsibilities and qualifications. 6.4 Staffing Recommendations The following two tables summarize Streamline and Galavan s current staffing and salaries compared to staffing and salaries for an expanded organizational structure that more closely follows industry standards and peer organizational structures. The methodology used to develop the proposed expanded structure is explained in Appendix E. In summary, this proposal is based on comparing the current organizational structure against: Wages and descriptions of job responsibilities from the Employee Wage and Benefit Interactive Tool (KFH Group, Inc., 2008) developed as a project of the Transit Cooperative Research Program (TCRP). TCRP is a program of the National Academy of Sciences Transportation Research Board. Wages, responsibilities, and qualifications from transit industry job listings. Staff ratios and organizational charts from peers. Recommendations from the on-site assessment report (Appendix C), including the recommendation for a street supervisor. Observations by Current Transportation as well as detailed comments in the on-site assessment report documenting heavy reliance on the board and the contractor for operational level decision making, as well as securement of local funds. A theme among stakeholder comments that there are opportunities for greater community engagement; as well as a strong desire from stakeholders and riders who want to see Streamline continue to grow, improve and expand service. These themes were perhaps best summarized in a comment by one of the TAC meeting participants who emphasized the importance of continuing to mature as a transit service.
92 6-6 Streamline Business Plan Table 6-3: Proposed full-time Equivalents and Salaries Split between Streamline and Galavan Position Proposed by FY 2015 FTE Salaries Total Streamline Galavan Total Streamline Galavan Administration HRDC CEO General Manager Galavan Director Accountant / Admin 1 1 Intern / Utility Worker Administration Subtotal $228,411 $145,876 $82,536 Operations Street Supervisor Dispatch/Office Manager Galavan Drivers Operations Subtotal $258,020 $68,166 $189,854 Total $486,431 $214,042 $272,389
93 Marketing, Communications, and Technology Marketing, Communications, and Technology Marketing is important for building community support for Streamline and for maintaining and increasing ridership. Marketing is especially important for MSU students. This is a population with high potential to benefit from Streamline s services, but due to constant turnover of the student body marketing must be ongoing to maintain awareness. The widely-used Marketing Mix model focuses on the Five-Ps of marketing.. The marketing mix combines the roles different marketing elements play in promoting products and services and delivering those products and services to customers.. 1) Product The products or services offered to your customer: Their physical attributes, what they do, how they differ from your competitors and what benefits they provide. 2) Price How you price your product or service so that your price remains competitive but allows you to make a good profit. 3) Place (Also referred to as Distribution) Where your business sells its products or services and how it gets those products or services to your customers. 4) Promotion The methods used to communicate the features and benefits of your products or services to your target customers. 5) People the level of service and the expertise and skills of the people who work for you, and how they can be used to set you apart from your competitors. 7.1 Current Marketing Strategies and Costs The current marketing plan was completed in 2006 when Streamline established, and the Board s marketing committee develops strategies each year. ASMSU contributes extensively to Streamline s marketing efforts through its outreach and marketing activities. In Fiscal Year 2012, advertising and public relations expenses were $30,906, which was $11,094 below the budgeted amount. This amount includes design and printing of bus schedules. In previous years Streamline hired a marketing firm to design and print bus schedules and to place advertisements, while in FY 2012 Streamline paid an ASMSU intern. Streamline has a need for more effective promotion, communication and advertising. Investments to achieve this objective have decreased in the last few years. Annual expenditures for advertising run approximately $???. An update to Streamline s marketing plan should include an annual budget. A positioning strategy results in the image Streamline wants to draw in the mind of customers, the picture the customer visualizes of what Streamline offers, in relation to the market situation, and the competition. Streamline has developed the Catch the Current slogan to capture the image it wants customers to associate with its intercity passenger service. Streamline s scheduled services offer the following benefits compared to other forms of transportation:


94 7-2 Streamline Business Plan Streamline s bus service is more affordable than driving, especially when considering the entire cost of automobile ownership, although many consider only the cost of fuel when calculating travel cost by car. Riders to MSU can save time and avoid parking. Riding the bus can be less stressful than driving, especially in winter driving conditions. Accident rates are far lower among buses than private vehicles. The time in the vehicle can be spent doing something other than driving. People who cannot drive can use Streamline. Social service agents can put their clients on Steamline or Galavan instead of setting up their own transportation system. A Streamline rider is helping the environment since buses are among the most energy efficient forms of transportation. Technology is making riding Streamline even more convenient and attractive since people now know when their bus will arrive. Figure 7-1: Success-comprehensive branding strategy If the decision is made to purchase 12-year buses that would be a good time to update the branding strategy. Streamline will have to move away from a vehicle-centric brand. We suggest incorporating people into any updated branding.
95 Marketing, Communications, and Technology Outreach opportunities Streamline can build on its use of TAC members to outreach to TAC member clients and constituents. This is probably best done by TAC organizations playing lead role and Streamline/HRDC in supporting role communication comes from TAC group, not directly from Streamline TAC members expressed willingness to help with messages to the public about the importance of the service to their members. Eagle Mount is an example of an organization that could be a particularly effective messenger because of their high profile and strong positive reputation in the community 7.3 Technology Technology plays a critical role in effective customer communications, and internal management of daily operations as well as longer term planning decisions. It is tightly related to operations, performance monitoring, marketing, social media strategy, and good information design. The same technological capabilities that make it possible to provide accurate, user-friendly information to the public are also necessary for critical management challenges such as assessing on-time performance and deciding how to allocate resources when increasing or cutting service. We have included this technology assessment in the same chapter with marketing and communications because improving technological capabilities is one of Streamline s best opportunities for improving customer and community outreach. Figure 7-2 illustrates how technology can tie together the different needs and responsibilities of riders, drivers, transit managers, and system managers. Technology will serve these needs most effectively if it is designed to integrate accurate data that includes a description of services, routes, and timetables, as well as real time vehicle location. The necessary technology functions can be grouped into rider information, transit management system, and automatic vehicle location. Different software, hardware, spreadsheets, and back-end databases can be used to address these as long as they are coordinated. Like all transit systems we have worked with, Streamline struggles with the challenge of managing and analyzing the large amount of complex financial data, service descriptions including miles and hours of service, and ridership data that must be combined to generate useful performance measures and other information. Data needs to be sliced in different ways for different purposes a task for which Streamline is primarily using Excel spreadsheets. While we do not have a full solution to make this easy, opportunities for improvement a presented in the following sections as well as in the performance measures discussion in section 3.2. In addition, we will share the spreadsheets we developed during this project with Streamline staff and board members, and we are available to answer questions.

96 7-4 Streamline Business Plan Figure 7-2: Diagram of technology uses.
97 Marketing, Communications, and Technology Streamline s Transit Management Technology System RideSystem The core data source for Streamline s transit management and traveler information capabilities is RideSystem a vehicle and ridership tracking system implemented by Streamline in Galavan has chosen Route Match as its turnkey technology. However we were not asked to assess Route Match, so this section focuses only on Streamline s deployment of RideSystem. Each bus is equipped with a tablet computer running RideSystem software. The tablets provide GPS capability for real time vehicle location tracking and the drivers use the tablets to enter the number of riders boarding at each stop. Overall, RideSystem has greatly improved Streamline s capabilities, however it also has some significant shortcomings and features that could be improved. RideSystem s benefits are its low cost and the high value information it generates. It is a great improvement over the previous, paper-based ridership tracking process cutting down on data entry and providing a much richer data set. RideSystem s downside is that it is a transit management lite system that has previously been deployed primarily for campus shuttles. It is worth noting that the ridestreamline.com website refers to shuttles rather than buses an inconsistency in branding that may be confusing to some users. Streamline is one of the first fixed route deployments for this system, and as a result there are a number of shortcomings and improvements that could be made especially to improve analysis and planning capabilities: On-Time Performance RideSystem lacks timetables, therefore it lacks the ability to compare actual arrival and departure time against scheduled arrival and departure time. As a result, Streamline does not currently have the capability to analyze on-time performance. Ridership Analysis and Operational Reports While the system does a good job with simple ridership queries such as ridership by day or route, it is difficult to do more advanced ridership analysis and to produce operational reports with the information that analysts and planners need. This is the result of various data problems that lead to difficulties in assessing patterns by trips or stops. Real Time Tracking Management and riders both report that the real time tracking capability is not consistently reliable and does not function well on some mobile devices. According to Karst, real-time location is not being consistently displayed for all buses because of the user interface design for the on-board tablets. It is not obvious to the driver if the location broadcast capability is on or off. Automated Stop Announcements - It lacks capabilities to do automated stop announcements on the buses, also described as talking bus capabilities. This requires
98 7-6 Streamline Business Plan additional hardware and costs, and is the most significant difference between a lite system and a full system. It is unreasonable to expect RideSystem to provide this capability. Streamline s goals for procuring RideSystem were: Provide riders with web and mobile-based, real-time bus location tracking. Improve ridership tracking. Run ridership reports. Track on-time performance. With the exception of improved ridership tracking, these goals have only been partially achieved. RideSystem has been a valuable addition to Streamline s capabilities, but it is not the complete technology solution, and there have been problems with the deployment. Simply stated, RideSystem needs to be improved to provide the capability to get the full value out of the high quality data it is already collecting. The developer can solve these problems by restructuring the database and using the General Transit Feed Specification (GTFS) to describe the routes. Additionally, some changes should be made to the bus drivers user interface GTFS General Transit Feed Specification Implementing the General Transit Feed Specification (GTFS) is probably Streamline s most significant opportunity to upgrade technology that will improve both service to the public and management capability. Formerly named the Google Transit Feed Specification, GTFS has become the most widely-used transit data standard in North America. 5 The same GTFS feed can be used for timetables, maps, a trip planner, find my bus capabilities, on-time performance reports, and other creative apps. Moreover, linking all these capabilities with the same GTFS feed minimizes errors and discrepancies between different public information tools such as printed schedules and web-based tools. A good description of GTFS is available at summarized here: GTFS is just a data format. When data follows those guidelines, it s called a GTFS feed. GTFS feeds give you an incredible amount of information about a transit system s routes, stops, schedules, fares, transfers. The beauty of it is that it starts at the most disaggregated level (the arrival and departure time of every stop of every bus) and categorizes data upwards with a structure resembling a relational database with fields and rules to connect tables as primary and foreign keys would. The highly refined data 5 Standard Schedule Formats. Accessed: 7 Jan 2010.
99 Marketing, Communications, and Technology 7-7 is needed for a trip planner that tells you exactly when to leave your house to catch a bus. Data formatted using GTFS runs practically every transit app offered by providers in North America. However, as noted above, RideSystem does not use this standard, leading to shortcomings with on-time performance reports and ridership reports by stop, trip, time, or other slices GTFS Development Process There are different options for methodologies to develop GTFS data. However, regardless of the methodology used, it is important use one set of geographic databases for the GTFS, printed timetables, bus stop names and locations used by the transit management system, and data analysis. Sometimes we have used ArcGIS and Excel to manage data. More recently we have worked with a combination of Google Earth, Google Maps, Google Spreadsheets, and Excel. This software suite has fewer capabilities than ArcGIS but does not require investment in new software and allows collaborative data creation and review. Upon request, we can share our Google route development cheat sheet with Streamline, Karst, and the Operations Committee Open Data GTFS also makes it easy to provide open data. As tracked by Open Plans, almost 85 percent of the transit miles traveled in the U.S. are done so on transit systems with open data. Meeting open data requirements is as simple as providing a link to a system s GTFS. Providing open data is a way to make a contribution to the entire transportation community as this data can then be ingested into an ever growing set of apps from apartment searches to livability planning tools. Perhaps the most common question posed by organizations using and sharing GTFS data is, What else can we do with this data? Google Transit The original use of GTFS was Google Transit, the transit trip planner now integrated with Google Maps. The Google Transit trip planner seamlessly plans itineraries on fixed-route transit services in response to queries for business and place names, addresses, intersections, and desired departure or arrival time. Google Maps presents travel by transit as an option to Google Maps users who may not be specifically looking for transit information, helping transit providers to reach new public transportation users Easy-to-use Traveler Information This section summarizes several technology-based services Streamline could offer or improve. Most of these services are web and mobile phone-based. Web and mobile-accessible traveler information addresses many of the barriers to public transportation usage. Traditional printed transit maps and schedules confuse many travelers. University of South Florida Study, almost half of participants were unable to correctly plan a trip
100 7-8 Streamline Business Plan using maps and timetables. 6 In Contrast, online maps and directions are familiar, commonlyused tools. According to the Pew Internet & American Life Project, the third most common internet activity for Americans is to search for a map or driving directions, (86%) behind only and using search engines Website The website is a transit system s primary technology application. Besides the printed schedule, this is primary tool for information dissemination. In fact, many riders and potential riders will look for information on the website before they look at a printed schedule. Therefore it is important for a transit website to be designed with ADA compliance and a mobile interface. Good website design for transit follows a few simple principles. The information that is most important to the rider should be above the fold at the top of the page. This can include a trip planner, a map of services, time tables, real-time bus location, and any special announcements about route or schedule changes. Streamline s website is visually appealing with a clean and inviting look, good images, and good branding. Much of the important information a customer would need is easy to locate and it presented in a user-friendly format. However, through our public outreach and our peer review we identified several areas that could be improved: Route Maps It should be easier for viewers to find and view route maps. All the best peer websites included prominent links to maps from their home pages. Their maps could also be viewed without downloading a PDF, though that option was always available. The ridestreamline.com real time bus tracking maps are as good, or better than anything on peer websites. However, it is not obvious from the homepage that this is where you should go for quick and easy maps. Moreover, none of the routes and schedules pages include a link ridestreamline.com. Instead they force the viewer to download a PDF to view the route map. Real Time Bus Tracking Many riders are unaware of Streamline s real time tracking service. This may be in part because the only link on the website is the last bullet under Latest Updates, and this bullet is in small grey text that is hard to spot and hard to read. Additionally, the instructions on Streamline s real-time bus tracking web page are not well organized and hard to understand particularly the instructions for the texting capability. There is lots of blank space on this page that could be used to organize the instructions into bullet points with text that more clearly explains the capabilities. 6 "Design Elements of Effective Transit Information Materials," by the National Center for Transit Research at the University of South Florida. 7 "Online Activites, Total." Pew Research Center's Internet & American Life Project <
101 Marketing, Communications, and Technology 7-9 Schedule Timetables We heard many comments that the schedule timetables are hard to understand. Ideas for improving the presentation of this essential information are discussed below. Trip Planner While almost all of the peer communities have a trip planner powered by Google Transit, Streamline s website lacks this important feature. Because many people struggle with even the best-designed schedules and maps, a trip planner is a valuable tool to help customers figure out which routes, stops and times they should use to get where they need to go. As noted above, Streamline would need to implement GTFS in order to offer a trip planner. During our peer review we noted peer websites that included good design, content, language, imagery, etc. Following are the peer websites we considered to be particularly good: Advance Transit (VT/NH) Addison County Transit Resources (VT) actr-vt.org/ Arcata & Mad River Transit System and Eureka Transit System (CA) and - These are sister systems that use the same web design. Cache Valley Transit District (UT) cachebus.org/ Mountain Line (Missoula) Larger public transportation operators serve as good models. Portland s Tri-Met system has a reputation of leading the country in technology deployment and information design We particularly like some elements of the website for Mountain Line in Flagstaff, AZ While other websites may offer more polished graphic design, Mountain offers some best practices that can be deployed in smaller systems such as: Trip planner above the fold Includes all pertinent information about the service, with a focus on how to use the bus Route status via Twitter, along with active Facebook presence Timetables that are easy to understand. Good rider s guide Schedule Timetables and Maps We believe the difficulties that riders reported with understanding Streamline s schedules and maps are the result of a combination of problems with design, consistency and accuracy. There are multiple possible solutions combining technology, design and quality control. Timetable Design The current timetable design of Streamline s hard copy schedules is confusing because the timetables for all the daytime, in-town routes are two pages wide and two pages tall. The length
102 7-10 Streamline Business Plan of the timetables is also a problem on the web because it forces viewers to scroll up and down to see the entire route. The timetables could be made shorter by using the industry-standard practice of not including all stops. This approach has the added benefit of eliminating early departures from minor stops. Missoula s Mountain Line publishes schedules that only include major stops. This solution is recommended in the operations review conducted by Steve Earle of Missoula (see Appendix C). However, a downside of this approach is that it can be confusing to riders if printed schedules do not show every stop on a route, while all the stops are included in web tools such as a detailed route map, an interactive map or a trip planner. Note that trip planners are designed to include all stops because their purpose is to direct a rider to the stop closest to their destination, and because a trip planner uses an algorithm based on GTFS data for all the stops on the entire schedule. Figure 7-3 shows a timetable from the Flagstaff, AZ transit system website that could serve as a model for Streamline to provide information in a manner that is easier to understand. Like Streamline, the buses on this route stop at each stop at the same time each hour, they have higher frequency during peak hours, and they use a vertical layout for their timetables. Note they follow the common practice of using boldface for afternoon times. Timetables are split into two logical out and back divisions. This was the approach the Current Transportation team took in Butte when for the redesign of timetables in 2012.

103 Figure 7-3: Sample Timetable from Flagstaff Marketing, Communications, and Technology 7-11
PUBLIC TRANSPORTATION PLAN FOR THE CITY OF GEORGETOWN
 PUBLIC TRANSPORTATION PLAN FOR THE CITY OF GEORGETOWN PRESENTATION TO CITY COUNCIL JANUARY 22, 2008 PUBLIC TRANSIT FOR THE CITY OF GEORGETOWN LOCAL SERVICE For Georgetown residents to Georgetown destinations.
Rochester Area Bike Sharing Program Study
 roc bike share Rochester Area Bike Sharing Program Study Executive Summary ~ January 2015 JANUARY 2015 8484 Georgia Avenue, Suite 800 Silver Spring, MD 20910 3495 Winton Pl., Bldg E, Suite 110 Rochester,
Pocatello Regional Transit Master Transit Plan Draft Recommendations
 Pocatello Regional Transit Master Transit Plan Draft Recommendations Presentation Outline 1. 2. 3. 4. What is the Master Transit Plan? An overview of the study Where Are We Today? Key take-aways from existing
1999 On-Board Sacramento Regional Transit District Survey
 SACOG-00-009 1999 On-Board Sacramento Regional Transit District Survey June 2000 Sacramento Area Council of Governments 1999 On-Board Sacramento Regional Transit District Survey June 2000 Table of Contents
City of Davenport CitiBus Public Transportation Study. April 2015
 City of Davenport CitiBus Public Transportation Study April 2015 Overview Project Background Key Findings CitiBus Service Allocation Policy Discussion 2 Project Background 3 About CitiBus Operates 17 routes
Guidelines for Providing Access to Public Transportation Stations APPENDIX C TRANSIT STATION ACCESS PLANNING TOOL INSTRUCTIONS
 APPENDIX C TRANSIT STATION ACCESS PLANNING TOOL INSTRUCTIONS Transit Station Access Planning Tool Instructions Page C-1 Revised Final Report September 2011 TRANSIT STATION ACCESS PLANNING TOOL INSTRUCTIONS
Tulsa Metropolitan Area LONG RANGE TRANSPORTATION PLAN
 Tulsa Metropolitan Area LONG RANGE TRANSPORTATION PLAN Indian Nations Council of Governments August 2005 CONTACTING INCOG In developing the Destination 2030 Long Range Transportation Plan, INCOG s Transportation
TRANSIT & NON-MOTORIZED PLAN DRAFT FINAL REPORT Butte County Association of Governments
 1 INTRODUCTION Maintaining a high quality of life is the essence of this plan for transit and non-motorized transportation in Butte County. Curbing greenhouse gas emissions (GHG) by reducing congestion,
THE NEXUS OF LIVABILITY, TRANSIT, AND PERFORMANCE MEASUREMENT
 THE NEXUS OF LIVABILITY, TRANSIT, AND PERFORMANCE MEASUREMENT CALACT SPRING CONFERENCE 2013 MAY 17, 2013 FRIDAY MORNING SESSION JONATHAN BROOKS ASSOCIATE TRANSPORTATION RESEARCHER TRANSIT MOBILITY PROGRAM
Craig Rempp, Transit Superintendent Mary Karlsson, Kimley-Horn. Mankato City Council Meeting 6/25/2018
 Craig Rempp, Transit Superintendent Mary Karlsson, Kimley-Horn Mankato City Council Meeting 6/25/2018 What is a Transit Development Plan (TDP)? Engagement Issues Goals, objectives, design guidelines and
Title VI Fare Change Equity Analysis
 Title VI Fare Change Equity Analysis Evaluation Report Submitted to Dallas Area Rapid Transit Submitted by TranSystems June 2012 Title VI Fare Change Equity Analysis Introduction DART has proposed a schedule
Philadelphia Bus Network Choices Report
 Philadelphia Bus Network Choices Report JUNE 2018 SEPTA Table of Contents Executive Summary...7 What if transit gave us more freedom?... 8 What is this report?... 8 The main conclusions... 9 What is happening
PEDESTRIAN ACTION PLAN
 ATTACHMENT 2 CITY OF SANTA MONICA PEDESTRIAN ACTION PLAN CITY OF SANTA MONICA PEDESTRIAN ACTION PLAN This page intentionally left blank EXECUTIVE SUMMARY CHAPTER 1 EXECUTIVE SUMMARY Setting the Stage
Exhibit 1 PLANNING COMMISSION AGENDA ITEM
 Exhibit 1 PLANNING COMMISSION AGENDA ITEM Project Name: Grand Junction Circulation Plan Grand Junction Complete Streets Policy Applicant: City of Grand Junction Representative: David Thornton Address:
Caltrain Bicycle Parking Management Plan DRAFT PROJECT SCOPE SUBMITTED TO CALTRANS FALL 2014
 Caltrain Bicycle Parking Management Plan DRAFT PROJECT SCOPE SUBMITTED TO CALTRANS FALL 2014 NOTE: The following draft scope of work was developed by Caltrain in the fall of 2014 as part of a Caltrans
Typical Rush Hour Commute. PennyforTransportation.com
 Typical Rush Hour Commute In the News Overview of the Plan Collaborative plan with projects in every community Prioritizing connectivity and congestion relief Dedicated transportation-specific funding;
ROUTES 55 / 42 / 676 BUS RAPID TRANSIT LOCALLY PREFERRED ALTERNATIVE
 ROUTES 55 / 42 / 676 BUS RAPID TRANSIT LOCALLY PREFERRED ALTERNATIVE April, 2012 1 INTRODUCTION The need for transit service improvements in the Routes 42/55/676 corridor was identified during the Southern
Washington Metropolitan Area Transit Authority Board Action/Information Summary. MEAD Number:
 Washington Metropolitan Area Transit Authority Board Action/Information Summary Action Information MEAD Number: 100962 Resolution: Yes No TITLE: Bicycle and Pedestrian Access Improvements Study PURPOSE:
Transportation Master Plan Advisory Task Force
 Transportation Master Plan Advisory Task Force Network Alternatives & Phasing Strategy February 2016 BACKGROUND Table of Contents BACKGROUND Purpose & Introduction 2 Linking the TMP to Key Council Approved
City of Novi Non-Motorized Master Plan 2011 Executive Summary
 City of Novi Non-Motorized Master Plan 2011 Executive Summary Prepared by: February 28, 2011 Why Plan? Encouraging healthy, active lifestyles through pathway and sidewalk connectivity has been a focus
Bike Share Social Equity and Inclusion Target Neighborhoods
 Bike Share Social Equity and Inclusion Target Neighborhoods Target Neighborhoods West End/Visitation Park/Academy/Hamilton Heights Wellsgoodfellow/Kingsway West The Ville/Greater Ville Kingsway East/Fountain
Travel and Rider Characteristics for Metrobus
 Travel and Rider Characteristics for Metrobus 040829040.15 Travel and Rider Characteristics for Metrobus: 2012-2015 Overview The Miami Dade County Metropolitan Planning Organization (MPO) conducted a series
Transit Ridership - Why the Decline and How to Increase. Hosted by the. Virginia Transit Association
 Transit Ridership - Why the Decline and How to Increase Hosted by the Virginia Transit Association Virginia Transit Association 1108 East Main Street, Suite 1108 Richmond, VA 23219 804.643.1166 www.vatransit.com
May 12, 2016 Metro Potential Ballot Measure Issue Brief: Local Return
 Summary: Local return is an important revenue source for cities to maintain their local transportation infrastructure. Most cities use their local return to operate small bus systems and repave streets,
University of Victoria Campus Cycling Plan Terms of Reference. 1.0 Project Description
 University of Victoria Campus Cycling Plan Terms of Reference 1.0 Project Description The Campus Cycling Plan, a first for the University, will provide a comprehensive and coordinated approach to support
Proposed. City of Grand Junction Complete Streets Policy. Exhibit 10
 Proposed City of Grand Junction Complete Streets Policy Exhibit 10 1 City of Grand Junction Complete Streets Policy Vision: The Complete Streets Vision is to develop a safe, efficient, and reliable travel
Caltrain Bicycle Parking Management Plan
 Caltrain Bicycle Parking Management Plan Board of Directors October 5, 2017 Agenda Item 11 Context for Plan Capacity and Access Issues Modernization program with Electrification Complimenting limited on-board
METRO Light Rail: Changing Transit Markets in the Phoenix Metropolitan Area
 METRO Light Rail: Changing Transit Markets in the Phoenix Metropolitan Area Abhishek Dayal, AICP Planner III, METRO Light Rail Phoenix, AZ BACKGROUND Transit in the Phoenix Region Transit services in the
The Florida Bicycle and Pedestrian Partnership Council
 The Florida Bicycle and Pedestrian Partnership Council Input to the Update of the Florida Transportation Plan March 2015 This document presents input from the Florida Bicycle and Pedestrian Advisory Council
Develop a Multi-Modal Transportation Strategy (Theme 6)
") DEVELOP A MULTI-MODAL TRANSPORTATION STRATEGY (THEME 6) WHY IS THIS THEME ADDRESSED? Develop a Multi-Modal Transportation Strategy (Theme 6) Statement of Ideal Reduce resident and visitor reliance on single
DEVELOP A MULTI-MODAL TRANSPORTATION STRATEGY (THEME 6) WHY IS THIS THEME ADDRESSED? Develop a Multi-Modal Transportation Strategy (Theme 6) Statement of Ideal Reduce resident and visitor reliance on single
Characteristics from these programs were used to compare to and evaluate existing conditions in Howard County.
 EXECUTIVE SUMMARY Bike share is a mobility option that allows users to access a fleet of public bicycles throughout a community. Bike share systems have successfully been implemented in communities throughout
Corpus Christi Metropolitan Transportation Plan Fiscal Year Introduction:
 Introduction: The Safe, Accountable, Flexible, Efficient Transportation Equity Act: A Legacy for Users (SAFETEA-LU) has continued the efforts started through the Intermodal Surface Transportation Efficiency
To secure Council approval for a pilot expansion of Transit service to the villages of St. Davids and Queenston.
 Operations Telephone (905) 468-4261 Facsimile (905) 468-4555 1565 Creek Road P.O. Box 190 Virgil, Ontario L0S 1T0 Report: OPS-15-026 Committee Date: May 04, 2015 Due in Council: May 11, 2015 Report To:
Hurricane to Zion Canyon Transit Study
 Hurricane to Zion Canyon Transit Study August 2010 Prepared for Five County Association of Governments This Page Intentionally Left Blank TABLE OF CONTENTS TABLE OF CONTENTS... i LIST OF FIGURES... ii
January Project No
 January 13 2015 Project No. 5070.05 Neil Connelly, Director University of Victoria, Campus Planning and Sustainability PO Box 1700 STN CSC Victoria, BC V8P 5C2 Dear Neil: Re: UVic 2014 Traffic Final Report
5. Pedestrian System. Accomplishments Over the Past Five Years
 5. Pedestrian System Accomplishments Over the Past Five Years The Alamo Area Metropolitan Planning Organization (MPO) and its partner agencies recognize the importance of improving pedestrian mobility.
Service Proposal for the City of Ashland, Oregon
 Rogue Valley Transportation District 3200 Crater Lake Avenue Medford, Oregon 97504-9075 Phone (541) 608-2429 Fax (541) 773-2877 Visit our website at: www.rvtd.org 2009-2011 Service Proposal for the City
Modal Shift in the Boulder Valley 1990 to 2009
 Modal Shift in the Boulder Valley 1990 to 2009 May 2010 Prepared for the City of Boulder by National Research Center, Inc. 3005 30th Street Boulder, CO 80301 (303) 444-7863 www.n-r-c.com Table of Contents
CITY OF COCOA BEACH 2025 COMPREHENSIVE PLAN. Section VIII Mobility Element Goals, Objectives, and Policies
 CITY OF COCOA BEACH 2025 COMPREHENSIVE PLAN Section VIII Mobility Element Goals, Objectives, and Policies Adopted August 6, 2015 by Ordinance No. 1591 VIII MOBILITY ELEMENT Table of Contents Page Number
Capital and Strategic Planning Committee. Item III - B. April 12, WMATA s Transit-Oriented Development Objectives
 Capital and Strategic Planning Committee Item III - B April 12, 2018 WMATA s Transit-Oriented Development Objectives Page 24 of 76 Washington Metropolitan Area Transit Authority Board Action/Information
NASHUA REGIONAL PLANNING COMMISSION REGIONAL BICYCLE AND PEDESTRIAN PLAN
 NASHUA REGIONAL PLANNING COMMISSION REGIONAL BICYCLE AND PEDESTRIAN PLAN June, 2005 Prepared by the Nashua Regional Planning Commission 2005 NRPC Regional Bicycle and Pedestrian Plan- JUNE 2005 ACKNOWLEDGEMENTS
Where We Live and Work Today
 San Diego Forward: The 2019-2050 Regional Plan Network Concepts Transportation Committee Item 4 October 19, 2018 Where We Live and Work Today 2018 2 2019 Regional Plan Transportation Committee Item 4 October
Bicycle Master Plan Goals, Strategies, and Policies
 Bicycle Master Plan Goals, Strategies, and Policies Mobilizing 5 This chapter outlines the overarching goals, action statements, and action items Long Beach will take in order to achieve its vision of
SHORT RANGE TRANSIT PLAN: Survey Results and Analysis
 GOLD COAST TRANSIT DISTRICT SHORT RANGE TRANSIT PLAN: Survey Results and Analysis FY 2014-15 to FY 2018-19 Overview As part of the Short Range Transit Plan (SRTP) community outreach process, Gold Coast
BUILDING THE CASE FOR TRAVEL OPTIONS IN WASHING TON COUNTY. Image: Steve Morgan. Image: Steve Morgan
 BUILDING THE CASE FOR TRAVEL OPTIONS IN WASHING TON COUNTY Image: Steve Morgan Image: Steve Morgan Image: TriMet Image: TriMet WHAT ARE TRAVEL OPTIONS PROGRAMS? Travel options programs encourage residents,
Purpose and Need. Chapter Introduction. 2.2 Project Purpose and Need Project Purpose Project Need
 Chapter 2 Purpose and Need 2.1 Introduction The El Camino Real Bus Rapid Transit (BRT) Project (Project) would make transit and other transportation improvements along a 17.6-mile segment of the El Camino
Public Consultation Centre For. Transportation Master Plan Update. Information Package
 Public Consultation Centre For Transportation Master Plan Update Information Package Date Location Hours Tuesday, September 12, 2017 Wednesday, September 13, 2017 Tuesday, September 19, 2017 Cambridge
Cabrillo College Transportation Study
 Cabrillo College Transportation Study Planning and Research Office Terrence Willett, Research Analyst, Principle Author Jing Luan, Director of Planning and Research Judy Cassada, Research Specialist Shirley
4 Ridership Growth Study
 Clause 4 in Report No. 15 of Committee of the Whole was adopted, without amendment, by the Council of The Regional Municipality of York at its meeting held on November 16, 2017. 4 Ridership Growth Study
CITY OF HAMILTON PUBLIC WORKS DEPARTMENT Transit Division
 CITY OF HAMILTON PUBLIC WORKS DEPARTMENT Transit Division TO: Chair and Members Public Works Committee COMMITTEE DATE: June 4, 2018 SUBJECT/REPORT NO: WARD(S) AFFECTED: PREPARED BY: SUBMITTED BY: Mountain
Arlington County 10-Year Transit Development Plan & Premium Transit Network Briefing. May 2016
 Arlington County 10-Year Transit Development Plan & Premium Transit Network Briefing May 2016 Overview 10-Year Transit Development Plan Premium Transit Network Columbia Pike service concept Premium amenities
Midtown Corridor Alternatives Analysis
 Midtown Corridor Alternatives Analysis Ridership Forecast Methodology and Results December 2013 Prepared by the SRF Consulting Group Team for Table of Contents Introduction... 1 Methodology... 1 Assumptions...
WELCOME. City of Greater Sudbury. Transportation Demand Management Plan
 WELCOME City of Greater Sudbury Transportation Demand Management Plan Public Consultation Session St. Andrew s Place, Activity Hall 111 Larch Street Wednesday September 13, 2017 6:00 to 8:00 pm Welcome
Cherry Creek Transportation and Land Use Forum September 25, 2013 Meeting Summary
 Cherry Creek Transportation and Land Use Forum September 25, 2013 Meeting Summary I. LEAD-IN TO SMALL GROUP DISCUSSION, POLLING AND STEERING COMMITTEE/TECHNICAL TASK FORCE DISCUSSION The meeting began
Estimating Ridership of Rural Demand-Response Transit Services for the General Public
 Estimating Ridership of Rural Demand-Response Transit Services for the General Public August 2016 prepared for US DOT prepared by Jeremy Mattson North Dakota State University Upper Great Plains Transportation
Hamilton Transportation Master Plan Public Consultation. Public Information Centre One Summary
 Hamilton Transportation Master Plan Public Consultation Public Information Centre One Summary Table of Contents Introduction 1 Purpose 2 What Was Presented 2 Who Came to the Meeting 2 The Breakout Sessions
ADOT Statewide Bicycle and Pedestrian Program Summary of Phase IV Activities APPENDIX B PEDESTRIAN DEMAND INDEX
 ADOT Statewide Bicycle and Pedestrian Program Summary of Activities APPENDIX B PEDESTRIAN DEMAND INDEX May 24, 2009 Pedestrian Demand Index for State Highway Facilities Revised: May 29, 2007 Introduction
Roanoke Valley TRANSIT VISION PLAN
 Roanoke Valley TRANSIT VISION PLAN Approved September 22, 2016 PART 6: Implementation Strategies and Performance Measures PART 6: Implementation Strategies 2 CONTENTS 1.0 OVERVIEW 4 2.0 TIMELINE 4 3.0
ALTERNATIVES ANALYSIS EXECUTIVE SUMMARY
 West Valley Connector Corridor ALTERNATIVES ANALYSIS EXECUTIVE SUMMARY FINAL September 2014 Ontario International Airport Ontario Mills Rancho Cucamonga Metrolink Station Kaiser Permanente PARSONS EXECUTIVE
ATTACHMENT 4 - TDM Checklist. TDM Checklist Overview
 ATTACHMENT 4 - TDM Checklist TDM Checklist Overview The proposed checklist rates developments on the degree to which they are TDM and transit supportive. Points are assigned based on the level of transit
SANTA CLARA COUNTYWIDE BICYCLE PLAN August 2008
 SANTA CLARA COUNTYWIDE BICYCLE PLAN August 2008 To assist VTA and Member Agencies in the planning, development and programming of bicycle improvements in Santa Clara County. Vision Statement To establish,
Kelowna On the Move. Pedestrian and Bicycle Master Plan
 Kelowna On the Move Pedestrian and Bicycle Master Plan Executive Summary April 2016 Purpose of the Plan The Pedestrian and Bicycle Master Plan identifies infrastructure, planning, and policy requirements
Chapter 2. Bellingham Bicycle Master Plan Chapter 2: Policies and Actions
 Chapter 2 Bellingham Bicycle Master Plan Chapter 2: Policies and Actions Chapter 2: Policies and Actions The Bicycle Master Plan provides a road map for making bicycling in Bellingham a viable transportation
APPENDIX C. Systems Performance Report C-1
 APPENDIX C Systems Performance Report C-1 System Performance Report & Requirements According to the FAST Act, a long range transportation plan needs to include a system performance report and subsequent
Transportation in Washoe County. Lee Gibson, Executive Director February 15, 2011
 Transportation in Washoe County Lee Gibson, Executive Director February 15, 2011 RTC OF WASHOE COUNTY Metropolitan Planning Organization Meet long term needs Deliver federal funding Program projects in
Nomination. Halton Region in Context
 Transportation Association of Canada Sustainable Urban Transportation Award Nomination of: Region of Halton Regional Transportation Master Plan Study March 2005 Nominated by: Nomination The TAC Sustainable
Public Works AGENDA ITEM D-2 STAFF REPORT
 AGENDA ITEM D-2 Public Works STAFF REPORT Transportation Master Plan Oversight and Outreach Committee Meeting Date: 10/30/2017 Staff Report Number: 17-001-TMP Regular Business: Provide feedback on Performance
AAMPO Regional Transportation Attitude Survey
 AAMPO Regional Transportation Attitude Survey Traditionally Underserved Populations helping organizations make better decisions since 1982 2018 Submitted to the AAMPO By: ETC Institute 725 W. Frontier
CITY OF HAMILTON. PUBLIC WORKS DEPARTMENT Transportation Division
 CITY OF HAMILTON PUBLIC WORKS DEPARTMENT Transportation Division TO: Mayor and Members General Issues Committee WARD(S) AFFECTED: CITY WIDE COMMITTEE DATE: February 25, 2013 SUBJECT/REPORT NO: Public Bike
How To Encourage More Efficient Transportation in Brazilian Cities
 How To Encourage More Efficient Transportation in Brazilian Cities Todd Litman Victoria Transport Policy Institute Presented Seminar on Discouraging The Use Of Cars São Paulo, Brazil 3 September 2013 Creating
The role of the Authority in promoting sustainable transport. Gerry Murphy South East Regional Assembly 27 th May 2011
 The role of the Authority in promoting sustainable transport Gerry Murphy South East Regional Assembly 27 th May 2011 Who we are National Transport Authority established on 1 st December 2009 Dublin Transport
July 23, Transit Workshop
 Agenda 1. Introductions 2. Presentation: Public Transit in Regina Review of Practices Elsewhere 3. Discussion #1: Transit Today 4. Break 5. Discussion #2: Transit Tomorrow Corridors, Service, and Amenities
GOLD COAST TRANSIT DISTRICT SHORT RANGE TRANSIT PLAN FY 2015 FY 2019 APPENDICES
 APPENDICES I. GCTD Ridership Data a. Fixed-Route 10 Year Ridership History b. Ridership Summary - FY 2013-14 & FY 2014-15 c. Performance Indicators By Route FY 2013-14 & FY 2014-15 d. Annual Ridership/Passengers
CASE STUDY City of Monrovia: Leveraging emerging ridesharing services to expand mobility options
 Advancing Mobility Management CASE STUDY City of Monrovia: Leveraging emerging ridesharing services to expand mobility options Agency: Location: Service Area: Modes: Community Context: Key Contacts: City
Vision to Action Community Coalition February 14, 2014 Briefing
 Vision to Action Community Coalition February 14, 2014 Briefing Transportation and Transit Planning & Mass Transit Operations Strategic Growth Area Office Brian S. Solis Transportation & Transit Manager
MIDCOAST MAINE TRANSIT STUDY. In Association with: MORRIS COMMUNICATIONS
 MIDCOAST MAINE TRANSIT STUDY In Association with: MORRIS COMMUNICATIONS Public Meetings June, 2013 Project Background Four coastal towns of Knox County have agreed on the importance of a transit study
Active Transportation Infrastructure Investment A Business Case
 Active Transportation Infrastructure Investment A Business Case In 2016, the Real Estate Foundation awarded the Capital Regional District a $50,000 grant for Shifting Gears: Land Use Change through Active
Free Ride Transit System 2014 On Board Passenger Survey
 Free Ride Transit System 2014 On Board Passenger Survey March 28, 2014 INTRODUCTION The last on-board passenger survey was conducted by the Breckenridge Free Ride on March 30, 2012. The 2012 survey had
CONNECTING PEOPLE TO PLACES
 CONNECTING PEOPLE TO PLACES 82 EAST BENCH MASTER PLAN 07 Introduction The East Bench transportation system is a collection of slow moving, treelined residential streets and major arteries that are the
Engagement Summary: Round 1
 Engagement Summary: Round 1 June 21, 2018 REPORT FOR: City of Courtenay 830 Cliff Avenue Courtenay, BC V9N 2J7 PREPARED BY: Urban Systems Ltd. 550 1090 Home Street Vancouver, BC V6B 2W9 ALONG WITH: Kathleen
EASTERN SHORE ALTERNATIVE TRANSPORTATION MODE STUDY FOR DISABLED, ELDERLY, LOW-INCOME, AND YOUTH POPULATION
 EASTERN SHORE ALTERNATIVE TRANSPORTATION MODE STUDY FOR DISABLED, ELDERLY, LOW-INCOME, AND YOUTH POPULATION Accomack-Northampton Planning District Commission Eastern Shore of Virginia Transportation Technical
Customer Satisfaction Tracking Report 2016 Quarter 1
 Customer Satisfaction Tracking Report 2016 Quarter 1 May 2016 Prepared by: NRG Research Group Project no. 317-15-1445 Suite 1380-1100 Melville Street Vancouver, BC V6E 4A6 Table of Contents Background
Memorandum. Fund Allocation Fund Programming Policy/Legislation Plan/Study Capital Project Oversight/Delivery Budget/Finance Contract/Agreement Other:
 Memorandum Date: November 20, 2017 To: Transportation Authority Board From: Eric Cordoba Deputy Director Capital Projects Subject: 12/5/17 Board Meeting: San Francisco Freeway Corridor Management Study
Exceeding expectations: The growth of walking in Vancouver and creating a more walkable city in the future through EcoDensity
 Exceeding expectations: The growth of walking in Vancouver and creating a more walkable city in the future through EcoDensity Melina Scholefield, P. Eng. Manager, Sustainability Group, City of Vancouver
Transportation-Demand Management Community Presentation
 Transportation-Demand Management Community Presentation American University Office of Risk, Safety and Transportation programs Thursday, June 7, 2018 Program Objectives Improve transportation options for
NM-POLICY 1: Improve service levels, participation, and options for non-motorized transportation modes throughout the County.
 Transportation PRINCE WILLIAM COUNTY 2008 COMPREHENSIVE PLAN NON-MOTORIZED PLAN CONTENTS Goals, Policies, and Action Strategies Table 4 (Bike Facility Classifications and Descriptions) Table 5 (Bike Facility
Minutes of the Sixth Meeting OZAUKEE COUNTY TRANSIT DEVELOPMENT PLAN ADVISORY COMMITTEE
 Minutes of the Sixth Meeting OZAUKEE COUNTY TRANSIT DEVELOPMENT PLAN ADVISORY COMMITTEE DATE: November 14, 2017 TIME: PLACE: 10:00 a.m. Auditorium Ozaukee County Administration Center 121 W. Main Street
Contents. Champaign-Urbana Mass Transit District Stop Placement Guidelines
 Contents Champaign-Urbana Mass Transit District Introduction... 1 Stop Spacing... 2 Rural... 2 Low Density Suburban... 2 General Urban... 2 Urban Core... 2 Operational Safety... 3 Stop Placement... 4 Nearside
2010 Pedestrian and Bicyclist Special Districts Study Update
 2010 Pedestrian and Bicyclist Special Districts Study Update Pedestrian and Bicyclist Special Districts Program Overview H-GAC s Special Districts Program aims to provide strategic investments in pedestrian
Sustainable Transportation Plan Draft 4/24/2012
 Sustainable Transportation Plan 2011-2012 Draft 4/24/2012 Contents I. Purpose... 3 II. Background... 3 III. Recent Accomplishments... 6 IV. Anticipated Changes... 8 V. Planning Process... 8 VI. Priorities...
Report Overview Policy versus Performance: Directions for North Carolina s Largest Transit Systems
 For Truth. For Freedom. For the Future of North Carolina Report Overview Policy versus Performance: Directions for North Carolina s Largest Transit Systems By David T. Hartgen Professor of Transportation
Key objectives of the survey were to gain a better understanding of:
 3 COMMUNITY INPUT Community input is an essential part of corridor studies. For the SR 87 corridor study, VTA staff conducted an extensive online survey of people living and commuting along the corridor.
BIKE PLAN CONTENTS GATEWAY
 CONTENTS Acknowledgments...vii Great Rivers Greenway District Board of Directors... vii Great Rivers Greenway District Staff... vii Project Consultants... vii Committees... viii Citizens Advisory Committee
Customer Service and Operations Committee. Board Information Item III-A. March 12, 2015
 Customer Service and Operations Committee Board Information Item III-A March 12, 2015 Business Partnerships and Encouraging Off-Peak Ridership Page 3 of 30 Washington Metropolitan Area Transit Authority
Beyond First First Last Last Mile Strategies. APA National Conference April 3, 2016 Chelsea Richer, AICP Fehr & Peers
 Beyond First First Last Last Mile Strategies APA National Conference April 3, 2016 Chelsea Richer, AICP Fehr & Peers 1 Beyond First Last Mile Strategies APA National Conference Jeremy Klop, AICP, Fehr
Market Factors and Demand Analysis. World Bank
 Market Factors and Demand Analysis Bank Workshop and Training on Urban Transport Planning and Reform. Baku, April 14-16, 2009 Market Factors The market for Public Transport is affected by a variety of
Coolest Cities Results Summary
 Coolest Cities Results Summary About Coolest Cities Canada s six largest urban areas provide homes and jobs for almost 15 million people, nearly half of our population. Transporting these citizens to and
Executive Summary. TUCSON TRANSIT ON BOARD ORIGIN AND DESTINATION SURVEY Conducted October City of Tucson Department of Transportation
 Executive Summary TUCSON TRANSIT ON BOARD ORIGIN AND DESTINATION SURVEY Conducted October 2004 Prepared for: City of Tucson Department of Transportation May 2005 TUCSON TRANSIT ON BOARD ORIGIN AND DESTINATION
Encouragement. Chapter 4. Education Encouragement Enforcement Engineering & Facilities Evaluation & Planning. Encouragement Chapter 4
 Encouragement Education Encouragement Enforcement Engineering & Facilities Evaluation & Planning Photo above: Children show off their ribbons at the Tour de Virginia Beach. Virginia Beach Bikeways and
Corporate. Report COUNCIL DATE: June 26, 2006 NO: C012 COUNCIL-IN-COMMITTEE. TO: Mayor & Council DATE: June 22, 2006
 Corporate NO: C012 Report COUNCIL DATE: June 26, 2006 COUNCIL-IN-COMMITTEE TO: Mayor & Council DATE: June 22, 2006 FROM: General Manager, Engineering FILE: 0410-20(MoT/Gate) SUBJECT: Surrey Response on