CHAPTER 1 INTRODUCTION... 1 CHAPTER 2 OUR PAST, PRESENT AND FUTURE... 15
|
|
|
- Harvey Owens
- 6 years ago
- Views:
Transcription
1
2
3 CHAPTER 1 INTRODUCTION PURPOSE OF THE MTP ABOUT THE MPO THE PROCESS NATIONAL, REGIONAL AND LOCAL TRENDS IN TRANSPORTATION NEW DIRECTIONS OF THE MTP GOALS AND OBJECTIVES CHAPTER 2 OUR PAST, PRESENT AND FUTURE POPULATION TRENDS Population Growth Age Distribution Households Labor Force & Employment COMMUTING TRENDS Commuting Patterns Commuting Modes Travel Times Vehicle Travel TRANSPORTATION SYSTEM Roadway Network Mileage Condition Congestion Freight Movement Trucking Air Rail Water Passenger Transportation Services Public Transit Services Demand-Response Transportation Services Regional, state & national passenger service Ridesharing Carpool Vanpool Car Sharing Bicycling & Walking Bicycle Facilities Pedestrian Facilities Bicycle and Pedestrian Programs SAFETY & SECURITY Critical Crash Rates Collision Data...53 Fayette County Jessamine County Collision Locations Security ENVIRONMENT Air Quality M e t r o p o l i t a n T r a n s p o r t a t i o n P l a n Page i
4 CHAPTER 3 PLAN DEVELOPMENT CURRENT & FUTURE NEEDS ASSESSMENT PARTICIPATION PROCESS Transportation Survey Public Notification & Meetings Coordination/Consultation TRAVEL DEMAND FORECASTING MODEL FINANCIAL FORECASTS Revenue Sources Federal State Local Highway Financial Estimate Short-range Forecasts: Long-range Forecasts: Transit Financial Estimate System Operations, Maintenance and Preservation Estimate PROJECT IDENTIFICATION & PRIORITIZATION Project Sources Prioritization Tool Project Scoping & Estimates CHAPTER 4 OUR PRIORITIES COMPLETE STREETS SUSTAINABLE TRANSPORTATION INVESTMENT FINANCIAL PLAN Short Range Financial Plan ( ) Long Range Financial Plan ( ) MULTIMODAL HIGHWAY CAPACITY INTERSECTION & CORRIDOR MODERNIZATION TRANSIT EXPANSION/IMPROVEMENTS OPERATIONS, MAINTENANCE & MANAGEMENT Operations Maintenance Travel Demand Management BICYCLE & PEDESTRIAN SAFETY & SECURITY FREIGHT ENVIRONMENT PLAN EVALUATION Fiscal Constraint Analysis Travel Demand Forecasting Model Performance Measures Coordination/Consultation IMPLEMENTATION Lexington Area MPO Transportation Improvement Program Kentucky Statewide Transportation Improvement Program M e t r o p o l i t a n T r a n s p o r t a t i o n P l a n Page ii
5 APPENDIX A TPC RESOLUTION APPROVING 2040 MTP APPENDIX B GROUPED PROJECTS APPENDIX C PARTICIPATION APPENDIX D PROJECT SCORING PROCESS APPENDIX E TITLE VI, ENVIRONMENTAL JUSTICE & SOCIAL EQUITY APPENDIX F ILLUSTRATIVE PROJECT LIST APPENDIX G ABBREVIATIONS & ACRONYMS M e t r o p o l i t a n T r a n s p o r t a t i o n P l a n Page iii
6 TABLE OF EXHIBITS EXHIBIT 1.1 LEXINGTON MPO PLANNING AREA 2 EXHIBIT 1.2 MPO PLANNING DOCUMENTS 3 EXHIBIT 1.3 MPO ORGANIZATIONAL STRUCTURE 4 EXHIBIT 1.4 NATIONAL VEHICLE MILES OF TRAVEL TREND 8 EXHIBIT 2.1 TOTAL POPULATION & POPULATION GROWTH FOR THE MPO AREA 15 EXHIBIT 2.2 POPULATION GROWTH AREAS 16 EXHIBIT 2.3 POPULATION AGE DISTRIBUTION 17 EXHIBIT 2.4 NUMBER AND SIZE OF HOUSEHOLDS 18 EXHIBIT 2.5 POPULATION AND LABOR FORCE GROWTH 18 EXHIBIT 2.6 EMPLOYMENT GROWTH AREAS 19 EXHIBIT 2.7 COMMUTES INTO AND OUT OF FAYETTE COUNTY 20 EXHIBIT 2.8 COMMUTES INTO AND OUT OF JESSAMINE COUNTY 21 EXHIBIT 2.9 PERCENT OF WORKERS DRIVING ALONE TO WORK 21 EXHIBIT 2.10 TRAVEL MODE TO WORK OTHER THAN DRIVING ALONE (% MODE SHARE) 22 EXHIBIT 2.11 TRAVEL MODE TO WORK OTHER THAN DRIVING ALONE (% CHANGE) 22 EXHIBIT 2.12 AVERAGE COMMUTE TRAVEL TIME IN MPO AREA 23 EXHIBIT 2.13 VEHICLE MILES OF TRAVEL IN MPO AREA 24 EXHIBIT 2.14 VEHICLE MILES OF TRAVEL IN FAYETTE & JESSAMINE COUNTY 24 EXHIBIT 2.15 ROAD NETWORK MILEAGE WITHIN THE MPO AREA 26 EXHIBIT 2.16 ROAD NETWORK BY ROADWAY CLASSIFICATION 26 EXHIBIT 2.17 LEXINGTON AREA ROADWAY PAVEMENT QUALITY 27 EXHIBIT 2.18 LEXINGTON AREA BRIDGE CONDITION RATINGS 28 EXHIBIT 2.19 TOP 10 WORST AM PEAK TRAVEL TIME INDEX 30 EXHIBIT 2.20 TOP 10 WORST PM PEAK TRAVEL TIME INDEX 30 EXHIBIT 2.21 TRAFFIC FLOW CONDITIONS FOR VARIOUS LOS AND V/C RATIOS 31 EXHIBIT 2.22 WORST CONGESTED ROADWAYS FOR BASE YEAR EXHIBIT 2.23 WORST CONGESTED ROADWAYS IN 2040 ( NO BUILD ) 32 EXHIBIT 2.24 LEXINGTON AREA FREIGHT FOCUS NETWORK 33 EXHIBIT 2.25 HEAVY TRUCK RATES ON FREIGHT FOCUS ROADWAYS 34 EXHIBIT 2.26 FREIGHT FOCUS ROADWAY NETWORK & RELATED VOLUME SERVICE FLOWS 35 EXHIBIT 2.27 LEXTRAN RIDERSHIP 36 EXHIBIT 2.28 LEXTRAN FIXED ROUTES & WHEELS (PARATRANSIT) SERVICE AREA 38 EXHIBIT 2.29 INTER-CITY TRANSIT PROVIDERS WITHIN THE LEXINGTON MPO AREA 40 EXHIBIT 2.30 WHEELS RIDERSHIP & TRIP PURPOSE 42 EXHIBIT 2.31 BLUEGRASS AIRPORT DIRECT FLIGHTS 44 EXHIBIT 2.32 BICYCLE & PEDESTRIAN FACILITY MILEAGE 47 EXHIBIT 2.33 EXISTING BICYCLE FACILITIES 48 EXHIBIT 2.34 PERCENT SIDEWALK COVERAGE ON MAJOR ROADS 49 EXHIBIT 2.35 LOCATION OF SIDEWALKS ON MAJOR ROADS 50 EXHIBIT 2.36 LEXINGTON WALK SCORE 51 EXHIBIT 2.37 CRITICAL CRASH RATES OF ROADS 53 EXHIBIT 2.38 FAYETTE COUNTY AVERAGE ANNUAL VEHICLE, PEDESTRIAN AND BICYCLE COLLISIONS 54 EXHIBIT 2.39 JESSAMINE COUNTY AVERAGE ANNUAL VEHICLE, PEDESTRIAN AND BICYCLE COLLISIONS 55 EXHIBIT 2.40 DENSITY OF VEHICULAR COLLISIONS AT INTERSECTION AND NON-INTERSECTION LOCATIONS M e t r o p o l i t a n T r a n s p o r t a t i o n P l a n Page iv
7 EXHIBIT 2.41 DENSITY OF PEDESTRIAN AND BICYCLE COLLISIONS 57 EXHIBIT 2.42 OZONE LEVELS IN THE MPO AREA 60 EXHIBIT 2.43 PARTICULATE MATTER LEVELS IN THE MPO AREA 61 EXHIBIT 3.1 LEXINGTON AREA MPO TRAVEL DEMAND MODEL INPUTS 73 EXHIBIT 3.2 EXAMPLE OF TRAVEL PATTERN (AIRSAGE) DATA FOR THE LEXINGTON AREA MPO 74 EXHIBIT 3.3 LEXINGTON MPO TRAVEL DEMAND MODEL AREA 74 EXHIBIT 3.4 MTP HIGHWAY REVENUE ESTIMATES FOR THE LEXINGTON AREA MPO ( ) 79 EXHIBIT 3.5 SUMMARY OF SHORT AND LONG-RANGE HIGHWAY REVENUE ESTIMATES 79 EXHIBIT 3.6 SUMMARY OF SHORT AND LONG-RANGE TRANSIT REVENUE ESTIMATES 80 EXHIBIT 3.7 MAINTENANCE & OPERATIONS ESTIMATES 82 EXHIBIT 3.8 PROJECT SOURCES FOR MTP CONSIDERATION 83 EXHIBIT 4.1 ELIGIBLE PROJECT TYPES FOR MAJOR MTP FUNDING CATEGORIES 90 EXHIBIT MTP SHORT RANGE FINANCIAL PLAN (T.I.P. TABLE) 94 EXHIBIT 4.3 LEXINGTON AREA MPO TRANSPORTATION IMPROVEMENT PROGRAM MAP 95 EXHIBIT 4.4 LONG RANGE FINANCIAL PLAN: ALLOCATION TARGETS BY PROJECT CATEGORY (%) 96 EXHIBIT 4.5 LONG RANGE FINANCIAL PLAN: ALLOCATION TARGETS BY PROJECT CATEGORY ($) 96 EXHIBIT FUNDING TARGET AMOUNTS: BY PROJECT CATEGORY & BY YEAR 97 EXHIBIT FUNDING TARGET AMOUNTS: CAPACITY & MODERNIZATION IMPROVEMENTS 97 EXHIBIT MTP PROJECT ABBREVIATION KEY 99 EXHIBIT MTP PROJECT MAP: CAPACITY & MODERNIZATION IMPROVEMENTS 100 EXHIBIT MTP LONG RANGE IMPROVEMENT PROJECTS: EXHIBIT MTP LONG RANGE IMPROVEMENT PROJECTS: EXHIBIT MTP LONG RANGE IMPROVEMENT PROJECTS: EXHIBIT MTP LONG RANGE IMPROVEMENT PROJECTS: EXHIBIT MTP LONG RANGE IMPROVEMENT PROJECTS: EXHIBIT 4.15 AVERAGE TRAVEL TIME REPORTED BY TRANSIT USERS VS. MOTORISTS 107 EXHIBIT 4.16 TRANSIT FINANCIAL PLAN: SHORT & LONG RANGE REVENUE AND EXPENDITURES 111 EXHIBIT 4.17 COST OF PAVEMENT REHABILITATION OVER TIME 117 EXHIBIT 4.18 KENTUCKY DESIGNATED NATIONAL TRUCK NETWORK 127 EXHIBIT 4.19 MTP FISCAL CONSTRAINT SUMMARY IN YEAR OF EXPENDITURE DOLLARS 130 EXHIBIT 4.20 VMT & VHT ON THE MPO ROAD NETWORK IN 2040 UNDER BUILD VS NO BUILD SCENARIO 131 EXHIBIT 4.21 FORECASTED CONGESTION LEVELS IN 2040 UNDER BUILD AND NO BUILD SCENARIO 132 EXHIBIT 4.22 MTP 2040 PERFORMANCE MEASURES FOR THE LEXINGTON AREA MPO 133 EXHIBIT 4.23 MAP-21 NATIONAL PERFORMANCE GOALS M e t r o p o l i t a n T r a n s p o r t a t i o n P l a n Page v
8

9 2040 Metropolitan Transportation Plan Page 1
10

11 Chapter 1 Introduction The transportation system is one of our most significant public assets and represents the largest allocation of public space in our community. Thus, transportation shapes our community identity and quality of life. Transportation enables us to engage in economic, social and other human activities, allowing our region to sustain, grow and thrive. Rights of way belong to every citizen and the transportation facilities and services conveyed within the right of way help us meet our daily needs for goods, services, education, employment and recreation. Sound investments in an interconnected, multimodal transportation system are the foundation for a strong economy and for the daily human interactions that take place in our community. 1.1 Purpose of the MTP The 2040 Metropolitan Transportation Plan (MTP) is a 26-year plan that communicates the future vision, goals, strategies, projects and programs for transportation in the Central Kentucky Region, with a focus on the planning area of Fayette and Jessamine County. The plan sets forth strategies for moving people and goods within our region safely and efficiently. The MPO transportation planning process enables a regional perspective through a comprehensive, coordinated and continuous planning process. The process is data-driven, goal-oriented and facilitates meaningful input from stakeholders and the public. IT also encourages us to examine and learn from our past, understand where we are at present, and determine our best future direction. Funding for transportation is and will continue to be limited and competitive, so we must focus on our top priorities and invest in the right transportation projects and programs. Our long range plans must be developed in a financially realistic manner, meaning we cannot plan to spend more than we expect to receive. Finally, our plan must be developed through engaging key stakeholder organizations and the people within our region. Key purposes of the 2040 MTP and transportation planning process are to: establish a regional vision guide future transportation policies and strategies project future demand for transportation services prioritize projects and programs develop a systems level approach considering all transportation modes and intermodal connections ensure fiscal balance by estimating costs and reasonably available financial sources for operation, maintenance and capital investments develop plans to preserve existing roads and facilities and make efficient use of the existing system ensure and reflect public and stakeholder input 2040 M e t r o p o l i t a n T r a n s p o r t a t i o n P l a n Page 1
.")
 in developing transportation plans.")
12 1.2 About the MPO Federal law requires all census urbanized areas with populations greater than 50,000 to designate a Metropolitan Planning Organization (MPO) to conduct transportation planning activities (Title 23 United States Code, and 49 U.S.C. 450). Urbanized areas with populations over 200,000 are designated as Transportation Management Areas or TMAs which carry additional planning and funding requirements. The MPO process is required to be comprehensive, coordinated and continuous (3C s) in developing transportation plans. MPOs that are certified as meeting federal transportation planning requirements are eligible for federal transportation funding. Planning Area There are currently nine MPOs in Kentucky. The Lexington Area MPO consists of Fayette and Jessamine County and the cities of Lexington, Nicholasville and Wilmore. The MPO land area consists of 458 square miles and has a population of 344,389 persons per the 2010 U.S. Census. For the first time, the 2010 U.S. Census designated a small portion of Scott County as part of the Urbanized Area and thus part of the MPO planning area. The Lexington Area MPO is now coordinating with officials from Scott County / City of Georgetown to establish a consensus on their desired level of involvement in the MPO transportation planning process. This discussion and decision will be finalized after the adjusted urbanized boundary is approved in mid Exhibit 1.1 Lexington MPO Planning Area 2040 M e t r o p o l i t a n T r a n s p o r t a t i o n P l a n Page 2
13 MPO Core Functions Per federal requirements, the core functions and planning documents of the MPO are listed below. These functions and work products are accomplished through a decision making Transportation Policy Committee (TPC), several technical sub-committees and technical professional staff (see Exhibit 1.3). These functions include: 1. Establish a fair and impartial setting to make regional decisions 2. Identify and evaluate transportation improvement options 3. Involve the public and key stakeholders 4. Participate in air quality planning 5. Develop and maintain a Congestion Management Process 6. Develop and maintain 4 key planning documents: Unified Planning Work Program Participation Plan Transportation Improvement Program Metropolitan Transportation Plan Outlines the annual work activities of the MPO Outlines strategies for public and stakeholder involvement Short range implementation plan for projects and programs in the region (4 year horizon) Long range transportation plan for the region (at least 20 years) Exhibit MPO Planning Documents To develop the MTP, the MPO works with federal, state and local governments, transit agencies, transportation stakeholders and the public to ensure transportation policies, plans, projects and programs move the region forward based upon mutually agreed upon goals and objectives. Much of this work takes place through committees, including the Transportation Policy Committee. Transportation Policy Committee (TPC) The TPC is the policy and decision-making body for the Lexington Area MPO. The TPC is comprised of elected and appointed officials from the City of Wilmore, Nicholasville and Lexington; Jessamine and Fayette County; LexTran; Federated Transportation Services of the Bluegrass; and the Kentucky Transportation Cabinet. The TPC has advisory (non-voting) members from the Federal Highway Administration (FHWA) and the Federal Transit Administration (FTA). Transportation Technical Coordinating Committee (TTCC) The Transportation Technical Coordinating Committee (TTCC) exists to enhance consultation among transportation and community stakeholders and to advise the TPC on technical matters. Four subcommittees of the MPO provide input and focus on specific transportation issues including: Air Quality Advisory Committee (AQAC) Bicycle/Pedestrian Advisory Committee (BPAC) Congestion Management Committee (CMC) Traffic Safety Coalition (TSC) 2040 M e t r o p o l i t a n T r a n s p o r t a t i o n P l a n Page 3

14 Exhibit 1.3 MPO Organizational Structure 2040 M e t r o p o l i t a n T r a n s p o r t a t i o n P l a n Page 4
15 1.3 The Process The MTP must be updated every five years and cover at least a twenty year period. This Lexington Area MPO 2040 MTP covers a 26-year planning period from 2014 to The MPO s approach developing the MTP and ongoing transportation planning activities included steps to: Assess existing transportation system Predict future travel demand Assess community needs & desires Establish regional visions, goals and objectives Identify solutions & strategies Predict future financial resources Develop long-range and short-range investment strategies Prioritize and evaluate projects & programs Implement the plan & monitor system performance The Lexington Area MPO planning process and the MTP consider certain national goals. Per the current transportation reauthorization bill entitled the Moving Ahead for Progress in the 21 st Century Act (MAP-21), MPOs must consider and emphasize eight planning factors when developing local and regional goals, plans, programs and priorities. In addition to the planning factors, MAP 21 also created performance based goals for planning areas. These national performance goals are discussed in more detail in Chapter 4, Performance Measures. MAP-21 Planning Factors 1. Support the economic vitality of the metropolitan area, especially by enabling global competitiveness, productivity, and efficiency. 2. Increase the safety of the transportation system for motorized and non-motorized users. 3. Increase the security of the transportation system for motorized and non-motorized users. 4. Increase the accessibility and mobility of people and for freight. 5. Protect and enhance the environment, promote energy conservation, improve the quality of life, and promote consistency between transportation improvements and State and local planned growth and economic development patterns. 6. Enhance the integration and connectivity of the transportation system, across and between modes, people and freight. 7. Promote efficient system management and operation. 8. Emphasize the preservation of the existing transportation system M e t r o p o l i t a n T r a n s p o r t a t i o n P l a n Page 5
16 In 2009, The Environmental Protection Agency (EPA), the U.S. Department of Housing and Urban Development (HUD), and the U.S. Department of Transportation (DOT) formed a Partnership for Sustainable Communities to help communities improve access to affordable housing, more transportation options, and lower transportation costs. They established livability principals that were adopted by the TPC in The MTP 2040 continues a commitment to these principles. Livability Principles Provide more transportation choices. Develop safe, reliable, and economical transportation choices to decrease household transportation costs, reduce our nation's dependence on foreign oil, improve air quality, reduce greenhouse gas emissions, and promote public health. Promote equitable, affordable housing. Expand location- and energy-efficient housing choices for people of all ages, incomes, races, and ethnicities to increase mobility and lower the combined cost of housing and transportation. Enhance economic competitiveness. Improve economic competitiveness through reliable and timely access to employment centers, educational opportunities, services and other basic needs by workers, as well as expanded business access to markets. Support existing communities. Target federal funding toward existing communities through strategies like transit oriented, mixed-use development, and land recycling to increase community revitalization and the efficiency of public works investments and safeguard rural landscapes. Coordinate and leverage federal policies and investment. Align federal policies and funding to remove barriers to collaboration, leverage funding, and increase the accountability and effectiveness of all levels of government to plan for future growth, including making smart energy choices such as locally generated renewable energy Value communities and neighborhoods. Enhance the unique characteristics of all communities by investing in healthy, safe, and walkable neighborhoods rural, urban, or suburban. MTP Approval The MPO Transportation Policy Committee (TPC) directs the development of the MTP and formally approves the plan following public and stakeholder input. A copy of the TPC Resolution adopting the 2040 MTP is in Appendix A. The MTP is submitted to the Kentucky Transportation Cabinet (KYTC), Federal Highway Administration (FHWA) and Federal Transit Administration (FTA) for their review regarding compliance with federal requirements. The MTP is updated every 5 years and may be amended or modified by the TPC, providing a direct and continuing role in project programming. MTP Amendment Amendments to the MTP are major revisions that include adding or deleting a significant project or major changes to a project (including design concept and scope). Amendments require public review and re-demonstration of fiscal constraint. The notification process for public and stakeholder input for MTP Amendments are outlined in the MPO Participation Plan. MTP Administrative Modification Minor changes to phasing, costs, funding sources, or estimated project dates within the MTP may be completed as Administrative Modifications per the MPO Participation Plan. Projects types listed in Grouped Projects (Appendix B) may be added by Administrative Modification and do not require public review M e t r o p o l i t a n T r a n s p o r t a t i o n P l a n Page 6
17 1.4 National, Regional and Local Trends in Transportation Nationally, there has been a recent trend toward less personal automobile use than in the past. Many transportation research and public policy agencies have been monitoring and exploring the implications of this trend for transportation investment in the coming years. The following discussion summarizes some of the key finding of the U.S. Public Interest Research Group Education Fund in their paper titled A New Direction Our Changing Relationship with Driving and the Implications for America s Future. From a national, regional and local perspective it appears the driving boom, a six decade long period of steady increases in per-capita driving, is likely over (see Chapter 2 for a discussion of driving trends in the MPO area). Americans drove more miles nearly every year between 1945 and 2004; however, this growth has leveled off during the last decade and has even reversed in recent years. A return to steady year-over-year increases in vehicle miles of travel (VMT) is not expected due to Baby Boomers retiring from the work force, continuing high fuel prices, technological advances that reduce the need for travel (teleconference, online shopping, etc), fewer people purchasing vehicles and obtaining driver s licenses, Americans tolerance for time spent in traffic, travel preferences and the travel needs of younger and older populations (Millennials and Baby Boomers, respectively) that are growing in size. While Americans drive less today than they did eight years ago, there has been a steady increase in public transportation use, bicycle trips and working at home (or telecommuting). Americans took nearly 10% more trips via public transportation in 2011 than we did in 2005 and saw increases in commuting by bike and foot. The major policy implications, new challenges and opportunities outlined in the report associated with these trends include: Less need for roadway capacity and expansion A need to revisit plans for new or expanded highways More resources to maintain the system in a state of good repair if significant capital outlays for new capacity are reduced Less dependency on foreign oil Less vehicle use equating to less wear and tear on the roadway system Less driving equating to less revenue collected from fuel usage tax Uncertainty in planning for the future when the continuation of trends is unknown Being responsive to the desire to drive less by Millennials and older Americans Researchers suggest three future scenarios 1) a reversal of declining VMT trends (back to the future), 2) a stabilization of VMT trends (enduring shift) or 3) a continuation of declining VMT (ongoing decline). Researchers agree that likely scenarios include a leveling off or on-going decline of VMT in the coming decades M e t r o p o l i t a n T r a n s p o r t a t i o n P l a n Page 7

18 National Travel Trends Vehicle Miles Tra Declined 2006 p Future Trend 1. Back to the Future VMT trend reverses a 2. Enduring Shift Continued VMT stabi 3. Ongoing Decline Declining VMT contin Exhibit 1.4 National Vehicle Miles Travel Trends Source: U.S. Public Interest Research Group Education Fund Within the MPO planning area, many local issues that are consistent with national trends have been observed through local data and through community outreach activities including: The composition of the population is changing. Age groups in their peak driving years used to make up 23% of our population, but make up only 12% today. Transportation and housing is costing us more than it did in the past. Vehicle miles of travel have declined for Fayette and Jessamine Counties. The cost of infrastructure is rising. Residents support land use planning and urban design that reduces the need for vehicular travel. Residents support multimodal options including transit, biking and walking. Residents support more emphasis on maintenance, operations and efficiency. Residents show concern for our environment M e t r o p o l i t a n T r a n s p o r t a t i o n P l a n Page 8

19 1.5 New Directions of the MTP Similar to most large urbanized areas, traffic is among the top complaints of people in the Lexington area. There is little doubt that being stuck in traffic is frustrating, expensive and inefficient in many ways. However, traffic can be a positive indication of an area s economic growth. How a community chooses to address travel demand (or traffic ) and facilitate the movement of goods is critical to sustaining good economic growth. Many communities have come to the realization that building out of congestion, primarily through new and widened roadways, can ease the pain of traffic in the short term, but not in the long term, and that continued expansion is not sustainable financially or in keeping pace with population growth. Even though per capita travel trends are declining, we must recognize that the area s population has and will continue to grow. The population in the MPO area is expected to reach nearly 500,000 by With this growth, we know we will need to improve on our transportation system and continue to focus on maximizing efficiency and on stabilizing and reducing personal auto use and vehicle miles of travel. This requires investment in broad range of strategies and improvements including: Multimodal capacity and facilities More and better bicycle facilities Intersection, interchange and corridor modernization and upgrades (better or innovative designs) to provide more efficient operation Intersection, or bottleneck, improvements (turn lanes, signal improvements) Improved connectivity and access management More and better sidewalks and crossings that meet Americans with Disabilities Act standards More transportation options for all segments of the population, including transit dependent and low income groups. Transit system expansions to improve local service and regional transit to serve growing satellite communities (i.e. vanpool, bus, rideshare) More and better operations and maintenance to maximize safety and efficiency Safety improvements and programs 2040 M e t r o p o l i t a n T r a n s p o r t a t i o n P l a n Page 9

20 Thus, the 2040 MTP proposes a new direction for transportation investment in the Lexington Area with the goal to maintain our vibrancy while offering reliable, affordable, safe and efficient mobility for people and goods. Our mantra will be about moving people and our success will be judged by how well we move the most people as efficiently and economically as we can, not just how well we move vehicles. These are not new ideas to the Lexington Area, but the 2040 MTP is a bold new step in providing the real financial support that is needed to fully accomplish our goals. Source: M e t r o p o l i t a n T r a n s p o r t a t i o n P l a n Page 10
21 1.6 Goals and Objectives Considering local input and the MAP-21 goals and emphasis areas, the MPO has set forth the following goals and objectives for the Lexington Area. These establish a foundation for MTP projects, programs and investments moving forward. Transportation Goals Provide for safe travel for all users Provide access and choices Provide connectivity within and between modes Be efficient, reliable and well maintained Support economic vitality and competitiveness Contribute to community character Enhance the environment Support health and wellness Objectives Reduce fatalities and injuries by identifying hazards and conflicts within and between modes and by implementing safety improvements. Remove barriers to travel for all modes and people of all ages and abilities by investing in projects that increase connectivity of streets, sidewalks, bikeways and transit service. Adopt a fix it first approach to transportation investment. Maximize existing infrastructure by targeting investments to reduce congestion. Invest in a range of travel choices and tools that reduce congestion including access management, bicycle and pedestrian facilities, intelligent transportation systems and transit improvements. Foster and promote increased ride-sharing and transit ridership. Coordinate land use, urban design, transportation and planning activities to make travel more efficient and accessible for all people. Provide walkable, transit-oriented transportation corridors. Ensure access to jobs, education, goods and services for all citizens including underserved populations, people with disabilities, youth and seniors through investments in public transit, para-transit and other mobility services. Ensure projects contribute to community character and are context-sensitive including appropriate design speeds, landscaping, public art, streetscape elements, preserving viewsheds and other cultural or historic resources. Facilitate regional transportation needs and solutions. Promote the use of efficient travel modes, fuels, vehicles and other innovative technologies to improve air quality. Consider the impact of transportation investments and projects on the health and wellness of communities and people. Ensure economic vitality by examining current and future needs for efficient goods and freight movement into and out of the region via roadways, railways and air. Monitor current and changing attitudes, trends and travel behaviors M e t r o p o l i t a n T r a n s p o r t a t i o n P l a n Page 11
22

23 2040 Metropolitan Transportation Plan Page 13
24
25 Chapter 2 Our Past, Present and Future Examining our region today and anticipating future needs helps inform the MPO and decision-makers on how transportation investments should be made over the coming 26 years. When developing the MTP, we ask ourselves where growth has occurred in the past and where it is expected it in the future. What are the current population trends and how will they change over time? How and where do people travel now and how might travel patterns differ in the future? What is the present condition of our transportation infrastructure? Where do we have or expect deficiencies? What are the needs of the region and the transportation network both now and in the future? How does the transportation system impact our environment and our region s safety and security? 2.1 Population Trends Travel demand is correlated to the number of people living in a region, their employment status, age, household size and income. Looking at the past and present composition of our population and our changing demographics can help us understand current travel patterns and predict how travel demand or preferences may change in the future Population Growth Each person in a region contributes to the overall demand for travel, whether traveling to and from work, school, running errands, shopping or for recreation and entertainment. The total population for the MPO area is approaching 350,000 with 86% living in Fayette County and 14% residing in Jessamine County. 500,000 Population Growth 480,268 MPO Population in 2011 Region Fayette % of total Jessamine % of total 344, ,803 86% 48,586 14% 400, , , , Jessamine Exhibit 2.1 Total Population & Population Growth for the MPO Area Source: American Community Survey 5 Yr Estimate ( ) & Kentucky State Data Center Fayette M e t r o p o l i t a n T r a n s p o r t a t i o n P l a n Page 15
 are expected to live in the region. Exhibit 2.")
26 Over the last several decades, the MPO s population has increased by nearly 45,000 people for each 10-yr census period, equivalent to a 35% increase in residents from 1990 to In 2040, over 480,000 people (40% more than today) are expected to live in the region. Exhibit 2.2 Population Growth Areas Source: MPO Travel Demand Model M e t r o p o l i t a n T r a n s p o r t a t i o n P l a n Page 16

27 % Population Age Distribution A person s age correlates to the number of trips they take in any given day. For instance, people who are employed and have children living at home generate a greater number of trips per day; whereas a student living on a college campus, or a retired senior, generate fewer trips. The age structure of the MPO region is changing, primarily by growing older than it once was. Historically, people aged 35 to 44 (considered to be in their peak travel/driving years) represented a significant percentage of the population. Moving forward from 2010, this age group will comprise only 13% of the population compared to 23% in the past. Younger ages that will enter their peak driving years during the span of the MTP planning period are also holding steady and/or shrinking. Further, in 2040 a much larger percentage of the population will be aged 65 and older, comprising 16% of the population in 2040 compared to 11% today. 25 MPO Age Distribution ( ) Exhibit 2.3 Population Age Distribution for the MPO Area Source: US Census & Kentucky State Data Center Households The number of households and average number of people living within a household is also a predictor of travel demand. Greater numbers of households and larger household sizes equate to more trips. According to the 2009 National Household Travel Survey, each individual within a household generates an average of 3.79 person trips per day (equivalent to just over 1.3 million trips per day for the Lexington Area MPO region in 2010). Although the overall population and number of households in the MPO area continues to grow, household size has slowly, but steadily declined (similar to national trends) M e t r o p o l i t a n T r a n s p o r t a t i o n P l a n Page 17
28 Households Persons Number of Households Houshold Size 200, , ,000 50, ,195 80,542 30,425 10, Fayette Jessamine Fayette Jessamine Exhibit 2.4 Number and Size of Households in MPO Area Source: US Census & Kentucky State Data Center The total number of households in the region grew by 54% from 91,074 to 140,685 between 1990 and Whereas, population growth for that same period was only 35 percent, meaning there is a greater number of households of smaller size than there has been in the past. In 2040, it is estimated that just over 480,000 people will live in the region, residing in over 208,000 households, representing an increase of 48% in the number of households during the next 25 years. These smaller households will be comprised of younger and older generations than in the past Labor Force & Employment The size of the labor force and the number of people employed in a region is a strong predictor of travel rates. Within the MPO region, the percentage of residents in the labor force has remained steady at percent and closely mirrors total population distribution (87% of the region s labor force resides in Fayette County and 13% in Jessamine County). The labor force also grew in step with population growth from 1990 to 2010 ( 36%). Note: The labor force represents those living in, but not necessarily working in, the MPO region. MPO Population and Labor Force Growth /- (#) / - (%) Population 255, , , , % Labor Force 139, , , , % Labor Force as % of Pop. 55 % 56 % 55 % Exhibit 2.5 Population and Labor Force Growth Source: US Census & American Community Survey (5 yr Estimate) Today, it is estimated that 152,000 people work in the MPO region (either living in the MPO area or commuting into the MPO area). Employment is expected to grow to over 236,000 by Exhibit 2.6 below shows those areas that are expected to experience the greatest growth in employment M e t r o p o l i t a n T r a n s p o r t a t i o n P l a n Page 18

29 Exhibit 2.6 Employment Growth Areas Source: MPO Travel Demand Model M e t r o p o l i t a n T r a n s p o r t a t i o n P l a n Page 19
. Thus, particular attention is paid to peak hour commuting patterns.")

30 2.2 Commuting Trends Commuting to work or school represents just 1 of 4 trips taken by an individual each day; however, it is often the longest trip of the day and occurs during peak travel periods (i.e. when the transportation system experiences the greatest demand). Thus, particular attention is paid to peak hour commuting patterns. This section explores commuting trends in the MPO including where people go, how they get there and how long it takes them Commuting Patterns Lexington is a major employment hub for the Bluegrass area. Jessamine County and Nicholasville are also a fast growing county/city with steady employment growth. Estimates from the American Community Survey indicate that just over 53,000 people commute into Fayette County each day, of which 35,000 are commuting directly from adjacent counties. The three counties with the largest influx of workers into Fayette include 10,000 workers from Jessamine County (43% of the Jessamine County labor force), 7,200 from Madison County (18% of the Madison County labor force) and 6,500 from Scott County (30% of the Scott County labor force). Eighty-eight percent of the labor force living in Fayette County also works in Fayette County. Twelve percent (18,000+) people commute to workplaces outside of Fayette County. Three-quarters (nearly 13,000) are commuters traveling to workplaces located in immediately adjacent counties with major workplaces including Toyota in Georgetown, state government offices in Franklin County and various locations in Jessamine County. Commutes into and out of Fayette County primarily take place along the major arterials leading into and out of Lexington. As population and employment growth continues into the future, these major arterials will continue to serve these commuting patterns at the regional level. Total into Fayette (region-wide) = 53,202 Total into Fayette (adjacent county shown above) = 35,544 Total out of Fayette (region-wide) = 22,085 Total out of Fayette (adjacent county shown above) = 14,270 Exhibit 2.7 Commutes Into and Out of Fayette County Source: MPO Travel Demand Model M e t r o p o l i t a n T r a n s p o r t a t i o n P l a n Page 20
 and US 68 (Harrodsburg Road).")
 of commutes made into Jessamine are from Fayette County.")
 = 10,622 Exhibit 2.8 Commutes Into and Out of Jessamine County Source: MPO Travel Demand Model 2.2.2 Commuting Modes According to the US Census, 80 percent of Lexington area residents report driving alone as their primary means of commuting to work.")
31 Percent Forty-seven percent of the workforce living in Jessamine County commutes out-of-county each day. Ninety percent work in directly adjacent counties. Of the nearly 12,000 out-of county commuters, eight-five percent are commuting to Lexington, primarily along US 27 (Nicholasville/Lexington Road) and US 68 (Harrodsburg Road). The ACS estimated there are just over 7,500 regular commuters into Jessamine County from the region, of which nearly 6,000 (78%) commute from directly adjacent counties. Seventy percent (4,000+) of commutes made into Jessamine are from Fayette County. Total into Jessamine (region-wide) = 7,686 Total into Jessamine (adjacent counties shown above) = 5,942 Total out of Jessamine (region-wide) = 11,786 Total out of Jessamine (adjacent counties shown above) = 10,622 Exhibit 2.8 Commutes Into and Out of Jessamine County Source: MPO Travel Demand Model Commuting Modes According to the US Census, 80 percent of Lexington area residents report driving alone as their primary means of commuting to work. Comparatively, the national average for workers driving alone is 91% (2009 NHTS). Over the last 20 years ( ) this rate has remained relatively stable in the MPO area, particularly in Fayette County. There was a notable increase in single occupancy vehicle use reported in 1990 compared to 1980 (when only percent of individuals were driving alone). Workers Driving Alone Fayette Jessamine (ACS 5y Est) Exhibit 2.9 Percent of Workers Driving Alone to Work in the MPO Area Source: 1990 & 2000 US Census & American Community Survey (5 yr Estimate) M e t r o p o l i t a n T r a n s p o r t a t i o n P l a n Page 21
 1990 2000 2011 (ACS 5y Est.) Exhibit 2.")
32 Percent Percent Fayette County Travel Mode to Work Carpool Public transit Walk Bicycle Worked at home Jessamine County Travel Mode to Work Carpool Public transit Walk Bicycle Worked at home (ACS 5y Est) (ACS 5y Est.) Exhibit 2.10 Travel Mode to Work Other than Driving Alone (% Mode Share) Source: 1990 & 2000 US Census & American Community Survey (5 yr Estimate) The remaining ±20 percent of commuters in Fayette and Jessamine County report carpooling, walking, bicycling and using public transportation. There was a drop in carpooling and public transit use from 1980 to 1990 that corresponds to the increase in workers driving alone. Over the last several decades there has been a gradual decrease in walking to work and a steady increase in bicycle commuting. Public transit use as a primary mode to work in Fayette County followed a slow steady decline during the last several decades until a reversal during the last ten years (2000 to 2010), presumably in response to improved transit service as a result of stabilized funding per a Fayette County property tax. Additionally, more and more people are working from home as technology has made telecommuting more feasible for many workers and employers. It is anticipated that telecommuting will continue to increase in the future. Currently 3-5% of residents in the MPO area work from home. Travel Mode to Work % Change ( ) Walk to Work Fayette 5.1% 5.0% 3.8% -25% Jessamine 5.5% 3.5% 3.4% -38% Bike to Work Fayette 0.4% 0.6% 0.9% +125% Jessamine 0.35% 0.01% No data -97% * Transit to Work Fayette 1.6% 1.3% 1.6% 0% Jessamine NA NA NA NA Carpool to Work Fayette 12% 11% 10% -16% Jessamine 14% 13% 10% -28% Exhibit 2.11 Travel Mode to Work Other than Driving Alone (% Change) Source: 1990 & 2000 US Census & American Community Survey (5 yr Estimate) M e t r o p o l i t a n T r a n s p o r t a t i o n P l a n Page 22

33 While the primary travel mode reported by commuters is an important planning consideration - particularly for anticipating peak hour travel demand and potential congestion - the data collected by the US Census is not the best indicator of overall alternative mode usage. First, it does not capture semi-regular or occasional trips taken by other modes. Second, it only gauges mode use for commuting to work, not other utilitarian or recreational trips, which outnumber commuting trips 4 to 1. The 2009 National Household Travel Survey shows that on average Americans are least likely to bicycle and walk for commuting purposes (3-5% bike/walk combined) but more likely to bike and walk for personal errands (9%), going to school or church (9%) and for socializing or recreation (17%), etc. Such personal travel surveys, as well as count data for all modes, that can more accurately account for actual bike and walk trips are not currently available for the MPO area Travel Times The average travel time to work has remained relatively stable over the last years, particularly in the last decade. Travel time remained flat in Fayette County from 2000 to 2010 and even decreased slightly in Jessamine County from 24.1 minutes to This indicates some improved efficiency of travel via capacity, operational and multimodal efforts, despite overall population growth and subsequent increases in travel demand. The Lexington Area MPO average commute time compares favorably to other metro areas. The average travel time to work for urban areas under 500,000 in population is 35 minutes with peer cities including Greensboro, North Carolina; Madison, Wisconsin and Columbia, South Carolina (2012 Urban Mobility Report Texas A&M Transportation Institute). Average Commute Travel Time Fayette Jessamine (ACS 5y Est) Exhibit 2.12 Average Commute Travel Time in MPO Area Source: 1990 & 2000 US Census & American Community Survey (5 yr Estimate) M e t r o p o l i t a n T r a n s p o r t a t i o n P l a n Page 23

34 VMT (x1,000) / day VMT (x 1,000)/day VMT (x1,000)/day Vehicle Travel Vehicle miles of travel (VMT) in the Lexington area has generally held steady over the last 10 to 12 year period. Fayette County has experienced 7.5 to 8.0 million miles of travel per day which includes many vehicles passing through the area on I-75 and I-64 (approximately 26 miles of vehicular travel per person, per day). Jessamine County has a total of 1 million miles of travel per day (approximately 21 miles of vehicular travel per person, per day). 9,000 Vehicle Miles Traveled 8,000 7,000 6,000 5,000 4,000 3,000 2,000 1, Fayette Jessamine Exhibit 2.13 Vehicle Miles of Travel in MPO Area Source: Highway Performance Monitoring System (HPMS), Kentucky Transportation Cabinet While these totals have held fairly constant on a large scale, a closer look, at a more refined scale, shows a pattern that mirrors national trends. Both counties had a peak in VMT between 2007 and 2010 and a drop-off in the last 3+ years. As more people live and work in the MPO area, the amount of driving seems to have peaked and may be in decline. The reasons for the decline have been mentioned previously (aging population, working at home, cost of fuel, etc.) thus we can no longer assume a continued increase in traffic volumes across the area. Certain roads in high growth areas will continue to show greater volumes of vehicles, but other facilities may have reached their peak and will not experience the traditional year-after-year growth. 7,900 7,800 7,700 7,600 7,500 7,400 7,300 7,200 7,100 Fayette County Vehicle Miles Traveled Jessamine County Vehicle Miles Traveled 1,040 1,020 1, Exhibit 2.14 Vehicle Miles of Travel in Fayette & Jessamine County Source: Highway Performance Monitoring System (HPMS), Kentucky Transportation Cabinet M e t r o p o l i t a n T r a n s p o r t a t i o n P l a n Page 24

35 2.3 Transportation System Transportation systems exist to provide social and economic connections. They provide people with access to jobs, education, good and services, friends and family. They provide for economic growth by facilitating the movement of goods and services throughout a community, a region, the nation and around the world. By nature, transportation systems are both multi-modal and inter-modal and each element plays a role in the overall movement of people and goods Roadway Network There are over 1,700 miles of roadways in the MPO Region. The road network consists of arterials, collectors and local roads in the urban and rural area as well as Interstates I-64 and I-75 in Fayette County. In Fayette County, the arterials include five US highways and seven KY State highways, converging and diverging radially from the center of Lexington. The five main north-south corridors are US-25, US-27, US-68, KY-922 and KY The three main east-west corridors are US-60, US-421, and KY New Circle Road, KY-4, loops around Lexington within the Urban Service Area. Man O War Boulevard makes a half-loop in the south area of Lexington-Fayette County. In Jessamine County, the two main north-south highways are US-27 and US-68. US-27 is designated as part of the National Highway System and carries the largest volumes of traffic in the county. The US 27 Bypass circles around the west side of Nicholasville, while Business US-27(X) passes through downtown Nicholasville. US-27 continues south and crosses Kentucky River at the Jessamine- Garrard County Line. US-68 continues southwest and crosses the Kentucky River at the Jessamine- Mercer County Line. Major east-west connecting routes in Jessamine County include KY 169, KY 29 and KY 39. Mileage In the MPO region, approximately 75% of the total road mileage is located in Fayette County and 25% of the total road mileage is located in Jessamine County (see Exhibit 2.15). Both counties have approximately 300 miles of rural roadways. Fayette County has nearly 1,000 miles of urban roads, whereas Jessamine County has 164 miles. Local streets and roads comprise about 70% of the total road system, with 30% of roadways being classified as collectors and arterials. Only roadways classified as a collector or arterial are addressed in the MTP and are eligible for federal funding M e t r o p o l i t a n T r a n s p o r t a t i o n P l a n Page 25

36 Roadway Mileage Fayette Co. Jessamine Co. Classification Miles % of Total Miles % of Total Rural Interstate % 0 0.0% Freeway & Expressway 0 0.0% 0 0.0% Principal Arterial % 9 1.9% Minor Arterial % % Major Collector % % Minor Collector % % Local % % Subtotal % % Urban Interstate 7 0.5% 0 0.0% Freeway & Expressway % 0 0.0% Principal Arterial % 7 1.5% Minor Arterial % % Major Collector % % Minor Collector 0 0.0% 0 0.0% Local % % Subtotal % % MPO Total = 1782 Miles % % Exhibit 2.15 Road Network Mileage within the MPO Area Source: Kentucky Transportation Cabinet Exhibit 2.16 Road Network by Roadway Classification Source: Kentucky Transportation Cabinet M e t r o p o l i t a n T r a n s p o r t a t i o n P l a n Page 26


37 Condition Keeping roadways and bridges in a state of good repair is of great importance to the public and a primary goal of transportation agencies. Poor pavement and bridge quality can degrade user experience, reduce safety, increase fuel consumption and operating costs, and cause damage to vehicles. Roadway and bridge condition is evaluated and tracked by both the KY Transportation Cabinet and local governments. Major roadways are evaluated by the KYTC, whereas local streets are evaluated and repaired by cities and counties within the MPO. The KYTC and local governments analyze the condition of pavement using several factors including the amount and severity of cracking or potholes, pavement smoothness and rutting. The KYTC places a greater emphasis on maintaining pavements that serve higher volumes of traffic and thus uses a sliding rating scale that holds hightraffic roadways to a higher standard of performance. Using this scale, roads are rated as good, fair, or poor depending upon the overall level of distress and the total traffic volume. Since 1998, the overall statewide percentage of all state-maintained pavements in good or fair condition has fluctuated between 79% and 86%. In 2011, good and fair pavements comprised 81% of the total state-maintained roadway mileage. Comparatively, 84 percent of roads in the Lexington Area were rated in good or fair condition from The state target for roads in good or fair condition is 92% Lexington Area Pavement Quality 2012 Lexington Area Pavement Quality 11% 5% 14% 22% 10% 6% 10% 20% 48% 54% Very Good <60 Good Fair Poor Very Poor >220 Very Good <60 Good Fair Poor Very Poor >220 Exhibit 2.17 Lexington Area Roadway Pavement Quality Source: Highway Performance Monitoring System (HPMS), Kentucky Transportation Cabinet M e t r o p o l i t a n T r a n s p o r t a t i o n P l a n Page 27
.")
38 Our bridges must be safe and sound to serve daily traffic demands. Per the National Bridge Inventory (NBI) Bridge Condition Data, Kentucky reported 1,897 NHS Bridges as being in deficiency status. This represents percent of bridges (the National bridge deficiency average is percent). A deficient rating does not necessarily mean a bridge is unsafe, rather that there are components that are in need of monitoring and/or replacement. As shown in Figure 2.16, Fayette County has a total of 196 bridges of which 134 (68%) are non-deficient structures. Fifty-two bridges are functionally obsolete (26%) and ten are structurally deficient (5%). Jessamine County has a total of 54 NBI bridges of which 32 (59%) are non-deficient structures. Thirty-seven percent (37%) of bridges in Jessamine County are functionally-obsolete and 4 percent (4%) are structurally-deficient bridges. Functionally obsolete: A bridge that is functionally obsolete is not necessarily unsafe. Indicates the bridge has older design features not built to today's standards. A functionally obsolete bridge is likely not wide or tall enough to accommodate current vehicle sizes, weights and traffic volumes. Structurally Deficient: A bridge that is structurally deficient is not necessarily unsafe. Indicates the bridge has elements that need to be repaired and/or monitored. A structurally deficient bridge should be maintained, inspected and monitored on a regular basis. MPO Area Bridge Condition Category Fayette Jessamine Total Number of Bridges Structurally-Deficient Bridges 10 2 Functionally-Obsolete Bridges Total Deficient Bridges Non-Deficient Bridges Source: FHWA Bridge Programs National Bridge Inventory (NBI) data for National Highway System (NHS) Bridges dated 12/31/2012 Exhibit 2.18 Lexington Area Bridge Condition Ratings Source: FHWA Bridge Programs National Bridge Inventory (NBI) (12/31/2012) M e t r o p o l i t a n T r a n s p o r t a t i o n P l a n Page 28

39 Congestion Congestion is a concern for the region and users of the transportation system. Congestion is defined as the level at which transportation system performance is no longer acceptable due to traffic interference resulting in decreased speeds and increased travel times. Severe congestion results in the loss of economic productivity (wasted time and slowed movement of goods and services) and environmental consequences including increased fuel consumption and vehicle emissions. Congestion management is a process that monitors transportation facilities and seeks to mitigate congestion through planning, operations, system management and projects that will effectively address bottlenecks and corridor-based congestion problems. The current transportation regulation, Moving Ahead for Progress in the 21 st Century Act (MAP-21) retains the requirement for MPOs to have a Congestion Management Process (CMP) in place for monitoring and reporting congestion, system performance and reliability. MAP-21 places additional emphasis on performance measurement and requires that it be completed in accordance with standards that will be established by FHWA in The Lexington Area MPO s CMP framework utilizes data, reports and studies to document congestion conditions through performance measures and identifies strategies to improve the system. Projects and programs identified in the MTP and TIP reflect this process by considering and weighting CMP performance measures and CMP solutions in the project selection and ranking process. CMP-related studies and documents are available at Travel Time Index In 2012, the MPO Congestion Management Committee (CMC) began developing and utilizing a Travel Time Index (TTI) to quantify congestion on major urban roadways. This was accomplished by working with the Kentucky Transportation Cabinet (KYTC) and the Kentucky Transportation Center (KTC) to analyze real-time Global Positioning System-probe (GPS-probe) speed data. The TTI is a ratio of travel speed during congested versus non-congested periods. The higher the TTI ratio, the greater the differential (i.e. the longer it takes to travel that roadway segment during peak times). The TTI for roadway segments were calculated for both AM and PM peak travel periods. Segments with the 10 worst TTIs are reported in Exhibits 2.19 and M e t r o p o l i t a n T r a n s p o r t a t i o n P l a n Page 29
40 Top 10 Worst AM Peak Travel Time Index ROUTE ROUTE NAME LIMIT A LIMIT B DIRECTION TTI RANK US 27 Nicholasville/Limestone Fay-Jess Co Line Man O War Inbound US 60 Midland/Winchester Rd I-75 Man O War Inbound KY 1425 Man O War Blvd I-75 Winchester Rd Innerloop KY 1974 Takes Creek Rd Man O War New Circle Rd Inbound US 25 Georgetown Rd New Circle Rd Fay-Scott Co Line Inbound US 25 Georgetown Rd W Main St New Circle Rd Inbound KY 1425 Man O War Blvd I-75 Winchester Rd Outerloop US 60 Midland/Winchester I-75 Man O War Outbound US 68 Harrodsburg/ S Broadway Man O War New Circle Rd Inbound US 25 Georgetown Rd New Circle Rd Fay-Scott Co Line Outbound Exhibit 2.19 Top 10 Worst AM Peak Travel Time Index Source: MPO Congestion Management Committee Top 10 Worst PM Peak Travel Time Index ROUTE ROUTE NAME LIMIT A LIMIT B DIRECTION TTI RANK US 27 Nicholasville/ S Limestone New Circle Rd Alumni Dr Inbound Local E High St Fontain Rd S Limestone Outbound US 60 Midland/ Winchester Rd I-75 Man O War Outbound Local S Limestone Ave. Champions W Main St Inbound KY 1974 Tates Creek Rd Man O War New Circle Rd Outbound US 27 Nicholasville/ S Limestone Man O War New Circle Rd Inbound US 25 Georgetown Rd New Circle Rd Fay-Scott Co Line Outbound US 25 Richmond Rd / E Main St New Circle Rd Midland Av Outbound KY 1425 Man O War Blvd I-75 Winchester Rd Outerloop KY 4 New Circle (Signalized) Newtwon Pike N Broadway Innerloop Exhibit 2.20 Top 10 Worst PM Peak Travel Time Index Source: MPO Congestion Management Committee Volume to Capacity Ratio and Level of Service Level of Service and Volume to Capacity ratios are common performance measure for transportation planning and congestion management. Traffic volume is defined as the number of vehicles that pass a point on a transportation facility during a specified time period, which is usually expressed in vehicles per hour or per day. Road or lane capacity, which is also expressed in vehicles per hour or per day, is the maximum traffic volume obtainable on a given road or lane. Volume to Capacity (V/C) ratio is a measure that reflects mobility and quality of travel on a facility or a section of a facility. It compares roadway demand (vehicle volume) with roadway supply (carrying capacity). For example, a V/C of 1.00 indicates the roadway is operating at its capacity. Level of Service (LOS), which is related to the V/C ratio, is a qualitative measure to describe roadway traffic and vehicular operating conditions based on factors such as speed, travel time, maneuverability, delay and safety. The level of service of a facility is designated with a letter, A to F, with A representing free flow operating conditions and F representing the most restricted vehicular flow conditions M e t r o p o l i t a n T r a n s p o r t a t i o n P l a n Page 30
41 Traffic flow conditions for various LOS and V/C ratios for arterials with a 40 mph design speed are shown below. A LOS of C or D is typical and acceptable in urban areas given varied land uses, traffic mix including pedestrian and bicyclists, need for access, turning movements, etc. A roadway s LOS and V/C are typically reported for peak travel periods. LOS SPEED (MPH) V/C TRAFFIC FLOW CONDITION A Greater than 35 Less than 0.34 Free flow; Speed is controlled by driver s desire, speed limits or physical roadway conditions. B 28 to Stable flow; Speed begins to be restricted with slight delays. Vehicles are reasonably unimpeded. C 22 to Stable flow with delays; Less freedom to maneuver; Speeds are somewhat restricted. D 17 to Approach to unstable flow; Little freedom to maneuver. Tolerable speeds can be maintained but restrictions may cause extensive delays. E 13 to Approaching capacity; Unstable flow with many stoppages; Maneuverability is severely restricted. F Less than or greater At or above capacity; Forced flow; Breakdown conditions; Low or no speeds; Stoppages are for long periods. Exhibit 2.21 Traffic Flow Conditions for various Levels of Service and Volume to Capacity Ratios Source: Highway Capacity Manual Exhibit 2.20 below shows which major roads in the Lexington MPO Area have reached or are approaching significant congestion levels based upon our existing road network. Significant congestion was defined as a V/C at or above 1.2 during peak periods. Roadways with a V/C greater than 1.0 but less than 1.2 are were denoted as approaching significant congestion levels. Whereas the first map shows conditions today, the second map (Exhibit 2.23) shows congestion conditions in the year 2040 given our existing road network and the completion of all the committed short-range projects that are currently underway, but without any of the long-range projects planned within the 2040 MTP (referred to at the 2040 no build scenario). See Chapter 4 for a depiction of projected congestion levels on major roads once the MTP 2040 projects are implemented M e t r o p o l i t a n T r a n s p o r t a t i o n P l a n Page 31
 Source: Lexington Area MPO Travel Demand Forecasting Model 2 0 4 0 M e t r o p o l i t a n T r a n s p o")
42 Exhibit 2.22 Worst Congested Roadways for Base Year 2012 Source: Lexington Area MPO Travel Demand Forecasting Model Exhibit 2.23 Worst Congested Roadways in 2040 ( No Build ) Source: Lexington Area MPO Travel Demand Forecasting Model M e t r o p o l i t a n T r a n s p o r t a t i o n P l a n Page 32


43 2.3.2 Freight Movement Goods movement into, out of, and across a region is vital to communities, their economy and to local industries that rely significantly on freight including manufacturers, distributors, retailers and agriculture. Public and private sectors play a role in freight movement and coordination is necessary at the regional, statewide and national level across many freight modes including rail, air, water and highways. The FHWA has identified freight movements as one of the fastest growing and rapidly changing transportation issues. In response, an MPO Freight Plan was drafted in 2007 to provide insight on needs and issues within the region and to help guide planning and investment to ensure that freight movement is maintained and maximized. The plan reviews freight trends across various transport modes and recommends strategies to address: Coordination with freight providers Land use coordination Roadway design & access management Designated truck routes Freight modeling Monitoring, commodity surveys & freight studies Additionally, an MPO Freight Program Assessment is conducted periodically with FHWA. The MPO last completed the assessment in An intermodal Freight Focus Network for the Lexington area is identified in the 2006 Kentucky Statewide Intermodal Freight Plan (developed by the KYTC). The Freight Focus Network for the MPO includes the major roadways, railroads and the Bluegrass Airport as shown in Exhibit The Lexington Area does not have any designated Intermodal Freight transfer points. Exhibit 2.24 Lexington Area Freight Focus Network Source: 2006 Kentucky Statewide Intermodal Freight Plan, KY Transportation Cabinet M e t r o p o l i t a n T r a n s p o r t a t i o n P l a n Page 33
44 The MPO primarily has authority for roadway planning that may affect highway freight movement; however, coordination and consultation with air and rail freight operators is also conducted via MPO committees and in other forums as needed including incorporating air and rail-related Congestion Mitigation and Air Quality (CMAQ) and Transportation Alternatives Program (TAP) projects in the MPO s MTP and TIP. Trucking In Kentucky, 73 percent of freight shipments are handled by truck (representing 43 percent of freight tonnage movement). In the Lexington MPO Area, through trucks primarily utilize I-75/64 with the truck traffic percentage reaching 15-25% along portions of those interstates. Trucks also frequently utilize New Circle Road and US 60 when traveling to and from the Bluegrass Parkway. Many industries with major trucking terminals are located on the north side of Lexington near the interstates. Other shippers/receivers are primarily concentrated along major arterials in professional service and commercial zones. Exhibit 2.25 Heavy Truck Rates on Freight Focus Roadways Source: 2006 Kentucky Statewide Intermodal Freight Plan, KY Transportation Cabinet The 2006 KYTC Statewide Intermodal Freight Plan identified a Freight Focus Road Network which includes the roadways within the MPO as shown in Exhibit The Network also includes all of US 27 in Jessamine County. The KYTC specifies that any funds utilized for improving freight flows should be focused along these corridors; likewise any improvements undertaken along these roadways should closely consider freight needs and impacts, while also being context-sensitive. Additionally, the KYTC plan calls attention to the segments of the freight road network which are at or approaching capacity and should therefore be monitored and/or prioritized for improvement. These routes as shown in Exhibit 4.26 include New Circle Road, US 68 (downtown Lexington south to New Circle Road) and Us 27 (downtown Lexington south to Nicholasville) M e t r o p o l i t a n T r a n s p o r t a t i o n P l a n Page 34
 Source: 2006 Kentucky Statewide Intermodal Freight Plan, KY Transportation Cabinet Air The Blue Grass")


45 Exhibit 2.26 Freight Focus Roadway Network & Related Volume Service Flows ( 1 = at or over capacity) Source: 2006 Kentucky Statewide Intermodal Freight Plan, KY Transportation Cabinet Air The Blue Grass Airport is an intermodal transfer point that provides for the movement of people and freight. Air cargo at the airport is handled by both airlines and independent cargo carriers, and consists of airfreight, air express and the United States mail. Equine air transportation is also available at the Bluegrass Airport. Airport representatives indicate that due to comparatively larger air freight hubs in Louisville and Cincinnati, the amount of cargo processed at the Bluegrass Airport is not expected to grow significantly in the coming years. Cargo tonnage (in pounds) at the Airport grew from 164,801 to 182,149 from 2010 to Rail Lexington has two Class-I rail freight operators - CSX Transportation and Norfolk Southern Corporation (Norfolk- Southern has lines in both Fayette and Jessamine County) and one Class-III rail operator RJ Corman Railroad Group. Areas served by these railroads include a major east-west corridor through central Fayette County and a major north-south corridor through central Fayette and Jessamine County, as well as Wilmore. Various industries in the area have direct rail access for shipping and receiving including lumber supply companies, manufacturers, trucking companies and agricultural warehouses and stockyards. Water There are no major navigable waterways in the Lexington Area that serve as freight corridors, nor are there any ports in the Lexington Area M e t r o p o l i t a n T r a n s p o r t a t i o n P l a n Page 35

46 Annual Trips (x 1,000) Passenger Transportation Services There are a number of passenger transportation services available in the Lexington MPO Area that enhance mobility and access for people who cannot or choose not to drive. These services are available to the general public. They may be privately or publically operated and include fixed-route transportation services (fixed schedules and fixed routes) while others are demand-responsive services (transport that is scheduled and routed upon request). Some services also have eligibility requirements. Public Transit Services Lexington Public Transit Authority (Lextran) Lextran celebrated 40 years of serving as Lexington s public transportation system in December of Lextran was incorporated as the Transit Authority of the Lexington Fayette Urban County Government in April of Prior to that time, there were several private transit systems in place beginning in 1874 when the Lexington Railway Company provided public transportation by horse-drawn stagecoaches. Today, public transit is operated by Lextran and is supported through a local annual property tax of six cents per every one hundred dollars of assessed property value. This local support accounted for 67% of the Lextran budget in FY2013. Ridership has steadily increased since the property tax began providing a stable funding source for basic and expanded service. Transit use as a primary mode for commuting purposes has also been on the rise over the last decade, increasing from 1.3% of commuter mode share to 1.6%. 7,000 Lextran Ridership 6,000 5,000 4,000 3,000 2,000 *note: 2010 ridership numbers reflect a significant amount of rides provided during the 2010 World Equestrian Games. Exhibit 2.27 Lextran Ridership M e t r o p o l i t a n T r a n s p o r t a t i o n P l a n Page 36
.")

47 Lextran operates a fleet of 72 buses (67 fixed-route buses and 5 trolleys) in Fayette County including a University of Kentucky campus shuttle service. The Lextran system currently operates 2 trolley routes and 22 bus routes that serves 980 bus stops (86 of which have bus shelters). Lextran operates at three levels of service each weekday; peak period, mid-day, and night service. Bus service runs from 5:30 a.m. until 12:30 a.m. Weekend service runs on a reduced time and frequency depending on the route. Regular passenger fare to ride Lextran is $1.00 and includes unlimited transfers on a one-way trip. Fares have not increased since The $1.00 fare is among the lowest of any public transit system in the region, and relatively low when compared nation-wide. Reduced fare programs as well as a variety of passes are available to individuals that qualify. For example, a reduced fare is available to senior citizens. A Class Pass is also available to elementary, middle, high school and college students in Fayette County during the school year. The Lextran route system currently serves Fayette County in a radial fashion following arterial streets to the fringes of the urban area. Exhibit 2.28 shows the Lextran fixed route system and service area. Most of the Lextran routes originate from the transit center located in the downtown Central Business District. The system s focus on the transit center makes it the main transfer point for a majority of routes as they simultaneously converge downtown at the Transit Center. Since starting operations in 1992, the Downtown Transit Center has outgrown the capacity of the facility. This is evident when the majority of Lextran buses in service pulse into the transit center at similar times, overcrowding the center and hindering operations. Adjustments such as moving some bus connections to the opposite side of the facility on High Street have been implemented in an attempt to create more space and better utilize the existing Center. However, this situation is not ideal and creates some confusion and hardship for riders that need to transfer in a limited time. The radial pulse system also makes it difficult to further reduce point-to-point transit travel times M e t r o p o l i t a n T r a n s p o r t a t i o n P l a n Page 37
 Service Area 2 0 4 0 M e")
48 Exhibit 2.28 Lextran Fixed Routes & Wheels (Paratransit) Service Area M e t r o p o l i t a n T r a n s p o r t a t i o n P l a n Page 38


49 Since spring of 2010, Lextran has operated a free downtown trolley circulator service in an effort to enhance the downtown transportation experience. Lextran continues to monitor and experiment with the trolley s routing to maximize its efficiency and appeal to passengers while also operating the service in a financially sustainable manner. Lextran continually monitors all city-wide bus routes and makes service adjustments, such as route contractions or expansions, based on ridership statistics and performance. In order to increase convenience for riders, Lextran has worked to introduce technology that puts real-time information in the hands of passengers. They have implemented an Interactive Voice Response (IVR) system that provides on-call service information to riders. New bus stop signs featuring specific stop numbers were recently installed allowing users to call the IVR line, enter their stop number, and receive departure times for the next bus. These times are updated continuously from real-time GPS information sent by the individual bus on that route. Users can also access real-time information about any bus currently in use on the system for trip planning purposes. Smart cards were also recently introduced by Lextran to allow for faster boarding and fare payment. Smart cards are contactless cards that users tap on the fare box when boarding, rather than dipping or swiping a magnetic stripe pass. The annual Class Pass was the first pass introduced in the form of a smart card and has proved to be a practical option that provides greater durability than a magnetic striped pass. All Lextran routes are wheelchair accessible for persons with a mobility impairment and 100% of busses are equipped with wheelchair lifts. Although, Lextran buses are friendly to passengers with wheelchairs, not all bus stops and routes leading to them are. Lextran and LFUCG are continually seeking to remedy stop access issues and to make spot improvements as able. For those who cannot utilize the fixed-route service due to a disability, Lextran contracts a door-to-door paratransit service through Red Cross WHEELS. Additional details regarding public transit can be found on Lextran s website ( and in the Lexington Area MPO Long Range Transit Plan M e t r o p o l i t a n T r a n s p o r t a t i o n P l a n Page 39

50 Bluegrass Inter-city Transit There are a number of inter-city bus services available to residents in the Bluegrass Region that run on a fixed schedule and route. These public transportation services provide an alternative way for regional commuters to reach the Lexington MPO Area for employment, retail, medical or other professional service. Some routes run regularly, whereas others require advance notice or a monthly subscription to the service. Several agencies operate these services as noted in Exhibit For additional details visit each agency s website (click the agency name in the Exhibit below). Agency Origin Regular Service or On-Call Destinations Bluegrass Community Action Partnership Frankfort Danville On-Call (24 hr) Transit Center, Bluegrass Airport, Greyhound Station KY River Foothills Development Council Winchester Richmond Regular w/ Monthly Fee & Subscription Lexmark, UK, Industry Rd, Downtown Lexington Transit Center, Bluegrass Airport, Greyhound Station Federated Transportation Services of the Bluegrass Harrison Co. Bourbon Co. Nicholas Co. Regular Exhibit 2.29 Inter-City Transit Providers within the Lexington MPO Area University of Kentucky Transit System The University of Kentucky (UK) is a major trip generator with over 40,000 people coming into and moving within the Campus boundaries each day. UK s Campus Area Transit System (CATS) fleet consists of eighteen buses that support four routes serving the campus core as well as a hospital shuttle. The system provides over 750,000 rides per year. Headways vary from 5 to 15 minutes during the day and 15 to 30 minutes during the night and summer. The CATS system is supplemented by public transportation through an agreement with Lextran so that larger numbers of people moving into and out of the campus core to the periphery can be accommodated. All intra-campus bus rides are free of charge to UK students, employees and visitors. UK students may purchase a special Lextran Student Class Pass for Lextran routes serving areas outside the campus boundary All CATS busses are outfitted with bike racks. Real-time travel information is provided via the Cat Tracker, a GPS-based tracking system that is accessible from a computer or mobile phone and enables riders to know when their bus will arrive M e t r o p o l i t a n T r a n s p o r t a t i o n P l a n Page 40


51 Ferry Service The Valley View Ferry is located on KY Route 169 at the County line of Fayette and Jessamine Counties. The ferry provides passage across the Kentucky River for approximately 250 vehicles per day, substantially reducing the commute time between Fayette, Jessamine and Madison Counties. In 2012, the ferry carried 110,000 vehicles and 165,000 passengers. The ferry is a free service operated by the Valley View Ferry Authority and is funded by the Kentucky Transportation Cabinet, the fiscal courts of Madison and Jessamine Counties, and the Lexington-Fayette Urban County Government. Valley View is the last remaining ferry on the Kentucky River and is the oldest year-round ferry service in the United States. Founded in 1785, seven years before Kentucky became a state, the Valley View Ferry is viewed by the community as a historic and cultural resource. Demand-Response Transportation Services Demand-response transportation services transport individuals along non-fixed routes and require advanced scheduling by the customer. These services may be provided by public entities, nonprofits, and private providers. The following demand-response services are available in the Lexington MPO Area. Paratransit Lextran s service Wheels is a door to door public transportation system for people residing within the Lextran service area whose needs cannot be fully met by the fixed route system due to a disability. The service is operated in accordance with the Americans with Disabilities Act of 1990 which requires a fully accessible transportation service within ¾ mile of a fixed route bus service. Wheels is operated in cooperation with the Bluegrass Chapter of the American Red Cross. It has been in operation since 1978 and is available 365 days a year. There are 43 mini buses with wheelchair lifts and six sedans utilized for the service. All qualifying residents with origins and destinations within Fayette County can be accommodated when rides are prescheduled one day in advance. Wheels provides more than 165,000 trips annually and travels over 1.5 million miles per year. In FY 2013, the total ridership averaged 14,431 trips per month and 131,196 monthly service miles. From 2003 to 2013, ridership more than doubled; a rate far greater than overall population growth of 13.5% during that same period. This trend is expected to continue as the MPO population ages (also evidenced by the growing use of the Wheels service for medical purposes). This growth may place a M e t r o p o l i t a n T r a n s p o r t a t i o n P l a n Page 41

52 greater demand on existing resources given Wheels passenger fares (currently $1.60 for most rides) must remain comparable to fixed-route passenger fares (currently $1). Passenger fares cover only a portion of the overall operating cost of required demand-response services. Wheels Usage % Change Annual trips ( ) 165, , % Annual mileage ( ) 1,572, , % Trip purpose % Change Medical 43% 28% + 54% Employment 21% 32% - 34% Food/shopping 9% 20% - 55% Education 2% 5% - 60% Other 25 % 15% + 67% Exhibit 2.30 Wheels Ridership & Trip Purpose In an effort to maximize efficiency of the service, Wheels currently utilizes RouteMatch Software in all vehicles to assist in producing schedules that maximize the daily efficiency by clustering and multiloading passengers. In addition, Wheels uses Mobile Data Terminals and Global Positioning System (GPS) units to convey the manifest to the bus operators and track the location of the vehicles. Human Service Transportation Delivery Door-to-door transportation for non-emergency medical treatment and purposes is provided to people who are eligible for Medicaid, Vocational Rehabilitation and Department of the Blind service recipients. These services are provided by the Federated Transportation Services of the Bluegrass (FTSB) in Fayette County and by the Bluegrass Community Action Partnership in Jessamine County. In 2012, the Bluegrass Ultra Transit Service ( BUS ) and their subcontractors provided nearly 17,000 trips to 272 Medicaid clients in Jessamine County. Independent Transportation Network The Independent Transportation Network of the Bluegrass (ITN of the Bluegrass), an affiliate of ITN America, provides rides to people who are 60 years and older as well as to people of any age with visual impairments. ITN is a fee-based membership service that is supported by both public and private resources. It includes a network of volunteer drivers and a dispatch/scheduling system. Rides are available 7 days a week, 24 hours a day for any purpose when the origin and destination is within Fayette County and northern Jessamine County. An emphasis is placed on door-through-door, arm-through-arm service meaning drivers may assist riders, which can be helpful for people who are elderly, not feeling well or need help carrying packages. ITN is a resource for those who do not quality for Paratransit or Human Service Transportation. ITN of the Bluegrass currently has about 500 members and provides from rides per month M e t r o p o l i t a n T r a n s p o r t a t i o n P l a n Page 42

53 Taxicab Taxicabs provide for travel convenience when a vehicle or driver is not available, when public transit is not in operation (after-hours) or when an origin or destination is not served by the public transit system. The availability of on-call taxicab service can make it easier for people to forego car ownership and provides an alternative to impaired driving which enhances public safety. There are three major taxicab companies and approximately 170+ vehicles registered in the Lexington MPO Area. In 2013, Yellow Cab was awarded Jobs Access & Reverse Commute (JARC) FTA funds to equip a number of vehicles in their fleet with wheelchair lifts to better serve the disabled community. Accessible transportation services, particularly during the hours when transit and paratransit services are not in operation, was often cited as a barrier to independence for people who use wheelchairs in the Lexington Area. Regional, state & national passenger service In today s mobile and global economy, many travelers seek connectivity to regional, statewide and national destinations via public transportation services. Several fare-based passenger options into and out of the Lexington area are available to residents, recreational and business travelers that need access to destinations by means other than personal automobile. Passenger Bus Regularly scheduled Inter-city passenger bus service to and from Lexington is provided through Greyhound and Megabus. These fee-based charter services are available to the public and are offered along fixed routes to many cities throughout the region, state and country. Megabus provides express service to 8 major cities and Greyhound provides connectivity to most major cities in the nation. For many travelers, particularly those who do not own a vehicle, charter bus is the most economical way to travel outside of the Bluegrass Region. Passenger Rail There are currently no passenger rail lines servicing the Lexington area. The nearest passenger rail service is provided by Amtrak in Cincinnati. In recent years, there has been growing public interest in a passenger rail service connecting Lexington, Frankfort, Louisville and Northern Kentucky. A costfeasible plan to provide such a service has yet to be realized. The most comprehensive study of the feasibility of passenger rail was commissioned by the KY Transportation Cabinet in See the Examination of I-75, I-64 and I-71 High Speed Rail Corridor Study M e t r o p o l i t a n T r a n s p o r t a t i o n P l a n Page 43


54 Passenger Air Lexington Bluegrass Airport (LEX) serves a population of over 1.5 million residing in over 15 surrounding counties in Kentucky. LEX offers commercial flights and a variety of corporate and general aviation services. The Bluegrass Airport is located in western Fayette County along Versailles Road and Man o' War Boulevard, 4 miles west of downtown Lexington. The airport is served by major airlines, offering direct flights to a host of US Cities, with global connections. Exhibit 2.31 Bluegrass Airport Direct Flights The airport recently updated their master plan in 2013 and the pan is focused on developing a comprehensive assessment of core infrastructure needs that take into consideration input from stakeholders and community partners. The Bluegrass Airport Master Plan includes the following long-term improvement projects. Asset Management & Infrastructure Rehabilitation Possible International Customs Facility Parking Lot Expansion Equipment Replacement\ West General Aviation Campus (Phases II & III) Runway 9-27 Extension & Widening Ridesharing Historically, ridesharing has played an important role in the MPO region to reduce the number of workers driving alone and reducing vehicular demand on the roadway network. Ridesharing includes both carpooling and vanpooling. More recently, car-sharing has also emerged as a new transportation option M e t r o p o l i t a n T r a n s p o r t a t i o n P l a n Page 44


55 Carpool Carpooling is the most common way that people commute in the Lexington area, next to driving alone. Carpooling in the MPO region, as a means of commuting, has declined over the last several decades from its peak in the 1980s when 23 percent of all work-related trips in Jessamine County and 18% in Fayette County were made in carpools. In the 1990 s and 2000 s carpooling decreased to 11-13% of all commuting trips (see Exhibit 2.10). Today, carpooling represents just over 10 percent of workrelated trips which still contributes greatly to lessening congestion on regional roadways and reducing fuel consumption and emissions. The local decline in carpooling has followed a similar national trend; however, our region is still above the national average of 9.7 percent. Carpooling is most common among people with long commutes. Many carpools are formed via personal contacts, neighbors and co-workers. In the past, carpool matching services have been provided by the MPO to help people connect throughout the region who are traveling to and from similar work or home destinations. A ride-matching database is typically utilized for such a service. While the MPO no longer provides this service, rideshare matching will be provided in the near future through Rideshare a program currently operated by Enterprise on behalf of Lextran. Vanpool Vanpooling allows even larger groups of individuals to share rides, further decreasing demand on the roadway network and providing both individual and community-level savings on fuel, energy, vehicle and roadway maintenance. A regional vanpool program is currently operated by Lextran and includes 8 vanpools and 89 riders (average of 11 riders per van) with an average round trip of 50 miles per van. Vanpools must currently have an origin or destination within Fayette County. Lextran acquired the vanpool from the LFUCG in 2013 and is currently in the capacity-building phase for the program. Car Sharing Car sharing is an emerging service where people have on-demand access to a fleet of vehicles so that they may rent a car for short periods of time, often by the hour. This service is attractive to people who only requires the use of a vehicle occasionally and may allow people to more easily utilize bicycling, walking and transit for regular trips, foregoing regular, day-to-day use of a private vehicle. According to The Economist, carsharing can reduce car ownership at an estimated rate of one rental car replacing 15 owned vehicles. The University of Kentucky currently operates a small car sharing program with a fleet of 2 vehicles. Car sharing opportunities for greater Lexington are currently in the exploratory phase M e t r o p o l i t a n T r a n s p o r t a t i o n P l a n Page 45

56 2.3.5 Bicycling & Walking Communities that are walkable and have well-integrated bike facilities have been shown to have stronger local economies, better air quality, improved public safety and citizens that are more active both socially and physically. Over the last decade, the MPO has increased its emphasis on bicycle and pedestrian planning, projects and programs to improve livability and provide sustainable transportation options. This emphasis also fulfills the MPO s legal obligation required by federal transportation legislation (MAP-21) to provide for the development, integrated management and operation of transportation facilities (including pedestrian walkways and bicycle transportation facilities) that will function as an intermodal transportation system. The MPO s Regional Bicycle and Pedestrian Master Plan (BPMP) was developed in 2007 and provided an extensive review of existing facilities, plans, polices and programs. The plan s recommendations guide how projects are selected and implemented. Since the Plan s adoption the network of bicycle facilities has doubled in mileage. Pedestrian infrastructure has also increased both in terms of sidewalk mileage and the provision of safer crossings. Bicycle Facilities Bicycling in the MPO area is gaining in popularity as a means to get to work, to school and to get more exercise. People who ride bikes vary in age, skill and trip purpose. Likewise, there are different methods and facilities to accommodate cycling. The bicycle system can be considered in terms of Rural (outside of the urban service or planned growth area) and Urban (inside the urban service or planned growth area). In general, the primary purpose people ride bikes in the two areas differs. Recreational cycling is common on rural secondary roads where motorists and cyclists must share the lane. Recreational cyclists are generally more experienced distance riders who are comfortable on rural secondary roads (local and collector roads) with low traffic volumes and along primary rural roads (arterial roads) that have paved shoulders. Share the road signs have been placed along common routes that people bicycle on in rural areas of the Lexington Area MPO to warn motorists that cyclists may be present on the roadway. In the urban areas, commuting to work or school as well as to access goods and services (utilitarian trips) are the primary trip purposes. The urban bicycle network can be divided into three categories shared use paths, bike lanes and shared roadways. Shared use paths are off-road facilities that can improve the connectivity of the bicycle network by supplementing missing or difficult gaps in onroad facilities. They also offer a riding experience away from vehicular traffic, which is often preferred by less experienced cyclists and is proven to encourage new ridership. Bike lanes are onroad facilities that delineate a portion of the roadway with striping, signage and pavement markings. Bike lanes accommodate the speed differential between bicycles and motor vehicles and facilitate predictable behavior and interactions between bicyclists and motorists. Shared roadways are streets M e t r o p o l i t a n T r a n s p o r t a t i o n P l a n Page 46


57 without exclusive designation for bicycles (such as local neighborhood streets) and in many cases, these roadways do not need specific treatments to accommodate bicycle traffic safely. Additional signage or markings can be placed on shared roadways (including signed bike routes and shared lane markings or sharrows ) to designate a preferred bicycle facility and/or draw attention to the presence of bicyclists. In the MPO area, the mileage of bike lanes and shared use trails has continued to grow over the last 10 year period, increasing to 47 miles, or about 5 miles per year. In 2010, almost 20 miles were added to the bicycle network when the US 68/Harrodsburg Road Trail and Phase 1 and 2 of the Legacy Trail were completed. However, most bicycling continues to take place on roadways that lack designated facilities. In some cases, lower volume, lower speed streets can accommodate cycling without the need for designated facilities. In other cases, improvements will be necessary to make bicycle travel a safe and pleasant experience for people of all experience levels. Such on-road facilities are critical to comprehensive bicycle systems since nearly any destination can be reached using the existing road network. Exhibit 2.32 Bicycle & Pedestrian Facility Mileage in the Lexington Area MPO M e t r o p o l i t a n T r a n s p o r t a t i o n P l a n Page 47

58 Exhibit 2.33 Existing Bicycle Facilities in the Lexington Area MPO Pedestrian Facilities Walkable communities encourage walking for short trips and for physical activity. These communities have pedestrian-oriented streets, building structures and land use patterns that make it convenient for residents to walk to services, shopping, schools and jobs. Such destinations are easily accessible from sidewalks, street crossings and transit stops. Walkable communities also have good street and sidewalk connectivity to reduce walking distances and to create multiple route choices. Walkable communities have streets with shade trees, sidewalks that are buffered from traffic, and buildings entrances and facades that are oriented toward people walking on the street M e t r o p o l i t a n T r a n s p o r t a t i o n P l a n Page 48


59 At some point each day we are all pedestrians. Streets and destinations within urban areas (and many rural areas) will be accessed by someone on foot at one time or another. For this reason, we must expect and accommodate walking on all urban roadways, with the exception of limited access highways. This creates better access, safety and equity for all users of the transportation system and enables people to be more physically active. Sidewalks are a critical strategy to improving walkability and safety. Studies indicate that fewer pedestrian collisions occur along roadways with sidewalks on both sides of the street compared to streets with no sidewalks or sidewalks on only one side. The figures below indicate the percentage of major roads in the MPO region that have sidewalks on no sides, one side, or both sides of the street. More than half of major arterials lack sidewalks on both sides of the street, which is problematic given high vehicular speeds and traffic volumes. In fact, a majority of pedestrian fatalities occur along arterials. The MPO has worked to increase sidewalk network mileage through capital projects and requiring sidewalk installations as new development and redevelopment occurs. Exhibit 2.34 Percent Sidewalk Coverage on Major Roads in the Lexington MPO Area M e t r o p o l i t a n T r a n s p o r t a t i o n P l a n Page 49

60 Exhibit 2.35 Location of Sidewalks on Major Roads in the Lexington MPO Area The ability and ease with which pedestrians can cross streets and intersections also affects walkability. Pedestrian infrastructure at a number of intersections in the MPO region have been inventoried and assessed. The MPO has worked to improve pedestrian crossings through the addition of high-visibility marked crosswalks, ADA compliant signals and curb ramps, lead pedestrian intervals (LPIs), countdown signals and audible signals. While many intersections do provide pedestrian signals, crosswalks and curb ramps, these features do not always imply a walkable environment. Other factors such as high traffic volumes, wide multi-lane roads and intersections, and aggressive or distracted driver behavior, can diminish walkability M e t r o p o l i t a n T r a n s p o r t a t i o n P l a n Page 50


61 The image below is an example of a walkability score developed from GIS-based data including population density, nearby destinations and the walkability of the street system based on block length and intersection density. Overall, the Lexington Area scores a 34 within the car-dependent range; however, there are neighborhoods scoring high on the walkabilty scale. Data from the US Census shows that far more people walk to work in many of these area. Continued efforts by the MPO to increase the overall walkabilty of urban areas include encouraging pedestrian-oriented street, land use and community design. Walk Score Description Walker's Paradise Daily errands do not require a car Very Walkable Most errands can be accomplished on foot Somewhat Walkable Some errands can be accomplished on foot Car-Dependent Most errands require a car Car-Dependent Almost all errands require a car. Exhibit 2.36 Lexington Walk Score ( Bicycle and Pedestrian Programs The MPO has worked to facilitate a comprehensive bicycle and pedestrian program that includes funding for projects, program staffing, a facilities plan, promotion and educational programs, and encourages the enforcement of laws and regulations. In 1999, the MPO established the Bicycle Pedestrian Advisory Committee (BPAC) to provide guidance on bicycle and pedestrian needs and projects in the MPO region. As a result, bicycle and pedestrian facilities are now routinely included in roadway improvement projects and more funding has been allocated for bike and pedestrian projects. In addition, a Bicycle/Pedestrian Coordinator position was established in 2003 to advocate for, and work to address bicycle and pedestrian issues in the MPO area. The MPO staff and BPAC members work together to encourage more bicycling and walking, increase safety and distribute information through various media and community events. Photo Source: M e t r o p o l i t a n T r a n s p o r t a t i o n P l a n Page 51
62 2.4 Safety & Security Every year more than 40,000 people are killed on our Nations roads and highways. More than 2 million are injured annually nation-wide. These traffic crashes can be devastating for the individuals involved and also have consequences for family members, friends and co-workers. Societal costs run into the hundreds of billions of dollars due to lost productivity, property damage, medical costs, emergency services and increased travel time due to delays. For these reasons the Lexington Area MPO has made transportation safety a top priority. The Lexington Area MPO is committed to the mission, vision and goals of the Kentucky Transportation Cabinet Strategic Highway Safety Plan These include: Mission: To reduce Kentucky s highway fatalities and injuries. Vision: Through public and private partnerships, achieve the most improved and sustainable downward trends in highway fatalities and injuries in the nation. Goal: To reduce the number of highway fatalities toward zero. Safety is given a high priority in MPO project selection and transportation planning processes. Project locations with critical crash rates and bicycle and pedestrian safety concerns are given additional weight in prioritization processes. The MPO also reviews and analyzes technical and statistical data of local and state transportation facilities on an on-going basis in an effort to be proactive in identifying and addressing safety issues for all modes. The MPO also promotes and facilitates a number of safety improvement techniques including congestion management strategies, access management, intersection improvements, bike and pedestrian facilities, traffic calming, incident management and educational campaigns. The MPO consults with a number of safety-related agencies and organizations through the MPO s Traffic Safety Coalition (TSC) Subcommittee. The committee is comprised of local and state stakeholders including police, traffic engineers, planners, public transportation providers and others. Initiatives of the committee during the last five years include: public school transportation safety, local & state police collision and trend statistics, identifying high crash locations, Ticketing Aggressive Cars and Trucks (TACT) campaign, I-75 incident and traffic management, Neighborhood Traffic Management Program (NTMP), defensive driving awareness and the Buckle Up Bluegrass Project Critical Crash Rates The KY Transportation Cabinet determines and assigns a Critical Crash Rate (CCR) to state roadways throughout Kentucky. The CCR for each roadway segment is based on the expected crash rate of similar facility types (i.e. road class, urban vs. rural) across the state. Critical Crash Rates above 1 indicate the segment experiences more collisions than is typical for roadways of a similar type. The M e t r o p o l i t a n T r a n s p o r t a t i o n P l a n Page 52
63 higher the CCR is above 1, the greater the disparity. Exhibit 2.37 shows the percentage of roadway segments in Fayette and Jessamine County that have CCRs of various ranges. Fayette County Critical Crash Rate of Roads Exhibit 2.37 Critical Crash Rate of Roads in the Lexington MPO Area Jessamine County Critical Crash Rate of Roads Total Highway Mileage Rated = 202 miles Total Highway Mileage Ranked= 69 % of Roadways CCR % of Roadways CCR 55.9% <1 50.0% <1 28.1% % % % % % % >4 0.0% > Collision Data Fayette County Exhibit 2.38 below shows the average total number of collisions, injuries and fatalities in Fayette County for the years 2008 through Over the five year period, the total average number of annual collisions was 13,647 which remained relatively flat with a small decrease of 1% to 2% from year to year (with the exception of which had a 3% increase in the total number of collisions). An average 25% of all collisions in Fayette County resulted in an injury. Reducing injury collisions and fatalities is desirable given they are the most costly to society, with fatal collisions being the most costly and detrimental. Fayette County had an average of 32 traffic fatalities per year during the five year period, correlating to 0.18% of motor vehicle collisions. One-third of fatal collisions involved alcohol or drugs as a contributing factor. Of vehicle-to-vehicle collisions, rear-end collisions represented the majority of collisions with an average of 4,867 over the five year period, accounting for 35% of all collisions. Sideswipe and angle collisions are the next common collision types averaging 19% and 20% respectively. Vehicular collisions with a pedestrian averaged 136 per year from , representing 1.2% of total collisions. Ninety-two percent of those resulted in injury (compared to a 25% injury rate for vehicle-to-vehicle collisions) and 3.5 percent resulted in a fatality (compared to 0.18% for vehicle-tovehicle collisions). Higher injury and fatality rates in vehicle-to--pedestrian collisions result from the offset in physical prowess between vehicles and pedestrians; thus it is important to recognize and work to minimize pedestrian safety issues. For example, of the average 32 fatalities in Fayette County each year, five are pedestrians, correlating to 16% of all fatalities; yet we know that pedestrian mode share is far less than 16 percent. Additionally, a pedestrian-to-vehicle collision is 20 times more likely to result in a fatality than that of a vehicle-to-vehicle collision (3.5% compared to 0.18%). Of pedestrian collisions, an average of 48.2 per year occurred at intersections and an average of 67.6 occurred at non-intersection locations M e t r o p o l i t a n T r a n s p o r t a t i o n P l a n Page 53
 resulted in injury, again supporting the importance of providing safe travel options for more vulnerable road users including bicyclists")
64 As seen in Exhibit 2.36, an average of 77 vehicle-to-bicycle collisions occurred annually during the same five year period representing 0.5% of annual collisions. Seventy-seven percent of bicycle collisions (60 collisions) resulted in injury, again supporting the importance of providing safe travel options for more vulnerable road users including bicyclists and pedestrians. An average of 44 bicycle collisions per year occurred at intersections and an average of 28.6 occurred at non-intersection locations. Exhibit 2.38 Fayette County Average Annual Vehicle, Pedestrian and Bicycle Collisions ( ) Jessamine County The total average number of collisions, injuries and fatalities in Jessamine County for the years 2008 through 2012 are shown in Exhibit The average of total collisions is 1400 per year. From 2009 to 2010, there was a 2% increase in collisions, followed by a 6% decrease in 2011, and an increase of 2% from 2011 to Similar to Fayette County, approximately 25% of vehicle-to-vehicle collisions in Jessamine County resulted in injury (average of 361 injury collisions annually). There was an average of 5 traffic fatalities in Jessamine County from 2008 to 2012 and a steady year-to-year decline during that five year period. In 2008 and 2009, fatalities totaled 7 and 8 respectively with a 50% decrease in 2010 to 4 total fatalities. The remaining two years were reduced by 1 fatality, for a total of 3 each year. This is a positive trend toward the goal of the KYTC Strategic Transportation Plan to reduce the number of highway fatalities toward zero. Of vehicle-to-vehicle collisions, rear-end collisions represent the majority of collisions with an average of 439 over the five year period, accounting for 34% of all collisions. Sideswipe and angle collisions are the next common collision types averaging 17% and 18% respectively. An average of 12 pedestrian collisions occurred in Jessamine County per year with 92 percent resulting in injury and 3 percent resulting in a fatality. There were 2 pedestrian fatalities over the 5 year period. Bicycle collisions in Jessamine County are relatively infrequent and vary from year to year with an average of 4 annually. Eight-four percent of bicycle collisions resulted in Injury. There were no bicycle fatalities in Jessamine County from 2008 to M e t r o p o l i t a n T r a n s p o r t a t i o n P l a n Page 54

65 Exhibit 2.39 Jessamine County Average Annual Vehicle, Pedestrian and Bicycle Collisions ( ) M e t r o p o l i t a n T r a n s p o r t a t i o n P l a n Page 55

, US-27X (business), US-68, KY-169 and KY-29.")
66 2.4.3 Collision Locations In Fayette County, 27% of all collisions occur at intersections. Exhibit 2.40 shows intersection and between street collision hot spot locations from 2008 to The highest frequency of collisions occurs at the round-about at West Reynolds Road and Keithshire Way with an average of 30.8 collisions totaling 1.1% of intersection collisions. Man o War Boulevard between Alumni Drive and Easthills Road is the most frequent between-street collision location. In Jessamine County, 60 percent of all collisions take place on five roads: US-27 (bypass), US-27X (business), US-68, KY-169 and KY-29. US-27 accounts for 40% of the 60% majority, or 23% of all total collisions in Jessamine County. Notably, US-27 experiences high traffic volumes and multiple access points along the corridor. Exhibit 2.40 Density of Vehicular Collisions at Intersection and Non-intersection locations in the MPO Area ( ) M e t r o p o l i t a n T r a n s p o r t a t i o n P l a n Page 56
67 Exhibit 2.41 indicates the location of pedestrian and bicycle collisions in Fayette and Jessamine County over the last five years. The majority occurred in the downtown area and in the vicinity of the University of Kentucky and along major arterials. In Jessamine County, bicycle and pedestrian collisions were concentrated along Main Street and the US-27 by-pass. Of pedestrian collisions, an average of 2.75 per year occurred at intersections and an average of 7.25 occurred at non-intersection locations. Exhibit 2.41 Density of Pedestrian and Bicycle Collisions in the MPO Area ( ) M e t r o p o l i t a n T r a n s p o r t a t i o n P l a n Page 57
68 2.4.4 Security Security of the transportation system goes beyond safety and includes planning for natural disasters, or preventing and responding to intentional harm or tampering. These issues have been raised in the public s conscious due to events such as September 11, Therefore, transportation planners also need to consider security in the transportation planning and programming process. The MPO works to improve security by fostering interagency coordination among different, governmental agencies and groups focused on security through the Traffic Safety Coalition (TSC) subcommittee, the Transportation Technical Coordinating Committee (TTCC) and the Transportation Coordination Committee (TCC). An important element of security planning is to ensure that the transportation system provides redundancy so that in the event of an emergency there are more ways than one for citizens to evacuate an area and likewise multiple ways for emergency personnel to enter an area. Parallel routes and good street connectivity enhances access to and along corridors and provide for this redundancy, which is one reason why the MPO has supported efforts by LFUCG to establish street connectivity standards. Another example of system redundancy is the Valley View Ferry, which is sometimes closed due to high or low water. When the ferry is closed, local roads can still provide reasonable, albeit longer, access to those who use the ferry for community purposes. Strategies to further enhance transportation security are discussed in Chapter M e t r o p o l i t a n T r a n s p o r t a t i o n P l a n Page 58
69 2.5 Environment Enhancing the environment is a stated goal of the MTP and the Comprehensive Plans of both Fayette and Jessamine County. By federal law, the MPO is responsible for ensuring that the region's plans for transportation infrastructure conform to National Ambient Air Quality standards. However, transportation can impact more than just air quality. Transportation policies and infrastructure can be linked to a variety of environmental issues including water quality, wildlife habitat modification, land absorption, noise and light pollution, energy consumption, air pollution, climate change and impacts to natural and cultural resources. For federally-funded transportation projects, environmental effects are considered during project planning, design, and engineering as part of a required environmental review process. This process addresses NEPA requirements to assess, avoid and/or mitigate negative impacts and is intended to result in decisions that are based on an understanding of environmental consequences, and take actions that protect, restore, and enhance the environment. Agencies that oversee environmental, historical and cultural programs and protection efforts are also consulted during the development of the MTP so that potential issues can be flagged prior to entering more detailed project development phases (see the MPO Participation Plan for further detail on environmental consultation agencies) Air Quality Vehicles (or mobile sources) are a major source of urban air pollution. Technology (cleaner vehicles and cleaner fuels) will continue to reduce vehicle pollution, but more people living in an area generally equates to more vehicles on the road. Recent national trends show a decrease in personal vehicle miles of travel per person and it is likely that this trend will continue. However, the population is also increasing and the economy is entering a period of growth. Thus, it is anticipated that overall travel demand will continue to grow. If we do not meet this increased demand in an efficient and multimodal manner, additional congestion may ensue, potentially compromising air quality. Ozone In November 1990, Fayette and Scott Counties were designated by the United States Environmental Protection Agency (USEPA) as a "non-attainment" air quality area for the pollutant ozone because of violations of National Ambient Air Quality Standards (NAAQS). The Kentucky Environmental and Public Protection Cabinet s Division for Air Quality (EPPC) submitted a re-designation request for the area in response to more consistent monitoring of attainment data. In November 1995, the area was re-designated to "attainment" but is required to maintain standards by showing conformity to the State Implementation Plan (SIP). Lexington Area MPO transportation projects, programs, and plans were also tested to ensure that they did not contribute to violations of the standards. USEPA revised the standard for ozone in April The new 8-hour standard requires ozone levels to be 0.08 parts per million (ppm) rather than 0.12 ppm, and applies this standard to an 8-hour M e t r o p o l i t a n T r a n s p o r t a t i o n P l a n Page 59

70 Concentration (ppm) average concentration rather than a 1-hour average. With this new standard, the Lexington area was designated in attainment when final designations were determined on June USEPA again revised the standard for ozone in May It retained the 8-hour average time period but dropped the concentration level to ppm. As seen in Exhibit 2.42, the Lexington area has maintained attainment of the ozone standard. However, ozone concentration readings are trending close to the new standard. Ozone Fayette Jessamine Standard Exhibit 2.42 Ozone Levels in the MPO Area Ozone Forecasting and Modeling One way the Lexington Area MPO staff monitors air quality is by using an ozone forecasting model. The model is run during the ozone season, May - September, to predict the Air Quality Index level for the next day. The forecast is calculated and an Ozone Action Day bulletin is ed to the media, local, state and federal government officials when it indicates a potential ozone violation of standards. Ozone Action Day bulletins are also distributed to employers. The advisories and Action Day bulletins promote voluntary efforts that can be taken to help reduced air pollution. A 4-day forecast is completed each weekday. The forecast is also updated daily on the LFUCG Air Quality web site and the MPO web site M e t r o p o l i t a n T r a n s p o r t a t i o n P l a n Page 60

71 Concentration (ug/m3) Particulate Matter Particulate matter is the term used for a mixture of solid particles and liquid droplets found in the air. These particles come in a wide range of sizes and can remain suspended in the air for extended periods. Fine particles, under 2.5 microns in diameter (PM 2.5), result from fuel combustion by motor vehicles and other sources. Coarser particles, up to 10 microns in diameter (PM 10), generally consist of windblown dust, and are released from agriculture and crushing and grinding operations. In December 2004, USEPA designated new PM standards. The PM 2.5 standards (annual and 24- hour) were added to the existing standard for PM 10. The Lexington area had attained the PM 10 standard for some time and continues to record acceptable levels. Air quality monitor readings in recent years indicated Lexington was close to exceeding the PM 2.5 standard. However, in December 2008, the Lexington area was also designated in attainment for fine particulates. The USEPA revised the PM standard again in December Exhibit 2.43 shows how the Fayette County air quality monitor readings compared to the standard. Again, the MPO particular matter concentrations are trending close to the standard Particulate Matter Exhibit 2.42 Particulate Matter Levels in the MPO Area Fayette Standard Exhibit 2.43 Particulate Matter Levels in the MPO Area Air Quality Future Issues Two future issues that are likely to become national air quality priorities are Mobile Source Air Toxics (MSAT) and Greenhouse Gas Emissions (GHG). As suggested by its name, MSAT are pollutants that may cause cancer or other serious health effects such as reproductive problems or birth defects. Examples of toxic air pollutants include benzene, found in gasoline; perchloroethylene, emitted from some dry cleaning facilities; and methylene chloride, used as a solvent by a number of industries. USEPA has established a monitoring network to measure these toxics M e t r o p o l i t a n T r a n s p o r t a t i o n P l a n Page 61
72 Greenhouse gases trap heat within the earth s atmosphere. Although most GHG emissions occur naturally, human activity generates some as well. Carbon dioxide (CO2) emissions account for more than 80% of U.S. GHG emissions. These emissions contribute to climate change and could lead to harmful effects such as sea-level rise and global hydrological changes. In contrast to most pollution trends, emissions of GHG have been rising from all sources. Transportation s contribution to GHG is approximately one-third of the total. Lexington-Fayette County has adopted a plan, the Empower Lexington Plan, which addresses GHG and energy uses from multiple sources including transportation. While both of these air quality issues are important and critical to the health and welfare of the planet, the impact to transportation planning has not been established. Therefore, the MPO will continue to monitor these issues and react accordingly to national directives as they are promulgated M e t r o p o l i t a n T r a n s p o r t a t i o n P l a n Page 62
73
74

75 M e t r o p o l i t a n T r a n s p o r t a t i o n P l a n Page 65
76
77 Chapter 3 Plan Development The major steps of the multifaceted MTP planning process are summarized below. Planning activities were accomplished in many ways including through public and stakeholder participation; collecting and analyzing transportation data from local, state and federal resources; utilizing transportation modeling tools; developing a project prioritization tool; and reviewing revenue sources and expenditures. Some steps along the way were primarily data driven, while others were qualitative and relied on stakeholder input. Major plan development steps included: Assessing the existing transportation system Assessing community needs & desires Establishing goals and objectives Identifying solutions & strategies Predicting future financial resources Establishing investment framework Prioritizing, evaluating and monitoring projects & programs 3.1 Current & Future Needs Assessment The MPO s review of the existing transportation system and the future needs for travel, transportation facilities and services are outlined in Chapter 2. This included a look at our region s population and employment growth, a review of where and how people are traveling now and will in the future, and an assessment of the existing system s current and future anticipated deficiencies. See the full assessment in Chapter Participation Process Community and stakeholder engagement was the basis for identifying our community needs and desires and for developing the MTP Goals and Objectives. The goal of the participation process, as outlined in the MPO Participation Plan (2012), was to provide early and ample opportunity for citizens and stakeholders to impart their ideas, opinions and values into the MTP and to influence the decisions that are made about transportation investment. Techniques used to solicit input from the public included a community transportation survey, public meetings/notifications and social media outreach. Coordination and consultation with various transportation stakeholders and committees also informed the MTP update Transportation Survey At the outset of the MTP update, the MPO distributed a community survey to gauge public opinion on current and future transportation issues. Surveys were distributed through lists maintained by the MPO, City Council/Commissions and neighborhood associations and promoted extensively M e t r o p o l i t a n T r a n s p o r t a t i o n P l a n Page 67

78 through traditional and social media. Hard copies and flyers, printed in both English and Spanish, were posted at public libraries and various local businesses. Copies were also direct mailed to organizations that represent underserved populations. Zip codes that were initially underrepresented in the survey responses were targeted for additional outreach. Paid advertisements were also published in the Jessamine Journal and targeted to Jessamine County social media users (Facebook) in an attempt to boost initial Jessamine County response rates. Just over 2,000 individuals responded to the transportation survey. Eighty percent of respondents reported driving alone as their current primary mode of travel (consistent with local commute-towork driving rates per the US Census). When people were asked how they would like to travel more, both now and in the future, people expressed a desire for more transportation options including public transit, bicycling and walking. Only 13% of people indicated they have no interest in other travel modes (from their current primary mode). How do you usually travel for most of your daily trips? How would you like to travel more...both today and in the future (choose one or more)? 7% 4% 4% 4% Drive Alone Bicycle 10% 13% 19% 81% Walk Public Transit Carpool/Vanpool 48% 24% 44% No Other Way When respondents were asked how they would rate the quality of different elements of the transportation system today they generally rated bicycling, walking and transit elements more poorly than vehicular elements. Traffic signal coordination and flow also rated below average as well as transportation services for seniors and people with disabilities. Categories shown in green below were rated of average quality. Those in purple and orange averaged a poor rating M e t r o p o l i t a n T r a n s p o r t a t i o n P l a n Page 68
79 How would you rate the quality and/or quantity of these elements of the transportation system today? (1 = very poor; 5 = excellent) Motorist safety Rural roads Connections between streets Reliability of travel Pavement & roadway maintenance Sidewalks & street crossings Traffic signal coordination Transportation for seniors & people with disabilities Flow of traffic Bike lanes & trails Public transit Bike & pedestrian safety The chart below indicates how respondents ranked the importance of various transportation issues for the future (1 = least important and 5 = most important). Elements shown in green averaged most important ratings among respondents (> 4.0). Those in purple rated of moderate importance (between 3.0 & 4.0). Those is in orange were of relative lesser importance (< 3.0). How would you rate the importance of the following items to provide for good transportation in our community and to address congestion in the coming 25 years? Urban design & land use patterns to encourage walking/biking/transit Bike & pedestrian safety Bike & pedestrian facilities More/better public transit Protect natural, historic, cultural resources Better traffic signal operations Improve air quality & environment Motorist safety Transportation services for seniors & people with disabilities Regional transit Real-time traffic information Maintain the existing transportation system Add lanes to existing roads Increase carpooling & vanpooling Improve the aesthetics of major roads More street connections Improve the movement of freight Build new roads M e t r o p o l i t a n T r a n s p o r t a t i o n P l a n Page 69


80 When asked how they would allocate transportation funds, respondents suggested a relatively balanced approach to transportation investment. This held true regardless of whether the respondents were Fayette or Jessamine County residents or whether they were primarily car commuters, transit riders, bicyclists or walkers. Input from the survey was used to guide the development of the MTP including the Goals & Objectives proposed MTP Financial Plan and Project Prioritization Tool. Additional survey questions and detailed responses, including demographic and geographic profiles are available in Appendix C. An extensive number of open-ended responses were also collected and compiled Public Notification & Meetings During the development of the MTP, the MPO notified the public and stakeholders of opportunities to review and provide input on the draft document via press releases, legal ads, social media and the MPO website (see Appendix C). Two public meetings were also held and included a presentation by the MPO summarizing local trends and transportation-related data, the results of the transportation survey and key concepts outlined in the MTP. Materials that were available at the meetings included the goals and objectives, proposed MTP funding allocation scenario, project lists and maps. The informal meetings allowed the public to ask questions and provide input on topics or areas of concern, as well as comment on and suggest preferred projects or solutions for transportation issues. In general, public comments on the MTP were positive regarding the overall goals and approach to investment with the exception of concerns expressed by individuals opposed to the I-75 Connector in Jessamine County (for which a feasibility study and environmental review are currently underway). A summary of written public comments are summarized in Appendix C M e t r o p o l i t a n T r a n s p o r t a t i o n P l a n Page 70
81 3.2.3 Coordination/Consultation Developing and implementing transportation plans and projects requires coordination and cooperation among many agencies at the national, state, regional and local levels. When developing the MTP, the MPO sought ongoing input from various agencies and stakeholders through standing committees, one-on-one meetings and direct correspondence. Committee Coordination During FY , the MPO Transportation Technical Committee (TTCC) was presented with information relevant to the MTP update and provided with the opportunity for feedback. Stakeholder agencies represented on the TTCC are listed below. One-on-one meetings and direct correspondence with many of these agencies regarding local transportation issues, strategies and solutions was also needed to develop the plan. LFUCG Divisions of Planning, Engineering, and Traffic Engineering; Representatives from Jessamine County; Representatives from the cities of Nicholasville and Wilmore; School transportation representatives including Fayette County Public Schools & University of Kentucky Parking and Transportation; Maintenance, operations and public safety agencies; Bluegrass Area Development District (BGADD); Federated Transportation Services of the Bluegrass (FTSB); Bluegrass Community Action Partnership; Lextran; LexPark Kentucky Transportation Cabinet (KYTC); Federal Highway Administration (FHWA); Bluegrass Airport; RJ Corman Railroad Company; When developing the MTP, feedback from the TTCC, as well as other MPO Subcommittees, was used to inform the Transportation Policy Committee on key issues, goals, policies and project considerations. Various presentations were made to the TPC including a summary of local transportation data, issues and trends; public opinions gathered through the survey; projected future travel needs; potential future investment strategies and projects; as well as a summary of the public s reaction to the draft plan. This on-going dialogue and input from TPC members and the stakeholders they represent helped inform the MTP s development. See Chapter 1 for TPC members, represented agencies and government entities. Stakeholder Consultation Letters and s were sent to all key transportation stakeholders in the MPO Participation Plan s Coordination/Consultation contact list (see the MPO Participation Plan Appendix A) requesting their input on current and future transportation issues and solutions. They were also notified by letter when the draft document and projects lists were available for comment. Per CFR and CFR , these contacts included: M e t r o p o l i t a n T r a n s p o r t a t i o n P l a n Page 71
82 Local planning/land use agencies Local economic development agencies Environmental protection/natural resource/conservation agencies Historic preservation agencies Airport operators Providers of freight transportation services Private and non-profit providers of transportation Other affected public agencies Representatives of: public transportation employees users of public transportation users of pedestrian walkways and bicycle transportation facilities people with disabilities Outreach to Underserved Populations A critical consideration in transportation planning is to ensure the equitable distribution of transportation services, facilities and resources within the community without regard to income, race, age, ability and other socio-economic factors; as well as avoiding any negative impacts or burdens on minority and low-income populations. The MPO sought participation from traditionally under-served and under-represented individuals in the development of the MTP by reaching out to the businesses, organizations and media contacts that serve minorities and other under-represented groups (see Appendix B and C of the MPO Participation Plan). The MPO distributed requests to these contacts asking them to complete and promote the transportation survey and sent notices with information on the public meetings and the availability of the public draft. Additionally, the MPO works to ensure that the membership of the MPO committees that inform the transportation planning process include representatives of people of varying socio-demographics and transportation user types, including people with disabilities and/or with limited access to vehicles M e t r o p o l i t a n T r a n s p o r t a t i o n P l a n Page 72
83 3.3 Travel Demand Forecasting Model In the transportation planning process, evaluating investment options, such as new and expanded roadways or transit service, helps decision-makers determine the best course of action for future transportation policies, programs and projects. Transportation planners rely on travel demand models (TDM) to help predict future needs and travel patterns and the outcomes of possible interventions. Travel demand forecasting models predict changes in travel and utilization of the transportation system in response to changes in regional development, demographics and transportation supply. During , a highly specialized travel demand forecasting model was developed and calibrated for the Lexington MPO Area in cooperation with the KY Transportation Cabinet. The Lexington Area TDM takes current socioeconomic data (2010 U.S. Census), including population and employment, and establishes a relationship between these variables and travel behavior (or trip making). Future year TDM forecasts (up to 2040) are based on estimated changes in socioeconomic data and anticipated land use. The TDM does however assume travel characteristics will remain constant over time. Multiple data sources were utilized to update and calibrate the TDM for the Lexington Area shown in Exhibit 3.1 below. TDM Data Inputs Population (by age) Housing Units (total, occupied & unoccupied) Workers Vehicles Employment (by sector) Employment (by location) Land Use (commercial/residential) Schools (public, private & colleges) Travel Pattern Data (Cell phone-based) Road Network & Characteristics Roadway Network Capacity Transit Routes* Transit Stops* Ridership* * Future use & analysis only Source 2010 US Census American Community Survey Woods & Poole Economics Kentucky Workforce Cabinet (ES-202) Fayette Co. Comprehensive Plan Jessamine Co., Nicholasville, Wilmore Joint Comprehensive Plan Fayette Co. Schools District Facilities Plan AirSage KYTC Highway Information System Highway Capacity Manual Lextran Exhibit 3.1 Lexington Area MPO Travel Demand Model Inputs M e t r o p o l i t a n T r a n s p o r t a t i o n P l a n Page 73
 Data for the Lexington Area MPO Lexington s TDM is based on data from nine counties in central Kentucky.")

84 Exhibit 3.2 Example of Travel Pattern (AirSage) Data for the Lexington Area MPO Lexington s TDM is based on data from nine counties in central Kentucky. This regional focus allows the model to account for longer distance trips into and out of Fayette and Jessamine County. Counties included in the regional model are shown in Exhibit 3.3 including Bourbon, Clark, Fayette, Garrard, Jessamine, Madison, Mercer, Scott and Woodford and a small portion of Franklin Co. Exhibit 3.3 Lexington Area MPO Travel Demand Model Area M e t r o p o l i t a n T r a n s p o r t a t i o n P l a n Page 74
85 The TDM was used to evaluate current and future population and employment density and growth areas (see Population Growth and Employment in Chapter 2). The model was also utilized to show current and future system capacity, flows and areas of congestion. The model provides system-wide performance measures for a base year (2012) given the existing roadway network and committed projects (E+C) which can be compared against a no-build and build alternative for the plan horizon year of The model also provides estimated system-wide transportation performance measures such as VMT and VHT should the MTP projects be completed (see Chapter for more information) M e t r o p o l i t a n T r a n s p o r t a t i o n P l a n Page 75
86 3.4 Financial Forecasts A major goal of the 2040 MTP is to provide a realistic estimate of total revenues that the MPO expects to receive over the next 26 years for transportation investment. The MTP also presents a financially constrained list of programs and projects that may be accomplished during the plan horizon given those anticipated federal, state and local revenues. This section provides an overview of estimated revenues and resources that may finance the programs and projects identified within the MTP. This funding analysis was performed in coordination with input from federal, state and local transportation agencies. Since the MTP is a long-range, systems-level plan, future revenue projections and anticipated project costs are best estimates utilizing the most current project and cost data available. The funding estimates are based on past historical data. Actual funding availability will depend upon actions taken at the local, state and federal levels. The financial forecasts are presented for highway sources (funds primarily administered through the Federal Highway Administration and KY Transportation Cabinet) and transit sources (funds primarily derived through the Federal Transit Administration and local revenue streams) Revenue Sources Major revenue sources at the local, state and federal levels that are utilized for transportation projects and programs include: Federal Funding The largest funding source for roadway projects is the federal government. The Federal-Aid Highway Act and the Highway Revenue Act of 1956 established the Highway Trust Fund in order to create a financing mechanism for the Interstate Highway System. The Highway Trust Fund is the funding source for most of the programs in the Act. The funds come from a motor fuels tax and are administered by the Federal Highway Administration (FHWA) and the Federal Transit Administration (FTA). The current transportation bill (MAP-21) simplified the funding categories. Program categories and eligible transportation elements and activities include: National Highway System Program (NHS) roadways serving major population centers, principal arterials, the interstate system, intermodal transportation facilities, and major travel destinations Federal Surface Transportation Program (STP) roadways that are classified urban collector or higher in urbanized areas or rural major collector or higher in rural areas, transit capital projects, and bike and pedestrian facilities Federal Surface Transportation Program, Lexington (SLX) STP funding dedicated to the Lexington area Interstate Maintenance (IM) reconstruction and maintenance of the interstate roadways M e t r o p o l i t a n T r a n s p o r t a t i o n P l a n Page 76
87 Congestion Mitigation and Air Quality (CMAQ) projects that reduce roadway congestion and transportation-related emissions Bridge Replacement and Rehabilitation (BRZ/BRX/BRO) Transportation Alternative Program (TAP) a 10% set-aside of the STP program for bicycle and pedestrian, historic preservation, landscaping and environmental projects Federal Transit Administration (FTA) State Funding Section 5303 Metropolitan Transportation Planning Program Section 5307 Urbanized Area Formula Program Section 5309 New Starts Section 5310 Enhanced Mobility of Seniors and Individuals with Disabilities Section 5311 Rural Areas Formula Program Section 5339 Bus and Bus Facility Formula Kentucky levies a motor fuels tax in addition to the federal tax to generate revenues for the administration and construction of transportation projects. State transportation funds are used for maintenance and operations of the statewide system, for the state construction program, and to provide state match required to receive federal funding. State funds are also sub-allocated to local governments on a formula basis through the Municipal and County Aid Program and Rural Secondary Program. Local governments use these funds for maintenance, operations and for federal funding match. State Construction Program (SP) construction, reconstruction and maintenance of state and county roads and bridges State Construction Bonds Program (SPB) funding derived from bonding State Construction High Priority Projects (SPP) funding available for construction, reconstruction, and maintenance of state and county roads and bridges Local Funding In addition to the Rural Secondary, Municipal and County Aid Programs allocated to local governments by the state described above; local cities and counties may use their General Fund as a source of capital for operational and maintenance needs. Local jurisdictions provide local funding to match federal and state funds as well as to fund local transportation projects directly. Money for major capital investments in streets and highways may also come from the sale of bonds Highway Financial Estimate The highway element of the financial plan is divided into a short-range and long-range forecast and financing plan to reflect two planning horizons covered within the 2040 MTP. The short-range forecast corresponds with the FY Transportation Improvement Program (TIP) and Kentucky s 2012 Highway Plan ( ). The long-range forecast covers the remaining years up to M e t r o p o l i t a n T r a n s p o r t a t i o n P l a n Page 77
88 Short-range Forecasts: The Kentucky Highway Plan covers six fiscal years and is developed by the KYTC, approved by the Kentucky Legislature, and signed by the Governor. It is revised every two years to coincide with the even-year legislative sessions. The KY Highway Plan uses project listings developed from MPO urbanized areas, area development districts, rural counties, MPO TIPs, and KYTC Highway Districts to develop a financial programming document to preserve and improve transportation facilities, make roadways safer, and achieve other important transportation planning goals and objectives. The Highway Plan and the TIP must be in agreement and must be fiscally-constrained. Since the TIP is a short range subset of MTP projects and programs, the source of funding for all TIP projects must be accounted for in the MTP as well. The current 2012 Highway Plan ( ) contains projects for the MPO area that were based upon the previous TIP and the last MTP (Year 2035 Metropolitan Transportation Plan). During the first five years ( ) of the 2040 MTP, it is assumed that all current projects in the 2012 Highway Plan will be completed (or have funding programmed). Therefore, the funding amounts shown for the period reflect the costs to complete the projects currently in the KYTC Highway Plan. The estimated revenue and expenditures for TIP Fiscal Years (FY 2013 through 2016) closely adhered to Kentucky s approved 2012 Highway Plan (FY 2012 thru FY 2018). The estimated cost of implementing these short-range highway projects in the 2040 MTP is approximately $269,081,000. Long-range Forecasts: For years , revenue assumptions are based on an analysis of historical expenditures for highway improvement projects in the Lexington area. Data for past expenditures of federal and state funding were available for the 20-year period from 1993 to Amounts spent on construction projects within the Lexington MPO area varied over this period from a low of $10,600,000 annually in 1993 to a high of $93,400,000 in 2008, with an average 20 year spending of slightly over $46 million per year. The observed variability and significant range in expenditures can be attributed to fluctuating construction activity and the costs of major projects. However, when these numbers are averaged over time, some stability can be expected. In addition, recent years have shown larger expenditures than the average. The average amount expended for highway construction over the last 10 years is $54,800,000. The average amount expended over the last 5 years is $65,400,000. An average percentage of statewide funds that were expended annually on projects within the planning area (since 1993) was also calculated and ranged from a low of 1.33% to a high of 7.63% - with an average of 4.18%. During the most recent 5-year period, the local average of statewide spending in the Lexington MPO Area was 4.37%, slightly higher than the 20-year average, also indicating a slight increase in local spending in the recent past. Thus, the last 5-year average of statewide funding (rounded to 4.4%) was assumed to be a reasonable estimate of future funding allocations to the Lexington area for the duration of the MTP planning period. Assuming 4.4% of the current statewide construction budget of approximately $1.2 billion yields an estimated annual dollar amount of $52,800,000 (in current dollars) to be expended in the Lexington MPO Area in the future M e t r o p o l i t a n T r a n s p o r t a t i o n P l a n Page 78
89 Chapter 4 of the MTP outlines the capital projects and expenditures that funding revenues would be applied to over the course the 2040 planning period. One high cost, regionally significant project, the US 27 / I-75 Connector, is currently being studied in-depth to determine its need, impacts, cost and feasibility. Included in the study is an analysis of funding options. Due to the project s high cost, the KYTC has recommended that the construction phase of the project be funded with Innovative Financing which could include toll or other revenue. Based on this recommendation from KYTC, the 2040 MTP financial analysis includes an additional $40,000,000 in estimated innovative financing revenue (equivalent to the current construction costs estimate for the Jessamine County portion of the I-75 Connector). Highway Revenue Estimate Amount Comment Short Range $269,081,000 FY 2014 FY 2018 Long Range $1,161,600,000 FY 2019 FY 2040 Innovative Financing (IF) $40,000,000 Possible funding for US 27 / I75 connector Total in 2014 dollars $1,470,681,000 Total for new projects/programs $1,201,600,000 Long-range funding less short-range commitments Total in Year of Expenditure (YOE) dollars $2,216,966,000 4% inflation factor Exhibit 3.4 MTP Highway Revenue Estimates for the Lexington Area MPO ( ) Year of Expenditure As part of the financial analysis, federal regulations require that all project costs be shown in Year of Expenditure (YOE) dollars. In order to accomplish YOE, the Lexington Area MTP followed KY Transportation Cabinet guidance and used a 4% escalation per year for both costs and revenues. To calculate YOE costs, current project costs were inflated to the midpoint of the 5-year period in which projects are scheduled. For example, the cost for a project scheduled between is increased 4% annually to the mid-year The amounts in the table below reflect short range ( ) and long range ( ) revenue estimates (grouped in 5 year increments and adjusted for YOE as described above) over the 26 year planning horizon. Estimated Highway Revenues ( ) Funding Years Revenue Short Range $269,081,000 Long Range $147,949, $376,333, $457,866, $557,064, $677,754,000 Total $2,216,966,000 Exhibit3.5 Summary of Short and Long-Range Highway Revenue Estimates M e t r o p o l i t a n T r a n s p o r t a t i o n P l a n Page 79
90 It is important to remember that state and federal governments cannot independently fund all projects and programs needed to meet present and future transportation needs of the community. Local governments must also allocate transportation funding both now and in the future ensure the greatest success. Additionally, local governments must continue to seek private financial participation where transportation impacts from private developments and business endeavors necessitate improvements Transit Financial Estimate Prior iterations of the MPO s MTP and Long-Range Transit Plan as well as Fayette County s Comprehensive Plan encouraged increased transit services to manage growing travel demand within the Urban Service Area. The plans emphasized a need to ensure stable revenue sources to enhance mass transit and provide citizens with alternatives to personal vehicles as a means to reduce congestion on roadways, improve air quality, support businesses, employees and employers, and other community benefits. Lextran s revenue comes from three primary sources: Formula allocations from the Federal Transit Administration (FTA); Revenue generated from a local Fayette County property tax; and revenue generated from passenger fares. These funding sources account for an average annual budget of $23 million per year. The MTP projections maintain this annual estimate over the 26 year period from FY 2014 through FY 2040 with a conservative 1% growth factor. These estimates only account for funding that is generally stable over time and does not include one-time or semi-regular infusions of funding from grants or special state/federal funding allocations for major capital projects. It also assumes fares do not increase and that formula funding remains consistent in the future. Estimated Transit Revenues ( ) Funding Years Revenue Short Range $111,768,000 Long Range $ 46,288, $119,831, $ 125,943, $ 132,367, $ 139,120,000 Total $675,316,000 Exhibit 3.6 Summary of Short and Long-Range Transit Revenue Estimates M e t r o p o l i t a n T r a n s p o r t a t i o n P l a n Page 80
91 3.4.4 System Operations, Maintenance and Preservation Maintaining and operating the transportation system in a way that preserves past investments and maximizes the safety, efficiency and reliability of transportation facilities and services is a top priority. State, local and transit agencies each play a significant role in maintaining and operating our roads, bike/pedestrian and transit facilities. They contribute resources including personnel, equipment, materials and associated funding to keep the system up and running on a day-to-day and long-term basis. State Role Routine maintenance and operation of the State Road System is accomplished by KYTC. The agency commits funding to ongoing operations and maintenance programs in the Statewide Transportation Improvement Program (STIP). The KYTC is organized to provide operational and maintenance services in four key functional areas: roadway maintenance; bridge maintenance; rest area maintenance; and traffic operations. The types of maintenance and operational activities that funding is utilized for include: Pavement maintenance, guard rails and median cable barriers, drainage channels, tunnels, retention basins, and sound walls, maintenance and restoration of landscaping, roadway lighting, traffic signals, signing and striping, freeway management system support, utility locating services, encroachment permits, crash clearing, repair of damaged safety features, litter pickup, snow and ice removal. Average state/federal funding expenditures for maintenance and operational functions in Fayette and Jessamine County are show in Exhibit 3.7 below. Local Agency Role Lexington MPO member agencies (Lexington-Fayette Urban County Government, Cities of Nicholasville, Wilmore and Jessamine County) also work to maintain and operate the transportation system. These agencies apply state and local funds and their share of state highway user revenue funds (municipal and county-aid funds) towards maintenance and operation activities similar to those listed above. The goal of local funding is to supplement, not supplant federal-level and state revenues that KYTC dedicates to maintenance and preservation in the Lexington MPO area M e t r o p o l i t a n T r a n s p o r t a t i o n P l a n Page 81
92 Transit Providers Regional transit and paratransit providers must also operate and maintain service, with operating costs being the primary financial need for transit services. Maintenance needs include the repair, rehabilitation and restoration of existing transit facilities and fleets. LexTran has estimated they will spend over $28 million to operate and maintain transit service in FY If and when revenue falls short of expenses, additional funding from grants or special state/federal funding allocations for major capital projects is used to supplement regular revenue sources and/or service adjustments are made. Lextran has forecasted similar operating and maintenance needs for the 26 year period of this MTP. Lextran reviews maintenance needs, operational efficiencies and related budgets every 5 years via a Comprehensive Operational Analysis (COA) of the transit system. The most recent COA is underway and will assess public transit needs and funding needed to maintain an expanding transit fleet. Funding for Maintenance & Operations In order to preserve, protect and maintain the evolving transportation system, the MPO will continue to coordinate with local and state agencies as described and work to ensure adequate funding for maintenance and operational needs. The total expenditures for operational and maintenance activities estimated by these agencies are summarized in Exhibit 3.7 below. This includes over $136 million in expenditures/revenues from FY Maintenance & Operations Estimates Major O & M Funding Sources Exhibit 3.7 Maintenance & Operations Estimates Source: KYTC, LFUCG, Lextran Funding Estimate State Funding (KYTC) $314,418,000 Local Funding $104,000,000 Lextran $2,528,552,000 Total $2,946,970, M e t r o p o l i t a n T r a n s p o r t a t i o n P l a n Page 82
93 3.5 Project Identification & Prioritization In developing the MTP, the MPO worked to identify projects and strategies to address the region s current and future transportation needs and to evaluate and prioritize solutions in a consistent and objective manner Project Sources Projects identified as a need and evaluated by the MPO came from various sources. Many projects were derived from more than one resource or needs listing. A tool was then developed to help set priorities for future spending since the needs and associated costs to address them exceeded anticipated revenues. Project Source Description 2035 MTP Projects identified in the 2035 Plan that were not implemented and remain relevant Unscheduled Needs List (UNL) Projects that have been proposed in the MPO area and are prioritized by the MPO for possible inclusion in the KYTC State Highway Plan KYTC s District 7 Transportation Plan Projects from the UNL prioritized by the KYTC through an inclusive, datadriven process for possible inclusion in the KYTC State Highway Plan Other Plans Projects identified in other plans that looked at specific issues such as corridor congestion and transit needs. (CMP, Transit Plan, Bike/Ped Plan) Input from staff, citizens and officials Projects and locations specified by local technical staff, citizen comments and local elected officials Exhibit 3.8 Project Sources for MTP Consideration Prioritization Tool To develop a financially constrained transportation plan, the MPO had to prioritize which projects could be completed with existing and estimated financial resources. The goal of the MPO s scoring process was to identify which projects would best facilitate the region s long term vision and to evaluate them in a consistent and systematic way. The scoring system was based on both federallydefined planning factors and locally-specific goals established by the MPO. Projects were evaluated and scored on a 100 point scale. The numeric ranking helped indicate the project s ability to accomplish MTP goals and its relative importance in relation to other projects. The process was intended to provide decision-makers with a basis of comparison and a recommended list of projects for the 2040 Plan M e t r o p o l i t a n T r a n s p o r t a t i o n P l a n Page 83
94 Local, Regional & Federal Goals The scoring criteria below are based on the 2040 MTP Goals and Objectives which were derived through public and stakeholder input. Each MTP goal was the basis for a project scoring category. One additional scoring category was added to address project feasibility (which relates to project delivery as set forth in national goals): Safety crash rates and safety improvement strategies Access/Choices enhancing more than one mode and providing access to low income, minority, disabled, or elderly populations Connectivity providing connections for road, bike, pedestrian users as well as regional connections; this includes providing redundancy to enhance transportation system security Efficient, Reliable, Well Maintained addressing congestion through multimodal solutions, operational improvements, or added capacity and enhancing system conditions Economic Vitality supporting employment centers and freight movement Community Character supporting quality growth through infill, redevelopment, streetscapes and mixed use development Environment encouraging sustainable transportation solutions Health and Wellness supporting physical activity and reduced vehicle emissions Project History and Feasibility* - this ninth factor was included in the scoring process to account for public and political support and for physical or financial constraints that would impact the likelihood of the project being implemented. The MPO also reviewed all of the required planning factors that are identified in the current federal transportation legislation (MAP-21) to ensure they were accounted for the scoring process. The planning factors set forth in federal regulations include: Support the economic vitality by enabling global competitiveness, productivity and efficiency; Increase the safety of the transportation system for motorized and non motorized users; Increase the security of the transportation system for motorized and non motorized users; Increase the accessibility and mobility options available to people and for freight; Protect and enhance the environment, promote energy conservation, improve quality of life, and promote consistency between transportation improvements and State and local planned growth and economic development patterns; Enhance the integration and connectivity of the transportation system, across and between modes, for people and freight; Promote efficient system management and operation; and Emphasize the preservation of the existing transportation system. More detailed information on the project scoring factors and criteria can be found in Appendix D M e t r o p o l i t a n T r a n s p o r t a t i o n P l a n Page 84
95 Congestion Management Process Since the Lexington urban area has a population greater than 200,000, it is federally designated as a Transportation Management Area (TMA). In a TMA, the planning and programming process is required by federal regulations to consider urban congestion management and give priority projects that relieve congestion. To ensure the prioritization tool was consistent with the MPO s Congestion Management Process (CMP), additional points were awarded to projects along congestion management routes based on current congestion levels. Points were also awarded to projects that applied a greater variety of congestion management strategies. Environmental Justice, Title VI & ADA Per federal law, MPOs must ensure equitable distribution of transportation services, facilities and resources within the community without regard to income, race, age, ability and other socioeconomic factors; as well as avoiding any negative impacts or burdens on minority and low-income populations. The prioritization tool assigned additional points to projects that would serve disadvantaged populations and enhance the mobility of minorities, people in poverty, people with disabilities and carless households. The areas within the MPO that have greater densities of disadvantaged populations are shown in Appendix E Project Scoping & Estimates Each project location was reviewed to ensure the proposed solution and project scope fit within the need and context of the surrounding area. For example, although traffic volumes may indicate a 4- lane roadway is needed in a residential area, a practical solution recognizes that is not a good fit and explores other options. Likewise, widening a right-of-way that is constrained by buildings, historic or environmental features may not be a practical solution to address long-term congestion issues, thus operational and multimodal improvements are identified as a preferred solution. With these constraints in mind, each improvement was categorized by its main function capacity improvement or operational improvement. Of course, many projects include both types of improvements but a primary project scope typically overrides the other. Updated planning-level cost estimates were prepared for this plan by state and local engineers based upon the latest project scopes and costing information available. Some cost estimates are derived from up-to-date planning studies conducted specifically for the respective projects, an example being the 2007 Congestion Management Study. Estimated project costs were used by the MPO to help determine which projects might be implemented over the 2040 planning period given expected future revenues M e t r o p o l i t a n T r a n s p o r t a t i o n P l a n Page 85
96

97 M e t r o p o l i t a n T r a n s p o r t a t i o n P l a n Page 87
98

99 Chapter 4 Our Priorities The 2040 MTP Goals and Objectives outline the Lexington Area MPO s commitment to providing a well-functioning, multimodal transportation system so that our Region can continue to grow and thrive. Investments in a more sustainable transportation system and a complete street approach to roadway design are important strategies to accomplish this. 4.1 Complete Streets A key policy to achieving an effective and equitable transportation system is commonly termed Complete Streets. This concept is not new to the MPO Area, but is still in the process of being fully embraced and accomplished. Complete Streets strive to ensure all residents have equal access to employment, education, services and goods within our community regardless of age, income or ability. This includes seniors, children, people with disabilities as well as people who cannot, or choose not to drive. Complete street design practices result in right of ways that serve the mobility needs of everyone and contribute to community identity. In addition, Complete Street transportation networks should strive to go beyond minimum Americans with Disabilities Act requirements to achieve best practices for accessibility for all people. 4.2 Sustainable Transportation Investment The MPO s 2040 MTP investment strategy is designed to address mobility and congestion management in more ways than one so that we can handle travel in a more context-sensitive, efficient and sustainable way than we do today. We recognize that a transportation system primarily geared toward automobile use leads to a number of individual, community and global consequences. Thus, the MPO and public have expressed a growing need to accommodate future travel differently than we have in the past. We recognize that personal auto use will continue to be a common mode of travel for many people. Our goal is to accommodate vehicular use as best we can, but not at the expense of making other transportation modes less desirable. We also want to reduce auto travel for some of our daily trips through more integrated land use patterns and to make travel by other modes safer and more convenient. That end, the MPO has proposed a multipronged approach to transportation investment. First and foremost, we need to take care of our existing infrastructure, look to increase the efficiency of existing infrastructure through improved operations, to provide more and better transportation choices, to be strategic in how and where we add system capacity, and when doing so, ensure that we improve travel capacity for all modes, not just personal vehicles. Projects, programs and policies that the MPO has identified to improve mobility and reduce congestion generally fall within the following project type/funding categories: M e t r o p o l i t a n T r a n s p o r t a t i o n P l a n Page 89
100 Multimodal Capacity Intersection & Corridor Modernization Public Transit Expansion/Improvements Operations, Maintenance & Management Bicycle & Pedestrian Facilities Exhibit 4.1 below summarizes the type of projects that may be eligible for funding within these projects categories. The list is illustrative, rather than exhaustive. Funding allocation amounts and specific projects and initiatives are further described within this Chapter. Multimodal Highway Capacity Major Widening (add lanes) Major Interchange Capacity New Roads Transit Upgrades (Lanes, Optimization, Stops/Shelters, Amenities) Bicycle & Pedestrian Upgrades Intersection & Corridor Modernization Minor Widening Upgrade to Urban Cross-section Safety Improvements Turn Lanes/Access Management Sidewalks & Bikeways Transit Expansion/ Improvements Increased peak-hour frequency (high volume routes) New/enhanced transfer points Regional Commuter Service (targeted routes) Technology & Amenities Bus Rapid Transit implementation (targeted/phased routes) Exhibit 4.1 Eligible Project Types for Major MTP Funding Categories Operations, Maintenance, Management Traffic Operations (ITS, signals, signs, markings, technology, upgrades) Increased O & M for highway & transit expansions Bus replacement Safety Hazards, ADA Deficiencies, Drainage Improvements Travel Demand Management Bicycle & Pedestrian Sidewalks (with no roadway impact) Shared Use Paths (commuteroriented) Bike lane enhancements Intersection & crossing improvements Education, Outreach & Marketing 4.3 Financial Plan The 2040 MTP Financial Plan describes how estimated revenues from existing and proposed funding sources will be used to construct, maintain and operate the existing and planned transportation system over the 26-year planning period. Chapter 3 of the MTP described the anticipated total revenue (based on past expenditures) in greater detail M e t r o p o l i t a n T r a n s p o r t a t i o n P l a n Page 90
101 4.3.1 Short Range Financial Plan ( ) As noted in the previous chapter, highway and transit funding can be divided into short and long range elements based on the project implementation documents the Transportation Improvement Program (TIP) and the Kentucky State Highway Plan. These documents identify projects and the corresponding funding needed to complete them within the near term. The TIP covers FY while the Kentucky State Highway Plan addresses 6 years ( ). Thus, the 2040 MTP Short Range Financial Plan corresponds with these documents and covers the years Exhibit 4.2 and 4.3 include a project list and map of the projects that are currently included in the MPO s TIP and the 2012 KY State Highway Plan. More details on project phasing and funding details can be found in the TIP at Short Range Financial Plan ( ) MTP Project ID Project ID Sponsor Facility Description Total Cost (x1000) S KYTC KY 4 Bridge painting on New Circle Rd $4,160 S KYTC CR-1122 Replace bridge over Boone Clark Co. line; Length=0.1 mi $810 S KYTC US 421 Replace bridge on US 421 over fork of Town Branch at intersection with Bracktown Rd; Length=0.1 mi $1,350 S KYTC KY 4 New Circle Road improvements between Versailles Rd and Georgetown Rd.; Length=4.1 mi $39,860 S KYTC CS 3605 Replace bridge on Malabu Dr over branch of Hickman Creek a Tates Creek Rd; Length=0.1 mi $1,000 S KYTC KY 353 Russell Cave bridge over I-64/75; overlay bridge deck; Length=0.1 mi $275 S KYTC KY 57 Bryan Station bridge over I-64/75; overlay bridge deck; Length=0.1 mi $275 S KYTC US 25 Reconstruct/widen US 25 (Georgetown Rd) from Spurr Rd. south of I-75 to 1400 ft. south of Ironworks Rd; Length=3.2 mi S KYTC US 60 Pavement rehab on US 60 from Bluegrass Pkwy to KY 4; Length=8.0 mi $25,000 S KYTC US 60 Versailles Rd. pavement rehab from Bennett Ave to Oliver Lewis Way; Length=0.5 mi $2,650 S LFUCG US 25 Richmond Rd. Multiuse Path between Eagle Creek Dr. and Coys Lane; Length=1.2 mi $690 S KYTC US 421 Leestown Rd. widen to 4 lanes from existing 4-lane to Masterson Park; Length=1.5 mi $15,000 S KYTC US 421 Leestown Rd. widen to 4 lanes from existing 4-lane to Masterson Park; Length=1.6 mi $4,856 $33, M e t r o p o l i t a n T r a n s p o r t a t i o n P l a n Page 91
102 Short Range Financial Plan ( ) S LFUCG CS Clays Mill Rd widen from Harrodsburg Rd to New Circle Rd - Section 1; Length=2.0 mi (Mod #4) $16,250 S LFUCG CS Clays Mill Rd widen from Higbee Mill Rd to Twain Ridge Dr - Section 2B; Length=0.3 mi $640 S LFUCG CS Clays Mill Rd widen from New Circle Rd to Keithshire Way - Section 2C; Length=0.6 mi (Mod#4) $3,750 S LFUCG KY 1927 S KYTC S KYTC New Route New Route S LFUCG NA Liberty Rd/Todds Rd widen from 0.2 mi S. of Andover Forest Dr/Forest Hill Dr to Polo Club Blvd - Section 2A & 2B; Length=1.6 mi (Mod #4) Citation Boulevard - Phase IIA from Southern RR to Mercer Rd; Length=1.7 mi Citation Boulevard - Phase IIB from Mercer Rd to Leestown Rd.; Length=0.8 mi Various Continuing Programs (Rideshare/Mobility, Air Quality Planning, Cong. Management, Bike/Ped Planning, Traffic Signals) (Mod #4) S LFUCG NA South Elkhorn Trail from Joseph Bryan Way through NS RR tunnel to Waveland - Section 2; Length=0.3 mi $400 S LFUCG NA South Elkhorn Trail from Lochdale Terrace extending under Man o' War to Shillito Park - Section 3; Length=0.3 mi S LFUCG NA West Hickman Trail Phase 1B from Clearwater Way at Man o' War Blvd. to Veterans Park; length=1.5 mi $1,050 S LFUCG Rose St Add bike lane on Rose Street from Rose Lane to Euclid; Length=0.2 mi (Mod #4) $252 S KYTC Construct pedestrian mall and streetscape improvements on Lexington College, Walnut and Gilespie Sts. Wilmore S KYTC KY 4 New Circle Road reconstruct Versailles Rd interchange; Length=0.1 mi $15,000 S LFUCG New Trail S S KYTC KY 4 Legacy Trail amenities and enhancements including the Isaac Murphy Memorial Art Garden trailhead (Mod #3) KYTC NA Operation of Valley View Ferry at KY River New Circle Road widening from Georgetown Rd. to Boardwalk including Newtown interchange frontage roads and ramps at Georgetown; Length=1.3 mi S KYTC IC-8104W University Dr bike lane extension from Cooper Dr to Alumni Dr; Length=0.4 mi $69 S KYTC Town Branch Trail from New Circle Rd to McConnell Springs crossing Old Frankfort Pk; Length= mi $459 S KYTC CS 1486 S KYTC/Jess. Extend East Brannon Rd from exiting road east of Lauderdale Dr to Tates Creek Rd (KY 1974); Length=2.5 mi M e t r o p o l i t a n T r a n s p o r t a t i o n P l a n Page 92 $14,254 $21,120 $2,710 $5,390 $625 $2,192 $1,000 $935 $39,950 $15,025 KY 129 Wilmore downtown drainage and street improvements $500
103 Short Range Financial Plan ( ) S KYTC/Jess. S KYTC/Jess. S KYTC/Jess. S KYTC KY 29 Turn lanes at W. Jessamine HS and E. Jessamine Middle $22 KY 169 Culvert replacement 0.5 mi W of US 68 $460 Nicholasville/Jessamine Co. pedestrian connections to schools study and preliminary engineering $100 Preliminary engineering and evaluate the financial feasibility of design/build/toll for new connector between US 27 N of Nicholasville and I-75 at the KY 627 interchange; Length=2.5 mi S KYTC US 27 Replace L&N RR bridge overpass, improve drainage and typical section on North Broadway; Length=0.3 mi $6,000 S KYTC KY 922 S KYTC KY 1980 S KYTC KY 2335 Construct an additional lane on Newtown Pk (KY 922) from Pintail Dr to SB I-75 entrance ramp; Length=0.3 mi Improve geometrics, typical section, and roadway hazards on Brannon Rd from US 68 to US 27; Length=3.2 mi Improve typical section and pavement on Ware Rd from Briar Hill Rd (KY57) to N entrance of Lex Bluegrass Army Depot; Length=2.1 mi S KYTC KY 169 Reconstruct KY 169 E of Keene to eliminate drop-offs; Length=0.5 mi $2,500 $3,000 $26,500 $11,500 $4,400 S KYTC CS 1375 Widen W 4th Street to 3 lanes from Henry St to Newtown Pk (KY922) including a new S entrance to BCTC; Length=0.2 mi S KYTC CS 1376 Construct N entrance to BCTC with turn lanes on Loudon Ave and Newtown Pk; Length=0.1 mi $1,000 $1,250 S LFUCG CS 4524 Widen Man O' War Blvd at Pink Pigeon Pkwy for dual left turn lanes $516 S LFUCG CS 4524 Man O' War Blvd at Alumni Dr turn lane improvement $869 S LFUCG CS 4524 Man O' War Blvd at Richmond Road turn lane improvement $614 S S S S S KYTC / LFUCG KYTC / LFUCG KYTC / LFUCG KYTC / LFUCG KYTC / LFUCG KY 922 KY 922 KY 922 KY 922 KY 922 Newtown Pk. Extension from Main St. to S. Limestone (additional funding for CLT); Length=2.5 mi Newtown Pk. Extension - Priority 2: Redevelopment of Southend Park Neighborhood Newtown Pk. Extension - Priority 2: redevelopment of Southend Park neighborhood Newtown Pk. Extension - Priority 3: From Versailles Rd to Broadway (Phase II); Length=0.6 mi Newtown Pk. Extension - Priority 4: From Existing Newtown & Patterson to S. Limestone (Phase III - Scott St. Connector); Length=0.5 mi S KYTC US 60 Scoping Study to reconstruct/widen US 60 (Winchester Rd) to 4 lanes; Length=0.9 mi $400 $5,241 $8,740 $6,106 $21,540 $22, M e t r o p o l i t a n T r a n s p o r t a t i o n P l a n Page 93
104 Short Range Financial Plan ( ) S KYTC US 27 Construct a new 4-lane connector between US 27 and I-75 $14,500 S KYTC US 27X Main Street provide streetlights from Oak Street to Chestnut Street; Length=0.2 mi $750 S LFUCG New Blvd Complete construction on Polo Club Blvd at Deerhaven Lane and Todds Rd; Length=0.2 mi (Mod #4) $2,564 S KYTC S KYTC New Route New Route East Nicholasville Bypass Section 1 from US 27 N of Nicholasville to KY 39; Length=4.3 mi East Nicholasville Bypass Section II from KY 39 to US 27 S of Nicholasville; Length=4.3 mi S KYTC US 68 Reconstruct intersection of KY 29 N of Wilmore; Length=0.7 mi $5,700 S-60 LFUCG KY 1974 Tates Creek Rd signal upgrades to replace inadequate facilities, upgrade signal faces and upgrade crosswalks S-61 LexTran LexTran Operating Expenditures $17,783 S-62 LexTran LexTran Capital Expenditures $8,780 S-63 LexTran LexTran Elderly and Disability Transportation Services - Wheels $675 S-64 LexTran LexTran Alternative Analysis $256 S-65 BUS Bluegrass Ultra-transit Service in Jessamine Co. expenditures $82 S-66 BUS Bluegrass Ultra-transit Service in Jessamine Co. expenditures $145 $89,750 $35,050 $250 Exhibit MTP Short Range Financial Plan (i.e. Transportation Improvement Program Project Table) M e t r o p o l i t a n T r a n s p o r t a t i o n P l a n Page 94

105 Exhibit 4.3 Lexington Area MPO Transportation Improvement Project Map M e t r o p o l i t a n T r a n s p o r t a t i o n P l a n Page 95
.")
106 4.3.2 Long Range Financial Plan ( ) The MPO anticipates that approximately $1.2 billion dollars (see MTP 3.4.2) will be available for new projects and programs in the Lexington MPO Area from 2019 to 2040 (after accounting for funds that are needed to complete projects currently scheduled from 2014 to 2018 as shown in MTP 4.3.1). The chart below shows how the MPO plans to allocate this anticipated funding to transportation projects and programs moving into the future. It is important to note that these are long-range funding targets, not fixed amounts. Given the nature of transportation programming and projects, the funding allocations are expected to flex from year to year. Annual funding amounts per project category will likely shift, sometimes substantially, from year to year as projects and initiatives enter particular phases of implementation, such as construction (versus design), which requires more revenue. However, the intent is for expenditures to average the annual amounts and percentages over time. Additionally, the allocation of funds to the project categories shown below will not commence in earnest until the committed projects within the TIP and STIP are complete. Rather, the proposed targets will guide how new projects are selected for inclusion in future TIP and STIP updates. Exhibit 4.4 Long Range Financial Plan: Allocation Targets by Project Categories (%) Long-Range Financial Plan: Allocation Targets by MTP Project Category Exhibit 4.5 Long Range Financial Plan: Allocation Targets by Project Category ($) % $ Annual $ Multimodal Highway Capacity 42 $487,872,000* $22,176,000 Intersection & Corridor Modernization 20 $232,320,000 $10,560,000 Transit Expansion (Capital & Operating) 20 $232,320,000 $10,560,000 Operations, Maintenance & Management 10 $116,160,000 $5,280,000 Bicycle & Pedestrian 8 $92,928,000 $4,224, $1,161,600,000 $52,800, M e t r o p o l i t a n T r a n s p o r t a t i o n P l a n Page 96
107 These proposed funding allocations and targets (in 2014 dollars) were applied to the prioritized highway project list to determine which of the highest ranking projects could be funded within the Long-Range planning period from Chapter 3 of the MTP describes how the highway projects were identified and ranked using a consistent, objective methodology. During that process, projects were classified as capacity or operational improvements. Capacity projects were included in the Multimodal Highway Capacity funding category (42% of funds) and operational projects were included in the Intersection and Corridor Modernization funding category (20% of funds). Available funds for these two project categories were combined and considered together (for a total of 62% of funds) when establishing a funding sequence and timeline for projects (see Exhibit 4.6 and 4.7 below). The goal was to allow additional flexibility for the implementation of both project types over time taking into consideration the project score, the estimated project cost, and the revenue anticipated to be available during the 5-year grouped planning periods extending from 2019 through Funding Targets (x $1,000,000) by Project Category by Year (in YOE=4%) Funding Years Total Available Multimodal Highway Capacity Intersection & Corridor Modernization Transit Expansion Exhibit Funding Target Amounts: by Project Category & by Year (in YOE = 4%) Operations, Maintenance, Management Bicycle & Pedestrian $ $62.14 $29.59 $29.59 $14.79 $ $ $ $75.27 $75.27 $37.63 $ $ $ $91.57 $91.57 $45.79 $ $ $ $ $ $55.71 $ $ $ $ $ $67.78 $ Funding Targets (x 1,000,000) (in YOE =4%) Funding Years Combined: Multimodal Capacity & Modernization Improvements $ $ $ $ $ Total 1, Exhibit Funding Target Amounts: Combined Multimodal Capacity & Modernization Improvements (in YOE=4%) M e t r o p o l i t a n T r a n s p o r t a t i o n P l a n Page 97

108 4.4 Multimodal Highway Capacity As our community matures, opportunities to relieve congestion through major widening projects has become more challenging and cost prohibitive. Construction costs continue to rise and funding for large-scale transportation projects is more constrained, as are urban rights of way. Thus, our challenge is to maximize system performance through innovation and cost-effective measures and to be strategic regarding where and how new highway capacity is added. We must think of capacity in terms of our ability to accommodate person trips, not just vehicle rips, and the transportation system s ability to move the greatest number of people. A corridor s capacity for moving people includes people traveling in cars, riding buses, traveling on foot or by bike. Thus, capacity improvements may include vehicular lanes, transit lanes, amenities that support transit services, bicycle facilities, sidewalks and safe crossings. The MTP recommends allocating 42 percent, or $487,871,000 (in today s dollars) of our anticipated future revenues toward Multimodal Highway Capacity projects which includes new roads, major widening of existing roads and associated complete street improvements. The recommended projects are mapped in Exhibit 4.9 and listed by general timeframe in Figure Projects include major interchange upgrades and adding travel lanes along many of our major roadways that serve significant cross-town and regional travel and freight needs, including access to Interstate highways. Example projects include Newtown Pike, Winchester Road, Man O War Boulevard, New Circle Road, Alumni Drive and Tates Creek Road in Lexington. Jessamine County capacity projects include US-27 and a placeholder for the I-75 Connector should analysis currently underway lead to a recommendation to proceed with the project M e t r o p o l i t a n T r a n s p o r t a t i o n P l a n Page 98

109 4.5 Intersection & Corridor Modernization The goal of Intersection and Corridor Modernization projects is to make our transportation corridors work better through improved efficiency and to improve access and safety for people traveling in vehicles, on foot, by bike and by bus. The projects seek to improve operations to address bottlenecks at intersections and along congested, constrained right of ways. Operational improvements may include minor capacity additions (such as turn lanes) to improve traffic flow, including for busses and freight carriers. Solutions may also include intelligent technology, intersection upgrades, signal coordination, access management, sidewalks, streets crossings, and facilities to better accommodating transit riders and bicycle traffic. Projects may improve safety or upgrade bridge or drainage structures. Many will upgrade rural cross-sections to urban crosssections (providing curbs, gutters and sidewalks) within urbanized areas. The MTP recommends allocating 20 percent, or $10,560,000 annually (in today s dollars), toward Intersection & Corridor Modernization projects (identified as operations in the project tables below). The recommended project locations are shown in Exhibit 4.9 and listed by general timeframe in Exhibit Most projects seek to improve operations along constrained roadways that carry significant amounts of regional traffic such as Winchester Road, Nicholasville Road, Newtown Pike, Harrodsburg Road, Versailles Road, etc. A number of projects are also proposed along cross-town connectors in need of multimodal facilities to improve connectivity such as Loudon Avenue, Liberty Road, Todds Road, Wilson Downing Road, Armstrong Mill and North Limestone in Fayette County as well as West Main Street in Wilmore and 3 rd Street/Keene Road in Nicholasville. See Exhibit 4.9 and 4.10 for a map/list of all locations. A key of abbreviations found within the project description is in Exhibit 4.8 below. Project Abbreviation Key AM BL C/G D R U C RR SW SUP YOE access management bike lane curb and gutter design right-of-way utility construction railroad sidewalk shared use path year of expenditure Exhibit MTP Project Abbreviation Key M e t r o p o l i t a n T r a n s p o r t a t i o n P l a n Page 99

110 Exhibit MTP Improvement Project Map (Multimodal Capacity and Intersection & Corridor Modernization) M e t r o p o l i t a n T r a n s p o r t a t i o n P l a n Page 100
111 Capacity Operation 2040 MTP Long Range Improvement Projects: Multimodal Highway Capacity and Intersection & Corridor Modernization in Year of Expenditure Dollars (YOE=4%) MTP ID# County Route Road Name From/To Project Description Dist. (ft) Project Cost (YOE=4%) Year Y Fayette KY 4 New Circle Rd Trade Center Dr to Woodhill Widen to 6 lanes, add Bikeway/SW, improve transit service 6,900 $26,158,000 2 Y Fayette CS 3016 Alumni Dr Nicholasville Rd to Tates Creek Rd 4 lane BLVD, BL or SUP, C/G/SW, Roundabouts 6,300 $9,125,000 3 Y Fayette KY 4 New Circle Rd Boardwalk to Limestone Widen to 6 lanes, add Bikeway/SW, improve transit service 4,600 $19,466,000 4 Y Fayette KY 922 Newtown Pk Main St to NCR AM, operational & multimodal improvement 7,200 $1,825,000 5 Y Fayette KY 1974 East High St Cochran to Euclid; Reconfigure & Streetscape; includes Euclid (TC to Ashland) $7,300,000 6 Y Fayette KY 1927 Liberty Rd New Circle Rd to Graftons Mill Widen to 3 lanes, add BL/C/G/SW 5,500 $23,725,000 7 Y Fay/Jess US 27 Nicholasville Rd Man O War to Nicholasville Byp Access management 25,400 $10,342,000 Total Cost (Year ) $97,941,000 Total Revenue (Year ) $91,729,000 Exhibit MTP Long Range Improvement Projects: in Year of Expenditure Dollars (YOE=4%) M e t r o p o l i t a n T r a n s p o r t a t i o n P l a n Page 101
112 Capacity Operation 2040 MTP Long Range Improvement Projects: Multimodal Highway Capacity and Intersection & Corridor Modernization in Year of Expenditure Dollars (YOE=4%) MTP ID# County Route Road Name From/To Project Description Dist. (ft) Project Cost (YOE=4%) Year Y Fayette KY 4 New Circle Rd Limestone to Eastland Pkwy Widen to 6 lanes, add Bikeway/SW, improve transit service 8,500 $32,935,000 9 Y Fayette KY 922 Newtown Pk New Circle Rd to 1-75 Widen to 6 lanes, add C/G/B/SW, transit imp. & SUP overpass 9,200 $38,782, Y Fay/Jess US 27 Nicholasville Rd Man O War to Nicholasville Byp. Widen to 6 lanes, transit improvement, SUP 25,400 $37,154, Y Fayette US 60 Versailles Rd Viley Rd to Oliver Lewis Way AM, operational & multimodal improvement 1,1100 $12,138, Y Fayette US 27 Nicholasville Rd Southland Dr to New Circle Rd Bus rapid transit, AM, operational & bike/ped 4,900 $4,115, Y Fayette CS 4524 Man O War Blvd I-75 to Richmond Rd Widen to 6 lanes, add BL or SUP, improve transit service 13,000 $15,247, Y Fayette US 27 Nicholasville Rd New Circle Rd Interchange Scoping Study $2,590, Y Fayette CS 4524 Man O War Blvd Winchester Rd to I-75 Widen to 4 lanes, add BL or SUP, C/G/SW 6,100 $11,398, Y Fayette US 27 S Limestone Upper St to Cooper Dr AM/operational/multimodal improvements 4,300 $1,406, Y Fayette US 60 Winchester Rd Midland Ave to New Circle Rd AM, operational & multimodal improvement 7,000 $3,997, Y Fayette KY 1974 Tates Creek Rd at New Circle Rd Reconstruct interchange (Double Crossover Diamond) $14,062, Y Fayette KY 1723 Forbes Rd Leestown Rd to Versailles Rd Reconstruct 2 lanes, SUP, operational & transit improvements 5,400 $5,773, Y Fayette CS 4174 Clays Mill Rd Harrodsburg Rd to New Circle Rd Widen to 3 lanes, add C/G/B/SW; incl realign w/ Harrodsburg 10,600 $16,283, Y Fayette CS 4524 Man O War Blvd Tates Creek Rd to Nicholasville Rd Widen to 6 lanes, add BL or SUP, improve transit service 10,600 $13,026, Y Fayette US 27 Nicholasville Rd Cooper Dr to Southland Dr Add one lane, bus rapid transit, multimodal improvements 6,300 $6,809, Y Fayette US 68 Harrodsburg Rd Lane Allen Rd to Mason Headley Bike/ped, intersection operation/capacity 4,000 $2,220, Y Fayette KY 1978 Greendale Rd US 421 to Citation Blvd Reconstruct 2 lanes (C/G, turn lanes, BL, SW) 7,100 $10,732, Y Fayette CS 3663 Mt Tabor Rd Richmond Rd to Patchen/Locust Reconstruct 2 lanes CG / BL / SW 1,300 $1,628, Y Fayette US 421 Leestown Rd at RR underpass Minor widening w/improved drainage under RR overpass $3,331,000 Total Cost ( ) $233,626,000 Total Revenue ( ) $233,327,000 Exhibit MTP Long Range Improvement Projects: in Year of Expenditure Dollars (YOE=4%) M e t r o p o l i t a n T r a n s p o r t a t i o n P l a n Page 102
113 Capacity Operation 2040 MTP Long Range Improvement Projects: Multimodal Highway Capacity and Intersection & Corridor Modernization in Year of Expenditure Dollars (YOE=4%) MTP ID# County Route Road Name From/To Project Description Dist. (ft) Project Cost (YOE=4%) Y Fayette CS 4524 Man O War Blvd Richmond Rd to Tates Creek Rd Widen to 6 lanes, add BL or SUP, improve transit service 22,100 $75,640, Y Fayette KY 1974 Tates Creek Rd Malabu Dr to Armstrong Mill Rd Widen to 6 lanes, NCR Interchange, Multimodal Imp. 3,700 $10,986, Y Fayette CS 2418 Liberty Rd Appletree Ln to New Circle Rd Reconstruct 2 lanes; CG / BL / SW; transit improvements 3,800 $11,256, Y Fayette KY 421 Leestown Rd Forbes Rd to Burke Rd Access management; multimodal improvements (SW) 1,100 $1,081, Y Fayette CS 1001 N Limestone Withers Ave to New Circle Rd Reconstruct 2 lanes CG / BL / SW; transit improvements; AM 2,000 $9,635, Y Jessamin New Connector E Nicholasville Bypass to I-75 Construct new connector - D phase 13,200 $7,204, Y Jessamin e New Connector E Nicholasville Bypass to I-75 Construct new connector - R phase 13,200 $5,403, Y Jessamin e New Connector E Nicholasville Bypass to I-75 Construct new connector - U phase 13,200 $2,701, Y Jessamin e New Connector E Nicholasville Bypass to I-75 Construct new connector - C phase 13,200 $0* 36 Y Fayette e CS 3016 Alumni Dr Edgewater Dr to MOW Blvd Widen to 6 lanes, add SW or SUP/separated bikeway; transit 4,200 $10,644, Y Fayette US 60 Winchester Rd Patchen Wilkes to Elkhorn Rd imp Add lane on shoulder; add SUP 5,000 $2,305, Y Fayette CS 2418 Liberty Rd Dallas Ave to Winchester Rd Access management; C/G/SW/BL 600 $2,161, Y Fayette US 25 Georgetown Rd Lima Dr to Nandino Access Management; SW or SUP; Transit 1,800 $4,502, Y Fayette US 25 Richmond Rd Idle Hour Dr to NCR Intersection operations; C/G/SW or SUP, multimodal 4,000 $2,701, Y Fayette KY 1974 Tates Creek Rd Armstrong Mill to MOW Blvd improvements Widen to 6 lanes, add SW or SUP; improve transit service 5,100 $14,047, Y Fayette US 68 Harrodsburg Rd Lane Allen to Pasadena Multimodal add transit improvements 5,200 $3,422, Y Jessamin US 27X Main St Richmond Ave (KY169) to US 27 AM/operational/multimodal improvements; widen to 5 lanes 3,700 $17,379, Y Fayette e CS 7038 Wilson Downing Byp Belleau Wood to Tates Creek at Reconstruct Orchard Shp 2 lanes/turn Center lanes; operational imp; C/G/SW; BL or 1,400 $3,674, Y Fayette CS 2230 Loudon Ave Road Russel Cave to Bryan Ave SUP Reconfigure; Access mgmt; C/G/SW; add BL 1,500 $3,026, Y Fayette CS 3037 Armstrong Mill KY 1974 (Tates Creek) to MOW Reconstruct 2 lanes / BL or SUP; transit improvements 7,400 $15,938, Y Fayette CS 4791 Southland Dr Rosemont Garden to US 27 AM/operational; C/G/SW; transit improvements 5,500 $10,157, Y Jessamin KY 169 Keene Rd Nicholasville Bypass to Oak St Reconstruct 2 lanes w/ turn lanes; BL or SUP; C/G/SW 7,000 $18,730, Y Fayette e CS 4735 Rosemont Garden Southland Dr to RR Reconstruct 2 lanes CG / BL / SW; Access management 2,400 $5,943, Y Fayette KY 4 New Circle Rd Nicholasville Rd to Harrodsburg Widen to 6 lanes 11,800 $40,305,000 72A Y Fayette KY 1968 Parkers Mill Rd Rd New Circle Rd to Man O War Reconstruct 2 lanes w/ 6 shoulders 4,700 $2,431,000 Total Cost ( ) $278,840,000 * $40,000,000 Estimated Construction Cost to Utilize Innovative Financing Total Revenue ( ) $281,271,000 Exhibit MTP Long Range Improvement Projects: in Year of Expenditure Dollars (YOE=4%) M e t r o p o l i t a n T r a n s p o r t a t i o n P l a n Page 103
114 Capacity Operation 2040 MTP Long Range Improvement Projects: Multimodal Highway Capacity and Intersection & Corridor Modernization in Year of Expenditure Dollars (YOE=4%) MTP ID# County Route Road Name From/To Project Description Dist. (ft) Project Cost (YOE=4%) Y Fayette CS 1321 Russell Cave Rd Park Place to N Broadway Reconstruct, add BL or SUP/C/G/SW $9,970, Y Fayette US 68 S Broadway US 25 (Main) to Mason Headley AM/operational/multimodal improvements 8,800 $7,231, Y Fayette CS 3016 Alumni Dr Tates Creek to Chinoe Rd 4 lane BLVD; Shared use path or SW&BL 3,700 $9,685, Y Fayette CS 7038 Wilson Downing US 27 to Belleau Wood Dr Reconstruct 2 lanes/turn lanes; operational imp; C/G/SW; BL or 7,800 $18,055, Y Fayette CS 2690 Old Todds Rd Catera Trace to Liberty Rd Reconstruct 2 lanes add BL/C/G/SW 7,600 $18,471, Y Jessamin KY 1268 Main St (Wilmore) KY 29 to US 68 Reconstruct 2 lanes; complete SUP/SW 6,700 $12,270, Y Fayette CS 1257 Mercer Rd Greendale to US 25 (Georgetown) Reconstruct 2 lanes; BL/SW or SUP; Transit service 9,000 $22,459, Y Fayette US 27 Nicholasville Rd MOW Interchange Reconstruct intersection $96,409, Y Fayette KY 1681 Manchester St at Forbes Rd Add left turn lanes $876, Y Fayette KY 4 New Circle Rd Woodhill Dr to Nicholasville Rd Widen to 6 lanes 23,400 $108,461, Y Fayette KY 4 New Circle Rd Harrodsburg Rd to Versailles Rd Widen to 6 lanes 12,600 $41,894,000 Total Cost ( ) $345,781,000 Total Revenue ( ) $345,380,000 Exhibit MTP Long Range Improvement Projects: in Year of Expenditure Dollars (YOE=4%) M e t r o p o l i t a n T r a n s p o r t a t i o n P l a n Page 104
115 Capacity Operation 2040 MTP Long Range Improvement Projects: Multimodal Highway Capacity and Intersection & Corridor Modernization in Year of Expenditure Dollars (YOE=4%) MTP ID# County Route Road Name From/To Project Description Dist. (ft) Project Cost (YOE=4%) Y Fayette CS 4524 Man O War Blvd Nicholasville to Harrodsburg Rd Widen to 6 lanes, add BL or SUP, improve transit service 17,000 $71,178, Y Fayette CS 4524 Man O War Blvd Harrodsburg Rd to Versailles Rd Widen to 6 lanes, add BL or SUP, improve transit service 17,200 $61,794, Y Fayette Citation Blvd Silver Springs Dr to Russell Cave Construct new 2 lane roadway 5,300 $23,859, Y Fayette US 25 Richmond Rd MOW to Hayes Blvd Complete SUP 9,600 $6,665, Y Fayette CS 4540 Mason Headley Shaker Dr to Versailles Rd Reconstruct 2 lanes; BL/SW or SUP 6,900 $28,604, Y Fayette CS 2230 Loudon Ave Oakhill Dr to Bryan Ave Reconstruct 2 lanes ; add BL 2,300 $13,329, Y Fayette CS 4524 Man O War Blvd Various Various low build projects - See Congestion Mgmt Study $5,332, Y Jessamin KY 29 Wilmore/Lex. Rd Epworth to Harrodsburg Rd Urban cross-section upgrade; Shared use path 8,200 $24,792, Y Fayette KY 1977 Spurr Rd Georgetown Rd to Masterson Reconstruct 2 lanes; multimodal improvements 8,800 $18,128, Y Fayette CS 1325 Sandersville Rd at RR overpass Replace overpass; improve cross-section 300 $17,328,000 72B Y Fayette KY 1968 Parkers Mill Rd Versailles Rd to New Circle Rd Reconstruct 2 lanes w/ SUP or urban cross-section 6,400 $44,919, Y Jessamin CS 4174 Clays Mill Rd Brannon Rd to Catnip Hill (KY New Road; Clays Mill Rd extension 9,800 $21,327, Y Jessamin e CS 4174 Clays Mill Rd 3375) Catnip Hill (KY 3375) to KY 169 New Road; Clays Mill Rd extension 9,800 $21,327, Y Fayette e US 60 Versailles Rd (Keene Woodford Rd) Co to Keeneland Widen to 6 lanes 13,600 $37,855, Y Fayette KY 57 Bryan Station Rd Entrance Hermitage Dr to Preakness Dr Add BL / SW on bridge over I-75 2,100 $3,466, Y Fayette CS 3016 Alumni Dr Chinoe Rd to Edgewater Improve intersection with SW or SUP/separated bikeway 6,200 $15,755, Y Fayette US 68 S Broadway at Virginia Ave Improve intersection capacity $133,000 Total Cost ( ) $415,791,000 Total Revenue ( ) $420,208,000 Grand Total Cost for Multimodal Capacity & Modernization Projects ( ) in YOE dollars $1,371,979,000 Grand Total Revenue for Multimodal Capacity & Modernization Projects ( ) in YOE dollars $1,374,521,000 Exhibit MTP Long Range Improvement Projects: in Year of Expenditure Dollars (YOE=4%) M e t r o p o l i t a n T r a n s p o r t a t i o n P l a n Page 105

116 4.6 Transit Expansion/Improvements Public transit use is on the rise both nationally and in the Lexington area. Americans took nearly 10% more trips using public transportation in 2011 than in During that same time period, Lextran s ridership doubled. As our population continues to grow, especially among older and younger age groups, communities are turning to public transit as a key solution to remaining competitive and keeping pace with population growth as road space and land availability becomes more limited. Lexington area residents continue to demonstrate support for sustaining and expanding public transit, including through a local voter-approved property tax in In 2013, respondents to the MPO s Transportation Survey allocated an average of 20 cents on the dollar to public transit when asked how they would invest in transportation. One-third of survey takers said they would like to use the bus for transportation in the future. Openended survey responses often focused on Photo Source: public transit and the desire for better access to transit (sidewalks, routing, service hours and frequency), shorter travel times, and an interest in regional transit service. The MTP recommends allocating 20 percent, or $10,560,000 annually (in today s dollars), toward Transit Operations, Expansion and Improvements. As noted in the MTP Financial Plan, these funding allocations will not be immediately available as funds are committed to complete projects within the short-range financial plan (TIP and STIP). However, the MTP has set forth the policy for increasing future transit services and use and provides a placeholder for the commitment of funds in the coming years as we begin to explore opportunities for transit expansion. With this commitment in place, Lextran and community partners can begin to assess the most feasible, cost-effective means to increase transit services and ridership. Lextran is beginning a Comprehensive Operational Analysis (COA) that will be completed by the start of This COA, which is typically completed every 5 years, evaluates the current transit system and recommends best steps moving forward to meet the needs of users in a cost effective manner. The current COA will take a more comprehensive and long-range look at future capabilities and technologies that optimize and expand transit service. Feasible, cost-effective means to increase transit service and ridership that are identified by the COA may then be vetted, prioritized and programmed for funding through the MPO Planning Process and Transportation Improvement Program. Initiatives that are currently being explored or may be as part of the COA or future study include regional transit, increased service frequency, reduced transit travel times, additional transfer stations and bus rapid transit M e t r o p o l i t a n T r a n s p o r t a t i o n P l a n Page 106
117 Regional Transit Traditionally, Lextran service has only been in Fayette County. Starting in January 2014, Lextran began a one-year pilot of limited service to Jessamine County. The initiative is being funded by Jessamine County governments, Lextran and a FTA Jobs Access and Reverse Commute (JARC) grant. The service is primarily geared toward commuters using a Jessamine County park and ride location. The ability to expand service beyond Fayette County and beyond the one-year of the pilot program is currently limited by available funding for capital and operational costs. The potential interest, usage, needs and cost for continued regional services to Jessamine County and other communities must be further explored and scaled based on which areas can be served, ridership and available funding. Increased Service Frequency Lextran s ability to grow ridership and capture choice riders is limited at current service levels. Current weekday peak service includes 35-minute headways along most routes, with many routes operating 35-minute service throughout the day. Non-peak service on lower-volume routes and Saturday service operates at 70 minute headways. Any future peak-hour service increases would be targeted along the highest-volume routes. Reduced Travel Times Most all Lextran routes currently originate from and converge on the transit center in downtown Lexington, making it the main transfer point for a majority of routes. The radial pulse system makes it difficult to reduce point-to-point transit travel times. The current COA will evaluate the possibility of relocating the downtown transit center and the possibility of multiple transfer points in strategic areas of town for more efficient service options. A main complaint of transit commuters is that Lextran routes do not present an efficient mode of travel given the need to transfer downtown. This was confirmed when comparing travel time responses of transit users versus car commuters in the MPO s Transportation Survey, as well as reported commute times from the US Census. Since travel time is a major factor when selecting travel mode, reducing transit travel times will be critical to enticing people to ride the bus rather than drive. Exhibit 4.15 Average Peak Hour Travel Time Reported by Transit Users vs. Motorists in MPO Transportation Survey M e t r o p o l i t a n T r a n s p o r t a t i o n P l a n Page 107
118 Operational & Administrative Facility After an extensive search of Fayette County, Lextran has identified and purchased land to build a new administration building that will consolidate its entire staff as well as vehicle housing and maintenance into one facility. Currently, portions of the Lextran staff and maintenance functions are housed at different properties, including rental properties. The new facility will increase efficiency through centralized staffing and maintenance functions and provide a modern, properly-equipped headquarters to operate from. The proposed facility is LEED certified to serve Lextran with energy efficiencies for the entire building lifecycle. The ground breaking for construction is anticipated in the latter part of The current cost estimate for the project is $23 million as reflected in the shortrange capital expenditures shown in Exhibit Bus Rapid Transit In January of 2014, Lextran completed a Transit Alternatives Analysis for the (U.S. 27) Nicholasville Rd corridor. After a study of existing conditions, forecasted demographics, future land uses and traffic patterns, it was recommended to pursue a Locally Preferred Alternative (LPA) of Mixed Traffic Bus Rapid Transit (BRT) connecting Nicholasville with downtown Lexington. This proposed version of Bus Rapid Transit envisions a limited amount of inbound and outbound stops with service running form a terminal park-and-ride location in Nicholasville to the downtown transit center in Lexington. The service would consist of nine new stations along the corridor and the existing transit center. The BRT line would operate with approximately one mile station spacing from 6 AM to 6 PM on a 20 minute weekday headways. Ridership estimates using the STOPS model predict 1,700 riders on an average weekday. When college students and special event trips are accounted for, the number is estimated to increase to 2,100 per weekday. Travel time savings for the service are 9.6 minutes for the inbound trip and 6.2 minutes for the outbound trip. The service would be branded differently in relation to the regular fixed-route buses to identify it as a special service including iconic stations and various amenities. The areas where the BRT stops are installed will present an opportunity for creative redevelopment, bike, pedestrian and transit-oriented design. Customized treatments along travel corridors will be implemented to allow the bus to mitigate traffic more efficiently during peak congestion. Three main elements of the chosen Locally Preferred Alternative are as follows: Business Access Transit Lane Where exclusive BRT lanes are not feasible, existing curbside lanes would be designated as a Business Access-Transit Lane, or a BAT Lane. This would take advantage of the curb lane that most through traffic typically avoids because of frequent right turn entrance activity. BAT Lanes are designated primarily through signage that restricts their use to only buses and vehicles making right turns. Transit Signal Priority Through the use of GPS technology, Transit Signal Priority (TSP) provides a time savings advantage to BRT buses with minimal impact on overall traffic flows. TSP allows buses to receive an early and/or additional green phase indicator at the traffic signal to improve on-time performance if the bus is running late. TSP involves equipping BRT vehicles with special emitters that send speed, M e t r o p o l i t a n T r a n s p o r t a t i o n P l a n Page 108

119 heading, and position information. If the vehicle is approaching while the signal is green, the controller provides for additional green time to get the vehicle through the intersection. Queue Jump Lanes These lanes take TSP a step further by providing a short stretch of exclusive lane as a BRT bus approaches an intersection. Queue jump lanes can be located at key intersections, allowing the BRT bus to receive a green signal while other vehicles remain at a stop at the same intersection, thus giving the bus priority in the queue. The Nicholasville Rd corridor is identified as a high capacity transit corridor in the LFUCG 2013 Comprehensive Plan. The LAMPO also identifies this as a corridor of importance with regard to moving people. Therefore, the BRT/BAT Lane concept is highly compatible and complimentary to the planning efforts within the corridor and the region M e t r o p o l i t a n T r a n s p o r t a t i o n P l a n Page 109

120 Other Transit Alternatives The chosen BRT/BAT Lane alternative in the Transit Alternatives Analysis Study was compared to many transit options that were studied and determined to not be feasible for reasons including cost effectiveness, constructability and operational support issues. Street cars, light rail and commuter rail were ruled out as they ranked poorly in the pre-screening phase of the study. Right-of-way and infrastructure costs coupled with many logistical challenges along the corridor eliminated the practical application of rail transit for the duration of this plan (2040). MAP-21 governs the process the Federal Transit Administration (FTA) uses to assess potential transit projects for funding. The funding process is becoming more competitive as more jurisdictions seek FTA funding on a national level for local transit projects. In judging the merit of transit projects, the FTA is not only sensitive to cost or operations, but also the impacts of transit projects on the surrounding communities. In the US 27 corridor bus options are more realistic in terms of their ability to provide improved service at a lower cost and with lower physical impacts than rail options. This is congruent with FTA guidance which favors BRT projects for their flexibility and relative low cost of entry. Integrating Transit with Land Use & Corridor Improvements The MPO will play a vital role in coordinating city-planning and Lextran efforts to better serve the Lexington-Fayette County region. Long-range goals for more transit-oriented regional centers and transportation corridors must be considered and implemented as new development and infill occurs Synergies between public investments in multimodal corridor improvements and private sector developments can provide mutual public/private benefits including reduced congestion, auto use and increased real estate values. The MPO should foster and facilitate network improvements to better accommodate planned developments, particularly in those areas that can or could accommodate additional mode-sharing opportunities such as corridors with relatively high transit ridership connecting employment and residential land uses. For example, the LFUCG 2013 Comprehensive Plan has identified Nicholasville Rd and South Limestone (U.S. 27) as a high capacity transit corridor to address congestion and enhance transit service. Fayette Mall before Transit Oriented Development Fayette Mall before Transit Oriented Development M e t r o p o l i t a n T r a n s p o r t a t i o n P l a n Page 110

121 Fayette Mall after Transit Oriented Development (excerpted from the Transit Alternatives Analysis Report) Furthermore, Jessamine County and the City of Nicholasville have invested in a U.S. 27 Access Management Plan which establishes agreements for preserving the integrity of the roadway corridor for future multimodal improvements, including future transit service, well as preserving the integrity of basic traffic operations as development continues. Current Transit Financial Plan Exhibit 4.16 presents LexTran s financial plan given current revenues and expenditure. The chart assumes no new services, expenditures or revenues for the purposes of forecasting the cost to continue the current service into the future. This financial information will be updated if and when additional service needs, costs, revenues and expenditures are identified. Transit Financial Plan: Summary of Short & Long Range Revenue & Expenditures (x $1,000) in YOE =4% Revenue Expenditures Funding Source FTA 5307 Local Tax Fares Total Operating Capital Total Short Range $22,557 $78,214 $10,998 $111,768 $120,329 $23,658 $143,986 Long Range $9,342 $32,391 $4,555 $46,288 $50,696 $9,342 $60, $ 24,184 $ 83,856 $ 11,791 $ 119,831 $ 133,546 $ 24,184 $ 157, $ 25,417 $ 88,133 $ 12,393 $ 125,943 $ 143,867 $ 25,417 $ 169, $ 26,714 $ 92,629 $ 13,025 $ 1132,367 $ 154,986 $ 26,714 $ 181, $ 28,077 $ 97,354 $ 13,689 $ 139,120 $ 166,964 $ 28,077 $ 195,040 Total $136,290 $ 472,577 $ 66,450 $ 675,316 $ 770,388 $ 137,391 $ 907, ,290 Note: LexTran s forecasted expenditures exceed anticipated revenue. However, additional funding will be pursued through various grant opportunities or necessary expenditure reductions will be made. Exhibit 4.16 Transit Financial Plan: Summary of Short and Long Range Revenue and Expenditures (x $1,000) in Year of Expenditure (YOE = 4%) M e t r o p o l i t a n T r a n s p o r t a t i o n P l a n Page 111

122 4.7 Operations, Maintenance & Management It is essential to preserve, protect and get the most out of our existing and future transportation infrastructure. The 2040 MTP proposes a 10% supplemental funding increase to support ongoing and expanded Operations, Maintenance and Management efforts to ensure our transportation system operates efficiently and is kept in a state of good repair. The funds are intended to help us maximize system efficiency through operational improvements including signal retiming, incident management and intelligent transportation systems. Funds will help implement demand management strategies to reduce and shorten vehicular trips in our region. The funding will help clear existing maintenance backlogs, allow agencies to readily address maintenance and safety hazards as they arise, and better address maintenance needs as our infrastructure continues to age. This supplemental maintenance and operations funding also helps account for new maintenance needs generated by any new infrastructure that is programmed within the MTP. Improvements that add more lane miles, sidewalks, bikeways and transit services come with future maintenance needs. Example Operations, Maintenance and Management projects include resurfacing roads, bridges and shared-use paths; systematic replacement of buses and traffic equipment; replacement and repair of traffic control devices; and repairing drainage and other structures. The MTP recommends 10% or $5,280,000 annually (in today s dollars) for these project/program types. These funds are supplemental to the existing operations and maintenance allocations and funding streams described in Chapter 3. The projects will be identified, prioritized and programmed through the MPO Planning Process and Transportation Improvement Program Operations Causes of congestion can often be addressed with operational strategies that directly target problem areas. Regional operational strategies geared toward optimizing system performance may include expanding regional Intelligent Transportation Systems including incident management, signal coordination and special even traffic management. These strategies improve mobility, access to information for travelers, reduce traveler delays, and enhance public safety and security M e t r o p o l i t a n T r a n s p o r t a t i o n P l a n Page 112
123 Intelligent Transportation Systems (ITS) Intelligent Transportation Systems (ITS) include electronics, communications, or information processing used singly or in combination to improve the efficiency and safety of transportation systems. ITS technologies enhance transportation system operations, especially during peak travel periods. ITS elements can include: Vehicle detection devices that report traffic counts, speed, and travel time; Video surveillance equipment that monitors roadways for congestion and incidents; Roadway sensors that monitor weather and road conditions; Communication services and facilities that transmit information; Traffic control centers that serve as central location for traffic management, communication, and collection and coordination of information; Variable message signs that display traffic information to motorists; Roadway service patrols that respond to incidents in a timely manner. ITS Architecture ITS programs work most effectively when integrated into an interconnected network or architecture. ITS Architecture is A regional framework for ensuring institutional agreement and technical integration for implementation of ITS projects. The FHWA requires that a regional ITS architecture include (at a minimum): Description of the region; Identification of the participating agencies and stakeholders; An operational concept that identifies roles and responsibilities of stakeholders; Any agreements required for operations; System functional requirements (high level); Interface requirements & information exchange with planned and existing systems; Identification of ITS standards supporting regional and national interoperability; Sequence of projects required for implementation ITS Architecture creates a common framework of interoperability at the national, regional or local level and helps ensure that ITS deployments: can be planned in a logical manner; integrate successfully with other systems; meet the desired performance levels; has the desired behavior; is easy to manage; is easy to maintain; is easy to extend; satisfies the expectations of the users M e t r o p o l i t a n T r a n s p o r t a t i o n P l a n Page 113

124 Bluegrass ITS Architecture A Technical Memorandum regarding opportunities for a Bluegrass Intelligent Transportation System (BITS) was developed in 2004 and outlined specific initiatives and technologies of local applicability in the areas of: Travel and Traffic Management Public Transportation Management Electronic Payment Commercial Vehicle Operations Emergency Management Advanced Vehicle Safety Systems Information Management Maintenance and Construction Management The Bluegrass ITS Architecture was the beginning of a regional framework for ensuring institutional agreement and technical integration in the implementation of ITS projects. It is federally required that a review and update of the ITS Architecture be conducted for the Lexington MPO and surrounding area in the near term to reflect changes in regional needs, new stakeholders, services, projects, priorities and other ITS elements. In fiscal year 2015, this responsibility will be shared by the MPO, the LFUCG Division of Traffic Engineering, the Kentucky Transportation Cabinet (KYTC) District-7 and the Lexington Transit Authority as they are key users of ITS in the MPO area. An ITS advisory/management group will be formed to assess existing ITS components, regional ITS opportunities and to guide the ITS Architecture update. Since ITS functions are very regional in nature, this update will be conducted as a supplement to the KYTC Statewide ITS architecture. In addition, the update will be conducted in close coordination with the Federal Highway Administration Kentucky Division s. It is envisioned that the projects and programs identified through this Statewide/Regional ITS initiative will be prioritized for investment in the coming years. These initiatives are eligible activities for the MTP 2040 Operations, Maintenance and Management funding category. ITS components and emphasis areas currently place in the MPO area include: Traffic Management Ongoing traffic signal system upgrades, including equipment and timing plans and other innovative high tech adaptive monitoring, detection and control systems. These are essential to maximize system efficiency and safety M e t r o p o l i t a n T r a n s p o r t a t i o n P l a n Page 114


125 LFUCG Traffic Management Center Lexington s Traffic Management Center (TMC) is the nerve center for helping the public have a safe and efficient journey to and from their homes and other destinations. The TMC allows traffic conditions to be monitored and for engineers to identify problem areas and to make signal adjustments in real-time. Real-Time Public Transit Information and Automatic Fare Collection Lextran has acquired and implemented technology that monitors buses in use with global positioning satellites (GPS). The technology allows Lextran to monitor performance and offer realtime information to passengers on the timing of bus service. Automatic fare collection and accounting systems have also been implemented to save time and money for both Lextran and their passengers. Traffic Incident Management Traffic incidents, such as crashes, stalled vehicles, traffic stops, roadway debris, construction and special events, are estimated to cause nearly 60 percent of the total delay experienced by motorists in the United States. Traffic congestion caused by these incidents affects the safety and mobility of all travelers. Traffic incident management works to reduce the effects of incident-related congestion by detecting incidents when they occur, reducing the time for responders to arrive, and decreasing the time required for traffic to return to normal conditions. Many public sector and private sector partners are involved in traffic incident management, but it is not a core function of any agency. The Lexington Area MPO transportation planning process has a Traffic Safety Coalition that meets regularly to discuss and coordinate incident management strategies. The 2040 MTP encourages jurisdictional and private sector partners to continue to enhance this program and improve coordination among the many entities involved, including first responders and police M e t r o p o l i t a n T r a n s p o r t a t i o n P l a n Page 115

126 4.7.2 Maintenance All elements of our transportation system require maintenance and the residents of our community want our system maintained in a state of good repair. This requires systematic, routine maintenance including sweeping streets, cleaning and repairing drains, and fixing traffic signals. It also requires significant investments in rehabilitating and repaving surfaces, replacing substandard bridges, reconfiguring and upgrading intersections. Unfortunately, regular and preventative maintenance can be deferred when funding is too limited which leads to a backlog of needs, safety hazards and higher long-term costs. Maintenance needs include: Complete Street Elements All components within the right of way are essentially complete street elements and include curb ramps, sidewalks, signs, signals, pavement markings, street trees and drainage structures among others. Many jurisdictions and agencies oversee the maintenance of various facilities within the right of way; even private property owners are responsible for certain elements such as sidewalks, street trees and curbs. Ultimately, local and state governments are responsible for enforcing these requirements and ensuring public facilities are kept in a state of good and safe repair. Good coordination is essential to effective maintenance practices and to realizing any cost savings and economies of scale that performing maintenance functions in sync can provide. For instance, there are financial and time-saving benefits to repairing drainage structures and realigning or repairing curb ramps when roads are resurfaced; however, budgeting and planning for these improvements are not always aligned. The Maintenance, Operations and Management funding category is intended to help make funding available for realizing these benefits. Thus, if a road is scheduled for resurfacing and other complete street elements are in need of repair, additional funds may be made available to address all maintenance needs in a holistic, cost-effective manner. Pavement Preservation By 2035, the KYTC has a goal of increasing the percentage of good and fair pavements to a target of 92%. The Lexington Area MPO area has adopted this target as described in and has allocated additional maintenance funds to ensure adequate resources area available to keep pavements in a state of good repair for reasons including safety and cost savings. Studies by the Texas Transportation Institute indicate that it costs less in the long run to have good roads than bad roads. Deferred maintenance drives up long-term cost and accelerates the need for complete roadway rehabilitation, which can be four times as costly. Deferred M e t r o p o l i t a n T r a n s p o r t a t i o n P l a n Page 116

127 rehabilitation also compounds the problem, often leading to pavement failure and the need to reconstruct the whole roadbed, at what could be 10 times the cost. As illustrated in the figure, for each $1 spent before pavement quality drops below fair condition later saves from $6 to $14 dollars in major rehabilitation work. While this example is for road pavement, it is applicable to nearly any public infrastructure or asset including transit fleet vehicles and shelters. Exhibit 4.17 Cost of Pavement Rehabilitation Over Time Source: National Pavement Preservation Transit Maintenance Maintaining the region s bus system is essential to provide safe and efficient service to thousands of daily riders and for attracting new ridership. Maintenance needs include regularly servicing vehicles and the systematic replacement of aging fleets as well as keeping transit stations, bus stop and shelters clean and in a state of good repair. The MTP 2040 Operations, Maintenance and Management funding category anticipates and accounts for funding that will be needed for ongoing maintenance and operations for existing and expanding transit services M e t r o p o l i t a n T r a n s p o r t a t i o n P l a n Page 117

128 4.7.3 Travel Demand Management Travel demand management (TDM) is a cost-effective way to reduce congestion and the need for new and wider roadways. TDM efforts aim to reduce the number and length of personal trips made in private automobiles, particularly during peak travel times. TDM can be accomplished by providing public transit, bicycle and pedestrian facilities and increasing their use; through better coordinated land use and transportation planning; and low-cost strategies aimed at travel behavior modification. TDM strategies may include: commuter services (public and private) employer services marketing campaigns vanpool services car-sharing services car-pool matching services parking management strategies telecommuting variable work schedules guaranteed ride home programs financial incentives land use/corridor plans transit-oriented development development incentives/requirements TDM services and programs available in the Lexington area have varied over time. Moving forward, the MPO should work to review and assess past and current programs and initiatives. The MPO should engage partner agencies and stakeholders, including the public, to develop strategies for improving existing programs and employing new TDM strategies that appeal to residents and workers in today s region. Focus areas may include: Vanpool & Carpool The vanpool program serving the Bluegrass Region was transferred to the Lexington Transit Authority in It currently has 8 vans in daily operation. At its peak, the program consisted of twenty, 15-passenger vans. Lextran is currently building additional capacity for the program and has contracted with a private vendor Rideshare by Enterprise to manage and expand the program. Carpool matching services will also provided by the vendor. The MPO should continue to coordinate and assist Lextran with marketing and support for vanpool and carpool programs, including monitoring the effectiveness of public information campaigns, and to assist with the program s continued success and growth M e t r o p o l i t a n T r a n s p o r t a t i o n P l a n Page 118

129 Mobility Coordination & Marketing The goal of mobility management is to improve transportation options and services and to make the traveling public aware of options available to them. The MPO currently provides these services through the Bluegrass Mobility Office. The Mobility Office works with transportation service providers to reduce confusion about what transportation options are available to the public by consolidating transportation information in one centralized location. In 2013, the Mobility Office collaborated with the Lexington Transit Authority (Lextran) and the Lexington Parking Authority (LexPark) to create a unified brand, website and marketing campaign titled Move it People. The campaign promotes a common website to the public and enables each agency to maximize their marketing dollars by combining resources. The Lexington Area MPO should continue to provide these marketing services through the Bluegrass Mobility Office (or other similarly branded office/campaign name). The MPO should also asses and identify local target areas, populations, employers, incentives and public service messages that present the greatest opportunity to change personal travel behaviors and determine methods to evaluate the effectiveness of these efforts. Planning, Land Use & Urban Design The demand for travel and how realistic and desirable our travel options are is directly related to land use patterns and the design of our public and private places, spaces and streets. The intensity and location of land uses influences travel patterns. Dispersed land development and disconnected street patterns tends to result in more vehicular travel. Rates of bicycling, walking and public transit are higher where land uses are more compact, mixed and connected. When schools, parks and shops are located close to homes, residents do not have to travel far for their daily needs. Walking and bicycling is more convenient and they are less likely to drive for every trip. Even when trips are made by vehicles, they are shorter, reducing the total amount of vehicular travel on the system. A primary purpose of urbanization and transportation systems is to facilitate the movement and exchange of goods, services, ideas and relationships among people. How a person will choose to travel is influenced by many factors including how much time they have, how long it will take them, how direct their route is, how safe their route is, and how desirable and interesting it is. Reducing automobile travel requires planners and designers to be strategic and mindful of these factors and to consider how the built environment will shape people s travel choices. People will not walk or bike if their route is indirect, lacks sidewalks and involves crossing multi-lane roads with fast moving traffic M e t r o p o l i t a n T r a n s p o r t a t i o n P l a n Page 119

130 Taking the bus can be equally frustrating if it takes twice as long as driving, if bus stops are located too far away and if there are no sidewalks leading to stops. The design of buildings, parks, plazas, open spaces and streets also impacts travel choice as does the relationship of buildings to the street. Closely-spaced buildings oriented toward the sidewalk increases the desirability of walking as do pedestrian-oriented store fronts, tree-line streets and active civic spaces. These not only increase walking, but they contribute to community character and livability. Thus, if we want to succeed in creating more desirable communities and ones where automobiles do not dictate our community form and character, we must be deliberate in our planning and design efforts. This requires tighter integration of land use and transportation planning. Many MPOs support planning initiatives and studies that will help local jurisdictions incorporate community design standards and guidelines into their planning processes. They may also target transportation investment in areas that are working to better integrate land use and transportation including neighborhood, pedestrian and transitoriented developments and corridors. The Lexington Area MPO should continue to support, lead and participate in these efforts in Fayette and Jessamine County. It is intended that funding allocated toward Operations, Maintenance and Management may be utilized for initiatives such as: Land use planning including small area plans and corridor plans Commercial and residential design standards/guidelines Street design standards/guidelines Transit-oriented and pedestrian-oriented design guidelines Street connectivity and access management standards M e t r o p o l i t a n T r a n s p o r t a t i o n P l a n Page 120

131 4.8 Bicycle & Pedestrian A major overarching goal of the 2040 MTP is to accelerate implementation of the MPO s Regional Bicycle & Pedestrian Master Plan (BPMP) that was adopted as an element of the 2035 MTP in The BPMP outlines a vision for bicycling and walking in our region that was formulated through public input. The plan describes community goals and objectives for bicycling and walking, existing bike and pedestrian facilities, and a list of proposed policies and improvement projects that are needed to create a more walkable and bike friendly community. The plan describes the role that bicycling and walking play in creating a more livable and sustainable region. It emphasizes the nexus between a healthy and active citizenry and investments in active transportation as an opportunity to decrease future healthcare costs and to produce social, economic and public health returns on these investments. The MPO s 2035 MTP summarized and reiterated the importance of four focus areas addressed in the Bicycle and Pedestrian Master Plan. Those initiatives, their current status and recommendations for continued progress include: Planning and Urban Design The BPMP recommended that development and design standards for more walkable and bike friendly neighborhoods be instituted. Since the adoption of the 2035 MTP, the Bicycle and Pedestrian Coordinator was made a permanent staff position in the Lexington Area MPO. The Coordinator serves on the LFUCG Technical (development) Committee, the Planning Commission s Subdivision Committee and regularly reviews and advises the planning staff and the Commission on new development and infill redevelopment to ensure projects include adequate bike, pedestrian and transit infrastructure. Significant progress was also made to develop Complete Street standards for new developments that relate roadway design to land use and improve the context-sensitivity of roadway corridors. A number of bicycle and pedestrian-related standards have also been incorporated into the zoning ordinance, particularly for mixed use, big box, infill and adaptive reuse developments. Moving forward, continued emphasis should be placed on incorporating bicycle & pedestrian-friendly elements into planning and zoning codes as discussed in the Travel Demand Management Planning, Land Use & Urban Design of the 2040 MTP (as well as the BPMP). Complete Streets The BPMP and 2035 MTP also called for developing a more balanced transportation system by refocusing transportation projects and planning efforts on creating Complete Streets that are designed with the needs of pedestrian, bicyclists, motorists and transit users in mind. A draft Complete Streets manual for Fayette County has since been developed to serve as a guide for all capital roadway projects, for new developments and redevelopments. The manual will ensure M e t r o p o l i t a n T r a n s p o r t a t i o n P l a n Page 121

132 developments and projects include connecting streets, context sensitive design, appropriate accommodations for bicycle and pedestrians, and pedestrian-friendly intersections that minimize the barrier effect that major roadways create for bicyclists and pedestrians. The MPO should seek formal adoption of the Complete Streets Manual by LFUCG (LFUCG funded the project) and should work with Jessamine County to incorporate complete street standards into their local codes, standards and regulations. The BPMP identified a network of major streets within the MPO area that are in need of Complete Street retrofits to make them more safe and desirable for bicycling and walking. These projects and needs were reviewed and have been incorporated into the 2040 MTP. As a result, 82% of the projects within the MTP contain specific improvements for bicycling, walking and public transit (excluding projects that do not allow for complete street design such as limited access highways). It is the intent of the 2040 MTP that the Bicycle & Pedestrian funding element be used to accomplish Complete Street retrofits along those streets that were noted as being deficient for bicycling and walking and are not currently slated for improvement as part of Multimodal Capacity or Corridor & Intersection Modernization within the MTP financial plan. Greenway Trails The BPMP emphasized the development of off-road greenway trails as a component of the bicycle and pedestrian transportation system. The plan identified priority north-south and east-west trails both within and between the two counties of the MPO. In Fayette County, the Legacy Trail and Veterans Park Trail (including the Bellefonte & West Hickman Trail) are the primary north-south connections. Significant sections of this trail corridor have been constructed over the past five years including Phase 1 & 2 of the Legacy Trail, several bikeways in the vicinity of downtown and the University of Kentucky, as well as trails in Veterans Park. The Town Branch Trail and the Brighton East Rail Trail are the primary east-west Fayette County connections and have also seen significant progress over the last five years including a detailed study of preferred Town Branch Trail alignments and construction of Phase 2. Brighton Rail Trail Phase 2 was also recently completed. Additional phases of both trails are currently funded and under development. In Jessamine County, a major north-south trail connection has been constructed along US 68 and a shared use trail has also been planned for construction along the US27 Eastern By-pass. A study to determine the feasibility and best course of action to improve bicycle and pedestrian safety along the east-west trail corridor in Jessamine County will be underway shortly. The project will determine the best alignment for connecting 90% of Jessamine County schools and will provide safe active transportation options for many of the neighborhoods along the corridor. It is the intent of the 2040 MTP that funds within the Bicycle & Pedestrian financial plan be available for completing off-road trails, including bike/walk connections to schools in Fayette and Jessamine County M e t r o p o l i t a n T r a n s p o r t a t i o n P l a n Page 122

133 Although we have made significant progress on our regional off-road greenway trails, our trail system is still incomplete and in need of full build out. The MPO s commitment to apply resources toward trail projects and programs is essential. The BPMP prioritized trail projects identified in the Fayette County Greenway Master Plan and encouraged further development and prioritization of trails per a Jessamine County Greenway Plan. The plan also proposes that a future system of rural bike routes and regional trails be developed in coordination with surrounding counties. Funding, Implementation & Evaluation The MTP recommends 8% or $4,224,000 annually (in today s dollars) for Bicycle & Pedestrian projects & programs. The projects will be identified, prioritized and programmed through the MPO Planning Process and Transportation Improvement Program per the Bicycle & Pedestrian Master Plan, LFUCG Greenway Master Plan, special studies and/or the MPO s Bicycle & Pedestrian Advisory Committee. Example projects include sidewalks, bike lanes, shared use paths (trails), intersection & crossing improvements, education, marketing and outreach. Funding and resources may also be used to facilitate project implementation (special studies) and for monitoring and evaluating safety and the effectiveness of bicycle & pedestrian projects or programs. For instance, while the US Decennial Census and American Community Survey provide some data on work-related bicycle and pedestrian trips, trip data for all other purposes is unknown. While this information is useful, it does not account for a significant number of trips for other purposes including for school, exercise, social, shopping and general errands. It is recommended that the MPO work to collect more usage data. Methods may include scheduled counts, smart phone and other GPS technologies, and traffic signal actuation counts. The counts will provide information that can be used to generate more accurate data including collision rates, as opposed to monitoring only the number of collisions. GPS data can also provide insight on the routes people currently take for bicycle and pedestrian trips. This data can be used to determine the best approach to completing the gaps in the bicycle and pedestrian network. They will also provide another means for prioritizing projects listed in the BPMP. A set of performance measures, including bicycling and walking usage and collision rates, are further outlined in Plan Evaluation of 2040 MTP. Additional performance measures are listed in the BPMP. These are intended to evaluate the impacts of the MPO s investments in bicycling and walking over time. The BPMP appeals to our partners and to the public for their help in implementing, evaluating and improving upon our regional plans for bicycling and walking. The BPMP also calls for citizenbased groups in each county to provide oversight. The MPO s BPAC and TPC should continue to help to provide this oversight M e t r o p o l i t a n T r a n s p o r t a t i o n P l a n Page 123
134 4.9 Safety & Security In response federal regulations and local emphasis and, safety and security are interwoven into the Lexington Area MPO transportation planning process. Safety and security considerations are incorporated into any project, program or initiative outlined within the MTP and other relevant documents and policies. This includes any project funded through the MPO which performs maintenance activities and/or improves capacity, operations, transit, bicycle or pedestrian facilities. The MTP recommends that the MPO continue to participate in a number of regular committees, task forces and project development committees to enable the MPO to achieve these safety and security goals/strategies: Develop short and long-term strategies that can enhance the safety for all users of the transportation system; Continuously gather public and stakeholder input on safety and security concerns and communicate this information through the transportation planning process in order to achieve solutions; Create policies and design practices that are consistent with safety and security goals and develop tools that allow stakeholders to examine safety data and establish priorities; Utilize information systems and databases for compiling and analyzing crash data; Involvement in the regional incident management plans, coordination and training; Publicize the benefits of safety, and educate decision-makers and the public through ongoing marketing, education and outreach efforts; Apply for relevant safety funding. Safety MPO projects, programs and processes must be consistent with and work to achieve the mission, vision and goals of the Kentucky Transportation Cabinet s Strategic Highway Safety Plan (SHSP) entitled Toward ZERO Deaths. To this end, the MPO staff evaluates the area s collisions utilizing the state s Highway Performance Monitoring System (HPMS) and collision/crash databases. The MPO also reviews monthly collision data for Fayette County that is provided by the LFUCG Division of Police and incorporates this information into the transportation planning process. Focus areas of the analyses include: Between Street Collisions Intersection Collisions Red Light Running Collisions Pedestrian Collisions Bicycle Collisions The MPO staff also frequently assesses safety-related data and information using Geographic Information Systems (GIS) which are visualization tools that can illustrate problem areas. Examples M e t r o p o l i t a n T r a n s p o r t a t i o n P l a n Page 124
135 include overlaying and analyzing bicycle and pedestrian crash data as it relates to roadway characteristics such as the presence of a sidewalk or bikeway. The MPO also seeks to improve safety through utilizing Complete Street design principles for projects that will be implemented through the MTP. Complete street design principles seek to minimize high speeds and speed differentials which are known to significantly contribute to poor transportation safety for all travel modes. Complete street design means vehicular speeds are appropriate for the surrounding area and maximize the safety of all road users including drivers, pedestrians and bicyclists. Complete Street design means target speeds dictate design speeds which influence the geometric features of a roadways, primarily horizontal curvature, vertical curvature, super elevation, lane widths and sight distance. Other design strategies to encourage appropriate driver speeds include: Setting an appropriate and realistic speed limit; Using physical measures such as curb extensions and medians to narrow the traveled way; Setting signal timing for slow to moderate progressive speeds between intersections; Using narrower travel lanes that cause motorists to naturally slow; and Using design elements such as on street parking or street trees to create side friction. Security Transportation security deals with emergency events such as natural disasters, terrorist attacks or other incidents caused by criminal activity that can significantly impact our transportation system. Such events often require a coordinated response from multiple stakeholders. The Lexington Area MPO Transportation Planning process facilitates coordination with the area s public safety agencies that deal directly with these issues and concerns. This is accomplished through several committees and groups that include: Transportation Safety Coalition (TSC) Bicycle Pedestrian Advisory Committee (BPAC) Blue Grass Area Development District Regional Transportation Advisory Committee Transportation Technical Coordinating Committee (TTCC) KYTC District 7/MPO Project Coordinating Committee Statewide Transportation Planning (STP) - coordination with the state works to influence projects that increase safety in the biennial Kentucky Recommended Highway Plan One objective of the MPO is to help ensure cooperation and coordination among agencies that are involved in incident management and responding to emergency situations. In the event of a major hazard, measures may be taken to ensure an area or site is safe and secure and may necessitate roadway closures. Opening closed highways or lanes as soon as possible is desirable. In some events, evacuations may be necessary. Police, Fire, and Emergency Management agencies maintain M e t r o p o l i t a n T r a n s p o r t a t i o n P l a n Page 125
136 current evacuation and disaster preparedness plans. The link to LFUCG s Division of Emergency Management is Another objective of the MPO is to ensure that the transportation system is capable of handling a response to an emergency. This can be achieved by assessing the transportation system and ensuring that, in the case of highway closures, there is redundancy in the system meaning there is good connectivity and parallel alternative routes. Providing sufficient emergency personnel and good access for emergency equipment along transportation corridors is also important when time is of the essence to those in distress and those who wish to continue on to their destinations. Utilizing existing and future planned ITS systems and other measures can help aid in accessing and clearing emergency incidents and can also effective for handling evacuations. In 2008, the Lexington Area MPO and the FHWA conducted a security self-assessment to comply with FHWA s National Performance Measure regarding implementation of security as a separate planning element in the MPO work plan. The findings, recommendations, and comments have all since been implemented. The following are continued security objectives and actions recommended by the 2040 MTP: Continue to ensure cooperation and coordination among all agencies in incident management and emergency situations. Continue to engage emergency and law enforcement personnel in transportation planning. Continue assessments to ensure that the transportation system is capable of handling a response to an emergency. Continue to coordinate the Transportation Safety Coalition Committee which includes members of KYTC, LFUCG DEM (Division of Emergency Management), local governmental officials, law enforcement, emergency personnel and wrecker services. Conduct an updated security self-assessment to determine new security needs as they relate to the transportation planning process M e t r o p o l i t a n T r a n s p o r t a t i o n P l a n Page 126


137 4.10 Freight Freight concerns largely relate to mobility and access. Mobility for freight means smooth and reliable traffic flow conditions on the region s state and federally-designated truck network which includes interstates, freeways, major regional and principal arterials, and at-grade railroad freight crossings. Exhibit 4.18 Kentucky Designated National Truck Network Accessibility pertains to the freight vehicle operator s ability to locate, navigate to, and reach the intended destination within the truck network to deliver and/or pick up freight. Access issues include road geometrics, bridge clearances, weight restrictions and severe bottlenecks between regional roadways, manufacturers and freight facilities located in Fayette and Jessamine Counties. The roadway improvement projects identified with the 2040 MTP will benefit the movement of freight. In the project scoring and selection process, projects that will positively impact freight corridors as well as locations where freight originates and arrives in substantial amounts, were given additional weight. Lexington s Travel Demand Model also accounts for and evaluates truck trip generation rates. These rates were adapted from the Quick Response Freight Manual II. The LAMPO model forecasts truck traffic for two types of heavy trucks: Single units (which contain FHWA vehicle classes 4-7) and combinations (which contain FHWA vehicle classes 5-13). The majority of freight movement in the LAMPO region occurs on the highways. In order to meet regional goals for economic activity and freight movements, the Lexington Area MPO identified the following focus areas needed for successful freight transportation. Coordinate Freight Issues Freight providers tend to be very knowledgeable about bottlenecks in the system that can hinder truck and other vehicle movements. In addition, they may be aware of signal timing, signage or geometric (e.g., turning radii) deficiencies in the system. With their involvement, the MPO can develop a detailed list of improvement needs and incorporate them into project designs and operational/maintenance/management initiatives for improvement. While long-range freight planning is necessary, short-term results are also important in engaging and maintaining interest from freight providers M e t r o p o l i t a n T r a n s p o r t a t i o n P l a n Page 127

138 The MPO will work with freight transportation companies operating in the region to identify specific deficiencies in the transportation system that hinders freight movements and to incorporate design elements for large trucks in roadway planning and design. In addition, coordination with KYTC on freight issues could provide increased information regarding freight flows and improvement needs. It may be desirable to establish a freight task force for this purpose. Land Use Considerations To the extent possible, heavy truck traffic should be separated from light vehicle traffic and sensitive land uses (e.g., neighborhoods, schools, parks, etc.). Industrial land uses should be isolated from residential and commercial areas. The MPO actively engages with the LFUCG Long Range Planning Section and Comprehensive Plan update process to make every effort to ensure freight issues are considered in land use decision-making. Roadway Design and Access Management Due to their large size, trucks and buses have special needs for moving through the transportation system. Roadway and access requirements for these vehicles should be considered in the design of intersections and interchanges. Roads in and around industrial areas should be designed specifically for the movement of large trucks. The MPO must continue to work with local and state engineering departments to ensure freight considerations are included in design standards. Designate Truck Routes Truck routes provide freight haulers with a network of the most efficient and least impacting locations for traveling through Fayette and Jessamine County. Designated truck routes can have a positive influence on traffic safety if properly planned, implemented and enforced. Hazardous materials traffic should be carefully considered and routed accordingly. These designated routes will be updated periodically, especially as land use changes and roadway improvements occur. Develop a Freight Model Although the Lexington Area MPO has a Travel Demand Model, some components of freight movement are not included in the model. The MPO should look into possible enhancements to the model to better account for freight. Capabilities for doing so may be dependent upon available data for the Lexington Area MPO s region. Commodity Survey and Freight Study Since the last study is out of date, the Lexington Area MPO needs to review whether a commodity and freight study should be conducted for the two-county area M e t r o p o l i t a n T r a n s p o r t a t i o n P l a n Page 128
139 4.11 Environment The 2040 MTP supports an improved environment for the Lexington area in several ways. The Plan promotes projects that modernize transportation infrastructure and programs that reduce emissions, including those that were identified in the Empower Lexington Plan. These initiatives cover a broad array of strategies to reduce emissions: Develop bike and pedestrian programs and infrastructure; Increase transit service and coverage; Promote ridesharing; Develop an eco-driving program; Pursue energy efficient highway and congestion relief strategies; Encourage low carbon and alternative fuels; Promote energy efficient vehicles; Pursue smart streetlights. Examples of initiatives addressed within the MTP include adding more bike and pedestrian facilities to encourage non-motorized travel, purchase of clean fuel buses and fleets, intelligent transportation operations systems for our highways, and transportation demand management programs to reduce congestion and delays. In addition, the Plan supports continued efforts to promote energy efficient planning. The MTP emphasizes strategies to achieve long-range goals for transit oriented development, infill and redevelopment and the livability principles (more choices, supporting existing communities, and valuing neighborhoods). These efforts will not only reduce pollution in the area but also promote a more active population where walking, biking and transit-riding are seen as true alternatives to vehicle travel. The Plan also supports continued monitoring of air quality in the area. As noted in Chapter 2, MPO staff will use an ozone forecasting tool to monitor conditions through the summer and alert the community when conditions could be averse to citizen s health. The Lexington area is currently meeting air quality standards and has been designated attainment. However, air quality monitor readings indicate pollution levels are near national standards. The MPO will continue to monitor air quality issues and pursue policies and programs that have positive impacts to the region s air. As a former non-attainment area, Lexington is eligible for funding specifically earmarked for pollution reduction and the MPO is committed to take advantage of these funds M e t r o p o l i t a n T r a n s p o r t a t i o n P l a n Page 129
140 4.12 Plan Evaluation This section describes how the MPO evaluated our current transportation system and how investment strategies outlined within the 2040 MTP may impact our community. This includes an assessment of congestion levels and how they may change if the MTP is implemented. We also describe how the MPO will establish performance measures and targets to assess system performance moving forward and how we plan to continually gather community and stakeholder input on the effectiveness of our plans and projects. A Fiscal Constraint Analysis is also provided to show how revenues and expenditures will be balanced. Fiscal Constraint Analysis Long-range transportation plans developed by MPOs are required to be fiscally constrained, meaning we can only include projects that we can reasonably expect to fund. This means limiting planned spending on capital projects, operating and maintenance programs based on anticipated revenues from local, state and federal sources including the FHWA and FTA. The follow Exhibit 4.19 summarize the Lexington Area MPO s estimated revenues balanced against planned expenses which are categorized by project type and program. MTP Fiscal Constraint Summary in Year of Expenditure Dollars (YOE = 4%) Improvement Type Time Frame Period Funding Source Short Range Highway Construction (continuation of existing projects i.e. completion of TIP and KY State Highway Plan Projects) Long Range Highway Construction (new Multimodal Capacity projects and Intersection & Corridor Modernization projects) Operations, Maintenance & Management (new projects/programs) Transit Expansion (new projects/ programs) Bicycle & Pedestrian (new projects/programs) Transit Operations and Capital* (continuation of existing programs) Highway Operations and Maintenance (continuation of existing programs) Exhibit 4.19 MTP Fiscal Constraint Summary in Year of Expenditure Dollars Revenue Expenditures Ratio Short Range FHWA $269,081,000 $269,081, Long Range FHWA $1,374,530,000 $1,375,578, Long Range FHWA $221,700,000 $221,700, Long Range FHWA $443,390,000 $443,390, Long Range FHWA $177,370,000 $177,370, Short & Long Range Short & Long Range FTA $675,316,000 $907,779, FHWA, State, Local $418,418,000 $418,418, Total $3,579,805,000 $3,813,316, M e t r o p o l i t a n T r a n s p o r t a t i o n P l a n Page 130
141 Travel Demand Forecasting Model The Travel Demand Model (TDM) was used to forecast the travel and congestion impacts that growth in the Lexington MPO area may generate by the year 2040 if no new transportation improvements are undertaken. This is called the No-Build analysis. Not surprisingly network-wide congestion, vehicle hours of travel (VHT) and vehicle miles of travel (VMT) under a No-Build scenario are expected to increase rather significantly by 2040 (see discussion in Chapter 2). Exhibit 4.20 below compares the network-wide VMT and VHT in the year 2040 if no new roadway projects are completed beyond those that are committed and underway as part of the short-range financial plan (TIP and STIP projects). This No Build scenario shows what our future may look like in 2040 if we do not implement the MTP. It is important to note that the model only measures vehicular travel patterns and roadway congestion resulting from population growth, employment growth and added roadway capacity (adding lanes, new roads, etc). The model does not account for any reductions in congestion, VMT or VHT as a result of operational improvements, mode shifts to transit, bicycling, walking, carpooling or telecommuting. Thus, in addition to calculating expected VMT and VHT reductions from MTP capacity projects between the No Build and Build Scenario, the MPO also assumed an overall 10% reduction in localized vehicular trips as a result of mode shifts and operational improvements under the Build scenario. The MPO felt this was a reasonable assumption given observed trends in increased telecommuting, transit use and bicycling as well as the potential to further reduced vehicular travel and delay via operational improvements, improved multimodal facilities and services. Vehicle Miles of Travel on MPO Roadway Network Time Period 2040 "No Build" 2040 "Build" % Change in VMT (Build vs No Build) AM 2,031,435 1,879, MD 3,854,960 3,582, PM 2,778,202 2,591, NT 3,139,396 2,919, Daily 11,803,993 10,973, Vehicle Hours of Travel on MPO Roadway Network Time Period 2040 "No Build" 2040 "Build" % Change in VHT (Build vs No Build) AM 52,674 46, MD 98,047 87, PM 75,134 65, NT 78,535 70, Daily 304, , Exhibit 4.20 Vehicle Miles of Travel & Vehicle Hours of Travel on the MPO Road Network in 2040 Under Build vs No Build Scenario Source: Lexington Area MPO Travel Demand Model M e t r o p o l i t a n T r a n s p o r t a t i o n P l a n Page 131
142 Exhibit 4.21 shows what vehicle congestion levels would look like on the existing street network in 2040 if no other transportation projects are undertaken (beyond committed projects) compared to congestion levels if the long-range 2040 MTP projects are implemented. Exhibit 4.21 Forecasted Congestion Levels on Major Roadways in 2040 Under Build and No build Scenario Source: Lexington Area MPO Travel Demand Forecasting Model M e t r o p o l i t a n T r a n s p o r t a t i o n P l a n Page 132
143 Performance Measures It is important for transportation plans and investments to be based on goals and desired outcomes that can also be supported by measurable data. Establishing performance-based criteria helps us measure the progress we ve made toward reaching our community goals and can help us track whether our actions have led to the results we intended. Historical trend data for the Lexington area was outlined in Chapter 2 and serves as a baseline that can be used for performance tracking as we move forward. These indicators will also help inform our Congestion Management Process MTP Goal 2040 MTP Performance Measure Desired Trend Target* Safety Access/Choices Number of fatalities Number of injuries Collision rates (vehicles, bike, pedestrian, transit) Critical Crash Rates Population within 1/2 mile transit Transit ridership Paratransit efficiency Vanpool ridership Down Down Down Down Up Up Up Up Connectivity Sidewalk & bikeway mileage Up Efficiency/ Reliability/ Maintenance Economic Vitality Community Character / Environment Travel Time Index Vehicle Hours Travel Volume to Capacity Ratio Transit on-time performance Road/bridge condition Average commute time Combined housing & transportation cost Regional commute time Bike/ped/transit/carpool mode share Vehicle Miles of Travel (VMT/capita) Number of alternative fuel vehicles Down Down Down Up Up Down Down Down Up Down Up Health and Wellness Ozone level / air quality violation Obesity rate Physical activity rate Down Down Up * Targets will be set in coordination with FHWA, KYTC and Lextran. Exhibit 4.22 MTP 2040 Performance Measures for the Lexington Area MPO M e t r o p o l i t a n T r a n s p o r t a t i o n P l a n Page 133
144 In addition to the performance measures described above, the U.S. Secretary of Transportation, in consultation with States and MPOs, will establish national performance measures for the areas in Exhibit 4.23 below in the near future as a result of MAP-21. States, in coordination with MPOs, will then set performance targets in support of those measures, and state and metropolitan plans will describe how programs and project selection will help achieve the targets. Performance management will lead to more efficient investment of transportation funds by focusing on national goals, increasing accountability and transparency, and improving decision making, particularly in the goal areas below that were established by the federal legislation. MAP-21 Goal Area National Performance Goal Safety To achieve a significant reduction in traffic fatalities and serious injuries on all public roads Infrastructure condition To maintain the highway infrastructure asset system in a state of good repair Congestion reduction To achieve a significant reduction in congestion on the National Highway System System reliability To improve the efficiency of the surface transportation system Freight movement and economic vitality To improve the national freight network, strengthen the ability of rural communities to access national and international trade markets, and support regional economic development Environmental sustainability To enhance the performance of the transportation system while protecting and enhancing the natural environment Reduced project delivery delays To reduce project costs, promote jobs and the economy, and expedite the movement of people and goods by accelerating project completion through eliminating delays in the project development and delivery process, including reducing regulatory burdens and improving agencies work practices Exhibit 4.23 MAP-21 National Performance Goals Coordination/Consultation The MPO will continue to consult with transportation professionals, elected officials and the public to monitor any shifts in regional priorities and public attitudes towards transportation projects and programs. This may include periodic transportation surveys to gather information on travel preferences, facility and program needs, and to determine whether the public feels that the transportation system and related improvements are meeting their needs. Additionally, stakeholder agencies and the public will be consulted during project development phases to ensure that environmental, cultural, historic and other community resources are considered when projects and programs are implemented M e t r o p o l i t a n T r a n s p o r t a t i o n P l a n Page 134
145 4.13 Implementation Inclusion of a project or program in the 2040 MTP means that it has been identified as a regional priority for funding and is part of the MTP s financial plan. The Lexington Area Transportation Improvement Program (TIP) and Statewide Transportation Improvement Program (STIP) are the official mechanisms through which projects in the MTP are implemented. The TIP and STIP are near term (4 year) programs of scheduled transportation improvements. Projects that are included in the TIP/STIP are drawn from the highest priority transportation projects in the near term of the 2040 MTP. Projects in the TIP/STIP must be included the MTP and must help implement the goals of the long-range MTP. Lexington Area MPO Transportation Improvement Program The TIP is a phased, multi-year schedule for obligating federal funds to projects in the Lexington area. The MPO formally requests and obligates Federal aid Highway Program funds from the Commonwealth of Kentucky and from the Federal Transit Administration through the TIP. The TIP must also include all regionally significant, non federally funded projects. Like the MTP, the TIP must be fiscally constrained. The TIP helps the MPO and the public track local, state and federal transportation funds and projects. The TIP is not as much a construction timeline as it is a financial program for scheduling and obligating federal funds; it represents the intent to construct or implement a specific project and the anticipated flow of federal funds and matching state or local contributions. While estimated implementation dates are given for projects in the plan, it should be noted that both project development and the TIP are dynamic in that it has the flexibility to be amended and modified as programs and projects are implemented. A major update to the TIP occurs at least every four years. Kentucky Statewide Transportation Improvement Program Many of the transportation projects and programs listed within the MTP will utilize funding that is ultimately programmed within the State Transportation Improvement Program (STIP) which is a 4- year subset of the 6-year Kentucky Highway Plan. The Highway Plan is developed by the KY Transportation Cabinet and adopted by the KY State Legislature every two years. Local priorities established by MPO s within their MTPs are considered by the Transportation Cabinet and Kentucky Legislature in developing the Highway Plan; however, concurrence with the MTP and local priorities is not guaranteed. Thus, it is incumbent upon the MPO to coordinate with the KY Transportation Cabinet and to make our local Legislative Representatives aware of local priorities and the merits of local projects and programs M e t r o p o l i t a n T r a n s p o r t a t i o n P l a n Page 135
146 .
147 Appendix A TPC Resolution Approving 2040 MTP M e t r o p o l i t a n T r a n s p o r t a t i o n P l a n Page 137
148 Appendix B Grouped Projects Projects types listed in the Grouped Projects table below may be added by an Administrative Modification to the MTP. Grouped Projects * HSIP - High Cost Safety Improvements HSIP - Low Cost Safety Improvements HSIP - Lane Departure Resurfacing Improvements HSIP - Lane Departure Roadway Section Improvements HSIP - Drive Smart Safety Corridors HSIP - Older Driver HSIP - High Risk Rural Roads Median Guardrail/Cable Projects Rail Crossing Protection Rail Crossing Separation Intersection Improvements for Safety or Efficiency Other Highway Safety Improvements Intelligent Transportation System (ITS) Projects Traffic Signal System Improvements Highway Signing Pavement Resurfacing, Restoration, and Rehabilitation Pavement Markers and Striping Bridge Replacement Bridge Rehabilitation Bridge Inspection Bridge Painting Scenic Byways Transportation Alternatives Program (TAP) Transportation, Community, and System Preservation (TCSP) Congestion Mitigation Air Quality (CMAQ) Projects Recreational Trails Program Commuter Ridesharing Programs Bicycle and Pedestrian Facilities Park & Ride Facilities Ferry Boat Capital and Operating Assistance Purchase of New Buses (to replace existing vehicles or for minor expansion) Rehabilitation of Transit Vehicles Transit Operating Assistance Transit Operating Equipment Transit Passenger Shelters and Information Kiosks Construction or Renovation of Transit Facilities FTA Section 5317 New Freedom Initiative M e t r o p o l i t a n T r a n s p o r t a t i o n P l a n Page 138
149 Appendix C Participation MTP 2040 Participation Activities 4/23/2014 TPC Plan Approval (public/televised meeting) 4/23/2014 Present summary of public comments to TPC 4/12/2014 Public Comment period closes 3/27/2014 Public meeting in Jessamine County 3/25/2014 Public meeting in Fayette County 3/19/2014 to database of 550 Survey Respondents regarding public comment period and public meetings 3/18/2014 Press Release; Social Media; Outreach to Elected Officials regarding public comment period and public meetings 3/17/2014 Notification to all Consultation Contacts (see PP) and Representatives of Underserved Populations sent regarding MTP 2040 Public Comment Period 3/13/2014 Legal ad in Jessamine Journal and Herald Leader for 30 day public comment period and public meetings 2/26/2014 Presentation of financial plan and funding scenario to TPC (public/televised meeting) 2/19/2014 Presentation of financial plan and funding scenario to TTTC 1/26/2014 Present results to TPC (public meeting) 12/17/2013 soliciting input on transportation issues sent to consultation contacts (see PP) 10/1/2013 Closed survey 9/20/2013 English & Spanish survey distributed at Festival Latino booth 9/13/2013 Reposted to city website homepage and Facebook page 9/12/2013 Began paid Facebook Ad campaign targeting Fayette and Jessamine residents 9/12/2013 Large print version of survey distributed by Bluegrass Council of the Blind 9/12/2013 to Jessamine Co public officials seeking help with distribution 9/12/2013 Redistribution of survey via Facebook & neighborhood associations 9/12/2013 Spanish hardcopies delivered to Lexington Village Library Branch 9/10 & Survey distributed at Fayette County Comprehensive Plan public vmeetings 9/12/2013 9/9/2013 WKYT 27 interview regarding survey 9/9/2013 Sent letter and survey promotional flyers to MPO mailing list of 100 stakeholders related to underserved populations 9/5/2013 Paid ad for survey ran in Jessamine Journal 9/3/2013 Spanish survey distributed to LFUCG CM Henson, Friends of Versailles Rd and La Voz requesting help targeting Spanish-speaking populations 8/28/2013 TPC presentation of Local Conditions & Trends in Transportation (public/televised meeting) 8/27/2013 Contacted Jessamine Journal requesting coverage of survey 8/22/2013 Press release regarding MTP 2040 and survey distributed to media contacts (see Particpation Plan) 8/20/2013 Survey distributed to Jessamine Co library and other locations per Nancy Stone 8/19/2013 Survey distributed to all Fayette County libraries 8/16/2013 Survey link sent to all Fayette County neighborhood association contacts 8/12/2013 Survey posted to LFUCG home page 8/8/2013 Survey distributed to all MPO committees 8/8/2013 Survey distributed to all LFUCG Council Members and asked to distribute via social media and networks 8/5/2013 Survey posted to Facebook; outreach to encourage Sharing to networks 7/1/2014 Goals and Objectives distributed to all MPO committees 6/26/2013 TPC presentation of National Trends in Transportation (public meeting) 6/26/2013 TPC presentation of draft Goals & Objectives (public meeting) M e t r o p o l i t a n T r a n s p o r t a t i o n P l a n Page 139

150 Appendix C Participation (cont d) MTP 2040 Legal Ad M e t r o p o l i t a n T r a n s p o r t a t i o n P l a n Page 140
151 Appendix C Participation (cont d) Summary of Public Comments on 2040 MTP Summary of Written Comments Two comments indicated need for regional public transportation between smaller cities (e.g. Nicholasville, Georgetown, Versailles, and Midway) including bus, light rail and park and ride facilities. One comment in favor of expenditures to maintain roads and improve safety and traffic flow. One comment expressed need for safe bicycle/pedestrian paths in Jessamine County. One comment expressed the potential for increasing bike to bus use and connectivity; the need to allow bikes on trolleys; free bus passes during bike month and public transit month. One comment expressed concern with improving safety of county roads (e.g. Mackey Pike, Bethany Road). Two comments expressed concern with Bethany/169 intersection. One comment in favor of Brannon Rd Extension. Two comments in favor of construction the I-75 Connector for economic development, connectivity, etc. MPO Staff Response Regional transit is a recommendation of the MTP and placeholders for additional funds to support transit expansions are included pending additional study. The MTP provides additional funding for such activities. Additional funding for bike/ped facilities are specified in the long-range financial plan. Additional funding for transit initiatives are specified in the long-range financial plan. Federal funds are not typically used on county roads. However, some improvements, including intersections with roads such as 169, may be appropriate. Additional funding for safety and operational improvements are included in the MTP. This project is included. A placeholder for funding is included in the long range plan pending conclusion of feasibility/environmental study. Eight comments voicing non-support of I-75 Connector; Various concerns were expressed including project cost, need, financing, environmental impacts, etc. Note: Full text of written comments is available upon request A placeholder for funding is included in the long range plan pending conclusion of feasibility/environmental study. The plan may be amended at a later date to remove the project if desired once the study is complete M e t r o p o l i t a n T r a n s p o r t a t i o n P l a n Page 141

152 Appendix C Participation (cont d) Transportation Survey Results M e t r o p o l i t a n T r a n s p o r t a t i o n P l a n Page 142

153 M e t r o p o l i t a n T r a n s p o r t a t i o n P l a n Page 143
154 M e t r o p o l i t a n T r a n s p o r t a t i o n P l a n Page 144


155 M e t r o p o l i t a n T r a n s p o r t a t i o n P l a n Page 145


156 M e t r o p o l i t a n T r a n s p o r t a t i o n P l a n Page 146

157 M e t r o p o l i t a n T r a n s p o r t a t i o n P l a n Page 147
158 M e t r o p o l i t a n T r a n s p o r t a t i o n P l a n Page 148
159 M e t r o p o l i t a n T r a n s p o r t a t i o n P l a n Page 149
160 Appendix D Project Scoring Process Background To assist in the selection of worthy transportation projects, staff has developed a scoring process and used it to prioritize projects. It is based on the 2040 Plan Goals and Objectives and procedures developed for the 2035 MTP. Staff also looked at scoring processes by other MPOs and modified the criteria for local needs. This methodology provides a systematic approach to scoring many projects which will need to be evaluated while developing a financially constrained regional transportation plan. The numeric ranking for each project determines the staff s recommendation of a relative comparison with other projects. It is meant to provide information to decision makers for a final recommended list of projects in the 2040 Plan. The Scoring Process The process uses criteria based on goals and objectives of the Plan. The first eight are factors that apply to all projects and are directly aligned with the plan s goals. The final criterion was developed specifically to address project history and feasibility. It is anticipated that most projects will incorporate multimodal improvements that address the concept of complete streets. All users (highway, transit, bike, and pedestrian) should be accommodated as much as practical on all projects. All criteria are awarded points on a sliding scale as indicated or with a point for meeting the criteria. Projects Criterion 100 Points Possible Safety (8 possible points) Staff used available critical crash rate factors (CCRF) to assign points for the safety criterion. The CCRF is a measure of a facilities crash history compared to a statewide crash history for a similar facility. Any CCRF greater than 1 indicates that the crash rate is above an average and is potential area of concern. A CCRF of 3 or greater was awarded the maximum point value 3 points. Point values were reduced as the CCRF drops below 3 until a score of 1 was given for any facility with a CCRF below 1. If a project extended over several segments with different crash rates, the highest value was used for scoring. New facilities were scored based on existing routes the project is designed to alleviate. A second issue is whether a project addresses a bike or pedestrian safety issue. Bicycle riders and pedestrians are more vulnerable in vehicle crashes so additional points (2) were awarded if a project improves conditions for these road users. Points were also added if the project specifically includes safety improvement strategies for highway, bike/pedestrian, and traffic calming/signage/signal upgrades M e t r o p o l i t a n T r a n s p o r t a t i o n P l a n Page 150
161 Access / Choices (12 possible points) Communities with transportation choices and easy access for all users have an enhanced quality of life. It is important to emphasize more than the traditional highway mode. Therefore, projects that improve transit service got points based on the amount and quality of the transit improvement on a scale from 0 to 4 points. Similarly, bike and pedestrian improvements were scored on the same scale. Any project that enhances access for the Environmental Justice population (low income, minority, disabled or aging population) earned up to 3 points. In addition, a project that corrects an Americans with Disability (ADA) deficiency added a point. Connectivity (10 possible points) Transportation systems need to be connected. This criterion addressed how a project will improve connectivity for vehicles, bikes and pedestrians within the urban area and throughout the region. A roadway project that improves vehicle connections from one area to another earned up to 4 points. An improvement that makes connections for bicycles and pedestrians also earned up to 4 points. Regional connections are also important so up to 2 points were awarded for projects that enhance inter-region mobility. Efficient, Reliable, and Well Maintained (23 possible points) Projects that ensure an efficient, reliable and well maintained transportation system are the essential component to the Plan. Due to its importance, a high number of points were assigned to this criterion. The three major issues addressed were congestion, travel time and delay, and system conditions. Congestion reduction strategies are further divided into three types: multimodal, operations, and capacity. Each of these strategies earned up to 4 points based on the project s scope. Multimodal strategies include transit service improvements and bike and pedestrian upgrades. Operational improvements include ITS and signalization upgrades, access management, and signage projects. Capacity upgrades include adding lanes, intersection or interchange reconstruction, and adding turn lanes. Travel time and delay is an important measure of efficiency. The MPO s Congestion Management Process has developed several measures to quantify delay and a network of critical roadways that merit special consideration. Travel Time Index (TTI) is a measure of a motorist s ability to travel a segment of road under congested conditions compared to uncongested or free flow conditions. Projects scored up to 3 points on the existing TTI and the ability to reduce congestion. Another tool used to measure congestion is the travel demand model. It was used to identify roadway level-of-service (LOS) and volume to capacity ratios. Using model derived measures, a project scored up to 3 points on the existing conditions and the ability to reduce bottlenecks. Projects earned additional points by being located on the area s critical networks: Congestion Management Process, National Highway System, and functional classification system M e t r o p o l i t a n T r a n s p o r t a t i o n P l a n Page 151
162 An important component of a well maintained system is to ensure that improvements enhance or protect investments already made. Maintaining the existing system is a first priority and doing it in a manner that addresses the surrounding environment should be considered. Points were given for upgrading an existing facility and designing improvements in a context sensitive to the location. Economic Vitality (7 possible points) The economic vitality criterion awarded points that serve and support existing employment centers or enhance the movement of freight. Projects which were expected to significantly enhance access to high employment areas were given up to 2 points. Likewise, projects that provided or improved multimodal access to jobs or retail centers scored up to 2 points. An additional point was earned for projects providing access to planned growth areas. Providing better access to major shipping or distribution centers added another point and a project located on the designated truck route (existing or future) added 1 point. Community Character (6 possible points) An area of emphasis in the Lexington area is to encourage infill and redevelopment within the urban core to preserve as much of the rural landscape as possible. The community character criterion attempts to reward projects that support quality growth. Projects that encourage or support infill and redevelopment and projects near mixed-use, high density area earned up to 2 points for each. Additional points were earned if the project was in a new growth area and if the project included streetscape enhancements Environment (11 possible points) Protecting or improving the environment is an important quality supported by the community. Vehicle miles of travel (VMT) and vehicle hours of travel (VHT) are two measures that are related to air quality. Projects that reduce VMT and/or VHT improve the environment by reducing emissions. Up to 5 points was awarded to projects that have a significant impact on these measures. Sustainability is a measure of a project s ability to reduce direct and indirect energy and environmental impacts and to protect natural resources. Therefore, projects that promote alternative modes of transportation or environmentally cleaner modes earned up to 3 points. Health and Wellness (5 possible points) The link between the transportation system and the health of citizens has become issue nationally. To account for projects that promote increased physical activity, this criteria allocated up to 2 points. To account for projects that reduce air pollution and its adverse impact on health, an additional 3 points were earned M e t r o p o l i t a n T r a n s p o r t a t i o n P l a n Page 152
163 Project History, Support and Feasibility (17 possible points) This category of the scoring tool is meant to gauge the project s history, support and feasibility. Project history awarded up to 2 points for improvements that: have already completed detailed planning and/or engineering studies; have been listed previously in a community plan including the MPO s TIP and MTP; and/or have a demonstrated commitment of funding support. The corridor or planning study, a land use recommendation, or an engineering study is meant to recognize projects which have been identified through a formal planning process. Zero points were given to projects with no previous planning evaluation. Under project support, up to 4 points were earned based on public support of a project. Four more points were awarded for local officials support. The public support factor was included to emphasize the importance of public input to the planning process. Staff familiarity with public sentiment through various methods of contact (meetings, phone calls, , etc) and response to a survey conducted for the MTP update provided a subjective assessment. Staff knowledge of a project s relative importance to local officials established points for the local/regional priority criterion. The final category under this criterion is feasibility. Projects that have no known right-of-way or environmental issues, and therefore, potentially easier to construct, earned up to 3 points. The feasibility criterion attempts to quantify a project s implementation likelihood. Some projects have merit but lack feasibility due to political / public will, right-of-way availability, environmental constraints or other issues can make projects difficult to construct M e t r o p o l i t a n T r a n s p o r t a t i o n P l a n Page 153
164 Project Scoring Matrix GOAL DESCRIPTION MEASURE POINTS TOTAL POINTS 1 Safety compare crash rates (in MVM) to statewide averages project addresses existing bike/ped safety issue project includes safety improvement strategies CCRF > 3 3 CCRF > 2 2 CCRF > 1 1 yes 2 2 pts for bike and sw; 1 pt for improvement no 0 highway improvements 1 bike/ped improvements 1 signal/signage/traffic calming improvements pt for major signal or sign 2 Access/Choices include or enhance more than primary mode transit service improvement pts on transit route; +1 enhanced transit; +1 BRT bike/ped improvements pts new bike; 2 pts new ped; 1 pt for improvement bike/ped EJ access improvement - increases access for low income, minority, diasbled or elderly population pt for low income area/minority area/elderly or disabled area corrects ADA compliance issue Connectivity improves connectivity for vehicles-more direct route yes pts for new route; 2 pts for added capacity; 1 pt for turn lane improves connectivity for bike/ped-more direct route yes pt for added BL and/or SW; 1 pt for connecting to existing BL or SW M e t r o p o l i t a n T r a n s p o r t a t i o n P l a n Page 154
165 promotes regional transportation solutions Significant 2 2 pts for new regional connection Moderate 1 1 pt for increased capacity on regional facility Low/negative Efficient, Reliable, Well Maintained congestion reduction strategies-multimodal transit service improvement 1pt for new facility; 1 pt for bike/1 pt for ped/1 pt for transit improvement bike/ped improvements 0-4 congestion reduction strategies-operations ITS/signalization improvement 2pt for AM; 1pt for signal improvement; 1 pt for signs improvement access management signage/wayfinding 0-4 congestion reduction strategies-capacity geometrical improvements-add lanes, etc. 4 pts for adding lanes; 3 pts for intersection recon; 2 pts for turn lanes/minor intersection/interchange reconstruction turning movement improvement 0-4 observed travel time and delay (congestion management process) travel time index (TTI) 0-3 on CMP network 1 on NHS network 1 class arterial or above 1 model identified congestion (v/c, LOS) pts for v/c > 1.5; 2 pts for v/c > 1.25; 1 pt for v/c > 1 system condition upgrades existing facility 0-3 context sensitive upgrade pts for substandard facility; 2 pts for upgrading facility; 1 pt of minor improvement 5 Economic Vitality support existing, expanding or new employment centers freight and goods movement high employment area 0-2 2pts for high; 1 pt for some employment multi-modal access to jobs/retail pts for transit/bike/ped access; 1 point for some access to new planned growth area 1 major shipping/distribution center 1 designated truck route or anticipated truck route M e t r o p o l i t a n T r a n s p o r t a t i o n P l a n Page 155
166 6 Community Character supports quality growth 7 Environment improves the environment located in area of new growth 1 supports infill/redevelopment 0-2 includes streetscape enhancements 1 near mixed-use, high density area reduces VMT/VHT 0-5 sustainability pts for inside NCR/core area; 1 point for redevelopment potential 2 pts for bike/ped; 2 pts for added lane; 1 pt for minor capacity 2 pts for multimodal solution; 1 pt for targeted capacity improves natural or cultural resources pts for near/improve natural/cultural resource; 1 pt for storm/drainage improvement 8 Health and Wellness improves the health and wellness of citizens increases physical activity pts for bike/ped; 1 pt for only one 9 Project History and Feasibility project history reduces vehicle emissions pts for added capacity; 2 pts for improve capacity (minor); 1 pt for bike/ped detailed planning and engineering pts for developed plans; 1 pt for previous review previous TIP, MTP, or community plan pts for multiple plans; 1 pt for one plan funding support pts for funds committed; 1 pt for some D work project support public priority 0-4 feasibility local officials priority 0-4 no known ROW/environmental obstacles Subtotal M e t r o p o l i t a n T r a n s p o r t a t i o n P l a n Page 156

167 Appendix E Title VI, Environmental Justice & Social Equity Equitable Target Areas The Equitable Target Area (ETA) Maps were developed from US Census data to identify environmental justice (EJ) communities in the Lexington Area MPO. EJ communities are protected by national EJ Policies, including Title VI of the Civil Rights Act of 1964 and Presidential Executive Orders and Identifying Equitable Target Areas helps the MPO s ensure that there is an equitable distribution of transportation services, facilities and resources within the community without regard to income, race, age, ability and other socio-economic factors; and to ensure that there are not disproportionate negative impacts or burdens on minority and low-income populations. To identify these ETAs, a regional average for certain socio-economic demographics was established utilizing the American Community Survey 5 year Estimates. A regional threshold was identified and census tracts that exceeded that threshold were identified as an EJ census tract. For example, the average percentage of the population in the Lexington Area that is living below the poverty level is 17.8%. Census tracts that meet or exceed this threshold were them mapped. A compilation of Equitable Target Areas was generated to demonstrate the greatest concentrations of EJ-sensitive populations. Darker areas on the Demographic Distress map to the left indicates greater concentrations of various EJ populations. The presence of such EJ populations was considered and incorporated into the Project Scoring Process M e t r o p o l i t a n T r a n s p o r t a t i o n P l a n Page 157
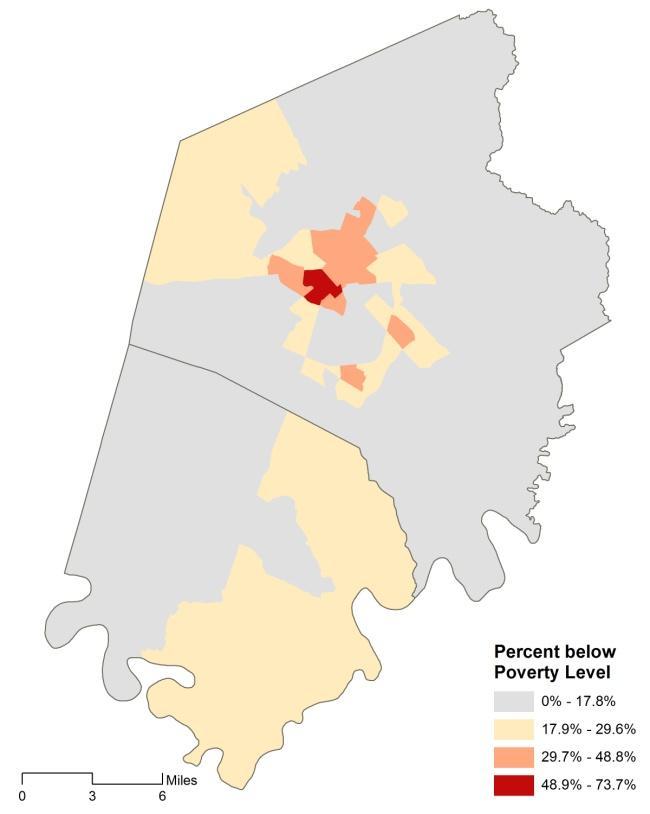
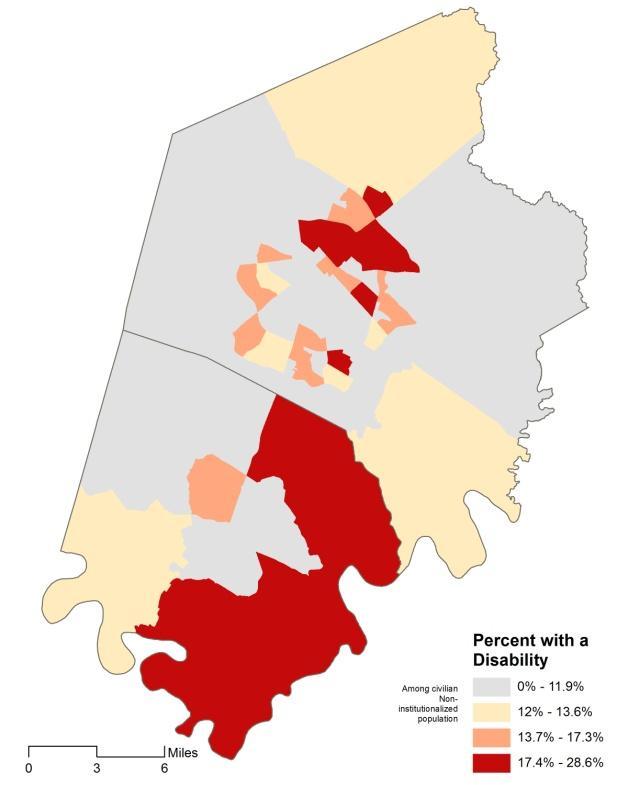
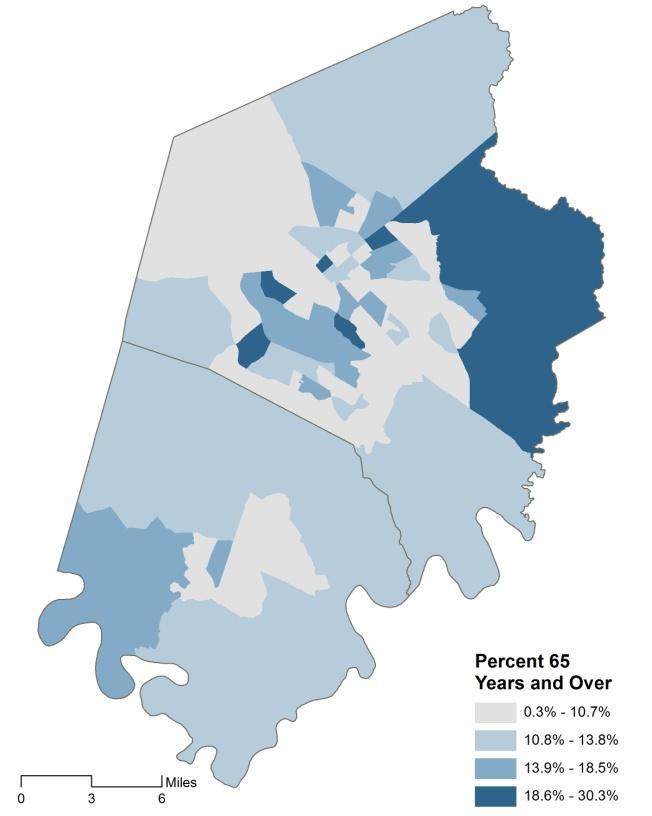
168
Transportation Master Plan Advisory Task Force
 Transportation Master Plan Advisory Task Force Network Alternatives & Phasing Strategy February 2016 BACKGROUND Table of Contents BACKGROUND Purpose & Introduction 2 Linking the TMP to Key Council Approved
Regional Transportation Needs Within Southeastern Wisconsin
 Regional Transportation Needs Within Southeastern Wisconsin #118274 May 24, 2006 1 Introduction The Southeastern Wisconsin Regional Planning Commission (SEWRPC) is the official areawide planning agency
Exhibit 1 PLANNING COMMISSION AGENDA ITEM
 Exhibit 1 PLANNING COMMISSION AGENDA ITEM Project Name: Grand Junction Circulation Plan Grand Junction Complete Streets Policy Applicant: City of Grand Junction Representative: David Thornton Address:
Proposed. City of Grand Junction Complete Streets Policy. Exhibit 10
 Proposed City of Grand Junction Complete Streets Policy Exhibit 10 1 City of Grand Junction Complete Streets Policy Vision: The Complete Streets Vision is to develop a safe, efficient, and reliable travel
Attachment A: Columbus Area Metropolitan Transportation Plan Objectives, Performance Measures, and Targets
 OBJECTIVE: Reduce the percentage of commuters driving alone, and increase the percentage of commuters riding transit, ing Reducing single occupancy auto commutes and increasing commuters using alternative
AMATS Complete Streets Policy
 AMATS Complete Streets Policy Table of Contents: Section 1. Definition of Complete Streets Section 2. Principles of Complete Streets Section 3. Complete Streets Policy Section 4. Consistency Section 5.
ACTIVE TRANSPORTATION
 ACTIVE TRANSPORTATION Mobility 2040 Supported Goals Improve the availability of transportation options for people and goods. Support travel efficiency measures and system enhancements targeted at congestion
MCTC 2018 RTP SCS and Madera County RIFP Multi-Modal Project Eval Criteria GV13.xlsx
 MCTC 8 RTP SCS and Madera County RIFP Multi-Modal Project Eval Criteria GV.xlsx Madera County Transportation Commission Regional Transportation Plan / Sustainable Communities Strategy Multi-Modal Project
2045 Long Range Transportation Plan. Summary of Draft
 2045 Long Range Transportation Plan Summary of Draft Fredericksburg Area Metropolitan Planning Organization The George Washington Region includes the City of Fredericksburg and the counties of Caroline,
Basalt Creek Transportation Refinement Plan Recommendations
 Basalt Creek Transportation Refinement Plan Recommendations Introduction The Basalt Creek transportation planning effort analyzed future transportation conditions and evaluated alternative strategies for
CITY OF BLOOMINGTON COMPLETE STREETS POLICY
 CITY OF BLOOMINGTON COMPLETE STREETS POLICY POLICY OBJECTIVE: The City of Bloomington will enhance safety, mobility, accessibility and convenience for transportation network users of all ages and abilities,
City of Novi Non-Motorized Master Plan 2011 Executive Summary
 City of Novi Non-Motorized Master Plan 2011 Executive Summary Prepared by: February 28, 2011 Why Plan? Encouraging healthy, active lifestyles through pathway and sidewalk connectivity has been a focus
Purpose and Need. Chapter Introduction. 2.2 Project Purpose and Need Project Purpose Project Need
 Chapter 2 Purpose and Need 2.1 Introduction The El Camino Real Bus Rapid Transit (BRT) Project (Project) would make transit and other transportation improvements along a 17.6-mile segment of the El Camino
Tulsa Metropolitan Area LONG RANGE TRANSPORTATION PLAN
 Tulsa Metropolitan Area LONG RANGE TRANSPORTATION PLAN Indian Nations Council of Governments August 2005 CONTACTING INCOG In developing the Destination 2030 Long Range Transportation Plan, INCOG s Transportation
Thank you for this opportunity to discuss with you how we can work together to make our streets more complete.
 Thank you for this opportunity to discuss with you how we can work together to make our streets more complete. 1 2 3 Thank you for this opportunity to discuss with you how we can work together to make
Chapter 7. Transportation. Transportation Road Network Plan Transit Cyclists Pedestrians Multi-Use and Equestrian Trails
 Chapter 7 Transportation Transportation Road Network Plan Transit Cyclists Pedestrians Multi-Use and Equestrian Trails 7.1 TRANSPORTATION BACKGROUND The District of Maple Ridge faces a number of unique
BUILDING THE CASE FOR TRAVEL OPTIONS IN WASHING TON COUNTY. Image: Steve Morgan. Image: Steve Morgan
 BUILDING THE CASE FOR TRAVEL OPTIONS IN WASHING TON COUNTY Image: Steve Morgan Image: Steve Morgan Image: TriMet Image: TriMet WHAT ARE TRAVEL OPTIONS PROGRAMS? Travel options programs encourage residents,
Performance Criteria for 2035 Long Range Transportation Plan
 Minimizing Impacts on Natural, Historic, Cultural or Archeological Resources 2035 LRTP Weighting Factor: 7% Objective 1.1: Use appropriate planning and design criteria to protect and enhance the built
Prioritizing Transportation Policy and Funding for Active Transportation, Safety, Equity and Health
 Mayor Karl Dean, Chairman Prioritizing Transportation Policy and Funding for Active Transportation, Safety, Equity and Health Leslie A. Meehan, AICP Planning and Implementing the Active Community Webinar
Perryville TOD and Greenway Plan
 Perryville TOD and Greenway Plan Greenway Glossary Pathway: A bicycle and pedestrian path separated from motorized vehicular traffic by an open space, barrier or curb. Multi-use paths may be within the
RESOLUTION NO ?? A RESOLUTION OF THE CITY OF NEPTUNE BEACH ADOPTING A COMPLETE STREETS POLICY
 RESOLUTION NO. 2018-?? A RESOLUTION OF THE CITY OF NEPTUNE BEACH ADOPTING A COMPLETE STREETS POLICY WHEREAS, safe, convenient, and accessible transportation for all users is a priority of the City of Neptune
I-105 Corridor Sustainability Study (CSS)
") I-105 Corridor Sustainability Study (CSS) Metro Streets and Freeways Subcommittee March 21, 2019 Gary Hamrick Cambridge Systematics, Inc. I-105 CSS Project History & Background Funded by Caltrans Sustainable
I-105 Corridor Sustainability Study (CSS) Metro Streets and Freeways Subcommittee March 21, 2019 Gary Hamrick Cambridge Systematics, Inc. I-105 CSS Project History & Background Funded by Caltrans Sustainable
Mobility and Congestion
 Technical Memorandum Mobility and Congestion Prepared for: Prepared by: September 25, 2013 1 Table of Contents 1. Introduction... 1 2. Congestion Forecasting Process... 1 2.1 Mobility and Congestion Terms...
CONNECTING PEOPLE TO PLACES
 CONNECTING PEOPLE TO PLACES 82 EAST BENCH MASTER PLAN 07 Introduction The East Bench transportation system is a collection of slow moving, treelined residential streets and major arteries that are the
2. Context. Existing framework. The context. The challenge. Transport Strategy
 Transport Strategy Providing quality connections Contents 1. Introduction 2. Context 3. Long-term direction 4. Three-year priorities 5. Strategy tree Wellington City Council July 2006 1. Introduction Wellington
We believe the following comments and suggestions can help the department meet those goals.
 The Honorable Secretary Anthony Foxx The Secretary of Transportation United States Department of Transportation 1200 New Jersey Avenue, SE Washington, DC 20590 August 30, 2013 Dear Secretary Foxx, Thank
TRANSIT & NON-MOTORIZED PLAN DRAFT FINAL REPORT Butte County Association of Governments
 1 INTRODUCTION Maintaining a high quality of life is the essence of this plan for transit and non-motorized transportation in Butte County. Curbing greenhouse gas emissions (GHG) by reducing congestion,
Typical Rush Hour Commute. PennyforTransportation.com
 Typical Rush Hour Commute In the News Overview of the Plan Collaborative plan with projects in every community Prioritizing connectivity and congestion relief Dedicated transportation-specific funding;
APPENDIX C. Systems Performance Report C-1
 APPENDIX C Systems Performance Report C-1 System Performance Report & Requirements According to the FAST Act, a long range transportation plan needs to include a system performance report and subsequent
Chapter 2. Bellingham Bicycle Master Plan Chapter 2: Policies and Actions
 Chapter 2 Bellingham Bicycle Master Plan Chapter 2: Policies and Actions Chapter 2: Policies and Actions The Bicycle Master Plan provides a road map for making bicycling in Bellingham a viable transportation
STUDY ADVISORY COMMITTEE. October 8, 2015
 STUDY ADVISORY COMMITTEE October 8, 2015 Study Purpose evaluate the long-term transportation strategies and investments needed to sustain the county s economic health and quality of life in the coming
Incorporating Health in Regional Transportation Planning
 Mayor Karl Dean, Chairman Incorporating Health in Regional Transportation Planning Leslie A. Meehan, AICP Center TRT Intervention Webinar January 29, 2013 Objectives for Today Background About the Nashville
Incorporating Health in Regional Transportation Planning
 Mayor Karl Dean, Chairman Incorporating Health in Regional Transportation Planning Leslie A. Meehan, AICP Center TRT Intervention Webinar January 29, 2013 Objectives for Today Background About the Nashville
Context of Transportation Planning in the Central Lane Metropolitan Planning Organization (MPO) Area
 Area") May 2017 May 2017 Context of Transportation Planning in the Central Lane Metropolitan Planning Organization (MPO) Area There are four adopted transportation plans which cover the Central Lane MPO area,
May 2017 May 2017 Context of Transportation Planning in the Central Lane Metropolitan Planning Organization (MPO) Area There are four adopted transportation plans which cover the Central Lane MPO area,
WALKNBIKE DRAFT PLAN NASHVILLE, TENNESSEE EXECUTIVE SUMMARY NASHVILLE, TENNESSEE
 NASHVILLE, TENNESSEE EXECUTIVE SUMMARY Executive Summary A world-class multi-modal transportation system is essential to a vibrant city and better quality of life. -Mayor Barry The WalknBike plan aims
Goal 3: Foster an environment of partnerships and collaboration to connect our communities and regions to one another.
 Non-Motorized Transportation Plan (NMTP) Draft Vision, Goal and,, Tri-County Regional Planning Commission (TCRPC) Purpose The purpose of the Tri-County Regional Planning Commission (TCRPC) Non-Motorized
SANTA CLARA COUNTYWIDE BICYCLE PLAN August 2008
 SANTA CLARA COUNTYWIDE BICYCLE PLAN August 2008 To assist VTA and Member Agencies in the planning, development and programming of bicycle improvements in Santa Clara County. Vision Statement To establish,
Bicycle Master Plan Goals, Strategies, and Policies
 Bicycle Master Plan Goals, Strategies, and Policies Mobilizing 5 This chapter outlines the overarching goals, action statements, and action items Long Beach will take in order to achieve its vision of
o n - m o t o r i z e d transportation is an overlooked element that can greatly enhance the overall quality of life for the community s residents.
 N o n - m o t o r i z e d transportation is an overlooked element that can greatly enhance the overall quality of life for the community s residents. 84 Transportation CHAPTER 11 INTRODUCTION Transportation
Online Open House Survey Report. December 2016
 December 216 I. OVERVIEW & OUTREACH SUMMARY Introduction Washington County evaluated long-term transportation investments and strategies as part of the Transportation Futures Study. The purpose of the
ADOT Statewide Bicycle and Pedestrian Program Summary of Phase IV Activities APPENDIX B PEDESTRIAN DEMAND INDEX
 ADOT Statewide Bicycle and Pedestrian Program Summary of Activities APPENDIX B PEDESTRIAN DEMAND INDEX May 24, 2009 Pedestrian Demand Index for State Highway Facilities Revised: May 29, 2007 Introduction
City of Jacksonville Mobility Fee Update
 City of Jacksonville Mobility Fee Update 2017 Preliminary Analysis May 3, 2017 Carnival Cruise lines photo credit Presentation Overview Public Outreach Process Pedestrian and Bicycle Master Plan Study
May 12, 2016 Metro Potential Ballot Measure Issue Brief: Local Return
 Summary: Local return is an important revenue source for cities to maintain their local transportation infrastructure. Most cities use their local return to operate small bus systems and repave streets,
PRELIMINARY DRAFT FIRST AMENDMENT TO VISION 2050: A REGIONAL LAND USE AND TRANSPORTATION PLAN FOR SOUTHEASTERN WISCONSIN
 PRELIMINARY DRAFT FIRST AMENDMENT TO VISION 2050: A REGIONAL LAND USE AND TRANSPORTATION PLAN FOR SOUTHEASTERN WISCONSIN ESTABLISHING TARGETS FOR FEDERAL PERFORMANCE MEASURES: HIGHWAY SAFETY SOUTHEASTERN
NM-POLICY 1: Improve service levels, participation, and options for non-motorized transportation modes throughout the County.
 Transportation PRINCE WILLIAM COUNTY 2008 COMPREHENSIVE PLAN NON-MOTORIZED PLAN CONTENTS Goals, Policies, and Action Strategies Table 4 (Bike Facility Classifications and Descriptions) Table 5 (Bike Facility
Bicycle and Pedestrian Chapter TPP Update Overview. TAB September 20, 2017
 Bicycle and Pedestrian Chapter TPP Update Overview TAB September 20, 2017 Bicycling & Walking in the Twin Cities Where are we now? The Bike-Pedestrian system Current trends New developments Where are we
The Route 29 Corridor Study was initiated at the request of Virginia s Commonwealth
 CHAPTER 2: Study Background and approach The Route 29 Corridor Study was initiated at the request of Virginia s Commonwealth Transportation Board in response to requests from members of the General Assembly
How To Encourage More Efficient Transportation in Brazilian Cities
 How To Encourage More Efficient Transportation in Brazilian Cities Todd Litman Victoria Transport Policy Institute Presented Seminar on Discouraging The Use Of Cars São Paulo, Brazil 3 September 2013 Creating
5. Pedestrian System. Accomplishments Over the Past Five Years
 5. Pedestrian System Accomplishments Over the Past Five Years The Alamo Area Metropolitan Planning Organization (MPO) and its partner agencies recognize the importance of improving pedestrian mobility.
City of Wayzata Comprehensive Plan 2030 Transportation Chapter: Appendix A
 A1. Functional Classification Table A-1 illustrates the Metropolitan Council s detailed criteria established for the functional classification of roadways within the Twin Cities Metropolitan Area. Table
Town of Superior. Superior Trails Plan
 Part 1 Base Information 1. Project Title US 36 Bikeway Extension 2. Project Start/End points or Geographic Area Provide a map with submittal, as appropriate 3. Project Sponsor (entity that will construct/
Chapter 14 PARLIER RELATIONSHIP TO CITY PLANS AND POLICIES. Recommendations to Improve Pedestrian Safety in the City of Parlier (2014)
") Chapter 14 PARLIER This chapter describes the current status and future plans for biking and walking in the City of Parlier. RELATIONSHIP TO CITY PLANS AND POLICIES The Parlier General Plan is the primary
Chapter 14 PARLIER This chapter describes the current status and future plans for biking and walking in the City of Parlier. RELATIONSHIP TO CITY PLANS AND POLICIES The Parlier General Plan is the primary
Highway 217 Corridor Study. Phase I Overview Report
 Highway 217 Corridor Study Phase I Overview Report November 3, 24 BACKGROUND AND OVERVIEW Study purpose The Highway 217 Corridor Study is developing multi-modal transportation solutions for traffic problems
Measuring and Communicating Mobility:
 Measuring and Communicating Mobility: The District Mobility Project Stephanie Dock, District Department of Transportation TRB Transportation Issues in Major Cities Committee May 2, 2017 Deconstructing
SF Transportation Plan Update
 SF Transportation Plan Update CAC Meeting #11 Existing Conditions and Future Baseline Needs Revised, Part I www.sfcta.org/movesmartsf twitter.com/sanfranciscota www.facebook.com/movesmartsf January 30,
PEDESTRIAN ACTION PLAN
 ATTACHMENT 2 CITY OF SANTA MONICA PEDESTRIAN ACTION PLAN CITY OF SANTA MONICA PEDESTRIAN ACTION PLAN This page intentionally left blank EXECUTIVE SUMMARY CHAPTER 1 EXECUTIVE SUMMARY Setting the Stage
Living Streets Policy
 Living Streets Policy Introduction Living streets balance the needs of motorists, bicyclists, pedestrians and transit riders in ways that promote safety and convenience, enhance community identity, create
APPROVE A RESOLUTION ADOPTING A COMPLETE STREETS POLICY
 STAFF REPORT MEETING DATE: September 13, 2016 TO: FROM: City Council Bob Brown, Community Development Director Russ Thompson, Public Works Director Patrick Filipelli, Management Analyst 922 Machin Avenue
Develop a Multi-Modal Transportation Strategy (Theme 6)
") DEVELOP A MULTI-MODAL TRANSPORTATION STRATEGY (THEME 6) WHY IS THIS THEME ADDRESSED? Develop a Multi-Modal Transportation Strategy (Theme 6) Statement of Ideal Reduce resident and visitor reliance on single
DEVELOP A MULTI-MODAL TRANSPORTATION STRATEGY (THEME 6) WHY IS THIS THEME ADDRESSED? Develop a Multi-Modal Transportation Strategy (Theme 6) Statement of Ideal Reduce resident and visitor reliance on single
Public Consultation Centre For. Transportation Master Plan Update. Information Package
 Public Consultation Centre For Transportation Master Plan Update Information Package Date Location Hours Tuesday, September 12, 2017 Wednesday, September 13, 2017 Tuesday, September 19, 2017 Cambridge
Appendix T 1: Additional Supporting Data
 Appendix T 1: Additional Supporting Data Project Delivery Delays with the implementation of the 2000 TIP became apparent early in the decade. In response to direction among policy officials, ARC began
Governor s Transportation Vision Panel
 Office of Governor Kate Brown Governor s Transportation Vision Panel JLA Public Involvement Project Overview The is a yearlong effort to develop a series of recommendations for the Governor that address
SMART 1 Public Meeting #1. February 24, 2016
 SMART 1 Public Meeting #1 February 24, 2016 Agenda Who is the SMTC? SMART 1 project overview Syracuse Metropolitan Transportation Council An Introduction: Who we are & what we do What is an MPO? A Metropolitan
Vision Public Workshop: Findings
 Vision Public Workshop: Findings Long Range Transportation Plan & Bicycle Mobility Plan February 2018 Vision Workshop South Kingstown 1/23/18 Providence 1/24/18 Newport 1/31/18 Long Range Transportation
PERFORMANCE ANALYSIS of The Draft 2015 CLRP
 Item 9 PERFORMANCE ANALYSIS of The Draft CLRP Presentation to the Transportation Planning Board September 16, CLRP Performance Analysis 1 What is the Long-Range Transportation Plan (CLRP)? The CLRP identifies
Solana Beach Comprehensive Active Transportation Strategy (CATS)
") Solana Beach Comprehensive Active Transportation Strategy (CATS) 3.0 Goals & Policies The Solana Beach CATS goals and objectives outlined below were largely drawn from the Solana Beach Circulation Element
Solana Beach Comprehensive Active Transportation Strategy (CATS) 3.0 Goals & Policies The Solana Beach CATS goals and objectives outlined below were largely drawn from the Solana Beach Circulation Element
CITY OF COCOA BEACH 2025 COMPREHENSIVE PLAN. Section VIII Mobility Element Goals, Objectives, and Policies
 CITY OF COCOA BEACH 2025 COMPREHENSIVE PLAN Section VIII Mobility Element Goals, Objectives, and Policies Adopted August 6, 2015 by Ordinance No. 1591 VIII MOBILITY ELEMENT Table of Contents Page Number
WILMAPCO Public Opinion Survey Summary of Results
 Wilmington Area Planning Council WILMAPCO Public Opinion Survey Summary of Results Prepared by: 2955 Valmont Road, Suite 300 Boulder, Colorado 80301 t: 303-444-7863 f: 303-444-1145 www.n-r-c.com Table
Chapter 5 Future Transportation
 Chapter 5 Future Transportation The Future Land Use Plan identifies the desired land use designations. The land uses desired for Crozet depend, in large part, on the success of the transportation system,
WEST AND SOUTH WEST RING ROAD DOWNSTREAM TRAFFIC IMPACTS
 Page 1 of 9 EXECUTIVE SUMMARY Alberta Transportation ( AT ) is preparing to construct the final sections of the Calgary Ring Road. This includes the South West Ring Road ( SWRR ) (from Lott Creek Blvd
Rochester Area Bike Sharing Program Study
 roc bike share Rochester Area Bike Sharing Program Study Executive Summary ~ January 2015 JANUARY 2015 8484 Georgia Avenue, Suite 800 Silver Spring, MD 20910 3495 Winton Pl., Bldg E, Suite 110 Rochester,
Welcome. Background. Goals. Vision
 Welcome The formal Public Information Centre (PIC) for the Transportation Master Plan How We GO will be held in early 2017. At that time we will present the recommended transportation system for Niagara
TRANSPORTATION TRAINING TOPICS. April 6, 2010
 TRANSPORTATION TRAINING TOPICS April 6, 2010 Roles of Transportation Providers Context and Policy Makers Division of Transportation and Traffic Other City Operations Other Transportation Operators CMA
SNCC Demographic Trends
 Employment Population SNCC Demographic Trends In 1970 the SNCC population was 10,040, accounting for roughly 3% of the County population In 2015, SNCC grew to 60,567 people, roughly 11% of the County population
5.0 Roadway System Plan
 Southwest Boise Transportation Study Page 16 5.0 Roadway System Plan The Roadway System Plan outlines roadway improvements in the Initial Study Area. It forecasts future deficiencies on the arterial system,
THE I-79 CORRIDOR. I-79 provides motorists with connections to the following major highways: I-80, PA 358, PA 965 and PA 208.
 The I-79 Corridor Pittsburgh to Erie Regional Thruway I-79 was constructed through Mercer County in the early 1960s. The portion north of PA 965 opened in 1961 and the segment south of PA 965 the following
Bicycle and Pedestrian Connectivity Study Phase 2
 Connectivity Study Phase 2 Process PROCESS OUTCOMES Phase Prepared By STEP I Public Participation and Outreach 1. RTP Outreach activities, and development of the Bike and Ped Task Force Phase 1 2011 OCPC
New Measure A Expenditure Categories DEFINITIONS OF ELIGIBLE EXPENDITURES Adopted March 8, 2007
 New Measure A Expenditure Categories DEFINITIONS OF ELIGIBLE EXPENDITURES Adopted March 8, 2007 City Street and County Road Maintenance Program The preservation and keeping of public street and road rights-of-way
Welcome. Public Meeting. Heading 1. Heading 2. DeMers Ave. Columbia Rd. Washington St. 42nd St. 32nd Ave. Heading 3 HEADING
 Heading 1 Heading 2 Heading 3 HADING Welcome 4 Heading 5 Normal Normal Less Spacing Public Meeting Normal No Spacing Strong mphasis Intense mphasis To Do List ullet List ullet Last List ullet 2 CÞ List
MOBILITY RESULTS AREA. Budgeting For Outcomes Council Presentation January 12, 2007
 MOBILITY RESULTS AREA Budgeting For Outcomes Council Presentation January 12, 2007 Mobility Results Team Members 2 Hammond Perot, OED, Co-Team Leader Bonnie Meeder, DEV (returning), Co-Team Leader Peer
STREET AND HIGHWAY PLAN
 STREET AND HIGHWAY PLAN Introduction The street and highway system in the Winston-Salem Urban Area consists of thousands of miles of traffic carrying facilities, ranging from short local residential streets
2015 Florida Main Street Annual Conference. Complete Streets Equal Stronger Main Streets
 WHAT ARE COMPLETE STREETS? CASE STUDIES COMPLETING YOUR MAIN STREET 2015 Florida Main Street Annual Conference St. Petersburg, Florida August 19, 2015 WHAT ARE COMPLETE STREETS? CASE STUDIES COMPLETING
Vision to Action Community Coalition February 14, 2014 Briefing
 Vision to Action Community Coalition February 14, 2014 Briefing Transportation and Transit Planning & Mass Transit Operations Strategic Growth Area Office Brian S. Solis Transportation & Transit Manager
Measuring Transportation: Traffic, Mobility and Accessibility
 Measuring Transportation: Traffic, Mobility and Accessibility THIS FEATURE COMPARES THREE APPROACHES TO MEASURING TRANSPORTATION SYSTEM PERFORMANCE. TRAFFIC-BASED MEASUREMENTS EVALUATE MOTOR VEHICLE MOVEMENT;
City of Hamilton s Transportation Master Plan (TMP) Public Consultation 3 December 2015
 Public Consultation 3 December 2015") City of Hamilton s Transportation Master Plan (TMP) Public Consultation 3 December 2015 McPhail Transportation Planning Services Ltd. AGENDA 6:00 7:00 pm Viewing Boards / Q & A with the Team 7:00 7:50
City of Hamilton s Transportation Master Plan (TMP) Public Consultation 3 December 2015 McPhail Transportation Planning Services Ltd. AGENDA 6:00 7:00 pm Viewing Boards / Q & A with the Team 7:00 7:50
FACTS AND FIGURES: MAKING THE CASE FOR COMPLETE STREETS IN LEE COUNTY
 FACTS AND FIGURES: MAKING THE CASE FOR COMPLETE STREETS IN LEE COUNTY Safety: Close to 5,000 pedestrians and bicyclists die each year on U.S. roads, and more than 70,000 are injured. [Mean Streets, Surface
TOWN OF PORTLAND, CONNECTICUT COMPLETE STREETS POLICY
 TOWN OF PORTLAND, CONNECTICUT COMPLETE STREETS POLICY I. VISION, GOALS & PRINCIPLES VISION To improve the streets of Portland making them safer and more accessible for all users including pedestrians,
Where We Live and Work Today
 San Diego Forward: The 2019-2050 Regional Plan Network Concepts Transportation Committee Item 4 October 19, 2018 Where We Live and Work Today 2018 2 2019 Regional Plan Transportation Committee Item 4 October
Goals, Objectives, and Policies
 Goals, Objectives, and Policies ADVISORY GROUP INPUT PUBLIC INPUT SNS PREVIOUS STUDIES RBPP Goals Vision Statement Southern Nevada will develop a safe, connected, and convenient walking and bicycling system
Findings. TSTC went line-by-line through the STIP and categorized projects into 15 categories:
 Tracking the Dollars 2012-2015: A Review of Planned Transportation Investments in Connecticut and what it says about Connecticut s transportation priorities The Connecticut Department of Transportation
DRAFT MOVING FORWARD RHODE ISLAND BICYCLE MOBILITY PLAN 2018 PREPARED FOR PREPARED BY IN ASSOCIATION WITH
 RHODE ISLAND MOVING FORWARD BICYCLE MOBILITY PLAN 2018 PREPARED FOR PREPARED BY IN ASSOCIATION WITH T AF CHAPTER 1 D R INTRODUCTION CHAPTER 3 ARTICULATES VISION Bicycling is safe, fun and practical in
Briefing Paper #1. An Overview of Regional Demand and Mode Share
 2011 Metro Vancouver Regional Trip Diary Survey Briefing Paper #1 An Overview of Regional Demand and Mode Share Introduction The 2011 Metro Vancouver Regional Trip Diary Survey is the latest survey conducted
Clackamas County Comprehensive Plan
 ROADWAYS The County s road system permits the movement of goods and people between communities and regions, using any of a variety of modes of travel. Roads provide access to virtually all property. They
REGIONAL BICYCLE AND PEDESTRIAN DESIGN GUIDELINES
 REGIONAL BICYCLE AND PEDESTRIAN DESIGN GUIDELINES November 16, 2011 Deb Humphreys North Central Texas Council of Governments Bicycle and Pedestrian Advisory Committee Snapshot of the Guide 1. Introduction
Appendix A-1: Purpose and Need Statement
 Appendix A-1: Purpose and Need Statement PURPOSE AND NEED STATEMENT Western & Ashland Corridors Bus Rapid Transit (BRT) Project Prepared for Chicago Transit Authority 567 West Lake Street Chicago, IL 60661
City of Homewood Transportation Plan
 City of Homewood Transportation Plan Prepared for: City of Homewood, Alabama Prepared by: Skipper Consulting, Inc. May 2007 TABLE OF CONTENTS INTRODUCTION... 1 BACKGROUND INFORMATION... 1 EXISTING TRANSPORTATION
West Dimond Blvd Upgrade Jodhpur Street to Sand Lake Road
 West Dimond Blvd Jodhpur St to Sand Lake CSS Transportation Project Summary Municipality of Anchorage Project # 05 005 Project Manager: John Smith, P.E. (MOA PM&E) Project Administrator: Julie Makela,
MTP BICYCLE ELEMENT UPDATE. November 2017
 MTP BICYCLE ELEMENT UPDATE November 2017 TIME FOR AN UPDATE Bicycle Element adopted in July 2008 Almost 10 years old Many planned facilities have been implemented 10 years more experience in planning,
Planning Guidance in the 2012 AASHTO Bike Guide
 Planning Guidance in the 2012 AASHTO Bike Guide Presentation by: RJ Eldridge Peter Lagerwey August 22, 2012 WEBINAR 2: PLANNING GUIDANCE IN THE 2012 AASHTO BIKE GUIDE Today s Webinar Significant Updates
City Council Agenda Item #6-A CITY OF ALAMEDA Memorandum. To: Honorable Mayor and Members of the City Council. John A. Russo City Manager
 CITY OF ALAMEDA Memorandum To: From: Honorable Mayor and Members of the City Council John A. Russo City Manager Date: January 14, 2013 Re: Adopt a Resolution Approving a Complete Streets Policy, in Accordance