Bicycle-Rail Trip Analysis and Greenhouse Gas Emissions Reduction Focused Study
|
|
|
- Giles Franklin
- 6 years ago
- Views:
Transcription

1 Bicycle-Rail Trip Analysis and Greenhouse Gas Emissions Reduction Focused Study
2
3 Bicycle-Rail Trip Analysis and Greenhouse Gas Emissions Reduction Focused Study June, 2011 Los Angeles County Metropolitan Transportation Authority
4
5 This report and the data contained within was prepared and collected by: Metro Cris Liban, Manager of Environmental Compliance and Services Department Gwynneth L. Doyle, Senior Environmental Specialist Lynne Goldsmith, Bike Program Manager Anthony (Tony) Jusay, Transportation Planning Manager Nathan Baird, Bicycle Planning Intern David Sotero, Media Relations Elizabeth McGowan, Senior Marketing and Communications Officer Sarah Winfrey, Communications Assistant Anna Mercaldi, Assistant Public Communications Officer ICF International Madonna Marcelo, Project Manager Keith Cooper, Senior Air Quality and Climate Change Analyst Alta Planning + Design Lauren Ledbetter, Project Manager Matt Benjamin, Assistant Project Manager (Former) Adrian Witte, Senior Planner Tony Salomone, GIS Specialist Los Angeles County Bicycle Coalition Jennifer Klausner, Executive Director Alexis Lantz, Planning and Policy Director Dorothy Kieu Le, Planning and Policy Director (Former) Over 40 volunteers
6
7 Table of Contents Executive Summary... i Purpose... i Methodology... i Findings... i Structure... iii Introduction... 1 Purpose... 1 U.S. DOT Bicycle and Pedestrian Accommodation Policy... 1 The First Mile-Last Mile Barriers... 2 Metro s Bicycle Policy... 2 Methodology... 2 Survey Instrument... 3 Surveyors... 3 Counts... 4 Days and Times... 6 Results... 7 Overview of Data Collected... 7 Peak Hour Use... 9 Boarding and Alighting Mode To or From Station Trip Purpose Mode Shift Trips To and From the Station Trips from Origin to Destination Access to a Motor Vehicle Reasons for Choosing the Bike-Rail Option Demographics Los Angeles County Metropolitan Transportation Authority June 2011 TOC-i
8 Bicycle-Rail Trip Analysis and Greenhouse Gas Emissions Reduction Focused Study Reductions in Vehicle Miles Traveled Bicycle Use Estimates Distance Traveled Distance To or From the Station Distance from Origin and Destination Vehicle Miles Avoided Estimated Greenhouse Gas Emissions Reduction Senate Bill Methodology Combined Bicycle-Rail Use Emissions Reductions Vehicle Offsets Findings and Recommendations Findings Recommendations Appendices Appendix A: Survey Instruments Appendix B: Additional Survey Data Tables Appendix C: Additional Count Data Tables and Charts Appendix D: Schematic Maps Appendix E: Emissions Calculations References Los Angeles County Metropolitan Transportation Authority June 2011 TOC-ii
9 Bicycle-Rail Trip Analysis and Greenhouse Gas Emissions Reduction Focused Study List of Tables Table 1: Stations Selected for Counts and Surveys... 5 Table 2: Data Collection Days and Times... 6 Table 3: Number of Surveys Collected and Number of Bicyclists Counted... 8 Table 4: Bicycle Count Data Summary... 9 Table 5: Bicyclist Boardings and Alightings by Line Table 6: Mode Traveled to or From Station Table 7: Purpose of Trip: Start of Trip to Station, by Time Period Table 8: Purpose of Trip: End of Trip from Station, by Time Period Table 9: If you didn't have your bike, how would you get from your origin to the first station? Table 10: If you didn't have your bike, how would you get from the second station to your destination?.. 14 Table 11: If you didn't have your bike and couldn't take a train, how would you get from your origin to your destination? Table 12: How often do you have access to a motor vehicle? Table 13: Factors Influencing a Person's Decision to Travel by Bike and Rail Table 14: Estimated Annual Bicycle Trips for the Metro Rail System Table 15: Distance Traveled to or From Station by Mode Table 16: Vehicle Miles Reduced by Combined Bicycling/Rail Trips Table 17: Emissions Reductions in Tons per Year Los Angeles County Metropolitan Transportation Authority June 2011 TOC-iii
10 Bicycle-Rail Trip Analysis and Greenhouse Gas Emissions Reduction Focused Study List of Figures Figure 1: Schematic of Bicycle-Rail Trip... 3 Figure 2: Map of Survey Stations... 5 Figure 3: Bicycle Peaking Patterns Figure 4: Responses to the Question: If you didn t have your bike, how would you get from your: (A) origin to first station, and (B) second station to destination? Figure 5: Responses to the Question: If you didn t have your bike and couldn t take a train, how would you get from your origin to your destination? Figure 6: Responses to the Question: How often do you have access to a motor vehicle? Figure 7: Gender and Age Breakdown of Survey Respondents Figure 8: Schematic of Distance Calculations for Origin to Destination Los Angeles County Metropolitan Transportation Authority June 2011 TOC-iv
11 Executive Summary Purpose The Los Angeles County Metropolitan Transportation Authority (Metro) recently began studying the ways in which bicycling, for transportation and in combination with transit, can reduce automobile use and lower greenhouse gas (GHG) emissions. The first of these focused studies concentrated on the Metro Orange Line and parallel bicycle path. This Bicycle Rail Trip Analysis and Greenhouse Gas Emissions Study looks more broadly at bicycle trips to and from Metro Rail. The purpose of this study is to establish the benefits of providing an integrated transportation system where bicyclists are accommodated at train stations and on trains. Methodology This focused study relies on bicycle trip data gathered by conducting intercept surveys of bicyclists at a subset of nineteen (19) Metro Rail stations. Counts and surveys were conducted during the weekday morning commute period (6 a.m. to 10 a.m.), the weekday evening commute period (4 p.m. to 8 p.m.) and the weekend midday period (10 a.m. to noon). Bicyclists were asked to report about the journey they were taking at that moment, from the origin to the final destination. Concurrently with the intercept surveys, volunteers recorded the total number of bicyclists entering and exiting each sampled station. Volunteers collected 605 usable surveys and counted 2,305 bicyclists at the 19 sampled stations. This study uses survey data to calculate bicycle-rail trip distances and associated reductions in vehicle miles traveled (VMT) and GHG emissions. Bicycle count data collected at the sample stations was extrapolated to daily and annual bicycle trips at all stations using Metro Rail ridership data from fiscal year (FY) 2009, and commonly accepted traffic analysis methodology. For those bicycle trips that replaced auto-based trips, trip distances were calculated and used to calculate annual VMT reductions, which were then applied in the Caltrans Emissions Factors model to calculate estimate GHG, criteria pollutant, and mobile-source air toxics (MSAT) emissions reductions. 1 Findings This study indicates that bicyclists are a small but important subset of riders on the Metro Rail system, and bicycle-rail trips offset vehicle miles traveled resulting in quantifiable greenhouse gas emissions. The counts and extrapolated methodology mirrors commonly accepted practices in traffic analysis. Some relevant extrapolated results, based on the data, are as follows: Approximately 1,195,000 bicyclists would use the Metro Rail system annually. (Which represents 1.3 percent of all annual trips.) 1 Caltrans Emissions Factors model (CT-EMFAC) is a California-specific project-level analysis tool, which models the GHG constituent pollutant CO 2, as criteria pollutant and MSAT emissions using the latest version of the California Mobile Source Emission Inventory and Emission Factors model. The model was developed by UC Davis, in coordination with Caltrans and the California Air Resources Board (CARB), and is the Caltrans preferred model for quantification of mobile-source GHG emissions. Los Angeles County Metropolitan Transportation Authority June 2011 i
12 Bicycle-Rail Trip Analysis and Greenhouse Gas Emissions Reduction Focused Study Bicycle-rail trips would replace approximately 322,000 motor vehicle trips and reduce 3.96 million vehicle miles traveled each year, offsetting approximately 2,152 metric tons of carbon dioxide equivalents (CO 2 e) annually. This would be equivalent to taking 422 motor vehicles off the road. 2 Bicyclists are universally using the Metro Rail system, with bicyclists reporting starting or ending their rail trip at 71 out of 73 Metro Rail stations surveyed. Over a quarter (27 percent) of bicycle-rail trips replace a motor vehicle trip. 3 In terms of getting to or from the station, twelve percent of bicycle trips replaced motor vehicle trips. 4 On average, 13 bicyclists per hour one bicyclist every five minutes enters or exits a Metro train during the weekday morning or weekday evening peak periods. An average of 10 bicyclists per hour one every six minutes enters or exits a Metro train during the weekend midday period. This study provides data on the bikeshed of Metro Rail stations, and underscores the importance of increasing a bicyclists reach by providing for bicycles on transit. On average, bicyclists traveled 2.2 miles to access train travel (these distance are within the typical bicycling catchment area of a train station). Bicyclists taking the bus travel an average of 4.9 miles to access a station. Additional study results are as follows: Bicyclists are using the Metro system just as other Metro riders do. Respondents generally follow commute trends, with 90 percent of respondents starting their weekday a.m. trip at home and 65 percent of respondents ending their weekday a.m. trip at work. Similarly, 54 percent of respondents started their weekday p.m. trip at work and 66 percent of respondents ended their weekday p.m. trip at home. Accommodating bicyclists at rail stations and on trains provides mobility benefits. Thirteen percent of bicyclists would not make their trip if they couldn t bicycle and take the train. Respondents are more transit dependent than the general population, with 11 percent of respondents stating that they rarely have access to a motor vehicle and over a third of respondents (37 percent) stating that they never have access to a motor vehicle. In Los Angeles County, 9.4% of households do not have access to a motor vehicle. 5 Allowing bicycles on trains is a major reason why people choose to bicycle, particularly for riders who have access to a motor vehicle. Survey respondents overwhelmingly said that being allowed to take their bike on the train influenced their decision to travel by bike and rail. Of the 477 people who responded to the 2 On average, an automobile is driven 11,720 miles per year, producing 5.1 metric tons of CO 2 e. 3 Origin to final destination, or A to D trip. 4 Origin to train station, for example, A to B or B to C trip. 5 U.S. Census Bureau, American Community Survey3-Year Estimates. Los Angeles County Metropolitan Transportation Authority June 2011 ii
13 Bicycle-Rail Trip Analysis and Greenhouse Gas Emissions Reduction Focused Study question, 65 percent chose allowed to take bike on train as a factor that influenced their decision. Respondents with access to a motor vehicle are more likely than those without access to a motor vehicle to cite allowed to take bike on train, no car parking at station, bike lockers at station, and have to pay for car parking at station as factors that influenced their decision to bicycle. Women are much less likely to bicycle to a Metro Rail station than men. Respondents were mostly male (86 percent) and 75 percent were between the ages of 18 and 39. This percentage of female bicyclists is consistent with the data collected through the 2009 City of Los Angeles Bike Count, which found only 15% of bicyclists counted were female. In other California urban areas, women typically represent between 25 and 30 percent of bicyclists rather than the 14 percent found by this study, suggesting that there may be ways that Metro can increase the percentage of women using the bike-rail mode. 6 Structure This report consists of the following sections: Introduction: Study Results: Reductions in Vehicle Miles Traveled: Estimated Greenhouse Gas Emissions Reduction: Findings and Recommendations: Appendices: Describes the study purpose and policy background, and discusses the methodology of the surveys and counts in detail Summarizes the results from the counts and surveys. Calculates the estimated bicycle usage for the entire Metro Rail system, and the estimated vehicle miles reduced by bicycle-rail trips. Calculates the amount of carbon dioxide emissions (as well as criteria air pollutant and mobile-source air toxics emissions) offset by bicyclerail trips. Describes key findings, lessons learned and provides policy recommendations for Metro to pursue in meeting its sustainability goals and providing for bicyclists on transit. Provides survey instruments, survey data tables, count data tables and a graphic map of trips to and from the Metro Rail stations. 6 The Seamless Travel Study by U.C. Berkeley s Safe Transportation Research and Education Center (2010) conducted intercept surveys of 212 bicyclists at 25 locations throughout San Diego County and found a gender breakdown of 68% male, 32% female. The San Francisco State of Cycling Report Card (2008) conducted intercept surveys of bicyclists and found a gender breakdown of 73% male, 23% female. Portland, Oregon, which has constructed an extensive network of bicycle facilities over the last decade and has an outreach program targeted to women bicyclists, has seen the percentage of female bicyclists increase to 32% as of Los Angeles County Metropolitan Transportation Authority June 2011 iii
14
15 Introduction Purpose Metro recently began studying the ways in which bicycling, for transportation and in combination with transit, can reduce automobile use and lower GHG emissions. The first of these focused studies concentrated on the Metro Orange Line and parallel bicycle path. This Bicycle Rail Trip Analysis and Greenhouse Gas Emissions Reduction Focused Study concentrated more broadly at bicycle trips to and from Metro Rail lines. The purpose of this study is to determine the extent of the benefits of providing an integrated transportation system where bicyclists are a complementary mode-choice to riding the system. This focused study s methodologies, data, findings and recommendations will serve as another important dataset for future focused studies of multimodal benefits, and provide empirical support for improving bicycle-transit integration with the goal of reducing automobile miles and GHG emissions. In 2006, Metro adopted the Metro Bicycle Transportation Strategic Plan which emphasizes infrastructure, access and connectivity improvements that will increase the use of bicycles as a transportation mode. This focused study establishes baseline data for the typical number of bicycle-rail trips that are made on Metro transit facilities, estimates the GHG emissions offset by bicycle-rail trips, and provides data that can be used to complement the development of climate change policies and transit industry protocols. U.S. DOT Bicycle and Pedestrian Accommodation Policy On March 15, 2010, U.S. Secretary of Transportation Ray LaHood announced a new federal policy 7 on the development of fully integrated active transportation networks. Transportation agencies, such as Metro are expected to take the lead on this new policy: The DOT policy is to incorporate safe and convenient walking and bicycling facilities into transportation projects. Every transportation agency, including DOT, has the responsibility to improve conditions and opportunities for walking and bicycling and to integrate walking and bicycling into their transportation systems. Because of the numerous individual and community benefits that walking and bicycling provide including health, safety, environmental, transportation, and quality of life transportation agencies are encouraged to go beyond minimum standards to provide safe and convenient facilities for these modes. In light of this new federal policy statement, preparation of this Metro Rail Focused Mode Shift study comes at an opportune time. The study s purpose, to establish the sustainability benefits of providing an integrated transportation system where bicyclists are accommodated at train stations and on trains, can serve as the data to support this new policy. By quantifying these benefits, Metro should be able to follow USDOT s recommended actions with hard data to support this policy shift: The DOT encourages States, local governments, professional associations, community organizations, public transportation agencies, and other government agencies, to adopt similar policy statements on bicycle and pedestrian accommodation as an indication of their commitment 7 United States Department of Transportation, Policy Statement on Bicycle and Pedestrian Accommodation Regulations and Recommendations. (Signed on March 11, 2010 and announced March 15, 2010) Los Angeles County Metropolitan Transportation Authority June
16 Bicycle-Rail Trip Analysis and Greenhouse Gas Emissions Reduction Focused Study to accommodating bicyclists and pedestrians as an integral element of the transportation system. In support of this commitment, transportation agencies and local communities should go beyond minimum design standards and requirements to create safe, attractive, sustainable, accessible, and convenient bicycling and walking networks. The First Mile-Last Mile Barriers Bicycling offers one solution to overcoming the first mile-last mile barriers for people who would potentially take transit but choose not to because their starting point or final destination is not conveniently accessible to the transit stop due to distance, street patterns, or safety concerns. Metro recognizes the importance of bridging this last mile to attract drivers to transit, and the role that bicycling plays. Metro allows folding bicycles on trains at all times and is studying the feasibility of a subsidized folding bicycle program. Regionally, the Southern California Association of Governments (SCAG) and the City of Los Angeles recommended two bicycle-related strategies to address the first mile-last mile barrier in their 2009 report Maximizing Mobility in Los Angeles: increasing folding bicycle use and establishing bicycle sharing programs. 8 The data, findings and recommendations from that study can be used to guide, support and evaluate bicycle-related first mile-last mile programs. Metro s Bicycle Policy Metro s Bicycle Policy has an effect on how bicyclists are using the system. Bicycles are allowed on bus bike racks with no time restrictions. At the time the study was conducted, bicycles were restricted from the trains during the peak weekday commuting period, and through certain localities. However on April 28, 2011 that policy has been removed. However, if the arriving train is crowded, or the bus rack is full, then the bicyclist must wait for a train with available room. Bicycle restrictions were: weekdays 6:30 a.m. - 8:30 a.m. and 4:30 p.m. - 6:30 p.m. Trains affected were all of the Blue Line, all of the Gold Line, Green Line from Norwalk station to Redondo Beach station, Red Line from Union Station to Wilshire/Vermont station (both directions). Methodology This focused study relies on bicycle trip data gathered by conducting intercept surveys of bicyclists at a subset of nineteen (19) Metro Rail stations to measure reductions in VMT and GHG emissions related to bicycle-rail trips. Count data, in conjunction with Metro Rail ridership data from FY 2009, are used to extrapolate VMT and GHG emissions reductions to annual numbers as is typically done in transportation analysis. The sections below describe the methodology used for the surveys and the counts. 8 SCAG, Maximizing Mobility in Los Angeles First and Last Mile Strategies. Accessed July 7, Los Angeles County Metropolitan Transportation Authority June
17 Bicycle-Rail Trip Analysis and Greenhouse Gas Emissions Reduction Focused Study Survey Instrument For each bicycle-train trip, surveyors collected: the origin of the trip (A), the station where the bicyclist boarded the train (B), the station where the bicyclist exited the train (C), and the final destination of the bicyclist (D). See Figure 1 for an illustration. The surveyor also collected the mode (e.g., walk, bike, bus, etc.) that the bicyclist took to get from the origin to the train station (A-B) and from the train station to the destination (C-D). Finally, bicyclists were asked how they would travel between their origin and destination (A-D) if they didn t have their bike and couldn t take the train. Appendix A includes the survey instruments. The same information was collected of boarding bicyclists and alighting bicyclists. Note that to collect comparable data from boarding and alighting bicyclists, the survey instrument for the boarding bicyclists had to be worded slightly differently and have a different question order than the survey instrument for the alighting bicyclists. To improve the chances of collecting more accurate information, the surveyors recorded the bicyclists answers, rather than having bicyclists fill out the forms themselves. Spanish-speaking surveyors were assigned to stations where high numbers of Spanish-speaking riders were expected, and all surveyors were given Spanish surveys in addition to English surveys. Figure 1: Schematic of Bicycle-Rail Trip Surveyors The Los Angeles County Bicycle Coalition (LACBC) recruited volunteer surveyors. They had previous experience in spearheading the 2009 City of Los Angeles Bicycle and Pedestrian Count project, and have the ability to mobilize a large amount of volunteers to conduct surveys and pedestrian counts simultaneously at several locations. LACBC used their weekly newsletter, which was sent out to their membership database, as well as to approximately 6,000 Los Angeles area residents/cyclists, to recruit volunteer surveyors for the project. In addition, LACBC posted this request on their Facebook page and sent out special volunteer opportunity s to their members who have previously volunteered. Volunteers were allowed to choose the locations and times with which they volunteered based on where they lived and their schedule. However, in some cases, volunteers were requested to conduct their surveys in areas where there were gaps in the planned schedule. LACBC conducted a volunteer training session, which included Metro s rail safety training course. During the training session, LACBC conducted the following: Los Angeles County Metropolitan Transportation Authority June
18 Bicycle-Rail Trip Analysis and Greenhouse Gas Emissions Reduction Focused Study Described the purpose of the study; Reviewed the count and survey forms; Demonstrated a survey being taken in front of the volunteers; Led the volunteers to role play in taking and administering the survey; Provided instructions on the submittal of completed count and survey forms; and Provided contact information for LACBC volunteer coordinators. Counts During the same time periods that surveys were collected, the number of bicyclists exiting and entering the stations and the number of bicycles parked at the station were counted. Entering and exiting bicyclists were counted in fifteen-minute intervals, and parked bicycles were counted at the beginning and end of the count time. Station Selection Bicyclists were intercepted and counted at twenty Metro Rail stations (see Figure 1), representing 29% of all rail stations on the Metro Red, Purple, Gold, Blue, and Green Lines. Bus Rapid Transit stations (Metro Orange and Silver Lines) were not included in this analysis. When selecting the stations, the following guidelines were used: 9 1. All end-of-line stations were selected to capture people who might bicycle from outside Metro s service area to an end-of-line station. 2. Stations with generally higher ridership, and therefore perceived higher bicycle usage were prioritized. 3. All vehicle and bicycle parking facilities were represented (e.g. bicycle lockers, bicycle racks, pay parking, free parking, no parking). 4. Some mid-line stations were selected for geographical distribution. Within these parameters, stations were selected randomly. Table 1 lists the selected stations, the motor vehicle and bicycle parking status, and the location of the station within the transit network (i.e., whether a station is end of line or not). 9 Geographical distribution and bicycle amenities were taken into consideration in an effort to obtain results from a variety of metropolitan living conditions, which would influence a person s usage of this mode-choice. Los Angeles County Metropolitan Transportation Authority June

19 Bicycle-Rail Trip Analysis and Greenhouse Gas Emissions Reduction Focused Study Figure 2: Map of Survey Stations Station Line(s) Table 1: Stations Selected for Counts and Surveys Free Parking Racks Only Racks and Lockers End of Line Transfer Station Notes North Hollywood Red x x x High-use Vermont/Santa Monica Red x High-use, Mid-line Wilshire/Vermont 1 Purple/Red x x x Mid-line Wilshire/Western Purple x x Westlake/MacArthur Purple/Red Park x Sierra Madre Villa Gold 3 x x x High-use, Mid-line Los Angeles County Metropolitan Transportation Authority June
20 Bicycle-Rail Trip Analysis and Greenhouse Gas Emissions Reduction Focused Study Station Line(s) Free Parking Racks Only Racks and Lockers Highland Park Gold 3 x End of Line Transfer Station Notes High-use, Mid-line Mariachi Plaza Gold 3 x Mid-line Atlantic Gold 3 x x x 7th St/Metro Center 2 Blue/Red/ Purple x High-use Grand Blue Mid-line Florence Blue x X Mid-line Imperial/Wilmington 2 Blue x x x High-use, Mid-line Del Amo Blue x x Mid-line 1st Street 1 Blue x x Norwalk Green x x x High-use Crenshaw Green x x Mid-line Aviation/LAX Green x x High-use Redondo Beach Green x x x 1. These stations offer free parking but provide patrons the option to pay for a reserved parking spot. 2. Only bicyclists on the Metro Blue Line were intercepted. 3. Includes both the Pasadena and Eastside Extension Lines. Days and Times Surveys and counts were conducted over the three-week period spanning from Tuesday, May 11, 2010 to Saturday, May 29, To avoid skewing results, data were not collected on Bike to Work Day (Thursday, May 14, 2010). Data were collected at each station three times: during both weekday morning (6:00 a.m. to 10:00 a.m.) and evening commute hours (4:00 p.m. to 8:00 p.m.) and once on the weekend (10:00 a.m. to noon). Weekday count and survey windows include times during which bicyclists are allowed to take their bike on the train, in addition to the times when bicyclists are restricted from taking their bike on the train. There are no restrictions during the weekend. Weather was fair on all the days counts were collected. Table 2 summarizes the data collection days and times, and lists the times that bicycles are restricted on trains. Table 2: Data Collection Days and Times Days Times Bicycle Restrictions Weekday Morning (Tues, Wed, or Thurs) 6 a.m. to 10 a.m. Bikes restricted on trains from 6:30 a.m. to 8:30 a.m. Weekday Evening (Tues, Wed, or Thurs) 4 p.m. to 8 p.m. Bikes restricted on trains from 4:30 p.m. to 6:30 p.m. Weekend Saturday or Sunday 10 a.m. to noon No restrictions in place. Los Angeles County Metropolitan Transportation Authority June
21 Bicycle-Rail Trip Analysis and Greenhouse Gas Emissions Reduction Focused Study Results Overview of Data Collected Surveyors collected 710 surveys at 19 stations. Fifteen percent of the collected surveys were Spanish. Over two thousand (2,305) bicyclists were counted entering or exiting the selected stations. Not every counted cyclist was surveyed. Survey rates were as low as 3 percent, and as high as 100 percent between the 19 stations. Stations with lower bicycle counts had better sample rates (see Table 3). Since bicyclists were intercepted in the middle of their journey, there were occasions when not all information was collected before a bicyclist needed to catch a train or ride away from the station. Of the 710 survey responses received, 605 or 85 percent had at least one origin or destination address. The analysis in this report only uses the 605 surveys with origin or destination data. Of these 605 surveys, 106 had origin addresses only, 65 had destination addresses only, and 434 surveys had addresses for both origin and destination. As shown in Table 4, a total of 2,305 bicyclists were counted entering or exiting the twenty sampled stations, with 909 bicyclists counted during the weekday morning period, 1,053 bicyclists counted during the weekday evening period, and 343 bicyclists counted during the weekend midday period. Table 4 shows the average number of bicyclists counted per hour at each station. On average, 12.9 bicyclists were counted every hour at the 19 stations during the weekday peak hours. This is equivalent to one bicyclist every five minutes. During the weekend peak, an average of 10.1 bicyclists were counted every hour at 17 of the 19 stations approximately one every six minutes. 10 Transfer stations Imperial/Wilmington, 7 th St/Metro Center, and Wilshire/Vermont had the highest bicycle counts of any station, with weekday averages of 35.9, 32.9 and 24.0 bicyclists counted per hour, respectively. Despite having excellent bicycle access via the Metro Orange Line bicycle path, North Hollywood saw lower than average hourly bicycle counts. Though Mariachi Plaza, on the Metro Gold Line, saw the lowest weekday hourly bicycle counts of all the stations, surveyors observed many bicyclists using the bus adjacent to the station, rather than taking the train, underscoring the fact that these counts may not be indicative of bicycle use on the Metro Bus system. 10 Bicycle counts were not recorded at two of the 19 stations during the weekend because the counts were not turned in despite repeated follow-up with volunteers (see Table 3). Los Angeles County Metropolitan Transportation Authority June
22 Bicycle-Rail Trip Analysis and Greenhouse Gas Emissions Reduction Focused Study Table 3: Number of Surveys Collected and Number of Bicyclists Counted Station Line(s) Number of Surveys Collected Counts Percent of Bicyclists Surveyed* Weekday Morning Weekday Evening Weekend Midday Weekday Morning Weekday Evening Weekend Midday Weekday Morning Weekday Evening 1st Street Blue 4 6 no data % 40% n/a 7th St/Metro Center Blue % 11% 15% Atlantic Gold % 31% 58% Aviation/LAX Green % 19% 36% Crenshaw Green % 27% 33% Del Amo Blue % 30% 23% Florence Blue no data 46% 18% n/a Grand Blue % 61% 47% Highland Park Gold no data % 43% n/a Imperial/Wilmington Blue no data no data n/a n/a 26% Mariachi Plaza Gold 3 1 no data % 25% n/a North Hollywood Red % 58% 13% Norwalk Green % 27% 47% Redondo Beach Green % 19% 50% Sierra Madre Villa Gold % 26% 92% Vermont/Santa Monica Red % 46% 5% Westlake/MacArthur Park Red no data % 25% n/a Wilshire/Vermont Red/Purple % 40% 36% Wilshire/Western Purple no data 36% 52% n/a Weekend Midday Total *Represents the number of bicycles surveyed compared to the number of bicycles counted entering/exiting the station. No data refers to locations for which there is no data available, typically because the count and survey forms were not turned in despite repeated follow-up. Los Angeles County Metropolitan Transportation Authority June
23 Bicycle-Rail Trip Analysis and Greenhouse Gas Emissions Reduction Focused Study Table 4: Bicycle Count Data Summary Weekday Weekend Station Line Total Count Hourly Average Total Count Hourly Average Notes* Imperial/Wilmington Blue TS, ML, HU 7th St/Metro Center Blue TS, HU Wilshire/Vermont* Red/Purple TS, ML Florence Blue no data n/a ML Norwalk Green EOL, HU Crenshaw Green ML Westlake/MacArthur Park Purple/Red HU, ML Del Amo Blue ML Aviation/LAX Green HU Wilshire/Western Purple no data n/a EOL Grand Blue ML North Hollywood Red EOL, HU Highland Park Gold ML, HU Sierra Madre Villa Gold EOL Vermont/Santa Monica Red HU, ML Redondo Beach Green EOL Atlantic Gold EOL 1st Street Blue EOL Mariachi Plaza Gold ML Total 1, By Line Metro Blue Line Metro Red/Purple Line Metro Green Line Metro Gold Line *Station type represented by EOL end of line, TS transfer station, ML mid-line, and HU high-use. **Wilshire/Vermont counts as two stations. No data refers to locations for which there is no data available. Peak Hour Use Bicyclists peaking patterns roughly follow those of all Metro riders, but do show distinct differences. As shown in Figure 3, bicyclist use peaks before and after the weekday bicycle use restrictions, but shows the highest peak during the peak hour restriction. See Appendix C for a chart comparing overall Metro Rail peaking to bicyclist peaking. Los Angeles County Metropolitan Transportation Authority June
24 Bicycle-Rail Trip Analysis and Greenhouse Gas Emissions Reduction Focused Study Figure 3: Bicycle Peaking Patterns Boarding and Alighting Bicyclists were asked to identify the station where they began their bicycle-rail trip, and the station at which they would end their trip. As shown in Table 5, bicyclists are universally using the Metro Rail system, with bicyclists reporting starting or ending their rail trip at 71 out of 73 Metro Rail stations (97 percent). Surveyors observed bicyclists using the bus parallel to the Gold Line, rather than the Gold Line. Appendix B lists the boarding and alighting stations, sorted by line. Table 5: Bicyclist Boardings and Alightings by Line Number of Stations on Line Number of Stations Where Bicyclists Boarded or Alighted Percent of Stations Represented Metro Red Line / Purple Line % Metro Blue Line % Metro Green Line % Metro Gold Line % Total % Los Angeles County Metropolitan Transportation Authority June
25 Bicycle-Rail Trip Analysis and Greenhouse Gas Emissions Reduction Focused Study Mode To or From Station Bicyclists were asked to identify which modes they took to or from a station by choosing from a list of options. All of the 605 respondents answered the question, resulting in responses for 1,210 trips, as shown in Table 6. Not surprisingly, bicycling was the primary mode, with bicycle-only trips representing 81 percent of all trips (979 trips). Bicycle-transit trips were the next highest mode, representing 8% of all trips (92 trips). Table 6: Mode Traveled to or From Station Mode Total Trips Percentage Biked % Walked % Drove alone 6 0.5% Dropped off 6 0.5% Carpooled 3 0.2% Bus % Linked Trips % Biked & Bus % Biked & Train/Subway/Light Rail % Train/Subway/Light Rail % Biked & Train/Subway/Light Rail & Bus % Biked & Walked 6 0.5% Train/Subway/Light Rail & Bus 3 0.2% Biked & Walked & Bus 1 0.1% No mode stated 6 0.6% Total 1, % Trip Purpose Respondents were asked to report generally where they were coming from and going to their trip purpose. Choices included the following: Work; Store, restaurant, movies, or other shopping and entertainment; Family or friend's house; Home; Doctor, dentist, or other personal business; or Other (write-in field). Los Angeles County Metropolitan Transportation Authority June
26 Bicycle-Rail Trip Analysis and Greenhouse Gas Emissions Reduction Focused Study Many of the write-in answers were school-related, or could be categorized as one of the other trip purposes. This is reflected in Table 7 and Table 8. The trip purpose varies by time of day and indicates that many of the respondents are using Metro Rail for work-related commuting. Respondents generally follow commuter trends, with 90 percent of respondents starting their weekday morning trip at home and 65 percent of respondents ending their weekday morning trip at work. Similarly, 54 percent of respondents started their weekday evening trip at work and 66 percent of respondents ended their weekday evening trip at home. During the weekend, these trends are less pronounced. Table 7: Purpose of Trip: Start of Trip to Station, by Time Period Start of trip Weekday Morning Weekday Evening Weekend Midday Doctor, dentist, or other personal business 0% 3% 0% Family or friend's house 1% 6% 9% Home 90% 22% 73% Store, restaurant, movies, or other shopping and entertainment 1% 5% 6% Work 5% 54% 8% School 1% 7% 1% Other 0% 2% 4% Total 100% 100% 100% Out of 596 respondents who answered question. Totals may not add up to 100% due to rounding. Table 8: Purpose of Trip: End of Trip from Station, by Time Period End of trip Weekday Morning Weekday Evening Weekend Midday Doctor, dentist, or other personal business 5% 1% 3% Family or friend's house 4% 10% 20% Home 8% 66% 20% Other 5% 4% 14% School 11% 4% 0% Store, restaurant, movies, or other shopping and entertainment 2% 5% 24% Work 65% 10% 20% Total 100% 100% 100% Out of 601 respondents who answered question. Mode Shift Travel mode refers to the way in which people travel bicycling, walking, driving alone, carpooling, taking the bus, and taking a train are all modes of travel. Mode shift refers to when people shift from one travel mode to another. This study is primarily concerned with whether survey respondents would Los Angeles County Metropolitan Transportation Authority June
27 Bicycle-Rail Trip Analysis and Greenhouse Gas Emissions Reduction Focused Study shift from biking to driving, carpooling or getting dropped off if biking wasn t an option. Integrating bicycle and pedestrian facilities with transit facilities provides a higher multimodal level of service than transit or bicycle/pedestrian facilities alone, allowing travelers to switch more easily between modes and use more than one non-auto mode per trip. The ability to mode-shift is a part of the overall philosophy of sustainable and livable community strategies. To understand this, respondents were asked how they would make their trip if they couldn t use their bicycle. This question was asked three ways: 1. If you didn't have your bike, how would you get from your origin to the first station? 2. If you didn't have your bike, how would you get from the second station to your destination? 3. If you didn't have your bike and couldn't take a train, how would you get from your origin to your destination? Respondents were asked to choose from a list of answers, and could choose more than one answer. Responses are summarized in Table 9, Table 10 and Table 11, below. Trips To and From the Station The answers to the first two questions were very similar. As shown in Figure 4, if respondents couldn t bicycle to or from the train station, between 42 and 43 percent would switch to walking and between 35 to 36 percent would switch to taking the bus. Only 8 percent of respondents would switch to driving alone, carpooling or getting dropped off. Three to 4 percent said they would not make the trip if they couldn t bicycle. Trips from Origin to Destination Responses to the third question were dramatically different, and showed more mode shift toward private motor vehicles and an increased percentage of respondents who would not make the trip at all. As shown in Figure 5, when respondents were asked about how they would get from their origin to their destination if they couldn t ride their bike and take the train, 18 percent would switch to walking and 40 percent would switch to taking the bus. Over a quarter, 27 percent, would shift to private motor vehicles (18 percent drive alone, 5 percent carpool and 4 percent dropped off). Thirteen percent would not make the trip if they couldn t bicycle and take the train, indicating that the bike-rail mode provides significant mobility benefits. Los Angeles County Metropolitan Transportation Authority June
28 Bicycle-Rail Trip Analysis and Greenhouse Gas Emissions Reduction Focused Study Table 9: If you didn't have your bike, how would you get from your origin to the first station? Mode to Which Respondents Would Switch Number Percent Walk % Bus % Drive Alone 55 8% Train/Subway/Light Rail 32 4% Carpool 19 3% Drop off 18 2% Other 13 2% Would not make the trip 24 3% Total 719 Respondents could choose more than one answer. Table 10: If you didn't have your bike, how would you get from the second station to your destination? Mode to Which Respondents Would Switch Number Percent Walk % Bus % Drive Alone 57 8% Train/Subway/Light Rail 35 5% Drop off 15 2% Carpool 13 2% Would not make the trip 28 4% Total 717 Respondents could choose more than one answer. Los Angeles County Metropolitan Transportation Authority June
29 Bicycle-Rail Trip Analysis and Greenhouse Gas Emissions Reduction Focused Study Table 11: If you didn't have your bike and couldn't take a train, how would you get from your origin to your destination? Mode to Which Respondents Would Switch Number Percent Bus % Drive Alone % Walk % Carpool 37 5% Drop off 33 4% Other 14 2% Train/Subway/Light Rail 10 1% Would not make the trip 97 13% Total 768 Respondents could choose more than one answer. Figure 4: Responses to the Question: If you didn t have your bike, how would you get from your: (A) origin to first station, and (B) second station to destination Los Angeles County Metropolitan Transportation Authority June
30 Bicycle-Rail Trip Analysis and Greenhouse Gas Emissions Reduction Focused Study Figure 5: Responses to the Question: If you didn t have your bike and couldn t take a train, how would you get from your origin to your destination? Access to a Motor Vehicle Respondents were asked if they had access to a motor vehicle. Respondents are very transit-dependent, with over a third of respondents (37 percent) stating that they never have access to a motor vehicle and 11 percent of respondents stating that they rarely have access to a motor vehicle, as shown in Table 12 and in Figure 6. Twenty-three (23) percent of respondents sometimes have access to a motor vehicle and 30 percent always have access to a motor vehicle. Table 12: How often do you have access to a motor vehicle? Level of Access Number Percent Always % Sometimes % Rarely 60 11% Never % Total % Never 37% Rarely 11% Always 30% Sometimes 22% Figure 6: Responses to the Question: How often do you have access to a motor vehicle? Los Angeles County Metropolitan Transportation Authority June
31 Bicycle-Rail Trip Analysis and Greenhouse Gas Emissions Reduction Focused Study Reasons for Choosing the Bike-Rail Option Respondents were asked the question, Of the following choices, which ones influenced your decision to ride your bike to the train today, rather than walk, drive or take the bus? and were provided a list of choices from which to choose: Allowed to take bike on train (65% of respondents) No car parking at station (4% of respondents) Good bike facilities on the way to the station (4% of respondents) Bike racks at the station (3% of respondents) Bike lockers at the station (3% of respondents) Have to pay for car parking at the station (3% of respondents) None of the above (32% of respondents) Table 13 presents the percentages of survey respondents who identified which factor(s) influenced their decision to travel by bike and rail. Survey respondents overwhelmingly said that being allowed to take their bike on the train influenced their decision to travel by bike and rail. Of the 477 people who responded to the question, 65 percent chose allowed to take bike on train as a factor that influenced their decision. Thirty-two percent of respondents indicated that none of the given reasons influenced their decision to use their bike and rail, suggesting that there may be other factors besides bike access on trains, bike parking, motor vehicle parking, and bicycle facilities that influence a person s decision to travel by bike and rail. When looking at responses broken down by access to a motor vehicle, a slightly different picture emerges. Respondents with access to a motor vehicle are more likely to cite allowed to take bike on train, no car parking at station, bike lockers at station, and have to pay for car parking at station as factors that influenced their decision to bicycle. Respondents without access to a motor vehicle are slightly more likely to cite good bicycle facilities on the way to station as a factor that influenced their decision to bicycle, and are much more likely to state that none of the given choices influenced their decision to bicycle. Likely, not having access to a car was a major reason why these respondents chose to bicycle, though this was not included in the list of choices. It should be noted that at many stations, bicyclists were intercepted on the station platform, rather than outside the station. It is likely that bicyclists who were parking their bicycle outside the station were under-represented in the sample. These bicyclists may rate bicycle parking, motor vehicle parking, or bike facilities differently, compared to the bicyclists that we intercepted on the platform. Los Angeles County Metropolitan Transportation Authority June
32 Bicycle-Rail Trip Analysis and Greenhouse Gas Emissions Reduction Focused Study Table 13: Factors Influencing a Person's Decision to Travel by Bike and Rail Number of Responses Percent of Total Percent for those who have access to a car "always" or "sometimes" Percent for those who have access to a car "never" or "rarely" Allowed to take bike on train % 72% 57% No car parking at the station 19 4% 5% 2% Good bike facilities on the way to the station 17 4% 3% 4% Bike racks at the station 15 3% 3% 3% Bike lockers at the station 12 3% 3% 1% Have to pay for car parking at the station 12 3% 4% 0% None of the above % 23% 42% Total respondents who answered question Respondents could select more than one answer, so percentages do not add up to 100%. Breakdown by access to car does not include 3 respondents who did not answer the access to car question. Demographics Respondents were overwhelmingly male. Of the 566 bicyclists who indicated their gender, 86 percent were male, and 14 percent were female. This is consistent with the data collected through the 2009 City of Los Angeles Bike Count, which found only 15% of bicyclists counted were female. However, women typically represent between 25 and 30 percent of bicyclists rather than the 14 percent found by this study, suggesting that there may be ways that Metro can increase the percentage of women using the bike-rail mode. 11 Of the 566 bicyclists who stated their age, nearly half (48%) were between the ages of 18 to 29, and over a quarter (27%) were between the ages of 30 and 39. This too, is typical of other bicycle intercept surveys, which show that bicyclists tend to be younger than the general population. Figure 7 illustrates the gender and age breakdowns for the intercepted bicyclists. 11 The Seamless Travel Study by U.C. Berkeley s Safe Transportation Research and Education Center (2010) conducted intercept surveys of 212 bicyclists at 25 locations throughout San Diego County and found a gender breakdown of 68% male, 32% female. The San Francisco State of Cycling Report Card (2008) conducted intercept surveys of bicyclists and found a gender breakdown of 73% male, 23% female. Portland, Oregon, which has constructed an extensive network of bicycle facilities over the last decade and has an outreach program targeted to women bicyclists, has seen the percentage of female bicyclists increase to 32% as of Los Angeles County Metropolitan Transportation Authority June
33 Bicycle-Rail Trip Analysis and Greenhouse Gas Emissions Reduction Focused Study 14% 86% Male Female 7% 3% 18 to 29 years 14% 48% 27% 30 to 39 years 40 to 50 years 51 to 60 years 61+ years Figure 7: Gender and Age Breakdown of Survey Respondents Reductions in Vehicle Miles Traveled To estimate the amount of VMT and GHG emissions a bicycle-train trip offsets, one must answer at least two questions. First, how far is the total bicycle-train trip, from the origin to the destination? Second, did this trip replace a motor vehicle trip? This section calculates vehicle miles traveled for those bicyclists who indicated that they would switch to driving, carpooling or getting dropped off. This section begins with an estimate of the total system-wide bicycle use, which is extrapolated from the bicycle counts collected during the study using Metro Rail ridership data for FY It continues with description of how distances traveled by bicyclists were calculated based on the origin and destination locations reported by the intercepted bicyclists, and concludes with an estimate of the annual motorvehicle miles replaced by bicycle-rail trips. Bicycle Use Estimates Mariachi Plaza and Atlantic Stations were not in operation in FY 2009, and, therefore, are not used in the calculations. Accordingly, only 17 of the 19 stations were sampled for the weekday and only 15 of the 19 stations for the weekend. 13 Table 14 estimates the total annual bicycle ridership on Metro Rail by extrapolating the bicycle trips recorded during the count periods at the sample stations to represent daily, weekly and annual bicycle trip numbers. These were then expanded to represent bicycle trips at all stations. The extrapolations use ratios based on Metro Rail ridership information for FY Table 14 first estimates the daily weekday trips projected from weekday morning counts (Item A) and projected from weekday evening counts (Item B). It then averages these two counts to come up with the daily weekday bicycle trips (Item C). Annual weekday trips (Item D) are then calculated by applying the ratio of weekday trips/annual weekday trips. The same is conducted for weekend trips with daily weekend trips projected from weekend counts (Item E). These are then extrapolated using the ratio of 12 This methodology was developed specifically for this study but was based on the standard methodology of extrapolating annual traffic counts from peak hour counts. 13 Bicycle counts were not recorded at two of the 19 stations during the weekend. With two other stations not in operation in FY2009, only 15 stations were sampled for the weekend. Los Angeles County Metropolitan Transportation Authority June
34 Bicycle-Rail Trip Analysis and Greenhouse Gas Emissions Reduction Focused Study weekend trips/annual weekend trips to get annual weekend trips (Item F). Annual bicycle trips (Item G) are then calculated by summing the annual weekday and weekend trips. Appendix C includes ridership calculations for the 17 stations which were in operation in FY2009. Annually, there are approximately 1,194,200 bicycle trips taken on the Metro Rail system, representing 1.3 percent of all annual trips. 14 Table 14: Estimated Annual Bicycle Trips for the Metro Rail System Count Stations* All Stations** Calculation Notes*** A. Daily Weekday Bicycle Trips Projected from 6 a.m. to 10 a.m. counts 1,693 3,937 Weekday boardings and alightings counted between 6 a.m.-10 a.m. (see Table 3) divided by 2 to get trips, divided by.268 (i.e. the ratio of 6 a.m.- 10 a.m. weekday ridership to 24-hour weekday ridership) B. Daily Weekday Bicycle Trips Projected from 4 p.m. to 8 p.m. counts C. Daily Weekday Bicycle Trips 1,651 3,840 Weekday boardings and alightings counted between 4 p.m.-8 p.m. (see Table 3) divided by 2 to get trips, divided by.319 (i.e. the ratio of 4 p.m.- 8 p.m. weekday ridership to 24-hour weekday ridership) 1,672 3,888 Average of A and B D. Annual Weekday Bicycle Trips E. Daily Weekend Bicycle Trips Projected from 10 a.m. to noon counts F. Annual Weekend Bicycle Trips E. Annual Bicycle Trips (including weekday, weekend, and holidays) 426, ,552 Daily weekday trips (C) divided by.004 (i.e. the ratio of daily weekday transit trips to annual weekday transit trips) 1,468 3,698 Weekend boardings and alightings counted between 10 a.m.-noon (see Table 3) divided by 2 to get trips, divided by.117 (i.e. the ratio of 10 a.m.-noon weekend ridership to 24-hour weekend ridership) 80, ,613 Daily weekend trips (E) divided by.018 (i.e. the ratio of daily weekend transit trips to annual weekend transit trips) 506,729 1,194,165 Annual weekday bicycle trips (D) plus annual weekend bicycle trips (F) Notes (Table 14): *Weekday counts include data at 17 stations. Weekend counts include data at 15 stations. **All station estimates are based on the total ridership ratio between the 17 weekday count stations (15 weekend count stations) and all stations. These ratios are calculated for the weekday as (i.e. 62,062,071 riders per year at the 17 count stations compared to 147,586,879 riders per year at all stations) and for the weekend as (i.e. 14,464,796 riders per year at the 15 count stations compared to 38,250,173 riders per year at all stations). A factor is also applied to account for the fact that two stations were not in operation in FY2009: Mariachi Plaza and Atlantic, both on the Metro Gold Line. A factor of 2.2% was applied on the weekday and 4.95% on the weekend, representing the percentage of riders counted at these stations (see Table 3). ***Ratios are based on Metro Rail ridership information for FY In FY 2009, the Metro rail system recorded 185 million boardings and alighting, which equates to approximately 92.9 million trips (a trip equals one boarding and one alighting). Los Angeles County Metropolitan Transportation Authority June
35 Bicycle-Rail Trip Analysis and Greenhouse Gas Emissions Reduction Focused Study Distance Traveled Using the nearest cross-streets to the origins and destinations as reported by bicyclists, the authors calculated the shortest distance between points using Geographic Information Software (GIS) and a map of surface streets for Los Angeles County. Distance was calculated for each trip to or from a station (A to B and C to D), as well as for the hypothetical trip between origin and destination (A to D) (see Figure 8). Figure 8: Schematic of Distance Calculations for Origin to Destination The process of mapping origin and destination points is sensitive to the accuracy of the street names, and for this reason, only a subset of origin and destination points could be mapped. Within the time-frame of the study, unmapped cross-streets were reviewed and manually located on the map. Distance To or From the Station Of the 605 surveys with address information, 106 had origin addresses only, 65 had destination addresses only, and 434 surveys had addresses for both origin and destination. This works out to 1,039 trips to or from a station, of which distance could be calculated for 1000 trips, or 96 percent. The remaining 4 percent contained addresses that could not be located on the map. Table 15 summarizes the distance traveled to or from station by mode. On average, bicyclists traveled 2.2 miles to access a station. Respondents who bicycled and took the bus traveled an average of 4.9 miles to access a station. Respondents using motor vehicles traveled the farthest to access a station. Table 15 summarizes the distance traveled to or from a station by mode. Table 15: Distance Traveled to or From Station by Mode Mode To or From Station Average Miles per Trip Max Miles Reported Total Trips Biked Walked Drove alone Dropped off Carpooled Los Angeles County Metropolitan Transportation Authority June
36 Bicycle-Rail Trip Analysis and Greenhouse Gas Emissions Reduction Focused Study Mode To or From Station Average Miles per Trip Max Miles Reported Total Trips Bus Metrolink Linked Trips (Average) Biked & Bus Biked & Train/Subway/Light Rail Train/Subway/Light Rail Biked &Train/Subway/Light Rail & Bus Biked & Walked Train/Subway/Light Rail & Bus Biked & Walked & Bus No mode stated Distance from Origin and Destination Of the 434 surveys that included both origin and destination addresses, distance was only calculated for the 114 respondents who indicated that they would switch to driving, carpooling or getting dropped off if they couldn t bicycle and take the train. Distance was calculated by using GIS to map the shortest route between the origin address and the destination address along surface streets. Average distance of an origin-destination trip along surface streets is miles. Vehicle Miles Avoided Vehicle miles avoided are calculated for the length of the total bicycle-rail trip from origin to destination (A to D) (see Figure 8). Respondents were asked how they would have made the entire trip, from their origin to their destination (A to D), if they couldn t take their bike and the rail. Twenty-seven percent indicated that they would shift from their bicycle-rail trip to driving alone, carpooling or being dropped off. Applying this percentage to the estimated total bicycle-rail trips translates to the reduction of 322,425 motor vehicle trips each year. The average distance of a shifted bicycle-rail trip is miles. Applying this to the reduced motor vehicle trips yields the reduction of just under 4 million motor-vehicle miles each year, as presented in Table 16. Table 16: Vehicle Miles Reduced by Combined Bicycling/Rail Trips 1 Total annual estimated system-wide bicycle-rail trips (Table 14) 1,194,165 2 Percent of trips that would be replaced by motor vehicle trip (Table 11) 27% 3 Total number of trips that would be replaced by a motor vehicle trip (line 1 x line 2) 322,425 4 Average distance per shifted trip (miles) Total Annual Motor Vehicle Miles Avoided (line 3 x line 4) 3,957,422 Los Angeles County Metropolitan Transportation Authority June
37 Bicycle-Rail Trip Analysis and Greenhouse Gas Emissions Reduction Focused Study Estimated Greenhouse Gas Emissions Reduction Reductions in VMT will have the co-benefit of reducing mobile-source air pollutant emissions, which include greenhouse gas (GHG) emissions, criteria pollutant emissions, and air toxics emissions. All of these are regulated in California with the last two being regulated by the United States Environmental Protection Agency. Including a discussion of the emissions mentioned above will convey the entire spectrum of regulated air quality emissions. A key issue related to GHG emissions is that vehicular travel contributes significantly to overall emissions. Statewide, transportation emissions from vehicles generate over one-third of overall emissions. At a municipal level, transportation may contribute more than 50 percent to citywide or countywide emissions 15. The South Coast Air Basin (Basin) currently fails to meet national ambient air quality standards (NAAQS) for three criteria pollutants: ozone (O 3 ), inhalable particulates (PM 10 ) and fine particulates (PM 2.5 ). The 1990 amendments to the federal Clean Air Act identify specific emission-reduction goals for areas such as the Basin that do not meet NAAQS. Within the Basin, automobile exhaust comprises the largest source of O 3 precursor emissions reactive organic compounds (ROC) and nitrogen oxides (NO X ). With respect to air toxics, the South Coast Air Quality Management District (SCAQMD) has recently completed the Multiple Air Toxics Exposure Study III (MATES III), which was an ambient air monitoring and evaluation study conducted in the Basin. The MATES III study concluded that the average carcinogenic risk throughout the Basin attributed to toxic air contaminants is approximately 1,194 in one million. Mobile sources (e.g., cars, trucks, trains, ships, aircraft, etc.) represent the greatest contributor to inhalation cancer risk. Bicycle-rail trips, by reducing automobile travel, improve sustainability and livability by reducing GHG, criteria pollutant and mobile-source air toxics (MSAT) emissions. This section develops air pollutant reduction estimates and relates those estimates to annual vehicle offsets. Senate Bill 375 Senate Bill 375 enhances California s ability to reach its AB 32 goals by promoting good planning with the goal of more sustainable communities. Per the law, the California Air Resources Board (ARB) developed regional greenhouse gas emission reduction targets for passenger vehicles, which account for a third of the states greenhouse gas emissions, during September ARB established targets for 2020 and 2035 for each region covered by one of the State s 18 metropolitan planning organizations (MPOs). Each of California s MPOs must now prepare a sustainable communities strategy (SCS) that demonstrates how the region will meet its greenhouse gas reduction target through integrated land use, housing and transportation planning. Once adopted by the MPO, the SCS will be incorporated into that region s federally enforceable regional transportation plan (RTP). ARB is also required to review each final SCS to determine whether it would, if implemented, achieve the greenhouse gas emission reduction target for its region. If the combination of measures in the SCS will meet the region s target, the MPO must prepare a separate alternative planning strategy (APS) to meet the target. 15 CoolCalifornia.org, Green L.A.: Climate Action Plan to Lead Nation, accessed January 5, Los Angeles County Metropolitan Transportation Authority June
38 Bicycle-Rail Trip Analysis and Greenhouse Gas Emissions Reduction Focused Study On June 30, 2010, ARB, with cooperation from a technical working group formed of MPO staff members, released its Draft Regional Greenhouse Gas Emission Reduction Targets for Automobiles and Light Trucks Pursuant to Senate Bill 375. In the draft report, the Southern California Association of Governments (SCAG), the MPO for the project area, agreed to preliminary per capita reduction targets of 8% and 13% at years 2020 and 2035, respectively, compared to base year 2005 per capita emissions levels. These official reduction targets were adopted by ARB on September 23, Methodology Vehicle emission volumes are determined by several factors, including the types of vehicles in circulation, how often they are started and stopped, how they are driven (speed distribution profile), and how far they are driven (VMT). The Caltrans Emissions Factors model (CT-EMFAC) was used to estimate GHG, criteria pollutant, and MSAT emissions reductions, based on the VMT reduction estimates derived from the survey results. CT-EMFAC is a California-specific project-level analysis tool, which models the GHG constituent pollutant carbon dioxide (CO 2 ), as criteria pollutant and MSAT emissions using the latest version of the California Mobile Source Emission Inventory and Emission Factors model (EMFAC2007). The model was developed by UC Davis, in coordination with Caltrans and the California Air Resources Board (CARB), and is the Caltrans preferred model for quantification of mobile-source GHG emissions. Emissions rates vary by vehicle speed, and as a result, the ratio of air pollutant emissions generated per mile is not a flat rate. This estimate reflects the diversity of vehicle speeds based on the year 2010 EMFAC2007 speed distribution profile for Los Angeles County. For GHG constituent emissions nitrous oxide (N 2 O) and methane (CH 4 ), average gram per mile emissions factors of and 0.016, respectively, were used to estimate emissions. 17 GHG emissions other than CO 2 are commonly converted into carbon dioxide equivalents, which takes into account the differing global warming potential (GWP) of different gases. For example, the Intergovernmental Panel on Climate Change (IPCC) finds that N 2 O has a GWP of 310 and methane has a GWP of 21. Thus, emissions of 1 ton of N 2 O and 1 ton of CH 4 are represented as the emissions of 310 tons and 21 tons of CO 2 equivalent (CO 2 e), respectively. This method allows for the summation of different GHG emissions into a single total. Combined Bicycle-Rail Use Emissions Reductions As stated earlier, bicyclists who use the Metro system to facilitate bicycle-rail trips result in an annual VMT reduction estimate of 3,957,422 miles. This would lead to a direct reduction in mobile-source emissions that include GHG emissions, criteria pollutant emissions, and MSAT emissions. Pollutant reduction estimates are provided below in Table California Air Resources Board, Draft CEQA Functional Equivalent Document (SCH# ) for Proposed Regional Greenhouse Gas Emission Reduction Targets for Automobiles and Light Trucks Pursuant to Senate Bill 375, August 9, 2010; California Air Resources Board, News Release: California Takes the First Step Toward More Livable, Sustainable Communities, September 23, 2010, accessed January 6, Derived by averaging the passenger vehicle emissions factors for years 2005 through 2008 provided in the Local Government Operations Protocol for the Quantification and Reporting of Greenhouse Gas Emissions Inventories, Version 1.1, May 2010, prepared by the California Air Resources Board. Los Angeles County Metropolitan Transportation Authority June
39 Bicycle-Rail Trip Analysis and Greenhouse Gas Emissions Reduction Focused Study Table 17: Emissions Reductions in Tons per Year Pollutant Emissions Reduction Estimate (Tons/Yr) GHG Emissions (Metric Tons) Carbon Dioxide (CO 2 ) 2,144 Nitrous Oxide (N 2 O) 9 Methane (CH 4 ) 1 CO 2 equivalent (CO 2 e) 2,154 Criteria Pollutant Emissions Reactive Organic Compounds (ROC) 1.1 Nitrogen Oxides (NO X ) 3.74 Carbon Monoxide (CO) Sulfur Dioxide (SO 2 ) 0.02 Inhalable Particulates (PM 10 ) 0.16 Fine Particulates (PM 2.5 ) 0.15 MSAT Emissions Diesel Particulate Matter Formaldehyde ,3-Butadiene Benzene Acrolein Acetaldehyde As shown above, bicyclists who use the Metro system to facilitate combined bicycle-rail trips would reduce GHG emissions by approximately 1,947 metric tons of CO 2 e per year. As a co-benefit, there would also be reductions in criteria air pollutants and MSAT emissions. Vehicle Offsets Another way to assess the benefits of the combined bicycle-rail trips is to measure the GHG emission reductions in a different context, namely vehicle offsets. On average, an automobile is driven 11,720 miles per year, producing 5.1 metric tons of CO 2 e 18. The mode shift generated by combined bicycle-rail trips would take the equivalent of about 422 automobiles off the road annually. Findings and Recommendations Findings This study indicates that bicyclists are a small but important subset of riders on the Metro Rail system, and bicycle-rail trips offset vehicle miles traveled resulting in quantifiable greenhouse gas emissions. The counts and extrapolated methodology mirrors commonly accepted practices in traffic analysis, with the exception of our small sample size. If a larger sample size were to validate our findings, then the following extrapolated numbers shows the potential for reducing VMT and GHGe: 18 United States Environmental Protection Agency, Greenhouse Gas equivalencies calculator ( May 31, Los Angeles County Metropolitan Transportation Authority June
40 Bicycle-Rail Trip Analysis and Greenhouse Gas Emissions Reduction Focused Study Approximately 1,195,000 bicyclists would use the Metro Rail system annually. (Which represents 1.3 percent of all annual trips.) Bicycle-rail trips would replace approximately 322,000 motor vehicle trips and reduce 3.96 million vehicle miles traveled each year, offsetting approximately 2,154 metric tons of carbon dioxide equivalents (CO 2e ) annually. This would be equivalent to taking 422 motor vehicles off the road. 19 Bicyclists are universally using the Metro Rail system, with bicyclists reporting starting or ending their rail trip at 71 out of 73 Metro Rail stations surveyed. Over a quarter (27 percent) of bicycle-rail trips replace a motor vehicle trip 20. In terms of getting to or from the station, twelve percent of bicycle trips replaced motor vehicle trips 21. On average, 13 bicyclists per hour one bicyclist every five minutes enters or exits a Metro train during the weekday morning or weekday evening peak periods. An average of 10 bicyclists per hour one every six minutes enters or exits a Metro train during the weekend midday period. This study provides data on the bikeshed of Metro Rail stations, and underscores the importance of increasing a bicyclists reach by providing for bicycles on transit. On average, bicyclists traveled 2.2 miles to access train travel (these distance are within the typical bicycling catchment area of a train station). Bicyclists taking the bus travel an average of 4.9 miles to access a station. Bicyclists are using the Metro system just as other Metro riders do. Respondents generally follow commute trends, with 90 percent of respondents starting their weekday a.m. trip at home and 65 percent of respondents ending their weekday a.m. trip at work. Similarly, 54 percent of respondents started their weekday p.m. trip at work and 66 percent of respondents ended their weekday p.m. trip at home. Accommodating bicyclists at rail stations and on trains provides mobility benefits. Thirteen percent of bicyclists would not make their trip if they couldn t bicycle and take the train. Respondents are more transit dependent than the general population, with 11 percent of respondents stating that they rarely have access to a motor vehicle and over a third of respondents (37 percent) stating that they never have access to a motor vehicle. In Los Angeles County, 9.4% of households do not have access to a motor vehicle. 22 Allowing bicycles on trains is a major reason why people choose to bicycle, particularly for riders who have access to a motor vehicle. 19 On average, an automobile is driven 11, 720 miles per year, producing 5.1 metric tons of CO 2 e. 20 Origin to final destination, or A to D trip. 21 Origin to train station, for example, A to B or B to C trip. 22 U.S. Census Bureau, American Community Survey 3-Year Estimates. Los Angeles County Metropolitan Transportation Authority June
41 Bicycle-Rail Trip Analysis and Greenhouse Gas Emissions Reduction Focused Study Survey respondents overwhelmingly said that being allowed to take their bike on the train influenced their decision to travel by bike and rail. Of the 477 people who responded to the question, 65 percent chose allowed to take bike on train as a factor that influenced their decision. Respondents with access to a motor vehicle are more likely than those without access to a motor vehicle to cite allowed to take bike on train, no car parking at station, bike lockers at station, and have to pay for car parking at station as factors that influenced their decision to bicycle. Women are much less likely to bicycle to a Metro Rail station than men. Respondents were mostly male (86 percent) and 75 percent were between the ages of 18 and 39. This percentage of female bicyclists is consistent with the data collected through the 2009 City of Los Angeles Bike Count, which found only 15% of bicyclists counted were female. In other California urban areas, women typically represent between 25 and 30 percent of bicyclists rather than the 14 percent found by this study, suggesting that there may be ways that Metro can increase the percentage of women using the bike-rail mode. 23 Recommendations Bicycle travel is a small but important part of travel on Metro's facilities. This study demonstrates the impact of bicycling at Metro's rail stations. This study provides empirical data on travel by bicycle on Metro s facilities. Use of this data and other similar data that may be collected in the future will be key to designing effective strategies to promote, sustain, and expand bicycle mode share across Metro s system. One way to assess the current and potential impact of bicycling is to compare GHG reductions from bicycle trips to GHG reductions from other alternative mode options and energy saving strategies. Metro's "Greenhouse Gas Emissions Cost Effectiveness Study" (June 2010) quantified costs for, among others, bicycle facilities and incentives to reduce GHGe: 1. The options presented in that report represent two distinct investment pilots, both of which were shown to reduce GHG emissions. The cost-effectiveness of bicycle programs could be improved substantially by exploring ways to achieve the same or higher increases in bicycling at lower cost to Metro 2. Bicycle programs provide a number of co-benefits beyond emission reductions including increased safety for bicyclists and pedestrians, health benefits from increases in physical activity, and generating higher ridership on Metro buses and trains. Dollars per ton of GHG reduced are among several key criteria to judge the benefits of bicycling on Metro facilities. 23 The Seamless Travel Study by U.C. Berkeley s Safe Transportation Research and Education Center (2010) conducted intercept surveys of 212 bicyclists at 25 locations throughout San Diego County and found a gender breakdown of 68% male, 32% female. The San Francisco State of Cycling Report Card (2008) conducted intercept surveys of bicyclists and found a gender breakdown of 73% male, 23% female. Portland, Oregon, which has constructed an extensive network of bicycle facilities over the last decade and has an outreach program targeted to women bicyclists, has seen the percentage of female bicyclists increase to 32% as of Los Angeles County Metropolitan Transportation Authority June
42 Bicycle-Rail Trip Analysis and Greenhouse Gas Emissions Reduction Focused Study 3. The total potential impact of a program of coordinated bicycle investments is greater than the sum of its parts. There is a definite network effect to bicycle travel. While individual facilities do attract new users, more riders will be attracted to each facility when bicycles can be a safe, convenient, and efficient means of transport for all destinations in Los Angeles. The true benefits of bicycle strategies are likely to grow over time as the network becomes more robust and as more people view bicycling as a competitive mode of transportation. Los Angeles County Metropolitan Transportation Authority June
43 Appendix A: Survey Instruments
44
45 Survey for Bicyclists Arriving at Station to Board Train Directions to Surveyor Please read aloud each question and the answers to the bicyclist, and ask them to give you their one best answer. All questions should have only one answer, unless otherwise indicated. When reading the questions, replace (origin) or (destination), with the origin and destination that the bicyclist told you. Questions 11 through 14 are optional, and should be asked if the bicyclist has enough time. to be filled out by surveyor Name Station Date of survey Time of survey: AM Weekday PM Weekday mid-day weekend origin 1. Where did you come from just now to get to this train station? Home Work Store, restaurant, movies, or other shopping and entertainment Family or friend s house Doctor, dentist or other personal business Other (Please specify.) 2. How did you get here? (Check all that apply.) Biked Walked Bus Drove alone Carpooled Dropped off Train/Subway/Light Rail Other (Please specify.) 3. What are the nearest cross streets and city to (origin)? Cross streets City or zip (origin) Other information that will help us identify the location (optional) destination 4. At which stop will you be exiting? Station Line (check one): Red Gold Blue Green Purple 5. Once you get o= the train, where are you headed? Home Work Store, restaurant, movies, or other shopping and entertainment Family or friend s house Doctor, dentist or other personal business Other (Please specify.) 6. How will you get there? (Check all that apply.) Bike Walk Bus Drive alone Carpool Drop o= Train/Subway/Light Rail Other (Please specify.) (destination) 7. What are the nearest cross streets and city to (destination)? Cross streets City or zip Other information that will help us identify the location (optional) Please see back to complete the survey.
46 Survey for Bicyclists Arriving at Station to Board Train (continued) mode choice 8. Think about your trip from (origin) to this station. If you didn t have your bike, how would you have made the trip? (Check all that apply.) Walked Bus Drove alone Carpooled Dropped o= Train/Subway/Light Rail Would not have made the trip Other (Please specify.) 9. Think about your trip from the train station you re going to and (destination). If you didn t have your bike, how would you make the trip? (Check all that apply.) Walk Bus Drive alone Carpool Drop o= Train/Subway/Light Rail Would not make the trip Other (Please specify.) 10. Think about your trip from (origin) to (destination). If you didn t have your bike and couldn t take the train, how would you make the trip? (Check all that apply.) Walk Bus Drive alone Carpool Drop o= Would not make the trip Other (Please specify.) optional questions To be asked by surveyors only if there is time. Do you have enough time to answer a few more questions? 11. Do you have access to a car? Always Sometimes Rarely Never 12. Of the following choices, which ones influenced your decision to ride your bike to the train today, rather than walk, drive or take the bus? (Check all that apply.) Bike racks at the station Bike lockers at the station Allowed to take bike on the train Good bike facilities on the way to the station Have to pay for car parking at the station No car parking at the station None of the above 13. What age group do you fall into? 18 to 29 years 30 to 39 years 40 to 50 years 51 to 60 years 61+ years 14. What gender do you identify with? (Best to have the surveyor make a note rather than ask!) Male Female jl 2010 lacmta
47 Encuesta para ciclistas que llegan a la estación para abordar el tren Instrucciones para los encuestadores Por favor lea en voz alta cada pregunta y respuesta a los ciclistas y pída que le den la mejor respuesta. Todas las preguntas deben tener sólo una respuesta a menos que se indique lo contrario. Cuando lea la pregunta reemplace (origen) o (destino), con el origen y destino que el ciclista le indicó. Las preguntas 11 al 14 son opcionales y deben ser preguntadas si el ciclista tiene suficiente tiempo. origen 1. De dónde acaba de venir para llegar a esta estación de tren? Casa Trabajo Tienda, restaurante, cine u otro lugar de compras y entretenimiento Casa de familia o amigos Doctor, dentista u otro negocio personal Otro (Por favor especifique.) 2. Cómo llegó? (Marque todas las que corresponden.) En bicicleta Caminando En autobús Conduciendo solo En camioneta compartida Lo trajeron En tren/tren subterráneo/tren ligero Otro (Por favor especifique.) 3. Cuáles son las calles de cruce y ciudad más cercana a (origen)? Calles de cruce Ciudad o código postal Otra información que pueda ayudarnos a identificar el lugar (opcional) (origen) para ser llenado por el encuestador Nombre Ubicación de la estación Fecha de la encuesta Hora de la encuesta: AM entre semana PM entre semana Medio día fin de semana destino 4. En qué parada bajará? Estación Línea (Marque una.): Red Gold Blue Green Purple 5. Una vez que baje del tren, a dónde irá? Casa Trabajo Tienda, restaurante, cine u otro lugar de compras y entretenimiento Casa de familia o amigos Doctor, dentista u otro negocio personal Otro (Por favor especifique.) 6. Cómo llegará? (Marque todas las que corresponden.) En bicicleta Caminando En autobús Conduciendo solo En camioneta compartida Lo trajeron En tren/tren subterráneo/tren ligero Otro (Por favor especifique.) 7. Cuáles son las calles de cruce y ciudad más cercana a (destino)? (destino) Calles de cruce Ciudad o código postal Otra información que pueda ayudarnos a identificar el lugar (opcional) Voltee para completar la encuesta.
48 Encuesta para ciclistas que llegan a la estación para abordar el tren (continuado) elección del modo de transporte 8. Piense en su viaje desde (origen) hasta esta estación. Si no tuviera su bicicleta, cómo habría llegado? (Marque todas las que corresponden.) Caminando En autobús Conduciendo solo En camioneta compartida En tren/tren subterráneo/tren ligero No hubiera hecho el viaje Otro (Por favor especifique.) Lo hubieron traído 9. Piense en su viaje desde la estación de tren a la que va y (destino). Si no tuviera su bicicleta, cómo llegaría? (Marque todas las que corresponden.) Caminando En autobús Conduciendo solo En camioneta compartida En tren/tren subterráneo/tren ligero No hubiera hecho el viaje Otro (Por favor especifique.) Lo hubieron traído 10. Ahora piense en su viaje de (origen) a (destino). Si no tuviera su bicicleta y no pudiera tomar el tren, cómo llegaría? (Marque todas las que corresponden.) Caminando En autobús Conduciendo solo En camioneta compartida No hubiera hecho el viaje Otro (Por favor especifique.) Lo hubieron llevado preguntas opcionales Para ser incluidas en cada encuesta y preguntadas por los encuestadores sólo si hay tiempo. Tiene suficiente tiempo para contestar cuatro preguntas más? 11. Tiene acceso a un auto? Siempre Raramente Algunas veces Nunca 12. De las siguientes opciones, cuales influenciaron su decisión para ir en bicicleta hacia el tren hoy, en vez de caminar, conducir, tomar el autobús? (Marque todas las que corresponden.) Portabicicletas en la estación Casilleros para bicicletas en la estación Se le permite llevar la bicicleta en el tren Buenas instalaciones para bicicletas en el camino a la estación Tiene que pagar por estacionamiento de auto en la estación No hay estacionamiento de auto en la estación Ninguna de las anteriores 13. A qué grupo de edad pertenece? 18 a 29 años 30 a 39 años 40 a 50 años 51 a 60 años más de 61 años 14. Con qué género se identifica? ( Es preferible que el encuestador haga una nota en vez de preguntar!) Masculino Femenino jl 2010 lacmta
49 Survey for Bicyclists Departing from Station after Exiting Train Directions to Surveyor Please read aloud each question and the answers to the bicyclist, and ask them to give you their one best answer. All questions should have only one answer, unless otherwise indicated. When reading the questions, replace (origin) or (destination), with the origin and destination that the bicyclist told you. Questions 11 and 12 are optional, and should be asked if the bicyclist has enough time. to be filled out by surveyor Name Station Date of survey Time of survey: AM Weekday PM Weekday mid-day weekend origin 1. At which station did you board the train? Station Line (Check one.): Red Gold Blue Green Purple 2. How did you get to that train station? Biked Walked Bus Drove alone Carpooled Dropped o= Train/Subway/Light Rail Other (Please specify.) 3. Where were you coming to the station from? (origin) Home Work Store, restaurant, movies, or other shopping and entertainment Family or friend s house Doctor, dentist or other personal business Other (Please specify.) 4. What are the nearest cross streets and city to (origin)? destination 5. Where are you going right now? Home Work Store, restaurant, movies, or other shopping and entertainment Family or friend s house Doctor, dentist or other personal business Other (Please specify.) 6. How will you get there? Bike Walk Bus Drive alone Carpool Drop o= Train/Subway/Light Rail Other (Please specify.) 7. What are the nearest cross streets and city to (destination)? Cross streets City or zip (destination) Other information that will help us identify the location (optional) Cross streets City or zip Other information that will help us identify the location (optional) Please see back to complete the survey.
50 Survey for Bicyclists Departing from Station after Exiting Train (continued) mode choice 8. Think about your trip from this station to (destination). If you didn t have your bike, how would you get there? (Check all that apply.) Walk Bus Drive alone Carpool Drop o= Train/Subway/Light Rail Would not make the trip Other (Please specify.) 9. Think about your trip from (origin) to the train station where you boarded. If you didn t have your bike, how would you have made the trip? Walked Bus Drove alone Carpooled Dropped off Train/Subway/Light Rail Would not have made the trip Other (Please specify.) 10. Now think about your trip from (origin) to (destination). If you didn t have your bike and couldn t take the train, how would you get there? Walk Bus Drive alone Carpool Drop o= Train/Subway/Light Rail Would not make the trip Other (Please specify.) optional questions To be asked by surveyors only if there is time. Do you have enough time to answer a few more questions? 11. Do you have access to a car? Always Sometimes Rarely Never 12. Of the following choices, which ones influenced your decision to ride your bike to the train today, rather than walk, drive or take the bus? (Check all that apply.) Bike racks at the station Bike lockers at the station Allowed to take bike on the train Good bike facilities on the way to the station Have to pay for car parking at the station No car parking at the station None of the above 13. What age group do you fall into? 18 to 29 years 30 to 39 years 40 to 50 years 51 to 60 years 61+ years 14. What gender do you identify with? (Best to have the surveyor make a note rather than ask!) Male Female jl 2010 lacmta
51 Encuesta para ciclistas que salen de la estación después de bajar del tren Instrucciones para los encuestadores Por favor lea en voz alta cada pregunta y respuesta a los ciclistas y pída que le den la mejor respuesta. Todas las preguntas deben tener sólo una respuesta a menos que se indique lo contrario. Cuando lea la pregunta reemplace (origen) o (destino), con el origen y destino que el ciclista le indicó. Las preguntas 11 al 14 son opcionales y deben ser preguntadas si el ciclista tiene suficiente tiempo. origen 1. En qué estación tomó el tren? Estación Línea (Marque una.): Red Gold Blue Green Purple 2. Cómo llegó a esa estación del tren? En bicicleta Caminando En autobús Conduciendo solo En camioneta compartida Lo trajeron En tren/tren subterráneo/tren ligero Otro (Por favor especifique.) 3. De dónde viajó para llegar a esa estación? Casa Trabajo Tienda, restaurante, cine u otro lugar de compras y entretenimiento Casa de familia o amigos Doctor, dentista u otro negocio personal Otro (Por favor especifique.) (origen) para ser llenado por el encuestador Nombre Ubicación de la estación Fecha de la encuesta Hora de la encuesta: AM entre semana PM entre semana Medio día fin de semana 4. Cuáles son las calles de cruce y ciudad más cercana a (origen)? Calles de cruce Ciudad o código postal Otra información que pueda ayudarnos a identificar el lugar (opcional) destino 5. Hacia dónde se dirige? Casa Trabajo Tienda, restaurante, cine u otro lugar de compras y entretenimiento Casa de familia o amigos Doctor, dentista u otro negocio personal Otro (Por favor especifique.) 6. Cómo llegará? En bicicleta Caminando En autobús Conduciendo solo En camioneta compartida Lo trajeron En tren/tren subterráneo/tren ligero Otro (Por favor especifique.) (destino) Voltee para completar la encuesta.
52 Encuesta para ciclistas que salen de la estación después de bajar del tren (continuado) 7. Cuáles son las calles de cruce y ciudad más cercana a (origin)? Calles de cruce Ciudad o código postal Otra información que pueda ayudarnos a identificar el lugar (opcional) elección del modo de transporte 8. Piense en su viaje desde esta estación hacia (destino). Si no tuviera su bicicleta, cómo llegaría? Caminando En autobús Conduciendo solo En camioneta compartida En tren/tren subterráneo/tren ligero No hubiera hecho el viaje Otro (Por favor especifique.) Lo hubieron traído 9. Piense en su viaje desde (origen) hacia la estación en la que abordo el tren. Si no tuviera su bicicleta, cómo habría llegado a la estación del tren? Caminando En autobús Conduciendo solo En camioneta compartida En tren/tren subterráneo/tren ligero No hubiera hecho el viaje Otro (Por favor especifique.) 10. Ahora piense en su viaje de (origen) a (destino). Si no tuviera su bicicleta y no pudiera tomar el tren, cómo llegaría? Lo hubieron traído Caminando En autobús Conduciendo solo En camioneta compartida No hubiera hecho el viaje Otro (Por favor especifique.) Lo hubieron llevado preguntas opcionales Para ser incluidas en cada encuesta y preguntadas por los encuestadores sólo si hay tiempo. Tiene suficiente tiempo para contestar dos preguntas más? 11. Tiene acceso a un auto? Siempre Raramente Algunas veces Nunca 12. De las siguientes opciones, cuales influenciaron su decisión para ir en bicicleta hacia el tren hoy, en vez de caminar, conducir, tomar el autobús? (Marque todas las que corresponden.) Portabicicletas en la estación Casilleros para bicicletas en la estación Se le permite llevar la bicicleta en el tren Buenas instalaciones para bicicletas en el camino a la estación Tiene que pagar por estacionamiento de auto en la estación No hay estacionamiento de auto en la estación Ninguna de las anteriores 13. A qué grupo de edad pertenece? 18 a 29 años 30 a 39 años 40 a 50 años 51 a 60 años más de 61 años 14. Con qué género se identifica? ( Es preferible que el encuestador haga una nota en vez de preguntar!) Masculino Femenino jl 2010 lacmta
53 Appendix B: Additional Survey Data Tables
54
55 Survey responses to the questions: Which station did you board the train? At which stop will you be exiting? Blue Gold (con t) 103rd St 3 5 Mission 1 5 1st St 1 16 Pico / Aliso 1 1 5th St 4 Sierra Madre Vila th / Metro Soto 1 Anaheim 5 4 Southwest Museum 1 0 Artesia 1 10 Union Station 1 13 Compton 3 13 (blank) 1 2 Del Amo 25 7 Green Firestone 3 6 Avalon 1 4 Florence Aviation Grand Crenshaw Imperial / Wilmington Douglas 1 2 Pacific 1 El Segundo 2 8 Pacific Coast Hwy 3 5 Hawthorne 4 7 Pico 3 Imperial / Wilmington 2 3 San Pedro 2 5 Lakewood 5 Slauson 5 6 Long Beach 7 7 Transit Mall 1 1 Mariposa 4 2 Vernon 4 Norwalk Wardlow 1 Redondo Beach Washington 3 13 Union Station 1 Willow 1 3 Vermont 2 (blank) 1 1 (blank) 1 Gold Red/Purple Allen 2 1 7th / Metro 4 10 Atlantic Civic Center 8 4 Chinatown 3 2 Hollywood / Highland 7 15 Del Mar 2 2 Hollywood / Vine 6 12 Fillmore 1 1 Hollywood / Western 1 5 Highland Park North Hollywood Indiana 2 1 Pershing Square 7 7 Lake 1 7 Union Station Lincoln / Cypress 3 2 Universal City 4 7 Little Tokyo 4 3 Vermont / Beverly 1 Maravilla 1 1 Vermont / Santa Monica Mariachi Plaza 3 1 Vermont / Sunset 3 5 Memorial Park 1 3 Westlake / MacArthur B-1
56 Survey responses to the questions: Which station did you board the train? At which stop will you be exiting? Wilshire / Normandie 1 2 Wilshire / Vermont Wilshire / Western (blank) 2 Metrolink 3 1 Cal State LA 1 Industry 1 Riverside 2 Orange 1 De Soto 1 (blank) 1 (blank) 1 Grand Total Calculations for Average Distance for Shifted Trips Number of Shifted Trips for Which we can calculate distance Total Vehicle Miles Average Miles per Shifted Trip Trips to or from a station Trips from origin to destination B-2
57 Appendix C: Additional Count Data Tables and Charts
58
59 AM Weekday, PM Weekday, Midday Weekend Bicycle Counts by Station AM- Station Line Weekday PM- Weekday Weekend Total Hourly Counts Notes Imperial/Wilmington Blue Transfer Station 7th St/Metro Center Blue Transfer Station Wilshire/Vermont Red Florence Blue no data Norwalk Green End of line Crenshaw Green Westlake/MacArthur Park Purple/Red Del Amo Blue Transfer Station Vermont/Santa Monica Red Wilshire/Western Purple no data End of line Aviation/LAX Green North Hollywood Red End of line Grand Blue Highland Park Gold Sierra Madre Villa Gold End of line Redondo Beach Green End of line Atlantic Gold End of line 1st Street Blue End of line Mariachi Plaza Gold Total , C-1
60 C-2
61 Appendix D: Schematic Maps
62
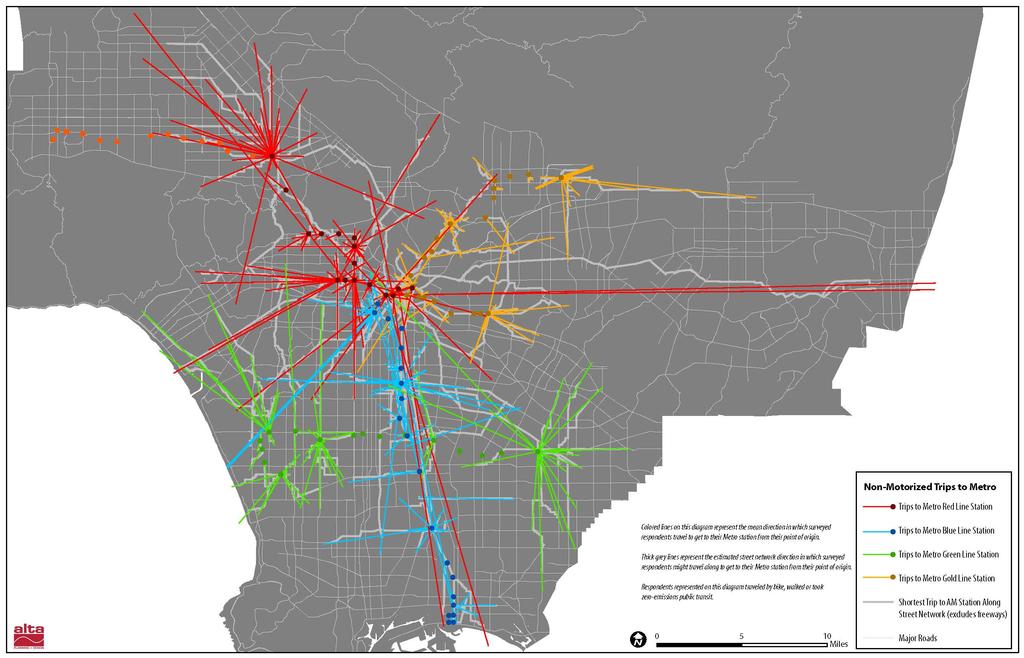
63
1999 On-Board Sacramento Regional Transit District Survey
 SACOG-00-009 1999 On-Board Sacramento Regional Transit District Survey June 2000 Sacramento Area Council of Governments 1999 On-Board Sacramento Regional Transit District Survey June 2000 Table of Contents
Metro Orange Line Mode Shift Study and and Greenhouse Gas Emissions Analysis
 Metro Orange Line Mode Shift Study and and Greenhouse Gas Emissions Analysis Metro Orange Line Mode Shift Study and Greenhouse Gas Emissions Analysis Prepared by: Los Angeles County Metropolitan Transportation
Capital Bikeshare 2011 Member Survey Executive Summary
 Capital Bikeshare 2011 Member Survey Executive Summary Prepared by: LDA Consulting Washington, DC 20015 (202) 548-0205 June 14, 2012 EXECUTIVE SUMMARY Overview This report presents the results of the 2012
Addressing Bicycle Capacity Issues on Public Transportation
 Addressing Bicycle Capacity Issues on Public Transportation Advanced Transportation Technologies Clean Transportation Solutions SM Whitney Pitkanen Project Manager MISSION STATEMENT CALSTART is dedicated
Briefing Paper #1. An Overview of Regional Demand and Mode Share
 2011 Metro Vancouver Regional Trip Diary Survey Briefing Paper #1 An Overview of Regional Demand and Mode Share Introduction The 2011 Metro Vancouver Regional Trip Diary Survey is the latest survey conducted
An Assessment of Potential Greenhouse Gas Emissions Reductions from Proposed On Street Bikeways
 An Assessment of Potential Greenhouse Gas Emissions Reductions from Proposed On Street Bikeways Through the Sustainable Bethlehem Initiative, the Town of Bethlehem has identified both the improvement of
2016 Capital Bikeshare Member Survey Report
 2016 Capital Bikeshare Member Survey Report Prepared by: LDA Consulting Washington, DC 20015 (202) 548-0205 February 24, 2017 EXECUTIVE SUMMARY Overview This report presents the results of the November
Travel and Rider Characteristics for Metrobus
 Travel and Rider Characteristics for Metrobus 040829040.15 Travel and Rider Characteristics for Metrobus: 2012-2015 Overview The Miami Dade County Metropolitan Planning Organization (MPO) conducted a series
Cabrillo College Transportation Study
 Cabrillo College Transportation Study Planning and Research Office Terrence Willett, Research Analyst, Principle Author Jing Luan, Director of Planning and Research Judy Cassada, Research Specialist Shirley
Bicycle Master Plan Goals, Strategies, and Policies
 Bicycle Master Plan Goals, Strategies, and Policies Mobilizing 5 This chapter outlines the overarching goals, action statements, and action items Long Beach will take in order to achieve its vision of
Executive Summary. TUCSON TRANSIT ON BOARD ORIGIN AND DESTINATION SURVEY Conducted October City of Tucson Department of Transportation
 Executive Summary TUCSON TRANSIT ON BOARD ORIGIN AND DESTINATION SURVEY Conducted October 2004 Prepared for: City of Tucson Department of Transportation May 2005 TUCSON TRANSIT ON BOARD ORIGIN AND DESTINATION
COLUMBUS AVENUE NEIGHBORHOOD TRANSPORTATION STUDY
 COLUMBUS AVENUE NEIGHBORHOOD TRANSPORTATION STUDY Pedestrian Survey Findings Survey Main Findings: Transit and walking are the main two modes used by both visitors and residents of the area, regardless
Complete Street Analysis of a Road Diet: Orange Grove Boulevard, Pasadena, CA
 Complete Street Analysis of a Road Diet: Orange Grove Boulevard, Pasadena, CA Aaron Elias, Bill Cisco Abstract As part of evaluating the feasibility of a road diet on Orange Grove Boulevard in Pasadena,
Active Transportation on the Rise
 Integrated Approaches to Shared-Use Paths Doug Sarkkinen, PE Windi Shapley, PE Mandi Roberts, AICP, PLA Why? Biking and walking are important active transportation options. Shared-use paths are critical
Chapter 2. Bellingham Bicycle Master Plan Chapter 2: Policies and Actions
 Chapter 2 Bellingham Bicycle Master Plan Chapter 2: Policies and Actions Chapter 2: Policies and Actions The Bicycle Master Plan provides a road map for making bicycling in Bellingham a viable transportation
January Project No
 January 13 2015 Project No. 5070.05 Neil Connelly, Director University of Victoria, Campus Planning and Sustainability PO Box 1700 STN CSC Victoria, BC V8P 5C2 Dear Neil: Re: UVic 2014 Traffic Final Report
Washington Metropolitan Area Transit Authority Board Action/Information Summary. MEAD Number:
 Washington Metropolitan Area Transit Authority Board Action/Information Summary Action Information MEAD Number: 100962 Resolution: Yes No TITLE: Bicycle and Pedestrian Access Improvements Study PURPOSE:
BUILDING THE CASE FOR TRAVEL OPTIONS IN WASHING TON COUNTY. Image: Steve Morgan. Image: Steve Morgan
 BUILDING THE CASE FOR TRAVEL OPTIONS IN WASHING TON COUNTY Image: Steve Morgan Image: Steve Morgan Image: TriMet Image: TriMet WHAT ARE TRAVEL OPTIONS PROGRAMS? Travel options programs encourage residents,
Berkeley Strategic Transportation Plan A-76
 Berkeley Strategic Transportation Plan A-76 Appendices 1. A Team Effort 2. Where We ve Been A-11 Berkeley Strategic Transportation Plan Alameda County Transportation Plan Alameda County will be served
Bike Rack Occupancy on the University of North Texas Campus
 Bike Rack Occupancy on the University of North Texas Campus Chloe B. Thomas Faculty Mentor: Dr. Nagaoka, Department of Geography, College of Arts and Sciences The presence of bike parking facilities has
AAMPO Regional Transportation Attitude Survey
 AAMPO Regional Transportation Attitude Survey Traditionally Underserved Populations helping organizations make better decisions since 1982 2018 Submitted to the AAMPO By: ETC Institute 725 W. Frontier
MONTGOMERY COUNTY PLANNING DEPARTMENT THE MARYLAND-NATIONAL CAPITAL PARK AND PLANNING COMMISSION
 MONTGOMERY COUNTY PLANNING DEPARTMENT THE MARYLAND-NATIONAL CAPITAL PARK AND PLANNING COMMISSION MCPB Item No. 4 Date: 04-17-14 2014 Mobility Assessment Report José Dory, Senior Planner, Functional Planning
CITY OF COCOA BEACH 2025 COMPREHENSIVE PLAN. Section VIII Mobility Element Goals, Objectives, and Policies
 CITY OF COCOA BEACH 2025 COMPREHENSIVE PLAN Section VIII Mobility Element Goals, Objectives, and Policies Adopted August 6, 2015 by Ordinance No. 1591 VIII MOBILITY ELEMENT Table of Contents Page Number
Solana Beach Comprehensive Active Transportation Strategy (CATS)
") Solana Beach Comprehensive Active Transportation Strategy (CATS) 3.0 Goals & Policies The Solana Beach CATS goals and objectives outlined below were largely drawn from the Solana Beach Circulation Element
Solana Beach Comprehensive Active Transportation Strategy (CATS) 3.0 Goals & Policies The Solana Beach CATS goals and objectives outlined below were largely drawn from the Solana Beach Circulation Element
SANTA CLARA COUNTYWIDE BICYCLE PLAN August 2008
 SANTA CLARA COUNTYWIDE BICYCLE PLAN August 2008 To assist VTA and Member Agencies in the planning, development and programming of bicycle improvements in Santa Clara County. Vision Statement To establish,
CAPITOL REGION COUNCIL OF GOVERNMENTS. Bike / Pedestrian Count Project
 CAPITOL REGION COUNCIL OF GOVERNMENTS Bike / Pedestrian Count Project October 2009 Introduction In 2008, the Capitol Region Council of Governments (CRCOG) updated the Regional Bike/Ped Plan, The CRCOG
June 3, Attention: David Hogan City of San Mateo 330 W. 2oth Avenue San Mateo, CA 94403
 June 3, 2015 Attention: David Hogan City of San Mateo 330 W. 2oth Avenue San Mateo, CA 94403 Regarding: PA # 15-030, Bridgepointe Shopping Center 2202 Bridgepointe Parkway, APN 035-466-10 Dear David: Enclosed
Exceeding expectations: The growth of walking in Vancouver and creating a more walkable city in the future through EcoDensity
 Exceeding expectations: The growth of walking in Vancouver and creating a more walkable city in the future through EcoDensity Melina Scholefield, P. Eng. Manager, Sustainability Group, City of Vancouver
Goals, Objectives, and Policies
 Goals, Objectives, and Policies ADVISORY GROUP INPUT PUBLIC INPUT SNS PREVIOUS STUDIES RBPP Goals Vision Statement Southern Nevada will develop a safe, connected, and convenient walking and bicycling system
Purpose and Need. Chapter Introduction. 2.2 Project Purpose and Need Project Purpose Project Need
 Chapter 2 Purpose and Need 2.1 Introduction The El Camino Real Bus Rapid Transit (BRT) Project (Project) would make transit and other transportation improvements along a 17.6-mile segment of the El Camino
Measuring and Communicating Mobility:
 Measuring and Communicating Mobility: The District Mobility Project Stephanie Dock, District Department of Transportation TRB Transportation Issues in Major Cities Committee May 2, 2017 Deconstructing
TRANSIT & NON-MOTORIZED PLAN DRAFT FINAL REPORT Butte County Association of Governments
 1 INTRODUCTION Maintaining a high quality of life is the essence of this plan for transit and non-motorized transportation in Butte County. Curbing greenhouse gas emissions (GHG) by reducing congestion,
Caltrain Bicycle Parking Management Plan DRAFT PROJECT SCOPE SUBMITTED TO CALTRANS FALL 2014
 Caltrain Bicycle Parking Management Plan DRAFT PROJECT SCOPE SUBMITTED TO CALTRANS FALL 2014 NOTE: The following draft scope of work was developed by Caltrain in the fall of 2014 as part of a Caltrans
PEDESTRIAN COLLISIONS IN LOS ANGELES 1994 through 2000
 PEDESTRIAN COLLISIONS IN LOS ANGELES 1994 through 2000 City of Los Angeles Department of Transportation Gloria Jeff, General Manager March, 2006 This document printed with grant funds from the California
Chapter PERFORMANCE MEASURES AND ACCOUNTABILITY. Introduction
 PERFORMANCE MEASURES AND ACCOUNTABILITY Introduction Performance measures are helpful in evaluating the progress being made toward achieving the goals and objectives of the Gateway Bicycle Plan. The Plan
NM-POLICY 1: Improve service levels, participation, and options for non-motorized transportation modes throughout the County.
 Transportation PRINCE WILLIAM COUNTY 2008 COMPREHENSIVE PLAN NON-MOTORIZED PLAN CONTENTS Goals, Policies, and Action Strategies Table 4 (Bike Facility Classifications and Descriptions) Table 5 (Bike Facility
Summary of NWA Trail Usage Report November 2, 2015
 Summary of NWA Trail Usage Report November 2, 2015 Summary Findings: The study showed that Northwest Arkansas (NWA) had relatively high cyclist user counts per capita aggregated across the top three usage
METRO Light Rail: Changing Transit Markets in the Phoenix Metropolitan Area
 METRO Light Rail: Changing Transit Markets in the Phoenix Metropolitan Area Abhishek Dayal, AICP Planner III, METRO Light Rail Phoenix, AZ BACKGROUND Transit in the Phoenix Region Transit services in the
Guidelines for Providing Access to Public Transportation Stations APPENDIX C TRANSIT STATION ACCESS PLANNING TOOL INSTRUCTIONS
 APPENDIX C TRANSIT STATION ACCESS PLANNING TOOL INSTRUCTIONS Transit Station Access Planning Tool Instructions Page C-1 Revised Final Report September 2011 TRANSIT STATION ACCESS PLANNING TOOL INSTRUCTIONS
DRAFT MOVING FORWARD RHODE ISLAND BICYCLE MOBILITY PLAN 2018 PREPARED FOR PREPARED BY IN ASSOCIATION WITH
 RHODE ISLAND MOVING FORWARD BICYCLE MOBILITY PLAN 2018 PREPARED FOR PREPARED BY IN ASSOCIATION WITH T AF CHAPTER 1 D R INTRODUCTION CHAPTER 3 ARTICULATES VISION Bicycling is safe, fun and practical in
Climate Change Action Plan: Transportation Sector Discussion Paper: Cycling
 Climate Change Action Plan: Transportation Sector Discussion Paper: Cycling ontario.ca/climatechange Contents 1. Minister of Transportation s message... 3 2. Introduction... 5 3. Sector Overview and Support
APPENDIX A. Outreach Summary
 APPENDIX A Outreach Summary COUNTYWIDE TRANSPORTATION PLAN Summary of Public Outreach and Engagement To gather an understanding of the transportation issues and priorities throughout the county, and inform
Bike Planner Overview
 Bike Planner Overview A Web-based Sketch Planning Tool for Los Angeles County presented by William E. Walter, GISP April 12, 2017 GIS-T Transportation leadership you can trust. Bike Planner Overview Guiding
MTP BICYCLE ELEMENT UPDATE. November 2017
 MTP BICYCLE ELEMENT UPDATE November 2017 TIME FOR AN UPDATE Bicycle Element adopted in July 2008 Almost 10 years old Many planned facilities have been implemented 10 years more experience in planning,
Planning Transit Operations and Bike Sharing Denver RTD. Bill Van Meter, Assistant General Manager, Planning March 23, 2012
 Planning Transit Operations and Bike Sharing Denver RTD Bill Van Meter, Assistant General Manager, Planning March 23, 2012 1 Overview RTD Background RTD Bike-n-Ride Program RTD - Bike Share Coordination:
CASE STUDY City of Monrovia: Leveraging emerging ridesharing services to expand mobility options
 Advancing Mobility Management CASE STUDY City of Monrovia: Leveraging emerging ridesharing services to expand mobility options Agency: Location: Service Area: Modes: Community Context: Key Contacts: City
SAN FRANCISCO WOMEN AND BIKING A CASE STUDY ON THE USE OF SAN FRANCISCO BIKE LANES SYNTHESIS
 SAN FRANCISCO WOMEN AND BIKING A CASE STUDY ON THE USE OF SAN FRANCISCO BIKE LANES SYNTHESIS WOMEN AND BIKING: A CASE STUDY ON THE USE OF SAN FRANCISCO BIKE LANES 2 TAKEAWAY KEY Increasing biking is a
Rail Station Fact Sheet University of Dallas Station
 Rail Station Fact Sheet University of Dallas Station Station Overview University of Dallas Station is located on John Carpenter Freeway and west of Loop 12 across from the University of Dallas in Irving.
Sun Metro Fixed Route Rider Survey
 University of Texas at El Paso DigitalCommons@UTEP IPED Technical Reports Institute for Policy and Economic Development 8-1-2006 Dennis L. Soden University of Texas at El Paso, desoden@utep.edu Mathew
2017 North Texas Regional Bicycle Opinion Survey
 2017 North Texas Regional Bicycle Opinion Survey Sustainable Development Program Kevin Kokes, AICP Public Meetings April, 2018 North Central Texas Council of Governments MPO for the Dallas-Fort Worth Region
Rail Station Fact Sheet DFW Airport North Station* (*station under construction with anticipated start of service in late 2018)
") Rail Station Fact Sheet DFW Airport North Station* (*station under construction with anticipated start of service in late 018) Station Overview DFW Airport North Station will be located on DFW nternational
Rail Station Fact Sheet DFW Airport North Station* (*station under construction with anticipated start of service in late 018) Station Overview DFW Airport North Station will be located on DFW nternational
CITY OF SIGNAL HILL Cherry Avenue Signal Hill, CA
 CITY OF SIGNAL HILL 2175 Cherry Avenue Signal Hill, CA 90755-3799 AGENDA ITEM TO: HONORABLE MAYOR AND MEMBERS OF THE CITY COUNCIL FROM: STEVE MYRTER, P. E. DIRECTOR OF PUBLIC WORKS SUBJECT: SPRING STREET
May Canal Cordon Report 2017
 May 2018 Canal Cordon Report 2017 Report on trends in mode share of vehicles and people crossing the Canal Cordon to 2017 2 Analysis of trends in mode share of people crossing the canal cordon - 2017 Contents
Key objectives of the survey were to gain a better understanding of:
 3 COMMUNITY INPUT Community input is an essential part of corridor studies. For the SR 87 corridor study, VTA staff conducted an extensive online survey of people living and commuting along the corridor.
Stress Bikeway Network
 Building Portland s Low- Stress Bikeway Network Photo credit: Michael Anderson Bikeportland.org Designing Streets 2015 Austin, TX October 29 2015 Roger Geller Portland Background Existing low- and lower-stress
Appendix T 1: Additional Supporting Data
 Appendix T 1: Additional Supporting Data Project Delivery Delays with the implementation of the 2000 TIP became apparent early in the decade. In response to direction among policy officials, ARC began
Public Works AGENDA ITEM D-2 STAFF REPORT
 AGENDA ITEM D-2 Public Works STAFF REPORT Transportation Master Plan Oversight and Outreach Committee Meeting Date: 10/30/2017 Staff Report Number: 17-001-TMP Regular Business: Provide feedback on Performance
Modal Shift in the Boulder Valley 1990 to 2009
 Modal Shift in the Boulder Valley 1990 to 2009 May 2010 Prepared for the City of Boulder by National Research Center, Inc. 3005 30th Street Boulder, CO 80301 (303) 444-7863 www.n-r-c.com Table of Contents
SOLANA BEACH BICYCLE TRANSPORTATION PLAN SECOND ADDENDUM
 SOLANA BEACH BICYCLE TRANSPORTATION PLAN SECOND ADDENDUM Prepared by the City of Solana Beach January 2005 Introduction In June of 1993, the Solana Beach City Council adopted a Bikeway Master Plan as directed
Baseline Survey of New Zealanders' Attitudes and Behaviours towards Cycling in Urban Settings
 Baseline Survey of New Zealanders' Attitudes and Behaviours towards Cycling in Urban Settings Highlights 67% of urban New Zealanders, 18 years of age or more own or have access to a bicycle that is in
Findings and Lessons from Safe Routes to Transit (SR2T) David Weinzimmer, SafeTREC, UC Berkeley PedsCount!, May 2014
 David Weinzimmer, SafeTREC, UC Berkeley PedsCount!, May 2014") Findings and Lessons from Safe Routes to Transit (SR2T) David Weinzimmer, SafeTREC, UC Berkeley PedsCount!, May 2014 Safe Routes to Transit (SR2T) Funded by Regional Measure 2 (2004), $20M in total funding
Findings and Lessons from Safe Routes to Transit (SR2T) David Weinzimmer, SafeTREC, UC Berkeley PedsCount!, May 2014 Safe Routes to Transit (SR2T) Funded by Regional Measure 2 (2004), $20M in total funding
2012 Transit Study Randolph County
 2012 Transit Study Randolph County Appendix B Technical Memorandum 2011 Transportation Survey Prepared for: Randolph County Housing Authority Country Roads Transit Submitted by: July 1, 2012 Table of Contents
Access BART: TOD and Improved Connections. October 29, 2008
 Access BART: TOD and Improved Connections October 29, 2008 1 Access BART Study Goals Evaluate at the system-level land use and access scenarios to optimize ridership Identify station clusters that provide
Kelowna On the Move. Pedestrian and Bicycle Master Plan
 Kelowna On the Move Pedestrian and Bicycle Master Plan Executive Summary April 2016 Purpose of the Plan The Pedestrian and Bicycle Master Plan identifies infrastructure, planning, and policy requirements
Sustainable Transportation Plan Draft 4/24/2012
 Sustainable Transportation Plan 2011-2012 Draft 4/24/2012 Contents I. Purpose... 3 II. Background... 3 III. Recent Accomplishments... 6 IV. Anticipated Changes... 8 V. Planning Process... 8 VI. Priorities...
Camosun College Modal Split
 2010 Camosun College Modal Split How Does the College Community Get to Campus? Shannon Craig & Julie Higginson Camosun College 1/21/2011 Contents Introduction... 3 Methodology... 3 Results... 6 Mode Share
U.S. Bicycling Participation Study
 U.S. Bicycling Participation Study Report of findings from the 2016 survey Conducted by Corona Insights Commissioned by PeopleForBikes Released July 2017 Table of Contents Background and Objectives 3 Research
2017 Northwest Arkansas Trail Usage Monitoring Report
 2017 Northwest Arkansas Trail Usage Monitoring Report Summary Findings: The study showed that average daily weekday bicycle volumes per study site increased by about 32% between 2015 and 2017, from 142
Measuring Transportation: Traffic, Mobility and Accessibility
 Measuring Transportation: Traffic, Mobility and Accessibility THIS FEATURE COMPARES THREE APPROACHES TO MEASURING TRANSPORTATION SYSTEM PERFORMANCE. TRAFFIC-BASED MEASUREMENTS EVALUATE MOTOR VEHICLE MOVEMENT;
North Coast Corridor:
 North Coast Corridor: Connecting People, Transportation & Environment Legislative Hearing: 11.8.10 1 North Coast Corridor Region s Lifeline A Regional Strategy Mobility, Economy & Environment North Coast
BIKE PLAN CONTENTS GATEWAY
 CONTENTS Acknowledgments...vii Great Rivers Greenway District Board of Directors... vii Great Rivers Greenway District Staff... vii Project Consultants... vii Committees... viii Citizens Advisory Committee
Results from the 2009 City of Los Angeles Bicycle and Pedestrian Count
 Results from the 2009 City of Los Angeles Bicycle and Pedestrian Count Table of Contents Executive Summary 2 About the Los Angeles County Bicycle Coalition 3 2009 Bicycle and Pedestrian Count Objectives
Bike Share Social Equity and Inclusion Target Neighborhoods
 Bike Share Social Equity and Inclusion Target Neighborhoods Target Neighborhoods West End/Visitation Park/Academy/Hamilton Heights Wellsgoodfellow/Kingsway West The Ville/Greater Ville Kingsway East/Fountain
Westside Transportation Access Needs Assessment - Short and Long Term Improvements
 ABSTRACT The Los Angeles County Metropolitan Transportation Authority (MTA) adopted the 2001 Long Range Transportation Plan (LRTP), which sets out the County s transportation investments for the next 20-25
A Survey of Planning, Design, and Education for Bikeways and Bus Routes on Urban Streets
 A Survey of Planning, Design, and Education for Bikeways and Bus Routes on Urban Streets, Community & Economic Development Agency, Transportation Services Division (510) 238-3983 bikeped@oaklandnet.com
Rail Station Fact Sheet UNT Dallas Station
 Rail Station Fact Sheet UNT Dallas Station Station Overview UNT Dallas Station is located on the east side of University Hills Boulevard in Dallas. t is connected by a walking path to the University of
City of Novi Non-Motorized Master Plan 2011 Executive Summary
 City of Novi Non-Motorized Master Plan 2011 Executive Summary Prepared by: February 28, 2011 Why Plan? Encouraging healthy, active lifestyles through pathway and sidewalk connectivity has been a focus
The Role of MPOs in Advancing Safe Routes to School through the Transportation Alternatives Program
 The Role of MPOs in Advancing Safe Routes to School through the Transportation Alternatives Program In 2012, Congress made changes to Federal funding for Safe Routes to School that gave some metropolitan
Rail Station Fact Sheet CentrePort/DFW Airport Station
 Rail Station Fact Sheet CentrePort/DFW Airport Station Station Overview CentrePort/DFW Airport Station is located by Statler Boulevard at Breezewood Drive in Fort Worth. Free shuttles connect the station
I-105 Corridor Sustainability Study (CSS)
") I-105 Corridor Sustainability Study (CSS) Metro Streets and Freeways Subcommittee March 21, 2019 Gary Hamrick Cambridge Systematics, Inc. I-105 CSS Project History & Background Funded by Caltrans Sustainable
I-105 Corridor Sustainability Study (CSS) Metro Streets and Freeways Subcommittee March 21, 2019 Gary Hamrick Cambridge Systematics, Inc. I-105 CSS Project History & Background Funded by Caltrans Sustainable
INTRODUCTION. Specifically, the objectives are to:
 INTRODUCTION The River to Sea Transportation Planning Organization (TPO) conducts the Tell the TPO Transportation Trends Survey to better understand the transportation preferences and priorities for the
About the Active Transportation Alliance
 About the Active Transportation Alliance Chicagoland s voice for better biking, walking and transit Founded 1985 7,000 members, ~33 full time staff Serve Chicago metro region 1 More Cars, More Driving
National Bicycle and Pedestrian Documentation Project INSTRUCTIONS
 National Bicycle and Pedestrian Documentation Project INSTRUCTIONS The National Documentation Project (NBPD) is an annual bicycle and pedestrian count and survey effort sponsored by the Institute of Transportation
Flyaway Bus: GIS Analysis on Current and Potential Ridership, Revenue, and Prospective Stations
 ProfessorBarry Waite & Bonnie Shrewsbury Flyaway Bus: GIS Analysis on Current and Potential Ridership, Revenue, and Prospective Stations 1. Abstract The Flyaway Bus is a long distance non-stop shuttle
Dear Mr. Tweed: Sincerely, Min Zhou, P.E. Vice President
 December 17, 2012 Mr. Steve Tweed City of Long Beach, Department of Public Works Traffic & Transportation Bureau, 10 th Floor City Hall 333 West Ocean Boulevard Long Beach, CA 90802 Subject: Broadway and
APPENDIX W OFF-MODEL ADJUSTMENTS
 APPENDIX W OFF-MODEL ADJUSTMENTS The three-county travel demand model was used to evaluate the land use and transportation project scenarios for the Regional Transportation Plan Update. The model provided
The Florida Bicycle and Pedestrian Partnership Council
 The Florida Bicycle and Pedestrian Partnership Council Input to the Update of the Florida Transportation Plan March 2015 This document presents input from the Florida Bicycle and Pedestrian Advisory Council
Transportation Master Plan Advisory Task Force
 Transportation Master Plan Advisory Task Force Network Alternatives & Phasing Strategy February 2016 BACKGROUND Table of Contents BACKGROUND Purpose & Introduction 2 Linking the TMP to Key Council Approved
APPENDIX C Arlington Transit On-Board Survey Technical Memorandum
 APPENDIX C Arlington Transit On-Board Survey Technical Memorandum Arlington County Appendix C December 2010 TABLE OF CONTENTS 1.0 Overview of Transit Rider Survey Process... 1 2.0 Responses to Survey Questions...
Urban planners have invested a lot of energy in the idea of transit-oriented
 DOES TRANSIT-ORIENTED DEVELOPMENT NEED THE TRANSIT? D A N I E L G. C H AT M A N Urban planners have invested a lot of energy in the idea of transit-oriented developments (TODs). Developing dense housing
Proposed. City of Grand Junction Complete Streets Policy. Exhibit 10
 Proposed City of Grand Junction Complete Streets Policy Exhibit 10 1 City of Grand Junction Complete Streets Policy Vision: The Complete Streets Vision is to develop a safe, efficient, and reliable travel
Traffic Safety Barriers to Walking and Bicycling Analysis of CA Add-On Responses to the 2009 NHTS
 Traffic Safety Barriers to Walking and Bicycling Analysis of CA Add-On Responses to the 2009 NHTS NHTS Users Conference June 2011 Robert Schneider, Swati Pande, & John Bigham, University of California
National Bicycle and Pedestrian Documentation Project INSTRUCTIONS
 National Bicycle and Pedestrian Documentation Project INSTRUCTIONS The National Documentation Project (NBPD) is an annual bicycle and pedestrian count and survey effort sponsored by the Institute of Transportation
Market Factors and Demand Analysis. World Bank
 Market Factors and Demand Analysis Bank Workshop and Training on Urban Transport Planning and Reform. Baku, April 14-16, 2009 Market Factors The market for Public Transport is affected by a variety of
Eric Sundquist Managing Director State Smart Transportation Initiative (SSTI) Urban Sustainability Accelerator
 Urban Sustainability Accelerator") New tools for making better transportation system decisions Eric Sundquist Managing Director State Smart Transportation Initiative (SSTI) Urban Sustainability Accelerator Accessibility and trip-making
New tools for making better transportation system decisions Eric Sundquist Managing Director State Smart Transportation Initiative (SSTI) Urban Sustainability Accelerator Accessibility and trip-making
Cheryl Thole CUTR/NBRTI, Senior Research Associate Tampa, Florida
 A Change in Accessibility and Convenience? Implementing BRT and the Impact on Transit Riders Cheryl Thole CUTR/NBRTI, Senior Research Associate Tampa, Florida Project Background Greater station spacing
ORANGE COUNTY TRANSPORTATION AUTHORITY. Metrolink Ridership and Revenue Quarterly Report. Staff Report
 ORANGE COUNTY TRANSPORTATION AUTHORITY Metrolink Ridership and Revenue Quarterly Report Staff Report March 8, 2012 To: From: Subject: Transit Committee Will Kempton, Chief Executive Officer Metrolink Ridership
Philadelphia Bus Network Choices Report
 Philadelphia Bus Network Choices Report JUNE 2018 SEPTA Table of Contents Executive Summary...7 What if transit gave us more freedom?... 8 What is this report?... 8 The main conclusions... 9 What is happening
MCTC 2018 RTP SCS and Madera County RIFP Multi-Modal Project Eval Criteria GV13.xlsx
 MCTC 8 RTP SCS and Madera County RIFP Multi-Modal Project Eval Criteria GV.xlsx Madera County Transportation Commission Regional Transportation Plan / Sustainable Communities Strategy Multi-Modal Project
SACRAMENTO AREA TRAVEL SURVEY: BEFORE BIKE SHARE
 SACRAMENTO AREA TRAVEL SURVEY: BEFORE BIKE SHARE August 2017 A Research Report from the National Center for Sustainable Transportation Susan Handy, University of California, Davis Drew Heckathorn, University