EVALUATION OF SOLID GREEN BICYCLE LANES TO INCREASE COMPLIANCE AND BICYCLE SAFETY
|
|
|
- Archibald Watts
- 6 years ago
- Views:
Transcription
1 EVALUATION OF SOLID GREEN BICYCLE LANES TO INCREASE COMPLIANCE AND BICYCLE SAFETY Submitted to: Federal Highway Administration Office of Traffic Operations Submitted by: City of New York Department of Transportation February 8 th, 2011
2 NATURE OF THE PROBLEM On-street bicycle lanes are designed for the exclusive use of cyclists to enhance safety and improve operations for all roadway users. Exclusive bicycle lanes segregate roadway users of different sizes and speeds to reduce the likelihood of crashes and improve mobility. Motorists have been observed driving, standing and parking in bicycle lanes, thereby undermining the safety and traffic flow benefits of these marked lanes. Motorists may be insufficiently aware of the presence of bicycle lanes and their obligation to avoid driving, standing or parking thereon. Frequent incursions of motorists into bicycle lanes can have an intimidating effect on cyclists and lead to reduced levels of cycling. This problem has been noted particularly where the bicycle lane is adjacent to the curb, rather than adjacent to a lane of curbside parking. By emphasizing the portion of the roadway adjacent to the curb reserved for the exclusive or preferential use by cyclists, bicycle usage can be encouraged. Correct lane positioning is important for cyclists at intersection approaches especially for the right turn trap type crash in which a vehicle encroaches into the bicycle lane for a right turn and strikes a cyclist. By defining the correct lane position cyclists may be more prominent in the cone of vision for both overtaking right turning motorists and oncoming left turning motorists. According to the Institute for Highway Safety/Highway Loss Data Institute website 35% of cyclist deaths in 2000 occurred at intersections. In New York City, intersections account for 88% of cyclist injuries and 84% of cyclist fatalities. 1 According to the FHWA s Transportation Air Quality Selected Facts and Figures publication FHWA- PD , commuter trips by bicycle declined by 20% from 1980 to 1990, while urban traffic congestion levels from had increases typically in the range of 20% - 30% (or more). These developments are contrary to the goals of the National Bicycling and Walking Study FHWA-PD which are: 1. To double the current percentage of total trips made by bicycling and walking, and; 2. To simultaneously reduce by ten percent the number of cyclists and pedestrians killed or injured in traffic crashes. According to Kenneth R. Wykle, former Federal Highway Administrator, in his 1 Cyclist injury data comes from NYSDMV. Cyclist fatality data comes from NYPD/DOT database. Both data sets cover the period
3 Pedaling into the 21st Century article People shouldn t have to use a gallon of gasoline to get a quart of milk. Increased use of bicycling as a means of transportation also will help protect the environment, reduce traffic congestion, and develop more livable communities. 2
4 DESCRIPTION OF EXPERIMENTAL DEVICES The EVALUATION OF SOLID GREEN BICYCLE LANES TO INCREASE COMPLIANCE AND BICYCLE SAFETY project was approved by FHWA in May The project was designed to answer two questions: 1. Does the use of the solid green marking prompt motorists to respect the bicycle lane (reducing encroachments) as well as be more aware of cyclists along the roadway? 2. Does the solid green pavement marking increase bicycle use by providing a well-defined area for the bicyclist in the roadway? Beginning in 2007, New York City Department of Transportation (NYCDOT) has experimented with using green paint to demarcate curbside bike lanes in their entirety. To date, green painted lanes have been used in 28 projects for a total of 18.4 lane miles in New York City. As discussed in the original project proposal, the purpose of this experiment was to evaluate the effectiveness of solid green pavement marking between the bicycle lane striping. It was anticipated that the use of the solid green marking would prompt motorists to respect the bicycle lane (reducing encroachments) as well as be aware of cyclists along the roadway. In addition, the solid green pavement marking was expected to prompt greater bicycle use by providing a well-defined area for the bicyclist in the roadway. NYC Traffic Regulations prohibit cars from driving in bike lanes except when reasonable and necessary to make turns or comply with NYPD instructions (Section 4-12 (p)). As a result of coordination between the Bicycle Technical Committee (BTC) and the Pavement Markings Technical Committee (PMTC) of the National Committee on Uniform Traffic Control Devices (NCUTCD), the color green was identified as the most likely color for this experiment. (In addition to common perception, the 2009 MUTCD defines the use of blue pavement markings for handicapped parking only in Section 3A.05. NYCDOT elected to use the Ride-A-Way Coating Material, manufactured by Integrated Paving Concepts Inc., a "high performance premium coating material consisting of epoxy, modified acrylic polymers blended with sand and aggregate." StreetBond Colorant was added to provide color to the coating. Each lane received 2 coats of the Ride-A-Way Coating Material. NYCDOT s findings of the paint are as follows: 3
5 The paint does not cause the lane to become slippery when wet (0.5 friction factor) It initially masks imperfections in the asphalt, but over time as the lane becomes dirty, imperfections become more pronounced and visible. The shade shows up well at night under the street light illumination of the city s high pressure sodium lamps. Refurbishment is required approximately every 3 to 5 years. 4
6 METHODOLOGY To determine the impact of the solid green paint markings on driver and cyclist behavior, NYCDOT staff observed driver and cyclist behavior along four green paint treated curbside lanes and three standard bicycle lanes with white lane lines. Traffic counts were conducted during the PM peak period (4pm-6pm) in September of Of the three control lanes, two are typical non-curbside bike lanes. The third, Clinton St. in Brooklyn between Remsen and Montague Streets is one of the few instances of a curbside bike lane that is not painted green. Due to the lack of unpainted curbside lanes to use as a control, this report compares compliance rates between green painted curbside bicycle lanes and non-curbside, unpainted bicycle lanes. As neither lane style features a protective buffer (e.g. median materials/plantings, barriers, repositioned parking lanes) NYCDOT believes that these lane types are similar enough to warrant a meaningful comparison. While all lane segments had similar land use characteristics, this study is unable to fully take into account the potential traffic pattern and volume differences that may arise from different land use and travel patterns. NYCDOT surveyors noted both the total number of drivers and cyclists and the drivers behavior and positioning on the road: standing in the bike lane, driving in the bike lane, and driving on the bike lane line. In addition, surveyors noted drivers awareness of cyclists on the road by noting the percentage of time that the bike lane was obstructed when cyclists were present. Chart 1: EVALUATION OF SOLID GREEN BICYCLE LANES TO INCREASE COMPLIANCE AND BICYCLE SAFETY-Study Locations ID # Street Borough Extents Green Paint? 1 Hoyt St Brooklyn State Street to Atlantic Avenue Yes 2 Clinton St Manhattan Delancey Street to Rivington Street Yes 3 Clinton St Brooklyn Hunts Lane to Remsen Street Yes 4 Prince St Manhattan Elizabeth Street to Mott Street Yes 5 Bleecker St Manhattan Leroy to Carmine Street Yes 6 Bleecker St Manhattan 6th Avenue to MacDougal Street No 7 E 10th Manhattan 1st Avenue to Avenue A No 5
7 8 Clinton St Brooklyn Remsen Street to Montague Street No 6


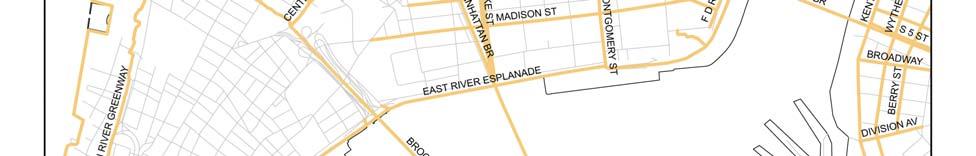
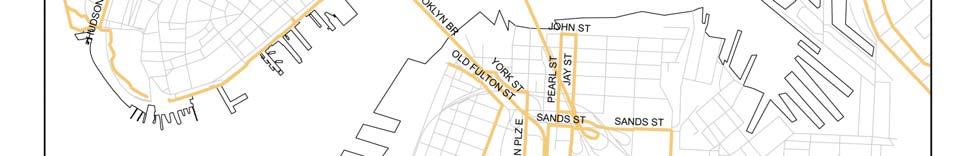
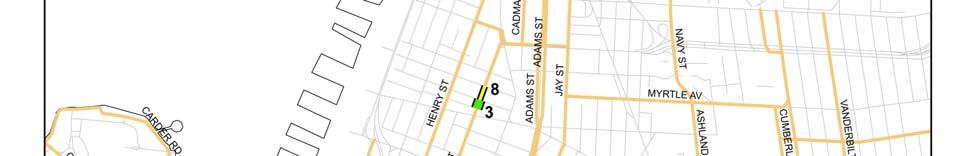
8 Figure 1: Study Locations 7
9 FINDINGS Does the use of the solid green marking prompt motorists to respect the bicycle lane (reducing encroachments) as well as be more aware of cyclists along the roadway? NYCDOT data indicates that the green paint treatment resulted in fewer instances of drivers encroaching on the bike lane by driving on the bike lane boundary line. Overall, 7% of drivers on the green paint treated streets drove on the bike lane boundary line as opposed to 16% of drivers on streets with the typical non-painted bike lane treatment. The data also showed fewer instances in driving in the bike lane; on average, 4% of drivers drove in the bike lane on green paint treated streets as opposed to 7% of typical streets. The frequency of standing or parking in the bike lane between the two different paint treatments was comparable. Driver behavior the likelihood of drivers driving in the bike lane did not seem to be influenced by the presence of cyclists in either lane type. On average, cyclists riding in the lane found it unobstructed in 96% of the cases on green paint treated lanes as opposed to 93% of cases on the typical non-painted lanes. A closer comparison of the two paired location sites, Clinton Street in Brooklyn, (sites #7 & #3 on the study locations map fig. 1 ) and Bleecker Street in Manhattan (sites # 5 & 6 on the study locations map fig. 1) suggests that the green paint may increase awareness of bicycle infrastructure more significantly than the data shows in aggregate. The Clinton Street green painted curbside lane extends from Joralemon Street to Tillary Street (0.3 lane miles) with a short unpainted gap between Remsen and Montague Streets. Land use characteristics along this corridor are fairly uniform. NYCDOT surveyors counted 881 vehicles and 117 cyclists at study location # 3 (painted) and 1,112 vehicles and 112 cyclists at location #8 (unpainted) one block north. Cyclists make up 12% of the total traffic volume at location #3 and 9% of the total traffic volume at location #8. 2 Over the study period, NYCDOT surveyors on Clinton Street reported that 1% of 2 Bicycle counts were conducted in September 2007 and September 2010 from 4-6pm on weekdays. The before count was conducted on Clinton Street, Brooklyn, between Montague and Pierpont (Pierrepont?) Streets, one block away from the 2010 count (location # 8). 8
10 drivers at location #3 (painted) drove in the bike lane as opposed to 11% of vehicles at location #8 (unpainted) one block north. An additional 7% of drivers at location #3 drove on the bike lane line as opposed to 16% at location #8. On Clinton Street, the green paint also seemed to also make drivers more aware of cyclists; at location #3 the Clinton Street lane was clear in 98% of the times when cyclists were in the lane as opposed to only 83% of the time at location #8. The green paint treatment is featured on Bleecker Street from Hudson Street to 6 th Avenue. Bleecker Street is unpainted east of 6 th Avenue; the green paint treatment resumes east of Lafayette Street. Land use characteristics along this corridor are fairly uniform. NYCDOT surveyors counted 985 vehiclesand 177 cyclists at study location # 5 (painted) and 910 cars and 315 cyclists at location #6 (unpainted) approximately two blocks east. Cyclists make up 15% of the total traffic volume at location #5 and 26% of the total traffic volume at location #6. On Bleecker Street, surveyors reported that 5% of drivers at location #5 (painted) drove on the bike lane line as opposed to 15% of cars at location #6 (unpainted). Does the solid green pavement marking increase bicycle use by providing a well-defined area for the bicyclist in the roadway? The unprecedented growth in cycling in New York City over the past four years makes it difficult to evaluate the second question, the impact of the green paint markings alone on bicycle use. For example, cycling on Clinton Street, Brooklyn (location # 8) increased by 58% from September 2007 to September However, commuter cycling in New York grew 321% from , with much of that growth occurring since 2006 when the City began its 200-lane-mile commitment to expand the existing cycling network. Commuter cycling has increased by 26% from 2008 to 2009 and more than doubled since While the green paint lanes are likely to be a factor in this growth, this report cannot separate their impact from the growth of the cycling network as a whole. Anecdotally, most cyclists like the green paint treatment and believe that it is more effective at keeping cars from parking in bike lanes than regular striping. In particular, cyclists cite the conspicuousness of cars parked in green painted lanes as a deterrent to drivers parking there. 3 Bicycle counts were conducted in September 2007 and September 2010 from 4-6pm on weekdays. The before count was conducted on Clinton Street, Brooklyn, between Montague and Pierpont (Pierrepont?) Streets, one block away from the 2010 count (location # 8). 9
11 CONCLUSIONS The data collected by NYCDOT suggests that the green paint treatment can enhance bike lane visibility and limit instances of drivers driving in the bike lane or on the dividing line. Drivers were less likely to drive on the bike lane line by an average of 9 percentage points if the lane was painted green than if it was not painted. Driver behavior the likelihood of drivers driving in the bike lane remained essentially constant in both lane types regardless of the presence of cyclists. On average, cyclists found the bike lane clear 93%-95% of the time. Significant increases in cycling in New York City over the past decade make it impossible to determine the exact impact of green painted lanes on cycling rates. Commuter cycling in New York City has increased by 26% from 2008 to 2009 and more than doubled since While the green paint lanes are likely to be a factor in this growth, this report cannot untangle their impact from the growth of the cycling network as a whole. Overall, the green painted lanes have contributed to general increases in cycling rates and safety in New York City. As cycling in New York City has increased, cyclist injuries and fatalities have fallen steadily. Cyclist injuries fell 44 percentage points from 1999 to Cyclist fatalities have fluctuated but trended downward during the same period. This increase in ridership and safety is concurrent with the installation of green painted lanes and overall expansion of the city s bicycle network. 10
12 Chart 2: EVALUATION OF SOLID GREEN BICYCLE LANES TO INCREASE COMPLIANCE AND BICYCLE SAFETY-Findings Green Paint Unpainted Lane is clear when cyclist Driver Behavior present? ID # Cyclists Cars Standing in bike lane Driving in bike lane On bike lane line In travel lane Yes No Bicycles as % of all vehicles 1 Hoyt Street (BK) % 1% 6% 93% 98% 2% 22% 2 Clinton Street (MN) 152 1,266 1% 9% 9% 81% 88% 13% 11% 3 Clinton Street (BK) % 1% 7% 92% 98% 2% 12% 4 Prince Street (MN) % 2% 10% 87% 98% 2% 37% 5 Bleecker Street (MN) % 2% 5% 93% 97% 3% 15% - All Green 623 3,027 1% 4% 7% 89% 96% 4% 17% 6 Bleecker Street (MN) % 1% 15% 84% 100% 0% 26% 7 E.10th Street (MN) % 7% 20% 71% 89% 11% 32% 8 Clinton Street (BK) 112 1,112 0% 11% 16% 72% 83% 13% 9% - All Unpainted 626 2,437 1% 7% 16% 76% 93% 13% 20% All data collected in September, 2010 during the PM rush (4pm-6pm)
13 EVALUATION OF SOLID GREEN BICYCLE LANES TO INCREASE COMPLIANCE AND BICYCLE SAFETY: Study Locations 1
14 Figure 2: Existing Green Lanes 2


15 Study Location #1: Hoyt Street, Brooklyn Extents: State Street to Atlantic Ave. Study Location #2: Clinton Street, Manhattan Extents: Delancey Street to Rivington Street


16 Study Location #3: Clinton Street, Brooklyn Extents: Hunts Lane to Remsen Street Study Location #4: Prince Street, Manhattan Extents: Elizabeth Street to Mott Street 1


17 Study Location #5: Bleecker Street, Manhattan Extents: 6 th Ave. to MacDougal Street) Study Location #6: East 10th Street, Manhattan Extents: 1 st Ave. to Ave. A 2

18 Study Location #7: Clinton Street, Brooklyn Extents: Remsen Street to Montague Street 3
19 RELATED FINDINGS Commuter cycling rates in New York City have risen dramatically over the past decade, a 321% increase from 1999 to Commuter cycling increased by 26% between and more than doubled since Concurrent with this increase in commuter cycling, cyclist injuries and fatalities have fallen steadily. Cyclist injuries fell 44 percentage points from 1999 to Cyclist fatalities have fluctuated but trended downward during the same period. Much of the growth in cycling occurred since 2006 when NYCDOT began implementing its ambitious plan to install 200 lane miles of bicycle network in three years and complete the city s Bicycle Master Plan by NYC Cycling Growth vs. Injuries % Change Cyclist Injuries Cyclist Fatalities Commuter Cycling Indicator Figure 3: Cycling Growth vs. Injuries & Fatalities (Data from NYCDOT & NYSDOT) The City of Portland, Oregon has experimented with colored markings at bicyclemotor vehicle crossings. The results of their experiments are contained in the Document Portland s Blue Bike Lanes Improved Safety through Enhanced Visibility, City of Portland Office of Transportation July 1, The conclusions included in this report indicated, among other results, statistically significant increases in motorists yielding to cyclists and an increase in motorists slowing or stopping when approaching conflict areas4. 4 City of Portland Office of Transportation, Portland s Blue Bike Lanes Improved Safety through Enhanced Visibility, July 1, 1999 p
FEDERAL HIGHWAY ADMINISTRATION APPLICATION
 FEDERAL HIGHWAY ADMINISTRATION APPLICATION REQUEST FOR PERMISSION TO EXPERIMENT WITH A BICYCLE BOX INTERSECTION TREATMENT Submitted by: City of Columbus Department of Public Service Date: June 26, 2009
43 rd Avenue, Skillman Avenue Protected Bike Lanes
 43 rd Avenue, Skillman Avenue Protected Bike Lanes Presented to Queens Community Board 2 Transportation Committee - November 6, 2017 43 rd Avenue, Skillman Avenue: Presentation Overview Background Project
MEMORANDUM. Charlotte Fleetwood, Transportation Planner
 MEMORANDUM Date: Updated August 22, 2017 To: Organization: Charlotte Fleetwood, Transportation Planner Boston Transportation Department From: Jason DeGray, P.E., PTOE, Regional Director of Engineering
Welcome! San Jose Avenue Open House August 25, 2015
 Welcome! San Jose Avenue Open House August 25, 2015 Vision Zero The City and County of San Francisco adopted Vision Zero San Francisco Vision Zero High Injury Network as a policy in 2014, committing an
REGIONAL BICYCLE AND PEDESTRIAN DESIGN GUIDELINES
 REGIONAL BICYCLE AND PEDESTRIAN DESIGN GUIDELINES November 16, 2011 Deb Humphreys North Central Texas Council of Governments Bicycle and Pedestrian Advisory Committee Snapshot of the Guide 1. Introduction
Active Transportation Facility Glossary
 Active Transportation Facility Glossary This document defines different active transportation facilities and suggests appropriate corridor types. Click on a facility type to jump to its definition. Bike
Transportation Issues Poll for New York City
 2016-17 Transportation Issues Poll for New York City 82% support Vision Zero and reducing traffic deaths 72% on average, support more street space for children to play, protected bike lanes and other safety
MUTCD Part 6G: Type of Temporary Traffic Control Zone Activities
 MUTCD Part 6G: Type of Temporary Traffic Control Zone Activities 6G.01 Typical Applications Each temporary traffic control (TTC) zone is different. Many variables, such as location of work, highway type,
Dear Mr. Tweed: Sincerely, Min Zhou, P.E. Vice President
 December 17, 2012 Mr. Steve Tweed City of Long Beach, Department of Public Works Traffic & Transportation Bureau, 10 th Floor City Hall 333 West Ocean Boulevard Long Beach, CA 90802 Subject: Broadway and
City of Albert Lea Policy and Procedure Manual 4.10 ALBERT LEA CROSSWALK POLICY
 4.10 ALBERT LEA CROSSWALK POLICY PURPOSE: Pedestrian crosswalks are an integral part of our transportation infrastructure. To be effective and promote safety, marked crosswalks must be installed after
RED COLORED TRANSIT-ONLY LANES REQUEST TO EXPERIMENT
 RED COLORED TRANSIT-ONLY LANES REQUEST TO EXPERIMENT Submitted to: California Traffic Control Devices Committee Federal Highway Administration, Office of Traffic Operations Submitted by: San Francisco
Most Dangerous Roads for Walking And How States Can Make them Safer. Route 110, Long Island, New York Image by Dougtone
 Most Dangerous Roads for Walking And How States Can Make them Safer Route 110, Long Island, New York Image by Dougtone Tri-State Transportation Campaign February 2013 Introduction Key Findings More than
Pavement Markings (1 of 3)
") Pavement Markings (1 of 3) DESCRIPTION AND DEFINITION Disadvantages Relatively high cost (over typical Crash reduction as yet unknown painted edge line) No tactile effect The STOP AHEAD pavement marking
Pavement Markings (1 of 3) DESCRIPTION AND DEFINITION Disadvantages Relatively high cost (over typical Crash reduction as yet unknown painted edge line) No tactile effect The STOP AHEAD pavement marking
Date: April 4, Project #: Re: A Street/Binford Street Traffic/Intersection Assessment
 To: Peter Cavanaugh General Electric From: David Bohn, PE Ryan White, PE Date: April 4, 217 Project #: 13421. Re: / Traffic/Intersection Assessment Consistent with the Cooperation Agreement between the
Pedestrians safety. ROAD SAFETY SEMINAR PIARC/AGEPAR/GRSP Lome, Togo October 2006 Lise Fournier, Canada-Qu
 Pedestrians safety ROAD SAFETY SEMINAR Lome, Togo October 2006 Lise Fournier, Canada-Qu Québec Contents WHO s data Risk factors Pedestrian needs Pedestrian facilities Conclusion Source: WHO WHO reports
G AT E WAY PLAN. Community BRIEFING KIT GATEWAY BIKE
 G AT E WAY PLAN GATEWAY BIKE Community BRIEFING KIT PLAN August 2016 TABLE OF CONTENTS INTRODUCTION... 1 THE BENEFITS OF A BIKEABLE COMMUNITY... 2 ECONOMY...2 SAFETY...3 HEALTH...3 HOUSEHOLD SPENDING...3
Clybourn Ave. Protected Bike Lane Study Halsted St. to Division St.
 Clybourn Ave. Protected Bike Lane Study Halsted St. to Division St. Nathan Roseberry, Senior Engineer Pam Broviak, Project Manager July 24, 2014 Agenda Project Goals Existing Roadway Conditions Traffic
Small Town & Rural Multimodal Networks
 Small Town & Rural Multimodal Networks Fred Young, PLA Andrea Clinkscales, AICP, PMP Alta Planning + Design Funding Partners Project Team Existing Design Guidance AASHTO Flexibility Guide 2004 AASHTO Bike
New York City School Safety Engineering Program. Jackson Wandres The RBA Group June 09, 2005
 8,008,271 858,661 New York City School Safety Engineering Program Jackson Wandres The RBA Group June 09, 2005 Office of School Safety Engineering Project Goals 1) Improve traffic and pedestrian safety.
EUCLID AVENUE PARKING STUDY CITY OF SYRACUSE, ONONDAGA COUNTY, NEW YORK
 EUCLID AVENUE PARKING STUDY CITY OF SYRACUSE, ONONDAGA COUNTY, NEW YORK CITY OF SYRACUSE DEPARTMENT OF PUBLIC WORKS 1200 CANAL STREET EXTENSION SYRACUSE, NEW YORK 13210 DRAFT REPORT DATE: November 13,
Why Zone In on Speed Reduction?
 Learn it. Do it. Live it! SPEED REDUCTION IN THE ZONE Why Zone In on Speed Reduction? Speeding is a serious issue that plays a major role in the risk of serious injury and pedestrian fatality in a crash.
TOWN OF PAYSON TRAFFIC CALMING MANUAL
 TOWN OF PAYSON TRAFFIC CALMING MANUAL APPROVED BY THE PAYSON TOWN COUNCIL SEPTEMBER 6, 2007 TOWN OF PAYSON TRAFFIC CALMING POLICY 1.0 Introduction Traffic Calming involves retrofitting physical devices
Draft North Industrial Area-Wide Traffic Plan
 Summary of North Industrial and Hudson Bay Industrial Recommended Improvements Table 1. Summary of s Item Location 1 2 3 4 5 6 7 8 9 10 11 12 Millar Ave north of 51st St Super 8 Motel back lane 400 Block
Designing for Pedestrian Safety
 Designing for Pedestrian Safety Treatments at Unsignalized Pedestrian Crossings Presented by: Charlie Zegeer PBIC Director August 17, 2010 Crossing Crashes Part 1: General Principles 3 2 Why do people
Off-road Trails. Guidance
 Off-road Trails Off-road trails are shared use paths located on an independent alignment that provide two-way travel for people walking, bicycling, and other non-motorized users. Trails specifically along
Zlatko Krstulich, P.Eng. City of O9awa
 Zlatko Krstulich, P.Eng. City of O9awa 1. Introduction to the Ontario Traffic Manual Series 2. What is OTM Book 18: Bicycle Facilities? 3. Study / Committee Team Members 4. Brief overview of the content
TRANSPORTATION ANALYSIS REPORT US Route 6 Huron, Erie County, Ohio
 TRANSPORTATION ANALYSIS REPORT US Route 6 Huron, Erie County, Ohio December 12, 2012 Prepared for: The City of Huron 417 Main Huron, OH 44839 Providing Practical Experience Technical Excellence and Client
Arlington County, Virginia ~ National Capital Region Transportation Planning Board (TPB) Transportation and Land-Use Connections (TLC) Program
 Transportation and Land-Use Connections (TLC) Program") Arlington County, Virginia ~ National Capital Region Transportation Planning Board (TPB) Transportation and Land-Use Connections (TLC) Program May 4, 2011 Nature of the Problem European and US Best Practices
Arlington County, Virginia ~ National Capital Region Transportation Planning Board (TPB) Transportation and Land-Use Connections (TLC) Program May 4, 2011 Nature of the Problem European and US Best Practices
Toronto Complete Streets Guidelines
 88 90 5.1 Cycling Design Principles 92 5.2 Context-sensitive Cycling Facilities 96 5.3 Key Cycling Elements Cycling infrastructure provides choice in how people are able to move around the city. Cyclists
Project Goal and Description. Why Broadway? Broadway SFMTA.COM/BROADWAY. The goal of the Broadway Safety Improvement
 PROJECT OVERVIEW Project Goal and Description The goal of the Broadway Safety Improvement d St Van Ness Ave Project is to improve safety and comfort for all who Franklin St Hyde St Octavia St Gough St
PRELIMINARY DRAFT FIRST AMENDMENT TO VISION 2050: A REGIONAL LAND USE AND TRANSPORTATION PLAN FOR SOUTHEASTERN WISCONSIN
 PRELIMINARY DRAFT FIRST AMENDMENT TO VISION 2050: A REGIONAL LAND USE AND TRANSPORTATION PLAN FOR SOUTHEASTERN WISCONSIN ESTABLISHING TARGETS FOR FEDERAL PERFORMANCE MEASURES: HIGHWAY SAFETY SOUTHEASTERN
Bicycle - Motor Vehicle Collisions on Controlled Access Highways in Arizona
 Bicycle - Motor Vehicle Collisions on Controlled Access Highways in Arizona Analysis from January 1, 1991 to June 30, 2002 Richard C. Moeur, PE Traffic Design Manager, Northern Region Michelle N. Bina
Roadways. Roadways III.
 Introduction 97 Roadway Design Principles 98 Safe Speeds 99 Optimizing of Street Space 00 Minimum Lane Widths in the City of Boston 02 Design Features that Reduce Operating Speeds 05 Travel Lanes Transit
CHAPTER 1 STANDARD PRACTICES
 CHAPTER 1 STANDARD PRACTICES OBJECTIVES 1) Functions and Limitations 2) Standardization of Application 3) Materials 4) Colors 5) Widths and Patterns of Longitudinal Pavement Marking Lines 6) General Principles
UNCONTROLLED PEDESTRIAN CROSSING GUIDELINES
 City and County of Denver UNCONTROLLED PEDESTRIAN CROSSING GUIDELINES Prepared for: Prepared by: Adopted September 2016 This page is intentionally left blank. Contents for Denver Uncontrolled Pedestrian
40 th Street Green Shared Lane Evaluation DRAFT May 2014
 DRAFT May 2014 Table of Contents Introduction & Problem Statement... 2 Problem Statement... 4 Location of Proposed Experiment... 5 Description and Use of the Proposed Traffic Control Device... 6 Background/Literature
DEPARTMENT OF ENVIRONMENTAL SERVICES. North Harrison Street (Lee Highway to Little Falls Road) Comparative Analysis. Prepared for:
 Comparative Analysis. Prepared for:") DEPARTMENT OF ENVIRONMENTAL SERVICES North Harrison Street (Lee Highway to Little Falls Road) Comparative Analysis Prepared for: Arlington County Department of Environmental Services 2100 Clarendon Boulevard,
DEPARTMENT OF ENVIRONMENTAL SERVICES North Harrison Street (Lee Highway to Little Falls Road) Comparative Analysis Prepared for: Arlington County Department of Environmental Services 2100 Clarendon Boulevard,
CITY OF NEW ORLEANS. Department of Public Works. Baronne Street Bike Lane
 CITY OF NEW ORLEANS Department of Public Works Baronne Street Bike Lane 9/17/2014 Agenda Welcome Greg Lawson, Office of Neighborhood Engagement Introduction - Deputy Mayor Andy Kopplin, Chief Administrative
Pedestrian & Bicycle Safety Innovations & Applications
 Pedestrian & Bicycle Safety Innovations & Applications County Engineers Association of Maryland Spring, 2017 Conference May 25, 2017 George Branyan Pedestrian Program Coordinator District Department of
MEMORANDUM. Date: 9/13/2016. Citywide Crosswalk Policy
 MEMORANDUM Date: 9/13/2016 Re: Citywide Crosswalk Policy Foreword Through the s Circulation Element and Complete Streets Policy, it is the City s goal to promote walking trips and provide safe facilities
Designing for Pedestrian Safety in Washington, DC
 Designing for Pedestrian Safety in Washington, DC February 25, 2014 George Branyan Pedestrian Program Coordinator District Department of Transportation DC Journey to work mode split: 2012 Means of Transportation
Bicycle and Pedestrian Level of Service Evaluation
 Bicycle and Pedestrian Level of Service Evaluation June 214 Florida Department of Transportation Bicycle and Pedestrian Evaluation Prepared by Sprinkle Consulting Cambridge Systematics For the Florida
Lessons Learned from Cycle Tracks (Class IV Bikeways) Design Practice
 Design Practice") Lessons Learned from Cycle Tracks (Class IV Bikeways) Design Practice By: Min Zhou, P.E., Principal/Vice President KOA Corporation 1 What is a Cycle Track (Class IV) TYPICAL BIKEWAY CLASSIFICATION CLASS
Lessons Learned from Cycle Tracks (Class IV Bikeways) Design Practice By: Min Zhou, P.E., Principal/Vice President KOA Corporation 1 What is a Cycle Track (Class IV) TYPICAL BIKEWAY CLASSIFICATION CLASS
Engineering and Traffic Investigation Providing Justification for Lowering Default Arterial and Non-Arterial Speed Limits
 Engineering and Traffic Investigation Providing Justification for Lowering Default Arterial and Non-Arterial Speed Limits August 2016 Overview Seattle is committed to improving public health and safety
US Hwy. 64/264 Pedestrian Crossing at the Little Bridge Alternatives Analysis Public Meeting
 Town of Nags Head US Hwy. 64/264 Pedestrian Crossing at the Little Bridge Alternatives Analysis Public Meeting Prepared by: Department of Public Works August 8, 2013 Where traffic-control signals are not
C/CAG. Sunnybrae Elementary School Walking and Bicycling Audit. San Mateo-Foster City School District JUNE 2013
 Sunnybrae Elementary School Walking and Bicycling Audit JUNE 2013 San Mateo-Foster City School District C/CAG City/County Association of Governments of San Mateo County SUNNYBRAE ELEMENTARY SCHOOL WALKING
RE: City of Portland Request to Experiment with HAWK/Bike signal
 October 4, 2005 Regina S. McElroy, Director Office of Transportation Operations HOTO Room 3401 400 7 th Street, S.W. Washington, D.C. 20590 RE: City of Portland Request to Experiment with HAWK/Bike signal
TRAFFIC IMPACT ANALYSIS
 TRAFFIC IMPACT ANALYSIS FOR THE CHAMPAIGN UNIT#4 SCHOOL DISTRICT PROPOSED HIGH SCHOOL (SPALDING PARK SITE) IN THE CITY OF CHAMPAIGN Final Report Champaign Urbana Urbanized Area Transportation Study 6/24/2014
APPENDIX A: Complete Streets Checklist DRAFT NOVEMBER 2016
 APPENDIX A: Complete Streets Checklist DRAFT NOVEMBER 2016 Complete Streets Checklist MetroPlan Orlando s Complete Streets Checklist is an internal planning tool for staff to further implementation of
Complete Street Analysis of a Road Diet: Orange Grove Boulevard, Pasadena, CA
 Complete Street Analysis of a Road Diet: Orange Grove Boulevard, Pasadena, CA Aaron Elias, Bill Cisco Abstract As part of evaluating the feasibility of a road diet on Orange Grove Boulevard in Pasadena,
MOBILITY RESULTS AREA. Budgeting For Outcomes Council Presentation January 12, 2007
 MOBILITY RESULTS AREA Budgeting For Outcomes Council Presentation January 12, 2007 Mobility Results Team Members 2 Hammond Perot, OED, Co-Team Leader Bonnie Meeder, DEV (returning), Co-Team Leader Peer
CURBSIDE ACTIVITY DESIGN
 5 CURBSIDE ACTIVITY DESIGN This chapter provides design guidance for separated bike lanes adjacent to curbside activities including parking, loading and bus stops. Typical configurations are presented
Data Analysis February to March Identified safety needs from reported collisions and existing travel patterns.
 Welcome! Thank you for participating in today s Valencia Bikeway Improvements workshop. Data Analysis February to March Identified safety needs from reported collisions and existing travel patterns. Initial
ITS-NY ANNUAL MEETING Bus Rapid Transit in New York City: Bus Lane Operations on One-Way Arterial Streets
 ITS-NY ANNUAL MEETING Bus Rapid Transit in New York City: Bus Lane Operations on One-Way Arterial Streets June 9, 2011 Ted Orosz AICP, Director Long Range Bus Planning MTA New York City Transit 1 Overview
6.0 PEDESTRIAN AND BICYCLE FACILITIES 6.1 INTRODUCTION 6.2 BICYCLE DEMAND AND SUITABILITY Bicycle Demand
 6.0 PEDESTRIAN AND BICYCLE FACILITIES 6.1 INTRODUCTION Bicycle and pedestrian travel along and in the vicinity of the corridor is part of the vision of Somerset and Hunterdon counties and the integrated
SLOW DOWN A STUDY OF SPEEDING ON MCGUINNESS BLVD
 SLOW DOWN A STUDY OF SPEEDING ON MCGUINNESS BLVD ACKNOWLEDGEMENTS This report was prepared by Shawn Macias, in consultation with the McGuinness Boulevard Working Group. This report would not have been
Northbound San Jose Avenue & I-280 Off-Ramp Road Diet Pilot Project
 Project Overview Fed by a two-lane Interstate-280 (I-280) off-ramp, high vehicular volumes and speeds are longstanding issues along San Jose Avenue. Residents in the surrounding neighborhoods have expressed
Safety and Active Transport. Dr. Maureen Carew, Medical Officer of Health Renfrew County and District Health Unit May 30, 2014
 Safety and Active Transport Dr. Maureen Carew, Medical Officer of Health Renfrew County and District Health Unit May 30, 2014 Active Transport Vision Increase levels of walking and cycling Reduce vehicle
PEDESTRIAN/BICYCLE CRASH STUDY
 PEDESTRIAN/BICYCLE CRASH STUDY This report summarizes an analysis of pedestrian and bicycle crashes that has been conducted by the CRCOG staff. In 2004, CRCOG completed a study of pedestrian crash data
Agenda. Overview PRINCE GEORGE S PLAZA METRO AREA PEDESTRIAN PLAN
 PRINCE GEORGE S PLAZA METRO AREA PEDESTRIAN PLAN May 28, 2008 Agenda Welcome and introductions Project overview and issue identification Planning context and strengths Design challenges and initial recommendations
Data Analysis February to March Identified safety needs from reported collisions and existing travel patterns.
 Welcome! Thank you for participating in today s Valencia Bikeway Improvements workshop. Data Analysis February to March Identified safety needs from reported collisions and existing travel patterns. Initial
PEDALING FORWARD. A Glance at the SFMTA s Bike Program for SFMTA.COM
 PEDALING FORWARD A Glance at the SFMTA s Bike Program for 2017-2021 SFMTA.COM INTRODUCTION About This Booklet More people from all walks of life see their bicycle as a more convenient way to get where
ADVISORY BICYCLE LANES REALITY VERSUS DESIGN GUIDANCE
 Michael Williams 0 ADVISORY BICYCLE LANES REALITY VERSUS DESIGN GUIDANCE Michael Williams (Corresponding author) Alta Planning + Design SE Grand Avenue Portland, OR Email: michaelwilliams@altaplanning.com
Caltrans Sloat Boulevard Pedestrian Safety Project Response to Community Questions, Comments & Concerns
 Caltrans Sloat Boulevard Pedestrian Safety Project Response to Community Questions, Comments & Concerns Revised: May 10, 2016 The California Department of Transportation (Caltrans) is planning various
CONNECTING PEOPLE TO PLACES
 CONNECTING PEOPLE TO PLACES 82 EAST BENCH MASTER PLAN 07 Introduction The East Bench transportation system is a collection of slow moving, treelined residential streets and major arteries that are the
Bicycle Network. Vision Zero San Francisco The City and County of San
 PROJECT BACKGROUND Project Needs 1. 17th between Church and Sanchez is identified as a location where there is a disproportionate number of crashes involving people riding bikes. 2. There is currently
Truck Climbing Lane Traffic Justification Report
 ROUTE 7 (HARRY BYRD HIGHWAY) WESTBOUND FROM WEST MARKET STREET TO ROUTE 9 (CHARLES TOWN PIKE) Truck Climbing Lane Traffic Justification Report Project No. 6007-053-133, P 101 Ι UPC No. 58599 Prepared by:
Road Safety Audit Course Participant Guidebook. August 22 & 23, Cleveland Avenue Columbus, Ohio
 Road Safety Audit Course Participant Guidebook August 22 & 23, 2017 Cleveland Avenue Columbus, Ohio 1 2 Table of Contents Executive Summary... 5 Cleveland Avenue City of Columbus... 6 Road Location Details...
Appendix C. City of Fort Collins Recommended Bicycle Design Guidelines. Appendix C: Recommended Bicycle Design Guidelines 1
 Appendix C City of Fort Collins Recommended Bicycle Design Guidelines Appendix C: Recommended Bicycle Design Guidelines 1 This appendix provides general design considerations for implementation of bicycle
The DC Pedestrian Master Plan
 The DC Pedestrian Master Plan September 28, 2010 George Branyan Pedestrian Program Coordinator District Department of Transportation Presentation Agenda Scope of the Plan Methodology Recommendations Implementation
General Design Factors
 Chapter 3: 3-1.0 Introduction General Design Factors Mn/DOT s goals include encouraging and accommodating safe bicycling. From a design perspective, these goals are achieved by first having an understanding
Northeast 65 th Street Vision Zero Project Proposals From A Roosevelt High School Student Joe Mangan
 Northeast 65 th Street Vision Zero Project Proposals From A Roosevelt High School Student Joe Mangan PROPOSALS: 1. Extend raised cycle tracks down 65 th Street Northeast. Please do not consider any other
SCHOOL CROSSING PROTECTION CRITERIA
 CITY OF MADISON TRAFFIC ENGINEERING SCHOOL CROSSING PROTECTION CRITERIA January 2016 Adopted as Policy on August 31, 1976, by Common Council by Amended Resolution #29,540 Amended on September 14, 1976,
Bicycle Boulevards and Neighborhood Greenways
 Bicycle Boulevards and Neighborhood Greenways Traffic Safety is Improving for Everyone 90 80 70 60 50 40 30 20 10 0 PORTLAND: TOTAL TRAFFIC FATALITIES 1986-2008 1986 1987 1988 1989 1990 1991 1992 1993
Proposed Bridge Street East Bicycle Lanes Public Open House Thursday, April 27, 2017
 WELCOME Proposed Bridge Street East Bicycle Lanes Public Open House Thursday, April 27, 2017 Purpose of the Open House The purpose of this Open House is to gain public input on the bicycle lanes proposed
EVALUATION OF A GREEN BIKE LANE WEAVING AREA IN ST. PETERSBURG, FLORIDA. William W. Hunter Senior Research Scientist
 EVALUATION OF A GREEN BIKE LANE WEAVING AREA IN ST. PETERSBURG, FLORIDA William W. Hunter Senior Research Scientist Raghavan Srinivasan Senior Transportation Research Engineer Carol A. Martell Senior Applications
Tunnel Reconstruction South 5 th Street Association October 16, 2018
 Tunnel Reconstruction South 5 th Street Association October 16, 2018 Reconstructing the Tunnel 2 Service During Tunnel Reconstruction April 2019 through July 2020 3 Projected Cross River Travel Paths of
Pedestrian Safety at Roundabouts. Presentation to the Howard-Suamico School Board November 26, 2007
 Pedestrian Safety at Roundabouts Presentation to the Howard-Suamico School Board November 26, 2007 Roundabouts that have replaced stop signs and traffic signals have reduced the number and severity of
Designing for Pedestrian Safety. Alabama Department of Transportation Pre-Construction Conference May 2016
 Designing for Pedestrian Safety Alabama Department of Transportation Pre-Construction Conference May 2016 1 Designing for Pedestrians Marking Crosswalks at Signalized intersections High Visibility Markings
Bicycle-Specific Traffic Control Is it "Bicycle-Friendly"?
 Bicycle-Specific Traffic Control Is it "Bicycle-Friendly"? Richard C. Moeur, P.E. In the United States, the Uniform Vehicle Code and most state laws treat bicyclists as having much the same rights and
LANCASTER CITY BICYCLE NETWORK
 LANCASTER CITY BICYCLE NETWORK Downtown Merchants Meeting Wednesday, July 19, 2017 http://www.lancasteratp. DOWNTOWN WALKABILITY ANALYSIS What changes can be made, in the least amount of time, and for
Kentucky s Surface Transportation System
 Kentucky s Surface Transportation System ROAD AND BRIDGE CONDITIONS, TRAFFIC SAFETY, TRAVEL TRENDS, AND NEEDS MARCH 2018 PREPARED BY WWW.TRIPNET.ORG Founded in 1971, TRIP of Washington, DC, is a nonprofit
CITY OF WEST LAKE HILLS. Forest View Neighborhood Traffic Calming Study
 CITY OF WEST LAKE HILLS 901 South Mopac Expressway Building V, Suite 220 Austin, Texas 78746 Texas P.E. Firm Registration No. F-929 Klotz Associates Final Report Submittal: March 20, 2015 Revised Final
Appendix T CCMP TRAIL TRAFFIC & TRANSPORTATION DESIGN STANDARD
 Appendix T CCMP 3.3.4 TRAIL TRAFFIC & TRANSPORTATION DESIGN STANDARD 3.3.4 Trail Traffic and Transportation Design Multi-use trails have certain design standards, which vary depending on the agency that
PRINCE GEORGE S PLAZA METRO AREA PEDESTRIAN PLAN
 PRINCE GEORGE S PLAZA METRO AREA PEDESTRIAN PLAN May 28, 2008 Agenda Welcome and introductions Project overview and issue identification Planning context and strengths Design challenges and initial recommendations
157 Chapter 6: Bicycles
 Chapter 6: Bicycles 157 158 Bicycle use continues to increase as more people use a bicycle for transportation, recreation, physical fitness and energy conservation. Cyclists must obey the rules of the
An Assessment of Potential Greenhouse Gas Emissions Reductions from Proposed On Street Bikeways
 An Assessment of Potential Greenhouse Gas Emissions Reductions from Proposed On Street Bikeways Through the Sustainable Bethlehem Initiative, the Town of Bethlehem has identified both the improvement of
Access Management in the Vicinity of Intersections
 Access Management in the Vicinity of Intersections FHWA-SA-10-002 Technical Summary Photo: Ralph Bentley (used with permission) 0 Access Management is: The design, implementation and management of entry
SPEED MANAGEMENT FOR VISION ZERO
 SPEED MANAGEMENT FOR VISION ZERO LUANN HAMILTON, DEPUTY COMMISSIONER FOR PROJECT DEVELOPMENT CHICAGO DEPARTMENT OF TRANSPORTATION NACTO DESIGNING CITIES 2017 Vision Zero Action Plan Speed management and
2018 AASHTO BIKE GUIDE
 2018 AASHTO BIKE GUIDE Your presenter Rob Burchfield, PE NW Regional Engineering Director 35 years of experience in traffic engineering and bicycle facility design Toole Design Group Toole Design Group
MEMORANDUM INTRODUCTION/PURPOSE/OVERALL FINDINGS
 MEMORANDUM Date: To: From: Subject: Steve, City of Tacoma Dan Grayuski and Will Lisska, Fehr & Peers Schuster Corridor Trail Project SE12-0265.00 INTRODUCTION/PURPOSE/OVERALL FINDINGS The City of Tacoma
Improving Cyclist Safety at the Dundas Street West and Sterling Road Intersection
 STAFF REPORT ACTION REQUIRED Improving Cyclist Safety at the Dundas Street West and Sterling Road Intersection Date: August 17, 2012 To: From: Wards: Reference Number: Public Works and Infrastructure Committee
Cycling and risk. Cycle facilities and risk management
 Cycling and risk Cycle facilities and risk management Failure to recognize possibilities is the most dangerous and common mistake one can make. Mae Jemison, astronaut 6/11/2010 York Regional Council Cycling
Bay to Bay Boulevard Complete Streets Project
 Bay to Bay Boulevard Complete Streets Project Dale Mabry Highway to Bayshore Boulevard February 08, 2018 Photo Source: Tampa Bay Times Alessandra Da Pra Meeting Format Introduction Resurfacing Information
COWETA HIGH SCHOOL AND EAST HIGHWAY 51
 COWETA HIGH SCHOOL AND EAST HIGHWAY 51 Lack of sidewalks along Ben Lumpkin Rd. Lack of crosswalks and ramps at intersection. Hwy 51 is wide to cross as a pedestrian. No ADA compliance or connection to
Acknowledgements. Mr. David Nicol 3/23/2012. Daniel Camacho, P.E. Highway Engineer Federal Highway Administration Puerto Rico Division
 Daniel Camacho, P.E. Highway Engineer Federal Highway Administration Puerto Rico Division Acknowledgements Mr. David Nicol Director, FHWA Office of Safety FHWA Office of Safety http://safety.fhwa.dot.gov/provencountermeasures/
2018 AASHTO BIKE GUIDE
 2018 AASHTO BIKE GUIDE Your presenters Jessica Fields, PE Denver Office Director Sagar Onta, PE, PTOE Denver Engineering Director 35 years of combined experience street design, transportation planning,
Memorandum. Exhibit 60 SSDP To: Jenny Bailey, Senior Planner. From: Bill Schultheiss, P.E. (WA. P.E. #46108) Date: June 20, 2017
 Date: June 20, 2017") Memorandum To: Jenny Bailey, Senior Planner From: Bill Schultheiss, P.E. (WA. P.E. #46108) Date: June 20, 2017 Re: East Lake Sammamish Trail, Segment 2B Review King County has asked Toole Design Group
Memorandum To: Jenny Bailey, Senior Planner From: Bill Schultheiss, P.E. (WA. P.E. #46108) Date: June 20, 2017 Re: East Lake Sammamish Trail, Segment 2B Review King County has asked Toole Design Group
Access Management Regulations and Standards
 Access Management Regulations and Standards Efficient highway operation Reasonable property access Concept of Access Management The way to manage access to land development while simultaneously preserving
CITY OF SARATOGA SPRINGS PEDESTRIAN CROSSING TOOLBOX
 CITY OF SARATOGA SPRINGS PEDESTRIAN CROSSING TOOLBOX This toolbox is to be used to guide pedestrian crossing improvements within the City of Saratoga Springs. Details for each crossing type are provided.