Tracking Bicyclists' Route Choices, Case Study: The Ohio State University
|
|
|
- Thomasina Lindsey
- 6 years ago
- Views:
Transcription
1 MN WI MI IL IN OH USDOT Region V Regional University Transportation Center Final Report NEXTRANS Project No. 171OSUY2.2 Tracking Bicyclists' Route Choices, Case Study: The Ohio State University By Gulsah Akar, Ph.D. Associate Professor City & Regional Planning, Knowlton School The Ohio State University akar.3@osu.edu and Yujin Park, Ph.D. Candidate Research Assistant City & Regional Planning, Knowlton School The Ohio State University park.2329@osu.edu
2 DISCLAIMER Funding for this research was provided by the NEXTRANS Center, Purdue University under Grant No. DTRT12 G UTC05 of the U.S. Department of Transportation, Office of the Assistant Secretary for Research and Technology (OST R), University Transportation Centers Program. The contents of this report reflect the views of the authors, who are responsible for the facts and the accuracy of the information presented herein. This document is disseminated under the sponsorship of the Department of Transportation, University Transportation Centers Program, in the interest of information exchange. The U.S. Government assumes no liability for the contents or use thereof.
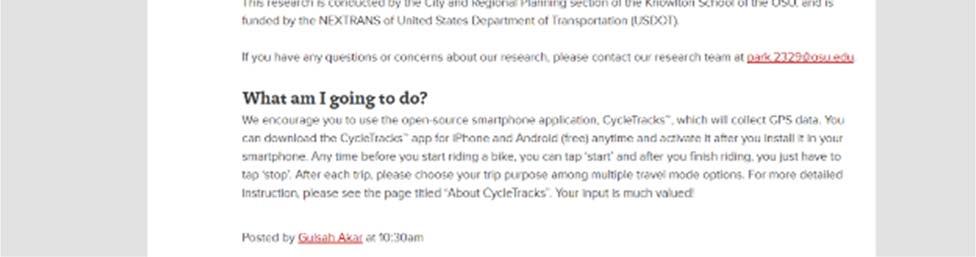
3 MN WI MI IL IN OH USDOT Region V Regional University Transportation Center Final Report TECHNICAL SUMMARY NEXTRANS Project No. 171OSUY2.2 Final Report, August, 2017 Tracking Bicyclists Route Choices, Case Study: The Ohio State University Introduction Bicycles have low access costs and moderate travel speeds, reduce congestion, help protect the environment and bring many health benefits (Clifton & Akar, 2009). Within these considerations, several researchers have explored the factors associated with bicycling choice to understand the needs of bicyclists and increase bicycle mode share. Existing literature identified socio demographics, built environment, road conditions and land use patterns as factors associated with bicycling choice in general (Pucher et al., 2011; Dill and Carr, 2003). Among these, presence of bicycle facilities, motor vehicle traffic characteristics, surface quality, neighboring land uses are cited as factors affecting bicycling route choices (Broach et al. 2012). There is increasing interest among colleges and universities in ways to reduce local congestion, contributions to greenhouse gases, and provide leadership in sustainable transportation. This study brings these two emerging areas together: analyzing campus transportation patterns and identifying the factors associated with bicycle trip generation and bicycle route choices using state of the art data collection techniques at a large university campus, The Ohio State University (OSU). The origins, destinations and routes of bicycle trips are collected through a cell phone app: CycleTracks (1). This app is developed by SFCTA (San Francisco County Transit Authority) to collect data on users bicycle trip routes and times, and display maps of their rides using smartphone GPS. This study has two major components: (i) an online survey with questions on bicycling decisions and personal attitudes associated with those decisions, (ii) collecting bicycle trip data (origins, destinations and routes) using a cell phone app (CycleTracks) and route choice analyses. 1 and travel forecasting/cycletracks iphone and android NEXTRANS Project No 019PY01Technical Summary - Page 1
4 Findings The first part of this study uses data from the 2015 Campus Travel Pattern Survey. We collaborated with OSU s Transportation & Traffic Management Department on this survey. The focus of the survey is on individuals bicycling choices as an alternative commute mode to campus. This study performs analyses with the data on respondents travel origins to draw out practical information on the bicycling environment along actual roads to and from campus. Using survey respondents residential locations and data on Bicycle Level of Service (BLOS) received from MORPC (Mid Ohio Regional Planning Commission), we construct a dataset that consists of respondents travel origins and shortest routes to OSU campus. Since the 2015 survey data reveal that those who live within 1 5 miles from campus are more likely to be bicycle users, we categorize those who live within 5 miles from the campus area as potential bicyclists and a target group for promoting bicycling to commute. We include these respondents in our detailed analyses. We assume the respondents ride to a central campus location using the shortest path. First, we geocode each respondent s residential location into coordinates on an ArcGIS layer. Second, we transform the Ohio street system into a network of nodes and arcs (or road segments) using Python and MS Excel. Following these and through some data manipulation, we assign the potential number of bicycling trips to each road segment using the shortest path algorithm. We superimpose the layer of BLOS (Bicycle Level of Service) values upon this map and perform an overlay analysis. We compare the potential bicycling trips and the BLOS values at each road segment level. These two values are compared particularly for heavily used segments. The comparison results are discussed in detail in the report. Overall, only a few roads are rated as Good (11%), 16.7% are rated as Poor, while 37.7% are considered Moderate. Most of the segments with high trip demands fall into the categories of Moderate or Residential. Please note that 19.1% of the road segments did not have assigned BLOS values. Potential bicyclists would encounter roads with multiple BLOSs. For instance, an individual may ride on road segments with moderate or residential BLOS near his/her neighborhood and close to campus, but likely face poor or moderate road segments in between. We provide snapshots of these different road conditions as examples. We consider BLOS values as an indicator of bicycle friendliness, however the four categories of BLOS (i.e. Good, Moderate, Poor, and Residential) may not suffice to capture detailed components. In the second part of this study, we analyze smart phone GPS data in an effort to analyze bicycle route preferences and their associations with facility types. Data were collected through smartphone GPS in central Columbus from September through the end of November, We recruited study participants from The Ohio State University through invitations, fliers and advertisements on campus buses. The report details on the following five major tasks: NEXTRANS Project No 019PY01Technical Summary - Page 2
5 1) Collection of the GPS data on bicycle trips (origin, destination, purpose and route) 2) Cleaning and matching of the GPS points to a given road network 3) Developing maps illustrating the collected data 4) Comparing the chosen routes with the shortest routes 5) Discussion on future research plans The survey respondents were asked to download a smartphone application, CycleTracks. These individuals recorded their bicycle trips by turning the app on and off at the beginning and end of each bicycle trip. We provided the link of our survey promotion website in our survey invitation s and survey promotion postcards, where detailed step by step instructions were described with screenshots of the application ( We collected data on 1,584 bicycle trips. GPS traces were matched to the network links using ArcGIS custom routines and a high resolution network reconstructed to include all possible links available for bicycling. The preliminary results show that the most frequently used street segments among the chosen routes and the shortest routes are different in terms of their locations and characteristics. These suggest that riders preferred different segments as compared to those predicted by the shortest path algorithm. Many of the participant bicyclists used the pedestrian walkways near the central university library and the streets where many university buildings and facilities are located. Several riders also preferred exclusive bicycle trails which are close to the campus area. In general, riders preferred road segments with higher levels of bikeability. Recommendations To analyze bicyclists route choice behaviors more accurately, a small number of studies have employed revealed preference surveys on commute routes using GPS based route tracking applications. In this study, we collect GPS data using a smart phone app and conclude that this method is effective in capturing information about bicycle trips. The data collection methodology and analysis techniques introduced in this study can help other researchers conduct similar studies. We conclude our study by setting the ground for future work that will identify the factors closely associated with the route choices and the degree of diversion from shortest paths. NEXTRANS Project No 019PY01Technical Summary - Page 3
6 Contacts For more information: Gulsah Akar, Ph.D. The Ohio State University Knowlton School NEXTRANS Center Purdue University Discovery Park 3000 Kent Ave. West Lafayette, IN (765) NEXTRANS Project No 019PY01Technical Summary - Page 4
7 Table of Contents Introduction... 1 PART 1. Bicycling Decisions, Personal Attitudes and Shortest Routes to Campus... 4 Introduction: 2015 Campus Travel Pattern Survey... 5 a. About the Survey... 5 b. Main Findings... 5 c. Implications Analyses on the Shortest Path to Campus a. Data & Methodology i. Sample Collection ii. Data Preparation iii. Geocoding Process and Conversion to GIS iv. Shortest Routes Algorithm b. Results i. Potential Use of Shortest Paths to Campus Analyses on Bicycle Level of Service (BLOS) a. Data & Methodology i. Data ii. Methods b. Results i. Comparison of BLOS values with Potential Bicycle Trip Demands ii. Heavily used road segments versus BLOS: Matched? Discussions PART 2. Tracking Bicyclists Route Choices Using Smartphone GPS Introduction Data Collection a. CycleTracks Smartphone Application b. Recruiting Participants Data Preparation a. Importing the data b. Cleaning the data c. Matching the GPS traces to the Network d. Frequently used network segments Future Plans a. Research Questions b. Network and Environmental Attributes Concluding Remarks References Appendix 1. Survey Fliers Appendix 2. Survey Promotion Website Appendix 3. Survey Invitation
8 List of Figures Figure 1. The Survey Question on Street Intersections Figure 2. Cleaning Duplicate Nodes Figure 3. The Snapshot of the Batch Geocoding Website Figure 4. Plotting Residential Locations on Google MyMaps Figure 5. The Table Showing Geocoding Results Figure 6. Point Mapping on ArcMap Figure 7. Shortest Routes from the Origin Points within 1, 3, and 5 Miles of Campus Figure 8. Shortest Routes from the Origin Points within 1 and 3 Miles of Campus Figure 9. Distribution of Streets with Different Bicycle Level of Service (BLOS) Figure 10. Bicycle Level of Service (BLOS) Values and Shortest Paths Figure 11. Snapshots of Some Locations along the Shortest Paths Figure 12. Work Flow of GPS Data Processing and Preparation before Analysis Figure 13. The Screenshot of the Main Page Figure 14. The Structure of the Raw GPS Point Dataset Figure 15. An Excerpt Map of Raw GIS Traces in Central Ohio (1) Figure 16. An Excerpt Map of Raw GIS Traces in Central Ohio (2) Figure 17. An Excerpt Map of Raw GIS Traces in Central Ohio (3) Figure 18. An Excerpt Map of Raw GIS Traces at the OSU Campus Figure 19. Calculation of Differences in Time and Distance between GPS Points Figure 20. The Maps Before Preprocessing Figure 21. The Resulting Maps After Preprocessing Figure 22. Removal of Several Outlying Points at Origins and Destinations for Trace Rectification Figure 23. Unstable GPS Signals Resulting in Scattered Geocoded Points Figure 24. GPS Traces on the Google Base Map after Data Cleaning (N= 1,408) Figure 25. The Map of the Actually Chosen Routes Matched to the Network Map (N = 452) Figure 26. The Map of the Shortest Routes for Comparison (N = 452) Figure 27. Comparison of the Most Frequently Used Routes (Chosen and Shortest Paths)... 45
9 List of Tables Table 1. Descriptive Statistics of the Survey Respondents... 7 Table 2. Neighborhood and Environmental Factors Affecting Individuals Bicycling Decisions by University Affiliation and Gender... 8 Table 3. Neighborhood and Environmental Factors Affecting Individuals Decision to Bike by Bicycling Level Table 4. Comparison of Personal Attitudes and Residential Self Selection Table 5. The Sum of Street Segment Lengths for Each BLOS Value Table 6. Cross Tabular Analysis of BLOS and Potential Bicycle Trips per Segment Table 7. The Three Most Frequently Used Road Segments Table 8. Descriptive Information of the Collected Trips and Bicyclists Table 9. Network Data Sources Table 10. The Five Most Frequently Used Link Segments by the OSU Participants Table 11. The Description of Potential Explanatory Variables for Bicycle Route Choice Analysis... 50
10 Introduction Bicycles have low access costs and moderate travel speeds, reduce congestion, help protect the environment and bring many health benefits (Clifton & Akar, 2009). Within these considerations, several researchers have explored the factors associated with bicycling choice to understand the needs of bicyclists and increase bicycle mode share. Existing literature identified socio demographics, built environment, road conditions and land use patterns as factors associated with bicycling choice in general (Pucher et al., 2011; Dill and Carr, 2003). Among these, presence of bicycle facilities, motor vehicle traffic characteristics, surface quality, neighboring land uses are cited as factors affecting bicycling route choices (Broach et al. 2012). There is increasing interest among colleges and universities in ways to reduce local congestion, contributions to greenhouse gases, and provide leadership in sustainable transportation. This study brings these two emerging areas together: analyzing campus transportation patterns and identifying the factors associated with bicycle trip generation and bicycle route choices using state of the art data collection techniques at a large university campus, The Ohio State University (OSU). The origins, destinations and routes of bicycle trips are collected through a cell phone app: CycleTracks (1). This app is developed by SFCTA (San Francisco County Transit Authority) to collect data on users bicycle trip routes and times, and display maps of their rides using smartphone GPS. This study has two major components: (i) an online survey with questions on bicycling decisions and personal attitudes associated with those decisions, (ii) collecting bicycle trip data (origins, destinations and routes) using a cell phone app (CycleTracks) and route choice analyses. Part 1. Campus Travel Pattern Survey The first part of this study uses data from the 2015 Campus Travel Pattern Survey. We collaborated with OSU s Transportation & Traffic Management Department on this survey. The focus of the survey is on individuals bicycling choices as an alternative commute mode to campus. This study performs analyses with the data on respondents travel origins to draw out practical information on the bicycling environment along actual roads to and from campus. Using survey respondents residential locations and data on Bicycle Level of Service (BLOS) received from MORPC (Mid Ohio Regional Planning Commission), we construct a dataset that consists of respondents travel origins and shortest routes to OSU campus. Since the 2015 survey data reveal that those who live within 1 to 5 miles from campus are more likely to be bicycle users, we categorize those who live within 5 miles from the campus area as potential 1 and travel forecasting/cycletracks iphone and android 1
11 bicyclists and a target group for promoting bicycling to commute. We include these respondents in our detailed analyses. We assume the respondents ride to a central campus location using the shortest path. First, we geocode each respondent s residential location into coordinates on an ArcGIS layer. Second, we transform the Ohio street system into a network of nodes and arcs (or road segments) using Python and MS Excel. Following these and through some data manipulation, we assign the potential number of bicycling trips to each road segment using the shortest path algorithm. We superimpose the layer of BLOS (Bicycle Level of Service) values upon this map and perform an overlay analysis. We compare the potential bicycling trips and the BLOS values at each road segment level. These two values are compared particularly for heavily used segments. The comparison results are discussed in detail in the report. Overall, only a few roads are rated as Good (11%), 16.7% are rated as Poor, while 37.7% are considered Moderate. Most of the segments with high trip demands fall into the categories of Moderate or Residential. About 19% of the road segments did not have assigned BLOS values. Potential bicyclists would encounter roads with multiple BLOSs. For instance, an individual may ride on road segments with moderate or residential BLOS near his/her neighborhood and close to campus, but likely face poor or moderate road segments in between. We provide snapshots of these different road conditions as examples. We consider BLOS values as an indicator of bicycle friendliness, however the four categories of BLOS (i.e. Good, Moderate, Poor, and Residential) may not suffice to capture detailed components. Part 2. Analyses of Bicycle Routes In the second part of this study, we analyze smart phone GPS data in an effort to analyze bicycle route preferences and their associations with facility types. Data were collected through smartphone GPS in central Columbus from September through the end of November, We recruited study participants from The Ohio State University through invitations, fliers and advertisements on campus buses. The report provides details on the following five major tasks: 1) Collection of the GPS data on bicycle trips (origin, destination, purpose and route) 2) Cleaning and matching of the GPS points to a given road network 3) Developing maps illustrating the collected data 4) Comparing the chosen routes with the shortest routes 5) Discussions on future research plans 2
12 The survey respondents were asked to download a smartphone application, CycleTracks (2). These individuals recorded their bicycle trips by turning the app on and off at the beginning and end of each bicycle trip. We provided the link of our survey promotion website in our survey invitation s and survey promotion postcards, where detailed step by step instructions were described with screenshots of the application ( We collected data on 1,584 bicycle trips. GPS traces were matched to the network links using ArcGIS custom routines and a high resolution network reconstructed to include all possible links available for bicycling. The preliminary results show that the most frequently used street segments among the chosen routes and the shortest routes are different in terms of their locations and characteristics. These suggest that riders preferred different segments as compared to those predicted by the shortest path algorithm. Many of the participant bicyclists used the pedestrian walkways near the central university library and the streets where many university buildings and facilities are located. Several riders also preferred exclusive bicycle trails, for example the Olentangy Trail, which are close to the campus area. In general, riders preferred road segments with higher levels of bikeability. 2 and travel forecasting/cycletracks iphone and android 3
13 PART 1. Bicycling Decisions, Personal Attitudes and Shortest Routes to Campus 4
14 Introduction: 2015 Campus Travel Pattern Survey a. About the Survey The purpose of the 2015 Ohio State University (OSU) Campus Travel Pattern Survey is to provide insights on campus travel patterns. The survey was conducted online from Apr 27, 2015 to May 11, It was distributed to a stratified random sample of 15,088 faculty, staff, graduate/professional students, and undergraduate students by with survey links to the survey instrument website. A total of 1,574 responses were received, which correspond to about 1.7% of the campus population. The survey questionnaire includes questions on sociodemographic characteristics, individuals attitudes towards their own neighborhood characteristics, commute mode choices and behaviors, perceptions of commuting environments and two intersecting streets nearest to respondents residential locations. The core questions associated with bicycling travel patterns include 27 bicycling specific attitudinal questions designed to be answered on a Likert scale of 1 ( strongly disagree ) to 5 ( strongly agree ). b. Main Findings Of the 1,574 respondents, the final sample used in empirical analysis includes 677 individuals with correct address records and complete responses to every survey question included in the analyses. The respondents were asked to report how many times per week (i.e., never, one to two days a week, three to four days a week, or five or more days a week) they use different modes for their commute to campus. The survey provided the following options for mode choice: Auto (drive alone) Carpooling (with 1 or more people) CABS bus (Campus Area Bus Service) COTA bus (Central Ohio Transit Authority) Bicycle Walking Bicycle & Bus (in the same trip) Bicycle & Auto (in the same trip) Auto & Bus (in the same trip) (If you used any other mode of transportation to campus, please specify.) 5
15 Table 1 provides the summary of basic characteristics of survey respondents and the distribution of commuter cyclists across university affiliation (faculty, staff, and students), gender, commute distance, age, flexibility in arrival times and their responses to the question on residential self selection ( Bicycling conditions were a factor in choosing where I live ). Residential self selection refers to the situation where individuals select themselves into certain neighborhoods based on their predetermined preferences for specific modes. A commuter cyclist in this study is defined as one who commutes to campus by bicycle at least once a week. Based on this classification, 12.6% of the analysis sample is classified as bicycle commuters. About 33.3% of those who live within a mile of campus are bicyclists and 24.6% of those within 5 miles of campus are bicyclists. This percentage gets significantly lower as commute distance increases. About 19.3% of the respondents agreed with the statement on residential self selection. About 35% of those who agreed with the statement, Bicycling conditions were a factor in choosing where I live, and 60.8% of those who strongly agreed with the same statement are found to be bicycle commuters. In addition to the sociodemographic information, the survey respondents were asked to rate bicycling related environmental factors on a scale of 1 to 5 (1 being strongly disagree and 5 being strongly agree ). Tables 2 and 3 show the analysis results on individuals evaluations about environmental factors and neighborhood conditions associated with bicycling decisions. Table 2 presents the average ratings by university affiliation and gender. The numbers in bold are the top five factors for each group. Standard deviations are presented in parenthesis. 6
16 Table 1. Descriptive Statistics of the Survey Respondents N % Bicyclist (%) Non Bicyclist (%) All Respondents University Affiliation Faculty Staff Graduate Student Undergraduate Student Gender Male Female Commute Distance Less than a mile to 5 miles to 10 miles More than 10 miles Age Under Over Flexibility in Arrival Times Not flexible at all Rarely flexible Somewhat flexible Very flexible Residential Self Selection Strongly disagree Disagree Neither disagree nor agree Agree Strongly agree
17 Table 2. Neighborhood and Environmental Factors Affecting Individuals Bicycling Decisions by University Affiliation and Gender Factor Faculty Staff Undergraduate Students Graduate / Professional Students Male Female Commuting by car is safer than riding a bicycle. Bicycling is impractical for me because I need to carry things or transport others (1.0) (1.0) (1.0) (1.0) (1.0) (1.0) 3.90 I would choose to ride a bike if there were more bike routes to and from campus I would choose to ride a bike if there were options for renting or borrowing bicycles (1.1) 2.33 (1.1) 2.57 (1.1) (1.1) 2.43 (1.1) I would choose to ride a bike if there were more indoor or covered places to store bikes on campus (1.1) There are no bicycle lanes or routes near enough for me to ride I would have to take detours from the most direct route in order to use bike paths, bike lanes or streets more suited for bicycles (1.1) 3.81 (1.1) (1.1) 3.69 (1.1) 3.82 (1.1) The roadway conditions (markings, signals, width, and lighting) on some streets make the route unsafe for bicyclists on my commute route (1.1) 4.01 (1.0) 3.70 (1.1) 3.96 (1.0) 3.81 (1.1) 4.10 (1.0) I would not leave my bicycle outside my residence because it might be stolen (1.1) There is so much traffic along the street I live on that it would be difficult or unpleasant to bicycle in my neighborhood My bicycle might be stolen even if properly secured (0.9) 3.63 (0.9) 3.80 (1.1) 3.88 (1.0) 3.64 (1.0) 3.70 (0.9) There are off street bicycle trails or paved paths in or near my neighborhood that are easy to access (1.4) (1.4) 3.06 Bicycling conditions were a factor in choosing where I live (1.1) 1.89 (0.9) (1.1) There is a bus stop within a reasonable bicycling distance from my residential location (1.4) 3.01 (1.4) 3.74 (1.1) (1.4) 3.13 (1.4) There are bike lanes in my neighborhood that are easy to access (1.1) 2.61 (1.1) Where I currently live is a good neighborhood for riding a bicycle Note: Values indicate the average of the 5 Likert scaled responses to each statement. The top five most popular factors are in bold. Standard deviations are presented in parenthesis (1.1)
18 Graduate students report stronger willingness to ride a bike if there were more bike routes to and from campus (3.75), if there were options for renting or borrowing bicycles (3.05), and if there were more indoor or covered places to store bikes on campus (3.29), as compared to other groups (faculty, staff, and undergraduate students). In evaluation of neighborhood conditions for bicycling, faculty members generally have positive attitudes, and they gave higher points to the statement, bicycling conditions were a factor in choosing where I live. Undergraduate students reported the lowest satisfaction towards bicycle related neighborhood environments. Overall, faculty and staff members tend to rate bicycling as an inconvenient mode in terms of safety, travel, and time management as compared to undergraduate and graduate students. For example, faculty and staff members are more likely to agree with the statement would have to take detours from the most direct route in order to use bike paths, bike lanes or streets more suited for bicycles. Both males and females tend to agree with the statement, commuting by car is safer than riding a bike. This is consistent with the fact that they similarly strongly agreed with the statement, the roadway conditions (markings, signals, width, and lighting) on some streets make the route unsafe for bicyclists on my commute route (3.81 and 4.10, respectively). Meanwhile, males present a more positive evaluation of their neighborhood environments. They are more likely to agree with statements such as where I currently live is a good neighborhood for riding a bicycle (3.38), there are bike lanes in my neighborhood that are easier to access (2.68), and there is a bus stop within a reasonable bicycling distance from my residential location (3.32) as compared to females (3.12, 2.47, and 3.13, respectively). Both male and female members strongly agreed with the statement I would have to take detours from the most direct route in order to use bike paths, bike lanes or streets more suited for bicycles while females are slightly more likely to do so (3.69 and 3.82, apiece). Table 3 shows that both novice and intermediate cyclists strongly agree with the statements commuting by car is safer than cycling (4.29 and 3.93) and the roadway conditions are unsafe for bicyclists on commute routes (4.25 and 3.98) more than advanced cyclists (3.54 and 3.59, respectively). They feel that there are no bicycle lanes near enough for them (3.81 and 3.61) and they would have to take detours from the most direct routes to campus for safer bike paths (3.97 and 3.86) more than advanced cyclists (3.11 and 3.52, respectively). Therefore, we conclude that perceived levels of difficulty in bicycling appear to be higher for novice and intermediate cyclists as compared to advanced cyclists. 9
19 Table 3. Neighborhood and Environmental Factors Affecting Individuals Decision to Bike by Bicycling Level Factor Advanced Intermediate Novice Commuting by car is safer than riding a bicycle (1.1) 3.93 (1.0) 4.29 (0.9) Bicycling is impractical for me because I need to carry things or transport others (1.1) I would choose to ride a bike if there were more bike routes to and from campus I would choose to ride a bike if there were options for renting or borrowing bicycles (1.1) 2.48 (1.1) I would choose to ride a bike if there were more indoor or covered places to store bikes on campus There are no bicycle lanes or routes near enough for me to ride (1.4) I would have to take detours from the most direct route in order to use bike paths, bike lanes or streets more suited for bicycles (1.0) 3.97 (1.1) The roadway conditions (markings, signals, width, and lighting) on some streets make the route unsafe for bicyclists on my commute route (1.0) 4.25 (0.9) I would not leave my bicycle outside my residence because it might be stolen There is so much traffic along the street I live on that it would be difficult or unpleasant to bicycle in my neighborhood (1.1) My bicycle might be stolen even if properly secured (1.0) 3.76 (0.9) 3.70 (1.0) There are off street bicycle trails or paved paths in or near my neighborhood that are easy to access (1.4) 3.10 (1.4) Bicycling conditions were a factor in choosing where I live (1.0) There is a bus stop within a reasonable bicycling distance from my residential location (1.4) There are bike lanes in my neighborhood that are easy to access. Where I currently live is a good neighborhood for riding a bicycle Note: Values indicate the average of the 5 Likert scaled responses to each statement. The top five most popular factors are in bold. Standard deviations are presented in parenthesis Table 4 shows how personal attitudes towards bicycling related factors vary across bicyclists and non bicyclists. Since we have a large number of attitudinal questions, we classify these questions into 10 groups of similar questions that are closely related to one another and name each accordingly. 10
20 To compare group means, we used Mann Whitney U test, which is the alternative test to the independent sample t test. The Mann Whitney U test is used when the data are ordinal and it is hard to assume that a variable follows the normal distribution. The test results indicate that non bicycling commuters and bicycling commuters significantly differ in many aspects. On average, commuter cyclists most strongly agreed with the statements related to perceived additional benefits of bicycling, including reducing environmental impacts, enjoying health benefits, and saving money. Non bicyclists also recognized these benefits as being considerable, but not at the level that cyclists did. Notably, conditional willingness to use bicycles seems to be the most discriminating attitudinal group of statements, followed by negative images towards bicyclists on the street and bicyclefriendliness of neighborhoods. Most of the commuter cyclists agreed that they would ride a bicycle more frequently if bicycle related facilities are to be improved, such as more bike trails, covered bike storage places, and bike sharing facilities. On the contrary, non cyclists responses demonstrate that they are rather insensitive to facilities or infrastructure improvements. Nonbicyclists are more likely to perceive cyclists riding on the street as being careless. Bicyclists are more likely to report positive values on bicycle friendliness of neighborhoods. The significant difference across bicyclists and non bicyclists may allow for several interpretations. Bicyclists may choose to live in more bicycle friendly neighborhoods or, they may have more favorable ratings of their environments in general when it comes to bicycling. Table 4 also reports that bicyclists are more likely to agree with the statement Bicycling conditions were a factor in choosing where I live. Regarding deterrents, non commuter cyclists reported higher levels of agreements to the statements under sensitivity to safety in mode choice and perceived obstacles to bicycling on routes. Non bicyclists are sensitive to safety and weather issues more than bicyclists, but bicyclists think of these conditions as important factors as well. The gap between two groups is not as critical as in other significant components. 11
21 Table 4. Comparison of Personal Attitudes and Residential Self Selection Means of Attitudes for Each Group Conditional Willingness to Use Bicycles Bicycling Commuters Non Bicycling Commuters Mean Std. Dev Mean Std. Dev I would choose to ride a bike if there were more indoor or covered places to store bikes on campus. I would choose to ride a bike if there were more bike routes to and from campus. I would choose to ride a bike if there were options for renting or borrowing bicycles Biking can sometimes be easier for me than driving. I try to ride a bike to help improve air quality. Bicycle Friendliness of Neighborhoods Where I now live is a good neighborhood for bicycling. There are off street bicycle trails or paved paths in or near my neighborhood that are easy to access There are bike lanes easy to access in my neighborhood. There is so much traffic along the street I live on that it would be unpleasant to bicycle in my neighborhood. Sensitivity to Safety in Mode Choice Safety in traffic is an important factor. Safety from crime is an important factor Extreme weather conditions are important factors. Perceived Obstacles to Bicycling on Routes The roadway conditions on some streets make the route unsafe for bicyclists on my commute route. I would have to take detours from the most direct route in order to use bike paths or bike lanes There are no bicycle lanes or routes near enough for me to ride. Perceived Additional Benefits of Bicycling Biking reduces environmental impacts. Biking benefits health and fitness Biking gives me the opportunity to save money. Negative Images towards Bicyclists on the Street Bicyclists do not care about drivers on the road Bicyclists do not care about pedestrians on the street. Availability of Bicycle Racks Bicycle racks are easy to find There are enough parking racks for bicycles. 12
22 Table 5. Comparison of Personal Attitudes and Residential Self Selection (Continued) Means of Attitudes for Each Group Concerns about Theft Bicycling Commuters Non Bicycling Commuters Mean Std. Dev Mean Std. Dev I would not leave my bicycle outside my residence because it might be stolen My bicycle might be stolen even if properly secured. Familiarity with Bicycle Related Services I can find a place to help repair my bicycle if needed. When needed, I can find a convenient place to shower and change clothing after bicycling. The Degree of Residential Self Selection Bicycling conditions were a factor in choosing where I live Note: Values indicate the average of the 5 Likert scaled responses to each group of statements and its standard deviations. Group means in bold indicate that differences between groups are statistically significant at the 95% (p value<0.05) level using Mann Whitney U Test. c. Implications The 2015 Campus Travel Pattern Survey features a variety of survey questions that measure attitudes and perceptions of university members towards bicycling. The analyses reveal that most of the bicyclists live within 1 to 5 miles from campus. Investing in separate bicycle facilities or improved ones is found to be important to encourage bicycling especially for novice bicyclists who account for a significant portion. Promoting safety on bicycle routes, more bicycle lanes, and separating bike riders from auto traffic may increase the number of bike commuters. Separate bicycle facilities should follow the shortest routes (as much as possible) to keep commute times and distances at a minimum. 13
23 Analyses on the Shortest Path to Campus a. Data & Methodology i. Sample Collection Among the 1,574 participants who participated in the 2015 Campus Transportation Survey, 1,189 participants provided information on where they live. The respondents were asked to report the names of the two streets that intersect closest to their homes (Figure 1). The survey results reveal that most bicyclists live within 5 miles from campus. Therefore, we assumed this distance to be a bikable distance in this context, and created shortest paths for bicycle commute for all respondents living within 5 miles from campus. This resulted in 584 respondents for mapping. Figure 1. The Survey Question on Street Intersections 14
24 ii. Data Preparation Data cleaning and creating a valid network Observations with missing values, uncorrectable typos and unrelated answers were deleted from the sample. Centerlines Shape Data which shows all roads and streets lines for Greater Franklin County provided by the Mid Ohio Regional Planning Commission (MORPC), named Location Based Response System (LBRS), is used as the network dataset for mapping. The network data could not be used as they were, because bicyclists cannot ride on all roads (i.e. highways). By using the attribute information on speed limits, those roads with speed limits more than 35 mph were selected and excluded while creating the links and nodes for the final network dataset. We demonstrate the difference between two networks later on by comparing these maps. To create links and nodes on the network before the shortest path analysis, ArcGIS function Feature Vertices to Points was used with a selection of both ends as an option. This function generates two nodes at the vertical points of each link and assigns random numbers to newly created nodes. Two nodes at the end of a link have the same link ID which they are connected to. This function assigns two ID numbers to each node because nodes are connected to two different links at the same time (Figure 2). Thus, after endowing spatial coordinates to every node, we exported the attribute table for further manipulation. Figure 2. Cleaning Duplicate Nodes The results file contains data on link ID, starting node ID, ending node ID, speed limit and link length (as impedance). iii. Geocoding Process and Conversion to GIS Geocoding converts an address to a set of latitude and longitude values for spatial reference. ArcGIS ver provides functions for these types of geocoding tasks. However, since our data set is not in an ordinary address format we used another tool for this step. Our data provide information on the closest intersection. We converted these intersections into 15
 as inputs and clicks the button geocode, Batch Geocoding converts these into other forms of spatial references")
25 corresponding coordinates using Batch Geocoding ( geocode). If one enters a vector of values with spatial references (addresses or coordinates) as inputs and clicks the button geocode, Batch Geocoding converts these into other forms of spatial references (Figure 3). Following this, we checked for outliers and errors, and plotted the coordinates created by Batch Geocoding on the map (Figure 4). Finally, we refined the list of individual coordinates and prepared them to be imported into GIS (Figure 5). We used ArcMap ver , to import the refined data set of coordinates. The result file is a point layer on ArcMap (Figure 6). The green point at the center of the map is the location of the Thompson Library of the Ohio State University. The procedure followed for importing excel coordinates into ArcGIS is well outlined in ESRI s technical article How To: import XY data tables to ArcMap and convert the data to a shapefile (ESRI, 2016). Figure 3. The Snapshot of the Batch Geocoding Website 16


26 Figure 4. Plotting Residential Locations on Google MyMaps Figure 5. The Table Showing Geocoding Results 17

27 Figure 6. Point Mapping on ArcMap iv. Shortest Routes Algorithm The purpose of these analyses is to create shortest distance routes for potential bicycle trips with individuals residences as origins and central campus as the destination. By employing Dijkstar s algorithm and Python programming, we computed impedances and shortest times from every origin point. Dijkstar s algorithm works with inputs of link ID, starting node ID, ending node ID, and impedance value of each link. The preparation of these values were discussed in the Data Preparation section. The Python code file can be downloaded from the Python open source website ( 18

28 b. Results i. Potential Use of Shortest Paths to Campus We assigned the corresponding volumes of potential trips to each link. We categorized trip volumes into 5 classes (i.e., 1 to 10 trips, 11 to 50 trips, 51 to 100 trips, 101 to 200 trips, and 201 to 584 trips) to give different width to each class so that frequently used links would appear thicker on the map (Figures 7 and 8). Blue colored circles in Figure 7 represent 1, 3, and 5 mile buffer areas. Circles in Figure 8 represent 1 and 3 mile buffer areas. Figure 7. Shortest Routes from the Origin Points within 1, 3, and 5 Miles of Campus 19
 at the street link level from MORPC.")
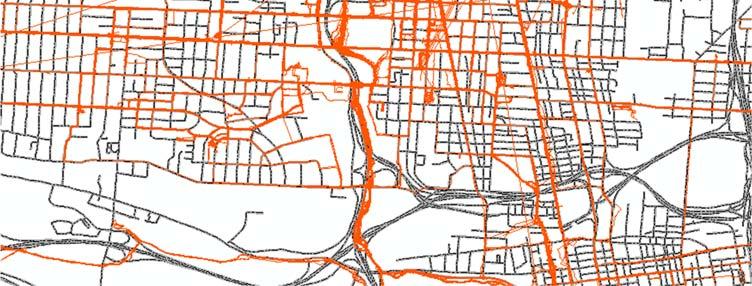
29 Figure 8. Shortest Routes from the Origin Points within 1 and 3 Miles of Campus Analyses on Bicycle Level of Service (BLOS) a. Data & Methodology i. Data We obtained the data on Bicycle Level of Service (BLOS) at the street link level from MORPC. The map below (Figure 9) shows the streets in central Ohio categorized by their bicycle level of service values based on MORPC s classifications ( 20

30 Figure 9. Distribution of Streets with Different Bicycle Level of Service (BLOS) (Source: Mid Ohio Regional Planning Commission) ii. Methods We use the Intersect option of the Overlay function of ArcGIS, a fundamental spatial exploratory tool, which enables users to compare information or attributes of different source data that are from the same location by overlaying two layers. Detailed information on this function can be found at: ysis.htm 21

31 b. Results i. Comparison of BLOS values with Potential Bicycle Trip Demands Since the input dataset, here the BLOS dataset, does not include all the streets, some street segments did not receive BLOS values during the intersect process. The map below exhibits all the shortest distance paths with four different BLOS values (Figure 10). Figure 10. Bicycle Level of Service (BLOS) Values and Shortest Paths 22
32 We calculated some basic statistics to understand whether there is any pattern in the distribution of BLOS values (Tables 5 and 6). According to the results shown in Table 6, we find that most of the potential bicycle trips are on road segments with moderate BLOS. Table 6. The Sum of Street Segment Lengths for Each BLOS Value Bicycle Level of Service Sum of Segment Lengths (in meters) Good 28, Moderate 95, Poor 42, Residential 39, (unknown) 48, Total 254, % Table 7. Cross Tabular Analysis of BLOS and Potential Bicycle Trips per Segment The Number and Share (%) of Trip Segments Potential Bicycle Trips 1 ~ 10 Good Moderate Poor Residential Unknown Total 295 (12.7) 825 (35.5) 436 (18.8) 308 (13.3) 459 (19.8) 2323 (100.0) 11 ~ (10.4) 183 (52.7) 54 (15.6) 28 (8.1) 46 (13.3) 347 (100.0) 50 ~ (9.2) 65 (66.3) 18 (18.4) 5 (5.1) 1 (1.0) 98 (100.0) 101 ~ (0.0) 64 (76.2) 10 (11.9) 7 (8.3) 3 (3.6) 84 (100.0) 201 ~ (0.0) 0 (0.0) 0 (0.0) 1 (16.7) 5 (83.3) 6 (100.0) Total 340 (11.9) 1137 (39.8) 518 (18.1) 349 (12.2) 514 (18.0) 2858 (100.0) 23
33 ii. Heavily used road segments versus BLOS: Matched? We find that the most heavily used road segments (or the ones that would attract the most trips based on the shortest path algorithm) have moderate or residential BLOS based on MORPC s classifications. We did not include the top two heavily used road segments here because they do not have assigned BLOS values. The table below (Table 7) displays third, fourth, and fifth most heavily used road segments, their BLOS classifications and expected trips. Since the current definition of moderate service is too broad to determine any specific service level, more detailed categories are needed in future studies. 24


 5 On")
34 Table 8. The Three Most Frequently Used Road Segments Rank Road Segment Expected Trips Bicycle Level of Service Location 3 On College Road (Residential) 4 On College Road (Residential) 5 On Annie and John Glenn Avenue (Moderate) 25


35 Looking closer at the data, we find that potential riders would face various levels of BLOS on their routes to campus if they were to follow the shortest paths. Here we look at two bicyclists who live in Upper Arlington (refer to the two red circles in Figure 11). We take a few snapshots of some locations along their predicted shortest routes. Blue lines denote Moderate, lightgreen lines Poor, dark green lines Good and pink lines Residential BLOS. The cyclist who starts from location Upper Arlington 1 will usually ride on streets which have moderate and poor BLOS. The other cyclist who starts from Upper Arlington 2 would start with Good BLOS but then will have to ride through poor and moderate BLOS segments. Figure 11. Snapshots of Some Locations along the Shortest Paths 26
36 Discussions This section of the report analyzed the 2015 OSU Campus Travel Pattern Survey data combined with data from MORPC (Mid Ohio Regional Planning Commission) to draw out bicycling related implications. First, we examined the bicycling behavior, attitudes and perceptions of university members and demonstrated different behaviors and attitudes across bicyclists, potential bicyclists and non bicyclists. Then we mapped the shortest routes of respondents living within 5 miles from campus and examined the BLOS levels of these routes. Potential bicyclists as well as current bicycle commuters rated bicycle lanes and separated facilities as important factors that would encourage more bicycle trips. Most respondents agreed with the statement that roadway conditions (e.g. markings, signals, width, and lighting) on some streets make the route unsafe for bicyclists. Survey respondents rated the influence of extreme weather conditions as considerable, but room for increased bicycle ridership through policy measures and infrastructure improvements was also comparable. We analyzed the shortest routes of the potential bicyclists and identified the BLOS of these routes. We found that most bicyclists would have to ride through segments with various service levels if they were to follow the shortest routes. We found that most road segments with considerable potential bicycle trips would fall into the moderate BLOS category. 27
37 PART 2. Tracking Bicyclists Route Choices Using Smartphone GPS 28
38 Introduction Bicycling is an effective way to enhance urban vitality and mitigate the negative environmental and health effects of our long and continued dependence on motorized vehicle travel. One promising way to encourage bicycling is to understand the attributes of the built environment conducive to bicycling related choices in order to provide a well planned bicycle infrastructure reflecting riders needs. Existing studies that rely on traditional surveys (e.g. mail or surveys) use shortest distance paths as proxies for the actually chosen path to analyze environmental attributes preferred by bicyclists. There is a high probability that the actual route is not correctly represented. Cyclists do not necessarily constrain their rides to shortest routes, which are not always comfortable to ride on, and may have significant physical barriers, such as slopes and high vehicular traffic. GISbased shortest path routes can be misleading for behavioral modelling. To avoid the arbitrary assumption of bicyclists routes and analyze route choice behaviors more accurately, a small number of studies have used GPS based route tracking techniques. An individual s smartphone constitutes valuable infrastructure for researchers to explore travel behavior. A large number of people in U.S. and other developed countries now possess smartphones The smartphone ownership rate in U.S exceeded 80% in Every smartphone has a built in GPS signal device that can be used to track and record the owner s geographic locations real time as well as navigate the shortest time path to a destination. Many of the GPS enabled applications and built in programs of smartphones are free to download. If a research team seeks to conduct a survey using GPS signals, they do not need to consider any extra cost to purchase, distribute and deliver survey assisting devices to survey participants thanks to this ubiquitous device. The developers of the applications often provide part of the collected data at one s request at a given price, and the survey would require no extra effort for researchers to develop an independent application and secure a data storage server for a particular survey. Smartphones are also mobile. Participants do not have to pay extra attention not to forget to carry a survey device with them, and an application can be turned on rather quickly for GPS tracking whenever they begin and finish their trips. Therefore, smartphone GPSsurveys can be promising options for travel behavior research. In this part of the project report we describe the following tasks: i. Collection of the GPS data on bicycle trips (origin, destination, purpose and route); ii. Cleaning and matching the GPS points to the complete network; 3 Smartphone Penetration Surpassed 80 Percent in 2016 (Accessed in August 1, 2017) 29


39 iii. Developing maps illustrating the collected data; iv. Comparing the chosen routes with the shortest routes; v. Specifying future research plans with these data Figure 12. Work Flow of GPS Data Processing and Preparation before Analysis Figure 12 presents the work flow of GPS data preprocessing that we conducted before route analyses. We collected and used bicycle GPS data in an effort to analyze bicycle route preferences and their associations with facility types. Data were collected through smartphone GPS in central Columbus from September through the end of November, We recruited study participants from The Ohio State University through invitations, fliers, and advertisement on campus buses. 30
40 Data Collection a. CycleTracks Smartphone Application The origins, destinations, and routes of bicycle trips and basic personal information of participants were collected through a smartphone application: CycleTracks. This app is developed by SFCTA (San Francisco County Transit Authority) to collect data on users bicycle trip routes and times and display maps of their rides using smartphone GPS signals. The official website ( and travel forecasting/cycletracks iphone andandroid) provides more information in detail. Our data collection took place from August 21, 2016 until December 1, 2016, for about two and a half months. Respondents were asked to download a smartphone application, CycleTracks. The individuals recorded their bicycle trips by turning the app on and off at the beginning and end of each bicycle trip. We provided the address of our survey promotion website in the survey invitation s and postcards, where detailed step by step instructions were described with screenshots of the application (u.osu.edu/cycletracks) (Appendix 1, 2, and 3). b. Recruiting Participants We used three recruitment techniques: 1) mass distribution, 2) survey promotion through an official website created for this study, and 3) distribution of postcards on the campus area and campus shuttles for more visibility. Under the permission of the Office of Chief Information Office, we sent mass s twice to OSU faculty, staff and students. The survey invitation s were sent to 23,116 people with university affiliations from August, 22, 2016 to August, 24, 2016 (Undergraduate students (8,500) + Graduate students (1,500) + Staff & Faculty (10,000) + those who allowed additional contacts for follow up research through other studies (3,116)). The content of the invitation , survey promotion website, and postcards are attached as Appendices 2, 3, and 4, respectively. We were able to collect GPS points of a total of 1,584 bicycle trips. With a high resolution network reconstructed by the authors to include all possible links available for cycling, GPS traces were matched to the network links using ArcGIS custom routines, as suggested by Dalumpines and Scott (2011). After a series of data screening and cleaning steps, in addition to the removal of identical routes generated by the same rider, 452 utilitarian trips by 76 cyclists were available for our analysis. 31


41 Data Preparation a. Importing the data The GPS points contributed by the bicyclists who used CycleTracks application during their rides were accessed through the SFCTA online database with a user ID and password offered by SFCTA (Figure 13). We downloaded the data in CSV file format (Figure 14). The downloaded data file contains two sheets, one for the GPS points, and the other for user information. Figure 13. The Screenshot of the Main Page Figure 14. The Structure of the Raw GPS Point Dataset In the dataset, Trip_ID is assigned to each trip trace and User_ID is assigned to a unique participant. haccuracy (i.e. horizontal accuracy) indicates the error range of a given GPS point in meters by a horizontal radius size around coordinates and vaccuracy (i.e. vertical accuracy) indicates the vertical error range of a given GPS point. These two accuracy measures are used to filter out those GPS points with low positioning precisions. Speed is reported in meters per second. The number of bicycle trips collected during the period is 1,584 contributed by 81 participants (Table 8). 32
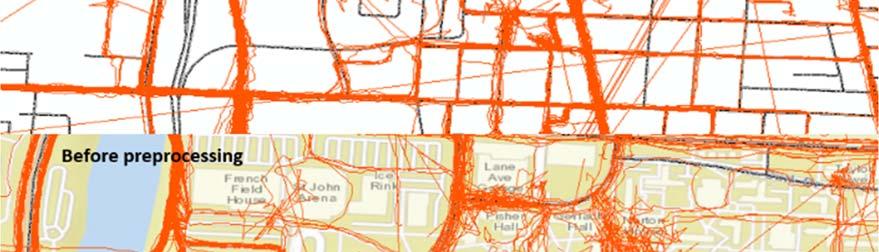
42 Table 9. Descriptive Information of the Collected Trips and Bicyclists Information Category The Number of Bicyclists % Male % Gender Female % Unknown % Total % % % % Age % % Unknown % Total % Daily % Several times per week % Cycling Several times per month 3 3.7% Frequency Less than a month 0 0.0% Unknown % Total % Commute % School % Work related % Errand % Purpose Shopping 5 0.3% Social 9 0.6% Exercise % Other 3 0.2% Unknown % Total % Figures 15, 16, and 17 show the GPS points and traces collected in Central Ohio and the immediate areas of The Ohio State University. With a closer look, one can identify problems related to outliers (Figure 18). 33

 Figure 16.")
43 Figure 15. An Excerpt Map of Raw GIS Traces in Central Ohio (1) Figure 16. An Excerpt Map of Raw GIS Traces in Central Ohio (2) 34

 Figure 18.")

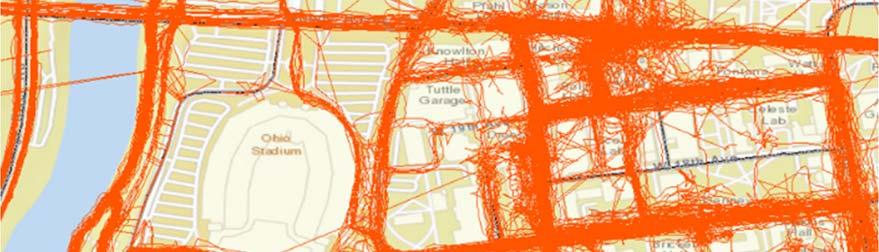
44 Figure 17. An Excerpt Map of Raw GIS Traces in Central Ohio (3) Figure 18. An Excerpt Map of Raw GIS Traces at the OSU Campus 35
 Creating a complete bicycling network: a new network should include the street network as well as other links bicyclists may use, e.g., park trails, parking lots, small passages c) Matching GPS points to the complete network links: collected GPS points should be matched onto correct network links b.")
45 Processing the collected bicycle GPS data involves three crucial components as follows: a) Cleaning the data of errors: removing outlier signals, signal noises, interruptions of signal reception, or very short traces b) Creating a complete bicycling network: a new network should include the street network as well as other links bicyclists may use, e.g., park trails, parking lots, small passages c) Matching GPS points to the complete network links: collected GPS points should be matched onto correct network links b. Cleaning the data Data cleaning is implemented at the GPS point level, not at the trace level. To capture defective or irrelevant points, we calculated several values using the GPS coordinates. These are (a) distance traveled since last captured point (meter), (b) change in time (sec), (c) speed (meter per sec) (Figure 19). Figure 19. Calculation of Differences in Time and Distance between GPS Points 36
46 Some of the GPS points were removed if at least one of the following conditions applied: a) Either horizontal or vertical accuracy values (measured in meters) were greater than 65 meters (this is a typical value we get when a GPS locator is not operating properly) b) original GPS speed indicator is equal to 1 c) the distance from last captured point is greater 200 m or time difference is greater than 1800 seconds (30 minutes) d) the calculated speed was greater than 30 mph (13.5 meter per second) or less than 2 mph (0.9 meter per second) Once these points were removed, the new column data showing changes between the points were recalculated. Based on these cleaned data, a trip was split into multiple trips if there was more than three minutes or more than 1,000 ft (305 m) between points in order to account for trip chaining. Finally, trips with fewer than five collected points were removed from the dataset. Before plotting the cleaned dataset into ArcGIS, we assigned ObjectID to each point to make the inspection easier. The maps illustrating the GPS traces before and after these processes are shown in Figures 20 and 21. The number of all commute trips were 1,327 (commute 901, school 254, work related 172). After data cleaning, this number reduced to 1,294 with 76 bicyclists. Using the Delete Identical built in function in ArcGIS, we removed those duplicate polylines whose geometries are identical to one another with a geometric tolerance set to be up to 20m. 37


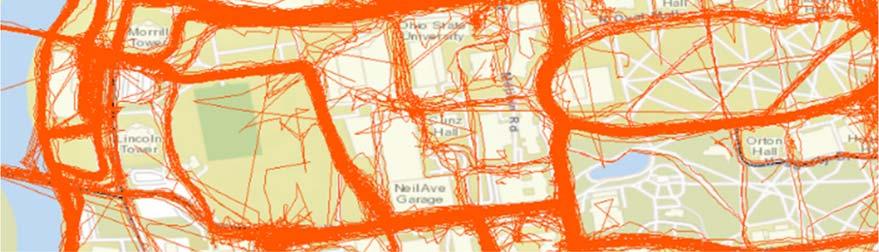
47 Figure 20. The Maps before Preprocessing 38


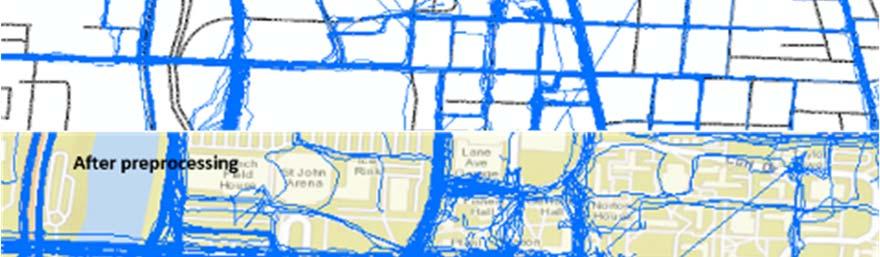
48 Figure 21. The Resulting Maps after Preprocessing 39


.")
49 Removing part of the GPS points at origins and destinations was necessary to correct the unrealistic segments of a route trace (Figure 22). Some bicyclists forgot to turn off the application that recorded their GPS signals at their destinations. Even after they got off their bicycles, their applications were still in operation and the GPS points at that moment were shown on the map at the top of the buildings or other features on which it was not possible to ride. At origins, bicyclists GPS applications took some time to normally and precisely locate the users geographic locations and thus points were often randomly scattered (Figure 23). Therefore, removing points recorded at origins and destinations helped reduce the noise in GPS points shown in maps, without critically affecting the overall traces (Figure 24). We used ArcPy module to assign numbers to GPS points in ascending and descending orders of record time. Then we deleted the first and last 30 points. Following this, those points plotted on top of buildings were removed using the ArcGIS Editor tool. Figure 22. Removal of Several Outlying Points at Origins and Destinations for Trace Rectification 40


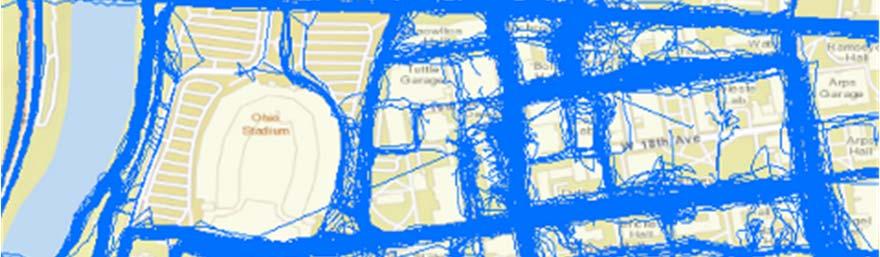
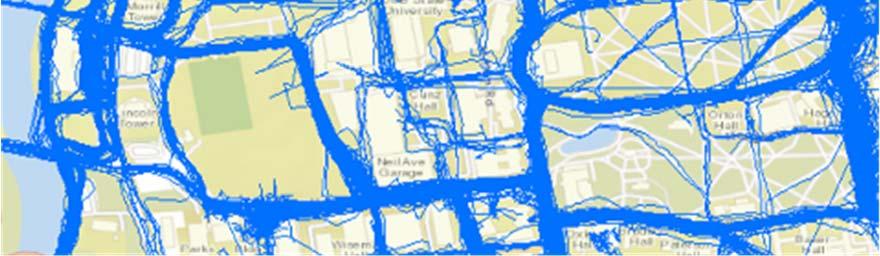
50 Figure 23. Unstable GPS Signals Resulting in Scattered Geocoded Points The following map (Figure 24) shows the screen shots of the final bicycle GPS traces after a series of data cleaning processes described above. Figure 24. GPS Traces on the Google Base Map after Data Cleaning (N= 1,408) 41
51 c. Matching the GPS traces to the Network We combined the network datasets from multiple sources into one consistent, connected network to match the resulting GPS traces. Table 9 presents several network data sources available for the Central Ohio region. Zhou and Golledge (2006) and Hudson (2012) noted that, compared to the rapid development of GPS and other positioning technology, map accuracy is relatively lagging behind, requiring a long term and energy intensive task. The maps have not been extended to represent the details of streets and particular types of facilities such as bike paths and sidewalks. Having said that, Open Street Map provides a quite solid and detailed map based on which researchers can begin constructing their own network data. It includes park trails, parking lot passages, and pedestrian walkways, saving researchers time and energy needed to manually add unrepresented links to the network. Table 10. Network Data Sources Institution Name Coverage Attributes Open Street Map ( GeoFabrik Ohio Contains potential pathways for bicyclists, Road class (motorway, residential, etc), One way, Locations of traffic signals US Census TIGER/Line System All Streets Franklin, OH None (but detailed network) MORPC (Mid Ohio Regional Planning Commission) Bikeways Central Ohio Path type, Class, Route type, MORPC (Mid Ohio Regional Planning Commission) Bike Level of Service (BLOS) Network Central Ohio Lanes, Speed, One way, Bike friendliness State Government of Ohio Ohio Geographically Referenced Information Program (OGRIP) LBRS (location based response system) street centerlines Central Ohio # of Lanes, Speed, One way, Road class After manually inspecting the accuracy and completeness of the resulting network data, we used ArcGIS ModelBuilder module to develop a map matching algorithm. The algorithm was developed by Dalumpines and Scott (2011). This algorithm requires the unique feature of ModelBuilder, Iterate Field Values to iteratively process multiple bike traces with different origins and destinations and polyline barriers. It also requires the standard Network Analyst extension license to be implemented. The way this algorithm works is that it finds the shortest path between a pair of origin and destination points within a bounded area, which is the 30 or 40 meter buffer area of a polyline connecting the set of GPS points of a trip. 42

52 The success rate of this map matching task was 89.1%. This rate is around the average success rate reported in previous studies (Dalumpines and Scott, 2011; Hudson et al. 2012). After we matched all routes to the network, it became evident that some of these routes were identical and traveled by the same bicyclist, therefore should be merged into a single route. If one path overlapped with another path within a twenty meter error range at the origin or destination, the two paths were considered to be the same path. After removing these identical routes, we ended up with a total of 452 unique routes made by 76 unique bicyclists. The following map presents the final map of the collected GPS traces cleaned and matched to the complete street network for bicyclists (Figure 25). In addition to the map representing the actually chosen routes of the participants, we created a separate map showing the shortest distance routes between the origins and destinations (Figure 26). Figure 25. The Map of the Actually Chosen Routes Matched to the Network Map (N = 452) 43

53 Figure 26. The Map of the Shortest Routes for Comparison (N = 452) 44
 (Yellow: 20 30, Orange: 30 40, Red: 40 82) Figure 27 shows the most frequently used street segments among the chosen routes")
 and those segments along Neil Avenue, where many university buildings and facilities are located.")
54 d. Frequently used network segments The Actually Chosen Routes (trip frequency 20) The Shortest Routes (trip frequency 20) Figure 27. Comparison of the Most Frequently Used Routes (Chosen and Shortest Paths) (Yellow: 20 30, Orange: 30 40, Red: 40 82) Figure 27 shows the most frequently used street segments among the chosen routes and the shortest routes. The two maps look quite different. They suggest that different segments were actually preferred by the bicyclists, unlike those expected by the shortest path algorithm. As Table 10 presents, many of the participant bicyclists used pedestrian walkways near the central university library (i.e. Thompson Library) and those segments along Neil Avenue, where many university buildings and facilities are located. Many of the participant bicyclists also preferred the exclusive bicycle trails, for example Olentangy Trail, which is close to the campus area. Except for the segments within the campus area, the segments with higher levels of bikeability were favored by the bicyclists. Based on these data we anticipate that the characteristics of the chosen routes differ from those of the shortest routes. 45


55 Table 11. The Five Most Frequently Used Link Segments by the OSU Participants Location Neil Avenue & Neil Drive Trip Frequency 78 ~ 81 Bicycle Level of Service Good Rank 1 Satellite View Location John H Herrick Dr & Cannon Dr & Olentangy Trail Trip Frequency 66 ~ 77 Bicycle Level of Service Poor Rank 2 Satellite View Location Olentangy Trail Trip Frequency 58 ~ 65 Bicycle Level of Service Good (Exclusive Bicycle Trail) Rank 3 Satellite View 46
")

56 Table 12. The Five Most Frequently Used Link Segments by the OSU Participants (Continued) Location Neil Avenue & W 8 th Ave Trip Frequency 52 ~ 57 Bicycle Level of Service Moderate Rank 4 Satellite View Location Olentangy Trail Trip Frequency Bicycle Level of Service Good (Exclusive Bicycle Trail) Rank 5 Satellite View 47
57 Future Plans a. Research Questions To analyze bicyclists route choice behaviors more accurately, a small number of studies have employed revealed preference surveys on commute routes using GPS based route tracking applications. These studies identify physical, functional, and operational characteristics of chosen and alternative routes as factors associated with route choices (Broach, Dill & Gliebe, 2012; Gim & Ko, 2016; Hood, Sall & Charlton, 2011; Howard & Burns, 2011; Menghini et al. 2010; Sener, Eluru & Bhat, 2009; Zhu & Levinson, 2015; Zimmermann, Mai & Frejinger, 2017). It is commonly found that, even if cyclists favor off street bike paths and bike lanes, their sensitivity to trip length turns out to be stronger than their sensitivity to shared use, especially in the case of commute trips (Broach, Dill & Gliebe, 2012; Hood, Sall & Charlton, 2011; Menghini et al. 2010; Sener, Eluru & Bhat, 2009). The influence of route gradient and its variations are significant, though small (Hood, Sall & Charlton, 2011; Zimmermann, Mai & Frejinger, 2017). While the results of traffic volume, speed limits and the number of lanes vary from study to study, signalized turns and stop signs appear to have significant impacts (Broach, Dill & Gliebe, 2012; Sener, Eluru & Bhat, 2009). Despite the significance of the road and traffic conditions, there is a lack of consideration on the environmental characteristics of bicycle routes, such as surrounding land use/cover patterns and streetscape. These environmental indicators are important because riders seek diverse utilities, such as health and recreation, even during utilitarian trips. Surrounding landuses are also associated with average daily traffic and pedestrian volumes, which affect bicycling conditions (Morency et al., 2012). Information on the effects of the built environment can inform decision makers on where to invest in and how to design bicycle facilities. Existing studies on walking behavior of urban residents find significant relationships between street network walkability and walking distance and route choices (Sarkar et al. 2015; Tribby et al. 2016). Tribby et al. (2016) find that a higher number of offices, on street parking and graffiti increases the propensity of riding along whereas retail stores/restaurants, industrial land use and pedestrian safety infrastructure decrease this propensity. While research on the relationship between streetscape design elements and propensity to walk is active, there has been few studies that examine the relationship between land use patterns, streetscape, and bicycling route preferences. Building upon these findings and using the cycling GPS data processed for empirical analysis, we will seek answers to the following questions. How much do cyclists prefer the shortest route when riding a bicycle? 48
58 How far are cyclists willing to take detours to enjoy their preferred attributes? How much are these routes adjacent to and overlapping with the shortest routes? Which factors drive bicyclists to take detours? What are the differences between a chosen route and the corresponding shortest route? What determinants are closely associated with the decision to detour and the degree of diversion? b. Network and Environmental Attributes Table 11 presents the list of expected explanatory variables for the study. The explanatory variables include: Roadway physical characteristics and classes (e.g., grade, the number of lanes, signalized and unsignalized intersections and road hierarchy (arterial, secondary, tertiary, residential, and service roadways)) Bicycle related facilities (e.g., the share of bicycle trails, paths, and lanes along each route) Route characteristics (e.g., travel length, number of turns, trip purpose) Roadway functional characteristics (e.g., typical traffic estimates, speed limits) Surrounding land uses and natural features (e.g., commercial, residential, offices, industrial and other land uses, and land cover (e.g., vegetation, impervious, water and bare soil) Streetscape features (the amount of street trees and greenery) To quantitatively assess the association between the explanatory variables and the degree of diversion (i.e. percentage of overlap with the shortest path), we plan to develop two different forms of models where the dependent variable will take two different forms: i. OLS regression models where the dependent variables will be the degree of diversion measured as the percentage of overlap with the shortest route (0 ~ 100%) ii. Ordered logit/probit models where we will assign discrete categories for different overlap levels (for instance: 0 to 25%, 25 to 50%, 50 to 75% and 75% and above) These models will help identify the factors associated with bicyclist route choice decisions. 49
59 Table 13. The Description of Potential Explanatory Variables for Bicycle Route Choice Analysis Category Description Distance of the actually chosen route (meter) Distance of the shortest route (meter) Trip related How much longer the actual route is than the shortest (%) The length of an overlap between the chosen and shortest routes How much portion of the chosen route stay on the shortest route (%) % of Land for Commercial Use within a 50m buffer of a route % of Land for Industrial Use within a 50m buffer of a route % of Land for Office within a 50m buffer of a route % of Land for Single Family Residence within a 50m buffer of a route Land Use Zoning % of Land for Multifamily Residence within a 50m buffer of a route % of Land for Education within a 50m buffer of a route % of Land for Governmental Use within a 50m buffer of a route % of Land for Park within a 50m buffer of a route Land Use Mix Index (= 8 category land use entropy score) % of Land with Green Vegetation Cover within a 50m buffer of a route % of Urban Impervious Cover within a 50m buffer of a route % of Water Surface within a 50m buffer of a route Land Cover % of Other types (e.g. bare soil) within a 50m buffer of a route Land Cover Mix Index (= 4 category land cover entropy score) Average Normalized Difference in Vegetation Index within a 50m buffer of a route (a range from 1 to 1) using remote sensing images % of Route Segments where larger than 6% Up Slope % of Route Segments where larger than 10% Up Slope % of Route Segments where larger than 15% Up Slope Slope % of Route Segments where larger than 20% Up Slope Mean Gradient (average slope, %) Variation in Elevation (std. dev, %) No. of Turns along a route Turns No. of Right Turns along a route No. of Left Turns along a route Average number of intersections per 100m along a route Intersection Average number of signalized intersections per 100m along a route Average number of unsignalized intersections per 100m along a route The average of posted speed limit along a route % of a route where posted speed limit is more than 35 mph Speed Limit % of a route where posted speed limit is more than 40 mph % of a route where posted speed limit is more than 45 mph 1 = primary, 2 = secondary, 3 = tertiary, 4= collector, 5= local, 6 = local, 7 = minor street, 8 Road Hierarchy = no motorized traffic path Lanes Average number of road lanes along a route Typical traffic along a route during peak hours (Tuesdays, 8AM) collected from Google Maps Traffic traffic records (0 = no motorized traffic, 1= fast, 2= active, 3= moderate, 4=busy, 5=heavy) % of a route which bicycle path exists % of a route where bicycle boulevard exists Bicycle Facilities % of a route where bicycle lanes exist % of a route where bicycle routes exists 50
60 Concluding Remarks There is increasing interest among colleges and universities in ways to reduce local congestion, contributions to greenhouse gases, and provide leadership in sustainable transportation. This study brings these two emerging areas together: analyzing campus transportation patterns and identifying the factors associated with bicycle trip generation and bicycle route choices using state of the art data collection techniques at a large university campus, The Ohio State University (OSU). This report covered these two components and provided directions for future research. The first part of this study uses data from the 2015 Campus Travel Pattern Survey. We explored the factors associated with individuals bicycling choices and analyzed the shortest paths that these individuals would potentially take if they were to ride bicycles to campus. We found that potential bicyclists would encounter roads with multiple BLOSs. For instance, individuals may ride on road segments with moderate or residential BLOS near their neighborhoods and close to campus, but likely face poor or moderate road segments in between. The second part of the study uses smart phone GPS data to analyze bicycle route preferences and their associations with facility types. The data were collect using a smart phone app CycleTracks. The results show that the most frequently used street segments among the chosen routes and the shortest routes are different in terms of their locations and characteristics. These suggest that riders preferred different segments as compared to those predicted by the shortest path algorithm. Following these results, we will conduct further analysis on the determinants of route choices, particularly focusing on the factors that are closely associated with the decision to detour and the degree of diversion. 51
61 References Akar, G., & Clifton, K. (2009). Influence of individual perceptions and bicycle infrastructure on decision to bike. Transportation Research Record: Journal of the Transportation Research Board, (2140), Broach, J., Dill, J., & Gliebe, J. (2012). Where do cyclists ride? A route choice model developed with revealed preference GPS data. Transportation Research Part A: Policy and Practice, 46(10), Dalumpines, R. and Scott, D.M. (2011). GIS based map matching: Development and demonstration of a postprocessing map matching algorithm for transportation research. In Advancing Geoinformation Science for a Changing World, , Springer Berlin Heidelberg. Dill, J. and Gliebe, J. (2008). Understanding and measuring bicycling behavior: A focus on travel time and route choice: Final report OTREC RR Oregon Transportation Research and Education Consortium. ESRI. (2016). Technical Support: How To: Import XY data tables to ArcMap and convert the data to a shapefile. Accessed in June 12, article/ Gim, T. H. T., & Ko, J. (2016). Maximum Likelihood and Firth Logistic Regression of the Pedestrian Route Choice. International Regional Science Review, Hoogendoorn Lanser, S., & Bovy, P. (2007). Modeling Overlap in Multimodal Route Choice by Including Trip Part Specific Path Size Factors. Transportation Research Record: Journal of the Transportation Research Board, 2003, Hood, J., Sall, E., & Charlton, B. (2011). A GPS based bicycle route choice model for San Francisco, California. Transportation Letters, 3(1), Howard, C., & Burns, E. (2001). Cycling to Work in Phoenix: Route Choice, Travel Behavior, and Commuter Characteristics. Transportation Research Record: Journal of the Transportation Research Board, 1773, Hudson, J.G., Duthie, J.C., Rathod, Y.K., Larsen, K.A. and Meyer, J.L. (2012). Using smartphones to collect bicycle travel data in Texas (No. UTCM ). Ma. L., & Dill. J. (2016). Do people s perceptions of neighborhood bikeability match reality?. Journal of Transport and Land Use, 10(1), Menghini, G., Carrasco, N., Schüssler, N., & Axhausen, K. W. (2010). Route choice of cyclists in Zurich. Transportation Research Part A: Policy and Practice, 44(9),
62 Morency, P., Gauvin, L., Plante, C., Fournier, M. and Morency, C. (2012). Neighborhood social inequalities in road traffic injuries: the influence of traffic volume and road design. American Journal of Public Health, 102(6), Park, Y. and Akar, G. (2017). Factors Affecting Bicycle Commuting: The Role of Individual Attitudes and Neighborhood Environments. Transportation Research Board 96th Annual Meeting, No Sarkar, C., Webster, C., Pryor, M., Tang, D., Melbourne, S., Zhang, X., & Jianzheng, L. (2015). Exploring associations between urban green, street design and walking: Results from the Greater London boroughs. Landscape and Urban Planning, 143, Sener, I. N., Eluru, N., & Bhat, C. R. (2009). An analysis of bicycle route choice preferences in Texas, US. Transportation, 36(5), Tribby, C. P., Miller, H. J., Brown, B. B., Werner, C. M., & Smith, K. R. (2016). Analyzing walking route choice through built environments using random forests and discrete choice techniques. Environment and Planning B: Planning and Design, Zhou, J. and Golledge, R. (2006). A three step general map matching method in the GIS environment: Travel/transportation study perspective. International Journal of Geographical Information System, 8(3), pp Zhu, S., & Levinson, D. (2015). Do People Use the Shortest Path? An Empirical Test of Wardrop s First Principle. PLoS ONE, 10(8). Zimmermann, M., Mai, T., & Frejinger, E. (2017). Bike route choice modeling using GPS data without choice sets of paths. Transportation Research Part C: Emerging Technologies, 75,

63 Appendix 1. Survey Fliers 54


64 Appendix 2. Survey Promotion Website 55
LESSONS FROM THE GREEN LANES: EVALUATING PROTECTED BIKE LANES IN THE U.S.
 LESSONS FROM THE GREEN LANES: EVALUATING PROTECTED BIKE LANES IN THE U.S. FINAL REPORT: APPENDIX C BICYCLIST ORIGIN AND DESTINATION ANALYSIS NITC-RR-583 by Alta Planning and Design Matt Berkow Kim Voros
1999 On-Board Sacramento Regional Transit District Survey
 SACOG-00-009 1999 On-Board Sacramento Regional Transit District Survey June 2000 Sacramento Area Council of Governments 1999 On-Board Sacramento Regional Transit District Survey June 2000 Table of Contents
Baseline Survey of New Zealanders' Attitudes and Behaviours towards Cycling in Urban Settings
 Baseline Survey of New Zealanders' Attitudes and Behaviours towards Cycling in Urban Settings Highlights 67% of urban New Zealanders, 18 years of age or more own or have access to a bicycle that is in
Kevin Manaugh Department of Geography McGill School of Environment
 Kevin Manaugh Department of Geography McGill School of Environment Outline Why do people use active modes? Physical (Built environment) Factors Psychological Factors Empirical Work Neighbourhood Walkability
APPENDIX D LEVEL OF TRAFFIC STRESS METHODOLOGY
 APPENDIX D LEVEL OF TRAFFIC STRESS METHODOLOGY 01 WHAT IS LEVEL OF TRAFFIC STRESS? When people bicycle on roadways, they encounter varying levels of stress from traffic. A quiet residential street with
METROPOLITAN TRANSPORTATION PLAN OUTREACH: INTERACTIVE MAP SUMMARY REPORT- 10/03/14
 METROPOLITAN TRANSPORTATION PLAN OUTREACH: INTERACTIVE MAP SUMMARY REPORT- 10/03/14 INTRODUCTION This document summarizes the results of the online interactive mapping exercise implemented by MIG for the
Cabrillo College Transportation Study
 Cabrillo College Transportation Study Planning and Research Office Terrence Willett, Research Analyst, Principle Author Jing Luan, Director of Planning and Research Judy Cassada, Research Specialist Shirley
Transportation Curriculum. Survey Report
 Transportation Curriculum Survey Report Jennifer Dill, Ph.D. Lynn Weigand, Ph.D. Portland State University Center for Urban Studies Center for Transportation Studies Initiative for Bicycle and Pedestrian
GIS Based Non-Motorized Transportation Planning APA Ohio Statewide Planning Conference. GIS Assisted Non-Motorized Transportation Planning
 The Purpose of GIS Assisted Network GIS Assisted Non-Motorized Transportation 2011 APA Ohio Statewide Conference Friday, 10:45 AM to Noon Focus on near-term projects wwwgreenwaycollabcom The purpose of
Active Travel and Exposure to Air Pollution: Implications for Transportation and Land Use Planning
 Active Travel and Exposure to Air Pollution: Implications for Transportation and Land Use Planning Steve Hankey School of Public and International Affairs, Virginia Tech, 140 Otey Street, Blacksburg, VA
Chapter 2. Bellingham Bicycle Master Plan Chapter 2: Policies and Actions
 Chapter 2 Bellingham Bicycle Master Plan Chapter 2: Policies and Actions Chapter 2: Policies and Actions The Bicycle Master Plan provides a road map for making bicycling in Bellingham a viable transportation
Active Transportation Facility Glossary
 Active Transportation Facility Glossary This document defines different active transportation facilities and suggests appropriate corridor types. Click on a facility type to jump to its definition. Bike
BICYCLE LEVEL OF SERVICE for URBAN STREETS. Prepared by Ben Matters and Mike Cechvala. 4/16/14 Page 1
 BICYCLE LEVEL OF SERVICE for URBAN STREETS Prepared by Ben Matters and Mike Cechvala 4/16/14 Page 1 Introduction The methodology used for the Bicycle (BLOS) analysis is from the Highway Capacity Manual
Matt Dykstra PSU MGIS Program
 Matt Dykstra PSU MGIS Program Outline Background Objective Existing Research Methodology Conclusions Significance and Limitations Two-way cycle track: Streetsblog.org Background What is bicycle infrastructure?
Driverless Vehicles Potential Influence on Bicyclist Facility Preferences
 Driverless Vehicles Potential Influence on Bicyclist Facility Preferences MICHAEL BLAU, MCRP, LCI O T E C O C T O B E R 2 6, 2 0 1 6 S E S S I O N # 8 2 - E V A L U AT I N G T H E P E R F O R M A N C E
2010 Pedestrian and Bicyclist Special Districts Study Update
 2010 Pedestrian and Bicyclist Special Districts Study Update Pedestrian and Bicyclist Special Districts Program Overview H-GAC s Special Districts Program aims to provide strategic investments in pedestrian
DKS & WASHINGTON COUNTY Washington County Transportation Survey
 PREPARED FOR: DKS & WASHINGTON COUNTY Washington County Transportation Survey April 2013 PREPARED BY: DHM RESEARCH (503) 220-0575 239 NW 13 th Ave., #205, Portland, OR 97209 www.dhmresearch.com 1 INTRODUCTION
GIS Based Data Collection / Network Planning On a City Scale. Healthy Communities Active Transportation Workshop, Cleveland, Ohio May 10, 2011
 The Purpose of GIS Based Network Planning GIS Based Data Collection / Network Planning Healthy Communities Active Transportation Conference Tuesday, May 10, 2011 10:00 AM Norman Cox, LLA, ASLA. Ann Arbor,
South Florida Commuter Travel Survey Summary and Preliminary Results. Southeast Florida FSUTMS User Group Meeting June 1, 2012
 South Florida Commuter Travel Survey Summary and Preliminary Results Southeast Florida FSUTMS User Group Meeting June 1, 2012 Agenda Introduction Survey Design Survey Implementation Preliminary Findings
Vision Zero High Injury Network Methodology
 Vision Zero High Injury Network Methodology DATA SETS USED: 1. Reportable crashes in Philadelphia from 2012-2016, available as open data through PennDOT 2. Street Centerline geographic layer, maintained
Goodlettsville Bicycle and Pedestrian Plan Executive Summary
 Goodlettsville Bicycle and Pedestrian Plan July 2010 In Cooperation with the Nashville Area Metropolitan Planning Executive Organization Summary Introduction Progressive and forward thinking communities
Rerouting Mode Choice Models: How Including Realistic Route Options Can Help Us Understand Decisions to Walk or Bike
 Portland State University PDXScholar TREC Friday Seminar Series Transportation Research and Education Center (TREC) 4-1-2016 Rerouting Mode Choice Models: How Including Realistic Route Options Can Help
Travel Behaviour Study of Commuters: Results from the 2010 Dalhousie University Sustainability Survey
 Travel Behaviour Study of Commuters: Results from the 2010 Dalhousie University Sustainability Survey Technical Report 2011-602 Prepared by: M.A. Habib, K.D. Leckovic & D. Richardson Prepared for: Office
2017 North Texas Regional Bicycle Opinion Survey
 2017 North Texas Regional Bicycle Opinion Survey Sustainable Development Program Kevin Kokes, AICP Public Meetings April, 2018 North Central Texas Council of Governments MPO for the Dallas-Fort Worth Region
Bikeway action plan. Bicycle Friendly Community Workshop March 5, 2007 Rochester, MN
 Bikeway action plan Summary The was held on March 5, 2007 at the Rochester Mayo Civic Center. The workshop was hosted by Rochester-Olmsted County Planning Department in collaboration with the League of
AAMPO Regional Transportation Attitude Survey
 AAMPO Regional Transportation Attitude Survey Traditionally Underserved Populations helping organizations make better decisions since 1982 2018 Submitted to the AAMPO By: ETC Institute 725 W. Frontier
Pedestrian Demand Modeling: Evaluating Pedestrian Risk Exposures
 Pedestrian Demand Modeling: Evaluating Pedestrian Risk Exposures Kelly J. Clifton National Center for Smart Growth University of Maryland May 19, 2008 Study Team University of Maryland National Center
Executive Summary. TUCSON TRANSIT ON BOARD ORIGIN AND DESTINATION SURVEY Conducted October City of Tucson Department of Transportation
 Executive Summary TUCSON TRANSIT ON BOARD ORIGIN AND DESTINATION SURVEY Conducted October 2004 Prepared for: City of Tucson Department of Transportation May 2005 TUCSON TRANSIT ON BOARD ORIGIN AND DESTINATION
Rochester Area Bike Sharing Program Study
 roc bike share Rochester Area Bike Sharing Program Study Executive Summary ~ January 2015 JANUARY 2015 8484 Georgia Avenue, Suite 800 Silver Spring, MD 20910 3495 Winton Pl., Bldg E, Suite 110 Rochester,
Purpose and Need. Chapter Introduction. 2.2 Project Purpose and Need Project Purpose Project Need
 Chapter 2 Purpose and Need 2.1 Introduction The El Camino Real Bus Rapid Transit (BRT) Project (Project) would make transit and other transportation improvements along a 17.6-mile segment of the El Camino
2018 Transportation Survey October 17, Prepared by:
 Transportation Survey October 17, Prepared by: Overview Methodology Systemwide results Strengths/Weaknesses by mode Importance of possible improvements Conclusions Methodology 500 Chittenden County residents
Investigating Commute Mode and Route Choice Variability in Jakarta using multi-day GPS Data
 Investigating Commute Mode and Route Choice Variability in Jakarta using multi-day GPS Data Zainal N. Arifin Kay W. Axhausen Conference paper STRC 2011 Investigating Commute Mode and Route Choice Variability
Saturation Flow Rate, Start-Up Lost Time, and Capacity for Bicycles at Signalized Intersections
 Transportation Research Record 1852 105 Paper No. 03-4180 Saturation Flow Rate, Start-Up Lost Time, and Capacity for Bicycles at Signalized Intersections Winai Raksuntorn and Sarosh I. Khan A review of
IBPI: Bicycle and Pedestrian Education Program
 Portland State University PDXScholar Urban Studies and Planning Faculty Publications and Presentations Nohad A. Toulan School of Urban Studies and Planning 12-1-2010 IBPI: Bicycle and Pedestrian Education
City Snapshot September 27, 2018
 1 City Snapshot September 27, 2018 Respondent Introduction Thank you for providing data for the PlacesForBikes City Rating program! The information you provide will be used to understand the progress your
SACRAMENTO AREA TRAVEL SURVEY: BEFORE BIKE SHARE
 SACRAMENTO AREA TRAVEL SURVEY: BEFORE BIKE SHARE August 2017 A Research Report from the National Center for Sustainable Transportation Susan Handy, University of California, Davis Drew Heckathorn, University
APPENDIX D. BICYCLE AND PEDESTRIAN AWARENESS SURVEY (Completed by Zogby International)
") APPENDIX D BICYCLE AND PEDESTRIAN AWARENESS SURVEY (Completed by Zogby International) Residents Views On Bicycling, Walking, and Jogging In Onondaga County Submitted to: Danielle Zebley Syracuse Metropolitan
APPENDIX D BICYCLE AND PEDESTRIAN AWARENESS SURVEY (Completed by Zogby International) Residents Views On Bicycling, Walking, and Jogging In Onondaga County Submitted to: Danielle Zebley Syracuse Metropolitan
Southern California Walking/Biking Research And Creative Evaluation
 Southern California Walking/Biking Research And Creative Evaluation Quantitative Research Topline Report December 7, 2015 Background & Objectives The Southern California Association of Governments (SCAG)
Online Open House Survey Report. December 2016
 December 216 I. OVERVIEW & OUTREACH SUMMARY Introduction Washington County evaluated long-term transportation investments and strategies as part of the Transportation Futures Study. The purpose of the
#19 MONITORING AND PREDICTING PEDESTRIAN BEHAVIOR USING TRAFFIC CAMERAS
 #19 MONITORING AND PREDICTING PEDESTRIAN BEHAVIOR USING TRAFFIC CAMERAS Final Research Report Luis E. Navarro-Serment, Ph.D. The Robotics Institute Carnegie Mellon University November 25, 2018. Disclaimer
2011 Countywide Attitudinal and Awareness Survey Results
 2011 Countywide Attitudinal and Awareness Survey Results Purpose of Study Establish baseline for measuring future performance Identify perceptions about transportation system, issues, priorities Assess
WILMAPCO Public Opinion Survey Summary of Results
 Wilmington Area Planning Council WILMAPCO Public Opinion Survey Summary of Results Prepared by: 2955 Valmont Road, Suite 300 Boulder, Colorado 80301 t: 303-444-7863 f: 303-444-1145 www.n-r-c.com Table
A Traffic Operations Method for Assessing Automobile and Bicycle Shared Roadways
 A Traffic Operations Method for Assessing Automobile and Bicycle Shared Roadways A Thesis Proposal By James A. Robertson Submitted to the Office of Graduate Studies Texas A&M University in partial fulfillment
El Paso County 2040 Major Transportation Corridors Plan
 El Paso County 2040 Major Transportation Corridors Plan Connect-our-County Online Transportation User Survey Preliminary Results June 24, 2010 Years of Residence 2. How many years have you LIVED HERE?
Determining bicycle infrastructure preferences A case study of Dublin
 *Manuscript Click here to view linked References 1 Determining bicycle infrastructure preferences A case study of Dublin Brian Caulfield 1, Elaine Brick 2, Orla Thérèse McCarthy 1 1 Department of Civil,
Recommendations from Boston City Council Transportation Policy Briefing Series
 Recommendations from Boston City Council Transportation Policy Briefing Series Report to Boston City Councilors May 2017 Prepared by: Boston City Council Committee on Parks, Recreation & Transportation
Modal Shift in the Boulder Valley 1990 to 2009
 Modal Shift in the Boulder Valley 1990 to 2009 May 2010 Prepared for the City of Boulder by National Research Center, Inc. 3005 30th Street Boulder, CO 80301 (303) 444-7863 www.n-r-c.com Table of Contents
FEDERAL HIGHWAY ADMINISTRATION APPLICATION
 FEDERAL HIGHWAY ADMINISTRATION APPLICATION REQUEST FOR PERMISSION TO EXPERIMENT WITH A BICYCLE BOX INTERSECTION TREATMENT Submitted by: City of Columbus Department of Public Service Date: June 26, 2009
U.S. Bicycling Participation Study
 U.S. Bicycling Participation Study Report of findings from the 2016 survey Conducted by Corona Insights Commissioned by PeopleForBikes Released July 2017 Table of Contents Background and Objectives 3 Research
3 ROADWAYS 3.1 CMS ROADWAY NETWORK 3.2 TRAVEL-TIME-BASED PERFORMANCE MEASURES Roadway Travel Time Measures
 ROADWAYS Approximately 6 million trips are made in the Boston metropolitan region every day. The vast majority of these trips (80 to percent, depending on trip type) involve the use of the roadway network
6.0 PEDESTRIAN AND BICYCLE FACILITIES 6.1 INTRODUCTION 6.2 BICYCLE DEMAND AND SUITABILITY Bicycle Demand
 6.0 PEDESTRIAN AND BICYCLE FACILITIES 6.1 INTRODUCTION Bicycle and pedestrian travel along and in the vicinity of the corridor is part of the vision of Somerset and Hunterdon counties and the integrated
CONNECTING PEOPLE TO PLACES
 CONNECTING PEOPLE TO PLACES 82 EAST BENCH MASTER PLAN 07 Introduction The East Bench transportation system is a collection of slow moving, treelined residential streets and major arteries that are the
Complete Street Analysis of a Road Diet: Orange Grove Boulevard, Pasadena, CA
 Complete Street Analysis of a Road Diet: Orange Grove Boulevard, Pasadena, CA Aaron Elias, Bill Cisco Abstract As part of evaluating the feasibility of a road diet on Orange Grove Boulevard in Pasadena,
ESP 178 Applied Research Methods. 2/26/16 Class Exercise: Quantitative Analysis
 ESP 178 Applied Research Methods 2/26/16 Class Exercise: Quantitative Analysis Introduction: In summer 2006, my student Ted Buehler and I conducted a survey of residents in Davis and five other cities.
EUCLID AVENUE PARKING STUDY CITY OF SYRACUSE, ONONDAGA COUNTY, NEW YORK
 EUCLID AVENUE PARKING STUDY CITY OF SYRACUSE, ONONDAGA COUNTY, NEW YORK CITY OF SYRACUSE DEPARTMENT OF PUBLIC WORKS 1200 CANAL STREET EXTENSION SYRACUSE, NEW YORK 13210 DRAFT REPORT DATE: November 13,
Northbound San Jose Avenue & I-280 Off-Ramp Road Diet Pilot Project
 Project Overview Fed by a two-lane Interstate-280 (I-280) off-ramp, high vehicular volumes and speeds are longstanding issues along San Jose Avenue. Residents in the surrounding neighborhoods have expressed
2017 Florida Commuter Transportation Summit
 2017 Florida Commuter Transportation Summit Building Bicycle Friendly Universities Ron Fuller, Assistant Director Transportation and Parking Services University of Florida Achieving the Silver Level a
Traffic Safety Barriers to Walking and Bicycling Analysis of CA Add-On Responses to the 2009 NHTS
 Traffic Safety Barriers to Walking and Bicycling Analysis of CA Add-On Responses to the 2009 NHTS NHTS Users Conference June 2011 Robert Schneider, Swati Pande, & John Bigham, University of California
Exhibit 1 PLANNING COMMISSION AGENDA ITEM
 Exhibit 1 PLANNING COMMISSION AGENDA ITEM Project Name: Grand Junction Circulation Plan Grand Junction Complete Streets Policy Applicant: City of Grand Junction Representative: David Thornton Address:
UWA Commuting Survey 2013
 UWA Commuting Survey 2013 September 2013 Project: UWA/10 UWA Commuting Survey 2013 September 2013 Client: University of Western Australia Project: UWA/10 Consultants: Donna Hill Petra Roberts Jennifer
At each type of conflict location, the risk is affected by certain parameters:
 TN001 April 2016 The separated cycleway options tool (SCOT) was developed to partially address some of the gaps identified in Stage 1 of the Cycling Network Guidance project relating to separated cycleways.
Methodology. Reconnecting Milwaukee: A BikeAble Study of Opportunity, Equity and Connectivity
 Reconnecting Milwaukee: A BikeAble Study of Opportunity, Equity and Connectivity Released June 27, 2017 About BikeAble Rails-to-Trails Conservancy s (RTC s) BikeAble TM tool is a GIS-modeling platform
ADOT Statewide Bicycle and Pedestrian Program Summary of Phase IV Activities APPENDIX B PEDESTRIAN DEMAND INDEX
 ADOT Statewide Bicycle and Pedestrian Program Summary of Activities APPENDIX B PEDESTRIAN DEMAND INDEX May 24, 2009 Pedestrian Demand Index for State Highway Facilities Revised: May 29, 2007 Introduction
Welcome! San Jose Avenue Open House August 25, 2015
 Welcome! San Jose Avenue Open House August 25, 2015 Vision Zero The City and County of San Francisco adopted Vision Zero San Francisco Vision Zero High Injury Network as a policy in 2014, committing an
CYCLING STRATEGY RESEARCH PUBLIC TELEPHONE SURVEY JANUARY HarGroup Management Consultants
 CYCLING STRATEGY RESEARCH PUBLIC TELEPHONE SURVEY JANUARY 2011 HarGroup Management Consultants CYCLING STRATEGY RESEARCH PUBLIC TELEPHONE SURVEY Submitted to The City of Calgary By HarGroup Management
Chapter 7. Transportation. Transportation Road Network Plan Transit Cyclists Pedestrians Multi-Use and Equestrian Trails
 Chapter 7 Transportation Transportation Road Network Plan Transit Cyclists Pedestrians Multi-Use and Equestrian Trails 7.1 TRANSPORTATION BACKGROUND The District of Maple Ridge faces a number of unique
EAST VILLAGE SHOPPERS STUDY A SNAPSHOT OF TRAVEL AND SPENDING PATTERNS OF RESIDENTS AND VISITORS IN THE EAST VILLAGE
 EAST VILLAGE SHOPPERS STUDY A SNAPSHOT OF TRAVEL AND SPENDING PATTERNS OF RESIDENTS AND VISITORS IN THE EAST VILLAGE CONTENTS 2 4 5 6 7 16 17 19 SUMMARY INTRODUCTION BACKGROUND METHODOLOGY RESULTS CONCLUSION
A Walkability Study for Downtown Brunswick
 Alex Thompson and Sam Vitello E.S. 204 Semester Project-Final Paper A Walkability Study for Downtown Brunswick Introduction and Problem Statement The goal of our project was to analyze parking availability
Key objectives of the survey were to gain a better understanding of:
 3 COMMUNITY INPUT Community input is an essential part of corridor studies. For the SR 87 corridor study, VTA staff conducted an extensive online survey of people living and commuting along the corridor.
CITY OF ALPHARETTA DOWNTOWN MASTER PLAN TRAFFIC EVALUATION
 CITY OF ALPHARETTA DOWNTOWN MASTER PLAN TRAFFIC EVALUATION June 2015 CITY OF ALPHARETTA DOWNTOWN MASTER PLAN TRAFFIC EVALUATION Introduction The Alpharetta Downtown Master Plan was developed in the fall
PEDALING FORWARD. A Glance at the SFMTA s Bike Program for SFMTA.COM
 PEDALING FORWARD A Glance at the SFMTA s Bike Program for 2017-2021 SFMTA.COM INTRODUCTION About This Booklet More people from all walks of life see their bicycle as a more convenient way to get where
City of Elizabeth City Neighborhood Traffic Calming Policy and Guidelines
 City of Elizabeth City Neighborhood Traffic Calming Policy and Guidelines I. Purpose: The City of Elizabeth City is committed to ensure the overall safety and livability of residential neighborhoods. One
Non-motorized Transportation Planning Resource Book Mayor s Task Force on Walking and Bicycling City of Lansing, Michigan Spring 2007 pg.
 Non-motorized Transportation Planning Resource Book pg. 105 of 158 Non-motorized Transportation Planning Resource Book pg. 106 of 158 Non-motorized Transportation Planning Resource Book pg. 107 of 158
NM-POLICY 1: Improve service levels, participation, and options for non-motorized transportation modes throughout the County.
 Transportation PRINCE WILLIAM COUNTY 2008 COMPREHENSIVE PLAN NON-MOTORIZED PLAN CONTENTS Goals, Policies, and Action Strategies Table 4 (Bike Facility Classifications and Descriptions) Table 5 (Bike Facility
A GIS APPROACH TO EVALUATE BUS STOP ACCESSIBILITY
 Advanced OR and AI Methods in Transportation A GIS APPROACH TO EVALUATE BUS STOP ACCESSIBILITY Giuseppe SALVO 1, Simona SABATINI 2 Abstract. This paper proposes a methodology to assess public transportation
SANTA CLARA COUNTYWIDE BICYCLE PLAN August 2008
 SANTA CLARA COUNTYWIDE BICYCLE PLAN August 2008 To assist VTA and Member Agencies in the planning, development and programming of bicycle improvements in Santa Clara County. Vision Statement To establish,
Finding a bicycle route that offers a high Level of Service in Adelaide
 Finding a bicycle route that offers a high Level of Service in Adelaide Sekhar School of Natural and Built Environment, University of South Australia 1 Introduction Many community planners and policy makers
Physical Implications of Complete Streets Policies
 Presentation Overview Physical Implications of Complete Norm Cox, ASLA, LLA Landscape Architect Ann Arbor, Michigan, 10:45 to Noon What Are Complete Streets? What Matters to Bicyclists and Pedestrians
APPENDIX E BIKEWAY PRIORITIZATION METHODOLOGY
 APPENDIX E BIKEWAY PRIORITIZATION METHODOLOGY INTRODUCTION The network of bikeways recommended in the Bicycle Master Plan is extensive and is likely to be only partially completed during the 25-year life
University of Victoria Campus Cycling Plan Terms of Reference. 1.0 Project Description
 University of Victoria Campus Cycling Plan Terms of Reference 1.0 Project Description The Campus Cycling Plan, a first for the University, will provide a comprehensive and coordinated approach to support
Winnipeg Walk Bike Projects Downtown Tire Talk - Summary
 Winnipeg Walk Bike Projects Downtown Tire Talk - Summary Downtown Projected Bike Lane System Connecting The Forks to the Exchange District (Fort Street, Garry Street & The Forks to Assiniboine Connection)
 Siła-Nowicka, K. (2018) Analysis of Actual Versus Permitted Driving Speed: a Case Study from Glasgow, Scotland. In: 26th Annual GIScience Research UK Conference (GISRUK 2018), Leicester, UK, 17-20 Apr
Multimodal Through Corridors and Placemaking Corridors
 68 Multimodal Through Corridors and Placemaking Corridors Corridors have different functions in a region. Some corridors are used to get smoothly and rapidly through a region or to get quickly to major
Appendix C. Corridor Spacing Research
 Appendix C. Corridor Spacing Research Task 3 of the Twin Cities Bicycle Study called for the development of bicycle corridor spacing guidelines. This section summarizes research of the spacing of planned
A New Approach in the GIS Bikeshed Analysis Considering of Topography, Street Connectivity, and Energy Consumption
 A New Approach in the GIS Bikeshed Analysis Considering of Topography, Street Connectivity, and Energy Consumption ACSP Conference, Cincinnati, OH November 1, 2012 Hiroyuki Iseki, Ph.D. & Matthew Tingstrom
cyclingincities opinion survey ABOUT THE STUDY WHO DID WE ASK? WHAT DID WE DO?
 cyclingincities opinion survey ABOUT THE STUDY Using a bicycle for transportation is good for the environment, and it also offers personal health benefits. Cycling is also feasible, since more than 80%
Rolling Out Measures of Non-Motorized Accessibility: What Can We Now Say? Kevin J. Krizek University of Colorado
 Rolling Out Measures of Non-Motorized Accessibility: What Can We Now Say? Kevin J. Krizek University of Colorado www.kevinjkrizek.org Acknowledgements Mike Iacono Ahmed El-Geneidy Chen-Fu Liao Outline
Proposed White Flint Separated Bike Lane Network September 2015
 Proposed White Flint Separated Bike Lane Network September 2015 Abstract This report includes a proposed separated bike lane network for the White Flint Sector Plan area. Separated bike lanes create a
Investment in Active Transport Survey
 Investment in Active Transport Survey KEY FINDINGS 3 METHODOLOGY 7 CYCLING INFRASTRUCTURE 8 Riding a bike 9 Reasons for riding a bike 9 Mainly ride on 10 Comfortable riding on 10 Rating of cycling infrastructure
CHAPTER 3: Vision Statement and Goals
 Davidson Walks & Rolls: Active Transportation Master Plan CHAPTER 3 Contents: Overview Vision Statement Measurable Goals Public Outreach CHAPTER 3: Vision Statement and Goals Overview The vision statement
Among the key specific findings from the survey are the following:
 TO: FROM: RE: Interested Parties David Metz and Greg Lewis Fairbank, Maslin, Maullin, Metz & Associates Seattle Voter Attitudes on Bicycling and the So-Called War on Cars DATE: January 17, 2013 Fairbank,
RURAL HIGHWAY SHOULDERS THAT ACCOMMODATE BICYCLE AND PEDESTRIAN USE (TxDOT Project ) June 7, Presented by: Karen Dixon, Ph.D., P.E.
 June 7, Presented by: Karen Dixon, Ph.D., P.E.") RURAL HIGHWAY SHOULDERS THAT ACCOMMODATE BICYCLE AND PEDESTRIAN USE (TxDOT Project 0-6840) June 7, 2016 Presented by: Karen Dixon, Ph.D., P.E., TTI Team: Kay Fitzpatrick, Raul Avelar, & Subasish Das Project
RURAL HIGHWAY SHOULDERS THAT ACCOMMODATE BICYCLE AND PEDESTRIAN USE (TxDOT Project 0-6840) June 7, 2016 Presented by: Karen Dixon, Ph.D., P.E., TTI Team: Kay Fitzpatrick, Raul Avelar, & Subasish Das Project
SAN FRANCISCO MUNICIPAL TRANSPORTATION AGENCY
 THIS PRINT COVERS CALENDAR ITEM NO. : 10.2 DIVISION: Sustainable Streets BRIEF DESCRIPTION: SAN FRANCISCO MUNICIPAL TRANSPORTATION AGENCY Adopting Conceptual Proposal for Streetscape Improvements to Broadway,
Categorizing Cyclists: What Do We Know? Insights from Portland, OR
 Categorizing Cyclists: What Do We Know? Insights from Portland, OR Jennifer Dill, Ph.D. Professor, Urban Studies & Planning Director, Oregon Transportation Research & Education Consortium (OTREC) Portland
VGI for mapping change in bike ridership
 VGI for mapping change in bike ridership D. Boss 1, T.A. Nelson* 2 and M. Winters 3 1 Unviersity of Victoria, Victoria, Canada 2 Arizona State University, Arizona, USA 3 Simon Frasier University, Vancouver,
SAN FRANCISCO MUNICIPAL TRANSPORTATION AGENCY
 THIS PRINT COVERS CALENDAR ITEM NO. : 12 DIVISION: Sustainable Streets BRIEF DESCRIPTION: SAN FRANCISCO MUNICIPAL TRANSPORTATION AGENCY Approving various bicycle improvements and traffic modifications
PERCEPTIONS AND ATTITUDES OF URBAN UTILITY CYCLISTS A CASE STUDY IN A BRITISH BUILT ENVIRONMENT
 Cycling and Society Symposium 2014 Theme A - Demographics Northumbria University at Newcastle Monday 15 th September 2014, Civic Centre PERCEPTIONS AND ATTITUDES OF URBAN UTILITY CYCLISTS A CASE STUDY
Using a Mixed-Method Approach to Evaluate the Behavioural Effects of the Cycling City and Towns Programme
 1 of 25 Using a Mixed-Method Approach to Evaluate the Behavioural Effects of the Cycling City and Towns Programme Kiron Chatterjee (Centre for Transport & Society, UWE) with acknowledgements to research
Community & Transportation Preferences Survey
 Community & Transportation Preferences Survey Webinar: August 5, 2015 Hugh Morris, AICP, LEED Realtor.org Jennifer Dill, Ph.D. trec.pdx.edu 1 Introduction National Association of Realtors Over 1,000,000
Madison Urban Area and Dane County. Bicycle Transportation Plan Summary. September Introduction. Bicycle Plan Scope and Planning Process
 Bicycle Transportation Plan Summary Madison Urban Area and Dane County Introduction September 2000 Bicycling is an important mode of transportation in the Madison urban area and countywide that is available