NORTHWEST HILLSBOROUGH COUNTY TRANSIT STUDY HILLSBOROUGH COUNTY, FLORIDA
|
|
|
- Eileen Claribel Green
- 6 years ago
- Views:
Transcription

1 NORTHWEST HILLSBOROUGH COUNTY TRANSIT STUDY HILLSBOROUGH COUNTY, FLORIDA DRAFT DECEMBER 2016
2

3 NORTHWEST HILLSBOROUGH COUNTY TRANSIT STUDY HILLSBOROUGH COUNTY, FLORIDA PREPARED FOR Hillsborough Metropolitan Planning Organization 601 E Kennedy Boulevard, 18th floor Tampa, FL Hillsborough Area Transit Authority 4305 E 21st Avenue Tampa, FL PREPARED BY Kittelson & Associates, Inc. 100 N Tampa Street, Suite 2670 Tampa, FL DRAFT DECEMBER 2016
4 CONTENTS SECTION 1 INTRODUCTION... 1 Project Description 1 Scope of the Report 1 SECTION 2 EXISTING CONDITIONS AND TRAVEL MARKET... 3 Existing Land Use 3 Future Land Use 5 Population Demographics 7 Existing Transit Network 13 Travel Demand and Market Characteristics 17 SECTION 4 TRAIL AND TRANSIT CONNECTIVITY Methodology for Linking Greenways and Trails 39 Potential Future Connections 49 SECTION 5 CONCLUSIONS AND RECOMMENDATIONS SECTION 3 SERVICE IMPROVEMENT DEVELOPMENT AND EVALUATION Public Involvement 19 Planned Improvements 21 Evaluation of Potential Improvements 22 Improvement Phasing and Prioritization 36 Potential Funding Sources 36
5 FIGURES FIGURE 1 Study Area... 2 FIGURE 2 Existing Land Use... 4 FIGURE 3 Future Land Use... 6 FIGURE 4 Northwest Hillsborough County Population... 7 FIGURE 5 Population Density... 8 FIGURE 6 Employment Density FIGURE 7 Median Household Income FIGURE 8 Existing Transit Network FIGURE 9 Bicycle and Pedestrian Crashes ( ) FIGURE 10 Inflow and Outflow of Employees FIGURE 11 Commute Pattern for Northwest Residents FIGURE 12 Work Locations of Residents in the Study Area FIGURE 13 Home Locations of Workers in the Study Area FIGURE 14 Public Involvement - Respondent Demographics FIGURE 15 Public Involvement - Survey Responses by Zip Code FIGURE 16 Route 34 (Hillsborough Avenue) Potential Improvement FIGURE 17 Route 34 (Hillsborough Avenue) - Public Input FIGURE 18 Route 16 (Waters Avenue) Potential Improvement FIGURE 19 Route 16 (Waters Avenue) - Public Input FIGURE 20 Route 61LX Potential Improvement FIGURE 21 Route 61LX - Public Input FIGURE 22 Potential New Route on Ehrlich Road/Bearss Avenue FIGURE 23 New Ehrlich/Bearss Route - Public Input FIGURE 24 Town n Country Flex Route FIGURE 25 Paratransit Service Area FIGURE 26 First-Mile/Last-Mile Expansion - Public Input FIGURE 27 Trail/Transit Connections FIGURE 28 Route 39/Upper Tampa Bay Trail at Sheldon Road FIGURE 29 Route 34/Town n Country Greenway at Sheldon Road FIGURE 30 Route 30/ Town n Country Greenway at Hanley Road FIGURE 31 Route 34/Air Cargo Road Multi-Use Path at Hillsborough Avenue FIGURE 32 Route 39/Upper Tampa Bay Trail at Citrus Park Drive FIGURE 33 Town n Country Flex Route/ Upper Tampa Bay Trail at Linebaugh Avenue FIGURE 34 Northwest Transfer Center/ Upper Tampa Bay Trail at Waters Avenue FIGURE 35 Route 61 LX/ Upper Tampa Bay Trail at Gunn Highway TABLES TABLE 1 Existing Transit Performance TABLE 2 Operating and Capital Costs TABLE 3 Route 34 (Hillsborough Avenue) Performance Measures TABLE 4 Route 16 (Waters Avenue) Performance Measures TABLE 5 Route 61LX Performance Measures TABLE 6 Ehrlich/Bearss Route Performance Measures TABLE 7 Route 61LX Performance Measures TABLE 8 Summary of Improvement Recommendations APPENDIX A LEHD ANALYSIS APPENDIX B PUBLIC INVOLVEMENT SURVEY APPENDIX C HART TDP MAPS APPENDIX D TBEST OUTPUT REPORTS APPENDIX E ADDITIONAL CONTACT INFORMATION
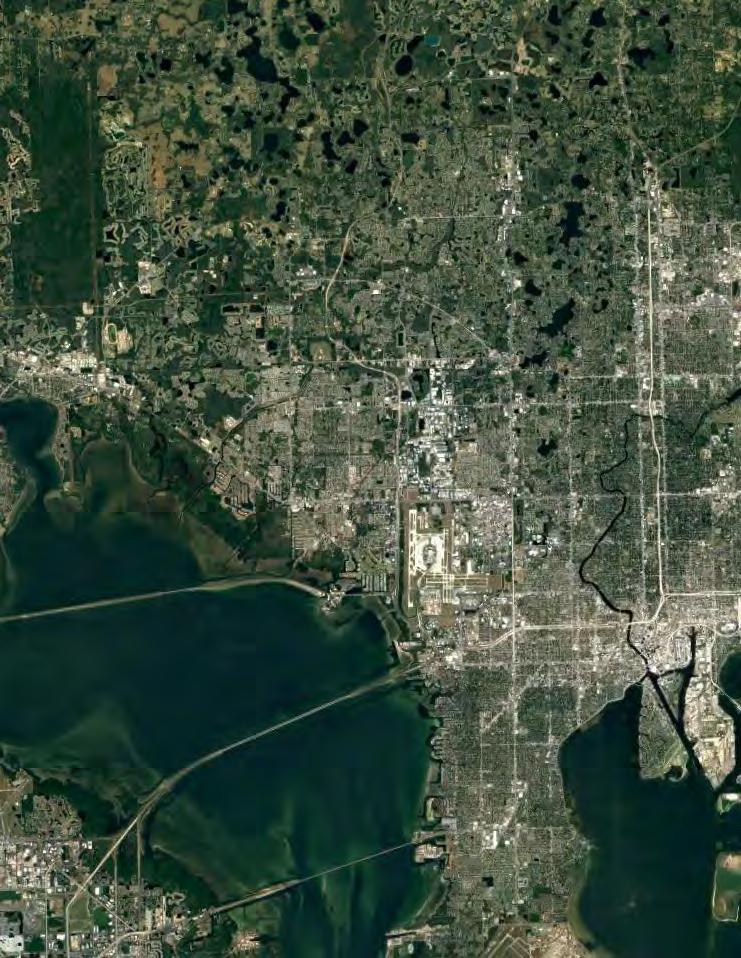
6 SECTION 1 INTRODUCTION PROJECT DESCRIPTION The Hillsborough Metropolitan Planning Organization (MPO), in partnership with the Hillsborough Area Regional Transit Authority (HART), requested a study to evaluate the existing transit service and characteristics in the northwest portion of Hillsborough County and identify service improvements intended to tie into the 2017 major update to the Transit Development Plan (TDP). Northwest Hillsborough County has historically been characterized as suburban or rural-suburban. These less-dense growth patterns present difficulties for providing transit services. The current TDP calls for increased local, express, MetroRapid, and flex services within the study area. This study incorporates some improvements previously identified in the TDP, but also looks for new ways to enhance transit service in the area. SCOPE OF THE REPORT This report describes characteristics of Northwest Hillsborough County related to transit service, including existing and future land use and population demographics. The report describes potential transit service improvements for the area and estimates the ridership and operating and capital costs associated with each improvement. Finally, the report evaluates trail and transit connections within the study area and presents recommendations to improve those connections. The study area limits are the Pasco County line to the north, the Pinellas County line on the west, Hillsborough Avenue (SR 580) to the south, and Dale Mabry Highway (SR 597) to the east (see Figure 1). The study area includes the areas of Egypt Lake, Town n Country, Westchase, Carrollwood, Citrus Park, Northdale, Keystone, and Cheval. 1 DRAFT DECEMBER 2016
7 PINELLAS COUNTY HILLSBOROUGH COUNTY PASCO COUNTY HILLSBOROUGH COUNTY KEYSTONE/ ODESSA CITRUS PARK VILLAGE GREATER CARROLLWOOD/ NORTHDALE WESTCHASE TOWN AND COUNTRY EGYPT LAKE FIGURE 1 PROJECT AREA STUDY AREA TAMPA INTERNATIONAL AIRPORT DRAFT DECEMBER
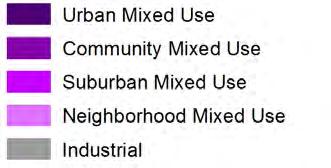
8 SECTION 2 EXISTING CONDITIONS AND TRAVEL MARKET EXISTING LAND USE The Northwest Hillsborough County study area is made up of Egypt Lake, Town n Country, Westchase, Carrollwood, Citrus Park, Northdale, Keystone, and Cheval. The existing land use is primarily single-family residential, as seen in Figure 2. Multi-family residential and commercial land uses front the major roadways in the area. There are industrial uses in the southeast corner of the study area, near the Tampa International Airport, and in the Westchase area. In the northwestern portion of the study area, the land use transitions to more rural and natural land uses. Major land use destinations likely to attract transit users include the Citrus Park Mall, St. Joseph s Hospital, and the area s public libraries. 3 DRAFT DECEMBER 2016


9 FIGURE 2 EXISTING LAND USE DRAFT DECEMBER
10 FUTURE LAND USE The planned future land use is not drastically different from the existing land use, as shown in Figure 3. The study area is expected to remain primarily low-density residential, with higher density residential and commercial uses fronting the major roadways, particularly in the southeast portion of the study area. The industrial land use near the airport is not expected to change. The major change in land use is the increase in mixed-use land uses, particular in the Citrus Park Village and Westchase areas. The vision for Citrus Park Village is to create a pedestrian-oriented traditional village that can support a variety of residential, commercial, office, and civic uses with allowable densities up to 20 housing units per acre. This may create an environment more suitable for transit service. Aside form the future land use designation, there is not yet a documented plan for Westchase; however, the Northwest Area Community Plan, which includes Westchase, sets a vision for traditional neighborhoods and town centers while preserving the area s greenways and natural resources. If Citrus Park and Westchase develop according to their future land use designations, these areas could become more transit-friendly in the future. 5 DRAFT DECEMBER 2016


11 FIGURE 3 FUTURE LAND USE DRAFT DECEMBER
12 POPULATION DEMOGRAPHICS Northwest Hillsborough County is a fast growing area. The population within the study area has nearly doubled in the past 15 years (see Figure 4). FIGURE 4 NORTHWEST HILLSBOROUGH COUNTY POPULATION Source: Census (2000,2010) and American Community Survey (2014) As shown in Figure 5, the resident population in the study area is concentrated in Town n Country, Egypt Lake, Carrollwood and Northdale. These areas each have population densities higher than 10 residents per acre in some locations. The population density is lower in Westchase, Citrus Park, and Cheval, with residential densities no more than 5 residents per acre. The population density continues to decline continuing farther north and west to Keystone, which has an average density of less than one resident per acre. 7 DRAFT DECEMBER 2016


13 Citrus Park Egypt Lake FIGURE 5 POPULATION DENSITY Source: 2014 American Community Survey DRAFT DECEMBER
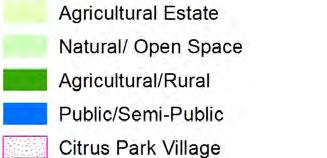
14 The existing employment density in the study area was summarized based on the Tampa Bay Regional Planning Model v8.1 (see Figure 6). The employment density follows a similar pattern as population density. The highest concentrations of jobs are along Hillsborough Avenue and Dale Mabry Highway in the Egypt Lake, Carrollwood, and Town n Country areas. Westchase, Northdale, and Cheval have more limited employment opportunities and there are very few jobs located in Keystone. 9 DRAFT DECEMBER 2016

 DRAFT")
15 FIGURE 6 EMPLOYMENT DENSITY Source: Tampa Bay Regional Planning Model v8.1 (2010) DRAFT DECEMBER
16 The median income for residents of Northwest Hillsborough County is $66,676 more than 30% higher than the Hillsborough countywide median income of $50,122. The income distribution (see Figure 7) follows an approximately inverse relationship to population density. Westchase, Keystone and Cheval have the highest median incomes, while median incomes are somewhat lower in Town n Country, Egypt Lake, and Carrollwood. MEDIAN INCOME $66,676 $50, DRAFT DECEMBER 2016


17 Citrus Park Egypt Lake FIGURE 7 MEDIAN HOUSEHOLD INCOME Source: 2014 American Community Survey DRAFT DECEMBER
18 EXISTING TRANSIT NETWORK The study area is currently served by six local bus routes, one express route, and two flex routes (see Figure 8). Nearly 4,500 daily boardings take place within the study area. Table 1 summarizes the service characteristics, annual ridership and route productivity for the routes in Northwest Hillsborough County. Of the routes in the study area, Route 39 (Busch Boulevard) and Route 34 (Hillsborough Avenue) carry the most riders. Route 7 (West Tampa/Citrus Park) and Route 16 (Waters Avenue) are among the most productive routes in the study area. The Town n Country Flex route underperforms when compared to other flex routes in the County and experienced a decrease in ridership between 2014 and While Route 61LX ranks high among the county s express routes, its annual ridership is low and declining. TABLE 1 EXISTING TRANSIT PERFORMANCE Route 7 - West Tampa/Citrus Park Key Destinations Served Citrus Mark Mall West Tampa Transfer Center Downtown Tampa 16 - Waters Avenue Northwest Transfer Center Yukon Transfer Center 30 - Town 'n Country/ Airport 34 - Hillsborough Avenue 36 - Dale Mabry Hwy./ Himes Avenue Northwest Transfer Center Tampa International Airport Westshore Downtown Tampa Northwest Transfer Center netp@rk Transfer Center Raymond James Stadium West Tampa Transfer Center 39 - Busch Boulevard Northwest Transfer Center Citrus Park Mall Yukon Transfer Center netp@rk Transfer Center Service Hours and Headway Weekdays Saturday Sunday 4:40am - 10:45pm 30-min headway 5:30am - 8:45pm 40-min headways 4:30am - 1:00am 30-min headway 5:00am - 1:00am 30-min headway 5:30am - 10:30pm 30-min headway 4:30am - 12:00am 30-min headway 6:30am - 8:30pm 60-minute headways 5:30am - No Service 7:45pm 40-min headways 6:30am - 1:00am 30-minute headways 6:30am - 10:15pm 30-min headway 6:00am - 9:00pm 60-min headway 7:00am - 10:30pm 30-min headways 6:00am - 10:00pm 60-min headway 7:00am - 8:30pm 60-min headways FY 2014 Annual Ridership FY 2015 % Change Route Productivity, FY 2015 Passengers per Revenue Hour Passengers per Revenue Mile 561, , % , , % , , % , , % , , % , , % Local System Average LX - NW No Service Hillsborough Limited Express 12,860 11, % Citrus Park Northwest Transfer Center Westshore Downtown Tampa 2 SB trips in AM 2 NB trips in PM Express System Average Town n' Country FLEX Northwest Transfer 5:15am - No Service Center 7:00pm 60-min headway 10,082 9, % Northdale FLEX Town n Country Hospital 5:30am - 9:15pm 60-min headway 6:45am - 6:30pm 60-min headway No Service 39,732 43, % FLEX System Average DRAFT DECEMBER 2016


19 Citrus Park Egypt Lake FIGURE 8 EXISTING TRANSIT NETWORK DRAFT DECEMBER
20 PEDESTRIAN AND BICYCLE SAFETY Figure 9 shows bicycle and pedestrian crashes reported in the study area between 2010 and The detailed crash reports were not reviewed as part this study. While the crashes shown may not have all involved transit users, 30 of the reported crashes occurred along transit routes. The majority of crashes along transit routes (21 of 30) occurred at signalized intersections. The remaining nine crashes occurred at unsignalized intersections or mid-block locations. The highest concentration of bicycle and pedestrian crashes occurred on Hillsborough Avenue between Sheldon Road and the Veterans Expressway. 15 DRAFT DECEMBER 2016
 DRAFT DECEMBER")
21 FIGURE 9 BICYCLE AND PEDESTRIAN CRASHES ( ) DRAFT DECEMBER
 data were used to help understand commute trip patterns in the study area.")
22 TRAVEL DEMAND AND MARKET CHARACTERISTICS According to a 2014 HART on-board survey, nearly 70% of transit users in the study area are traveling to or from work or school. The U.S. Census Bureau and Department of Labor s Longitudinal Employer- Household Dynamics (LEHD) data were used to help understand commute trip patterns in the study area. The analysis outputs are provided in Appendix A. An estimated 16% of employed residents who live in the study area also work in the study area (see Figure 10). The remaining 84% of employed residents work outside of the study area. Figure 12 and Figure 13 show the work locations of study area residents and the home locations of study area workers, respectively. FIGURE 10 INFLOW AND OUTFLOW OF EMPLOYEES Source: Census Bureau and Department of Labor s Longitudinal Employer-Household Dynamics, 2014 Based on the LEHD analysis, the top employment destinations for study area residents are: 1 DOWNTOWN TAMPA 2 WESTSHORE 3 TOWN N COUNTRY 4 OLDSMAR 5 PINELLAS COUNTY GATEWAY AREA 6 BRANDON 7 UNIVERSITY AREA According to 2014 American Community Survey data, the vast majority of commute trips for study area residents are single-occupant vehicle trips. Today, fewer than 1% of area residents use transit to get to work (see Figiure 11). 62,946 81,895 16,090 FIGURE 11 COMMUTE PATTERN FOR NORTHWEST RESIDENTS 17 DRAFT DECEMBER 2016


23 FIGURE 12 WORK LOCATIONS OF RESIDENTS IN THE STUDY AREA Source: Census Bureau and Department of Labor s Longitudinal Employer-Household Dynamics, 2014 FIGURE 13 HOME LOCATIONS OF WORKERS IN THE STUDY AREA Source: Census Bureau and Department of Labor s Longitudinal Employer-Household Dynamics, 2014 DRAFT DECEMBER


24 SECTION 3 SERVICE IMPROVEMENT DEVELOPMENT AND EVALUATION Despite the relatively low transit mode-split in the study area, there is still a documented need for transit service. A 2014 HART on-board survey found that 59% of transit riders boarding or alighting in the study area are from zero-car households and 91% are from zero- or one-car households. When asked how else they could make their trip, nearly 25% of respondents said they would not have been able to make the trip without transit. Considering the study area s low-density land use and area residents relatively high median income, this study focuses on improving the existing system to better serve the area residents who rely on transit service to travel in and around the study area. PUBLIC INVOLVEMENT A survey was conducted in October 2016 to get feedback on the potential improvements described later in this section. A summary of the study s public outreach efforts is provided below, along with general information about the survey respondents. Survey feedback on specific improvement proposals is provided later, in the Evaluation of Potential Improvements section. The following outreach methods were used: Conducted outreach at the Northwest Transfer Center, Town n Country Library, and Bravo! Supermarket; Based on survey results, the most common transit trips types are: 1 WORK 2 SHOPPING 3 MEDICAL 4 EDUCATION 5 RECREATION FIGURE 14 PUBLIC INVOLVEMENT - RESPONDENT DEMOGRAPHICS Survey flyers were left at the Town n Country, Jimmy Keel, Austin Davis, and Upper Tampa Bay Libraries; HART staff rode the study area routes and handed out survey flyers to passengers; and A link to the survey was posted on the MPO s website and sent to the study area neighborhood associations and community groups. A total of 88 survey responses were received. Figure 15 illustrates the distribution of survey responses based on the respondent s zip codes. A majority of respondents (58%) are daily transit users and 78% use transit as a primary means to commute. Most survey respondents (61%) use transit because they do not have access to a vehicle. Nearly twothirds of survey respondents live in zero- or one-car households, and the majority of respondents have personal incomes below $25,000 (see Figure 14). A copy of the survey and detailed responses are provided in Appendix B. 19 DRAFT DECEMBER 2016


25 FIGURE 15 PUBLIC INVOLVEMENT - SURVEY RESPONSES BY ZIP CODE DRAFT DECEMBER


 (13) (10) Riverview service (9) Hours and frequency (8) Brandon service (8) Bicycles (6) Downtown, airport and shuttle Operators (5) MetroRapid (5) Valrico service (4) connections (6) An")
 FY 2016-FY2025 The Action Plan, including the new tenth year, focuses on non-peak service enhancements, with some new van-based services and")


26 PLANNED IMPROVEMENTS The FY HART Transit Development Plan (TDP) includes an Action Plan, which is limited to HART s status quo funding, and a Go Hillsborough/ Vision Plan, which outlines improvements that could be made with additional revenue. Both plans include improvements in the study area, but none of these improvements are currently funded. The Action Plan and Vision Plan maps are provided in Appendix C. HART FY2016 FY2025 Trans Deve opmen P an Annua Upda e Sep ember Public Involvement HART engaged in a robust public involvement process for this year s TDP annual update. Although an annual TDP update does not require this level of public outreach, a robust public outreach program was undertaken, in coordination with the ongoing GO Hillsborough public involvement process, to seek input and reaction from the public on the FY 2016 TDP update. GO Hillsborough HART has been an active participant, with Hillsborough County and the cities of Tampa, Temple Terrace and Plant City, in the community-driven development of the GO Hillsborough Community Transportation Plan. The FY 2016 annual update of the HART TDP incorporates the extensive public involvement of GO Hillsborough, which included a first round of 36 meetings held between February and May 2015 and a second round of 56 GO Hillsborough meetings that kicked off in August Some major takeaways from the GO Hillsborough public engagements included: Current transit system is limited, inadequate and underfunded An interest in redesigning transit to include: o True commuter express service and real park and rides o Solution oriented transit not just a bus o New routes in some areas not served or underserved o Improved frequency, evenings and weekend service Participation in ongoing GO Hillsborough meetings A total of 179 TDP comments were logged and categorized as follows: Top categories: Transit center and Route improvements Ferry (54) bus environment Shelters (9) (13) (10) Riverview service (9) Hours and frequency (8) Brandon service (8) Bicycles (6) Downtown, airport and shuttle Operators (5) MetroRapid (5) Valrico service (4) connections (6) An overview of the revised 10-year Status Quo Plan, including the new tenth year follows in the next section. 7. Year-by-Year: Revised Action Plan (Status Quo Funding) FY 2016-FY2025 The Action Plan, including the new tenth year, focuses on non-peak service enhancements, with some new van-based services and pilot programs (first and last mile and HARTPlus Customer Choice in FY 2016). The following year-by-year description of the plan is color-coded by new/expanded service type, with descriptions of the service enhancements, and estimated total annual miles, hours and ridership. Presented ridership numbers are conservative estimates and will be revised with TBEST modeling. Click on each year to open a weblink to a map of each year s service improvements. Note: This requires being connected to the internet. Other categories: Service issues Fares Funding Good service Temple Terrace South County service USF service Lutz service service N. Hillsborough/Pasco Seffner service Westchase service Westshore service service West Tampa service HARTFlex HARTPlus Plant City Pass sales PSTA consolidation Small buses Streetcar Learn more about GO Hillsborough, view the plan, meetings and related documents at: Transit-related comments from the first and second rounds of GO Hillsborough can be found at: LINK: The TDP Open House flier, presentations and TDP comments can be found at: TDP Open Houses and Public Input HART held a series of 11 TDP Open House meetings between July 23, 2015 and September 6, 2015, with a total of 125 attendees. Additionally 12 presentations on the TDP were made to the Hillsborough MPO and its committees, as well as community and business groups. HART got the word out about the TDP Update and opportunity for public involvement through: CEO radio interview and spots on urban radio, WTMP FY enhancements are included in the HART 5-year strategic financial plan: Press release in English and Spanish distributed widely Ads in 3 newspapers (FL Sentinel, La Gaceta, Tampa Tribune) Fliers posted at Transit Centers and on buses Website, social media promotion Meeting dates & locations posted on gohillsborough.org Fliers distributed to community relations contacts, including County and City Offices of Neighborhood Relations Page 2 Page 3 21 DRAFT DECEMBER 2016
27 EVALUATION OF POTENTIAL IMPROVEMENTS IDENTIFICATION OF POTENTIAL IMPROVEMENTS The study team reviewed the proposed plans for the area and met with the MPO and HART to discuss potential improvements that had not been documented previously. Four primary transit improvements were identified in the study area, with the goal of improving service for existing users and providing better regional mobility to Pinellas and Pasco Counties. The identified improvements include increased service on two existing local routes, an extension of one existing express route, and the development of one new local route. The study also explores different alternatives for the Town n County Flex route and ways to incorporate on-demand transit throughout the study area. METHODOLOGY An evaluation was performed for each of the individual improvements to determine its potential ridership and operating and capital costs. Ridership increases for existing routes resulting from frequency or travel time improvements were determined using ridership elasticity factors provided in the Transit Capacity and Quality of Service Manual, Third Edition. 1 Ridership associated with new transit service was analyzed using HART s 2015 validated TBEST model. The TBEST output reports are provided in Appendix D. In general, the cost to construct a concrete landing pad was included at all new stops, as there are very few locations that have an eight-foot sidewalk at the curb. Shelters were assumed to be provided at locations with 20 or more daily boardings. TABLE 2 OPERATING AND CAPITAL COSTS Item Cost Operating Cost per Vehicle Revenue Hour $96.68/revenue hour (Local and Express) Operating Cost per Vehicle Revenue $49.81/revenue hour Hour (Flex) New bus $500,000 New flex route van $100,000 Bus Stop Sign $1,000 Landing Pad $1,000 Shelter $25,000 EVALUATION A summary of each potential service change, including ridership, cost, and public input, is provided in the following pages. A recommendation is provided for each potential service change for incorporation into the next major update of HART s TDP. The operating and capital costs summarized in Table 2 were provided by HART. Costs for additional paratransit service were estimated based on the percentage increase in service area, using ¾-mile buffers around existing and new transit routes. The costs associated with new and leased park-n-rides were taken from the 2012 FDOT State Park-and-Ride Guide. 2 The assumed cost for constructing a new park-n-ride was $9,000 per space for a surface lot. The assumed cost to lease a spot from an existing parking lot was $12 per space per year. 1 Paul Ryus et al., Transit Capacity and Quality of Service Manual, Third Edition,Transportation Reasearch Board s Transit Cooperative Highway Research Prgroam, Frederick R. Harris, Inc., State Park-and-Ride Guide, Florida Department of Transportation, June DRAFT DECEMBER

28 ROUTE 34 (HILLSBOROUGH AVENUE) Description Route 34 currently runs along Hillsborough Avenue and connects the Northwest Transfer Center and the Transfer Center (see Figure 16). Route 34 has the second highest annual ridership of all routes in the study area and is the most productive route in terms of passengers per revenue mile. The HART TDP previously identified Route 34 for expanded service. The existing route operates at 30-minute headways Monday-Saturday and at 60-minute headways on Sunday. The potential improvement for Route 34 includes doubling the route s frequency (i.e., weekday service every 15 minutes along Hillsborough Avenue east of Sheldon Road) and providing an extension to Oldsmar. On the western end of the route, trips would alternate between serving the Northwest Transfer Center and Oldsmar, with each terminus receiving service every 30 minutes. The extension to Oldsmar would provide an opportunity for HART to connect to PSTA s Route 67, as well as providing service to an area where a number of local residents are employed. Stops were assumed to be provided at 1,700-foot intervals along the extension, the approximate spacing of public access points along this portion of Hillsborough Avenue. It was assumed that the existing PSTA route to the Northwest Transfer Center would terminate in Oldsmar in the future. FIGURE 16 ROUTE 34 (HILLSBOROUGH AVENUE) POTENTIAL IMPROVEMENT SURVEY QUOTES This change would make this route a bit confusing This would make my commute to work so much easier! Would love this service! Can go to Oldsmar Flea Market especially! 23 DRAFT DECEMBER 2016


29 Performance Measures The effects of doubling the frequency on the existing route were evaluated, in addition to doubling the frequency in combination with an extension to Oldsmar. The results of the analysis are summarized in Table 3. Doubling the frequency on Route 34, with or without the Oldsmar extension, would require five additional buses. The extension to Oldsmar would require 36 new bus stops, eight of which would have shelters, and assumes the use of nine existing PSTA bus stops along the route. Operating costs for the Oldsmar extension include the cost associated with approximately eight square miles of new paratransit service. In terms of ridership increase, the two improvement options perform very similarly. Doubling the frequency on the existing route is expected to yield slightly higher ridership, compared to doubling frequency in combination with an extension to Oldsmar. TABLE 3 ROUTE 34 (HILLSBOROUGH AVENUE) PERFORMANCE MEASURES Existing Conditions (2016) Double Frequency Double Frequency + Oldsmar Extension Annual Miles 376, , ,686 Annual Revenue Hours 30,452 60,904 60,904 Capital Cost -- $2,500,000 $2,756,000 Annual Operating Cost - Fixed Route $2,944,099 $5,888,199 $5,888,199 Annual Operating Cost - Additional Paratransit $183,810 Daily Ridership (Weekday / Saturday / Sunday) 2,750 / 1,844 / 877 4,375 / 2,637 / 1,254 4,240 / 2,903 / 1,381 Annual Ridership 848,129 1,325,609 1,312,178 Annual Fare Revenue $882,054 $1,378,633 $1,364,666 Operating Cost per Passenger $3.47 $4.44 $4.63 Passengers per Revenue Hour Passengers per Revenue Mile Public Input The survey respondents favored the extension to Oldsmar, with more than 50% saying they would start using the route or use it more often, compared to 40% for the frequency increase alone (see Figure 17). Some respondents expressed concern that alternating trips between Oldsmar and the Northwest Transfer Center would make the route difficult to understand. FIGURE 17 ROUTE 34 (HILLSBOROUGH AVENUE) - PUBLIC INPUT 3% 1% 27% 30% 43% 23% 53% 20% Recommendation: Oldsmar Extension The extension to Oldsmar provides enhanced regional mobility for HART customers and Pinellas County residents. While increasing the frequency on the existing route may provide slightly higher ridership, it is not enough to outweigh the additional service coverage the extension to Oldsmar would provide. HART could implement the Oldsmar extension as an alternatng route or a separate route. ROUTE 16 (WATERS AVENUE) DRAFT DECEMBER

30 Description Route 16 runs along Waters Avenue and connects the Northwest Transfer Center and the Yukon Transfer Center (see Figure 18). Route 16 is the most productive route in the study area per revenue mile. The HART TDP previously identified Route 16 for expanded service. The existing route operates at 40-minute headways Monday-Saturday and does not run on Sunday. This study looks at increasing the frequency on Route 16 to 30-minute, 20-minute, and 15-minute service. FIGURE 18 ROUTE 16 (WATERS AVENUE) POTENTIAL IMPROVEMENT SURVEY QUOTES Great can not wait Waits would be shorter while waiting in hot sun DRAFT DECEMBER 2016

31 Performance Measures The results of the Route 16 analysis are summarized in Table 4. Increasing the frequency to 30 minutes results in an increase in overall route productivity per revenue hour. If service frequency is increased to 20 or 15 minutes, productivity declines. Increasing the frequency to 30, 20, or 15 minutes would require an additional one, three, or four buses, respectively. TABLE 4 ROUTE 16 (WATERS AVENUE) PERFORMANCE MEASURES 40-min Headway (Existing ) 30-min Headway 20-min Headway 15-min Headway Annual Miles 101, , , ,401 Annual Revenue Hours 9,834 13,659 22,765 27,318 Capital Cost -- $500,000 $1,500,000 $2,000,000 Annual Operating Cost $950,751 $1,320,552 $2,200,920 $2,641,104 Daily Ridership (Weekday / 888 / 439 1,270 / 628 1,613 / 797 1,818 / 899 Saturday) Annual Ridership 249, , , ,205 Annual Fare Revenue $259,239 $370,851 $470,880 $530,613 Operating Cost per Passenger $3.81 $3.70 $4.86 $5.18 Passengers per Revenue Hour Passengers per Revenue Mile Public Input As part of the survey, participants were asked their opinion on an increase in frequency to 30 or 15 minutes. The study team was looking for a potential tipping point when riders would start using the route more often. In general, the public had a favorable opinion of increasing the service frequency, but there was very little difference in opinion between the 30- and 15-minute headways (see Figure 19). FIGURE 19 1% ROUTE 16 (WATERS AVENUE) - PUBLIC INPUT 1% 33% 41% 31% 42% 25% 26% Recommendation: 30-minute Headways An increase in frequency to 30 minutes is expected to be more productive than the existing route and has the lowest upfront capital cost of any of the improvement options. Increasing the frequency any further would decrease the route s efficiency, and there is not a strong public desire to do so. The 30-minute headway provides better transfer opportunities for passengers, as it matches the headway of most of HART s other routes. A 30-minute headway also makes it easier for passengers to remember the schedule, as the bus arrives at the same times each hour. DRAFT DECEMBER

32 ROUTE 61LX Description Route 61LX is the only express route in the study area. It currently connects Citrus Park, the Northwest Transfer Center, Westshore and Downtown Tampa. There are two southbound routes during the morning peak period and two northbound routes in the afternoon peak period. The route primarily runs on the Veterans Expressway and Interstate 275. During the morning peak period, the route begins at the Carollwood Baptist Church and then deviates onto Sheldon Road to serve the Northwest Transfer Center. In the afternoon, the route remains on the Veterans Expressway to serve the Carrollwood Baptist Church, before continuing on to the Northwest Transfer Center. At present, about 20 passengers make the round trip each day. By 2018, additional express toll lanes will be open on the Veterans Expressway. The price on the new lanes will increase with congestion so that the express lanes can operate at 45 mph or better. The Florida Turnpike Enterprise will allow buses to use the new express lanes for free. Access points to the exclusive lanes will be south of Van Dyke Road and south of Gunn Highway. The proposed service change takes advantage of the new express lanes and removes the deviation on Sheldon Road. Passengers traveling between Carrollwood and Downtown Tampa can expect a 10-minute travel savings in the morning and a 4-minute travel savings in the afternoon with this service change. The potential service change, shown in Figure 20, consolidates two existing park-n-rides, Carrollwood Baptist Church and Citrus Park, into one park-nride at the Veterans Expressway and Gunn Highway interchange. This new park-n-ride would also serve Route 39. In order to maximize travel time savings, the new park-n-ride would be constructed in one of the interchange quadrants. Alternately, HART could look for an existing parking lot to lease. Lastly, the potential service change includes an extension to Pasco County to meet PCPT Route 54 on SR 54. HART may be able to lease parking spaces from two existing shopping centers at SR 54, or could construct a new park-n-ride near the interchange. The Gunn Highway park-n-ride and the extension to Pasco County are consistent with TBARTA s recent recommendation for Phase 1 of the Westshore to Crystal River/Inverness Transit Study. 27 FIGURE 20 ROUTE 61LX POTENTIAL IMPROVEMENT SURVEY QUOTES I have friends who live in Pasco County whom I rarely get to see. This would be a nice change I am less likely to use the service if the Carrollwood Baptist Church Park n Ride is no longer on the route. DRAFT DECEMBER 2016

33 Performance Measures The results of the Route 61LX analysis are summarized in Table 5. The potential service change is expected to increase ridership by approximately 20%. The increased travel speed associated with the change makes the route more productive per revenue mile, but the route would be less productive per revenue hour due to the overall increase in route length and travel time to and from Pasco County. The service change would not require any additional buses. The capital costs associated with this improvement consist of constructing a new 50-space park-n-ride lot at Gunn Highway. A lease agreement is assumed for parking in Pasco County. TABLE 5 ROUTE 61LX PERFORMANCE MEASURES Existing (2016) Proposed Annual Miles 23,023 24,389 Annual Revenue Hours 945 1,223 Capital Cost -- $495,800 Annual Operating Cost $91,317 $118,224 Daily Ridership (Weekday) Annual Ridership 9,614 11,666 Annual Fare Revenue $9,999 $12,133 Operating Cost per $9.50 $10.13 Passenger Passengers per Revenue Hour Passengers per Revenue Mile Public Input Overall, the survey respondents had a favorable view of potential improvement on Route 61LX (see Figure 21); however, there is concern among existing riders who currently board at one of the three park-n-ride locations. They may no longer be able to use the route if the detour along Sheldon Road is removed. FIGURE 21 ROUTE 61LX - PUBLIC INPUT 7% 3% 34% 29% 27% Recommendation: Incremental Improvement The existing route is one of the least productive on HART s system. While the proposed improvement offers some benefit, it may not be enough to justify the capital cost of constructing a new park-n-ride. In conjunction with the opening of the new express lanes on the Veterans Expressway, HART may want to first consider removing the detour on Sheldon Road and using one of the existing park-n-ride lots at Citrus Park or the Carrollwood Baptist Church as a starting point for the route. If the travel time savings produce an increase in ridership, HART could then consider expanding the route to Pasco County and constructing a new park-n-ride lot closer to the Expressway. DRAFT DECEMBER

34 NEW ROUTE ON EHRLICH ROAD/BEARSS AVENUE Description Another potential improvement is a new east-west route on Ehrlich Road and Bearss Avenue. This route would connect Citrus Park and the University of South Florida. This improvement would extend HART s service area to the north, as no east-west service is currently provided on Ehrlich Road/Bearss Avenue. The western terminus would be the Citrus Park Mall and the eastern terminus would be the University Area Transit Center (see Figure 22). Service would be provided seven days a week, with 30-minute headways on weekdays and 60-minute headways on weekends. The assumed service hours are 5:00 AM to 8:00 PM, or 15 hours per day. Stops were assumed to be provided at 1,000-foot intervals, the approximate spacing of public access points along Ehrlich Road and Bearss Avenue. FIGURE 22 POTENTIAL NEW ROUTE ON EHRLICH ROAD/BEARSS AVENUE 29 DRAFT DECEMBER 2016

35 Performance Measures The results of the Ehrlich Road/Bearss Avenue route analysis are summarized in Table 6. The new route would require four buses and 98 new bus stops, 11 of which would have shelters. These figures assume the use of 28 existing HART bus stops along the route, particularly on the eastern end of the route. Operating costs include the cost associated with approximately nine square miles of new paratransit service area. TABLE 6 EHRLICH/BEARSS ROUTE PERFORMANCE MEASURES Annual Miles 200,880 Annual Revenue Hours 18,600 Capital Cost $2,449,000 Annual Operating Cost - Fixed Route $1,798,248 Annual Operating Cost - Additional $199,540 Paratransit Daily Ridership (Weekday / Saturday / 1040 / 660 / 326 Sunday) Annual Ridership 318,383 Annual Fare Revenue $331,119 Operating Cost per Passenger $6.27 Passengers per Revenue Hour Passengers per Revenue Mile 1.58 Public Input Overall, the survey respondents supported the addition of the new route, with nearly 20% saying they would use the route every day and an additional 40% saying they would use the route at least once a week (see Figure 23). FIGURE 23 NEW EHRLICH/BEARSS ROUTE - PUBLIC INPUT 12% 20% 25% 6% 37% Recommendation: Incorporate in the TDP This route would enhance east-west travel in the study area, and it is expected to perform at about 70% of the local system average. The route should be considered for incorporation into the upcoming major update to the TDP. DRAFT DECEMBER

36 TOWN N COUNTRY FLEX ROUTE Description The Town n Country Flex Route is a circular route that currently runs in the clockwise direction only (see Figure 24). Walk-up service is available at any of the designated HART bus stops along the route. Pick-ups and drop offs can be reserved at any location within the Flex zone. Reservations can be made from 2 hours to 3 days in advance of a trip. The current flex route is only convenient for passengers in one direction of their trip. For example, passengers traveling one stop would need to ride the remainder of the one-hour route on their return trip. The route underperforms in comparison to other flex routes in the County and its ridership is decreasing. This study considered adding a counterclockwise loop and evaluated the feasibility of serving the existing travel demand with on-demand transit service. FIGURE 24 TOWN N COUNTRY FLEX ROUTE 31 DRAFT DECEMBER 2016
37 Performance Measures The results of the analysis are summarized in Table 7. Adding a counterclockwise loop to the existing flex service is expected to almost double the ridership. Nevertheless, the cost per passenger to operate the flex route would be over $17. The capital costs associated with this improvement include one new van and 15 new stops. TABLE 7 ROUTE 61LX PERFORMANCE MEASURES Existing (2016) Proposed Annual Miles 42,168 84,336 Annual Revenue Hours 3,514 7,028 Capital Cost -- $130,000 Annual Operating Cost $175,032 $350,065 Daily Ridership (Weekday / Saturday) Annual Ridership 10,291 19,905 Annual Fare Revenue $5,248 $10,152 Operating Cost per $17.01 $17.59 Passenger Passengers per Revenue Hour Passengers per Revenue Mile An Alternative - On-Demand Transit Service HART currently operates a taxi-voucher program as a supplement to its paratransit service. For each voucher, HART pays $16 and the customer pays $4 for door-to-door service. Serving the existing flex route demand with a similar taxi voucher would be more efficient for HART than operating the existing flex route, which currently costs HART $17 per customer. HART could likely provide door-to-door trips within the flex route service area with a lower cost voucher than they provide their paratransit customers. Additionally, HART is beginning a first-mile/last-mile pilot program, HyperLINK. Customers who are traveling to or from a bus stop can receive up to a three-mile ride. The customer pays $3 and HART pays $4. If HART combined these services, they could serve the current flex route demand for $41,000 - $164,665 annually, depending on the number of passengers who would qualify for the lower cost HyperLINK trip and assuming use of the higher cost ($16) taxi voucher. Recommendation: On-Demand Transit HART should consider replacing the Town n Country flex route with on-demand transit service. Ondemand service would provide the existing customers the same, or better, level of service with a lower annual cost to HART. HART could reassign the current van to improve service on another flex route, or could start a new flex route in another part of the County. DRAFT DECEMBER
38 PARATRANSIT SERVICE In accordance with the Americans with Disabilities Act of 1990, HART operates the HARTPlus paratransit service for people with physical, cognitive, emotional, visual or other disabilities that prevent them from using HART fixed route bus system. HARTPlus is a door-to-door shared-ride van service offered within ¾-mile of a local fixed route. Figure 25 shows the existing paratransit service area within and around the study area. The Route 34 extension and proposed new route on Ehrlich Road/Bearss Avenue would trigger the need for additional paratransit service in these new service areas. Figure 25 shows the areas not currently in the paratransit transit service area that would need to be added if these service changes are implemented. The operating costs associated with the new paratransit service area were included as part of the performance measures for the Route 34 and Ehrlich Road/Bearrss Avenue service changes, summarized in Table 3 and Table 6, respectively. Paratransit service is not required along flex routes or express routes; therefore, the proposed service changes to Route 61LX and the Town n Country Flex Route would not affect paratransit service. Similarly, the service change proposed for Route 16 does not affect the route alignment and would not affect the associated paratransit service area. 33 DRAFT DECEMBER 2016
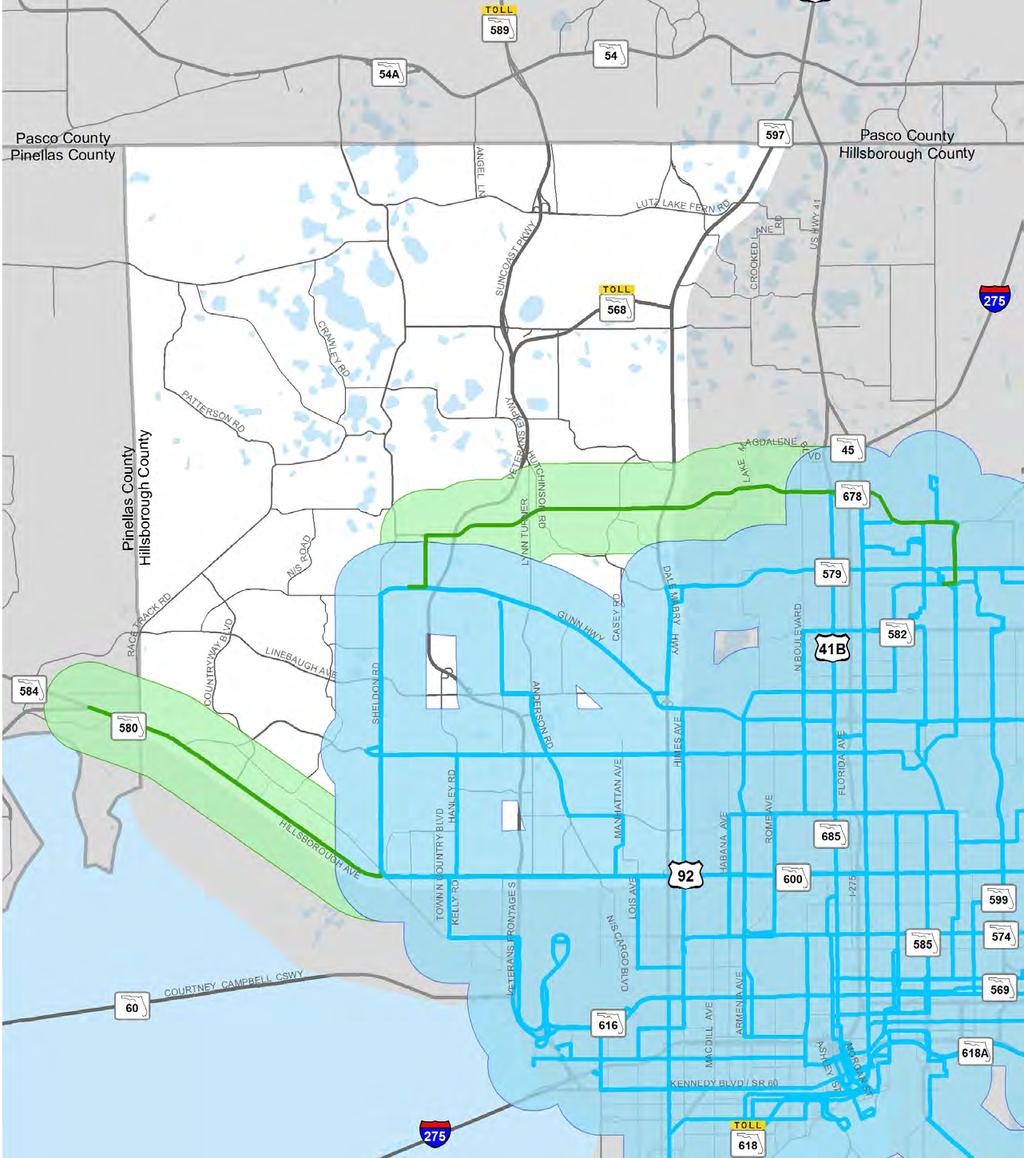

39 FIGURE 25 PARATRANSIT SERVICE AREA DRAFT DECEMBER
40 OPPORTUNITIES FOR ON-DEMAND TRANSIT The identified improvements are focused on areas with the highest population densities and the most transit-supportive land uses. The areas of Westchase, Keystone, and Cheval do not currently exhibit land use characteristics conducive to fixed-route transit. In the future, Westchase may become a more mixeduse community with higher land use densities, but until that time, HART may consider using on-demand transit service to serve these areas. This service could include expansion of HART s taxi voucher program or first-mile/last-mile program. HART has seen tremendous success with its taxi voucher program as a way to replace costly paratransit trips. The firstmile/last-mile program is still in its infancy, but it is expected to provide better connectivity for HART customers to and from their final destinations. When asked about the expansion of the first-mile/ last-mile pilot program, approximately 60% of survey respondents said they would use the service at least once a week (see Figure 26). FIGURE 26 FIRST-MILE/LAST-MILE EXPANSION - PUBLIC INPUT Dallas Area Rapid Transit Go Pass To improve the way transit users get to and from bus stops, Dallas Area Rapid Transit (DART) added a feature to its GoPass app that allows users to purchase a bus pass and request a ride from Uber, Lyft, or Zipcar in the same app. Previously, users would need to purchase a bus pass in the GoPass app and then open the rideshare app to request a car. DART s partnership with Uber, LYFT, and Zipcar does not provide any new services to transit users it simply streamlines an existing process. No money is exchanged between DART and any of the rideshare services, and there are no formal agreements. If a user requests a ride through the GoPass app, they are taken directly to the rideshare services website or app where the transaction takes place. The only written agreement is between DART and Zipcar for Zipcar s use of DART parking spaces. DART does not cover any of the cost for the rideshare service. In this case, the program, launched in March 2015, does not require any additional funding aside from app development. Other public agencies, including the City Altamonte in Central Florida, have chosen to subsidize the cost of rideshare service to and from a transit stop. 16% 6% 17% 33% 28% As public policy works to keep up with innovations in transit service, funding and reporting remain ongoing challenges for on-demand transit service. HART is not able to report trips from its taxi voucher or first-mile/last-mile program to the National Transit Database. HART will need to continue to find flexibility in existing funding sources to provide these mobility options to customers. The following summarizes other on-demand transit service being used in other parts of the country that could be considered in the Northwest study area. Agency contact information is provided in Appendix E. HART could explore options to streamline transit/ rideshare connections for customers who live more than three-miles from a transit stop and do not qualify for the first-mile/last-mile program. Depending on availability of funding, HART could consider offsetting some of the cost of the rideshare trip. Kansas City Regional Transit RideKC Kansas City recently launched a one-year pilot program, RideKC. Kansas City partnered with Bridj, a rideshare service, and Ford, which provided a fleet of 10 vans for the program. Through the Bridj smartphone app, users can request a ride from a 14-passenger Ford van. Users are then given a customized pick-up location. Bridj is constantly optimizing pick-up and drop-off locations and routes based on demand. Typical wait time for a van is 5-10 minutes and each ride is $1.50. This was the first time Bridj partnered with a public agency. The program was initiated to increase access to jobs and spur economic development in the area. The goal of the program is to give people using transit more mobility options and give residents better access to job opportunities. HART could consider an on-demand vanpool service to serve residents in more remote areas of the County. 35 DRAFT DECEMBER 2016
41 IMPROVEMENT PHASING AND PRIORITIZATION This report identified improvements that can be implemented in the near-term and improvements that could be implemented in later years of the TDP. HART s maintenance facility is currently at capacity, which prevents HART from adding additional buses to its fleet at this time. There is an ongoing study to identify a new maintenance facility, but any nearterm improvement must make use of HART s existing vehicle fleet, either by not requiring additional vehicles, or by reducing service elsewhere in the county and reallocating the vehicle(s) to serve the northwest county. The following improvements do not require additional vehicles and could be implemented in the near-term: ROUTE 61LX The potential realignment of Route 61LX makes use of the existing buses serving the route. HART should consider realigning the route, off of Sheldon Road, in conjunction with the opening of the new express lanes on the Veteran s Expressway. TOWN N COUNTRY FLEX ROUTE If HART decides to replace the Town n Country Flex Route with on-demand transit, this would not require any additional HART vehicles. The following improvements require additional buses and should be added to HART s Action Plan as part of the next major update to the TDP: 1. Route 34 increased frequency and expansion to Oldsmar 2. Route 16 increased frequency 3. New route on Erhlich Road/Bearss Avenue POTENTIAL FUNDING SOURCES Potential funding for the expanded service may be obtained from the traditional funding sources that currently finance HART services including capital and operating costs. Capital cost for fixed assets (e.g., buses, station infrastructure, and ancillary facilities such as maintenance facilities) generally comes from different sources than funds applied to operations and maintenance of the service. The specific funding mechanism generally differs even if both the capital and operating costs comes from the same general category (e.g., federal funds). Funding for transit is derived from two general categories: public sector and private sector. Public sector funding is derived from public tax dollars allocated through federal, state, and local funding mechanisms. PUBLIC SECTOR FUNDING FEDERAL TRANSIT ADMINISTRATION Funds for urban mass transit are available from the Federal Transit Administration (FTA) to qualified transit authorities pursuant to procedures set forth in the Moving Ahead for Progress in the 21st Century Act (MAP-21). The process of obtaining federal capital assistance is initiated by a recipient designated by state and local officials, and by publicly owned operators of mass transportation services such as HART. Generally, the designated recipient for a service area prepares and submits a regional program of projects to the FTA for approval. Additionally, the recipient is required to file an application with the FTA regional office to be eligible for any FTA program grant. Federal grants can generally reimburse up to 80 percent of the cost of capital programs and a portion of operating expenses to improve or continue mass transportation service. Federal, state, and local resources provide funding to the HART system. Federal and most of the state programs are not for specific bus transit corridors or routes unless specifically stated. DRAFT DECEMBER
42 Urbanized Area Formula Program: Section Urbanized Area Formula Grants, Section Apportionment of Appropriations for Formula Grants Urbanized Area Formula Program provides the largest source of federal transit funding. Formula funds are appropriated based on population, transit service provided, and the number of low-income individuals and may be used for capital projects, planning, job access and reverse commute projects and operating costs. The Job Access and Reverse Commute (JARC) program was incorporated into Section 5307 which provides transit service to lowincome individuals to access jobs. Funds may be used for operating expenses for urban areas with a population fewer than 200,000 and areas with a population over 200,000 if they operate no more than 100 buses in during peak periods. Section 5339 Bus and Bus Facilities Formula Grant Bus and Bus Facilities Formula Grants may be used for capital projects to purchase buses and related equipment and to construct bus facilities. Section 5310 Formula Grants for the Enhanced Mobility of Seniors and Individuals with Disabilities Grants under Section 5310 may be used to plan, design, and carry out public transportation projects to meet the needs of seniors and individuals with disabilities when public transportation is insufficient, unavailable, exceeds the requirements of the Americans with Disabilities Act of 1990, or provides alternative transportation to assist seniors and individuals with disabilities. STATE PROGRAMS Available sources from the State of Florida, as identified in the Florida Statutes and/or Florida Department of Transportation Procedures are listed below: Park and Ride Lot Program As part of the commuter assistance program to encourage transit and carpools, the Park and Ride Lot Program provides funding to purchase or lease land to construct park and ride lots based on FDOT criteria. Public Transit Block Grant Program Established by the Florida Legislature, the Public Transit Block Grant Program provides funds for eligible transit capital and operating costs, consistent with local government comprehensive plans. Funds are awarded to public transit providers eligible to receive funding from the Federal Transit Administration s Sections 5307 and 5311 and to Community Transportation Coordinators. Public Transit Service Development Program The Public Transit Service Development Program, also enacted by the Florida Legislature, provides initial funding for special projects that incorporate new or innovative techniques to improve or expand public transit services. Projects may include new technologies, routes, services, or the purchase of special transportation services. Transit Corridor Program The Transit Corridor Program provides discretionary funds based on need to support new services within specific corridors that will reduce or alleviate congestion or other mobility issues. These funds may be used for transit capital or operating expenses identified in a Transit Development Plan, Congestion Management System Plan, or other formal study undertaken by a public agency. Additional state resources may be available to local governments and transit agencies to provide for the local share of project costs. 37 DRAFT DECEMBER 2016
43 LOCAL RESOURCES Local jurisdictions have enacted taxes or earmarked existing taxes specifically for transit operations. Portions or motor vehicle registration fees, portions of local sales tax, and documents taxes for registration of public documents (e.g., deeds and mortgages, licenses, etc.) can be applied to public transit service. Several counties around Florida, including Hillsborough County in 2010 and in 2016, have considered a sales tax surcharge for application to transit service. Some jurisdictions make use of road and bridge tolls, and potentially managed lane tolls, to support public transportation. While these tolls are generally implemented to cover the cost of constructing, operating, and maintaining the roads and bridges, some cities dedicate as much as 60 percent of the toll revenues to transit operations. Promoting transit reduces congestion levels on the roads making such facilities more attractive and avoiding the cost of expanding such facilities when that is even possible. Increasingly, the public sector is looking at the potential for managed lane tolls to support transit operations. PRIVATE FUNDING SOURCES In addition to the traditional funding sources, funds from one or more private sources may be used for capital costs and for operations. These are specific to the private funding provider. UNIVERSITY PROGRAMS Many institutes of higher learning have found it advantageous to support a public transit agency by applying student activity fees and other charges to students and then offering unlimited, free use of the transit service. In this way, the educational institution can give mobility to students who may not have access to automobiles and yet avoid the staffing, infrastructure, liability, and specialized knowledge needed to run a transit operation. Service can be scalable, allowing the institution to purchase only as much service as is needed while capitalizing on the economies of scale of the existing transit provider. HART sponsors the U-PASS Program with the University of South Florida (USF). With valid USF ID cards, USF students can ride all HART services for free and USF faculty and staff can ride for twentyfive cents. Students pay for this service through an activity fee and HART invoices USF each month based on the number of passengers. PUBLIC PRIVATE PARTNERSHIPS A Public-Private Partnerships (PPPs) is a contractual agreement between a public agency and a private entity as a way to accelerate delivery of transportation projects. The private partner may contribute to the design, construction, financing, and operations and maintenance of project or any combination thereof. PPPs are usually reserved for large infrastructure projects. Central to the success of PPPs is a revenue stream that can repay any initial cost incurred by the private entity. Transit has traditionally found this arrangement challenging as the revenue source, fares, is typically insufficient to provide the necessary revenue. Toll roads built under a PPP arrangement use the tolls as repayment. In some cases, the public sector may simply pay an annual availability pay in lieu of tolls, in effect paying the tolls on behalf of the users. CORPORATE TRANSIT PROGRAM HART offers the Corporate Transit Program to encourage the use of public transportation. This program provides nontaxable fare subsidies up to $240 per employee per month toward the cost of public transportation. Federal law entitles all US employees to this tax-deductible business expense. DRAFT DECEMBER
44 SECTION 4 TRAIL AND TRANSIT CONNECTIVITY METHODOLOGY FOR LINKING GREENWAYS AND TRAILS The National Center for Transit Research (NCTR) prepared the Methodology for Linking Greenways and Trails with Public Transportation in Florida 3 for the Florida Department of Transportation (FDOT). The methodology was created to enhance access and connectivity between public transit service and trails in an effort to improve community livability. The methodology defined three types of transit/trail connections. 1 SCENARIO TRAIL AND TRANSIT ROUTE INTERSECT AND CONNECT 2 SCENARIO TRAIL AND TRANSIT ROUTE INTERSECT BUT DO NOT CONNECT NCTR chose northwest Hillsborough County as a case study for the methodology. In the report, they summarized three transit/trail connections within the study area one for each scenario. As part of this study, the methodology was applied to the remaining transit/trail connections in the study area. Figure 27 provides the locations of the existing and proposed trails as well as the location of existing transit routes. As shown in the map, there are eight existing transit/trail connections and two proposed connections with the study area. The following recommendations apply to all transit/ trail connections: Including trail access points on HART route maps; Add trail access points to automatic stop announcements; Improve transit information on Hillsborough County trails map, including: -- Defining the bus icon in the legend, -- Identifying transit access points with route numbers, and -- Adding transit information on the back of the map; Adding street signs to identify trail to motorists; and Providing wayfinding signage between the bus stop and trail access. 3 SCENARIO TRAIL AND TRANSIT ROUTE ARE CLOSELY ALIGNED BUT DO NOT INTERSECT ka 1 3 Sara Hendricks and Martin Catala, Methodology for Linking Greenways and Trails with Public Transportation in Florida, National Center for Transit Research, February DRAFT DECEMBER 2016


45 FIGURE 27 TRAIL/TRANSIT CONNECTIONS DRAFT DECEMBER

46 SCENARIO 1 ROUTE 39/UPPER TAMPA BAY TRAIL AT SHELDON ROAD The Upper Tampa Bay Trail connects to Route 39 with an at-grade, signalized crossing at Sheldon Road (see Figure 28). There is a bus stop located approximately 500 feet north of the trail. Trail users can directly access the bus stop via the sidewalk or paved shoulder. Transit riders traveling north may be tempted to travel upstream in the northbound lanes to access the trail south of the stop. HART may want to consider the following: Relocate the northbound bus stop closer to the trail; or Provide a prerecorded announcement that trail users should alight at the bus stop south of the trail. FIGURE 28 ROUTE 39/UPPER TAMPA BAY TRAIL AT SHELDON ROAD 41 DRAFT DECEMBER 2016

47 SCENARIO 1 ROUTE 34/TOWN N COUNTRY GREENWAY AT SHELDON ROAD The Town n Country Greenway connects to Route 34 with an at-grade, signalized crossing at Sheldon Road (see Figure 29). The nearest bus stop is located approximately 300 feet north of trail. Trail users can directly access the bus stop via sidewalk or paved shoulder. Transit riders traveling north may be tempted to travel upstream in the northbound lanes to access the trail south of the stop. HART may want to consider the following: Consolidate upstream and downstream stops at the trail crossing; Relocate the northbound bus stop closer to the trail; or Provide a prerecorded announcement that trail users should alight at the bus stop south of the trail. FIGURE 29 ROUTE 34/TOWN N COUNTRY GREENWAY AT SHELDON ROAD DRAFT DECEMBER

48 SCENARIO 1 ROUTE 30/ TOWN N COUNTRY GREENWAY AT HANLEY ROAD The Town n Country Greenway connects to Route 30 with an at-grade, signalized crossing at Hanley Road (see Figure 30). There is a bus stop located approximately 500 feet north of the trail, at the signalized intersection of Hanley Road and Woodbridge Road. There are sidewalks on both sides of Hanley Road that allow a pedestrian connection between the trail and transit stop. There are sharrows on Hanley Road between the trail crossing and bus stop and signs prompting drivers to share the road with cyclists. Users who are boarding or alighting on the opposite side of the roadway from where they access the trail have two signalized crossing opportunities: at the signalized trail crossing and near the transit stop at the Woodbridge Road intersection. No specific recommendations were identified for this connection. FIGURE 30 ROUTE 30/ TOWN N COUNTRY GREENWAY AT HANLEY ROAD 43 DRAFT DECEMBER 2016
. There are bus stops serving eastbound and westbound Route 34 within 150 feet of the signalized intersection.")
49 SCENARIO 1 ROUTE 34/AIR CARGO ROAD MULTI-USE PATH AT HILLSBOROUGH AVENUE A multiuse path along Air Cargo Road connects several industrial parcels near the airport to Route 34 with a signalized intersection at Hillsborough Avenue and Air Cargo Road (see Figure 31). There are bus stops serving eastbound and westbound Route 34 within 150 feet of the signalized intersection. Pedestrian trail users can directly access the bus stop via a sidewalk connection from the multi-use path. Cyclists can access the bus stops via the paved shoulder or by walking their bicycles on the sidewalk. No specific recommendations were identified for this connection. FIGURE 31 ROUTE 34/AIR CARGO ROAD MULTI-USE PATH AT HILLSBOROUGH AVENUE DRAFT DECEMBER

50 SCENARIO 1 ROUTE 39/UPPER TAMPA BAY TRAIL AT CITRUS PARK DRIVE The Upper Tampa Bay Trail connects to Route 39 at the signalized intersection of Citrus Park Drive and Citrus Park Lane (see Figure 32). The trail runs north-south, parallel to Citrus Park Lane, with a pedestrian bridge for trail users wishing to cross Citrus Park Drive. There are bus stops serving eastbound and westbound Route 39 within 200 feet of the signalized intersection. For trail users wishing to access these stops, there is an at-grade multi-use path that pedestrians and cyclists can use to get from the trail to the intersection. No specific recommendations were identified for this connection. FIGURE 32 ROUTE 39/UPPER TAMPA BAY TRAIL AT CITRUS PARK DRIVE 45 DRAFT DECEMBER 2016

51 SCENARIO 2 TOWN N COUNTRY FLEX ROUTE/ UPPER TAMPA BAY TRAIL AT LINEBAUGH AVENUE The Upper Tampa Bay Trail intersects the Town n Country Flex route with a below-grade crossing approximately 3,000 feet east of Sheldon Road. There is sidewalk connection from the trail to an atgrade intersection of Linebaugh Avenue. The at-grade crossing locations is not currently marked or signalized. The nearest bus stop is located 1/3 mile west of the trail crossing, about midway between the trail crossing and Sheldon Road (see Figure 33). HART may consider relocating the existing bus stop closer to the trail or adding a bus stop at the trail crossing. The County may want to consider replacing signage at the trail. The signage should include information about bus route connections on Linebaugh Avenue. FIGURE 33 TOWN N COUNTRY FLEX ROUTE/ UPPER TAMPA BAY TRAIL AT LINEBAUGH AVENUE DRAFT DECEMBER

52 SCENARIO 3 NORTHWEST TRANSFER CENTER/UPPER TAMPA BAY TRAIL AT WATERS AVENUE The Upper Tampa Bay Trail is adjacent to, but separated from, Waters Avenue, near the Northwest Transfer Center. The trail is physically separated from the Transfer Center and Waters Avenue by a flood channel. It would be costly to construct a trail connection over the flood channel. Bike lanes and sidewalks exist over the Waters Avenue bridge, and there is a signalized crossing opportunity at Waters Avenue and the Transfer Center entrance. Pedestrians can access the Transfer Station using the existing sidewalk on Waters Avenue. Cyclists can access the Transfer Center using the bike lane provided on Waters Avenue, but would need to ride in mixed traffic in order to turn left into the Transfer Center. Alternatively, cyclists can walk their bicycles along the sidewalk and cross at the signalized intersection with pedestrians. The existing sidewalk and bike lane infrastructure provide an effective connection between the trail and the Transfer Center (see Figure 34), but the connection is not obvious. In addition to improved wayfinding signage, HART could provide information about the trail access to the kiosk at the Transfer Center. FIGURE 34 NORTHWEST TRANSFER CENTER/ UPPER TAMPA BAY TRAIL AT WATERS AVENUE 47 DRAFT DECEMBER 2016

53 SCENARIO 3 ROUTE 61 LX/ UPPER TAMPA BAY TRAIL AT GUNN HIGHWAY The Upper Tampa Bay Trail is adjacent to, but separated from, Gunn Highway, near the Citrus Park park-n-ride, which currently serves Route 61LX. The trail is physically separated from the park-n-ride and Gunn Highway by a heavily vegetated buffer. Creating a connection through the landscaping may be costly and would likely require an easement. Today, trail users wishing to access to the park-n-ride can do so via Ehrlich Road, north of the park-n-ride. A wide sidewalk connects the trail to the signalized intersection of Ehrlich Road and Gunn Highway. There is a channelized eastbound right turn lane (see Figure 35) setback from the intersection. In order to remain in a marked space, pedestrians would need to walk approximately 400 feet west of the intersection to get to the sidewalk on the west side of Gunn Highway. Alternatively, there is a sidewalk that runs on the east side of Gunn Highway and provides a more direct route, but there is no marked crossing to get trail users to the bus stop on the west side of the roadway. There is no bike facility on Gunn Highway; bicyclists can ride in mixed traffic or walk their bicycle along the sidewalk. As a short-term solution, HART may want to consider working with Hillsborough County to provide a marked crossing in front of the bus stop on Gunn Highway. If this is a more popular connection, the County may consider obtaining an easement to provide a direct connection from the trail to the park-n-ride. This connection would also serve the baseball fields in the area. HART may want to consider providing bicycle parking at the park-n-ride, as bicycles can be seen chained to the tree near the bus stop. FIGURE 35 ROUTE 61 LX/ UPPER TAMPA BAY TRAIL AT GUNN HIGHWAY DRAFT DECEMBER
Transit Workshop with MPO Board
 Transit Workshop with MPO Board Overview of Workshop What is a TDP? Historical trends Existing bus service 2028 Recent public outreach Future direction Policy Questions 1 What TDP is Not Not a budget Not
Pocatello Regional Transit Master Transit Plan Draft Recommendations
 Pocatello Regional Transit Master Transit Plan Draft Recommendations Presentation Outline 1. 2. 3. 4. What is the Master Transit Plan? An overview of the study Where Are We Today? Key take-aways from existing
City of Davenport CitiBus Public Transportation Study. April 2015
 City of Davenport CitiBus Public Transportation Study April 2015 Overview Project Background Key Findings CitiBus Service Allocation Policy Discussion 2 Project Background 3 About CitiBus Operates 17 routes
TRANSIT & NON-MOTORIZED PLAN DRAFT FINAL REPORT Butte County Association of Governments
 1 INTRODUCTION Maintaining a high quality of life is the essence of this plan for transit and non-motorized transportation in Butte County. Curbing greenhouse gas emissions (GHG) by reducing congestion,
Tulsa Metropolitan Area LONG RANGE TRANSPORTATION PLAN
 Tulsa Metropolitan Area LONG RANGE TRANSPORTATION PLAN Indian Nations Council of Governments August 2005 CONTACTING INCOG In developing the Destination 2030 Long Range Transportation Plan, INCOG s Transportation
Guidelines for Providing Access to Public Transportation Stations APPENDIX C TRANSIT STATION ACCESS PLANNING TOOL INSTRUCTIONS
 APPENDIX C TRANSIT STATION ACCESS PLANNING TOOL INSTRUCTIONS Transit Station Access Planning Tool Instructions Page C-1 Revised Final Report September 2011 TRANSIT STATION ACCESS PLANNING TOOL INSTRUCTIONS
Arlington County 10-Year Transit Development Plan & Premium Transit Network Briefing. May 2016
 Arlington County 10-Year Transit Development Plan & Premium Transit Network Briefing May 2016 Overview 10-Year Transit Development Plan Premium Transit Network Columbia Pike service concept Premium amenities
CITY OF COCOA BEACH 2025 COMPREHENSIVE PLAN. Section VIII Mobility Element Goals, Objectives, and Policies
 CITY OF COCOA BEACH 2025 COMPREHENSIVE PLAN Section VIII Mobility Element Goals, Objectives, and Policies Adopted August 6, 2015 by Ordinance No. 1591 VIII MOBILITY ELEMENT Table of Contents Page Number
Title VI Fare Change Equity Analysis
 Title VI Fare Change Equity Analysis Evaluation Report Submitted to Dallas Area Rapid Transit Submitted by TranSystems June 2012 Title VI Fare Change Equity Analysis Introduction DART has proposed a schedule
EXECUTIVE SUMMARY... vii 1 STUDY OVERVIEW Study Scope Study Area Study Objectives
 Contents EXECUTIVE SUMMARY... vii 1 STUDY OVERVIEW... 1-1 1.1 Study Scope... 1-1 1.2 Study Area... 1-1 1.3 Study Objectives... 1-3 2 EXISTING CONDITIONS... 2-1 2.1 Existing Freeway Conditions... 2-4 2.1.1
Chapter 5 Future Transportation
 Chapter 5 Future Transportation The Future Land Use Plan identifies the desired land use designations. The land uses desired for Crozet depend, in large part, on the success of the transportation system,
WILMAPCO Public Opinion Survey Summary of Results
 Wilmington Area Planning Council WILMAPCO Public Opinion Survey Summary of Results Prepared by: 2955 Valmont Road, Suite 300 Boulder, Colorado 80301 t: 303-444-7863 f: 303-444-1145 www.n-r-c.com Table
Typical Rush Hour Commute. PennyforTransportation.com
 Typical Rush Hour Commute In the News Overview of the Plan Collaborative plan with projects in every community Prioritizing connectivity and congestion relief Dedicated transportation-specific funding;
1/30/2019 DRAFT. January 31, Item #1 CITIZENS PARTICIPATION
 January 31, 2019 Item #1 CITIZENS PARTICIPATION 1 Item #2 APPROVAL OF MINUTES Item #3 TRAC GOALS, FRAMEWORK & AGENDA REVIEW 2 COMMITTEE GOALS Learn about Southern Nevada s mobility challenges, new developments
Arterial Transitway Corridors Study. Ave
 Arterial Transitway Corridors Study Ave January 2012 Arterial Transitway Corridors Study Overview Corridor Features and Demographics 11 study corridors, 95 route miles 86,000 daily rides and half of existing
North Shore Transportation Improvement Strategy
 North Shore Transportation Improvement Strategy Preliminary, Near-term Recommendation 2016 April Transportation Improvement Strategy (TIS) Comprehensive and Analytical A multi-modal transportation strategy
Travel and Rider Characteristics for Metrobus
 Travel and Rider Characteristics for Metrobus 040829040.15 Travel and Rider Characteristics for Metrobus: 2012-2015 Overview The Miami Dade County Metropolitan Planning Organization (MPO) conducted a series
ROUTES 55 / 42 / 676 BUS RAPID TRANSIT LOCALLY PREFERRED ALTERNATIVE
 ROUTES 55 / 42 / 676 BUS RAPID TRANSIT LOCALLY PREFERRED ALTERNATIVE April, 2012 1 INTRODUCTION The need for transit service improvements in the Routes 42/55/676 corridor was identified during the Southern
Rochester Area Bike Sharing Program Study
 roc bike share Rochester Area Bike Sharing Program Study Executive Summary ~ January 2015 JANUARY 2015 8484 Georgia Avenue, Suite 800 Silver Spring, MD 20910 3495 Winton Pl., Bldg E, Suite 110 Rochester,
2045 Long Range Transportation Plan. Summary of Draft
 2045 Long Range Transportation Plan Summary of Draft Fredericksburg Area Metropolitan Planning Organization The George Washington Region includes the City of Fredericksburg and the counties of Caroline,
Corpus Christi Metropolitan Transportation Plan Fiscal Year Introduction:
 Introduction: The Safe, Accountable, Flexible, Efficient Transportation Equity Act: A Legacy for Users (SAFETEA-LU) has continued the efforts started through the Intermodal Surface Transportation Efficiency
Appendix A-1: Purpose and Need Statement
 Appendix A-1: Purpose and Need Statement PURPOSE AND NEED STATEMENT Western & Ashland Corridors Bus Rapid Transit (BRT) Project Prepared for Chicago Transit Authority 567 West Lake Street Chicago, IL 60661
MEETING Agenda. Introductions. Project Overview. Key Study Components. Alternative Station Concepts. Preferred Station Concept. Next Steps.
 City GARLAND Council ROADVISION Briefing STUDY VISION STUDY Dallas, TX April 8, 2010 1 1 MEETING Agenda Introductions Project Overview Key Study Components Alternative Station Concepts Preferred Station
Proposed. City of Grand Junction Complete Streets Policy. Exhibit 10
 Proposed City of Grand Junction Complete Streets Policy Exhibit 10 1 City of Grand Junction Complete Streets Policy Vision: The Complete Streets Vision is to develop a safe, efficient, and reliable travel
Everett Transit Action Plan. Community Open House November 16, 2015
 Everett Transit Action Plan Community Open House Everett has a great location, but getting around the city and into surrounding communities is a problem for all ages Many Voices, One Future: The Everett
Arterial Transitway Corridors Study
 Arterial Transitway Corridors Study February 2012 Arterial Transitway Corridors Study Overview Corridor Features and Demographics 11 study corridors, 95 route miles Routes: 86,000 daily rides and half
REGIONAL PRIORITIES Presentation to the Tampa Bay Regional Collaboration Committee September 10, 2012
 WEST CENTRAL FLORIDA MPO CHAIRS COORDINATING COMMITTEE REGIONAL PRIORITIES Presentation to the Tampa Bay Regional Collaboration Committee September 10, 2012 TRANSPORTATION REGIONAL INCENTIVE PROGRAM (TRIP)
Preliminary Transportation Analysis
 Preliminary Transportation Analysis Goals of a Robust, Multimodal Transportation Network Safe Accessible/Connected Efficient Comfortable Context-Sensitive Motor Vehicle: Continue to analyze the data to
EXISTING PRIORITIES FUNDED FOR CONSTRUCTION LRTP
 EXISTING PRIORITIES FUNDED FOR CONSTRUCTION Limits Description Status 1 415489 3 H1865 US HWY 301 FROM SR 674 TO BALM RD Widen 2 lanes to 6 lanes divided County / Construction Programmed 2016 2 405492
Performance Criteria for 2035 Long Range Transportation Plan
 Minimizing Impacts on Natural, Historic, Cultural or Archeological Resources 2035 LRTP Weighting Factor: 7% Objective 1.1: Use appropriate planning and design criteria to protect and enhance the built
2012 Transit Study Randolph County
 2012 Transit Study Randolph County Appendix B Technical Memorandum 2011 Transportation Survey Prepared for: Randolph County Housing Authority Country Roads Transit Submitted by: July 1, 2012 Table of Contents
DRAFT BUENA VISTA 2020 TRANSPORTATION PLAN
 DRAFT BUENA VISTA 2020 TRANSPORTATION PLAN DEVELOPED BY THE TRANSPORTATION PLANNING DIVISION OF THE VIRGINIA DEPARTMENT OF TRANSPORTATION IN COOPERATION WITH THE U.S. DEPARTMENT OF TRANSPORTATION, FEDERAL
INTRODUCTION. Specifically, the objectives are to:
 INTRODUCTION The River to Sea Transportation Planning Organization (TPO) conducts the Tell the TPO Transportation Trends Survey to better understand the transportation preferences and priorities for the
ADOT Statewide Bicycle and Pedestrian Program Summary of Phase IV Activities APPENDIX B PEDESTRIAN DEMAND INDEX
 ADOT Statewide Bicycle and Pedestrian Program Summary of Activities APPENDIX B PEDESTRIAN DEMAND INDEX May 24, 2009 Pedestrian Demand Index for State Highway Facilities Revised: May 29, 2007 Introduction
TRANSPORTATION & MOBILITY
 TRANSPORTATION & MOBILITY ROADWAY SYSTEM There are approximately 40 miles of roadways in Manitou Springs. For planning purposes, roadways are typically assigned a functional classification which defines
I-20 East Transit Initiative. Stakeholder Advisory Committee Meeting September 9, :00-6:00 PM
 I-20 East Transit Initiative Stakeholder Advisory Committee Meeting September 9, 2010 4:00-6:00 PM Meeting Agenda Introductions Project Background Study Overview Role of the SAC Initial Study Findings
PUBLIC TRANSPORTATION PLAN FOR THE CITY OF GEORGETOWN
 PUBLIC TRANSPORTATION PLAN FOR THE CITY OF GEORGETOWN PRESENTATION TO CITY COUNCIL JANUARY 22, 2008 PUBLIC TRANSIT FOR THE CITY OF GEORGETOWN LOCAL SERVICE For Georgetown residents to Georgetown destinations.
PEDESTRIAN ACTION PLAN
 ATTACHMENT 2 CITY OF SANTA MONICA PEDESTRIAN ACTION PLAN CITY OF SANTA MONICA PEDESTRIAN ACTION PLAN This page intentionally left blank EXECUTIVE SUMMARY CHAPTER 1 EXECUTIVE SUMMARY Setting the Stage
1999 On-Board Sacramento Regional Transit District Survey
 SACOG-00-009 1999 On-Board Sacramento Regional Transit District Survey June 2000 Sacramento Area Council of Governments 1999 On-Board Sacramento Regional Transit District Survey June 2000 Table of Contents
Chapter 4 Traffic Analysis
 Chapter 4 Traffic Analysis PURPOSE The traffic analysis component of the K-68 Corridor Management Plan incorporates information on the existing transportation network, such as traffic volumes and intersection
AAMPO Regional Transportation Attitude Survey
 AAMPO Regional Transportation Attitude Survey Traditionally Underserved Populations helping organizations make better decisions since 1982 2018 Submitted to the AAMPO By: ETC Institute 725 W. Frontier
Characteristics from these programs were used to compare to and evaluate existing conditions in Howard County.
 EXECUTIVE SUMMARY Bike share is a mobility option that allows users to access a fleet of public bicycles throughout a community. Bike share systems have successfully been implemented in communities throughout
4. ENVIRONMENTAL IMPACT ANALYSIS 9. TRANSPORTATION AND TRAFFIC
 4. ENVIRONMENTAL IMPACT ANALYSIS 9. TRANSPORTATION AND TRAFFIC 4.9.1 INTRODUCTION The following section addresses the Proposed Project s impact on transportation and traffic based on the Traffic Study
Lee s Summit Road Improvement Study Public Open House June 7, 2007 Summary of Comment Card Responses
 Lee s Summit Road Improvement Study Public Open House June 7, 2007 Summary of Comment Card Responses Introduction At the Lee s Summit Road Improvement Study Public Open House held Thursday, June 7, 2007
Bay to Bay Boulevard Complete Streets Project
 Bay to Bay Boulevard Complete Streets Project Dale Mabry Highway to Bayshore Boulevard February 08, 2018 Photo Source: Tampa Bay Times Alessandra Da Pra Meeting Format Introduction Resurfacing Information
Aurora Corridor to E Line
 Aurora Corridor to E Line Jack Whisner Transit Planner, Service Development King County Metro Transit Seattle, Washington jack.whisner@kingcounty.gov 206-477-5847 King County Metro Transit Part of general
State Road 54/56 Tampa Bay s Northern Loop. The Managed Lane Solution Linking I-75 to the Suncoast Parkway
 State Road 54/56 Tampa Bay s Northern Loop The Managed Lane Solution Linking I-75 to the Suncoast Parkway SUNCOAST PARKWAY Both I 75 and the Suncoast Parkway are planning, or in the process of constructing,
Plant City Walk-Bike Plan
 Plant City Walk-Bike Plan Plant City Commute Mode Share 2.2% 1.4% 2.9% Drove alone 10.2% Carpooled Public transportation (0.1%) Walked Used a Bike (0.4%) 82.9% Taxicab, motorcycle, or other means Worked
US 19 Pedestrian and Bicycle Safe Access to Transit Corridor Study
 US 19 Pedestrian and Bicycle Safe Access to Transit Corridor Study DRAFT Technical Memorandum #6 Cost and Benefit Evaluation Methodology August 2016 Prepared for: FLORIDA DEPARTMENT OF TRANSPORTATION DISTRICT
RESOLUTION NO ?? A RESOLUTION OF THE CITY OF NEPTUNE BEACH ADOPTING A COMPLETE STREETS POLICY
 RESOLUTION NO. 2018-?? A RESOLUTION OF THE CITY OF NEPTUNE BEACH ADOPTING A COMPLETE STREETS POLICY WHEREAS, safe, convenient, and accessible transportation for all users is a priority of the City of Neptune
Prepared For: Shieldbay Developments Inc. c/o Matson, McConnell Ltd. 2430A Bloor Street West Toronto, Ontario M6S 1P9.
 Prepared For: Shieldbay Developments Inc. c/o Matson, McConnell Ltd. 2430A Bloor Street West Toronto, Ontario M6S 1P9 Prepared By: URS Canada Inc. 4 th Floor, 30 Leek Crescent Richmond Hill, Ontario L4B
CASE STUDY City of Monrovia: Leveraging emerging ridesharing services to expand mobility options
 Advancing Mobility Management CASE STUDY City of Monrovia: Leveraging emerging ridesharing services to expand mobility options Agency: Location: Service Area: Modes: Community Context: Key Contacts: City
Most Important Part of any Plan
 Most Important Part of any Plan Objectives must be evaluated to determine if they have been achieved Achievement of Objectives: 10 of 13 Objectives Achieved 1 not achieved 2 not due yet Transportation
BUILDING THE CASE FOR TRAVEL OPTIONS IN WASHING TON COUNTY. Image: Steve Morgan. Image: Steve Morgan
 BUILDING THE CASE FOR TRAVEL OPTIONS IN WASHING TON COUNTY Image: Steve Morgan Image: Steve Morgan Image: TriMet Image: TriMet WHAT ARE TRAVEL OPTIONS PROGRAMS? Travel options programs encourage residents,
Interim Transit Ridership Forecast Results Technical Memorandum
 Interim Transit Ridership 401 South Jackson Street Seattle, WA 98104-2826 September 2012 Table of Contents 1 INTRODUCTION... 1-1 1.1 Project Background... 1-1 2 RIDERSHIP FORECASTS... 2-1 2.1 System Ridership
TAMPA BAY EXPRESS (TBX)
") TAMPA BAY EXPRESS (TBX) Hank Schneider, P.E. FDOT- District 7 Consultant Project Manager Florida Department of TRANSPORTATION TAMPA BAY EXPRESS AGENDA What is TBX? What does TBX do? Why is TBX Important?
TAMPA BAY EXPRESS (TBX) Hank Schneider, P.E. FDOT- District 7 Consultant Project Manager Florida Department of TRANSPORTATION TAMPA BAY EXPRESS AGENDA What is TBX? What does TBX do? Why is TBX Important?
Philadelphia Bus Network Choices Report
 Philadelphia Bus Network Choices Report JUNE 2018 SEPTA Table of Contents Executive Summary...7 What if transit gave us more freedom?... 8 What is this report?... 8 The main conclusions... 9 What is happening
4 Ridership Growth Study
 Clause 4 in Report No. 15 of Committee of the Whole was adopted, without amendment, by the Council of The Regional Municipality of York at its meeting held on November 16, 2017. 4 Ridership Growth Study
LOOP 360 IMPROVEMENT STUDY
 LOOP 360 IMPROVEMENT STUDY Overview and Preliminary Analysis August 2015 1 STUDY PROCESS 2 Study Background Loop 360 serves a wide range of users, including residents, businesses, bicyclists, and commuters
Chapter 7. Transportation. Transportation Road Network Plan Transit Cyclists Pedestrians Multi-Use and Equestrian Trails
 Chapter 7 Transportation Transportation Road Network Plan Transit Cyclists Pedestrians Multi-Use and Equestrian Trails 7.1 TRANSPORTATION BACKGROUND The District of Maple Ridge faces a number of unique
2018 Transportation Survey October 17, Prepared by:
 Transportation Survey October 17, Prepared by: Overview Methodology Systemwide results Strengths/Weaknesses by mode Importance of possible improvements Conclusions Methodology 500 Chittenden County residents
SMART 1 Public Meeting #1. February 24, 2016
 SMART 1 Public Meeting #1 February 24, 2016 Agenda Who is the SMTC? SMART 1 project overview Syracuse Metropolitan Transportation Council An Introduction: Who we are & what we do What is an MPO? A Metropolitan
DON MILLS-EGLINTON Mobility Hub Profile
 Mobility Hub Profile Dundas Don Mills-Eglinton West-Bloor Anchor Hub Gateway Hub N MOBILITY HUBS: Places of connectivity between regional and rapid transit services, where different modes of transportation
Roads and Vehicular Traffic Design Principles. Roads and Vehicular Traffic Recommendations
 CIRCULATION AND PARKING roads and vehicular traffic The Campus Master Plan updates the campus transportation network through a multi-modal approach that encourages walking and biking while improving vehicular
First and Last Mile Plan. April 2016
 First and Last Mile Plan April 2016 1 First and Last Mile refers to the portion of a transit trip between a transit stop and one s destination, and can include walking, biking, carpooling, rolling or driving,
Purpose and Need. Chapter Introduction. 2.2 Project Purpose and Need Project Purpose Project Need
 Chapter 2 Purpose and Need 2.1 Introduction The El Camino Real Bus Rapid Transit (BRT) Project (Project) would make transit and other transportation improvements along a 17.6-mile segment of the El Camino
Standing Committee on Policy and Strategic Priorities. Mount Pleasant Industrial Area Parking Strategy and Access Improvements
 POLICY REPORT Report Date: April 23, 2018 Contact: Lon LaClaire Contact No.: 604.873.7722 RTS No.: 9944 VanRIMS No.: 08-2000-20 Meeting Date: May 16, 2018 TO: FROM: SUBJECT: Standing Committee on Policy
US 19 Pedestrian and Bicycle Safe Access to Transit Corridor Study
 US 19 Pedestrian and Bicycle Safe Access to Transit Corridor Study DRAFT Technical Memorandum #3 Active Bus Stop Review and Observations August 2016 Prepared for: FLORIDA DEPARTMENT OF TRANSPORTATION DISTRICT
Online Open House Survey Report. December 2016
 December 216 I. OVERVIEW & OUTREACH SUMMARY Introduction Washington County evaluated long-term transportation investments and strategies as part of the Transportation Futures Study. The purpose of the
Memorandum. Fund Allocation Fund Programming Policy/Legislation Plan/Study Capital Project Oversight/Delivery Budget/Finance Contract/Agreement Other:
 Memorandum Date: November 20, 2017 To: Transportation Authority Board From: Eric Cordoba Deputy Director Capital Projects Subject: 12/5/17 Board Meeting: San Francisco Freeway Corridor Management Study
US 19 Pedestrian and Bicycle Safe Access to Transit Corridor Study
 US 19 Pedestrian and Bicycle Safe Access to Transit Corridor Study Summary Report October 2016 Prepared for: FLORIDA DEPARTMENT OF TRANSPORTATION DISTRICT 7 (FDOT) Contract No: C 9B41, FAP No: 8886 318
CONNECTING PEOPLE TO PLACES
 CONNECTING PEOPLE TO PLACES 82 EAST BENCH MASTER PLAN 07 Introduction The East Bench transportation system is a collection of slow moving, treelined residential streets and major arteries that are the
NEWMARKET CENTRE Mobility Hub Profile
 Mobility Hub Profile Dundas Newmarket West-Bloor Centre Anchor Hub Gateway Hub N MOBILITY HUBS: Places of connectivity between regional and rapid transit services, where different modes of transportation
Transportation in Washoe County. Lee Gibson, Executive Director February 15, 2011
 Transportation in Washoe County Lee Gibson, Executive Director February 15, 2011 RTC OF WASHOE COUNTY Metropolitan Planning Organization Meet long term needs Deliver federal funding Program projects in
JONESBORO HIGHWAY 63 HIGHWAY 18 CONNECTOR STUDY
 JONESBORO HIGHWAY 63 HIGHWAY 18 CONNECTOR STUDY Craighead County May 2007 JONESBORO HIGHWAY 63 HIGHWAY 18 CONNECTOR STUDY Craighead County May 2007 Prepared by Planning and Research Division Arkansas State
Bus Rapid Transit ALTERNATIVES ANALYSIS. Open House
 Bus Rapid Transit ALTERNATIVES ANALYSIS Open House June 23, 2015 Open House Meeting Agenda Agenda Introductions What is BRT? Project Goals Study Tasks Next steps Discussion PVTA Bus Rapid Transit Study
How Policy Drives Mode Choice in Children s Transportation to School
 How Policy Drives Mode Choice in Children s Transportation to School Physical Activity through Active Transportation Ruth L. Steiner 2011 Technical Conference and Exhibit Lake Buena Vista, FL April 3-6,
Key objectives of the survey were to gain a better understanding of:
 3 COMMUNITY INPUT Community input is an essential part of corridor studies. For the SR 87 corridor study, VTA staff conducted an extensive online survey of people living and commuting along the corridor.
BETHEL ROAD AND SEDGWICK ROAD CORRIDOR STUDY
 DRAFT PLAN City Council Meeting August 14, 2017 STUDY AREA Sedgwick Corridor State Route 160, principal arterial with Class 3 access management designation, commuter and freight route, connection to SR
Data Analysis February to March Identified safety needs from reported collisions and existing travel patterns.
 Welcome! Thank you for participating in today s Valencia Bikeway Improvements workshop. Data Analysis February to March Identified safety needs from reported collisions and existing travel patterns. Initial
Project Description Form 8EE
 Project Description Form 8EE Basic Project Information Submitting Jurisdiction/Agency: Town of Dumfries Project Title: Route 1 (Fraley Blvd) Widening: Brady's Hill Road to Dumfries Road Project Location:
Climate Change Action Plan: Transportation Sector Discussion Paper: Cycling
 Climate Change Action Plan: Transportation Sector Discussion Paper: Cycling ontario.ca/climatechange Contents 1. Minister of Transportation s message... 3 2. Introduction... 5 3. Sector Overview and Support
Exhibit 1 PLANNING COMMISSION AGENDA ITEM
 Exhibit 1 PLANNING COMMISSION AGENDA ITEM Project Name: Grand Junction Circulation Plan Grand Junction Complete Streets Policy Applicant: City of Grand Junction Representative: David Thornton Address:
SAN FRANCISCO MUNICIPAL TRANSPORTATION AGENCY
 THIS PRINT COVERS CALENDAR ITEM NO. : 11 DIVISION: Sustainable Streets BRIEF DESCRIPTION: SAN FRANCISCO MUNICIPAL TRANSPORTATION AGENCY Approving traffic modifications on Twin Peaks Boulevard between Christmas
David Jickling, Public Transportation Director Regional Transportation Commission, Washoe County
 David Jickling, Public Transportation Director Regional Transportation Commission, Washoe County Virginia Street Resort corridor connecting University of Nevada, Reno Downtown Truckee River Strip Casinos
Better Market Street. Engineering, Maintenance & Safety Committee (EMSC) February 28, 2018
 February 28, 2018") Better Market Street Engineering, Maintenance & Safety Committee (EMSC) February 28, 2018 1 Market Street Market Street - San Francisco by rulenumberone2 2 Market Street is the... City s busiest pedestrian
Better Market Street Engineering, Maintenance & Safety Committee (EMSC) February 28, 2018 1 Market Street Market Street - San Francisco by rulenumberone2 2 Market Street is the... City s busiest pedestrian
Executive Summary BEYOND THE B-LINE: RAPID TRANSIT LINE PHASE II - COMMERCIAL DRIVE WEST. Final Draft December 13, Appendix B BROADWAY/LOUGHEED
 BEYOND THE B-LINE: BROADWAY/LOUGHEED RAPID TRANSIT LINE PHASE II - COMMERCIAL DRIVE WEST Appendix B Executive Summary Final Draft December 13, 1999 UMA Lloyd Lindley Davidson Yuen Simpson Architects BROADWAY/LOUGHEED
DON MILLS-SHEPPARD Mobility Hub Profile
 DON MILLS-SHEPPARD Mobility Hub Profile Dundas Don Mills-Sheppard West-Bloor Anchor Hub Gateway Hub N MOBILITY HUBS: Places of connectivity between regional and rapid transit services, where different
2016 TELL THE TPO SURVEY
 RIVER TO SEA TRANSPORTATION PLANNING ORGANIZATION 2016 TELL THE TPO SURVEY CAMPAIGN SUMMARY August 2016 Introduction The River to Sea Transportation Planning Organization (TPO) conducted its second Tell
York Region Population and Employment Growth
 March 1, 2016 1 York Region Population and Employment Growth York Region needs to comply with The Provincial Growth Plan and new forecasts introduced to 2036 and 2041 2 Regional Official Plan Review York
Calgary Transit Route 302 Southeast BRT Year One Review June
 Calgary Transit Route 302 Southeast BRT Year One Review 2011 June Calgary Transit Route 302 Southeast BRT: Year One Review 2011 April Table of Contents 1.0 Executive Summary... 1 2.0 Introduction... 3
Evan Johnson, Tindale Oliver & Associates. Alan Danaher, P.E., PTOE, AICP, PTP
 To: Copies: From: Evan Johnson, Tindale Oliver & Associates Matt Muller, RTS Jesus Gomez, RTS Alan Danaher, P.E., PTOE, AICP, PTP Date: January 14, 2014 Subject: Ridership Projections Gainesville Streetcar
BICYCLE/PEDESTRIAN ACCESS TO TRANSIT SAFETY ASSESSMENT FOR EXISTING AND PLANNED SECTIONS OF US 19
 BICYCLE/PEDESTRIAN ACCESS TO TRANSIT SAFETY ASSESSMENT FOR EXISTING AND PLANNED SECTIONS OF US 19 Project Advisory Committee Meeting January 27, 2016 A JOINT EFFORT OF THE PINELLAS METROPOLITAN PLANNING
Service Proposal for the City of Ashland, Oregon
 Rogue Valley Transportation District 3200 Crater Lake Avenue Medford, Oregon 97504-9075 Phone (541) 608-2429 Fax (541) 773-2877 Visit our website at: www.rvtd.org 2009-2011 Service Proposal for the City
2010 Pedestrian and Bicyclist Special Districts Study Update
 2010 Pedestrian and Bicyclist Special Districts Study Update Pedestrian and Bicyclist Special Districts Program Overview H-GAC s Special Districts Program aims to provide strategic investments in pedestrian
US 19 PEDESTRIAN AND BICYCLE SAFE ACCESS
 US 19 PEDESTRIAN AND BICYCLE SAFE ACCESS TO TRANSIT CORRIDOR STUDY A JOINT EFFORT OF THE FLORIDA DEPARTMENT OF TRANSPORTATION AND FORWARD PINELLAS (F.K.A. PINELLAS COUNTY METROPOLITAN PLANNING ORGANIZATION)
Transportation Master Plan Advisory Task Force
 Transportation Master Plan Advisory Task Force Network Alternatives & Phasing Strategy February 2016 BACKGROUND Table of Contents BACKGROUND Purpose & Introduction 2 Linking the TMP to Key Council Approved
SUMMARY OF TRANSPORTATION INVESTMENTS
 Santa Cruz County 2016 Measure D: Transportation Improvement Expenditure Plan - Approved by over 2/3 of Santa Cruz County voters on November 8, 2016 - Overview Measure D, the 2016 Transportation Improvement
In station areas, new pedestrian links can increase network connectivity and provide direct access to stations.
 The Last Mile Planning for Pedestrians Planning around stations will put pedestrians first. Making walking to stations safe and easy is important; walking will be a part of every rapid transit Accessible
South King County High-Capacity Transit Corridor Study
 HIGH-CAPACITY TRANSIT CORRIDOR STUDY South King County Corridor South King County High-Capacity Transit Corridor Study Corridor Report August 2014 South King County High Capacity Transit Corridor Report