Prince Charles Traffic Management Plan Survey January 2014
|
|
|
- Shanon Mitchell Garrett
- 6 years ago
- Views:
Transcription

1 Prince Charles Traffic Management Plan Survey January
2 Study Background Stantec is working with the City of Edmonton to assist in a new Traffic Management Plan in the Prince Charles neighbourhood at the request of the community. Residents were asked to complete a preliminary survey to assess community concerns, including perceptions of: Traffic volume safety; Locations types of traffic issues; Willingness to accept traffic measures that may increase travel time. 2
3 Methodology The online survey was available online at or by telephone by request. The survey was open to anyone in Edmonton from January 10 to 23, respondents completed the survey. Results provide a margin of error no greater than ±10.2% at the 95% confidence level, or 19 times out of 20. Please note that due to rounding, graphs & tables do not always add to exactly 100%. 3


4 Respondent Profile How are you connected to the Prince Charles Community?* n= 82 *Multiple responses **Respondents were asked to specify. 4
5 Respondent Profile Respondents who are representatives of an association /organization Respondents (n=2) Community association (unspecified) 1 Prince Charles Community League 1 Other Respondents (n=2) Family members live in the community 2 5


6 Respondent Profile Based on your mailing address, where in Prince Charles is your home, business, property or other location?* n=72 *Base: Respondents who indicated a geographical connection to the area (owner, resident, patron, etc.) 6
7 Transportation Traffic Related Issues Issues most mentioned, by most frequently cited locations* ** Top Issues 124 Street (n=18) 124 St & Yellowhead (n=12) 124 St & 118 Ave (n=11) 124 St, YH to 118 Ave (n=7) 127 Street (n=6) High speeds/speeders High traffic volume Shortcutting Lack of turning signal/lanes Uncontrolled intersections Parking (overflow, visibility) Traffic congestion/backlog Commercial vehicles (general) 17 8 Traffic/pedestrian lights *Percentage by location, multiple responses **Use caution interpreting results when n<30 7
8 Transportation Traffic Related Issues (Issues overall) What would you say are the three biggest transportation or trafficrelated issues facing the community of Prince Charles today? Percent of Respondents (n=82)* n=82 *Multiple responses High traffic speeds/speeders 33 High traffic volume 29 Shortcutting 22 Lack of turning signal/lanes 15 Uncontrolled intersections 12 Parking issues (ex. overflow into residential areas/lack of stalls/block road visibility, etc.) Traffic congestion/back log 12 Commercial vehicles 10 Poor timing on traffic lights/pedestrian walk lights 9 Narrow roads/lanes
9 Transportation Traffic Related Issues (Issues overall) What would you say are the three biggest transportation or trafficrelated issues facing the community of Prince Charles today? (Continued) n=82 *Multiple responses Percent of Respondents (n=82)* Access in/out of area (in general) 6 Poor road conditions (in general) 5 Access to major/arterial roads 4 Pedestrian safety (in general) 4 Unsynchronized traffic lights 2 Impaired driving 2 Lack of snow removal/windrows 2 None 1 Others (single mention) 6 No response/don t know 12 9
10 Transportation Traffic Related Issues (Locations overall) Which locations are these issues most prevalent? Percent of Respondents (n=82)* 124 St. 22 n=82 *Multiple responses 124 St. Yellowhead Trail St. 118 Ave St. Yellowhead Trail to 118 Ave. 9 Everywhere (unspecified) Ave. to Yellowhead Trail St. 120 Ave St. 127 Ave. 4 Within the community Ave. 2 10
11 Transportation Traffic Related Issues (Locations overall) Which locations are these issues most prevalent? (Continued) Percent of Respondents (n=82)* 122 St. 2 n=82 *Multiple responses 121A St St. 121 Ave St. to 127 St. 119 Ave St. 127 St. 118 Ave. 2 Near Prince Charles Park St. 118 Ave St. to 126 St. 120 Ave 2 Others (single mention) 46 No response/don t know 40 11


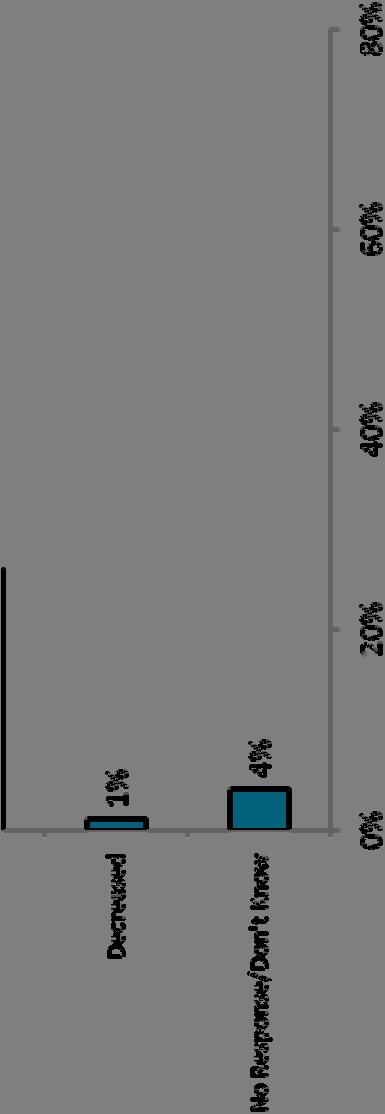
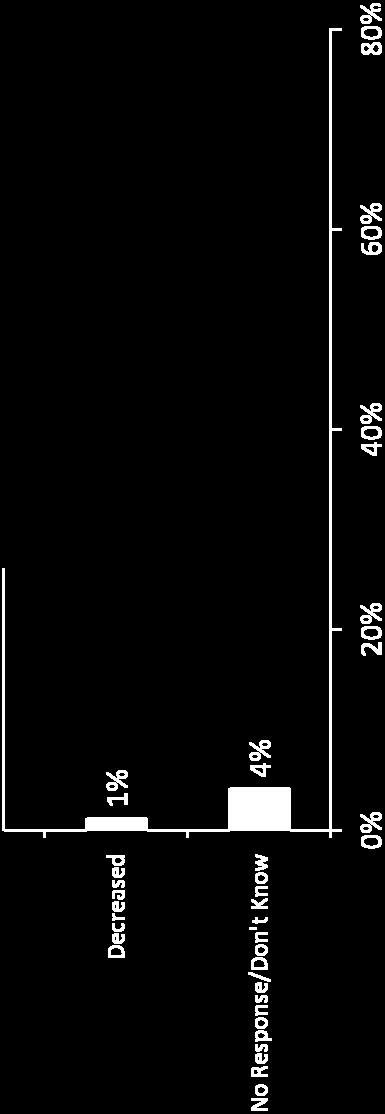
12 Traffic Volume in Prince Charles n= 82 12
13 Traffic Volume in Prince Charles Base: Respondents that indicated traffic volume has increased over the past 3 years Percent of Respondents* (n= 57) High volume of traffic during peak hours/rush hour 19 Increase of traffic in residential areas 18 Continued/ongoing growth/development in the area 16 General observations 12 Has noticed an increase in traffic volume (general) 12 Takes more time to reach destination/access certain roads/passing traffic lights Traffic volume/congestion is high on a regular/ongoing basis 5 *Multiple responses What makes you feel this way? Has lived in the area for a long time (general) 5 Timing of traffic lights 4 Others (single mention) 7 No response/don t know
14 Traffic Volume in Prince Charles Base: Respondents that indicated traffic volume has remained the same over the past 3 years Number of Respondents* (n= 21) Regularly uses roads in the area 4 General observations 4 Has lived in the area for a long time (general) 2 Traffic volume/congestion is high on a regular/ongoing basis 1 *Multiple responses What makes you feel this way? Has not noticed any change in traffic volume 1 No response/don t know 9 The one respondent (n=1) who felt that volume had decreased over the past 3 years indicated it was because of reduced commercial traffic from a business that closed. 14
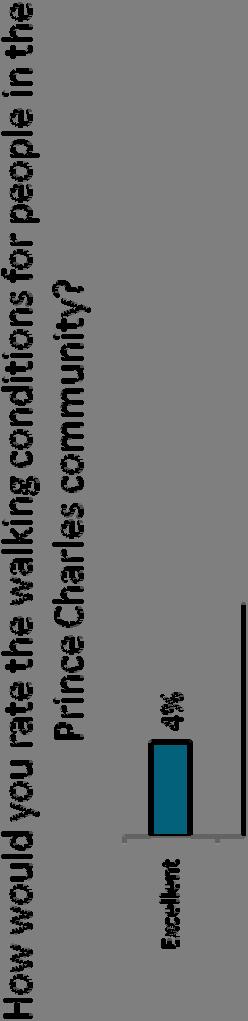
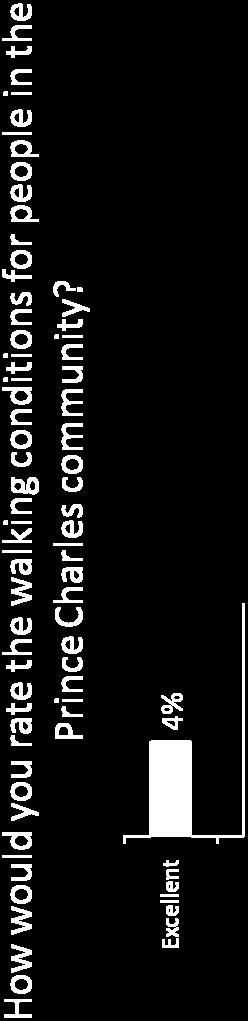
15 Walking Conditions n=82 15
16 Walking Conditions Base: Respondents that provided good/very good/excellent rating for walking conditions in Prince Charles community Percent of Respondents* (n=33) Sidewalks are in good condition/maintained 15 Enough/sufficient sidewalks available 12 Difficult/unsafe to cross streets/walk alongside traffic (ex. speeders/high traffic/lack signage/lighting) Safe to cross streets/walk alongside traffic (ex. crosswalk lights/lighting by roads) Sidewalks are not cleared in the winter season 6 Sidewalk maintenance could be improve/some need repairs/updating 2 *Multiple responses What makes you feel this way? Sidewalks are cleared in the winter season 2 Others (single mention) 15 No response/don t know
17 Walking Conditions What makes you feel this way? Base: Respondents that provided poor/fair rating for walking conditions in Prince Charles community Percent of Respondents* (n=47) Sidewalks are in poor condition/lack of maintenance 38 Difficult/unsafe to cross streets/walk alongside traffic (ex. speeders/high traffic/lack signage/lighting) Sidewalks are not cleared in the winter season 11 Lack of sidewalks available 9 Lack of drainage available/flooded sidewalks 4 *Multiple responses Depends on conditions (where/time of day) 2 No response/don t know
18 Level of Satisfaction with Transportation Conditions (Overall) Please rate your level of satisfaction with each of the below transportation conditions in the Prince Charles community: Traffic volume during the off peak travel periods Access to Public Transit (i.e. ETS DATS) Traffic safety during offpeak travel periods n=82 Low Satisfaction (1 2) Moderate Satisfaction (3) High Satisfaction (4 5) No Response/ Don t Know Mean 27% 26% 39% 9% % 29% 34% 11% % 31% 24% 7% 2.72 Parking 51% 13% 29% 6% 2.53 Traffic safety during the peak travel periods Traffic volume during the peak travel periods 68% 15% 10% 7% % 11% 7% 6%
19 Level of Satisfaction with Transportation Conditions (segmented) The following slides provide perceptions of transportation conditions broken down by respondents connection to the community. Please use caution in interpreting these results, as due to small sample size, differences are not considered to be statistically significant. Traffic volume during peak travel periods Low (1 2) Moderate (3) High (4 5) NR/DK Commuters (n=27) Area residents (n=55) Employees in area (n=17) Business owners/operators (n=11) Customers of businesses (n=16) Property owners (n=38) Resident of adjacent community (n=6) Assc./Org. (n=2) Table displays responses in percentages Mean 19
20 Level of Satisfaction with Transportation Conditions (segmented) Please use caution in interpreting these results, as due to small sample size, differences are not considered to be statistically significant. Traffic volume during off peak travel periods Low (1 2) Moderate (3) High (4 5) NR/DK Commuters (n=27) Area residents (n=55) Employees in area (n=17) Business owners/operators (n=11) Customers of businesses (n=16) Property owners (n=38) Resident of adjacent community (n=6) Assc./Org. (n=2) Table displays responses in percentages Mean 20
21 Level of Satisfaction with Transportation Conditions (segmented) Please use caution in interpreting these results, as due to small sample size, differences are not considered to be statistically significant. Traffic safety during peak travel periods Low (1 2) Moderate (3) High (4 5) NR/DK Commuters (n=27) Area residents (n=55) Employees in area (n=17) Business owners/operators (n=11) Customers of businesses (n=16) Property owners (n=38) Resident of adjacent community (n=6) Assc./Org. (n=2) Table displays responses in percentages Mean 21
22 Level of Satisfaction with Transportation Conditions (segmented) Please use caution in interpreting these results, as due to small sample size, differences are not considered to be statistically significant. Traffic safety during off peak travel periods Low (1 2) Moderate (3) High (4 5) NR/DK Commuters (n=27) Area residents (n=55) Employees in area (n=17) Business owners/operators (n=11) Customers of businesses (n=16) Property owners (n=38) Resident of adjacent community (n=6) Assc./Org. (n=2) Table displays responses in percentages Mean 22
23 Level of Satisfaction with Transportation Conditions (segmented) Please use caution in interpreting these results, as due to small sample size, differences are not considered to be statistically significant. Parking Low (1 2) Moderate (3) High (4 5) NR/DK Commuters (n=27) Area residents (n=55) Employees in area (n=17) Business owners/operators (n=11) Customers of businesses (n=16) Property owners (n=38) Resident of adjacent community (n=6) Assc./Org. (n=2) Table displays responses in percentages Mean 23
24 Level of Satisfaction with Transportation Conditions (segmented) Please use caution in interpreting these results, as due to small sample size, differences are not considered to be statistically significant. Access to Public Transit Low (1 2) Moderate (3) High (4 5) NR/DK Commuters (n=27) Area residents (n=55) Employees in area (n=17) Business owners/operators (n=11) Customers of businesses (n=16) Property owners (n=38) Resident of adjacent community (n=6) Assc./Org. (n=2) Table displays responses in percentages Mean 24
25 Reasons for Dissatisfaction with Transportation Conditions Base: Respondents that were dissatisfied (1 3) to at least 1 of the above statements Percent of Respondents (n=74) Shortcutting 74 Speeding on main roads within the community 69 Speeding on residential roads 68 Uncontrolled intersections 62 Enforcement of traffic laws 55 Pedestrian safety 54 Commercial traffic 42 Cyclist safety 37 Other** 14 *Multiple responses ** Respondents were asked to specify. 25
26 Reasons for Dissatisfaction with Transportation Conditions* (Segmented) Base: Respondents that were dissatisfied (1 3) to at least 1 of the above statements ** Commuter (n=23) Resident (n=52) Empl. (n=16) Buss. (n=8) Customer (n=13) Prprty Owner (n=33) Adj. Resident (n=5) Org/Assc. Rep. (n=2) Speeding on main roads within the community Speeding on residential roads Commercial traffic Pedestrian safety Shortcutting Cyclist safety Enforcement of traffic laws Uncontrolled intersections Other *Multiple responses, results displayed in percentages ** Due to small sample size, please use caution in interpreting comparing segmented data 26
27 Other Reasons for Dissatisfaction with Transportation Conditions Base: Respondents that listed Other in the previous question Number of Respondents* (n=10)** Increase traffic/congestion (in general) 4 Lack of parking available (in general) 2 Bus stops are poorly located (ex. far from facilities, reduce parking in residential areas,etc) Difficult to make turns at some intersections 1 Lack of traffic calming measures available 1 *Multiple responses **Use caution interpreting results when n<
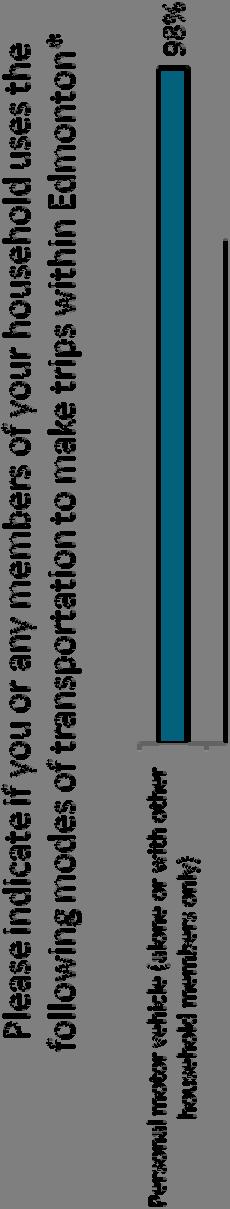
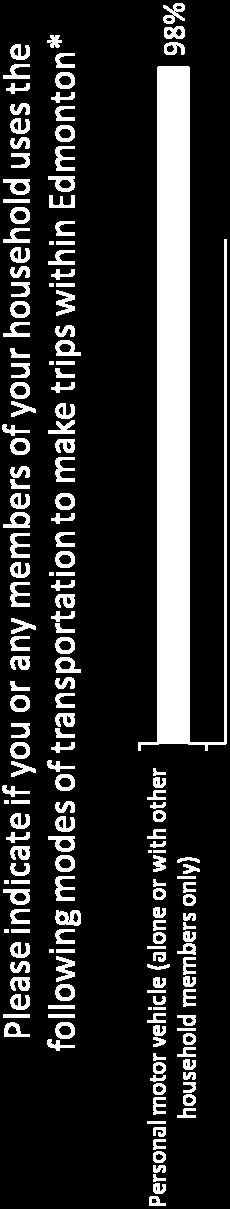
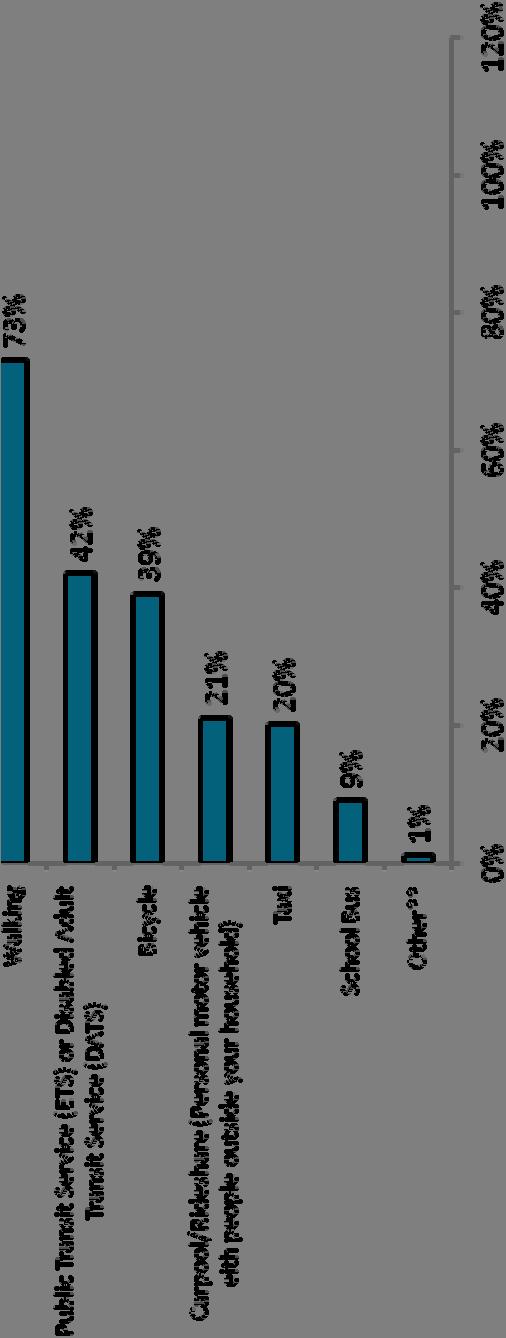
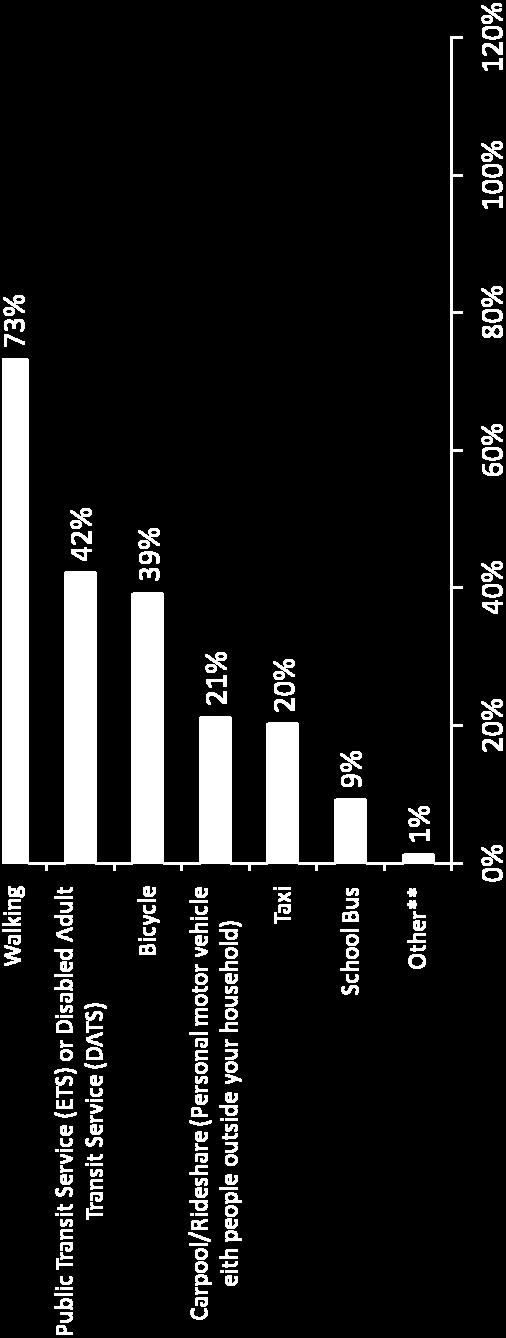
28 Modes of Transportation within Edmonton n=82 *Multiple responses **Respondents were asked to specify. 28
29 Traffic Habits Which intersections do you use most frequently to travel in out of the community? (all mentions) Percent of Respondents* (n=82) *Multiple responses 124 St. 118 Ave St. Yellowhead Trail St. 122 Ave St. Yellowhead Trail St. 120 Ave St. 122 Ave St. 121 Ave St. 121 Ave St. 118 Ave. 5 29
30 Traffic Habits Which intersections do you use most frequently to travel in out of the community? (continued) *Multiple responses Percent of Respondents* (n=82) 127 St. 120 Ave St. 118 Ave St. 123 Ave St. 118 Ave St. 118 Ave St. 119 Ave St. 2 Other (single mentions) 11 No response/don t know 5 30


31 On Street Parking Availability n=82 Mean = 2.89 out of 5 31
32 Priorities How much of a priority do you feel each of the following should have in the Prince Charles Community n=82 Low Priority (1 2) Moderate Priority (3) High Priority (4 5) No Response/ Don t Know Mean Speed enforcement 10% 21% 65% 5% 3.99 Reducing traffic volumes overall 15% 20% 62% 4% 3.87 Traffic control enforcement 20% 15% 57% 9% 3.68 New traffic controls 20% 16% 57% 7% 3.63 Improved traffic signage (ie: stop signs, pedestrian crossings) Reducing the volume of commercial traffic 17% 24% 52% 6% % 17% 48% 9% 3.40 Improved street lighting 24% 23% 45% 7% 3.28 Parking enforcement 43% 20% 28% 10%
33 Priorities in the Prince Charles Community (Segmented) The following slides provide priorities for addressing traffic issues broken down by respondents connection to the community. Please use caution in interpreting these results, as due to small sample size, differences are not considered to be statistically significant. Speed Enforcement Low (1 2) Moderate (3) High (4 5) NR/DK Commuters (n=27) Area residents (n=55) Employees in area (n=17) Business owners/operators (n=11) Customers of businesses (n=16) Property owners (n=38) Resident of adjacent community (n=6) Assc./Org. (n=2) Table displays responses in percentages Mean 33
34 Priorities in the Prince Charles Community (Segmented) Please use caution in interpreting these results, as due to small sample size, differences are not considered to be statistically significant. Reducing Traffic Volume Overall Low (1 2) Moderate (3) High (4 5) NR/DK Commuters (n=27) Area residents (n=55) Employees in area (n=17) Business owners/operators (n=11) Customers of businesses (n=16) Property owners (n=38) Resident of adjacent community (n=6) Assc./Org. (n=2) Table displays responses in percentages Mean 34
35 Priorities in the Prince Charles Community (Segmented) Please use caution in interpreting these results, as due to small sample size, differences are not considered to be statistically significant. Traffic Control Enforcement Low (1 2) Moderate (3) High (4 5) NR/DK Commuters (n=27) Area residents (n=55) Employees in area (n=17) Business owners/operators (n=11) Customers of businesses (n=16) Property owners (n=38) Resident of adjacent community (n=6) Assc./Org. (n=2) Table displays responses in percentages Mean 35
36 Priorities in the Prince Charles Community (Segmented) Please use caution in interpreting these results, as due to small sample size, differences are not considered to be statistically significant. Reducing the Volume of Commercial Traffic Low (1 2) Moderate (3) High (4 5) NR/DK Commuters (n=27) Area residents (n=55) Employees in area (n=17) Business owners/operators (n=11) Customers of businesses (n=16) Property owners (n=38) Resident of adjacent community (n=6) Assc./Org. (n=2) Table displays responses in percentages Mean 36
37 Priorities in the Prince Charles Community (Segmented) Please use caution in interpreting these results, as due to small sample size, differences are not considered to be statistically significant. Improved traffic signage Low (1 2) Moderate (3) High (4 5) NR/DK Commuters (n=27) Area residents (n=55) Employees in area (n=17) Business owners/operators (n=11) Customers of businesses (n=16) Property owners (n=38) Resident of adjacent community (n=6) Assc./Org. (n=2) Table displays responses in percentages Mean 37
38 Priorities in the Prince Charles Community (Segmented) Please use caution in interpreting these results, as due to small sample size, differences are not considered to be statistically significant. New Traffic Controls Low (1 2) Moderate (3) High (4 5) NR/DK Commuters (n=27) Area residents (n=55) Employees in area (n=17) Business owners/operators (n=11) Customers of businesses (n=16) Property owners (n=38) Resident of adjacent community (n=6) Assc./Org. (n=2) Table displays responses in percentages Mean 38
39 Priorities in the Prince Charles Community (Segmented) Please use caution in interpreting these results, as due to small sample size, differences are not considered to be statistically significant. Parking Enforcement Low (1 2) Moderate (3) High (4 5) NR/DK Commuters (n=27) Area residents (n=55) Employees in area (n=17) Business owners/operators (n=11) Customers of businesses (n=16) Property owners (n=38) Resident of adjacent community (n=6) Assc./Org. (n=2) Table displays responses in percentages Mean 39
40 Priorities in the Prince Charles Community (Segmented) Please use caution in interpreting these results, as due to small sample size, differences are not considered to be statistically significant. Improved Street Lighting Low (1 2) Moderate (3) High (4 5) NR/DK Commuters (n=27) Area residents (n=55) Employees in area (n=17) Business owners/operators (n=11) Customers of businesses (n=16) Property owners (n=38) Resident of adjacent community (n=6) Assc./Org. (n=2) Table displays responses in percentages Mean 40
41 Comfort Levels to Traffic Changing Measures For each of the following potential scenarios, please indicate how comfortable you would be with the change: n=82 Potential Scenarios Changes that would slow the free flow of traffic within the neighbourhood Changes that would remove parking in targeted areas (i.e. 3 4 stalls per location) Changes that would make it less convenient for you to enter or leave the neighbourhood Changes that would close a neighbourhood entrance exit you use Low Comfort (1 2) Moderate Comfort (3) High Comfort (4 5) No Response/ Don t Know Mean 27% 11% 60% 2% % 20% 33% 5% % 15% 26% 2% % 11% 23% 2%
42 Comfort Levels to Traffic Changing Measures (Segmented) The following slides provide comfort levels for traffic management strategies broken down by respondents connection to the community. Please use caution in interpreting these results, as due to small sample size, differences are not considered to be statistically significant. Slow the free flow of traffic within the neighbourhood Low (1 2) Moderate (3) High (4 5) NR/DK Commuters (n=27) Area residents (n=55) Employees in area (n=17) Business owners/operators (n=11) Customers of businesses (n=16) Property owners (n=38) Resident of adjacent community (n=6) Assc./Org. (n=2) Table displays responses in percentages Mean 42
43 Comfort Levels to Traffic Changing Measures (Segmented) Please use caution in interpreting these results, as due to small sample size, differences are not considered to be statistically significant. Remove parking in targeted areas Low (1 2) Moderate (3) High (4 5) NR/DK Commuters (n=27) Area residents (n=55) Employees in area (n=17) Business owners/operators (n=11) Customers of businesses (n=16) Property owners (n=38) Resident of adjacent community (n=6) Assc./Org. (n=2) Table displays responses in percentages Mean 43
44 Comfort Levels to Traffic Changing Measures (Segmented) Please use caution in interpreting these results, as due to small sample size, differences are not considered to be statistically significant. Less convenience for entering or leaving the neighbourhood Low (1 2) Moderate (3) High (4 5) NR/DK Commuters (n=27) Area residents (n=55) Employees in area (n=17) Business owners/operators (n=11) Customers of businesses (n=16) Property owners (n=38) Resident of adjacent community (n=6) Assc./Org. (n=2) Table displays responses in percentages Mean 44
45 Comfort Levels to Traffic Changing Measures (Segmented) Please use caution in interpreting these results, as due to small sample size, differences are not considered to be statistically significant. Closure of neighbourhood entrances & exits Low (1 2) Moderate (3) High (4 5) NR/DK Commuters (n=27) Area residents (n=55) Employees in area (n=17) Business owners/operators (n=11) Customers of businesses (n=16) Property owners (n=38) Resident of adjacent community (n=6) Assc./Org. (n=2) Table displays responses in percentages Mean 45
46 Traffic Volumes Safety In the areas of traffic volume safety, what other priorities do you think should be addressed in the Prince Charles community? Percent of Respondents (n=82) Speeding issues/speed limits 11 Traffic volume/congestion/high traffic flow 9 Wider streets/roads/upgrading roads 6 Pedestrian safety (ex. lights/crosswalks, etc.) 6 Accessibility of streets/roads 5 Street lighting 4 Uncontrolled intersections 4 Poor road conditions (potholes, in need of repair, etc.) 4 Snow/ice removal (on roads, sidewalks, etc.) 4 Parking availability/issues 4 *Multiple responses 46
47 Traffic Volumes Safety In the areas of traffic volume safety, what other priorities do you think should be addressed in the Prince Charles community? (cont d) Percent of Respondents (n=82) Bicycle lanes 2 Property/l use zoning 2 Children s safety in residential areas 2 Garbage/litter on streets 2 Sidewalks 2 Flooding/water/sewer drainage 2 Police enforcement of traffic related infractions/violations 2 Others (single mention) 4 Nothing else/no other priorities 5 No response/don t know 40 *Multiple responses 47
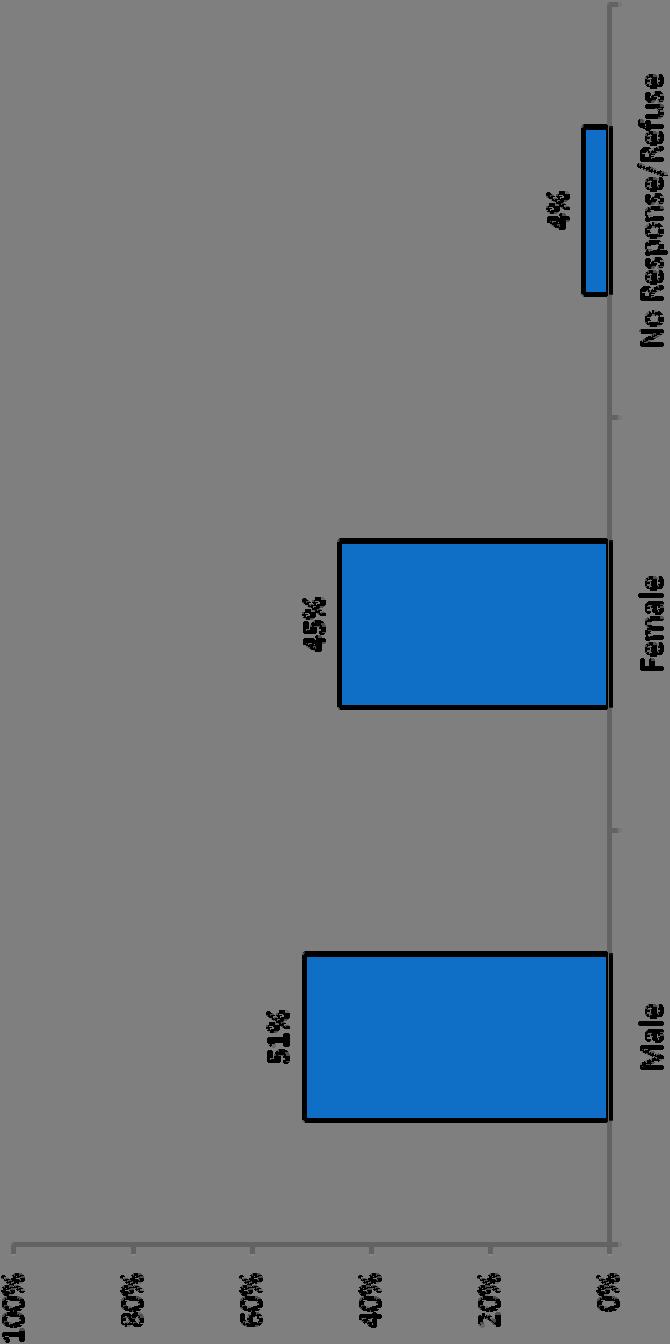
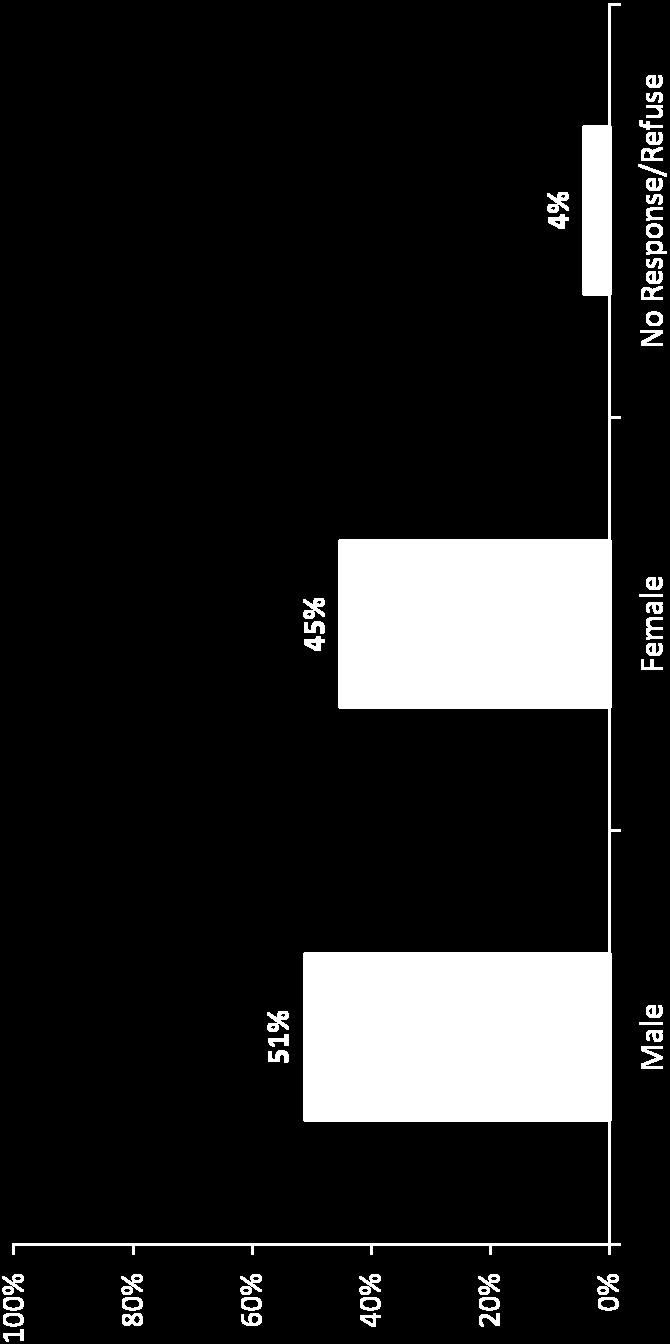
48 Demographics n=82 Gender 48
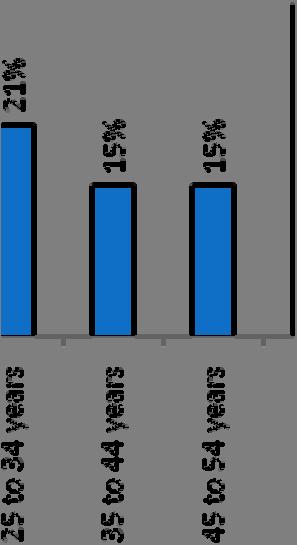
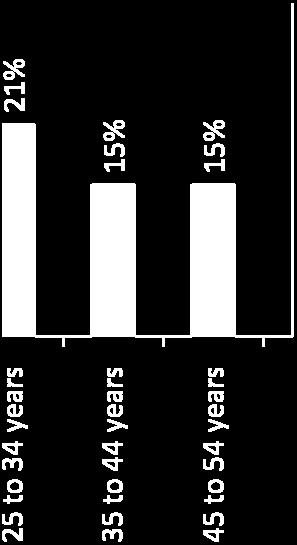

49 Demographics n=82 Age Mean = 49.4 years 49


50 Demographics Type of Dwelling n=82 * Respondents were asked to specify 50
51 Demographics Including yourself, how many people in each of the following age groups live in your household?* n=71 excludes No Response/Don t Know *Multiple responses. Graph shows those living with one or more person in each age group 51


52 Demographics n=82 Do you own or rent your home? 52
53 Demographics (Segmented) The following table displays a breakdown by renters versus owners Please use caution in interpreting these results, as due to small sample size, differences are not considered to be statistically significant. Commuter (n=27) Resident (n=55) Employee (n=17) Buss. (n=11) Customer (n=16) Property Owner (n=38) Adjacent Resident (n=6) Org/Assc. Rep. (n=2) Own Rent Don t Know/No Response Table displays responses in percentages


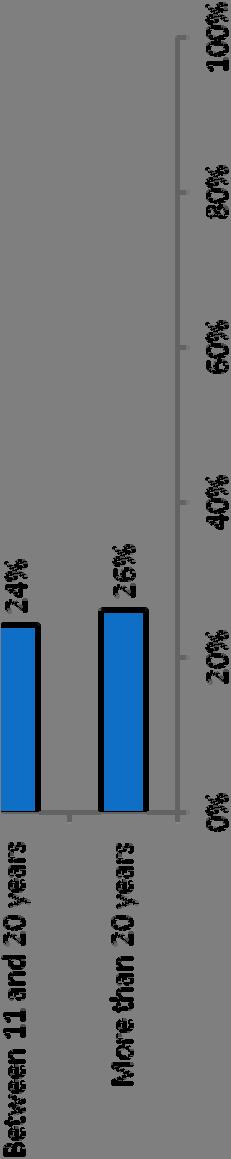
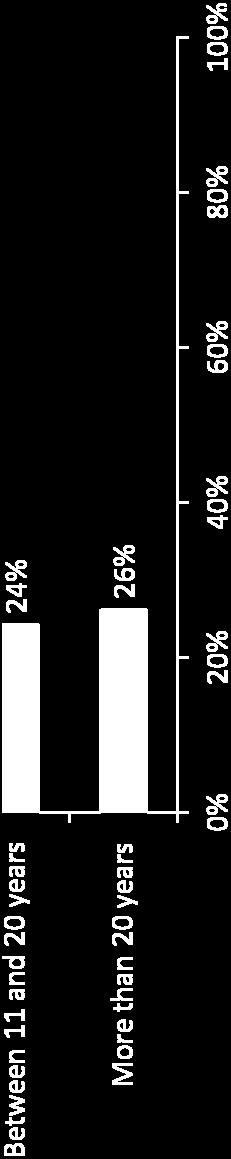
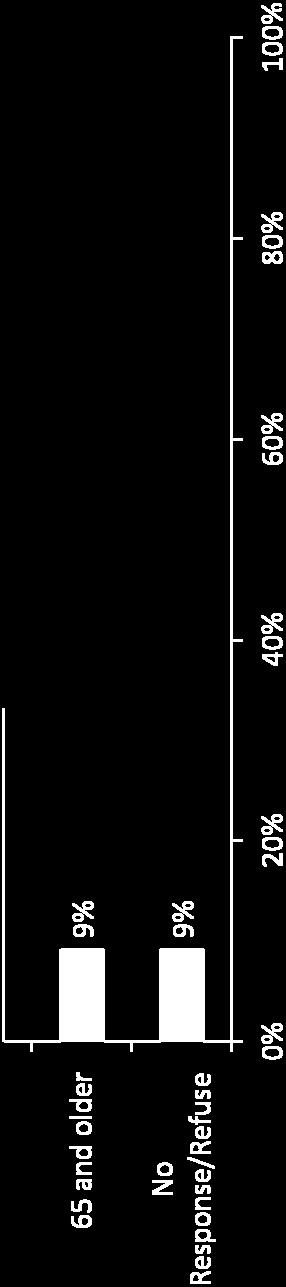
54 Demographics How many years have you lived in the Prince Charles Community? n=55 Base: Respondents who are area residents Mean = 15.5 years 54
55 Demographics How many years have you owned or operated a business in the Prince Charles community?* Number of years Base: Respondents who are area owners/operators *Small sample size please use caution when interpreting these results Mean = 16.8 years Number of Respondents (n=11) <1 year 1 3 years 1 4 years 2 9 years 2 12 years 1 18 years 1 25 years 1 40 years 1 61 years 1 55


56 Demographics How many years have you owned property in the Prince Charles community? n=38 Base: Respondents who are area property owners Mean = 17.6 years Mean = 17.6 years 56
122 Avenue: 107 Street to Fort Road
 : 107 Street to Fort Road November 24, 2015 4:30 8:00 p.m. Meeting Purpose Summarize project work completed to date Share results of public input from Phase 1 Share the draft concept plan and proposed
Section 2: Importance-Satisfaction Analysis
 Section 2: Importance- Analysis ETC Institute (2009) 35 Overview Importance- Analysis Blue Springs, MO Today, city officials have limited resources which need to be targeted to activities that are of the
Sherwood Drive Traffic Circle
 Strathcona County Sherwood Drive Traffic Circle Online Survey Results April 7, 215 I. Executive Summary The Sherwood Drive Traffic Circle Survey was administered in March 215. In total, 2,263 residents
CLOSED. The draft concept design has been broken down into 5 categories for the purpose of this survey:
 Old Strathcona s neighbourhood renewal process is now at the draft concept design phase. Over the last several months, the city has been gathering local knowledge and resident input that has been used
Public Information Centre
 WELCOME Public Information Centre Father Tobin Road Lougheed Middle School - Library Wednesday November 7, 2012 7:00 p.m.to 9:00 p.m. Please sign in Neighbourhood Traffic Calming Guide Background The City
Southside Road. Prepared for: City of St. John s Police & Traffic Committee. Prepared by: City of St. John s Traffic Division
 Southside Road Prepared for: City of St. John s Police & Traffic Committee Prepared by: City of St. John s Traffic Division January 2007 Southside Road - Traffic Report Page 1 of 9 BACKGROUND: th At the
Seattle Department of Transportation (SDOT) Preliminary Responses to Madison-Miller Community List of Site-Specific Concerns
 Preliminary Responses to Madison-Miller Community List of Site-Specific Concerns") Seattle Department of Transportation (SDOT) Preliminary Responses to Madison-Miller Community List of Site-Specific Concerns Background In July 2002 SDOT staff met with a small group of community residents
Seattle Department of Transportation (SDOT) Preliminary Responses to Madison-Miller Community List of Site-Specific Concerns Background In July 2002 SDOT staff met with a small group of community residents
WILMAPCO Public Opinion Survey Summary of Results
 Wilmington Area Planning Council WILMAPCO Public Opinion Survey Summary of Results Prepared by: 2955 Valmont Road, Suite 300 Boulder, Colorado 80301 t: 303-444-7863 f: 303-444-1145 www.n-r-c.com Table
TRAFFIC CALMING GUIDE FOR TORONTO CITY OF TORONTO TRANSPORTATION SERVICES DIVISION
 TRAFFIC CALMING GUIDE FOR TORONTO CITY OF TORONTO TRANSPORTATION SERVICES DIVISION CITY OF TORONTO TRANSPORTATION SERVICES DIVISION 2016 TRAFFIC CALMING GUIDE FOR TORONTO TABLE OF CONTENTS Introduction
Driverless Vehicles Potential Influence on Bicyclist Facility Preferences
 Driverless Vehicles Potential Influence on Bicyclist Facility Preferences MICHAEL BLAU, MCRP, LCI O T E C O C T O B E R 2 6, 2 0 1 6 S E S S I O N # 8 2 - E V A L U AT I N G T H E P E R F O R M A N C E
NM-POLICY 1: Improve service levels, participation, and options for non-motorized transportation modes throughout the County.
 Transportation PRINCE WILLIAM COUNTY 2008 COMPREHENSIVE PLAN NON-MOTORIZED PLAN CONTENTS Goals, Policies, and Action Strategies Table 4 (Bike Facility Classifications and Descriptions) Table 5 (Bike Facility
U.S. Bicycling Participation Study
 U.S. Bicycling Participation Study Report of findings from the 2016 survey Conducted by Corona Insights Commissioned by PeopleForBikes Released July 2017 Table of Contents Background and Objectives 3 Research
WELCOME Public Information Centre
 WELCOME Public Information Centre Fernforest Drive Brampton Soccer Centre Community Room #2 Tuesday January 19, 2016 6:30 p.m.to 9:00 p.m. Please sign in Neighbourhood Traffic Calming Guide Background
February 2018 Mixed Topic Survey Results
 February 2018 Mixed Topic Survey Results BACKGROUND The Edmonton Insight Community is a panel of over 7,000 Edmontonians (February 2018) who provide feedback to help City of Edmonton Council and administration
DKS & WASHINGTON COUNTY Washington County Transportation Survey
 PREPARED FOR: DKS & WASHINGTON COUNTY Washington County Transportation Survey April 2013 PREPARED BY: DHM RESEARCH (503) 220-0575 239 NW 13 th Ave., #205, Portland, OR 97209 www.dhmresearch.com 1 INTRODUCTION
2011 Countywide Attitudinal and Awareness Survey Results
 2011 Countywide Attitudinal and Awareness Survey Results Purpose of Study Establish baseline for measuring future performance Identify perceptions about transportation system, issues, priorities Assess
Transportation Issues Poll for New York City
 2016-17 Transportation Issues Poll for New York City 82% support Vision Zero and reducing traffic deaths 72% on average, support more street space for children to play, protected bike lanes and other safety
TriMet Attitude & Awareness Survey. November 2016
 TriMet Attitude & Awareness Survey November 2016 Methodology Telephone survey of 800 residents in TriMet service district Clackamas County N=183 Multnomah County N=369 Washington County N=248 Conducted
Byron Avenue. Public Meeting. Thursday June 16, Traffic Calming Design Sherbourne Road to Island Park Drive
 Byron Avenue Traffic Calming Design Sherbourne Road to Island Park Drive Public Meeting Thursday June 16, 2016 Our Lady of Fatima Parish 153 Woodroffe Avenue 6 9pm 1 Project Summary Area Projects Background
Edenbrook Hill Drive Traffic Calming Study
 WELCOME Public Information Centre Edenbrook Hill Drive Traffic Calming Study Fletchers Meadow Secondary School Wednesday January 20, 2016 6:30 p.m.to 9:00 p.m. Please sign in Neighbourhood Traffic Calming
FLETCHER AVENUE PEDESTRIAN AND BICYCLIST BEHAVIOR CHANGE FORMATIVE RESEARCH PROJECT
 FLETCHER AVENUE PEDESTRIAN AND BICYCLIST BEHAVIOR CHANGE FORMATIVE RESEARCH PROJECT EXTENT OF CHANGES IN PEDESTRIAN AND BICYCLIST ATTITUDES AND BEHAVIORS DIRECTLY AFTER A COMPLETE STREETS PROJECT IN FLORIDA
BETHEL ROAD AND SEDGWICK ROAD CORRIDOR STUDY
 DRAFT PLAN City Council Meeting August 14, 2017 STUDY AREA Sedgwick Corridor State Route 160, principal arterial with Class 3 access management designation, commuter and freight route, connection to SR
C/CAG. Sunnybrae Elementary School Walking and Bicycling Audit. San Mateo-Foster City School District JUNE 2013
 Sunnybrae Elementary School Walking and Bicycling Audit JUNE 2013 San Mateo-Foster City School District C/CAG City/County Association of Governments of San Mateo County SUNNYBRAE ELEMENTARY SCHOOL WALKING
Engagement Summary: Round 1
 Engagement Summary: Round 1 June 21, 2018 REPORT FOR: City of Courtenay 830 Cliff Avenue Courtenay, BC V9N 2J7 PREPARED BY: Urban Systems Ltd. 550 1090 Home Street Vancouver, BC V6B 2W9 ALONG WITH: Kathleen
El Paso County 2040 Major Transportation Corridors Plan
 El Paso County 2040 Major Transportation Corridors Plan Connect-our-County Online Transportation User Survey Preliminary Results June 24, 2010 Years of Residence 2. How many years have you LIVED HERE?
5 Transit & Traffic. Overview
 5 Transit & Traffic Overview Montgomery Place s roadways and overall traffic circulation are unique in the city due to the narrow streets and avenues with boulevards; however, no sidewalks or curbs in
City of White Rock. Strategic Transportation Plan. May 16, 2005
 City of White Rock Strategic Transportation Plan May 16, 2005 1 Outline Scope of Plan & Approach Council input and direction Key issues based on existing conditions Range of strategies to consider? Next
Ormsby Place Traffic Calming Pilot Project
 About the project Traffic shortcutting is an issue in communities, with residents expressing concerns about safety and their quality of life. City Council has heard these concerns, and in response, has
CONNECTING PEOPLE TO PLACES
 CONNECTING PEOPLE TO PLACES 82 EAST BENCH MASTER PLAN 07 Introduction The East Bench transportation system is a collection of slow moving, treelined residential streets and major arteries that are the
AAMPO Regional Transportation Attitude Survey
 AAMPO Regional Transportation Attitude Survey Traditionally Underserved Populations helping organizations make better decisions since 1982 2018 Submitted to the AAMPO By: ETC Institute 725 W. Frontier
CITY OF OTTAWA ROADWAY MODIFICATION APPROVAL UNDER DELEGATED AUTHORITY
 RMA-2015-ATM-038 CITY OF OTTAWA ROADWAY MODIFICATION APPROVAL UNDER DELEGATED AUTHORITY DATE: April 22, 2015 SUBJECT Approval of Roadway Modifications Recommended through an Area Traffic Management Study
SETTINGS AND OPPORTUNITIES MOBILITY & ACCESS
 7 mobility & access how do people use el camino what is it like to drive on el camino/to park along el camino what is the pedestrian experience like what is the role of transit along the corridor what
City of Winston-Salem 2006 Citizen Satisfaction Survey Report
 City of Winston-Salem 2006 Citizen Satisfaction Survey Report Methodology The City of Winston-Salem s 2006 Citizen Satisfaction Survey was conducted from October 6 th through October 20 th of 2006. The
Leaside Traffic Calming Plan Update. Community Meeting 2 November 22, :00 PM
 Leaside Traffic Calming Plan Update Community Meeting 2 November 22, 2016 7:00 PM Welcome and Study Background Welcome and Thank You! Study background from LPOA s perspective: Why are we doing this study?
Public Opinion about Transportation Issues in Northern Virginia
 Public Opinion about Transportation Issues in Northern Virginia Research and Strategy Presented to: The Northern Virginia Transportation Authority July 28, 2005 Research Objectives 1. Travel Patterns*
Ottewell Traffic Shortcutting Pilot Project
 About the project Traffic shortcutting is an issue in communities, with residents expressing concerns about safety and their quality of life. City Council has heard these concerns, and in response, has
Baseline Survey of New Zealanders' Attitudes and Behaviours towards Cycling in Urban Settings
 Baseline Survey of New Zealanders' Attitudes and Behaviours towards Cycling in Urban Settings Highlights 67% of urban New Zealanders, 18 years of age or more own or have access to a bicycle that is in
PEDESTRIAN COLLISIONS IN LOS ANGELES 1994 through 2000
 PEDESTRIAN COLLISIONS IN LOS ANGELES 1994 through 2000 City of Los Angeles Department of Transportation Gloria Jeff, General Manager March, 2006 This document printed with grant funds from the California
Safe Routes to School Action Plan Aberdeen, Idaho
 Background Aberdeen, Idaho is a largely agricultural community of nearly 2,000 people and is located in the southeast portion of the state on the western edge of American Falls Reservoir. The community
Draft North Industrial Area-Wide Traffic Plan
 Summary of North Industrial and Hudson Bay Industrial Recommended Improvements Table 1. Summary of s Item Location 1 2 3 4 5 6 7 8 9 10 11 12 Millar Ave north of 51st St Super 8 Motel back lane 400 Block
Plant City Walk-Bike Plan
 Plant City Walk-Bike Plan Plant City Commute Mode Share 2.2% 1.4% 2.9% Drove alone 10.2% Carpooled Public transportation (0.1%) Walked Used a Bike (0.4%) 82.9% Taxicab, motorcycle, or other means Worked
5. RUNNINGWAY GUIDELINES
 5. RUNNINGWAY GUIDELINES These guidelines should be considered collectively when making runningway decisions. A runningway is the linear component of the transit system that forms the right-of-way reserved
PRIORITIES RESULTS YOUR PRIORITIES FOR BRIDGEPORT 5% 4% 13% RESIDENTIAL CHOICES TRAILS & PARKS
 Community Visioning Open House The Community Visioning Open House was held on January, 31st 2018 at Harrisburg Area Community College (HACC), Lancaster Campus. Approximately 80 people attended this Open
PERCEPTIONS AND ATTITUDES OF URBAN UTILITY CYCLISTS A CASE STUDY IN A BRITISH BUILT ENVIRONMENT
 Cycling and Society Symposium 2014 Theme A - Demographics Northumbria University at Newcastle Monday 15 th September 2014, Civic Centre PERCEPTIONS AND ATTITUDES OF URBAN UTILITY CYCLISTS A CASE STUDY
Appendix E: Bike Crash Analysis ( )
") Appendix E: Bike Crash Analysis (2009-2012) Davis Bicycle Crashes Analysis 2009-2012 December 2013 Ride Walk Davis Active Transportation Program City of Davis December 2013 Prepared by: Jimmy Fong Active
Appendix E: Bike Crash Analysis (2009-2012) Davis Bicycle Crashes Analysis 2009-2012 December 2013 Ride Walk Davis Active Transportation Program City of Davis December 2013 Prepared by: Jimmy Fong Active
Public Works Committee Meeting Richard E. Mastrangelo Council Chamber November 20, 2017
 Public Works Committee Meeting Richard E. Mastrangelo Council Chamber November 20, 2017 Purpose of Meeting Why are we here? Project Recap/Updates Project Limits/Segments Road Diet Concept Lessons Learned
Executive Summary. TUCSON TRANSIT ON BOARD ORIGIN AND DESTINATION SURVEY Conducted October City of Tucson Department of Transportation
 Executive Summary TUCSON TRANSIT ON BOARD ORIGIN AND DESTINATION SURVEY Conducted October 2004 Prepared for: City of Tucson Department of Transportation May 2005 TUCSON TRANSIT ON BOARD ORIGIN AND DESTINATION
Rider Satisfaction Survey Total Market 2006
 Rider Satisfaction Survey Total Market 2006 Prepared For: Valley Metro Fall 2006 2702 North 44 th Street Suite 100-A. Phoenix, Arizona 85008 602-707-0050 www.westgroupresearch.com Valley Metro 2006 Rider
Pre-Plan Consultation Summary
 Transportation Master Plan Pre-Plan Consultation Summary Thursday July 7, 2011 Presentation ti Outline Consultation Objectives Scope of Consultation Who Responded? What did we hear? How well did we connect?
Tonight is for you. Learn everything you can. Share all your ideas.
 Strathcona Neighbourhood Renewal Draft Concept Design Tonight is for you. Learn everything you can. Share all your ideas. What is Neighbourhood Renewal? Creating a design with you for your neighbourhood.
Effective Pedestrian & Bicycle Safety Enforcement
 Effective Pedestrian & Bicycle Safety Enforcement October 20, 2011 George Branyan Pedestrian Program Coordinator District Department of Transportation Increasingly multi-modal region Change in Daily Trip
City of Elizabeth City Neighborhood Traffic Calming Policy and Guidelines
 City of Elizabeth City Neighborhood Traffic Calming Policy and Guidelines I. Purpose: The City of Elizabeth City is committed to ensure the overall safety and livability of residential neighborhoods. One
INTRODUCTION. Specifically, the objectives are to:
 INTRODUCTION The River to Sea Transportation Planning Organization (TPO) conducts the Tell the TPO Transportation Trends Survey to better understand the transportation preferences and priorities for the
CYCLING STRATEGY RESEARCH PUBLIC TELEPHONE SURVEY JANUARY HarGroup Management Consultants
 CYCLING STRATEGY RESEARCH PUBLIC TELEPHONE SURVEY JANUARY 2011 HarGroup Management Consultants CYCLING STRATEGY RESEARCH PUBLIC TELEPHONE SURVEY Submitted to The City of Calgary By HarGroup Management
Breaking the Cycle of Automobile Dependency
 201 City Centre Dr., Suite 800 - Mississauga, Ontario - L5B 2T4 - (905) 896 5941 Breaking the Cycle of Automobile Dependency An Analysis of Meadowvale Business Park in the City of Mississauga Executive
METROPOLITAN TRANSPORTATION PLAN OUTREACH: INTERACTIVE MAP SUMMARY REPORT- 10/03/14
 METROPOLITAN TRANSPORTATION PLAN OUTREACH: INTERACTIVE MAP SUMMARY REPORT- 10/03/14 INTRODUCTION This document summarizes the results of the online interactive mapping exercise implemented by MIG for the
2014/2015 BIKE ROUTE PLAN 83 AVENUE PROTECTED BIKE LANE
 About the Project 2014/2015 BIKE ROUTE PLAN The City of Edmonton is planning a major bike route on the south side of Edmonton. This bike route is one part of a plan to provide citizens with transportation
DEPARTMENT OF ENVIRONMENTAL SERVICES. North Harrison Street (Lee Highway to Little Falls Road) Comparative Analysis. Prepared for:
 Comparative Analysis. Prepared for:") DEPARTMENT OF ENVIRONMENTAL SERVICES North Harrison Street (Lee Highway to Little Falls Road) Comparative Analysis Prepared for: Arlington County Department of Environmental Services 2100 Clarendon Boulevard,
DEPARTMENT OF ENVIRONMENTAL SERVICES North Harrison Street (Lee Highway to Little Falls Road) Comparative Analysis Prepared for: Arlington County Department of Environmental Services 2100 Clarendon Boulevard,
WELCOME Mission-Geneva Transportation Study
 WELCOME Mission-Geneva Transportation Study Study Process and Schedule 2005 2006 Oct Nov Dec Jan Feb Mar Apr May Jun Jul Aug Sept Oct Task 2 Develop Outreach Plan Task 3 Document Existing Conditions/ Prioritize
complete streets design and construction standards public primer City of Edmonton
 complete streets design and construction standards public primer City of Edmonton introduction Complete Streets are streets for everyone: people who walk, wheel, bike, take transit, or drive. They are
Major Bike Routes 102 Avenue Workshop April 21, 2015
 Major Bike Routes 102 Avenue Workshop April 21, 2015 Our Purpose Today Provide context on how Major Bike Routes fit into Edmonton s future Share information on what we heard in our last phase, and how
9/21/2016 VIA . RE: The Knot (DR16-270)
") 9/21/2016 VIA EMAIL Garrett Norman, Assistant Planner City of Sacramento Community Development Department 300 Richards Boulevard, 3 rd Floor Sacramento, CA 95811 RE: The Knot (DR16-270) Dear Mr. Norman:
9/21/2016 VIA EMAIL Garrett Norman, Assistant Planner City of Sacramento Community Development Department 300 Richards Boulevard, 3 rd Floor Sacramento, CA 95811 RE: The Knot (DR16-270) Dear Mr. Norman:
TABLE OF CONTENTS. Executive Summary
 Executive Summary Background... ES-1 Pedestrian Network... ES-2 Bikeway Network... ES-2 Collision History... ES-2 Public Input... ES-4 Conclusions and Recommendations... ES-4 1. Introduction and Setting
About the Studio. Edward J. Bloustein School of Planning and Public Policy - Rutgers University
 About the Studio Edward J. Bloustein School of Planning and Public Policy - Rutgers University Purpose of studio: Help City of Bayonne apply for Safe Routes to School (SRTS) funding by producing a School
Master Transportation Plan Bicycle Element Survey
 September 28, 2017 Master Transportation Plan Bicycle Element Survey PAGE 1 Who did we reach? 1206 55% 89% 62% Respondents. 245 intercepts. Have never attended an Arlington County public meeting Would
Pedestrian Survey Report
 Pedestrian Survey Report The City of Albany conducted a Pedestrian Survey in 2007 with the purpose of identifying resident s concerns about barriers to walking and accessibility in the City. The survey
CITY OF WEST KELOWNA COUNCIL POLICY MANUAL
 CITY OF WEST KELOWNA COUNCIL POLICY MANUAL Page 1 of 7 DEPARTMENT: Engineering Services SUBJECT: Traffic Calming Policy (Revised June 6, 2017) Policy Statement: The provision of traffic calming measures
Investment in Active Transport Survey
 Investment in Active Transport Survey KEY FINDINGS 3 METHODOLOGY 7 CYCLING INFRASTRUCTURE 8 Riding a bike 9 Reasons for riding a bike 9 Mainly ride on 10 Comfortable riding on 10 Rating of cycling infrastructure
Malvern Borough Local Traffic Calming
 Malvern Borough Local Traffic Calming Purpose: To address speeding and high volume cut-through traffic on Malvern Borough owned residential streets. Traffic Calming Measures: Traffic Calming Measures (TCM)
2014/2015 BIKE ROUTE PLAN 83 AVENUE PROTECTED BIKE LANE
 About the Project The City of Edmonton is planning a major bike route on the southside of Edmonton. The Strathcona Bike Route will connect the communities of Strathcona, Garneau and the University area,
Mineral Avenue Corridor Assessment. ITE 2017 Western District Annual Meeting San Diego, CA June 21 st
 Mineral Avenue Corridor Assessment ITE 2017 Western District Annual Meeting San Diego, CA June 21 st Biography - Aaron Heumann, PE, PTOE Currently City of Littleton Transportation Engineering Manager 24
Appendix C. TRAFFIC CALMING PROGRAM TOOLBOX
 Appendix C. TRAFFIC CALMING PROGRAM TOOLBOX PHASE I...2 Do Not Enter Sign...3 One-Way Sign...4 Turn Prohibition...5 Pavement Markings...6 Speed Monitoring Trailer...7 Neighborhood Speed Watch...8 Police
Saskatchewan Drive Roadway Rehabilitation and Shared-Use Path Widening
 Saskatchewan Drive Roadway Rehabilitation and Shared-Use Path Widening We are here today to present the draft plan for the Saskatchewan Drive Roadway Rehabilitation and Shared-Use Path Widening project
ABOUT THIS STUDY The Tenderloin-Little Saigon Community-Based Transportation Plan
 ABOUT THIS STUDY The Tenderloin-Little Saigon Community-Based Transportation Plan The Greater Tenderloin Community Study Milestones October Community based organizations (Tenderloin Housing Clinic and
Community & Transportation Preferences Survey
 Community & Transportation Preferences Survey Webinar: August 5, 2015 Hugh Morris, AICP, LEED Realtor.org Jennifer Dill, Ph.D. trec.pdx.edu 1 Introduction National Association of Realtors Over 1,000,000
Transportation 2040 Update: Eudora Public Input As of June 1, 2017
 Transportation 2040 Update: Eudora Public Input As of June 1, 2017 Overview... 1 Survey Responses... 2 Overview The Lawrence Douglas County Metropolitan Planning Organization (MPO) is updating our long
Summary of Comments Public Meeting: Marietta Street Resurfacing Project Atlanta Contemporary August 29, 2017 / 6:00 pm to 8:00 pm
 Renew Atlanta hosted a public meeting to discuss the Marietta Street Resurfacing project at. Councilmember Cleta Winslow attended the public meeting, where over seventy (70) citizens to include representatives
6. Transport GAUTENG CITY-REGION OBSERVATORY QUALITY OF LIFE SURVEY 2015 LANDSCAPES IN TRANSITION
 GAUTENG CITY-REGION OBSERVATORY QUALITY OF LIFE SURVEY 1 6. Transport Christina Culwick, christina.culwick@gcro.ac.za, 011 717 7296 Dr Siân Butcher, sian.butcher@gcro.ac.za, 011 717 7696 Samy Katumba,
Duwamish Way-finding and CTR Report
 V. North Tukwila When the North Tukwila Manufacturing and Industrial Center was designated in 1992 as part of the region s land use and transportation plan, the plan called for the area to set a light-rail
Land Use and Transportation Town Hall September 17, 2018
 Land Use and Transportation Town Hall September 17, 2018 Welcome! Tonight s Agenda: 7:00-7:30 OVERVIEW PRESENTATIONS 7:30-8:15 BREAKOUT SESSIONS 8:15 - End TOWN HALL CITIZEN S TIME Purpose of Tonight s
FEDERAL HIGHWAY ADMINISTRATION APPLICATION
 FEDERAL HIGHWAY ADMINISTRATION APPLICATION REQUEST FOR PERMISSION TO EXPERIMENT WITH A BICYCLE BOX INTERSECTION TREATMENT Submitted by: City of Columbus Department of Public Service Date: June 26, 2009
Uptown West Neighbourhood Transportation Study
 Uptown West Neighbourhood Transportation Study Public Open House #2 Information for Review As we move towards the second public open house on May 6, 2014, information on the alternative solutions that
Community & Transportation Preferences Survey U.S. Metro Areas, 2015 July 23, 2015
 Community & Transportation Preferences Survey U.S. Metro Areas, 2015 July 23, 2015 Realtor.org trec.pdx.edu 1 Highlights: Generation gaps in everyday travel Only 71% of Millennials like driving (the lowest
Moving Cambridge. City of Cambridge Transportation Master Plan Public Consultation Centre. March 7, :00 8:00 PM.
 City of Cambridge Transportation Master Plan Public Consultation Centre March 7, 2018 5:00 8:00 PM Region of Waterloo City of Cambridge Transportation Master Plan Public Consultation Centre March 7, 2018
North Buckhead Civic Association. Recommendations For Wieuca Road
 North Buckhead Civic Association Recommendations For Wieuca Road October 7, 2009 Blank Page Page 2 of 16 Table of Contents 1. BACKGROUND 4 2. TRAFFIC SIGNALS AND ALL WAY STOPS 5 3. SPEED LIMITS AND SPEED
Alternative Traffic Calming Methods
 Alternative Traffic Calming Methods In-street Pedestrian Crossing Sign Cost: approximately $300 per sign not including the installation cost Advantages of in-street pedestrian crossing signs 1. Typically
Today. Develop Plans. Public Listening Session
 Welcome! 1. Share Existing Conditions and Data 2. Share Details of Proposed Project 3. Gather Feedback from Public M Ju ee ly tin 17 g D th a, 2 te 01 : 7 Meeting Purpose and 26th Street Project Timeline
Bellevue Downtown Association Downtown Bike Series
 Bellevue Downtown Association Downtown Bike Series Meeting 2 Franz Loewenherz Andreas Piller Kyle Potuzak Chris Long October 26, 2017 Today s Agenda: 1) Meeting Purpose 2) 9/28 Meeting Recap 3) Candidate
EXECUTIVE SUMMARY. Vision
 Vision Walking and bicycling in Salt Lake City will be safe, convenient, comfortable, and viable transportation options that connect people to places, foster recreational and economic development opportunities,
More than 1,750,000 Persons Surveyed for more than 500 cities in 48 States
 City of Rolla 2013 DirectionFinder Survey Findings Presented db by ETC Institute May 2013 1 ETC Institute AN National lleader in Market tresearch for Local Governmental Organizations helping city and county
Public Opinion about Transportation Issues in Northern Virginia A Report Prepared for the:
 Public Opinion about Transportation Issues in Northern Virginia A Report Prepared for the: Northern Virginia Transportation Authority By QSA Research & Strategy October 13, 2005 TABLE OF CONTENTS Page
2018 Santa Monica Resident Satisfaction Survey. November 2018
 2018 Santa Monica Resident Satisfaction Survey November 2018 Methodology Address-based sample Survey invitations mailed to 8,000 randomly selected residential addresses in Santa Monica Website/Phone based
Safer Cycling: How the City of Vancouver is Proactively Improving Cycling Safety
 Safer Cycling: How the City of Vancouver is Proactively Improving Cycling Safety Brian Patterson, MCIP, RPP Urban Systems 2015 Canadian Association of Road Safety Professionals (CARSP) Conference Session
Corporate. Report COUNCIL DATE: May 25, 1998 NO: R1500 REGULAR COUNCIL. TO: Mayor & Council DATE: April 27, 1998
 R1500 : Traffic Safety at 25 Avenue and 128 Street Intersection Corporate NO: R1500 Report COUNCIL DATE: May 25, 1998 REGULAR COUNCIL TO: Mayor & Council DATE: April 27, 1998 FROM: General Manager, Engineering
Eliminate on-street parking where it will allow for a dedicated bus only lane %
 Traffic Dashboard Priorities Survey Responses Introduction 1) Are you familiar with bus rapid transit (BRT)? a. No, BRT is new to me. 597 23.5% b. I ve heard of BRT, but I don t know much about it. 1,136
Seattle Department of Transportation. Web Panel Survey February 2018
 Seattle Department of Transportation Web Panel Survey February 2018 Methodology Web panel survey of residents age 18+ in Seattle, Washington Conducted February 13-24, 2018 A total of 601 interviews were
WALKABILITY CHECKLIST How walkable is your community?
 WALKABILITY CHECKLIST How walkable is your community? Everyone benefits from walking and other forms of active transportation. These benefits include: improved fitness, cleaner air, reduced risks of certain
Controlled. Semi-Controlled PAGE 01 CHAPTER 12 INTERSECTIONS
 PAGE 01 CHAPTER 12 INTERSECTIONS You will cross many intersections while driving. Intersections are especially dangerous because vehicles are crossing each other s driving path. Many crashes happen at
HENDERSON DEVELOPMENT 213, 217, 221, 221 ½, 223 HENDERSON AVENUE and 65 TEMPLETON STREET OTTAWA, ONTARIO TRANSPORTATION OVERVIEW.
 HENDERSON DEVELOPMENT 213, 217, 221, 221 ½, 223 HENDERSON AVENUE and 65 TEMPLETON STREET OTTAWA, ONTARIO TRANSPORTATION OVERVIEW Prepared for: 2294170 Ontario Inc. February 2, 2017 117-652 Report_1.doc
YELLOWHEAD TRAIL / 149 STREET INTERCHANGE
 YELLOWHEAD TRAIL / 149 STREET INTERCHANGE WELCOME Today we are introducing the concept planning project for a new gradeseparated interchange at Yellowhead Trail and 149 Street PURPOSE Provide information