The Community Path Extension
|
|
|
- Emil Little
- 6 years ago
- Views:
Transcription

1 June 2013 The Community Path Extension Data Metrics and Talking Points Metropolitan Area Planning Council MAPC.org
2 Acknowledgements The work that provided the basis for this publication was supported by funding under an award with the U.S. Department of Housing and Urban Development. The substance and findings of the work are dedicated to the public. The author and publisher are solely responsible for the accuracy of the statements and interpretations contained in this publication. Such interpretations do not necessarily reflect the views of the Government. MAPC would also like to thank the Metro Boston Consortium for Sustainable Communities for making this publication possible. This report was produced by MAPC. Writing and research contributions were made by the following staff members: Eric Halvorsen, Principal Author and Transportation Planner Meghna Dutta, Research Analyst Chris Kuschel, Public Health Planner Kate Ito, Public Health Research Analyst Peter James, Public Health Specialist Jessica Robertson, Transportation Coordinator Jamila Henderson, Research Analyst Mariana Arcaya, Public Health Manager Tim Reardon, Planning Research Manager MAPC Project Management and Oversight Jennifer Raitt, Project Manager and Chief Housing Planner Eric Bourassa, Transportation Director Joel Barrera, Deputy Director Marc Draisen, Executive Director MAPC would like to thank staff and volunteers from the City of Somerville for providing data and review throughout this process: Lynn Weissman, Friends of the Community Path Alan Moore, Friends of the Community Path Wig Zamore, Somerville Transportation Equity Partnership Hayes Morrison, Transportation and Infrastructure Director, City of Somerville MAPC would also like to thank staff from the Central Transportation Planning Staff for providing information and feedback throughout this process: Sean Pfalzer Bruce Kaplan Anne McGahan 2
3 Introduction: Purpose of this Report The Community Path Extension 1 is one of the most important bicycle and pedestrian infrastructure projects in the Metro Boston region. Once completed, it will close a two-mile gap bridging a network of paths extending 48 miles connecting communities from Bedford to Boston to Newton and Waltham. The Completed Community Path 2 will have significant benefits for air quality, public health, economic development, and reducing transportation costs for individuals and families in areas with higher concentrations of lower-income households. The Community Path Extension is also highly consistent with the Commonwealth s GreenDOT and Healthy Transportation Compact policies and the recently announced statewide mode shift goal of tripling the annual mileage of non-auto travel by the year The Metropolitan Area Planning Council (MAPC), on behalf of the Friends of the Community Path (the Friends), developed a report highlighting key data points which can be used to discuss the various benefits of completing the Community Path. This report organizes and presents data across a number of different topic areas which include: Population and employment statistics Resident commuting modes Existing bike and pedestrian counts on connecting shared-use paths Projections for future bicycle and pedestrian use on the Completed Community Path Potential benefits of constructing the Community Path alongside the Green Line Extension Economic benefits of completing the Community Path Public health benefits of completing the Community Path Throughout the report, blue callout boxes can be found which highlight some of the important benefits the Completed Community Path can provide. More information is provided in the Appendix to this report with details on the source for each data set and the method of calculating the data. The map on the following page shows the existing and proposed sections of the Community Path Extension between Cedar Street and North Point and how the proposed project connects to other local bike lanes and shared lanes in the area. The map also shows the proximity of the Community Path to the Green Line Extension, connections to open space, and nearby civic landmarks. 1 The Community Path Extension is defined as the Path extending from Cedar Street in Somerville to North Point in Cambridge 2 The Completed Community Path is defined as the extension of the MinuteMan Commuter Bikeway between Alewife and North Point/Lechmere Station. 3

4 4 Proposed Location of the Somerville Community Path Extension
5 Population and Employment Statistics Population and employment statistics were gathered from two of the most up-to-date data sources available to MAPC: the 2010 US Census and 2011 InfoGroup Employment Data. MAPC used these data sources to determine the total population and employment within.5 miles, 1 mile and 1.5 miles of the Completed Community Path from Alewife to Lechmere. These data points provide an overview of the potential user pool the Completed Community Path could draw from as a commuter and recreational pathway. Population Statistics MAPC, using the most recent population data from the 2010 US Census calculated the approximate number of residents living within the three different distances of the Completed Community Path 3. According to the 2010 US Census, 89,000 people live within a half-mile of the Completed Community Path. According to the 2010 US Census, 180,900 people live within one mile of the Completed Community Path. According to the 2010 US Census, 261,400 people live within 1.5 miles of the Completed Community Path. Employment Statistics MAPC, using new 2011 data from InfoGroup, calculated the approximate number of employees and businesses located within.5 miles, 1 mile and 1.5 miles of the Completed Community Path 4. 3 All population data came from the 2010 US Census. 4 Employee/employer data came from InfoGroup, Employment Data,
6 According to 2011 InfoGroup employment data, 55,300 employees work in over 3,500 businesses within a half-mile of the Completed Community Path. According to 2011 InfoGroup employment data, 131,800 employees work in over 8,900 businesses within one mile of the Completed Community Path. According to 2011 InfoGroup employment data, 376,400 employees work in over 22,000 businesses within 1.5 miles of the Completed Community Path. The City of Somerville has significantly fewer jobs per resident than surrounding communities like Boston and Cambridge. The Community Path Extension will create a transportation link to jobs in both of these communities, as well as other communities along the entire network of shared-use pathways. The table below shows the jobs per resident in Somerville and other communities accessible by existing shared-use pathways. Population and Employment Comparison Table City/Town 2010 Population Employment 6 Jobs per Resident Somerville 75,754 21, MAPC Comparable Communities Bedford 13,320 19, Cambridge 105, , Boston 617, , Lexington 31,394 19, Watertown 31,915 18, Medford 56,173 17, Arlington 42,844 8, MAPC Region MAPC Region 3,161,712 1,797, Census 6 MA EOLWD ES 202, Employment by Sectors,
7 Commuting to Work MAPC, using data from the American Community Survey, calculated the approximate number resident commuters 7 within a half-mile of the Completed Community Path. Resident commuters are people who live within a half-mile of the Path, are over the age of 16, and commute to their place of work. This information is helpful in determining the percentage of people who may use the Path for commuting purposes. According to data from the American Community Survey, only 40% of resident commuters within a half-mile of the Completed Community Path drive alone to work. According to data from the American Community Survey, 31% of resident commuters within a half-mile of the Completed Community Path use transit to commute to work. The commuting patterns of those within a half-mile of the Completed Community Path closely mirror the commuting patterns of Somerville as a whole. The table below shows how the City of Somerville s mode percentages compare to other cities and towns along shareduse paths for driving alone, taking public transit, biking, and walking. Commuter Mode Share Comparison Table City/Town Drive Alone Public Transit Bike Walk Somerville 41.4% 33.5% 4.8% 10.1% MAPC Comparable Towns Cambridge 32.7% 29.9% 7.2% 24.1% Boston 40% 34.1% 1.5% 15.5% Medford 66.2% 17.6% 1.3% 4.8% Arlington 70.4% 17.7% 2.2% 2.5% Watertown 70.7% 15.4% 1.0% 2.5% Lexington 81.8% 7.0% 0.6% 1.3% Bedford 88.6% 2.4% 0.4% 2.8% MAPC Region MAPC Region 66.8% 16.7% 1.1% 6.6% American Community Survey Data (Means of Transportation to Work, Commuters over Age 16) 7
8 Transportation and Travel Statistics Another important benefit of completing the Community Path is the introduction of a shareduse pathway that will provide a link to two of the most heavily used paths in our region: the MinuteMan and the Dr. Paul Dudley White paths. Forging this missing connection will allow both recreation and commuter users to connect from Bedford to Boston and beyond. The linking of these pathways makes it easier for residents and employees without access to a car to travel to destinations and do so in a healthier way. The following sections provide statistics on the benefits of the Completed Community Path to households with limited access to vehicles, regional connectivity, projected usage of the Path, and projected benefits of linking the Path to the Green Line Extension. Vehicles per Household MAPC, using data from the American Community Survey, calculated the approximate number of vehicles per household 8 within a half-mile of the Completed Community Path. This information is helpful in underscoring the need in an area for other modes of transportation besides personal automobiles. The table below shows how the City of Somerville compares to other communities with similar shared-use paths and to the MAPC region as a whole. According to data from the American Community Survey, 24% of households within a half-mile of the Completed Community Path do not have access to a car, and 46% have access to only one car. Vehicle Availability Comparison Table City/Town Zero Vehicles One Vehicle Somerville 24.0% 46.1% MAPC Comparable Communities Boston 35.9% 42.0% Cambridge 32.0% 48.7% Medford 10.8% 42.5% Watertown 10.4% 43.0% Arlington 10.4% 43.5% Bedford 3.9% 27.6% Lexington 3.8% 28.3% MAPC Region MAPC Region 15.8% 36.9% American Community Survey Data (Vehicles Available by Household) 8
9 Connectivity to Other Regional Paths The Completed Community Path will serve as the link connecting some of the most heavily used shared-use pathways in our region, linking numerous municipalities and creating a safe and healthy transportation option for both recreational users and commuters. MAPC compiled available data on existing regional pathways that the Completed Community Path would connect to in order to show the potential regional impact of completing this connection. The piece of the Community Path that is not currently constructed would add 2.1 miles to the regional path network, and connect to an additional 46 miles of existing paths. Completing the Community Path would provide the missing connection in a network of 48 miles of regional shared-use pathways. Regional Shared-Use Path Network Connecting to the Completed Community Path Pathway Name Municipalities Connected Distance of Existing Path Existing Community Path Somerville 1.9 Miles MinuteMan Path Cambridge, Arlington, Lexington, Bedford 10 Miles Dr. Paul Dudley White Path Cambridge, Boston, Watertown, Newton, Waltham 23.1 Miles Fitchburg Cut-Off Trail Cambridge, Belmont 0.8 Miles Narrow Gauge Trail Bedford, Billerica 3.1 Miles Reformatory Branch Trail Bedford, Concord 3.8 Miles Alewife Brook Pathways Cambridge, Arlington, Somerville, Medford 3.1 Miles Total Existing Path Mileage
10 10 Regional Pathway Network with the Completion of the Community Path
11 Trips on Regional Paths MAPC compiled available trip count data from the MinuteMan, Paul Dudley White, existing Community Path, Fitchburg Cut-Off Trail, Narrow Gauge Trail, and the Reformatory Branch Trail to show the potential regional path users that could connect to the Community Path once completed. Bicycle and pedestrian counts were completed on these pathways in 2010, 2011 and 2012 depending on the path. It is anticipated that all of these pathways would benefit greatly from the connectivity the Completed Community Path would provide, boosting usage for both pedestrians and bicyclists. The table below shows the average AM and PM peak hour counts for pedestrian and bicycle trips on each of the paths. MAPC used an average count number because many of the paths include several count locations and using an average helps to reduce the number of trips that may be double counted along the full length of the path. The counts used for each path were the most recent available and for consistency MAPC used only weekday counts because weekend counts were not available for all paths. Most of the counts were completed in the spring or fall and at a time when school was back in session to account for the large college/university student population. Unfortunately, at this point in time we do not have detailed survey data for trips regarding place of origin, place of work and whether the trips were for commuting or recreation purposes. Hopefully in the future more detailed surveys on shared-use pathways can be incorporated into bike and pedestrian trip counts. Average Weekday Trip Counts on Connecting Regional Pathways Pathway Name Pedestrian Trips Bicycle Trips AM Peak PM Peak AM Peak PM Peak Existing Community Path MinuteMan Paul Dudley White Fitchburg Cut-Off Trail Narrow Gauge Trail Reformatory Branch Trail No Counts Available 9 City of Somerville, April/May 2011 Bicycle/Pedestrian Counts 10 Boston Region MPO Bicycle/Pedestrian Count Database, CTPS, Spring, Summer, Fall Counts from Charles River Basin Pedestrian and Bicycle Study for Pathways and Bridges, Halvorson Design Partnership, Counts from May Boston Region MPO Bicycle/Pedestrian Count Database, CTPS, Spring, Summer, Fall Counts from Boston Region MPO Bicycle/Pedestrian Count Database, CTPS, Spring, Summer, Fall Counts from
12 The Central Transportation Planning Staff (CTPS) has a large database of bicycle and pedestrian trip counts for paths inside and outside the MAPC region. This database includes AM and PM peak hour counts as well as daily counts on both weekdays and weekends. The collection of this data spanned from as early as 1994 to 2012 for some of the paths. CTPS analyzed the entire set of bike and pedestrian counts to determine what percentage of the total daily trips occurred during the peak hour. Overall, it appears that about 10% of total daily trips were on the paths during the peak hour. With this data point, we can make the assumption that for paths which we only have peak hour counts we assume that represents 10% of the total daily trips. Using this assumption, MAPC has projected what typical weekday daily trips on the regional trails might be based on the most recent set of peak hour counts available 14. Weekday Daily Trip Estimation on Connecting Regional Pathways Pathway Name Daily Ped Daily Bike Daily Total Annual Total 15 Existing Community Path 3, , ,000 MinuteMan 3,680 2,080 5,760 1,152,000 Paul Dudley White 4,114 1,140 5,254 1,050,800 Fitchburg Cut-Off Trail ,000 Narrow Gauge Trail ,000 Reformatory Branch Trail No Peak Hour Counts Were Available Trip Projections on the Completed Community Path The City of Somerville, compared to other Massachusetts municipalities, has a very high percentage of commuters who walk, bike or use transit as part of their daily commute to work. This higher percentage provides justification for the need to offer safe and direct links for these commuters to their places of employment. Shared-use pathways, especially those that connect to transit stations, can help increase the number of people walking and biking in an area. In an attempt to better understand the number of potential trips along the Completed Community Path, MAPC used three different methods to project the number of cyclist and pedestrian trips that may occur along the Path once completed. Projecting the number of trips is difficult because of limited data sources. Path and trail counts are limited in scope, are traditionally done for the peak hours, are not usually done annually, and do not include a 14 MAPC took the highest peak hour during the weekday to estimate daily ped and bike users, and then took the average of all the count locations along the path. Therefore daily projections may not correspond to 10% of the peak hour counts listed in the table on page Used 200 operating days per year for the annual total calculation which is based on the MassDOT CMAQ spreadsheet. 12
13 survey of users to determine trip purpose, origin of the trip, nor destination of the trip. These are all useful data points that could help to determine who is using the path, why they are using it, and where they are coming from and headed to. With the limited data we have at hand, MAPC tested three different methodologies to see which may provide the most realistic results, and to try to develop a range of possible projections for bicycle and pedestrian use. These methods include: 1. Extrapolating peak hour counts for the existing Community Path segments to the Community Path Extension. 2. Using a combination of extrapolation for pedestrian counts and a tool developed by the UNC Highway Research Center for bicycle counts. 3. Utilizing the Boston MPO s regional travel demand model to determine total trips, trip purpose, and trip mode for traffic analysis zones along the path network of the Completed Community Path, Minuteman Path, and Paul Dudley White Path. Extrapolation Method The City of Somerville completed bicycle and pedestrian trip counts on the existing portions of the Community Path in 2010 and Using the 2011 counts, MAPC estimated daily bicycle and pedestrian trips on the Community Path Extension by extrapolating the daily counts along the existing 1.9 mile section of the Community Path to the rest of the 2.1 mile extension. Based on existing peak hour counts from 2011, MAPC estimates that the total daily trips along the existing Community Path are around 3,650. By extrapolating the counts from the 1.9 mile section of the existing Community Path to the rest of the extension, MAPC estimates there could be an additional 4,746 daily trips on the Extension for a total of 8,396 daily trips. This extrapolation assumes that each additional 1.9 mile segment of the Community Path Extension would have the same number of trips as the existing Community Path segment, and the last 0.3 mile segment would have a 0.3 share of the 1.9 mile segment. The table below summarizes the counts by each section of the Path. Extrapolation Method - Trip Potential of the Community Path Extension Community Path Section Mileage Daily Bikes Daily Peds Daily Total Annual Total Existing Community Path ,132 3, ,000 First 1.9 Mile Extension ,132 3, ,000 Final 0.3 Mile Extension , ,200 Totals 4.1 1,191 7,205 8,396 1,679,200 *The extrapolation estimates are not discounted to account for any double counting that may occur between the three different segments listed in the table. UNC Estimator Tool and Extrapolation Method The second projection methodology combines two different methods to estimate potential future use on the Completed Community Path. MAPC, using data from the US Census Bureau and a demand analysis tool for shared-use pathways 16, developed projections for 16 UNC Highway Research Center, 13
14 anticipated trips by cyclists along the Completed Community Path. The demand analysis tool provided projections for existing and new cyclist trips that are likely to occur on the Completed Community Path for both commuting and recreational purposes. To project pedestrian trips, MAPC used the extrapolation method explained in the section above due to the fact that the UNC model only projects cycling use on the facility. One caveat with the demand analysis tool is that it assumes 100% of cyclists in a given area would use the Completed Community Path. This process fails to account for other bicycle facilities that are in close proximity which would draw cyclists away from the Completed Community Path. For the purposes of this analysis, MAPC assumed that 100% of cyclists (existing and new) would use the Completed Community Path and not other on- or off-street facilities. This tool does not take into account trip origin and destination, which in many cases the Completed Community Path would not be the fastest or most direct route for a person s trip (walking or biking). These two factors likely lead to an overestimate of cyclist trips on the Completed Community Path because Somerville and surrounding municipalities have bike lanes, shared-lanes, and off-street paths that may be faster or more direct options for cyclists and pedestrians. UNC Tool and Extrapolation Method - Trip Potential of the Completed Community Path Community Path Mileage Daily Bikes Daily Peds Daily Total Annual Total UNC Model Bike Trips 8,380 N/A 8,380 1,676, MAPC Extrapolation Ped Trips N/A 7,205 7,205 1,441,000 Totals 4.1 8,380 7,205 15,585 3,117,000 Trip-Based Method The third projection methodology utilizes the Boston Region MPO s travel demand model which can project trips by purpose and mode within and between traffic analysis zones (TAZ). MAPC used the modeling data to determine the number of total trips by mode that are being made in and between TAZs within a half-mile of the MinuteMan, Dr. Paul Dudley White, and Completed Community Path. A half-mile buffer was used because it is more likely that pedestrians and bicyclists within a half-mile of the paths would use the path network for their trips versus travelers within 1.5 miles. The overlap among TAZs within 1.5 miles becomes greater and the likelihood of travelers using the path network becomes smaller since there are other walking and biking routes that may be faster and more direct. The regional travel demand model projects how many individual trips are being made by those driving alone, carpooling, taking transit, and walking/biking. According to the model, there are approximately 14,325 walking and biking trips occurring among all the TAZs within a half-mile of the three connected paths. The model also projects that very few walking/biking trips are occurring between TAZs within a half-mile of the MinuteMan to/from TAZs within a half-mile of the Dr. Paul Dudley White path. 14

15 15 Half-Mile TAZ Map
16 Regional Travel Demand Model Estimates Daily Bike/ Annual Bike/ Origin-Destination Corridor Walk Trips Walk Trips Minute Man to Paul Dudley White 5 1,000 Minute Man to Community Path 1, ,000 Paul Dudley White to Community Path 12,675 2,535,000 Totals 14,325 2,865,000 A majority of the trips are occurring between TAZs within a half-mile of the MinuteMan and Completed Community Path, and between the Dr. Paul Dudley White and Completed Community Path. This is a result of these path combinations having end points in and around downtown Boston, a major trip destination for work and non-work related trips. Given the estimates from the model, it shows that completing the Community Path could provide a direct connection from both the MinuteMan and Paul Dudley White paths to downtown Boston and back for cyclists and pedestrians. Bike and walk trips form the highest mode used within this geography at 40%. Drive and transit trips each form about a quarter of the trips along the half-mile buffer area. These other modes, especially the auto trips represent the pool of potential trips that could switch to walking or biking if the Community Path is completed. Similar to the walking/biking trips, the drive alone trips have a majority that begin within a half-mile of the MinuteMan and Paul Dudley White and end along the Completed Community Path. The trip-based method estimates the number of trips (not people) as a potential that can be captured by the Completed Community Path. Similar to the UNC method, this method assumes that all walk and bike trips will be along the Completed Community Path, and does not account for use of other bike and pedestrian facilities that those trips could potentially use. Due to these assumptions, the estimate of potential new trips along the path is at the higher end. Projection Comparison The three different methods used to project the number of trips (bike and ped) yielded three different totals each with their own set of assumptions. The MAPC extrapolation method uses actual bike and pedestrian counts from existing sections of the Community Path while the other two methods rely on models and assume that 100% of the cyclists and pedestrians will only use the Completed Community Path. In reality, not all cyclists and pedestrians will exclusively use the Completed Community Path for their trips since Somerville has a well-connected sidewalk network and an expanding on-street network of bicycle facilities. MAPC believes that the extrapolation projection represents a conservative estimate of how many users could be expected on the Completed Community Path on a typical weekday. Weekend volumes would likely be higher given the regional nature of the pathway and that it connects to two very popular weekend destination paths (MinuteMan and Paul Dudley 16
17 White). If the Completed Community Path averaged 8,396 users per day, the Path could expect to see over 3,000,000 trips taken in a year. At this time, it is difficult to predict what the mode shift from driving to walking/cycling would be if the Community Path were completed, but it is assumed that with an added option like the Path there would be mode shift associated with its completion. If even 5% of the driving trips within a half-mile of the entire pathway network were shifted to walk and bike trips, the Completed Community Path could see an increase of over 150,000 trips. Summary Table of Projection Results Projection Method Daily Total Annual Total MAPC Extrapolation 8,396 1,679,200 UNC Model 15,585 3,117,000 Boston MPO Trip-Based Method 14,325 2,865,000 Projecting Trips in the Year 2035 The three methods of projecting trips discussed above provide trip potentials based on 2010 population, employment, and trip patterns. MAPC also developed a methodology for projecting what the trip totals could be in the year 2035 if the Community Path were completed. Similar to the Boston MPO Trip-Based Method described in the previous section, MAPC used a combination of TAZ trip pairs from the regional travel demand model and the MAPC population projections to determine how many additional trips could be made on the Completed Community Path in MAPC utilized our population and household projections to determine the growth in households within a half-mile of the Completed Community Path, MinuteMan Bikeway, and Dr. Paul Dudley White Path. Summary Table of Household Growth Projections Path 2010 HH 2035 HH % Change Completed Community Path 40,000 47,000 18% MinuteMan 26,000 29,000 12% Dr. Paul Dudley White 42,000 50,000 19% Using the 2010 total trips and total households in the half-mile area of these three paths, MAPC calculated the trips per household in 2010 and then applied that number to the amount of new households projected in Then, we applied the 2010 mode share percentage for walk/bike trips to the total new trips in 2035 to estimate the number of potential trips the Completed Community Path could see in the future. The table below shows the potential range of increased trips on the Completed Community Path in
18 Summary Table of Projected Daily Trip Growth from Path MinuteMan to Paul Dudley White MinuteMan to Community Path Paul Dudley White to Community Path 2035 Trips (shown as a range) Low % Change High % Change 0 0% 0% 1,270 1,345 11% 18% 3,465 3,535 16% 19% Trips 2035 Low Trips 2035 High Trips MinuteMan to Dudley White MinuteMan to Community Path Dudley White to Community Path The ranges shown in the table above provide a low and high estimate for how much trips could increase between each pair of paths from 2010 to Completing the Community Path has clear user benefits to not only those households within a half mile of the Completed Community Path, but also those along the MinuteMan and Paul Dudley White paths. Increases in Path Use because of a New Connection The completion of the Community Path is expected to greatly increase use not only on the Community Path but on the other connecting pathways like the MinuteMan or Paul Dudley White. There are other examples from across the United States showing the benefits of creating a new connection between two existing shared-use pathways. In San Jose, the Guadalupe River Trail had a grade-separated and paved undercrossing connection constructed beneath the Airport Parkway creating a safer and 17 Non-home based trips are not included in this calculation because was not possible to determine where future employees would be coming from and what mode they would be using for commute trips. 18
19 more direct connection for the pathway. A trail count in 2008, after construction, showed an 86% increase in trail use 18. The 5.5 mile Midtown Greenway in Minneapolis was constructed in three separate phases. Trail use increased from 2003 to 2008 by 260% as a result of each subsequent phase connecting to the previous 19. The Ghost Town Trail in Indiana County, Pennsylvania had a bridge constructed that connected two existing trail segments. After the bridge was constructed, trail use increased by 21.5% 20. The Completed Community Path s Impact on Green Line Ridership MBTA rapid rail stations (i.e. Red Line, Green Line, Orange Line, etc.) are accessed by many different modes of transportation. Users drive, are dropped off, connect via other public transit routes, bike, and walk. Looking at the MBTA passenger survey data collected at stations across the MBTA system, the percent of rapid rail users accessing the station via bike vary widely. For instance, the percentage of cyclists accessing the Alewife station on the Red Line is around 6% 21, while cycle access at many Green and Orange Line stations average between 0% - 1% 22. There are many factors that impact the percentage of MBTA users accessing a station by bike including: Population and employment densities Availability of quality bike parking at the station Connectivity of bike infrastructure to the station Safety and efficiency of biking to the station Travel time of biking and taking transit versus just biking to an end destination In developing the projected benefits of the Completed Community Path on future Green Line Extension ridership by station, MAPC incorporated the factors listed above and also utilized the following data points: Commuting population within 1.5 miles of Alewife, Davis, Lowell, Gilman, Washington, and Lechmere stations Bicycle mode share of the commuting population within 1.5 miles of each station Existing and new cyclists by station area, based on projections from the UNC Highway Research Center demand analysis Existing or projected ridership at each station along the Completed Community Path Brown, Aaron M., "A Greenway Runs Through it: The Midtown Greenway and the Social Landscape of Minneapolis, Minnesota" 2010.Honors Projects. Paper MBTA Systemwide Passenger Survey, CTPS 22 Ibid Draft Environmental Impact Report, Green Line Extension, MassDOT 19
20 The Completed Community Path is an interesting case as far as shared-use pathways are concerned. Currently, there is a missing gap in the regional shared-use pathway network between the MinuteMan and existing Community Path and the paths along the Charles River in Cambridge and Boston. The proposed Community Path Extension would provide this link. The question that remains is: How many users of the Completed Community Path would use the facility to access transit stations versus those who may stay on the Path and bike to their end destination? MAPC feels that use of the Path will be high given the relative lack of facilities in close proximity and the ability of the Path to link to other regional shared-use facilities. But, by constructing the Path it also makes a bike commute from Somerville to Boston fast, safe and easy which may lead cyclists to not take the Green Line and instead bike directly from their point of origin to their end destination. For instance, a commuter from the Gilman Station area may have to complete the following steps for a completed origin/destination trip to Boston: 1. A one mile bike commute to the station (approximately 5 minutes if biking 12MPH) 2. Lock up their bike at the station (3 minutes to park and lock bike) 3. Wait for a Green Line train during the peak hour (5 minutes) 4. Ride the train into Boston (16 minutes) 5. Walk to their end destination from Park Street station (5 minute walk, based on end destination being within ¼ mile) Based on this trip, the estimated cumulative travel time is around 34 minutes door to door. It is likely to be faster for that person to bike from the Gilman Station area on the Completed Community Path to their end destination in Boston rather than take the extra step of riding the Green Line. The same trip taken by bicycle without a transfer to the Green Line could take as little as 18 minutes based on a cyclist traveling an average of 12 MPH. This same phenomenon can be seen along the Orange Line with the Southwest Corridor Path. There are very few bike access trips to Orange Line stations that are also along the Southwest Corridor Path. Bicyclists are more likely to continue down the Corridor Path than get off and take the Orange Line. Not taking the train also has health benefits for cyclists as well as travel time benefits. There are cases where connecting cyclists to Green Line stations becomes beneficial such as: During inclement weather conditions Users of the MinuteMan who have end destinations along the Green Line Users traveling to destinations along the Green Line further than Downtown Boston (i.e., Boston University, Boston College, Brookline, Newton, etc.) Given this information and these considerations, MAPC developed projections for how many cyclists would access the four Green Line stations along the Completed Community Path each day for a variety of trip purposes. 20
21 MAPC also projected the number of pedestrians that may use the Completed Community Path to access the four new Green Line Extension stations. According to data from the City of Somerville, approximately 20% of Red Line riders at Davis Square use the existing Community Path to access the station at the west head house. MAPC used this 20% pedestrian arrival figure to estimate arrivals at the new Green Line stations by pedestrians using the Completed Community Path. MAPC estimates that approximately 3,800 pedestrians will use the Completed Community Path to access the stations based on projected ridership at each of the four stations and a 20% arrival rate. We do believe this estimate represents the upper bounds of the access potential at the Green Line stations. The sidewalk network in Somerville is well connected and pedestrians are likely to access the new stations using this network and the Completed Community Path.. The 2009 DEIR projected that combined daily ridership at Lowell, Gilman, Washington Street, and Lechmere stations would be 19,300. It is projected that approximately 581 (116,200 annually) cyclists would use the Community Path to access the Lowell, Gilman, Washington Street, and Lechmere stations each day. Of these 581 cyclists, approximately 212 (42,400 annually) would be new cyclists who are not cycling in the absence of the Community Path. Of these 581 cyclists, approximately 284 (56,800 annually) would access the station for commuting trips and 186 (37,200 annually) would access the station for education trips. Approximately 3,800 (760,000 annually) pedestrians will use the Completed Community Path to access the four new Green Line stations each day. Economic Benefits One of the newer areas of research around shared-use pathways and bicycle facilities is the positive impact these investments can have on the local and regional economy. Communities from around the US have experienced benefits such as the opening of new 21
22 businesses, fewer vacancies in retail areas, higher retail sales volumes resulting in healthier businesses and sale tax benefits, and higher property sale prices. Heavily utilized bike and pedestrian facilities can bring more patrons to businesses in the community by providing new connections for local residents and a recreational option for out-of-town visitors. The current level of research and results based on user spending patterns has not been generalized enough to apply across the board to urban pathways like the Completed Community Path. Results have been very path specific and rely primarily on actual survey results from each individual path. Many of the survey studies have taken place along shared-use paths in rural and suburban locations, which may not be directly comparable to an urban pathway. This section provides some general information about the economic benefits that other paths have created in their local and regional economies. Local Spending Benefits Shared-use pathways have been shown to have direct links to tourism and increased spending on retail, services and hospitality sectors in rural and suburban locations where the pathway is the major draw. A study of the Outer Banks in North Carolina estimates that tourists who came specifically for bicycling generated approximately $60 million a year for the local economy, nearly nine times the cost of building the facility 24. The Greenbrier River Trail in West Virginia has estimated through user surveys that more than half of its users spend more than $100 per visit 25. Shared-use pathways and other bicycle and pedestrian facilities can also have a positive impact on the local economy in the form of new businesses and jobs. In 2008, the City of Portland, Oregon estimated that bicycle-related industries accounted for nearly $90 million in direct economic activity with 60% coming from the retail, repair, and rental sectors. Since 2006, these sectors have grown by 50% and increased the number of jobs from 850 to 1, Studies have been conducted both nationally and internationally to look at the amount cyclists spend at local businesses and the frequency of their trips. Several of these studies have revealed that consumers arriving to stores by bike spent similar amounts when compared to consumers who drive to the same store, but cyclists tend to make more trips per week. When you look at both the spending amounts and the frequency of trips, cyclists end up out-spending their auto counterparts over the course of a week. Portland State University researchers have been surveying consumers at local bars, restaurants, convenience stores, and grocery stores and have found that cyclists spend less per trip at these destinations but make more trips per month. When they totaled up the monthly spending across business categories, cyclists spend on average $14 more per month than drivers 27. This initial information suggests that cyclists can play an important part in the local 24 Clifton, Morrissey, and Ritter, Business Cycles: Catering to the Bicycling Market. TR News 280, May-June Ibid 26 Ibid 27 Ibid 22
23 retail and service economy, and bicycle and pedestrian linkages and accommodations to and in business districts should not be an afterthought. Property Value Premiums Research from around the United States also found that residential properties have been listed or sold with a premium based on proximity to shared-use pathways, especially those adjacent to the pathway. In 2002, the National Association of Realtors and the National Association of Home Builders ranked trails as the second most important community amenity out of a list of 18 choices 28. In 2004, the National Association of Home Builders ranked trails as the number one amenity 29. These trends show the demand for paths in close proximity to where people live as both a recreational and commuter amenity. Pathways have also been shown to have positive benefits to residential properties with little to no negative impacts. The MinuteMan Commuter Bikeway offers an interesting localized example of the economic value on adjacent properties. In 2006, realtor Craig Della Penna of The Murphys Realtors, Inc. looked at property sales data for homes along the MinuteMan and the Nashua River Rail Trail system and found that homes near the trails sold closer to the list price and in a faster time frame than properties not located near the trails. This analysis showed that homes near the trails sold at 99.3% of the list price compared with 98.1% for other homes sold in the towns. Homes near trails also sold in an average of 29.3 days compared to 50.4 days for the other homes 30. Connections to New Development Shared-use pathways can also be an excellent way to connect existing parts of a community to areas of new development or redevelopment. According to the City of Somerville, there are a number of underutilized parcels particularly in the Inner Belt/Brickbottom area that could be prime locations for redevelopment when the Green Line Extension is completed. These parcels would also be in close proximity to the Completed Community Path if constructed, providing yet another transportation connection to residents and employers/employees in the area. The following two statistics 31 show the potential economic development benefits of constructing the Green Line Extension and Community Path Extension in close proximity to these areas. According to data from the City of Somerville, there is approximately 7-10 million square feet of potential development space that could be accessible from the Completed Community Path. 28 Rails to Trails Conservancy, Economic Benefits of Trails and Greenways 29 Rails to Trails Conservancy, From Trail Towns to TrOD: Trails and Economic Development, Della Penna, Craig. Home Sales near Two Massachusetts Rail Trails. January, City of Somerville, TIGER II Application, Community Path 23
24 According to data from the City of Somerville, there are approximately 104 acres of underutilized land within a half-mile of the Completed Community Path. Benefits to Environmental Justice Populations Environmental Justice (EJ) Populations are defined as those with high minority, non-english speaking, low-income, or foreign born populations. These areas are mapped based on the percentage of the population which falls under any of the above listed criteria 32. Qualifying percentages are set by the Commonwealth. EJ populations are often more dependent on other modes of transportation besides personal automobiles, and the Completed Community Path would have specific benefits for residents falling under these categories. These populations are also often negatively impacted by air pollution effects and lack good access to open space/recreation options. Approximately 23% of the total population within a half-mile of the Completed Community Path fall within the minority category of the EJ Population count, 23% fall within the foreignborn category, and 7% fall within the English proficiency category. A map of the Community Path in relation to Environmental Justice population areas can be seen on the next page. The Community Path Extension travels almost exclusively through Environmental Justice areas in Somerville. 32 MassGIS, Data based on 2000 Census 24
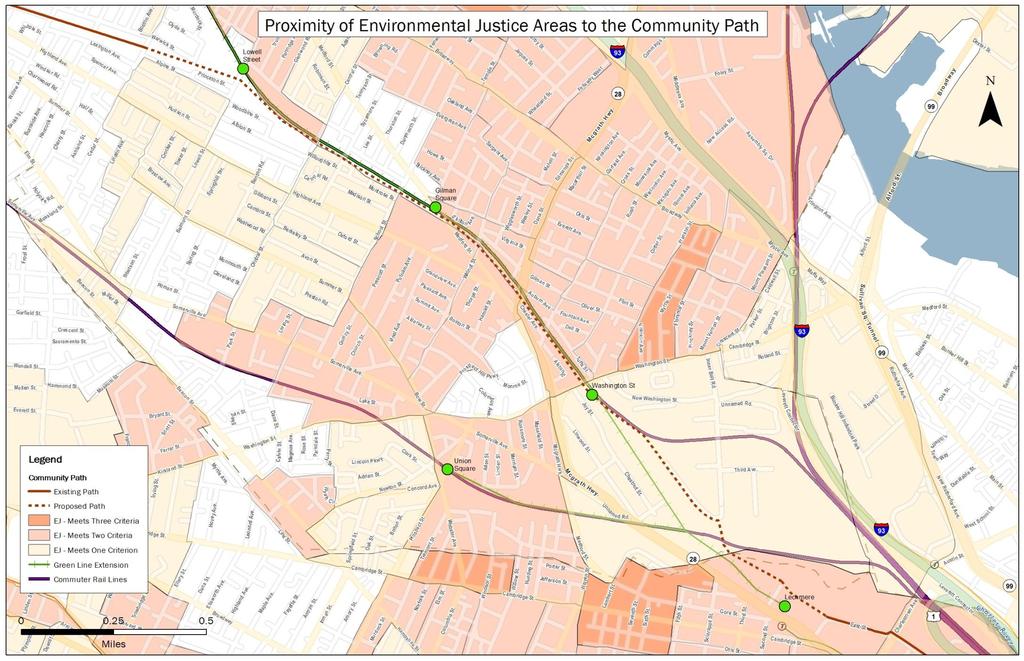
25 25
26 Public Health Benefits Residents in certain areas of Somerville are impacted by poor air quality resulting from I-93 cutting through the City, diesel commuter rail trains traveling through the City and a high concentration of local roadways serving neighborhoods in Somerville. Residents in these areas have higher rates of asthma, lung cancer and heart conditions. The Completed Community Path would provide added public health benefits to the residents in Somerville by creating a recreational path that can be used for exercise and active transportation, as well as connecting residents to parks and open space. The Completed Community Path would also help reduce vehicle trips in the area by replacing them with cycling and walking trips, and provide a safe and efficient connection to the Red Line and future Green Line Extension. Vehicle Reduction Removing vehicle trips from many already congested roadways in the Somerville area will have both air quality and mobility benefits for the City and region. The Completed Community Path will reduce vehicle miles traveled (VMT) and take cars off the road and replace them with walking and biking trips. Constructing the connection in this regional pathway system will make it easier, safer and more efficient for cyclists and pedestrians to travel from their points of origin to their destinations. MAPC used the Boston Region MPO s Congestion Mitigation and Air Quality (CMAQ) spreadsheet calculations to quantify the VMT reduction and air quality benefit of the Community Path Extension 33. The CMAQ spreadsheet projects a VMT reduction of 24,735 miles per day and a reduction of approximately 2,800 metric tons of CO2 per year 34. This is the equivalent to removing 552 cars from the road during the course of a year. This is an important statistic because the City of Somerville currently has the most lane-miles of road per square mile of any municipality in the Commonwealth, with many being used as cut-thru roads to get to and from Boston. A high density of roadways leads to poor air quality and negative health impacts on the most vulnerable populations across the City. The Community Path Extension could provide emissions reductions equivalent to removing 552 cars from the road per year. Somerville has the most lane-miles of road per square mile of any municipality in the Commonwealth at 25.7 miles per square mile. 33 The CMAQ calculations assume that all users on the Community Path were previously driving and does not discount air quality benefits by taking into account users who are already walking and biking. 34 US EPA Air Quality Calculations: 26
27 Increases in Open Space The Completed Community Path, running from Alewife to Lechmere, not only creates significant connectivity for pedestrians and cyclists, but it also provides additional open space for parts of the City that are not well-connected to neighborhood or regional parks. The Community Path Extension, between Cedar Street and Lechmere, would add approximately 4 acres of recreational and open space for the City on top of the 12 acres the existing pieces of the Community Path already provides. The Completed Community Path also creates valuable connections from neighborhoods and businesses to other larger open spaces and recreational fields throughout the City. Within a half-mile of the Completed Community Path, users would have access to approximately 146 acres of open space. Currently about 9.7% (257 acres) of the total land area in Somerville is designated as open space, parks, or recreational fields. If the Community Path Extension is completed, it would increase to 9.9%. On a per capita basis, the City would have around acres of open space per resident. While this may represent a very small percentage increase, the Community Path Extension provides a very important recreational opportunity in Somerville. The Community Path Extension would add 4 acres of open space to Somerville. The Completed Community Path provides access to 146 acres of open space within a half-mile of the facility. In 2008, a Somerville survey of 906 residents revealed that the existing Community Path section from the Cambridge line to Cedar Street was the most heavily used recreation space in the City. Health Benefits Completing the Community Path will have significant health benefits for the pedestrians and cyclists who use the facility. The Community Path Extension will provide the link connecting over 40 miles of continuous off-street paths which will have direct impacts on improving air quality, lowering risk for obesity, diabetes, heart disease, stroke and other chronic health conditions, and increasing hours of exercise. MAPC calculated hours of exercise, calories burned and pounds burned per person during the course of a year by pedestrians and cyclists along the Path. 27
28 Health Benefits per person per year 35 MAPC estimates that the hours of exercise per person per year are 120 hours for a cyclist and 80 hours for a pedestrian. MAPC estimates that the calories burned per person per year are 49,000 for a cyclist and 18,000 for a pedestrian. If converted to pounds lost per person per year it is 14 pounds for a cyclist and 5 pounds for a pedestrian*. *If all other variables are held equal, this is the average amount of calories/pounds lost per person per year. This does not take into account that people who exercise more may increase their caloric intake offsetting some of the weight loss benefits of exercise. The availability of this off-street path connection not only has benefits for exercise and reducing risk of obesity, it also helps prevent deaths that may have otherwise occurred absent the construction of the Path. Using the three projection methods, MAPC calculated the reduced number of deaths per year that could be attributed to completing the Community Path. Projection Method Number of Deaths per year Prevented by Completing the Community Path 36 Cycling Deaths Prevented Walking Deaths Prevented Total Deaths Prevented Dollars Saved (in Millions) MAPC $47 UNC $72 MPO Model $85 The dollars saved under the three scenarios is based on the amount researchers have determined Americans are willing to pay to avoid death. This compensation takes into account a variety of adverse conditions people are willing to accept or avoid based on a set monetary amount. The number of deaths prevented per year is multiplied by the value of a statistical life to get to the amount of money saved per year. Besides the benefits of reducing obesity and preventing loss of life, the Completed Community Path will also help reduce factors of morbidity like heart disease, diabetes, 35 Benefits were calculated based on 200 walking/biking days per year, benefits were calculated on a per person basis. The estimated average weight of 150lbs and cycling at 10-12MPH for cyclists, average weight of 150lbs and walking at 3.5MPH for pedestrians. 36 Statistics based on the World Health Organization s Health Economic Assessment Tool (HEAT). The US EPA estimates the value of a statistical life (VSL) at $6.9 million dollars. This value is based on the amount people are willing to pay for small reductions in their risks of dying from adverse health conditions that may be caused by environmental pollution. 28
Appendix B: Benefit-Cost Analysis
 Appendix B: Benefit-Cost Analysis RE-CONNECTING CLEVELAND: PATHWAYS TO OPPORTUNITY RE-CONNECTING CLEVELAND: PATHWAYS TO OPPORTUNITY [this page intentionally blank] RE-CONNECTING CLEVELAND: PATHWAYS TO
FACTS AND FIGURES: MAKING THE CASE FOR COMPLETE STREETS IN LEE COUNTY
 FACTS AND FIGURES: MAKING THE CASE FOR COMPLETE STREETS IN LEE COUNTY Safety: Close to 5,000 pedestrians and bicyclists die each year on U.S. roads, and more than 70,000 are injured. [Mean Streets, Surface
BUILDING THE CASE FOR TRAVEL OPTIONS IN WASHING TON COUNTY. Image: Steve Morgan. Image: Steve Morgan
 BUILDING THE CASE FOR TRAVEL OPTIONS IN WASHING TON COUNTY Image: Steve Morgan Image: Steve Morgan Image: TriMet Image: TriMet WHAT ARE TRAVEL OPTIONS PROGRAMS? Travel options programs encourage residents,
2017 Northwest Arkansas Trail Usage Monitoring Report
 2017 Northwest Arkansas Trail Usage Monitoring Report Summary Findings: The study showed that average daily weekday bicycle volumes per study site increased by about 32% between 2015 and 2017, from 142
TR NEWS. Public Health and Transportation. Innovation, Intervention, and Improvements NUMBER 299 SEPTEMBER OCTOBER 2015
 TR NEWS NUMBER 299 SEPTEMBER OCTOBER 2015 Public Health and Transportation Innovation, Intervention, and Improvements Public Health and Transportation Measuring the Health Benefits of Walking and Bicycling
Tulsa Metropolitan Area LONG RANGE TRANSPORTATION PLAN
 Tulsa Metropolitan Area LONG RANGE TRANSPORTATION PLAN Indian Nations Council of Governments August 2005 CONTACTING INCOG In developing the Destination 2030 Long Range Transportation Plan, INCOG s Transportation
 Time of Change We Are Growing We Are An Attractive Place To Live We Are Age Diverse + Living Longer 50000 40000 30000 20000 10000 0 2010 Census Job Density Housing Sheds Transit Sheds The Project FUNDING
1999 On-Board Sacramento Regional Transit District Survey
 SACOG-00-009 1999 On-Board Sacramento Regional Transit District Survey June 2000 Sacramento Area Council of Governments 1999 On-Board Sacramento Regional Transit District Survey June 2000 Table of Contents
G AT E WAY PLAN. Community BRIEFING KIT GATEWAY BIKE
 G AT E WAY PLAN GATEWAY BIKE Community BRIEFING KIT PLAN August 2016 TABLE OF CONTENTS INTRODUCTION... 1 THE BENEFITS OF A BIKEABLE COMMUNITY... 2 ECONOMY...2 SAFETY...3 HEALTH...3 HOUSEHOLD SPENDING...3
Goodlettsville Bicycle and Pedestrian Plan Executive Summary
 Goodlettsville Bicycle and Pedestrian Plan July 2010 In Cooperation with the Nashville Area Metropolitan Planning Executive Organization Summary Introduction Progressive and forward thinking communities
Methodology for assessing the benefits of active transportation projects EXECUTIVE SUMMARY
 C L I M AT E -S M A R T C I T I E S Methodology for assessing the benefits of active transportation projects EXECUTIVE SUMMARY Written by Eliot Rose and James Choe, ICF International For The Trust for
Typical Rush Hour Commute. PennyforTransportation.com
 Typical Rush Hour Commute In the News Overview of the Plan Collaborative plan with projects in every community Prioritizing connectivity and congestion relief Dedicated transportation-specific funding;
Midtown Corridor Alternatives Analysis
 Midtown Corridor Alternatives Analysis Ridership Forecast Methodology and Results December 2013 Prepared by the SRF Consulting Group Team for Table of Contents Introduction... 1 Methodology... 1 Assumptions...
Appendix T 1: Additional Supporting Data
 Appendix T 1: Additional Supporting Data Project Delivery Delays with the implementation of the 2000 TIP became apparent early in the decade. In response to direction among policy officials, ARC began
NASHUA REGIONAL PLANNING COMMISSION REGIONAL BICYCLE AND PEDESTRIAN PLAN
 NASHUA REGIONAL PLANNING COMMISSION REGIONAL BICYCLE AND PEDESTRIAN PLAN June, 2005 Prepared by the Nashua Regional Planning Commission 2005 NRPC Regional Bicycle and Pedestrian Plan- JUNE 2005 ACKNOWLEDGEMENTS
City of Novi Non-Motorized Master Plan 2011 Executive Summary
 City of Novi Non-Motorized Master Plan 2011 Executive Summary Prepared by: February 28, 2011 Why Plan? Encouraging healthy, active lifestyles through pathway and sidewalk connectivity has been a focus
APPENDIX E BIKEWAY PRIORITIZATION METHODOLOGY
 APPENDIX E BIKEWAY PRIORITIZATION METHODOLOGY INTRODUCTION The network of bikeways recommended in the Bicycle Master Plan is extensive and is likely to be only partially completed during the 25-year life
Town of Superior. Superior Trails Plan
 Part 1 Base Information 1. Project Title US 36 Bikeway Extension 2. Project Start/End points or Geographic Area Provide a map with submittal, as appropriate 3. Project Sponsor (entity that will construct/
Appendix 3.2 D. Ridership Errata Sheet
 Appendix 3.2 D Ridership Errata Sheet January 14, 2010 Since the release of the Alternatives Description for the South Coast Rail project, the Massachusetts Department of Transportation has identified
CHAPTER 3: Vision Statement and Goals
 Davidson Walks & Rolls: Active Transportation Master Plan CHAPTER 3 Contents: Overview Vision Statement Measurable Goals Public Outreach CHAPTER 3: Vision Statement and Goals Overview The vision statement
An Assessment of Potential Greenhouse Gas Emissions Reductions from Proposed On Street Bikeways
 An Assessment of Potential Greenhouse Gas Emissions Reductions from Proposed On Street Bikeways Through the Sustainable Bethlehem Initiative, the Town of Bethlehem has identified both the improvement of
Guidelines for Providing Access to Public Transportation Stations APPENDIX C TRANSIT STATION ACCESS PLANNING TOOL INSTRUCTIONS
 APPENDIX C TRANSIT STATION ACCESS PLANNING TOOL INSTRUCTIONS Transit Station Access Planning Tool Instructions Page C-1 Revised Final Report September 2011 TRANSIT STATION ACCESS PLANNING TOOL INSTRUCTIONS
Rail Station Fact Sheet DFW Airport North Station* (*station under construction with anticipated start of service in late 2018)
") Rail Station Fact Sheet DFW Airport North Station* (*station under construction with anticipated start of service in late 018) Station Overview DFW Airport North Station will be located on DFW nternational
Rail Station Fact Sheet DFW Airport North Station* (*station under construction with anticipated start of service in late 018) Station Overview DFW Airport North Station will be located on DFW nternational
Rail Station Fact Sheet CentrePort/DFW Airport Station
 Rail Station Fact Sheet CentrePort/DFW Airport Station Station Overview CentrePort/DFW Airport Station is located by Statler Boulevard at Breezewood Drive in Fort Worth. Free shuttles connect the station
Regional Transportation Needs Within Southeastern Wisconsin
 Regional Transportation Needs Within Southeastern Wisconsin #118274 May 24, 2006 1 Introduction The Southeastern Wisconsin Regional Planning Commission (SEWRPC) is the official areawide planning agency
Perryville TOD and Greenway Plan
 Perryville TOD and Greenway Plan Greenway Glossary Pathway: A bicycle and pedestrian path separated from motorized vehicular traffic by an open space, barrier or curb. Multi-use paths may be within the
MEMORANDUM. Charlotte Fleetwood, Transportation Planner
 MEMORANDUM Date: Updated August 22, 2017 To: Organization: Charlotte Fleetwood, Transportation Planner Boston Transportation Department From: Jason DeGray, P.E., PTOE, Regional Director of Engineering
El Paso County 2040 Major Transportation Corridors Plan
 El Paso County 2040 Major Transportation Corridors Plan Connect-our-County Online Transportation User Survey Preliminary Results June 24, 2010 Years of Residence 2. How many years have you LIVED HERE?
Active Travel and Exposure to Air Pollution: Implications for Transportation and Land Use Planning
 Active Travel and Exposure to Air Pollution: Implications for Transportation and Land Use Planning Steve Hankey School of Public and International Affairs, Virginia Tech, 140 Otey Street, Blacksburg, VA
Rochester Area Bike Sharing Program Study
 roc bike share Rochester Area Bike Sharing Program Study Executive Summary ~ January 2015 JANUARY 2015 8484 Georgia Avenue, Suite 800 Silver Spring, MD 20910 3495 Winton Pl., Bldg E, Suite 110 Rochester,
DRAFT MOVING FORWARD RHODE ISLAND BICYCLE MOBILITY PLAN 2018 PREPARED FOR PREPARED BY IN ASSOCIATION WITH
 RHODE ISLAND MOVING FORWARD BICYCLE MOBILITY PLAN 2018 PREPARED FOR PREPARED BY IN ASSOCIATION WITH T AF CHAPTER 1 D R INTRODUCTION CHAPTER 3 ARTICULATES VISION Bicycling is safe, fun and practical in
CITY OF COCOA BEACH 2025 COMPREHENSIVE PLAN. Section VIII Mobility Element Goals, Objectives, and Policies
 CITY OF COCOA BEACH 2025 COMPREHENSIVE PLAN Section VIII Mobility Element Goals, Objectives, and Policies Adopted August 6, 2015 by Ordinance No. 1591 VIII MOBILITY ELEMENT Table of Contents Page Number
Chapter 7. Transportation. Transportation Road Network Plan Transit Cyclists Pedestrians Multi-Use and Equestrian Trails
 Chapter 7 Transportation Transportation Road Network Plan Transit Cyclists Pedestrians Multi-Use and Equestrian Trails 7.1 TRANSPORTATION BACKGROUND The District of Maple Ridge faces a number of unique
APPENDIX D LEVEL OF TRAFFIC STRESS METHODOLOGY
 APPENDIX D LEVEL OF TRAFFIC STRESS METHODOLOGY 01 WHAT IS LEVEL OF TRAFFIC STRESS? When people bicycle on roadways, they encounter varying levels of stress from traffic. A quiet residential street with
CITY OF ALPHARETTA DOWNTOWN MASTER PLAN TRAFFIC EVALUATION
 CITY OF ALPHARETTA DOWNTOWN MASTER PLAN TRAFFIC EVALUATION June 2015 CITY OF ALPHARETTA DOWNTOWN MASTER PLAN TRAFFIC EVALUATION Introduction The Alpharetta Downtown Master Plan was developed in the fall
Urban planners have invested a lot of energy in the idea of transit-oriented
 DOES TRANSIT-ORIENTED DEVELOPMENT NEED THE TRANSIT? D A N I E L G. C H AT M A N Urban planners have invested a lot of energy in the idea of transit-oriented developments (TODs). Developing dense housing
2010 Pedestrian and Bicyclist Special Districts Study Update
 2010 Pedestrian and Bicyclist Special Districts Study Update Pedestrian and Bicyclist Special Districts Program Overview H-GAC s Special Districts Program aims to provide strategic investments in pedestrian
Base Information. 1. Project Title SH7/East Arapahoe Multi-Use Path and Transit Stop Improvements. 2. Project Start/End points or Geographic Area
 Part 1 Base Information 1. Project Title SH7/East Arapahoe Multi-Use Path and Transit Stop Improvements 2. Project Start/End points or Geographic Area 38 th /Marine streets to Cherryvale Road (See attached
Proposed White Flint Separated Bike Lane Network September 2015
 Proposed White Flint Separated Bike Lane Network September 2015 Abstract This report includes a proposed separated bike lane network for the White Flint Sector Plan area. Separated bike lanes create a
TRANSPORTATION & MOBILITY
 TRANSPORTATION & MOBILITY ROADWAY SYSTEM There are approximately 40 miles of roadways in Manitou Springs. For planning purposes, roadways are typically assigned a functional classification which defines
WELCOME TO OPEN HOUSE # 1 June 14, 2017
 Langstaff Road Weston Road to Highway 7 Class Environmental Assessment Study WELCOME TO OPEN HOUSE # 1 June 14, 2017 Please sign in and join our mailing list Purpose of Open House #1 & Study Area York
2014 peterborough city and county. active. transportation. & health. indicators primer
 2014 city and county active transportation & health indicators primer executive summary Walking, cycling and transit are good for our personal health, our local economies, and the environment. Understanding
Transportation Master Plan Advisory Task Force
 Transportation Master Plan Advisory Task Force Network Alternatives & Phasing Strategy February 2016 BACKGROUND Table of Contents BACKGROUND Purpose & Introduction 2 Linking the TMP to Key Council Approved
Vision Public Workshop: Findings
 Vision Public Workshop: Findings Long Range Transportation Plan & Bicycle Mobility Plan February 2018 Vision Workshop South Kingstown 1/23/18 Providence 1/24/18 Newport 1/31/18 Long Range Transportation
EUCLID AVENUE PARKING STUDY CITY OF SYRACUSE, ONONDAGA COUNTY, NEW YORK
 EUCLID AVENUE PARKING STUDY CITY OF SYRACUSE, ONONDAGA COUNTY, NEW YORK CITY OF SYRACUSE DEPARTMENT OF PUBLIC WORKS 1200 CANAL STREET EXTENSION SYRACUSE, NEW YORK 13210 DRAFT REPORT DATE: November 13,
METRO Light Rail: Changing Transit Markets in the Phoenix Metropolitan Area
 METRO Light Rail: Changing Transit Markets in the Phoenix Metropolitan Area Abhishek Dayal, AICP Planner III, METRO Light Rail Phoenix, AZ BACKGROUND Transit in the Phoenix Region Transit services in the
Rail Station Fact Sheet University of Dallas Station
 Rail Station Fact Sheet University of Dallas Station Station Overview University of Dallas Station is located on John Carpenter Freeway and west of Loop 12 across from the University of Dallas in Irving.
APPENDIX E: Transportation Technical Report
 New Jersey Pennsylvania Lackawanna Cut-Off Passenger Rail Service Reston Project Environmental Assessment APPENDIX E: Transportation Technical Report E.1 Introduction As part of the overall environmental
MCTC 2018 RTP SCS and Madera County RIFP Multi-Modal Project Eval Criteria GV13.xlsx
 MCTC 8 RTP SCS and Madera County RIFP Multi-Modal Project Eval Criteria GV.xlsx Madera County Transportation Commission Regional Transportation Plan / Sustainable Communities Strategy Multi-Modal Project
WILMAPCO Public Opinion Survey Summary of Results
 Wilmington Area Planning Council WILMAPCO Public Opinion Survey Summary of Results Prepared by: 2955 Valmont Road, Suite 300 Boulder, Colorado 80301 t: 303-444-7863 f: 303-444-1145 www.n-r-c.com Table
Corpus Christi Metropolitan Transportation Plan Fiscal Year Introduction:
 Introduction: The Safe, Accountable, Flexible, Efficient Transportation Equity Act: A Legacy for Users (SAFETEA-LU) has continued the efforts started through the Intermodal Surface Transportation Efficiency
Travel and Rider Characteristics for Metrobus
 Travel and Rider Characteristics for Metrobus 040829040.15 Travel and Rider Characteristics for Metrobus: 2012-2015 Overview The Miami Dade County Metropolitan Planning Organization (MPO) conducted a series
6.0 PEDESTRIAN AND BICYCLE FACILITIES 6.1 INTRODUCTION 6.2 BICYCLE DEMAND AND SUITABILITY Bicycle Demand
 6.0 PEDESTRIAN AND BICYCLE FACILITIES 6.1 INTRODUCTION Bicycle and pedestrian travel along and in the vicinity of the corridor is part of the vision of Somerset and Hunterdon counties and the integrated
There are traffic jams on Highway 1
 There are traffic jams on Highway 1 How can we relieve this congestion? 2016: Year of Decision for Santa Cruz County Transportation + le b a n i sta u S + Unsu stain able Which path should we take? 2016
CHAPTER 1 INTRODUCTION
 CHAPTER 1 INTRODUCTION Chapter Table of Contents THE 2017 HOUSTON BIKE PLAN 1-1 HOUSTON BIKEWAYS PROGRAM 1-2 HISTORY OF BICYCLE PLANNING IN HOUSTON 1-3 BICYCLE LEVEL OF COMFORT 1-3 EXISTING PLANS, PROGRAMS
Measuring Transportation: Traffic, Mobility and Accessibility
 Measuring Transportation: Traffic, Mobility and Accessibility THIS FEATURE COMPARES THREE APPROACHES TO MEASURING TRANSPORTATION SYSTEM PERFORMANCE. TRAFFIC-BASED MEASUREMENTS EVALUATE MOTOR VEHICLE MOVEMENT;
2045 Long Range Transportation Plan. Summary of Draft
 2045 Long Range Transportation Plan Summary of Draft Fredericksburg Area Metropolitan Planning Organization The George Washington Region includes the City of Fredericksburg and the counties of Caroline,
Chapter 5 Future Transportation
 Chapter 5 Future Transportation The Future Land Use Plan identifies the desired land use designations. The land uses desired for Crozet depend, in large part, on the success of the transportation system,
Speed Limits Study and Proposal. Public Input Session: 8/14/13
 Speed Limits Study and Proposal Public Input Session: 8/14/13 Why is Decatur a unique place for this project? First Community Transportation Plan in the nation with a Health Impact Assessment. Strong sense
APPENDIX 2 LAKESHORE ROAD TRANSPORTATION REVIEW STUDY EXECUTIVE SUMMARY
 APPENDIX 2 LAKESHORE ROAD TRANSPORTATION REVIEW STUDY EXECUTIVE SUMMARY Appendix 2 City of Mississauga Lakeshore Road FINAL REPORT Transportation Review Study December 2010 EXECUTIVE SUMMARY Study Purpose
Bike Share Social Equity and Inclusion Target Neighborhoods
 Bike Share Social Equity and Inclusion Target Neighborhoods Target Neighborhoods West End/Visitation Park/Academy/Hamilton Heights Wellsgoodfellow/Kingsway West The Ville/Greater Ville Kingsway East/Fountain
Moving Cambridge. City of Cambridge Transportation Master Plan Public Consultation Centre. March 7, :00 8:00 PM.
 City of Cambridge Transportation Master Plan Public Consultation Centre March 7, 2018 5:00 8:00 PM Region of Waterloo City of Cambridge Transportation Master Plan Public Consultation Centre March 7, 2018
January Project No
 January 13 2015 Project No. 5070.05 Neil Connelly, Director University of Victoria, Campus Planning and Sustainability PO Box 1700 STN CSC Victoria, BC V8P 5C2 Dear Neil: Re: UVic 2014 Traffic Final Report
ACTIVE TRANSPORTATION
 ACTIVE TRANSPORTATION Mobility 2040 Supported Goals Improve the availability of transportation options for people and goods. Support travel efficiency measures and system enhancements targeted at congestion
. ' motion. APPLtlDK.L - L"iLC_t1GLR 201b APPENDIX 7 TECHNICAL MEMOS
 . ' motion APPLtlDK.L - L"iLC_t1GLR 201b APPENDIX 7 TECHNICAL MEMOS The nmotion program will provide a large number of benefits for Middle Tennessee. This document presents selected benefits and other
4. ENVIRONMENTAL IMPACT ANALYSIS 9. TRANSPORTATION AND TRAFFIC
 4. ENVIRONMENTAL IMPACT ANALYSIS 9. TRANSPORTATION AND TRAFFIC 4.9.1 INTRODUCTION The following section addresses the Proposed Project s impact on transportation and traffic based on the Traffic Study
ADOT Statewide Bicycle and Pedestrian Program Summary of Phase IV Activities APPENDIX B PEDESTRIAN DEMAND INDEX
 ADOT Statewide Bicycle and Pedestrian Program Summary of Activities APPENDIX B PEDESTRIAN DEMAND INDEX May 24, 2009 Pedestrian Demand Index for State Highway Facilities Revised: May 29, 2007 Introduction
Appendix C. Corridor Spacing Research
 Appendix C. Corridor Spacing Research Task 3 of the Twin Cities Bicycle Study called for the development of bicycle corridor spacing guidelines. This section summarizes research of the spacing of planned
Complete Streets 101: Placemaking, Mobility and Parking
 Complete Streets 101: Placemaking, Mobility and Parking April 16, 2016 Today s Agenda Welcome Complete Streets 101 Presentation Panel Discussion and Q & A Planning Process Next Steps Open House Summary
Sustainable Transportation Planning in the Portland Region
 Sustainable Transportation Planning in the Portland Region Jennifer Dill, Ph.D. Associate Professor School of Urban Studies & Planning jdill@pdx.edu http://web.pdx.edu/~jdill/ Outline Elements of a sustainable
Exceeding expectations: The growth of walking in Vancouver and creating a more walkable city in the future through EcoDensity
 Exceeding expectations: The growth of walking in Vancouver and creating a more walkable city in the future through EcoDensity Melina Scholefield, P. Eng. Manager, Sustainability Group, City of Vancouver
The Role of MPOs in Advancing Safe Routes to School through the Transportation Alternatives Program
 The Role of MPOs in Advancing Safe Routes to School through the Transportation Alternatives Program In 2012, Congress made changes to Federal funding for Safe Routes to School that gave some metropolitan
North Coast Corridor:
 North Coast Corridor: Connecting People, Transportation & Environment Legislative Hearing: 11.8.10 1 North Coast Corridor Region s Lifeline A Regional Strategy Mobility, Economy & Environment North Coast
Multimodal Transportation Plan
 Multimodal Transportation Plan The Multimodal Transportation Plan will accommodate MILLENIALS ARE DRIVING LESS. WE CANNOT BUILD OUR WAY all modes of transportation by keeping pedestrians, OUT OF CONGESTION.
Base Information. 1. Project Title Erie Parkway and WCR 7 Traffic Signal Project
 Part 1 Base Information 1. Project Title Erie Parkway and WCR 7 Traffic Signal Project 2. Project Start/End points or Geographic Area Provide a map with submittal, as appropriate 3. Project Sponsor (entity
Summary of NWA Trail Usage Report November 2, 2015
 Summary of NWA Trail Usage Report November 2, 2015 Summary Findings: The study showed that Northwest Arkansas (NWA) had relatively high cyclist user counts per capita aggregated across the top three usage
APPENDIX W OFF-MODEL ADJUSTMENTS
 APPENDIX W OFF-MODEL ADJUSTMENTS The three-county travel demand model was used to evaluate the land use and transportation project scenarios for the Regional Transportation Plan Update. The model provided
Complete Street Analysis of a Road Diet: Orange Grove Boulevard, Pasadena, CA
 Complete Street Analysis of a Road Diet: Orange Grove Boulevard, Pasadena, CA Aaron Elias, Bill Cisco Abstract As part of evaluating the feasibility of a road diet on Orange Grove Boulevard in Pasadena,
RESOLUTION NO ?? A RESOLUTION OF THE CITY OF NEPTUNE BEACH ADOPTING A COMPLETE STREETS POLICY
 RESOLUTION NO. 2018-?? A RESOLUTION OF THE CITY OF NEPTUNE BEACH ADOPTING A COMPLETE STREETS POLICY WHEREAS, safe, convenient, and accessible transportation for all users is a priority of the City of Neptune
92% COMMUTING IN THE METRO. Congested Roadways Mode Share. Roadway Congestion & Mode Share
 COMMUTING IN THE METRO Roadway Congestion & Mode Share The majority of major roadways in Greater Des Moines are without congestion and have underutilized capacity. This surplus capacity could be used for
Agenda. US-1 Corridor Study and HIA Update. Pathway Diagram / Primary Indicators. Research Questions. Linking Multimodal Improvements to Indicators
 Icebreaker Agenda US-1 Corridor Study and HIA Update Pathway Diagram / Primary Indicators Research Questions Linking Multimodal Improvements to Indicators Vulnerable Populations US-1 Corridor Study Vision
WHITE PAPER: TRANSIT SERVICE FOR SOUTH SHAGANAPPI
 9/27/2012 TRANSIT PLANNING WHITE PAPER: TRANSIT SERVICE FOR SOUTH SHAGANAPPI 2012 Calgary Transit 1 Table of Contents Purpose... 3 Area of Change... 3 Background... 3 Access to destinations... 5 Connecting
Complete Streets 101: The Basics
 Complete Streets 101: The Basics Michigan Municipal League - Capital Conference March 21, 2017 Chip Smith, AICP - Senior Planner - Wade Trim Inc. and City Council member City of Ann Arbor 2017 MML Capital
Magnolia Place. Traffic Impact Analysis. Prepared for: City of San Mateo. Prepared by: Hexagon Transportation Consultants, Inc.
 Magnolia Place Traffic Impact Analysis Prepared for: City of San Mateo Prepared by: Hexagon Transportation Consultants, Inc. Updated January 4, 2010 Table of Contents 1. Introduction...1 2. Existing Conditions...6
San Mateo County Comprehensive Bicycle and Pedestrian Plan Open House
 San Mateo County Comprehensive Bicycle and Pedestrian Plan Open House October 28, 2010 Presented to San Mateo County residents and interested parties by Lauren Ledbetter, Alta Planning + Design Matt Haynes,
Somerville Community Path Feasibility Study
 Somerville Community Path Feasibility Study Prepared for: City of Somerville, Massachusetts Strategic Planning and Community Development July 14, 2006 Prepared by: VOLLMER Table of Contents Section 1.0
WALK- AND bike-friendly TURLOCK
 WALK- AND bike-friendly TURLOCK Ideas to Encourage Walking and Biking Benefits to the COMMUNITY Get Connected People who walk and bike have many more opportunities for casual interactions with friends
I-105 Corridor Sustainability Study (CSS)
") I-105 Corridor Sustainability Study (CSS) Metro Streets and Freeways Subcommittee March 21, 2019 Gary Hamrick Cambridge Systematics, Inc. I-105 CSS Project History & Background Funded by Caltrans Sustainable
I-105 Corridor Sustainability Study (CSS) Metro Streets and Freeways Subcommittee March 21, 2019 Gary Hamrick Cambridge Systematics, Inc. I-105 CSS Project History & Background Funded by Caltrans Sustainable
Attachment A: Columbus Area Metropolitan Transportation Plan Objectives, Performance Measures, and Targets
 OBJECTIVE: Reduce the percentage of commuters driving alone, and increase the percentage of commuters riding transit, ing Reducing single occupancy auto commutes and increasing commuters using alternative
Purpose and Need. Chapter Introduction. 2.2 Project Purpose and Need Project Purpose Project Need
 Chapter 2 Purpose and Need 2.1 Introduction The El Camino Real Bus Rapid Transit (BRT) Project (Project) would make transit and other transportation improvements along a 17.6-mile segment of the El Camino
Rail Station Fact Sheet Downtown Carrollton Station
 Rail Station Fact Sheet Downtown Carrollton Station Station Overview Downtown Carrollton Station is located at East Belt Line Road and Broadway Street near the historic Downtown Carrollton Square. The
INFRASTRUCTURE: Using the Grid to Create a more Self-Sustaining Downtown. Studio Spring 2013
 EMERGENT FUTURES The San Diego Section of the American Society of Civil Engineers (ASCE) released a new report, the 2012 San Diego County Infrastructure Report Card. Since the last San Diego Report Card
Transportation Trends, Conditions and Issues. Regional Transportation Plan 2030
 Transportation Trends, Conditions and Issues Regional Transportation Plan 2030 23 Regional Transportation Plan 2030 24 Travel Characteristics Why Do People Travel? Over one-half of trips taken in Dane
Public Consultation Centre For. Transportation Master Plan Update. Information Package
 Public Consultation Centre For Transportation Master Plan Update Information Package Date Location Hours Tuesday, September 12, 2017 Wednesday, September 13, 2017 Tuesday, September 19, 2017 Cambridge
GRAHAM PEDESTRIAN TRANSPORTATION PLAN
 GRAHAM PEDESTRIAN TRANSPORTATION PLAN Chapter 1 I 1.1 Scope and Purpose n March of 2005, the City of Graham contracted with Greenways Incorporated (GWI) to create a Pedestrian Transportation Plan. The
BETHEL ROAD AND SEDGWICK ROAD CORRIDOR STUDY
 DRAFT PLAN City Council Meeting August 14, 2017 STUDY AREA Sedgwick Corridor State Route 160, principal arterial with Class 3 access management designation, commuter and freight route, connection to SR
Phone: Fax: Project Reference No. (to be filled out by MassHighway):
:") Massachusetts Highway Department District 3 Project Need Form (PNF) This form is intended to provide preliminary information about the proposed project. It is not expected that all information that is
Massachusetts Highway Department District 3 Project Need Form (PNF) This form is intended to provide preliminary information about the proposed project. It is not expected that all information that is
2017 North Texas Regional Bicycle Opinion Survey
 2017 North Texas Regional Bicycle Opinion Survey Sustainable Development Program Kevin Kokes, AICP Public Meetings April, 2018 North Central Texas Council of Governments MPO for the Dallas-Fort Worth Region
The best indicator of an individual s and expanding access to parks and open space.
 Health & Wellness Create a Safe and Healthy Built Environment Artist s rendering, 2014 Health is important to Loveland residents, and stakeholders see the many strong connections between quality of life,
West Dimond Blvd Upgrade Jodhpur Street to Sand Lake Road
 West Dimond Blvd Jodhpur St to Sand Lake CSS Transportation Project Summary Municipality of Anchorage Project # 05 005 Project Manager: John Smith, P.E. (MOA PM&E) Project Administrator: Julie Makela,