Urban Transportation Indicators
|
|
|
- Grant Julius Joseph
- 6 years ago
- Views:
Transcription

1 Transportation Association of Canada Urban Transportation Indicators FIFTH SURVEY April 2016
2 Transportation Association of Canada Urban Transportation Indicators FIFTH SURVEY April 2016
3 DISCLAIMER The material presented in this text was carefully researched and presented. However, no warranty expressed or implied is made on the accuracy of the contents or their extraction from reference to publications; nor shall the fact of distribution constitute responsibility by TAC or any researchers or contributors for omissions, errors or possible misrepresentations that may result from use of interpretation of the material contained herein. Copyright 2016 by Transportation Association of Canada 2323 St. Laurent Blvd. Ottawa, ON K1G 4J8 Tel. (613) ~ Fax (613) ISBN
4 TAC REPORT DOCUMENTATION FORM Title and Subtitle Urban Transportation Indicators Fifth Survey Report Date April 2016 Coordinating Agency and Address Transportation Association of Canada 2323 St. Laurent Boulevard Ottawa, ON K1G 4J8 ITRD No. Author(s) David Kriger, Andreas Rose, Erhan Baydar, Jeff Moore, Lawrence Frank, Jim Chapman, Alan Pisarski Corporate Affiliation(s) and Address(es) David Kriger Consultants Inc. 24 Castlethorpe Crescent Ottawa, Ontario K2G 5P6 Canada Abstract The fifth Urban Transportation Indicators (UTI) Survey is the latest in a series of surveys that have, individually and collectively, provided an important picture of transportation behaviour and trends in Canadian urban areas. The overall goal of this survey program was to build a consistent and reliable database about urban transportation and develop indicators for Canadian municipalities and transportation stakeholders. The following steps were conducted as part of the survey: Established key geography for all metropolitan areas. Examined issues associated with CMAs and urban units having changing boundaries over time. Investigate ways to better account for the geographic variability that exists for many transportation indicators within the largest CMAs. Obtained and processed all the higher- level data and commercial sourced data as needed for the UTI study. Developed and issued surveys to participating municipalities and manage data collection. In larger urban areas, coordination across many municipalities, agencies and levels of jurisdiction was necessary to ensure data quality and consistency. Processed and analyzed all the data, including under a time-series perspective of the new streamlined indicators. Keywords Traffic and Transport Planning Accident rate Canada Data processing Financing Interview Network (traffic) Network (transport) Reginal planning Statistics Urban area The UTI Survey Database, which integrates data from the fifth survey as well as previous surveys, is also available in conjunction with this technical report. Supplementary Information Recommended citation: Kriger, D., Rose, A., Baydar, E., Moore, J., Frank, L., Chapman, J, and Pisarki, A Urban Transportation Indicators Fifth Survey. Ottawa, ON: Transportation Association of Canada.
5
6 ACKNOWLEDGEMENTS The development of the Urban Transportation Indicators Fifth Survey document and database was undertaken with funding provided by several agencies. TAC gratefully acknowledges the following funding partners for their contribution to the project. City of Calgary Ville de Montréal City of Saskatoon City of Vancouver Greater Vancouver Regional District Ministère des Transports du Québec Ministry of Transportation of Ontario Natural Resources Canada TransLink (South Coast British Columbia Transportation Authority) Transport Canada University of British Columbia April 2016 i
7 PROJECT STEERING COMMITTEE This report was developed under the supervision of a project steering committee of volunteer members. The participation of these committee members throughout the project is gratefully acknowledged. Zorana McDaniel (Co-Chair), City of Calgary Mohammad Tayyaran (Co-Chair, from October 2013), Transport Canada Ana Maria Leyton (Co-Chair, to October 2013), Transport Canada Mauricio Alamillo, Ministry of Transportation of Ontario Stéphane Brice, Ville de Montréal Steve Brown, City of Vancouver Victor Gaspar, TransLink Fadi Jarouche, Ministère des Transports du Québec Marina Melchiorre, City of Saskatoon Pierre Tremblay, Ministère des Transports du Québec Craig Stackpole (Project Manager), Transportation Association of Canada (from February 2014) Katarina Cvetkovic (Project Manager), Transportation Association of Canada (to February 2014) Consultant Team The Fifth Urban Transportation Indicators Survey, database and report were prepared by a consultant team lead by David Kriger Consultants Inc. (DKCI): David Kriger, DKCI (Consultant Project Manager) Andreas Rose, R.A. Malatest & Associates Ltd. Erhan Baydar, R.A. Malatest & Associates Ltd. Jeff Moore, R. A. Malatest & Associates Ltd. Dr. Lawrence Frank, Urban Design 4 Health Ltd. Jim Chapman, Urban Design 4 Health Ltd. Alan Pisarski, independent consultant ii April 2016
8 PARTNERS AND SURVEY PARTICIPANTS The Fifth Urban Transportation Indicators Survey relies on the participation of local partners in preparing and then validating data for the survey. Appreciation is expressed to these technical representatives and their colleagues for their time and enthusiasm. CMA Abbotsford Barrie Calgary Edmonton Greater Sudbury / Grand Sudbury Guelph Halifax Hamilton Kelowna Kitchener-Cambridge-Waterloo London Moncton Montréal Oshawa Ottawa-Gatineau Technical Representatives Russ Mammel (City of Abbotsford) Stew Patterson (City of Barrie) Ekke Kok (City of Calgary) Shahram Tahmasseby (City of Calgary) Daniel Vriend (City of Edmonton) Dave Kivi (City of Greater Sudbury / Grand Sudbury) Gwen Zhang (City of Guelph) Alan Taylor (Halifax Regional Municipality) Mohan Philip (City of Hamilton) Patrick Monaghan (Regional Municipality of Halton) Kumar Ranjan (Regional Municipality of Niagara) Rafael Villarreal (City of Kelowna) Geoffrey Keyworth (Regional Municipality of Waterloo) Maged Elmadhoon (City of London) Stéphane Thibodeau (City of Moncton) Yves Phaneuf (Communauté métropolitaine de Montréal) Jean-Michel Boisvert (Communauté métropolitaine de Montréal) Philippe Rivet (Communauté métropolitaine de Montréal) Stéphane Brice (Ville de Montréal) Chris Leitch (Regional Municipality of Durham) Jennifer M. Armstrong (City of Ottawa) Ahmad Subhani (formerly with the City of Ottawa) Tim Wei (City of Ottawa) Maurin Dabbadie (Ville de Gatineau) Québec Saguenay Saint John Marc Rondeau (Communauté métropolitaine de Québec) Nabila Bachiri (Communauté métropolitaine de Québec) Denis Coulombe (Ville de Saguenay) Tim O Reilly (City of Saint John) April 2016 iii
9 CMA Saskatoon Sherbrooke St. John s St. Catharines Niagara Toronto Trois-Rivières Vancouver Victoria Windsor Winnipeg Technical Representatives Lanre Akindipe (City of Saskatoon) Denis Gélinas (Ville de Sherbrooke) Jocelyn Grenier (Ville de Sherbrooke) Robin King (City of St. John s) Kumar Ranjan (Regional Municipality of Niagara) Michael Hain (City of Toronto) Chris Leitch (Regional Municipality of Durham) Patrick Monaghan (Regional Municipality of Halton) Shahrzad Borjian (Regional Municipality of Peel) Mark Hanlon (Regional Municipality of York) Jacques Bourassa (Société de transport de Trois-Rivières) Pierre Desjardins (Ville de Trois-Rivières) Guy Plamondon (Ville de Trois-Rivières) Daniel Massicotte (Ville de Trois-Rivières) Victor Gaspar (TransLink) Dave Murray (TransLink) Javier Pacheco-Raguz (TransLink) Corey Burger (Capital Regional District) John Hicks (Capital Regional District) Jeff Hagan (City of Windsor) Doug R. Hurl (City of Winnipeg) Other contributors to the Survey are listed in Appendix A. Appreciation is also expressed to members of the Project Steering Committee for their contributions to selected parts of the survey: Fadi Jarouche of the Ministère des transports du Québec prepared certain data for all five Québec CMAs, Mauricio Alamillo of the Ministry of Transportation of Ontario prepared certain tabulations for the Toronto CMA, and Victor Gaspar of TransLink prepared and coordinated the preparation of data for the Vancouver CMA and selected municipalities. Appreciation also is expressed to Wendy Reuter of the Canadian Urban Transit Association, for the provision of selected data on transit ridership and supply. Finally, appreciation is expressed to Brian Hollingworth of IBI for the provision of several files from the previous UTI survey. Cover photos were provided by David Kriger, DKCI. iv April 2016
10 ABBREVIATIONS AND ACRONYMS BMI CAC CBD CCHS CD CMA CO CO 2 CSD CT CUTA EUA GDP GHG HC HOV KM KM 2 L M NHS NO x O-D TAC TDM UTI VKT VOC WHO Body Mass Index Criteria Air Contaminant Central Business District Canadian Community Health Survey Census Division Census Metropolitan Area Carbon monoxide Carbon dioxide Census Subdivision Census Tract Canadian Urban Transit Association Existing Urban Area Gross domestic product Greenhouse gases Hydrocarbons High occupancy vehicle Kilometre Square kilometre Litres (of gasoline or diesel fuel) Metre National Household Survey Nitrogen oxides Origin-destination (travel survey) Transportation Association of Canada Transportation demand management Urban Transportation Indicators Vehicle-kilometres travelled Volatile organic compounds World Health Organization April 2016 v
11 TABLE OF CONTENTS 1 Introduction Background to the Urban Transportation Indicators Survey New Features in the Fifth UTI Review Findings and Their Implications to UTI Sources of Data Outline of Survey Questionnaire Definition of Geographical Areas CSD and CD Reporting Survey Response Rates Purpose and Outline of Report Key Findings Introduction Synopsis Growth Continues to Accrue to the Largest Urban Areas Urban Densities Are increasing, Although at Different Rates The Automobile Is Still Dominant, but Other Modes are Making Progress Investment in Transit Has Continued Sustainable Policies Continue to be Implemented Public Health is Influenced by Transportation Policy and Infrastructure Demographic and Economic Changes Will Influence Future Travel Needs Sustainability Scorecard Land Use and Transportation Initiatives Introduction and Approach Survey Overview Progress Since Trends by Size of Urban Area Trends Related to Specific Initiatives Urban Structure Introduction Components of Urban Growth Urban Densities vi April 2016
12 5 Overall Transportation Activity and Impacts Trip Making Modal Shares - CBD Modal Shares EUA Overview Mode Share by Age Group Mode Share by Occupation Mode Share by Gender Energy and Environment Public Transit Transit Demand Annual transit ridership Per capita ridership Commute transit shares Transit Supply Park-and-Ride Active Transportation Walking and Cycling Demand Cycling Supply Walking Supply Roads and Motor Vehicle Use Road Supply Parking Supply Motor Vehicle Ownership Vehicle-Kilometres Travelled Economic Performance Revenue Sources Transportation Expenditures Role of Transportation Investment in the Local Economy Health Indicators Introduction Physical Activity, Obesity and Related Conditions General April 2016 vii
13 Travel to School Proximity to Schools Time Spent in Vehicles Sidewalk Coverage Pedestrian / Cyclist Safety and Traffic Collisions Exposure to Air Pollution and Noise Pollution Air Pollution Generated by Burning of Transportation Fuels Proximity to Major Roads Asthma Prevalence Community Cohesion / Social Networks / Mental Health Heat / Heat Islands Conclusions and Possible Improvements for Future Surveys APPENDIX A. Other Survey Contributors B. Survey Questionnaire C. Definition of Geographic Areas D. Key Indicators viii April 2016
14 LIST OF EXHIBITS Exhibit 1-1. UTI Survey History... 2 Exhibit 1-2. Responses by Urban Area by Year... 5 Exhibit 1-3. Geographical Definitions Example (Ottawa-Gatineau)... 8 Exhibit 1-4. CSD and CDs Reported in the UTI Exhibit 1-5. Response Rates by Survey Section Exhibit 1-6. Status of Urban Travel Surveys in Responding CMAs Exhibit 2-1. CMA Group Definitions Exhibit 2-2. Total CMA Population by Urban Area Group, Exhibit 2-3. Growth in Population by CMA Group, Exhibit 2-4. EUA Population Density by Urban Area Group, Exhibit 2-5. Change in Population Density by Group, Exhibit 2-6. Summary of Automobile and Non-Automobile Indicators, Exhibit 2-7. Road and Transit Expenditures Per Capita, Exhibit 2-8. Tracking of Progress of TAC s Vision Exhibit 3-1. Categories of Land Use and Transportation Initiatives Exhibit 3-2. Degree of Implementation of Land Use and Transportation Initiatives, Exhibit 3-3. Average Implementation Levels by Category, Exhibit 3-4. Grouped Average Implementation Levels by Category, Exhibit 3-5. Implementation Levels by Groups, Exhibit 3-6. Ten Least-Implemented Initiatives, Exhibit 3-7. Ten Most-Implemented Initiatives, Exhibit 4-1. CMA and EUA population, Exhibit 4-2. CMA Population Levels and Growth, Exhibit 4-3. CMA Employment Levels and Growth, Exhibit 4-4. Changes in Population of EUA versus Rest of CMA, Exhibit 4-5. Proportion of Employment (Jobs) in CBD, Exhibit 4-6. Change in CBD Employment (Jobs) versus rest of CMA, Exhibit 4-7. Jobs per Working Population, Exhibit 4-8. Jobs per Working Population, CSDs and CDs Exhibit 4-9. EUA Urban Density (Population + Jobs), Exhibit Percent Change in EUA Densities, Exhibit EUA, CBD and CMA Densities Compared (Population + Jobs), April 2016 ix
15 Exhibit 5-1. EUA Daily Trips per Capita, Exhibit 5-2. Median CMA Journey-to-Work Trip Distances, Exhibit 5-3. Median CMA Journey-to-Work Trip Distances, - - Changes Exhibit 5-4. Median EUA Journey-to-Work Trip Distances, Exhibit 5-5. Journey-to-Work Durations by Mode (median minutes), by CMA Exhibit 5-6. Journey-to-Work Durations by Mode (median minutes), - Summary Exhibit 5-7. Modal Shares to CBD, AM Peak Period (%) Exhibit 5-8. Auto Occupancy to CBD, AM Peak Period Exhibit 5-9. Total Trips to CBD, All Modes, AM Peak Period, Exhibit Modal Shares to CBD, Daily (24 hour, %) Exhibit CBD Mode Shares for Daily Trips (24-hour), Exhibit Modal Shares for EUA, Daily (24 hour, %, all ages) Exhibit EUA Mode Shares for Daily Trips (24 hour, %, all ages), Exhibit Total EUA Trips per Capita, All Modes, 24 hour Exhibit CMA Journey-to-Work Mode Shares, Exhibit Modal Shares for EUA, Daily (24 hour, % by age group) Exhibit Auto Occupancy for EUA, Daily (24 hour, by age group) Exhibit EUA Commute Mode Share by Occupation Exhibit EUA Commute Mode Share by Occupation by CMA Group Exhibit EUA Commute Share by Gender Exhibit Total Transportation-Related CO 2 Emissions (Gasoline), Exhibit Daily Gasoline Use and Annual CO 2 Emissions Per Capita, Exhibit Daily Diesel Use and Annual CO 2 Emissions per Capita, Exhibit 6-1. Annual Transit Ridership, Exhibit 6-2. Percent Change in Annual Ridership, Exhibit 6-3. Annual Transit Rides per Capita, Exhibit 6-4. Percent Change in Annual Transit Rides per Capita, Exhibit 6-5. CMA Journey-to-Work Transit Mode Shares, Exhibit 6-6. Percent Changes, CMA Journey-to-Work Transit Mode Shares, Exhibit 6-7. Annual Revenue-Vehicle-Kilometres per Capita, Exhibit 6-8. Annual Revenue-Vehicle-Hours per Capita, Exhibit 6-9. Supply of Higher-Order Transit, Total Kilometres by Facility Type Exhibit Supply of Higher-Order Transit, Kilometres per 100,000 Capita x April 2016
16 Exhibit Park-and-Ride Spaces per 1,000 Capita, Exhibit 7-1. CMA Journey-to-Work Cycling Mode Shares, Exhibit 7-2. CMA Journey-to-Work Cycling Mode Shares, Five-Year Changes to Exhibit 7-3. CMA Journey-to-Work Walking Mode Shares, Exhibit 7-4. CMA Journey-to-Work Walking Mode Shares, Five-Year Changes to Exhibit 7-5. CMA Journey-to-Work Active Transportation Mode Shares, Exhibit 7-6. Total EUA Bikeway Kilometres, Exhibit 7-7. EUA Route-Km of On-Street Bikeways per Roadway Lane-Km, Exhibit 7-8. EUA Route-Km of On-Street Bikeways per Roadway Lane-Km, Changes Exhibit 7-9. EUA Off-Street Bikeway Path-Km per Km 2 Urbanized Area, Exhibit EUA Off-Street Bikeway Path-Km per Km 2 Urbanized Area, Changes Exhibit EUA Kilometres of Sidewalks per Capita, Exhibit 8-1. EUA Road-Lane-Kilometres per 1,000 Residents, Exhibit 8-2. EUA Road-Lane-Kilometres per 1,000 Residents by Facility Type, Exhibit 8-3. Parking Supply per Job in the CBD, (Public Parking Spaces) Exhibit 8-4. Maximum Hourly Cost, On-Street Parking in the CBD, Exhibit 8-5. Maximum Monthly Permit Cost, Off-Street Parking in the CBD, Exhibit 8-6. EUA Light-Duty Vehicles per Capita, Exhibit 8-7. EUA Light-Duty Vehicles per Capita, Five-Year Changes to Exhibit 8-8. Light-Duty Vehicles per Capita and Journey-to-Work Auto Mode Shares, Exhibit 8-9. Light-Duty Vehicles per Worker and Journey-to-Work Auto Mode Shares, Exhibit Light-Duty Vehicles per Worker and Journey-to-Work Auto Mode Shares, -126 Exhibit Daily EUA Vehicle-Kilometres Travelled Per Capita, Exhibit 9-1. Summary of Responses to Sources of Transportation Funding, Exhibit 9-2. Municipal / Regional Transportation Budgets per Capita in CMA, (all expenditures, LESS transit) Exhibit 9-3. Municipal / Regional Transportation Budgets, % breakdown in CMA, (all capital and operating/maintenance expenditures, LESS transit) Exhibit 9-4. Municipal / Regional Transit Budgets per Capita in CMA, (all transit expenditures) Exhibit 9-5. Municipal / Regional Transit Budgets, % breakdown in CMA, (all transit capital and operating/maintenance expenditures) Exhibit 9-6. Transportation Expenditures as % of CMA GDP, Exhibit Physical activity during leisure time, moderately active or active, April 2016 xi
17 Exhibit Percent of respondents (18 years and over) with overweight or obese BMI, Exhibit Percent of respondents with high blood pressure diagnosis, Exhibit Percent of respondents with diabetes diagnosis, Exhibit Percent of all 5 to 18 year old (grades K-12) students walking or cycling to school Exhibit Percent of 5-18 year old (grades K-12) students living within a certain distance of a school Exhibit Average minutes per trip, per person spent in car by trip type Exhibit Average minutes per trip, per person spent in transit vehicle by trip type Exhibit Percent of streets with sidewalks on both sides of the street Exhibit Traffic-related fatalities by mode type, Exhibit Traffic-related injuries by mode type, Exhibit Traffic-related fatalities by all modes for,, and Exhibit Traffic-related injuries by all modes for,, and Exhibit Daily Criteria Air Contaminants, Exhibit Tonnes of CO 2 emissions per day from daily diesel sales, Exhibit Tonnes of CO 2 emissions per day from daily gasoline sales Exhibit Percent of population living, working, or attending school within 100m of a major road Exhibit Percent of respondents with asthma diagnosis, Exhibit Percent of respondents rating their health as very good or excellent, Exhibit Percent of respondents rating their health as fair or poor, Exhibit Percent of respondents with a somewhat strong or very strong sense of belonging to their community, Exhibit Percent of respondents with very good or excellent self-reported mental health status, Exhibit Percent of respondents with fair or poor self-reported mental health status, Exhibit Percent of respondents rating their life satisfaction as satisfied or very satisfied, Exhibit Percent of population living within 400m of a public park that allows passive or active use in a natural, green space Exhibit Impervious (built) area as a proportion of total land area xii April 2016
18 April
19 1. INTRODUCTION 1.1 BACKGROUND TO THE URBAN TRANSPORTATION INDICATORS SURVEY The Urban Transportation Indicators (UTI) Survey series was introduced by the Urban Transportation Council of the Transportation Association of Canada (TAC) in The UTI surveys originally were intended to assess the progress of Canadian urban areas on sustainable transportation, as defined by TAC s New Vision for Urban Transportation. 1 The New Vision comprises 13 principles that describe a desirable future multi-modal transportation system and the supporting urban form and land use. In addition to its role in monitoring progress towards sustainable transportation, the UTI survey has become a key compendium of urban transportation and land use data and trends in Canada. This report presents the findings of the Fifth UTI (UTI5) survey. Except for the initial pilot survey, each UTI survey has used the Census year exclusively as its reference year. 2 This basis has ensured a reliable source of cross-canada demographic data and a consistent definition of an urban area; that is, the Census Metropolitan Area (CMA). Statistics Canada defines as a CMA as an area that has one or more neighbouring municipalities situated around a core, with a total area population of at least 100,000, of which 50,000 or more live in the core. 3 The basis in the CMA geographies also enables consistent comparisons among Canadian urban areas. Exhibit 1-1 summarizes the history of the UTI surveys. It can be seen that the number of urban areas included in the survey now comprises the full set of 33 CMAs. It also can be seen that inevitably there must be a lag between the Census year and the actual publication of the UTI, in part to allow for the Census data to be compiled, edited, tabulated and analyzed before they are released. Exhibit 1-1. UTI Survey History UTI Survey Reference Year(s) Number of CMAs Included in the UTI Year(s) UTI Conducted Pilot survey nd UTI rd UTI th UTI th UTI The Canadian Census of Population is conducted every five years, in the years ending in 1 and April 2016
20 1.2 NEW FEATURES IN THE FIFTH UTI REVIEW The UTI combines a survey of local municipal and provincial CMA representatives with the Census and other national data sets. This general method has been retained over the course of the series. However, prior to launching the UTI5 survey, the project team conducted an overall review. The review took into account the findings of a workshop at the 2010 TAC Annual Conference, following the release of the Fourth UTI report. Among other topics, the workshop asked participants how TAC could adjust the UTI series in order to account for new needs. 4 The review examined other transportation indicator surveys in Canada and around the world. It also examined how individual UTI4 indicators had actually been used, using the Project Steering Committee s own experiences as a practical guide. The review examined the key factors that influenced travel demand. Citing the Commuting in America series, 5 the review identified gender equality in the workforce, an aging population, and a widely dispersed workforce (meaning employers must draw from ever-larger commutersheds to find the skilled labour they need) as key factors that influence travel patterns and trends. The proposed UTI5 survey concept was presented to the CMAs in a nationwide webinar in December This provided the opportunity for local CMA representatives to comment on the concept and suggest refinements; and it also served to alert the local representatives to the subsequent survey FINDINGS AND THEIR IMPLICATIONS TO UTI5 The review addressed several topics. Relevancy. The concept and implementation of urban sustainable transportation have evolved over the two-decade history of the UTI. In the meantime, other related interests have arisen. As a result, the review looked at ways to incorporate these other interests while still retaining the original focus on sustainable transportation. Two new topics were added: o o Health and transportation. This major new initiative puts more emphasis on active transportation as well as on air quality and other factors that influence human health. Economic performance. This topic refocuses the UTI s original basis in financial and revenue sources, which have been simplified, in order to depict the importance of transportation in an urban area s overall economy. In addition, some categories of questions were redefined, in order to provide a better basis for addressing key emerging topics, notably: o Aging population. A categorization of mode shares by age group was introduced. This provides a basis for the future comparison of how people s travel choices vary as young adults enter the workforce and as the overall population ages. 4 5 Workshop on Urban Transportation Indicators and Trends: Implications for Policies and Programs, Summary, Transportation Association of Canada, Ottawa, The Commuting in America series draws from the decennial US Census. For the most recent (2013) Commuting in America IV briefs, now nearing completion, see The Commuting in America III report () is available at April
21 o Air quality. This topic is of increased interest in urban areas, especially as it relates to congestion, traffic operations, human health and the resultant economic impacts. Updated questions. While the UTI4 approach and phrasing of the questions was retained as a basis, this review revisited the wording of each question in order to reflect current needs, enhance clarity, and allow for multiple methods of calculation. The review also resulted in the addition of new categories in the Part A status of transportation and land use initiatives, which are discussed in Chapter 3. Uniqueness. This reflected the emergence of several other surveys in Canada and elsewhere, subsequent to the publication of the Fourth UTI. Although the UTI is easily Canada s (and one of the world s) most comprehensive compilation of urban transportation characteristics and trends, part of its appeal is its avoidance of duplication of other studies. Best practices. This review examined how other surveys compile data, recognizing that many indicators can have more than one viable method of calculation, as well as multiple data sources, or data sources that are defined differently among the CMAs. Streamlining. This review examined ways to streamline and consolidate the development of the data, with the goal of reducing respondent burden. It also eliminated a small number of questions that had received poor responses, identified as problematic for respondents to compile or had been collected but not tabulated. Web-based data collection. The availability and reliability of web-based survey technologies facilitated the collection of data from the local respondents. Among other features, the webbased survey available in both English and French provided pop-up references and definitions, allowed users to save interim results and return later, and allowed for multiple contributors from the same agency to access the survey. User-friendly database. A new survey database has been prepared. This incorporates data from the third and fourth UTI surveys and allows the user to make his or her own comparisons among the, and results, where the same indicators have been retained. It was recognized that these updates would not always allow for the analysis of trends from the previous UTI surveys, although it should be noted that this was true only for a minority of the indicators. At the same time, the new or rephrased questions provide a basis for further comparison in the future, ensuring relevancy and broadening the use of the UTI series. 1.3 SOURCES OF DATA As with the previous UTI surveys, there were two main sources of data, local and national: Local. Municipal, regional and provincial authorities in all 33 CMAs were asked to provide specific local information, via the web-survey. Exhibit 1-2 lists the responses by UTI. For UTI5, 28 CMAs participated, down from 31 in UTI4. 4 April 2016
22 Exhibit 1-2. Responses by Urban Area by Year CMA Survey Year Abbotsford Barrie Brantford X Calgary Edmonton Greater Sudbury / Grand Sudbury Guelph Halifax Hamilton Kelowna Kingston X Kitchener-Cambridge-Waterloo London Moncton Montréal Oshawa Ottawa - Gatineau Peterborough X X Québec X Regina X Saguenay Saint John X Saskatoon X Sherbrooke St. Catharines -Niagara St. John's Thunder Bay X X X Toronto Trois-Rivières Vancouver Victoria Windsor Winnipeg No. of CMAs Surveyed (+3) 31 (+2) 28 (+5) Legend: Submitted response x Non-participant: selected indicators developed using alternate sources April
23 National. Information was obtained from four sources that had nation-wide coverage: o o o o Statistics Canada, notably the Census of Population and the National Household Survey (NHS). Note that the voluntary NHS replaced the mandatory Census 2B Long Form. Like its predecessor, the NHS provides Place of Work / Place of Residence (Journey to Work) linkages. Canadian Urban Transit Association (CUTA) provided data on transit ridership and transit supply. These data are presented in Chapter 6. Note that the transit supply question was reformulated, compared with previous UTI surveys. The Kent Group Ltd. provided retail vehicle fuel sales for each CMA. For the first time, diesel fuel sales data were obtained, in addition to gasoline fuel sales: this was done to support the discussion of air quality as part of the new health and transportation indicators, given the important differences in the pollutants generated by the two types of fuels. Canadian Community Health Survey (CCHS) is an annual Statistics Canada survey that gathers health-related data at the CMA and other sub-provincial geographies. The CCHS provided key input to the new health and transportation indicators, to complement the data provided by local CMA representatives. 6 For convenience, the CUTA, Kent and CCHS data are identified explicitly as sources in the discussion and exhibits below. 1.4 OUTLINE OF SURVEY QUESTIONNAIRE As a result of the review, the original UTI survey questionnaire was reorganized and consolidated, and some new sections were added; all while still allowing for an analysis of historical trends for most indicators. The UTI5 survey had eight sections: 1. Land use and transportation initiatives. 2. Background (geography). 3. Land use characteristics (demographics). 4. Transportation supply. 5. Transportation demand. 6. Transportation system performance (linking supply and demand). 7. Economic performance. 8. Health. The UTI5 survey questionnaire can be found in Appendix B. 6 For more information on the CCHS, see 6 April 2016
24 1.5 DEFINITION OF GEOGRAPHICAL AREAS Three geographical areas are considered in the UTI5: the Region (i.e., the CMA), Existing Urbanized Area (EUA) and the Central Business District (CBD). These are defined as follows: Region. This is the CMA boundary, as defined by Statistics Canada for the Census. Existing Urban Area (EUA). The EUA is defined by Statistics Canada as those Census Tracts in which over 33% of the land area is classified as urbanized by Statistics Canada (that is, having minimum concentrations and densities of population 7 ). Some CMAs have one or more discontinuous areas generally smaller outlying communities that meet the 33% urbanization threshold. As with the Fourth UTI, local CMA representatives generally elected to exclude these outlying areas from their EUA definition, for the purposes of the UTI5. In other words, the EUA definition is based on Statistics Canada s definition, with modifications by local authorities. Statistics Canada in turn supplied its data according to these modified definitions. Central Business District (CBD). This is the area or areas within the CMA with the highest concentration of employment typically, the historical downtown core. The CBD is defined by local representatives. In most cases, the definitions corresponded to Census Tracts. An example of the geographical definitions is shown in Exhibit 1-3. Maps of the definitions for each urban area are provided in Appendix C. 7 H.A. Puderer, Urban Perspectives and Measurement, Statistics Canada, Ottawa, See April
 Source: Statistics Canada Consistent with the Fourth UTI, the UTI5 accounted for changes in the geographical boundaries; in particular, the EUA")
25 Exhibit 1-3. Geographical Definitions Example (Ottawa-Gatineau) Source: Statistics Canada Consistent with the Fourth UTI, the UTI5 accounted for changes in the geographical boundaries; in particular, the EUA boundaries. This reflects urban growth and expansion over time. To ensure consistent trend analyses and avoid possible distortions in the comparisons, Statistics Canada supplied and populations according to the EUA boundaries. Note that a fourth geographical definition, the Central Area (CA), was not retained from the Fourth UTI. The CA represented a central, mixed-use area, characterized by high concentrations of jobs and residents and including the CBD. It was intended to demonstrate how liveability and density in the central core had evolved, as an indicator of sustainable development. However, it proved difficult for local CMA representatives to provide the necessary data. As well, in the meantime a Queen s University research project developed a broad classification of CMA sub-areas by population density, using Census data. This broader definition recognizes high-density areas outside the core for example, around suburban universities and colleges. The research also used the Place of Work / Place of Residence linkages to further classify these areas by commuter mode, resulting in four categories: active cores (with strong walking and cycling shares), transit suburbs, auto suburbs and exurban areas (outside the urbanized area). With suburban populations making up 80% of the CMAs populations, the research demonstrated the strong dependence of commuters on the automobile. 8 As a result, the CA definition was dropped from the UTI5. 8 D. Gordon and Janzen, M., Suburban Nation? Estimating the Size of Canada s Suburban Population, Journal of Architectural and Planning Research, Volume 30 Number, 3, Autumn April 2016
26 1.6 CSD AND CD REPORTING Over time, the three largest CMAs Toronto, Montréal and Vancouver have become complex urban regions, with some component cities having significant concentrations of jobs and population. In addition, the Ottawa-Gatineau CMA uniquely covers two provinces, and being able to distinguish between the two parts was important to provincial planners. As a result, selected indicators were developed for the key municipal components of these four CMAs. These are defined as Census Subdivisions (CSD) or Census Divisions (CD). A Census Subdivision is defined as the general term for municipalities (as determined by provincial/territorial legislation) or areas treated as municipal equivalents for statistical purposes (e.g., Indian reserves, Indian settlements and unorganized territories). The Census Division corresponds to a county, regional district, or other similar group of CSDs for which regional planning and provision of services can occur. 9 The boundaries of CDs do not always align with CMA boundaries, with many CMAs containing only parts of some CDs. Moreover, the number of CSDs contained in the four CMAs varied, from 15 CSDs in the Ottawa-Gatineau CMA to 91 CSDs in the Montréal CMA. Reporting each CSD clearly is not meaningful for an exercise such as the UTI. For the three largest CMAs, it was determined that municipalities that were large enough to be major cities in their own right would be reported. This was defined as municipalities having populations of at least 200,000 and which provided most of their own services (although it was recognized that some services, such as public transit, might be provided at a regional level). Three CSDs were identified for the Vancouver and Toronto CMAs, three CDs were identified for the Montréal CMA, and two CSDs were identified for the Ottawa-Gatineau CMA. The 11 municipalities are listed in Exhibit 1-4. Exhibit 1-4. CSD and CDs Reported in the UTI5 Survey Year CD/CSD NAME Burnaby (CSD) Surrey (CSD) Vancouver (CSD) Brampton (CSD) Mississauga (CSD) Toronto (CSD) Laval (CD) Longueuil (CD) Montréal (CD) Gatineau (CSD) Ottawa (CSD) No. of CDs/CSDs Surveyed 11 9 Statistics Canada. Census Dictionary. Part of the Census reference material, available online at April
27 Note that the CBD and EUA definitions for the CMA-level indicators were retained for the CSD and CD responses. 1.7 SURVEY RESPONSE RATES Exhibit 1-5 tabulates the level of completion of the eight survey sections by individual respondents. CMAs are listed in alphabetical order, including the CSDs and CDs. The CMAs that did not participate in the survey listed at the end of the table. Among the participating CMAs, it can be seen that the response rates varied among sections, ranging from just under half the indicators from sections 1 (land use and transportation initiatives) and 8 (the health indicators a response rate entirely consistent with their newness), to 100% for the section 3 land use variables, which were sourced from Statistics Canada. Origin-destination (O-D) travel surveys are a primary source of data for the UTI5 and for transportation planning generally. Exhibit 1-6 summarizes the most recent availability of O-D surveys among the CMAs. Although some of the surveys took place after, and not all surveys were made available to the project, it can be seen that several surveys have been conducted since the Fourth UTI, with all but four CMAs having an O-D survey available, and 22 CMAs having conducted an O-D survey during or after. 10 This is a positive development for the state of urban transportation planning in Canada. 10 O-D surveys are planned for Edmonton and Saguenay in autumn April 2016
28 Exhibit 1-5. Response Rates by Survey Section Completion Survey Section 1- Background 2- Land Use and Transportation Initiatives Adopted by CMAs 3- Land Use Characteristics 4- Transportation Supply 5- Transportation Demand 6- Transportation System Performance 7- Economic Performance Indicators 8- Health Indicators Participating CMAs and CDs/CSDs Non-Participant Abbotsford - Mission Barrie Calgary Edmonton Greater Sudbury / Grand Sudbury Guelph Halifax Hamilton Kelowna Kitchener - Cambridge - Waterloo London Moncton Montréal Oshawa Ottawa - Gatineau -- Québec Saguenay Saint John Saskatoon Sherbrooke St. Catharines - Niagara St. John's Toronto Trois-Rivières Vancouver Victoria Windsor Winnipeg Brampton (CSD) -- Burnaby (CSD) -- Gatineau (CSD) -- Laval (CD) -- Longueuil (CD) -- Mississauga (CSD) -- Montréal (CD) -- Ottawa (CSD) -- Surrey (CSD) -- Toronto (CSD) -- Vancouver (CSD) -- Brantford Kingston Peterborough Regina Thunder Bay Completion rates: more than 25%, 25-75%, less than 25%, - not applicable April
29 Exhibit 1-6. Status of Urban Travel Surveys in Responding CMAs CMA Travel Survey Available Date of Most Recent Survey Date of Data Used for TAC UTI Abbotsford 2004 Barrie Brantford Calgary 2012 ** Edmonton 2005 *** 2005 Greater Sudbury / Grand Sudbury Guelph Halifax x - - Hamilton Kelowna Kingston Kitchener London ** Moncton Montréal Oshawa Ottawa - Gatineau 2005 Peterborough Québec Regina Saguenay x - *** - Saint John Saskatoon Sherbrooke * St. Catharines -Niagara St. John's x - - Thunder Bay x - - Toronto Trois-Rivières 2000 * Vancouver 1999 Victoria Windsor Winnipeg * Indicates urban areas derived survey answers from various local sources. ** Indicates urban areas used the same survey to complete certain parts of the UTI4 as for previous surveys. *** An O-D survey is planned for autumn April 2016
30 1.8 PURPOSE AND OUTLINE OF REPORT This report details the findings of the Fifth Urban Transportation Indicators Survey. Where comparisons can be made, data from previous UTIs and trends are presented, along with interpretations and discussions of the trends. However, as with previous UTIs, readers are intended to use the data as presented, and develop their own analyses and trends from these. The accompanying Access database, which contains data from the, and UTIs that are common to all three surveys, will support these analyses. Note that the database has been reformulated to increase user-friendliness. This report contains 11 chapters. For consistency, the chapters retain the same general format as the Fourth UTI report, with selected changes and additions to reflect the new and reorganized data. In addition to this first introductory chapter, the chapters are: Chapter 2 summarizes the key trends and findings, based on the New Vision s 13 principles. Chapter 3 examines the land use and transportation initiatives reported by local respondents. Chapter 4 summarizes land use and urban structure indicators, and discusses how these relate to transportation trends. Chapter 5 discusses transportation activity and impacts, including trip making, mode shares, and energy and environment. Chapter 6 addresses the demand and supply of public transit. Chapter 7 focuses on active transportation. Chapter 8 discusses roads and motor vehicle use. Chapter 9 summarizes the economic performance of transportation. Chapter 10 presents and discusses the new health indicators Chapter 11 concludes the report, and proposes possible improvements for future UTI surveys. The report is accompanied by four appendices, similar to the format of the Fourth UTI: Appendix A lists other contributors to the Fifth UTI, in addition to those identified in the preface to this report. Appendix B presents the survey questionnaire. Appendix C presents the maps that define the geographical areas for each CMA. Appendix D presents summary data for key indicators. April
31 14 April 2016
32 2. KEY FINDINGS 2.1 INTRODUCTION This chapter summarizes the key trends from UTI5. As before, the CMAs are categorized into four population groups, in order to facilitate a comparison among urban areas that have broadly similar characteristics, types of transit services, etc. The categories are shown in Exhibit 2-1. Although the population thresholds have not changed, It should be noted that Sherbrooke and St. John s moved from Group D to Group C in, and this shift might have a small impact on the comparison of trends for those two groups. Exhibit 2-1. CMA Group Definitions Group CMA Population Number of CMAs CMAs * Group A More than 2,000,000 3 Toronto, Montréal, Vancouver Group B 500,000 to 2,000,000 6 Ottawa-Gatineau, Calgary, Edmonton, Québec, Winnipeg, Hamilton Group C 190,000 to 500, Kitchener-Cambridge-Waterloo, London, St. Catharines - Niagara, Halifax, Oshawa, Victoria, Windsor, Saskatoon, Regina, Sherbrooke, St. John's Group D Less than 190, Barrie, Kelowna, Abbotsford - Mission, Greater Sudbury / Grand Sudbury, Kingston, Saguenay, Trois- Rivières, Guelph, Moncton, Brantford, Saint John, Thunder Bay, Peterborough * CMAs are listed in decreasing order of population (from the Census). 2.2 SYNOPSIS The key findings and trends are summarized below. The five trends identified in the previous UTI are revisited. Two new discussions have been added. These account for health and transportation, and for the relationship among travel demand, an aging population and changing economies GROWTH CONTINUES TO ACCRUE TO THE LARGEST URBAN AREAS The importance of Canada s urban areas as population and activity centres has long been established. As a group, the 33 CMAs comprised over 2/3 of the country s population: 69% in, up slightly from 68% in and. Exhibit 2-2 shows how the growth has varied among the four groups, and Exhibit 2-3 compares this growth with that of the country as a whole. April
33 Exhibit 2-2. Total CMA Population by Urban Area Group, - Group D Group C Group B Group A Population Millions 16 April 2016
34 Exhibit 2-3. Growth in Population by CMA Group, - Group Census Year Population % Growth Between Censuses % of CMA Population by Group Group A 10,120, % 10,865, % 50.5% 11,720, % 50.7% Group B 4,988, % 5,354, % 24.9% 5,827, % 25.2% Group C 3,273, % 3,457, % 16.1% 3,624, % 15.7% Group D 1,761, % 1,856, % 8.6% 1,950, % 8.4% All CMAs 20,144, % 21,534, % 100.0% 23,123, % 100.0% Canada 29,639, ,612, % -- 33,476, % -- It can be seen that: Population continues to accrue to the country s urban areas. The CMAs have gained population at a much faster rate than Canada as a whole 7.4% in the CMAs versus 5.9% nationally from to. 11 In contrast, the CMAs grew only slightly faster than the country as a whole between and 6.9% in the CMAs versus 6.7% nationally. Note that Canada s population grew more slowly from to than it did in the preceding five-year period. The nine largest CMAs have 3/4 of the CMA populations, and this proportion has been growing slightly. The three largest CMAs Toronto, Montréal and Vancouver are home to just over half the CMA population. The six Group B CMAs Ottawa-Gatineau, Calgary, Edmonton, Québec 11 It is not clear how much of the growth in population occurred in the geographical areas that were added to the CMA, and how much in those parts of the existing CMAs. This could have an implication on commuting patterns; that is, as the commutershed expands. This could be the subject of an investigation in a future UTI. April
35 City, Winnipeg and Hamilton comprise another 25% of the CMA population, and this proportion has been growing slightly faster than the Group A proportion. Population continues to accrue to the larger urban areas. The proportions of the remaining 24 CMAs in Groups C and D have been dropping slightly. Note that Group C s share has experienced the greatest drop, even as it gained two CMAs URBAN DENSITIES ARE INCREASING, ALTHOUGH AT DIFFERENT RATES The recent Queen s University research cited in Section 1.5 and the previous UTI surveys has established the importance of density as an indicator of sustainability: this applies both to the consumption of land, wherein higher densities represent a more efficient use of resources, and to transportation, whereby public transit can more effectively serve higher densities, and mixed uses are more conducive to travel by alternatives to the private, single-occupant vehicle. Exhibit 2-4 shows that EUA densities, as measured by population per square kilometre, have increased for all four population groups, albeit at different rates compared with the to interval. Densities have increased in all groups, with Group B now having the fastest growth rate and Group A s rate almost half that in the preceding five year interval. Proportionally, from to, Group B densities have increased fastest (by 7.9%), with Group A densities increasing by 6.8% - still strong but almost half the to rate of 12.2%. Group A densities continued to have the greatest increase in absolute terms, growing by 151 residents per square kilometre from to. Smaller CMAs also experienced strong growth rates, marking a turnaround from negative growth for Group D. Group C densities grew by 4.0%, a greater rate than the 3.5% rate experienced from to. Group D densities increased 4.2%: this compares favourably with the reduction of -1.3% that was experienced between and. Exhibit 2-5 compares these changes with those elsewhere in the CMA that is, in the less-developed areas outside the EUAs. As expected, the EUA densities are much higher than those elsewhere. However, it is noteworthy that the absolute increases in the three largest CMAs - 20 residents per km 2 outside the EUA - are of the same order as the Group D increase within the EUAs, at 25 residents per km April 2016
36 Exhibit 2-4. EUA Population Density by Urban Area Group, - Group D Group C Group B Group A ,000 1,500 2,000 2,500 EUA residents per km 2 Exhibit 2-5. Change in Population Density by Group, - - Change - Change Group D Group C Group B Group A EUA Rest of CMA EUA Rest of CMA EUA Rest of CMA EUA Rest of CMA Change in Population Density (Residents per km 2 ) April
37 2.2.3 THE AUTOMOBILE IS STILL DOMINANT, BUT OTHER MODES ARE MAKING PROGRESS Exhibit 2-6 summarizes selected indicators of travel behaviour. There are some indications that the usage and impacts of automobiles have dropped since, albeit slightly. On the one hand, light-duty vehicle ownership per capita a proxy for auto use - has continued to increase, but at a slower rate than in the five years prior to. On the other hand, transit use per capita has continued to increase, at over double the rate of the five years to. Commuting shares for transit and cycling have continued to increase, although the walk share has decreased since. 12 As well, even with the slight increase in vehicle ownership rates, fuel consumption rates have decreased. Overall, these indicators suggest a slight reduction in the impacts of the private automobile in favour, especially, of transit: given the dominance of the automobile, these changes, while seemingly small in absolute values, are significant. The changes no doubt reflect investments in transit and active transportation services and infrastructure, although they also reflect other factors such as improved vehicular fuel efficiencies and changing economic conditions (noting especially that the Great Recession of occurred between the fourth and fifth UTIs). Exhibit 2-6. Summary of Automobile and Non-Automobile Indicators, INVESTMENT IN TRANSIT HAS CONTINUED Light-Duty Vehicles per Capita Fuel Use per Capita (L/Day) Annual Transit Trips per Capita Work Trip Transit Mode Shares 14.80% 15.20% 16.57% Work Trip Walk Mode Shares 5.70% 5.70% 5.48% Work Trip Cycle Mode Shares 1.30% 1.40% 1.49% Exhibit 2-7 compares the transit expenditures and the road (other transportation) expenditures per capita, using the available information for, and. 13 Continuing a trend reported in the fourth UTI, it can be seen that per capita investments in transit increased in almost all the reporting CMAs in compared with, with the greatest increases again found in the largest CMAs. Many CMAs recorded increases in per capita road expenditures as well: in the smaller (Group C and Group D) CMAs, these tended to be greater than the per capita transit expenditures. This was true also for most of the larger CMAs, with the exceptions of Toronto, Vancouver and Ottawa-Gatineau where the per capita expenditures were greater for transit. Note that these data reflect the year of reporting, not the full five-year interval between the UTI surveys, so it is not clear whether these represent ongoing investments or specific projects Exhibit 5-16 establishes daily mode shares by age group and Exhibit 5-18 and Exhibit 5-19 explore mode share by worker occupation. With these benchmarks, future UTIs could explore how vehicle ownership, mode share by age group and mode share by occupation are related. The exhibit shows only those data that were provided by the CMAs. 20 April 2016

 Brampton (CSD) Montréal (CD) Laval (CD) Longueuil (CD) Vancouver (CSD) Surrey (CSD) Burnaby")
38 Exhibit 2-7. Road and Transit Expenditures Per Capita, - Transit Expenditures per capita Road Expenditures per Capita Group B Group A Hamilton Winnipeg Québec Edmonton Calgary Ottawa - Gatineau Vancouver Montréal Toronto Toronto (CSD) Mississauga (CSD) Brampton (CSD) Montréal (CD) Laval (CD) Longueuil (CD) Vancouver (CSD) Surrey (CSD) Burnaby (CSD) Ottawa (CSD) Gatineau (CSD) $0 $200 $400 $600 $800 $1,000 $1,200 Expenditures per capita April


39 Exhibit 2-7. Road and Transit Expenditures Per Capita, -, continued Transit Expenditures per capita Road Expenditures per Capita Group C Kitchener - Cambridge - Waterloo St. Catharines - Niagara London Sherbrook e Regina Saskatoon Windsor Victoria Oshawa Halifax St. John's $0 $200 $400 $600 $800 $1,000 $1,200 Expenditures per capita 22 April 2016

40 Exhibit 2-7. Road and Transit Expenditures Per Capita, -, continued Transit Expenditures per capita Road Expenditures per Capita Group D Kelown a Barrie Abbotsford - Mission Greater Sudbury / Grand Sudbury Trois- Rivières Saguenay Kingston Monct on Guelph Brantfo rd Thunder Bay Saint John Peterb orough $0 $200 $400 $600 $800 $1,000 $1,200 Expenditures per capita As reported in Chapter 9, in non-transit expenditures focused primarily on capital improvements as opposed to operations and maintenance. The reverse was true for transit, where operations and maintenance costs were of the order of 80% of total transit expenditures, with some exceptions. April
41 2.2.5 SUSTAINABLE POLICIES CONTINUE TO BE IMPLEMENTED Chapter 3 describes a range of sustainability-supportive land use and transportation policies and initiatives that CMAs have implemented or are considering. While it is true that priorities change over time, some initiatives have continued to be prominent notably, those addressing special user needs, road system optimization, urban design and walking. Many of these initiatives aim to address the mobility needs of an aging population, and they do so in a way that promotes alternatives to driving. Especially noteworthy is the increase in transit initiatives. Other initiatives, such as cycling and GHG reduction policies, remain active, although not at the same level of priority as in preceding surveys. Overall, progress on sustainable policies and actions continues, with initiatives ranging from studies to site-specific and region-wide implementation. Note that some new policy initiatives were added to the list this year and, although they do not rank among the most cited initiatives, they do indicate nascent interests for the future. These include Climate Change mitigation strategies and air pollutant reduction initiatives PUBLIC HEALTH IS INFLUENCED BY TRANSPORTATION POLICY AND INFRASTRUCTURE Transportation policies and infrastructure can influence the way people access health services, encourage or discourage active transportation, and place environmental health risks on vulnerable communities. Chapter 10 introduces a variety of health indicators to demonstrate the various links among transportation policies, infrastructure and human health and, furthermore, how health outcomes vary across CMAs. These health indicators include walking and bicycling behaviours, availability of sidewalks, proximity to school and natural space, traffic fatalities, fuel emissions, and asthma prevalence, all of which have been found to be associated with transportation and land use. Policymakers and planners can use the findings in this report to make informed decisions that will improve physical and mental health, reduce environmental risks, and increase access to destinations. 14 Going forward, these health and transportation indicators also can be used to measure progress towards these outcomes DEMOGRAPHIC AND ECONOMIC CHANGES WILL INFLUENCE FUTURE TRAVEL NEEDS Evidence from several urban areas in Canada and in other advanced economies points to an aging workforce, increased gender equality in both the numbers of jobs and the types of jobs, insufficient numbers of younger workers available to replace retiring older workers, and greater dependence on existing workers to be able to care for older people. All this means that greater flexibility is needed in the provision of transportation services that provide travellers increased options for circumventing congestion throughout the day. In the meantime, employers are experiencing challenges in finding skilled workers to fill jobs, especially as congestion grows: this further adds to the need for flexibility and transportation options. All this is happening in the midst of ongoing changes to the country s economic structure. 14 Centers for Disease Control and Prevention. Transportation Health Impact Assessment Toolkit. October. See 24 April 2016
42 To help measure these relationships going forward, at least from the transportation perspective, the UTI5 added several indicators that can track how mode shares evolve by age and by occupational categories. Supporting this are new indicators that relate investment in transportation to an urban area s overall economy, and show the role of alternate funding sources. 2.3 SUSTAINABILITY SCORECARD Exhibit 2-8 tracks the progress of TAC s 1993 New Vision for Urban Transportation, which was one of the key reasons for initiating the UTI series. The New Vision identified 13 principles that urban authorities could use in developing their sustainable transportation plans. The exhibit assesses the progress made with respect to each principle since the previous survey, which in turn is shown relative to the preceding survey. In keeping with previous UTIs, note that the principles are assessed in terms of a mixture of initiatives, which are described in Chapter 3, and outcomes, which are drawn from the rest of the report. For convenience, the progress from UTI4 to UTI5 ( to ) is also colour-coded: green for a positive development, red for a negative development and yellow for no overall change. The accompanying face symbols reflect the overall status of each principle in its own right. For most principles, the colour code and the face smiling, blank or frowning correspond to each other. However, in some cases they are different: for example, the fifth principle creating an environment that balances the role of the automobile shows a blank face (neither smiling nor frowning), on a green background. Here, the blank face indicates that both positive and negative aspects of the principle were recorded in UTI5, and the green background indicates that this represents overall progress compared with how UTI4 reported this principle. Similarly, the second principle promoting walking as a preferred mode has recorded positive and negative aspects in (hence, a blank face), but in sum overall conditions are about the same as they were in (hence, a yellow background). In sum, the picture is largely a positive one: progress has been observed on the majority of the sustainability principles (8 of 13). One principle worsened compared with UTI4 (goods movement), and four reported no real change compared with UTI4 (walking, use of technologies, transportation systems for the physically challenged and better ways to pay for transportation systems). Note that these assessments must synopsise the findings of a large number of indicators into a single assessment for each principle. They combine both quantitative and qualitative content. As such, they must be considered as indicative and illustrative, although not necessarily absolute. They are intended as a guide to inform transportation planning decisions and investments. The reader is invited to use the indicators presented herein to make his/her own conclusions regarding the progress of Canada s CMAs in sustainable transportation. April
43 Exhibit 2-8. Tracking of Progress of TAC s Vision Vision Principle Progress Progress - Progress - Supporting discussion based on the and earlier UTI Surveys 1. Plan for increased densities and more mixed land use 2. Promote walking as the preferred mode for person trips 3. Increase opportunities for cycling as an optional mode of travel 4. Provide higher quality transit service to increase its attractiveness relative to the private automobile 5. Create an environment in which automobiles can play a more balanced role EUA urban densities have mostly increased since, although densities have gone down in several CMAs since. The proportion of jobs outside the CBD has held steady or dropped in most CMAs, although this might be related more to the recession than to any formal plans. The implementation of walking initiatives has increased slightly overall since, with increases in CMA groups A and C and reductions for groups B and D. The walk journey-to-work share has increased in one-quarter of CMAs (compared with half the CMAs in the last UTI), but has dropped in the rest. The implementation of cycling initiatives has increased in some CMAs since. Cycling plans with proposed cycling networks are among the top 10 most implemented initiatives. Some CMAs have also extended their existing bikeway networks. The cycling journey-to-work share has increased in almost half the CMAs, but has decreased in the rest. The implementation of transit initiatives has increased since. Several CMAs have developed new transit infrastructure. The transit journey-to-work share has increased in 2/3 of the CMAs. Overall, transit ridership per capita has increased at an annual rate that is twice as fast as that to. CMAs continue to expand their urban road networks, although in most of these CMAs this expansion has not kept pace with population growth. The auto journey-to-work share has dropped slightly in many CMAs, even as the per capita rate of automobile ownership (light-duty vehicles) increased, also slightly. The automobile continues to be the mode of choice as people age. 26 April 2016
44 Exhibit 2-8. Tracking of Progress of TAC s Vision Vision Principle Progress Progress - Progress - Supporting discussion based on the and earlier UTI Surveys 6. Plan parking supply and price to be in balance with walking, cycling, transit and auto priorities The implementation of parking initiatives increased compared with, although parking ranks last among all the list of 12 initiatives. The supply of park-and-ride spaces (incentive parking to promote transit) has increased in about one-quarter of the CMAs. 7. Improve the efficiency of the urban goods distribution system Although sustainability initiatives aimed at reducing automobile traffic generally benefit goods movement, fewer initiatives specific to goods movement were reported than in. 8. Promote inter-modal and inter-line connections The increase in transit infrastructure in some CMAs and the general increase in transit ridership suggests that inter-modal connectivity has improved. Inter-modal connectivity for goods movement has not changed. 9. Promote new technologies which improve urban mobility and help protect the environment Emissions Energy and emissions reduction initiatives increased slightly over levels, even as light-vehicle ownership rates increased. GHG emissions per capita have dropped since, although this may be related to improved engine efficiency, the recession and other factors beyond local influence. The UTI5 measured Criteria Air Contaminants, as the basis for future comparisons of air pollution. Energy Energy consumption per capita has dropped since, although this may be related to improved engine efficiency, the recession and other factors beyond local influence. Median journey-to-work distances dropped significantly over. This also contributes to lower energy consumption rates, although the reduced distances may reflect economic changes related to the recession. 10. Optimize the use of existing transportation systems to move people and goods An increase in road system optimization initiatives was reported over. April
45 Exhibit 2-8. Tracking of Progress of TAC s Vision Vision Principle Progress Progress - Progress - Supporting discussion based on the and earlier UTI Surveys 11. Design and operate transportation systems which can be used by the physically challenged 12. Ensure that urban transportation decisions protect and enhance the environment 13. Create better ways to pay for future urban transportation systems Initiatives aimed at addressing special user needs continues to be the most prevalent among the 12 groups of sustainability initiatives, albeit at a slightly lower rate than. Initiatives in transit and in urban structure / land use, coupled with the expansion of the transit and cycling networks in some CMAs, aim to promote sustainable travel choices, especially in larger CMAs. Funding sources vary among the CMAs, although no one single type dominates: as before, this suggests that continued, reliable sources of funding may not exist in several areas. Some CMAs have introduced private funding. 28 April 2016
46 3. LAND USE AND TRANSPORTATION INITIATIVES 3.1 INTRODUCTION AND APPROACH Part 1 of the UTI5 survey asks respondents to describe the transportation and land use initiatives they have implemented or are considering. This part of the UTI5 survey corresponds to Part A of the previous surveys. The object is, first, to identify local priorities and, second, assess the degree to which these priorities have been implemented. The 10 categories and the wording of the individual initiatives were reviewed and updated to ensure currency with emerging issues. Exhibit 3-1 lists the categories and the initiatives. The exhibit shows additions (+) and changes ( ). The changes include the addition of an Other response, in order to provide more flexibility to respondents who, if they chose that response, were also asked to explain briefly what they meant. The goods movement category (8 th category) was reworded and augmented significantly, to reflect the recent emphases on the subject in several CMAs. Finally, the 10 th UTI4 category energy, environment and travel demand management (TDM) was divided into three separate categories, for a new total of 12 categories: Energy and emissions (category 10). Transportation demand management, including road pricing (category 11). GHG reduction initiatives (category 12). This allowed for a more elaborate differentiation among these related but still distinct topics. For example, road pricing is more properly treated as a TDM initiative than as an energy and emissions initiative. As well, Climate Change mitigation and adaptation strategies are becoming of interest to some agencies, and this fits well with the long-standing GHG reduction target as a separate category. Note that some of these changes were suggested by local CMA representatives during the pre-survey consultation webinar, and others met a positive response by other complementary TAC groups (notably, the Transportation Finance Standing Committee and the Climate Change Task Force) thereby potentially broadening the interest of the UTI by other TAC interests. No changes were made to the number or types of responses. The seven response levels were retained, with higher numbers representing increasing levels of implementation: 1. Not applicable. 2. Not a priority at present. 3. Studying the issue. 4. Have adopted policies / guidelines. 5. Implementing pilot project(s). 6. Implementing in specific case(s) or area(s). 7. Implementing throughout the EUA. The responses thus indicate the range of implementation, from 0% implementation (response 1) to 100% implementation (response 7). In keeping with the approach used in the previous UTIs, the results for each initiative were normalized and then averaged by category, to yield indications of priorities and their implementation. Note that not all CMAs responded to all initiatives and so the normalization was based only on the number of answers provided rather than on the total number of questions. April
47 Exhibit 3-1. Categories of Land Use and Transportation Initiatives 1. URBAN STRUCTURE/LAND USE a. long-term, integrated municipal land-use/transportation plan b. density targets for mixed-use centres/nodes c. limiting urban development within designated urban boundaries d. incentives/special policies for infill and brownfield development e. taxation and/or other incentives for compact, mixed-use development + f. other (Please describe) 2. URBAN DESIGN a. transit-supportive site design guidelines or policies b. cycling-supportive streetscaping c. pedestrian-supportive streetscaping d. traffic calming + e. other (Please describe) 3. WALKING a. pedestrian plan b. mid-block pedestrian crossings in areas of high pedestrian activity c. pedestrian-friendly intersection design d. clearing of snow and ice from sidewalks e. municipal participation on pedestrian advisory/awareness committees + f. other (Please describe) 4. CYCLING a. cycling plan with proposed cycling network b. municipal bike parking program c. municipal participation on cycling advisory/awareness committees d. zoning by-laws require cycling amenities bike parking, showers, etc.. in new development e. bike sharing programs f. delivery of/support for cycling skills training + g. other (Please describe) 5. TRANSIT a. Transit priority by means of HOV or reserved bus lanes b. Other transit priority measures c. Bike 'n' ride facilities d. Inter-municipal service coordination e. Inter-municipal fare coordination e.g., Regional smart-card. 30 April 2016
48 Exhibit 3-1. Categories of Land Use and Transportation Initiatives f. Integration of urban transit with inter-city services e.g., intermodal transit station. g. University/college student transit pass program e.g., U-Pass. h. Bulk purchase transit discount program e.g., Employer transit discount. i. Web-based trip planning information j. Real-time transit arrival information + l. other (Please describe) 6. PARKING a. parking standards related to local conditions e.g., level/ proximity of transit service, walkability of area, etc.. b. encouragement of shared parking arrangements c. maximum parking standards d. pricing to discourage use of public parking lots by commuters e. tax or other measure to discourage use of private lots by commuters + f. other (Please describe) 7. ROAD SYSTEM OPTIMIZATION a. transportation/traffic impact studies must consider access for all modes of transportation (e.g. Complete Streets approach) b. HOV lanes c. carpool parking lots d. transportation systems management program e. master plan identifies intersections requiring improvement f. real-time traffic signal control and coordinated signal timing g. incident management system + f. other (Please describe) 8. GOODS MOVEMENT a. goods movement strategy (stand-alone or part of transportation master plan) b. freight Council / Task Force made up of public / private goods movement stakeholders + c. freight-friendly land use plans, regulations and zoning + d. freight-friendly land use plans, regulations and zoning e. strategic goods movement network or permitted / restricted truck route designations f. existence of intermodal freight terminals and/or freight consolidation terminals + g. economic development strategy + h. Other (please describe) April
49 Exhibit 3-1. Categories of Land Use and Transportation Initiatives 9. SPECIAL USER NEEDS a. transit vehicles accessible to persons with disabilities b. transit stations/stops accessible to persons with disabilities c. paratransit to supplement regular transit for special needs d. curb cuts/ramps at designated pedestrian crossing points e. mobility disabled parking requirements f. audible pedestrian signals 10. ENERGY AND EMISSIONS a. alternative fuels/high efficiency vehicles for municipal fleets b. alternative fuels/high efficiency vehicles for transit vehicles + c. infrastructure for alternative fuels (e.g., fuel / recharge stations) d. Mandatory / voluntary emissions control strategies, including vehicle inspection and maintenance programs e. Established target for air pollutant reduction + f. Other (please describe) 11. TRANSPORTATION DEMAND MANAGEMENT (TDM), INCLUDING ROAD PRICING a. Regional/municipal TDM strategy b. Road pricing initiatives, (e.g. tolls, HOT lanes, cordon pricing, parking surcharges, etc). + c. Pilot/demonstration programs + d. Awareness and education / outreach programs e. TDM services delivered to/by workplaces f. TDM services delivered to/by schools (e.g., walk/bike to school programs) g. Carpool ridematching services h. Support for private or non-profit car sharing services + i. Other (please describe) 12. GHG REDUCTION INITIATIVES a. Established target for GHG reduction + b. Climate Change mitigation plan or strategy + c. Climate Change adaptation plan or strategy + d. Other (please describe) + Initiatives added in UTI5. Wording changed in existing initiative. 32 April 2016
50 3.2 SURVEY OVERVIEW Exhibit 3-2 shows the proportions of responses for each implementation level for the 12 categories. Some rankings are similar to those of the Fourth UTI: Special user needs once again had the highest area-wide implementation rate, and urban structure / land use, road system optimization and walking again ranking among the top five. Transit moved up to the second-most implemented category, and cycling also rose, while goods movement dropped from second place. At the other end of the scale, parking again was most often cited as not being a priority at present: this was followed by TDM and goods movement. In terms of initiatives in specific cases or areas, urban design again ranked highest, again followed by walking and followed by special user needs and urban structure / land use. Cycling and GHG reduction initiatives ranked highest in terms of topics that are being studied. The three new categories show that region-wide implementations are highest for GHG reduction initiatives comparable to cycling and goods movement initiatives. This is followed by TDM initiatives, and then energy and emissions (i.e., air quality initiatives ranked lower than GHG reduction initiatives). In sum, the implementation of area-wide transit projects has increased since. The implementation of special user needs initiatives continues to be prominent, as are urban structure / land use, road system optimization and walking initiatives. April


 or area(s) Have adopted policies/ guidelines Not a prority at present")


51 Exhibit 3-2. Degree of Implementation of Land Use and Transportation Initiatives, Special User Needs Transit Urban Structure/ Land Use Road System Optimization Walking Cycling Goods Movement GHG Reduction Initiatives TDM, Including Road Pricing Urban Design Energy and Emissions Parking 0% 10% 20% 30% 40% 50% 60% 70% 80% 90% 100% Implementing throughout study area Implementing pilot projects(s) Studying the issue Implementing in specific cases(s) or area(s) Have adopted policies/ guidelines Not a prority at present 3.3 PROGRESS SINCE Exhibit 3-3 compares the implementation progress of the 28 responding CMAs since the and UTIs. The implementation of special user needs continues to be most prevalent, although the proportion has dropped slightly since. Similarly, the implementation of urban design and walking initiatives also has dropped since. On the other hand, the implementation of urban structure / land use, road system optimization, cycling, TDM, parking, and, especially, transit initiatives has increased since. 34 April 2016

52 Exhibit 3-3. Average Implementation Levels by Category, - Special User Needs Urban Design Urban Structure/ Land Use Transit Walking Road System Optimization Cycling GHG Reduction Initiatives Energy and Emissions TDM, Including Road Pricing Goods Movement Parking 0% 10% 20% 30% 40% 50% 60% 70% 80% 90% 100% Implementation Level 3.4 TRENDS BY SIZE OF URBAN AREA Exhibit 3-4 shows how the treatment of the 12 categories of initiatives varies by population group. A few categories are pervasive among all four population groups: the special user needs category is noteworthy as are, to a lesser extent, urban design and (at the other end of the scale) goods movement and parking. The main message is that the implementation of the categories mainly depends on population size, with more populous areas having higher implementation rates. For almost all categories, the implementation level is uniformly highest among the three Group A CMAs. This is generally, though not always, followed by the six Group B CMAs. Group C and D CMAs generally follow in sequence, although for some categories special user needs, urban design, walking, road system optimization, GHG reduction initiatives, energy and emissions, goods movement and parking implementation was greater in the Group D CMAs. Exhibit 3-5 breaks down the implementation levels among the 12 categories for each population group, showing also the evolution over time. Parking, road system optimization, urban design, TDM and transit show progress across all four groups, compared with. Although all categories continue to implement various initiatives, in some cases the rate of implementation has dropped since notably, cycling, special user needs and GHG reduction initiatives. April
53 Exhibit 3-4. Grouped Average Implementation Levels by Category, Special User Needs Urban Structure/ Land Use Urban Design Road System Optimization Walking Transit GHG Reduction Initiatives Cycling Energy and Emissions TDM, Including Road Pricing Goods Movement Parking Group A Group B Group C Group D Group A Group B Group C Group D Group A Group B Group C Group D Group A Group B Group C Group D Group A Group B Group C Group D Group A Group B Group C Group D Group A Group B Group C Group D Group A Group B Group C Group D Group A Group B Group C Group D Group A Group B Group C Group D Group A Group B Group C Group D Group A Group B Group C Group D 0% 10% 20% 30% 40% 50% 60% 70% 80% 90% 100% Implementation Level 36 April 2016


54 Exhibit 3-5. Implementation Levels by Groups, Group A Group B Group C Group D Special User Needs Urban Design Urban Structure/ Land Use Transit Walking Road System Optimization Cycling GHG Reduction Initiatives Energy, Environment, and TDM TDM, Including Road Pricing Goods Movement Parking 0% 50% 100% Implementation Level 0% 50% 100% Implementation Level 0% 50% 100% Implementation Level 0% 50% 100% Implementation Level 3.5 TRENDS RELATED TO SPECIFIC INITIATIVES Exhibit 3-6 and Exhibit 3-7 present the ten least-implemented and ten most-implemented initiatives, respectively. The two tallies indicate the importance of different priorities. Several of the least important initiatives in the Fourth UTI are maintained in the same group: road pricing, bicycle sharing programs, HOV lanes and the establishment of targets for air pollutant reduction. Freight-friendly initiatives also rank in this group, as do maximum parking standards (the last having a much more prominent role in the Fourth UTI). There is less continuity in the most-implemented group, with three two carryovers: transit vehicles accessible to persons with disabilities, paratransit to supplement regular transit for special needs, and curb cuts/ramps at designated pedestrian crossing points. New in the Top 10 are mobility disabled parking requirements, goods movement networks, inclusion of all modes in transportation and traffic impact studies, accessible transit stations and stops, post-second student transit pass programs, realtime traffic signal control and coordinated signal timing, and cycling plans with proposed cycling networks. April

55 Exhibit 3-6. Ten Least-Implemented Initiatives, Road pricing initiatives Courier-friendly urban design and site planning Bike sharing programs Freight Council / Task Force made up of public / private goods movement stakeholders Pricing to discourage use of public parking lots by commuters HOV lanes Pilot / demonstration programs Maximum parking standards Freight-friendly land use plans, regulations and zoning Established target for air pollutant reduction 0% 10% 20% 30% 40% 50% 60% 70% 80% 90%100% Level of Implementation 38 April 2016

56 Exhibit 3-7. Ten Most-Implemented Initiatives, Mobility disabled parking requirements Transit vehicles accessible to persons with disabilities Paratransit to supplement regular transit for special needs Curb cuts/ramps at designated pedestrian crossing points Strategic goods movement network or permitted / restricted truck route designations Transportation/traffic impact studies must consider all modes of transportation Transit stations/stops accessible to persons with disabilities University/college student transit pass program Real-time traffic signal control and coordinated signal timing Cycling plan with proposed cycling network 0% 10% 20% 30% 40% 50% 60% 70% 80% 90% 100% Level of Implementation April
57 40 April 2016
58 4. URBAN STRUCTURE 4.1 INTRODUCTION Transportation and land use are related to each other. This chapter describes key population and employment characteristics for the 33 CMAs, and how they relate to each other. Exhibit 4-1 shows the break down in CMA populations between the EUA and the rest of the CMA. This is an indicator of sprawl, in the sense that the more households that are located outside the EUA, the more likely they are to have to commute longer distances to jobs (which tend to be located within the EUA), and the more likely that commute will be by auto. The number of residents outside the EUA varies by CMA, with the larger CMAs tending to have greater proportions (and greater numbers) than the smaller CMAs. Toronto, Montréal, Ottawa-Gatineau and Edmonton are particularly noteworthy. Although not shown here, compared with the proportion and population numbers outside the EUA have dropped in Vancouver but have increased in Edmonton. Note that all of the CSDs and CDs shown in the exhibit are located within their CMA s EUA. 4.2 COMPONENTS OF URBAN GROWTH The Toronto, Montréal and Vancouver CMAs still continue to attract the most growth among the CMAs. Exhibit 4-2 compares the population growth in the three largest CMAs (Group A) with that of the other three CMA groups combined. The three largest CMAs, which are home to half the CMA population, grew by 958,000 people from to exceeding the 734,000 people who were added to the other CMAs combined. The figures shown in the exhibit translate into an 8.0% growth rate for the three largest CMAs, compared with 6.9% for the rest of the CMAs. These are faster growth rates than those that occurred in the to interval (7.2% and 6.4%, respectively) especially in the three largest CMAs. Exhibit 4-3 makes the same comparisons for employment. Note that the data are for jobs (where people actually work), as opposed to the employed labour force, which portrays workers by their place of residence. The three largest CMAs are home to more jobs than the rest of the CMAs combined, and the number of jobs grew by 266,000 compared with 196,000 in the other CMAs. The figures shown in the exhibit translate into a post- Group A growth rate that was higher than those of the other CMAs combined (4.6% and 3.9% respectively). However, these growth rates are significantly lower than those that occurred between and (6.6% and 9.1% respectively): this is consistent with the lingering effects of the recession. Exhibit 4-4 is an indication of sprawl. It compares the post- growth in population within the EUA against growth outside the EUA, in the rest of the CMA. The tendencies are generally the same as they were between and (not shown). However, several CMAs show much stronger growth within the EUA than outside: Toronto, Montréal, Vancouver, Ottawa-Gatineau, Calgary and Edmonton are especially noteworthy, although growth outside the EUA is also strong in the Toronto CMA. April
59 Exhibit 4-1. CMA and EUA population, EUA Rest of CMA Group D Group C Group B Group A CM A CM A CM A CM A Toronto Toronto (CSD) Mississauga (CSD) Brampton (CSD) Montréal Montréal (CD) Laval (CD) Longueuil (CD) Vancouver Vancouver (CSD) Surrey (CSD) Burnaby (CSD) Ottawa-Gatineau Ottawa (CSD) Gatineau (CSD) Calgary Edmonton Québec Winnipeg Hamilton Kitchener - Cambridge - Waterloo London St. Catharines - Niagara Halifax Oshawa Victoria Windsor Saskatoon Regina Sherbrooke St. John's Barrie Kelowna Abbotsford - Mission Greater Sudbury / Grand Sudbury Kingston Saguenay Trois-Rivières Guelph Moncton Brantford Saint John Thunder Bay Peterborough CMA Population Millions 42 April 2016


60 Exhibit 4-2. CMA Population Levels and Growth, Group B,C,D Group A Group B,C,D Group A CMA Population Levels Millions ,200 CMA Population Growth Thousands Exhibit 4-3. CMA Employment Levels and Growth, Group B,C,D Group A Group B,C,D Group A CMA Employment Levels Millions ,200 CMA Employment Growth Thousands Exhibit 4-5 shows the proportions of CMA jobs that are located in the CBD, for, and. Historically, the CBD has been the primary CMA job centre. However, over time, jobs have increasingly dispersed to the suburbs. This dispersion has an impact on transportation, because the CBD has been the focus of transit service, while the dispersed non-cbd work destinations are more difficult to serve by transit. The exhibit shows that some CBDs have maintained their share of CMA jobs Toronto, Vancouver, Ottawa-Gatineau, Kitchener-Cambridge-Waterloo, London, Oshawa, Windsor, Saskatoon, Sherbrooke and Abbotsford-Mission. However, the CBD shares of the remaining 23 CMAs have dropped since, in many cases continuing trends established from. In, the CBD shares ranged from 7% in Hamilton (which is part of the Toronto commutershed) to 36% in Kelowna: both shares dropped slightly compared with. At the same time, jobs outside the CBD have grown much more than those in the CBDs in virtually all the CBDs, between and. Exhibit 4-6 shows this to be the case mainly in the seven largest CMAs, with non-cbd job growth especially pronounced in Toronto, Montréal, Vancouver, Calgary and Edmonton. Job growth has largely accrued to the larger CMAs: CBD jobs dropped absolutely in 15 CMAs, ranging from -300 jobs in Hamilton to -2,000 jobs in both Windsor and Kitchener-Cambridge-Waterloo. April
61 Outside the CBD, jobs dropped significantly in Windsor (-18,200) and St. Catharines Niagara (-3,300). In general, the job losses occurred primarily after, again consistent with the recession. Exhibit 4-4. Changes in Population of EUA versus Rest of CMA, - EUA Rest of CMA Group D Group C Group B Group A Toronto Montréal Vancouver Ottawa-Gatineau Calgary Edmonton Québec Winnipeg Hamilton Kitchener - Cambridge - Waterloo London St. Catharines - Niagara Halifax Oshawa Victoria Windsor Saskatoon Regina Sherbrooke St. John's Barrie Kelowna Abbotsford - Mission Greater Sudbury / Grand Sudbury Kingston Saguenay Trois-Rivières Guelph Moncton Brantford Saint John Thunder Bay Peterborough Thousands Change in Population 44 April 2016

62 Exhibit 4-5. Proportion of Employment (Jobs) in CBD, - Group D Group C Group B Group A Toronto Montréal Vancouver Ottawa-Gatineau Calgary Edmonton Québec Winnipeg Hamilton Kitchener London St. Catharines - Niagara Halifax Oshawa Victoria Windsor Saskatoon Regina Sherbrooke St. John's Barrie Kelowna Abbotsford Greater Sudbury Kingston Saguenay Trois-Rivières Guelph Moncton Brantford Saint John Thunder Bay Peterborough 0% 5% 10% 15% 20% 25% 30% 35% 40% 45% Proportion of CMA Employment in CBD April
63 Exhibit 4-6. Change in CBD Employment (Jobs) versus rest of CMA, - Rest of CMA CBD Group D Group C Group B Group A Toronto Montréal Vancouver Ottawa-Gatineau Calgary Edmonton Québec Winnipeg Hamilton Kitchener London St. Catharines - Niagara Halifax Oshawa Victoria Windsor Saskatoon Regina Sherbrooke St. John's Barrie Kelowna Abbotsford Greater Sudbury Kingston Saguenay Trois-Rivières Guelph Moncton Brantford Saint John Thunder Bay Peterborough Change in Jobs Thousands 46 April 2016
64 One tenet of sustainability is the ability of people to live and work in close proximity, the idea being that shorter commuting distances are more conducive to alternatives to the drive-alone trip. Exhibit 4-7 shows the ratios of jobs per working population for the CBD, the EUA and the CMA. Although the proportions are obviously highest in the CBD, and the EUAs and CMAs covers large areas and numbers of jobs and people, the exhibit nonetheless is illustrative: There is generally a balance of jobs in most CMAs, i.e., job-to-worker ratios of approximately 1.0. Exceptions are Toronto, Ottawa-Gatineau, Regina, Kingston, Guelph and Moncton, for each of which there are approximately 10% more jobs in the CMA than there are workers. On the other hand, there are 10% - 20% fewer jobs than workers in Hamilton, St. Catharines Niagara, Oshawa, Barrie, Brantford all of which are part of the Toronto commutershed - and Abbotsford-Mission, which is part of the Vancouver commutershed. All of this implies a significant in- and out-commute over long distances, for which commuter rail service is available to the Toronto and Vancouver CBDs, but otherwise the commutes must rely strongly on the automobile. The EUAs present a different story, with only three EUAs Vancouver, Kitchener-Cambridge- Waterloo and St. Catharines Niagara having job-to-worker ratios of about 1.0. Most of the rest have 10% to 30% more jobs than workers, implying a substantive commute from locations outside the urbanized area. At the same time, as above, the Hamilton, Oshawa, Barrie, Brantford and Abbotsford-Mission EUAs are all exporting 10% - 30% of their workers. For both situations, the implication is for long-distance commutes whose demands may grow over time. Note that the EUA ratios are all higher than the CMA ratios, which is an obvious reflection of where urbanization has happened. However, the point to note is that the urbanized areas are not completely self-contained, that long-distance commuting does exist to points within and beyond the CMA boundaries, and in many cases the commuting numbers are substantial. The long-distance commutes might also anticipate future expansions of the urbanized area over time, as people choose to live further away from the core. Looking at the CBD, in Thunder Bay had the lowest proportion of jobs per working population in the CBD, at 3.0 jobs per worker. Québec City, Kitchener-Cambridge-Waterloo, London, Oshawa, St. John s, Greater Sudbury / Grand Sudbury, Kingston, Saguenay, Guelph and Peterborough all reported ratios of 5.0 jobs per worker. It is clear that these ratios reflect the high concentration of jobs in a very small area, in what is traditionally the economic centre of each CMA, and so comparisons with the EUA and CMA ratios are not meaningful. However, many urban authorities have promoted increased residential development in the core in order to enhance the CBD s livability and vitality, as well as making it convenient for people to live and work within walking or cycling distance: going forward, the CBD jobs to working population ratio can track progress in these goals. Exhibit 4-8 shows the ratios for the 11 CSDs and CDs. Several CSDs and CDs are net importers of workers, including Toronto (at 1.36 jobs per worker), Longueuil (1.18), Burnaby (1.11), Montréal (1.10), Surrey (1.08), and Vancouver (1.06). The others all have fewer jobs than workers, with ratios as low as 0.54 jobs per worker in Laval and 0.55 jobs per worker in Brampton. April

65 Exhibit 4-7. Jobs per Working Population, CBD EUA CMA Group D Group C Group B Group A Toronto Montréal Vancouver Ottawa-Gatineau Calgary Edmonton Québec Winnipeg Hamilton Kitchener - Cambridge - Waterloo London St. Catharines - Niagara Halifax Oshawa Victoria Windsor Saskatoon Regina Sherbrooke St. John's Barrie Kelowna Abbotsford - Mission Greater Sudbury / Grand Sudbury Kingston Saguenay Trois-Rivières Guelph Moncton Brantford Saint John Thunder Bay Peterborough Jobs per Working Population 48 April 2016
 Mississauga (CSD) Brampton (CSD) Montréal (CD) Laval (CD) Longueuil (CD) Vancouver (CSD) Surrey (CSD) Burnaby (CSD) Ottawa (CSD) Gatineau (CSD)")
66 Exhibit 4-8. Jobs per Working Population, CSDs and CDs Toronto (CSD) Mississauga (CSD) Brampton (CSD) Montréal (CD) Laval (CD) Longueuil (CD) Vancouver (CSD) Surrey (CSD) Burnaby (CSD) Ottawa (CSD) Gatineau (CSD) Jobs per Working Population 4.3 URBAN DENSITIES Exhibit 4-9 shows how EUA densities have changed between and. The exhibit shows population (in blue) and jobs (in green) per square kilometre. The results are mixed, with the largest CMAs generally increasing in EUA density, as have several Group C and D CMAs. The exhibit also shows that densities have increased in each of the 11 CSDs and CDs. Exhibit 4-10 plots the percentage changes in each EUA between and, separately for population (blue) and jobs (green). Calgary, Edmonton, Saskatoon and Moncton all recorded the highest percentage changes in population densities (10% - 11%), while Brampton and Surrey recorded the highest overall increases, at 21% and 19% respectively. Edmonton, Saskatoon, Regina and St. John s each recorded the highest increases in job density, at 5%. Windsor (-7%), Thunder Bay, Brantford, Greater Sudbury / Grand Sudbury, Oshawa, St. Catharines Niagara and London all recorded reduced densities, most likely reflecting the recession. Exhibit 4-11 compares the densities across the CBD, EUA and total CMA for each CMA. Again, while the densities are highest in the CBDs, some CBDs are more concentrated than others, especially Vancouver (the highest density overall), followed by Toronto, Montréal, Calgary, Edmonton and Regina. CBD densities generally are significantly higher than those in the EUA and total CMA, as expected; however, the ratios are much higher in the aforementioned CMAs than elsewhere. To some extent, concentrated CBD densities are easier to serve by transit and reflect, in part, closer live-work relationships that are conducive to travel by alternatives to the auto. On the other hand, CBD densities are a function of the local economic structure meaning that relatively dense urban cores exist only a small number of smaller CMAs, such as St. John s and Saint John. Although EUA and total CMA densities are highest in the three largest CMAs, they are still low overall. April
, - Group A Toronto (CSD) Toronto Mississaug a (CSD) Brampton (CSD)")
 Ottawa (CSD) Ottawa-Gatineau 0 2,000 4,000 6,000 8,000")
67 Exhibit 4-9. EUA Urban Density (Population + Jobs), - Group A Toronto (CSD) Toronto Mississaug a (CSD) Brampton (CSD) Montréal (CD) Montréal Longueuil (CD) Laval (CD) Vancouver (CSD) Vancouver Surrey (CSD) Burnaby (CSD) Group B Hamilton Winnipeg Québec Edmonton Calgary Gatineau (CSD) Ottawa (CSD) Ottawa-Gatineau 0 2,000 4,000 6,000 8,000 10, ,000 4,000 6,000 8,000 10,000 Persons plus jobs per km 2 Persons plus jobs per km 2 50 April 2016
68 Exhibit 4-9. EUA Urban Density (Population + Jobs), -, continued Group C Kitchener - Cambridge - Waterloo St. Catharines - Niagara London St. John's Sherbrooke Regina Saskatoon Windsor Victoria Oshawa Halifax Group D Abbotsford - Mission Kelowna Barrie Greater Sudbury / Grand Sudbury Trois- Rivières Saguenay Kingston Thunder Bay Saint John Brantford Moncton Guelph Peterborou gh 0 2,000 4, ,000 Persons plus jobs per km 2 Persons plus jobs per km 2 April
 Mississauga (CSD) Brampton (CSD) Montréal Montréal (CD)")

69 Exhibit Percent Change in EUA Densities, - Jobs Population Group D Group C Group B Group A EU A EU A EU A EU A Toronto Toronto (CSD) Mississauga (CSD) Brampton (CSD) Montréal Montréal (CD) Laval (CD) Longueuil (CD) Vancouver Vancouver (CSD) Surrey (CSD) Burnaby (CSD) Ottawa-Gatineau Ottawa (CSD) Gatineau (CSD) Calgary Edmonton Québec Winnipeg Hamilton Kitchener - Cambridge - Waterloo London St. Catharines - Niagara Halifax Oshawa Victoria Windsor Saskatoon Regina Sherbrooke St. John's Barrie Kelowna Abbotsford - Mission Greater Sudbury / Grand Sudbury Kingston Saguenay Trois-Rivières Guelph Moncton Brantford Saint John Thunder Bay Peterborough -15% -10% -5% 0% 5% 10% 15% 20% 25% Percent change in densities 52 April 2016
70 Exhibit EUA, CBD and CMA Densities Compared (Population + Jobs), CBD EUA CMA Group D Group C Group B Group A Toronto Montréal Vancouver Ottawa-Gatineau Calgary Edmonton Québec Winnipeg Hamilton Kitchener - Cambridge - Waterloo London St. Catharines - Niagara Halifax Oshawa Victoria Windsor Saskatoon Regina Sherbrooke St. John's Barrie Kelowna Abbotsford - Mission Greater Sudbury / Grand Sudbury Kingston Saguenay Trois-Rivières Guelph Moncton Brantford Saint John Thunder Bay Peterborough 0 10,000 20,000 30,000 40,000 50,000 60,000 70,000 80,000 90,000 Urban densities by location within the CMA (population + jobs per km 2 ) April
71 54 April 2016
72 5. OVERALL TRANSPORTATION ACTIVITY AND IMPACTS 5.1 TRIP MAKING Exhibit 5-1 presents the daily trips per capita by EUA, from through. The data are shown by EUA as well as for the selected CSDs and CDs. As with the previous UTIs, the trip rates vary among urban areas, because of local differences in travel surveys and in the definition of a trip. Some CMAs have experienced a reduction in trip rates since (and, in some cases, since ) notably, Montréal, Calgary, Québec, Kitchener-Cambridge-Waterloo and Oshawa. The reasons for the reductions are not clear, although there is some evidence from origin-destination surveys in different parts of the country that trip rates have stabilized. In any event, the CSD and CD trip rates in some regions (Vancouver and Toronto) are higher than the corresponding EUA rates, again for reasons that are not apparent. Journey to work distances provide an indication of the spatial dispersion of where people live and where they work. Exhibit 5-2 compares the median CMA journey to work distances for, and, using Census and National Household Survey tabulations. Here, the median distances are not tied specifically to the population group, but may reflect factors such as changes in the local economy (forcing people to commute longer distances), growth in suburban jobs or expansion of the commutershed. Oshawa continues to have the highest median commuting distance, now approaching 12 km, followed by Barrie, Toronto, Hamilton, Calgary, Ottawa-Gatineau and Edmonton: except for Barrie, median distances in these CMAs have all increased. The long commuting distances in Oshawa, Barrie, Toronto and Hamilton reflect the fact that they are part of the very large commutershed that makes up the Greater Toronto and Hamilton Area, which encompasses all or parts of several CMAs. Median commute distances in most other CMAs have also increased, but have decreased in Montréal, Vancouver, Québec, Winnipeg, Victoria, Regina, Abbotsford-Mission, Kingston, Thunder Bay and Peterborough. Exhibit 5-3 shows that median commuting distances have increased in most CMAs, with high percent increases recorded in Brantford, Saguenay (for both five-year periods), Saint John, Sherbrooke, Oshawa and St. Catharines Niagara. By comparison, Exhibit 5-4 shows the median journey-to-work trip distances as measured over the EUA. Note that the EUA data are sourced from the National Household Survey: EUA data from the Census do not exist for previous years. April
 Mississauga (CSD) Brampton (CSD) Montréal Montréal (CD) Laval (CD) Longueuil (CD)")

73 Exhibit 5-1. EUA Daily Trips per Capita, - Group D Group C Group B Group A Toronto Toronto (CSD) Mississauga (CSD) Brampton (CSD) Montréal Montréal (CD) Laval (CD) Longueuil (CD) Vancouver Vancouver (CSD) Surrey (CSD) Burnaby (CSD) Ottawa (CSD) Ottawa - Gatineau Gatineau (CSD) Calgary Edmonton Québec Winnipeg Hamilton Kitchener - Cambridge - Waterloo London St. Catharines - Niagara Halifax Oshawa Victoria Windsor Saskatoon Regina Sherbrooke St. John's Barrie Kelowna Abbotsford - Mission Greater Sudbury / Grand Sudbury Kingston Saguenay Trois-Rivières Guelph Moncton Brantford Saint John Thunder Bay Peterborough Daily Trips per Capita 56 April 2016

74 Exhibit 5-2. Median CMA Journey-to-Work Trip Distances, - Group D Group C Group B Group A Toronto Montréal Vancouver Ottawa-Gatineau Calgary Edmonton Québec Winnipeg Hamilton Kitchener - Cambridge - Waterloo London St. Catharines - Niagara Halifax Oshawa Victoria Windsor Saskatoon Regina Sherbrooke St. John's Barrie Kelowna Abbotsford - Mission Greater Sudbury / Grand Sudbury Kingston Saguenay Trois-Rivières Guelph Moncton Brantford Saint John Thunder Bay Peterborough Median Journey to Work Distance (km) April


75 Exhibit 5-3. Median CMA Journey-to-Work Trip Distances, - - Changes Toronto Montréal Vancouver Ottawa-Gatineau Calgary Edmonton Québec Winnipeg Hamilton Kitchener - Cambridge - Waterloo London St. Catharines - Niagara Halifax Oshawa Victoria Windsor Saskatoon Regina Sherbrooke St. John's Barrie Kelowna Abbotsford - Mission Greater Sudbury / Grand Sudbury Kingston Saguenay Trois-Rivières Guelph Moncton Brantford Saint John Thunder Bay Peterborough -15% -10% -5% 0% 5% 10% 15% 20% % Difference with previous survey year 58 April 2016
76 Exhibit 5-4. Median EUA Journey-to-Work Trip Distances, Group D Group C Group B Group A Toronto Montréal Vancouver Ottawa - Gatineau Calgary Edmonton Québec Winnipeg Hamilton Kitchener - Cambridge - Waterloo London St. Catharines - Niagara Halifax Oshawa Victoria Windsor Saskatoon Regina Sherbrooke St. John's Barrie Kelowna Abbotsford - Mission Greater Sudbury / Grand Sudbury Kingston Saguenay Trois-Rivières Guelph Moncton Brantford Saint John Thunder Bay Peterborough Median Journey to Work Distance (km) April


, by CMA 15 16 Note that median means that half the observations were above this value, and half were below.")
77 For the first time, the Census (NHS) collected commute trip durations for each mode. Exhibit 5-5 shows the median durations, in minutes, by mode for each CMA It can be seen that the ranges are not consistent with CMA population, nor are they necessarily consistent among the modes. The data do provide, however, an indication of the actual conditions experienced by commuters, such as congestion, as well as the commuting distances, transit routing and so on. It can be seen that transit trips generally have the longest duration thought not always: in most of the largest CMAs, the transit duration is actually shorter than that of auto driver trips, which may reflect the fact that these are median times, unweighted by the actual numbers of trips. Walking trips generally have the shortest duration, followed by cycling trips. Exhibit 5-5. Journey-to-Work Durations by Mode (median minutes), by CMA Note that median means that half the observations were above this value, and half were below. The values are not weighted by the numbers of commute linkages that were actually made, and so these are not true averages. The other mode category is not shown. This category includes diverse modes such as motorboat. 60 April 2016
78 Note that these median per-mode times are not comparable with the observed average times reported by some CMAs in Chapter 10 specifically, Exhibit 10-7 and Exhibit 10-8, which report the average number of minutes spent on the journey to work in a car or in a transit vehicle, as observed from local origin-destination travel surveys. The differences can be attributed to methodological differences in survey process, sample size and so on; moreover, the NHS data may also include out-of-vehicle access, egress, wait and transfer times. Accordingly, the median times discussed above should be considered as illustrative. Exhibit 5-6 summarizes the trip durations. It can be seen that the maximums for all modes occur in Barrie or Oshawa, both of which are part of the Toronto commutershed. Minimum values generally occur in Group C communities, with the exception of walking in Montréal. The exhibit also shows average medians for each mode, for all CMAs and by population group. Of note, the averages for all modes are highest in the smallest CMAs (Group D). Transit durations are higher than auto driver for Group A and Group D, but are lower in Groups B and C. Auto driver durations are higher than those for auto passenger; and the durations for motorized modes are higher than those for cycling and walking. Walking and cycling trip durations are close to each for maximum, minimum and averages. Exhibit 5-6. Journey-to-Work Durations by Mode (median minutes), - Summary Median Driver Passenger Transit Cycling Walking Maximum 24.8 (Barrie) 20.9 (Barrie) 35.7 (Oshawa) 14.0 (Barrie) 12.6 (Barrie) Minimum 8.3 (Regina) 8.3 (St. John s) 6.3 (Regina) 4.6 (Saskatoon) 4.0 (Montréal) Average Group A Group B Group C Group D MODAL SHARES - CBD New for the UTI5, respondents were asked to describe travel to the CBD during the AM peak period. The object is to demonstrate the role of sustainable modes in accessing the urban core, which is typically the single-most importance concentration of jobs (and, sometimes, post-secondary schools) in CMAs. Exhibit 5-7 presents the mode shares for trips to the CBD during the AM peak period, for those CMAs for which data were available. It can be seen that the transit share is highest by far in the three largest CMAs: 67% in Montréal, 65% in Toronto and 60% in Vancouver, followed by 45% in Ottawa-Gatineau, 33% in Calgary, 30% in Québec and 22% in Winnipeg. Among the Group C CMAs, Victoria has a 23% transit share to the CBD, with Sherbrooke next highest at 11%. The three reporting Group D CMAs reported transit shares of 4%-5% (Guelph, Trois-Rivières and Kelowna). The results suggest that the transit level of service is a significant determinant of the transit share, specifically, the provision of higher-order transit to the CBD. Other factors also may be at play, such as a critical mass of jobs in the CBD, the proportion of the CMA s jobs located in the CBD (see Exhibit 4-5), and the nature of employment (e.g., Victoria is the Provincial seat of government). April
79 Active transportation (walking and cycling) shares are strong in several CMAs, especially Victoria (24%), Calgary (21%), Vancouver (14%), Ottawa-Gatineau (13%) and Québec and Kelowna (both 11%). The City of Vancouver has an active transportation share of 30% to the Vancouver CBD. In contrast, the auto driver shares to the CBDs are lowest in the largest CMAs, at 20% in Toronto and Vancouver and 22% in Montréal, growing steadily as CMA size decreases, to a high of 78% in Guelph. Overall, the available results suggest that the availability of alternatives to driving, especially higherorder transit and, likely, cycling paths, is key to reducing the auto share to the CBD. Other likely influences include the mix of residents and jobs in the urban core, which allows workers to live within walking or cycling distances of their workplace (see also Exhibit 4-7). 62 April 2016
 Auto Driver Auto Passenger Transit Walk Cycle Other Toronto Toronto (CSD) Montréal Group D Group C")

 Exhibit 5-8 presents the average occupancy for AM peak period auto trips to the CBD.")
 in Vancouver, to 1.")
80 Exhibit 5-7. Modal Shares to CBD, AM Peak Period (%) Auto Driver Auto Passenger Transit Walk Cycle Other Toronto Toronto (CSD) Montréal Group D Group C Group A Montréal (CD) Vancouver Vancouver (CSD) Surrey (CSD) Burnaby (CSD) Ottawa-Gatineau Ottawa (CSD) Gatineau (CSD) Calgary Québec Winnipeg Kitchener - Cambridge - Waterloo St. Catharines - Niagara Oshawa Victoria Sherbrooke Kelowna Trois-Rivières Guelph 0% 10% 20% 30% 40% 50% 60% 70% 80% 90% 100% Mode Shares to CBD (AM Peak Period) Exhibit 5-8 presents the average occupancy for AM peak period auto trips to the CBD. This is a measure of ridesharing, which is another sustainable transportation initiative: the higher the occupancy rate, the more efficient the vehicle trip. Again, the largest CMAs have the highest averages, ranging from 1.50 persons per vehicle (ppv) in Vancouver, to 1.30 in Calgary, 1.28 ppv in Ottawa-Gatineau, 1.24 ppv in Toronto, 1.23 ppv in Québec and 1.22 ppv in Montréal. The overall highest average occupancy is Victoria, at 1.61 pp, with Halifax and Sherbrooke recording 1.36 and 1.31 ppv, respectively. The smaller April

81 CMAs record the lowest occupancies: Kelowna at 1.10 ppv and Guelph at 1.12 ppv. In sum, several CMAs report strong average occupancies, generally (though not always) among the larger CMAs. Exhibit 5-8. Auto Occupancy to CBD, AM Peak Period Toronto Toronto (CSD) Montréal Group D Group C Group B Group A Montréal (CD) Vancouver Vancouver (CSD) Surrey (CSD) Burnaby (CSD) Ottawa - Gatineau Ottawa (CSD) Gatineau (CSD) Calgary Québec Winnipeg Kitchener - Cambridge - Waterloo St. Catharines - Niagara Halifax Oshawa Victoria Sherbrooke Kelowna Trois-Rivières Guelph Average Number of Persons Per Vehicle, Auto Trips to CBD (AM Peak Period) Exhibit 5-9 shows changes in the number of AM peak period trips to the CBD, from to. For most of the available CMAs, it can be seen that trips have increased, although the rate of increase is not always consistent with the increase in CBD jobs (see Exhibit 4-5 and Exhibit 4-6). For example, CBDdestined trips in the Toronto and Calgary CMAs have largely kept pace with the growth in CBD jobs, 64 April 2016

82 whereas the growth in trips to the Montréal, Vancouver and Ottawa-Gatineau CBDs has not increased as fast CBD jobs in these CMAs. These findings suggest that although the urban core remains the dominant centre of activity employment and otherwise other areas outside the CBD also are gaining importance, at least in some CMAs. Exhibit 5-9. Total Trips to CBD, All Modes, AM Peak Period, - Group D Group C Group B Group A Toronto Toronto (CSD) Montréal Montréal (CD) Vancouver Vancouver (CSD) Surrey (CSD) Burnaby (CSD) Ottawa - Gatineau Ottawa (CSD) Gatineau (CSD) Calgary Québec Winnipeg Kitchener - Cambridge - Waterloo St. Catharines - Niagara Oshawa Victoria Sherbrooke Kelowna Trois-Rivières Guelph Thousands Total Trips to CBD (All Modes, AM Peak Period) Exhibit 5-10 shows the breakdown of mode shares to the CBD, this time for the entire day. Patterns similar to those in the AM peak period occur. Transit continues to be the dominant mode in the three largest CMAs, at 57% in Montréal and Vancouver and 54% in Toronto. Transit shares are high in Ottawa- Gatineau (33%), Halifax (29%), Québec (22%) and Calgary (20%). Active transportation is highest in Calgary (40%) and Victoria (35%), followed by Vancouver and Québec at 24% and Winnipeg and Ottawa- Gatineau at 22%. The use of transit is linked to CMA size, as it is for the AM peak period; however, the active transportation shares is less dependent on CMA size, as is evidenced by the close range of shares recorded in CMAs of varying sizes: Trois-Rivières (15%), Sherbrooke (13%), Halifax (17%) and London (13%). In part, the active transportation shares likely reflect trips made during the course of the work or school day for example, to lunch or to shop at a nearby store (hence the importance of being able to record all activities during the course of one s daily routine). April
 Auto Driver Auto Passenger Transit Walk Cycle Other Group D Group C Group B Group A")
 Gatineau (CSD) Calgary Québec Winnipeg Kitchener - Cambridge - Waterloo London St.")
 Exhibit 5-11 shows how the daily CBD-destined mode shares have")

83 Exhibit Modal Shares to CBD, Daily (24 hour, %) Auto Driver Auto Passenger Transit Walk Cycle Other Group D Group C Group B Group A Toronto Toronto (CSD) Montréal Montréal (CD) Vancouver Vancouver (CSD) Surrey (CSD) Burnaby (CSD) Ottawa - Gatineau Ottawa (CSD) Gatineau (CSD) Calgary Québec Winnipeg Kitchener - Cambridge - Waterloo London St. Catharines - Niagara Halifax Oshawa Victoria Sherbrooke Kelowna Abbotsford - Mission Trois-Rivières Guelph 0% 10% 20% 30% 40% 50% 60% 70% 80% 90% 100% Mode Shares to CBD (24 hour) Exhibit 5-11 shows how the daily CBD-destined mode shares have changed over time. It can be seen that the transit share has increased in some CMAs for example, Montréal, Québec, Sherbrooke, Ottawa- Gatineau and Oshawa but has decreased in others, such as Toronto, Vancouver, Victoria, Calgary and Winnipeg. The reductions in Vancouver, Victoria and Calgary were offset, in part, by increases in the active transportation shares especially in Vancouver. 66 April 2016
, - Transit Auto Active")
")
 Gatineau (CSD) 0% 10% 20% 30% 40% 50% 60% 70% 80% 90% 100%")
84 Exhibit CBD Mode Shares for Daily Trips (24-hour), - Transit Auto Active Transportation Group B Group A Hamilton Winnipeg Québec Edmonton Calgary Ottawa-Gatineau Vancouver Montréal Toronto Toronto (CSD) Montréal (CD) Vancouver (CSD) Surrey (CSD) Burnaby (CSD) Ottawa (CSD) Gatineau (CSD) 0% 10% 20% 30% 40% 50% 60% 70% 80% 90% 100% CBD Mode Shares for Daily Trips (24h) April
, -, continued Transit Auto Active Transportation Group D Group C Kitchener - Cambridge - Waterloo St.")
 5.3 MODAL SHARES EUA 5.3.1 OVERVIEW This section presents EUA mode shares and their evolution over time.")

85 Exhibit CBD Mode Shares for Daily Trips (24-hour), -, continued Transit Auto Active Transportation Group D Group C Kitchener - Cambridge - Waterloo St. Catharines - Niagara Guelph Trois-Rivières Kelowna Barrie Sherbrooke Victoria Oshawa 0% 10% 20% 30% 40% 50% 60% 70% 80% 90% 100% CBD Mode Shares for Daily Trips (24h) 5.3 MODAL SHARES EUA OVERVIEW This section presents EUA mode shares and their evolution over time. New to the UTI5, the discussion also presents mode shares according to three key attributes of mode choice - age, occupation type and gender as the basis for future comparisons. Exhibit 5-12 summarizes the mode shares for daily trips in the EUA. It can be seen that the auto driver share dominates all reporting CMAs; however, transit is strong in the largest CMAs, with shares of 19% in Montréal, 16% in Toronto, 15% in Vancouver and 13% in Ottawa-Gatineau. Note that several 68 April 2016

 Longueuil (CD) Vancouver Vancouver (CSD) Surrey (CSD) Burnaby (CSD) Ottawa - Gatineau Ottawa (CSD) Gatineau (CSD) Calgary Québec Winnipeg Kitchener - Cambridge - Waterloo Oshawa")


86 CSDs and CDs have even higher transit shares, including the City of Montréal at 27%, the City of Toronto at 25%, the City of Vancouver at 24% and Burnaby at 22%. These CSDs and CDs similarly have the highest active transportation shares, 17% in the City of Vancouver, 16% in the City of Montréal and 13% in the City of Ottawa. Exhibit Modal Shares for EUA, Daily (24 hour, %, all ages) Auto Driver Auto Passenger Transit Walk Cycle Other Toronto Toronto (CSD) Montréal Montréal (CD) Group D Group C Group B Group A Laval (CD) Longueuil (CD) Vancouver Vancouver (CSD) Surrey (CSD) Burnaby (CSD) Ottawa - Gatineau Ottawa (CSD) Gatineau (CSD) Calgary Québec Winnipeg Kitchener - Cambridge - Waterloo Oshawa Sherbrooke Kelowna Trois-Rivières Guelph 0% 10% 20% 30% 40% 50% 60% 70% 80% 90% 100% Mode Shares for EUA (24 hour) Exhibit 5-13 shows how the daily EUA shares have changed over time. In the three largest CMAs, it can be seen that the EUA transit and active transportation shares have increased over time. In the Group B CMAs, the transit and active transportation shares have dropped in Ottawa-Gatineau and Calgary, but have increased in Québec. There is a similarly mixed pattern in the Group C and Group D CMAs, with the transit share having increased in Kitchener-Cambridge-Waterloo, Oshawa, Sherbrooke and Kelowna, but having dropped in Trois-Rivières and Guelph. By comparison, the active transportation share in these CMAs generally dropped, except for Sherbrooke. April
, - Transit Auto Active Transportation Ottawa - Gatineau Vancouver Montréal Toronto")
87 Exhibit EUA Mode Shares for Daily Trips (24 hour, %, all ages), - Transit Auto Active Transportation Ottawa - Gatineau Vancouver Montréal Toronto Hamilton Winnipeg Québec Edmonton Calgary 0% 10% 20% 30% 40% 50% 60% 70% 80% 90% 100% EUA Mode Shares for Daily Trips (24h) 70 April 2016

88 Exhibit EUA Mode Shares for Daily Trips (24 hour, %, all ages), -, continued Transit Auto Active Transportation Kitchener - Cambridge - Waterloo St. Catharines - Niagara London Brantford Guelph Trois-Rivières Kelowna Barrie Sherbrooke Victoria Oshawa 0% 10% 20% 30% 40% 50% 60% 70% 80% 90% 100% EUA Mode Shares for Daily Trips (24h) April

89 Exhibit 5-14 shows daily EUA trips per capita for the reporting CMAs. It can be seen that the EUA trip rates average 2.80, with a low of 2.10 trips per person in the Montréal EUA and highs of 3.50 trips per person in Kelowna and 3.58 trips per person in Calgary. Per capita trip rates are higher in the CSDs, with the highest rate recorded in the City of Vancouver at 7.29 trips per capita in the City of Vancouver: this suggests that many of the trips are generated by the city s daytime population, which in turn is consistent with the high proportion of walk trips to the CBD (i.e., short-distance trips) in Vancouver and elsewhere as shown in Exhibit 5-10 and Exhibit Exhibit Total EUA Trips per Capita, All Modes, 24 hour Group D Group C Group B Group A Toronto Toronto (CSD) Montréal Montréal (CD) Laval (CD) Longueuil (CD) Vancouver Vancouver (CSD) Surrey (CSD) Burnaby (CSD) Ottawa - Gatineau Ottawa (CSD) Gatineau (CSD) Calgary Québec Winnipeg Kitchener - Cambridge - Waterloo Oshawa Sherbrooke Kelowna Trois-Rivières Guelph Total EUA Trips (24h - All Modes) The NHS journey-to-work questions ask respondents about the usual mode they use to commute to work. Although not as precise in describing travel patterns as an O-D survey, the question provides insight into habitual behaviour on the regular commute. Exhibit 5-15 compares the journey-to-work mode shares for, and, for each CMA by population group. Three categories are shown: transit, auto (driver and passenger) and active transportation (bicycle and walk). In general, auto continues to dominate; however, the transit and active transportation shares have increased slightly, at the expense of the auto share. It can be seen that, for, the transit shares have increased slightly in all of the Group A and Group B CMAs except for Hamilton. In some cases, the increases reverse a decline. In the four largest 72 April 2016


90 CMAs, the transit commute share exceeds 20%, with Toronto s share at 23.6% and Vancouver s share having increased by one third since, to 20.7%. Active transportation commuting shares in these CMAs are less than 10%, with the highest shares recorded in Vancouver and Ottawa-Gatineau (both at 8.7%), which both grew: the non-motorized share declined slightly or stayed the same (with respect to ) in the other large CMAs. The transit shares in Group C have increased for most CMAs, although the picture is mixed for the smaller Group D CMAs. Halifax and Victoria show the highest transit shares, at 12.8% and 11.7%, respectively. These CMAs also have the highest active transportation shares, at 16.8% in Victoria and 9.9% in Halifax. Exhibit CMA Journey-to-Work Mode Shares, - Group A Vancouver Montréal Toronto Transit Auto Active Transportation 0% 10% 20% 30% 40% 50% 60% 70% 80% 90% 100% Mode Share Transit Auto Active Transportation Group B Ottawa- Gatineau Edmonto n Calgary Hamilton Winnipeg Québec 0% 10% 20% 30% 40% 50% 60% 70% 80% 90% 100% Mode Share April
91 Exhibit CMA Journey-to-Work Mode Shares, -, continued Transit Auto Active Transportation Group C Kitchener - Cambridge - Waterloo St. Catharines - Niagara London St. John's Sherbrooke Regina Saskatoon Windsor Victoria Oshawa Halifax 0% 10% 20% 30% 40% 50% 60% 70% 80% 90% 100% Mode Share 74 April 2016

92 Exhibit CMA Journey-to-Work Mode Shares, -, continued Transit Auto Active Transportation Group D Abbotsford - Mission Kelowna Barrie Greater Sudbury / Grand Sudbury Trois- Rivières Saguenay Kingston Thunder Bay Saint John Brantford Moncton Guelph Peterborou gh 0% 10% 20% 30% 40% 50% 60% 70% 80% 90% 100% Mode Share April
93 5.3.2 MODE SHARE BY AGE GROUP It is well established that mode choice varies by age group. This is due to factors such as the availability of a driver s license, occupational status, occupational type and mobility challenges. For example, many travel surveys have found that as people s income increases with age, they tend to purchase and increasingly use the private automobile. In the meantime, an increasing general awareness of the health benefits of active transportation means that people of all age groups are walking and cycling more. On the other hand, an aging population may increasingly face mobility challenges, meaning that many people no longer can drive. Accordingly, an understanding of how mode choice changes with age can help identify new needs for alternative to the drive-alone trip. As a simple proxy for these factors, Exhibit 5-16 shows mode shares for three age groups: 0-19 years. This group is dominated by students (i.e., people who are not yet in the workforce) and by people who are too young to be eligible to have a driver s license years. This group is made up primarily of people who are in the workforce and/or are raising families. 65+ years. This group is dominated by people who are no longer in the workforce. Note that these characterizations clearly are intended as generalizations, useful for the purposes of this discussion. For example, there are many workers in both the 0-19 and 65+ groups, and many people in the group who are not in the workforce. All age groups are active: it is their activities and mobility choices and needs vary. The point is to establish a practical basis for monitoring changes over time. As expected, among the reporting CMAs the 0-19 age group features low auto driver trips, in favour of all other modes: auto passenger, transit and walking. Cycling also has higher shares than the other age groups, though much smaller than the other non-driver modes. These choices are consistent with the lack of a driver s license and a lack of access to a vehicle, both of which increase a person s dependency on other modes. The age group tends to be the most dependent on auto driver trips, which dominate the shares of this group. This is again consistent with the employment, economic, income and familial status of this group. Even so, transit and walking are well represented in the largest CMAs (Toronto, Montréal, Vancouver, Ottawa-Gatineau). Overall, walking is well represented in most reporting CMAs although the same is not true for transit. Among the reporting Group B CMAs, auto passenger, transit and walking are represented equally, with auto passenger dominating these three modes in the reporting Group C and Group D CMAs. Cycling is strongest in this age group in the City of Montréal, the City of Vancouver (at 4%, the highest rate), Ottawa-Gatineau and Kelowna. To some extent, these rates reflect the supply of cycling paths. Auto driver trips similarly dominate the 65+ age group, although at noticeably lower rates than the age group. (Ottawa-Gatineau, and the City of Ottawa in particular, are the sole exceptions: the 65+ auto driver share is slightly higher than that of the share.) In all cases, the auto passenger share increases compared with that of the age group (suggesting people s continued reliance on the personal automobile). The transit share drops correspondingly, although walking continues to have a 17 Note that most surveys do not report the activity of very young children, in large part because they do not travel independently. However, because the threshold age varies among surveys, all ages are included in this description. 76 April 2016

 Auto Driver Auto")
 Montréal Toronto (CSD) Toronto Vancouver (CSD) Vancouver")

 by age group April")
94 strong share. Cycling is present, although at relatively small shares for most reporting CMAs, with Kelowna s share being highest, at 2.4%. Exhibit Modal Shares for EUA, Daily (24 hour, % by age group) Auto Driver Auto Passenger Transit Walk Cycle Other Group A Longueuil (CD) Laval (CD) Montréal (CD) Montréal Toronto (CSD) Toronto Vancouver (CSD) Vancouver Burnaby (CSD) Surrey (CSD) 0 to to Plus 0 to to Plus 0 to to Plus 0 to to Plus 0 to to Plus 0 to to Plus 0 to to Plus 0 to to Plus 0 to to Plus 0 to to Plus 0% 10% 20% 30% 40% 50% 60% 70% 80% 90% 100% Mode Shares for EUA (24 hour) by age group April
,")
")


 by age group 78 April 2016")
95 Exhibit Modal Shares for EUA, Daily (24 hour, % by age group), continued Auto Driver Auto Passenger Transit Walk Cycle Other Group D Group C Group B Ottawa - Gatineau Ottawa (CSD) Gatineau (CSD) Kitchener - Cambridge - Waterloo Winnipeg Québec Calgary Sas kat oo n Victoria Oshawa Trois- Rivières Kelowna Sherbrooke Guelph 0 to to Plus 0 to to Plus 0 to to Plus 0 to to Plus 0 to to Plus 0 to to Plus 0 to to Plus 0 to to Plus 20 to Plus 0 to 19 0 to to Plus 0 to to Plus 0 to to Plus 0 to to Plus 0% 10% 20% 30% 40% 50% 60% 70% 80% 90% 100% Mode Shares for EUA (24 hour) by age group 78 April 2016

96 Changes in average auto occupancy (persons per vehicle, or ppv) by age group also can be indicative, as shown in Exhibit The exhibit shows the average occupancy rates for the and 65+ age groups, for the reporting CMAs. 18 Exhibit Auto Occupancy for EUA, Daily (24 hour, by age group) Toronto 20 to Plus Group D Group C Group B Group A Vancouver Vancouver (CSD) Surrey (CSD) Burnaby (CSD) Ottawa - Gatineau Ottawa (CSD) Gatineau (CSD) Calgary Winnipeg Kitchener - Cambridge - Waterloo Oshawa Victoria Kelowna Guelph Auto Occupancy EUA 24h 18 Note that the calculation is based on the auto driver and auto passenger trips made by people within the given age group. Because there are relatively few licensed drivers in the 0-19 group as a proportion of total travellers in that group, the calculated 0-19 ppv rate is much higher than it should be: it is showing the ratio of people who drive to people who are passengers. While this is true of the other two groups, the much higher proportions of drivers in each of those groups makes those calculations a reasonable approximation for ppv for those two groups. April

. 5.3.")
, the need to have a vehicle at work, the location of the workplace in the urban area, hours of work (i.e., perceived safety level), and the availability and level of service of alternatives to driving.")
97 It can be seen that the occupancy rates for the two groups are generally of the same order. However, in most CMAs, the 65+ rate is higher than that of the group: this is consistent the lower occupancy rates associated with work trips and the higher rates associated with non-work trips. Calgary is an exception, with a rate of 1.46 ppv, dropping to 1.3 ppv for the 65+ group. Victoria similarly drops, from 1.53 ppv to 1.47 ppv, respectively. The rates for the two age groups are also close to, but generally greater than, those observed in AM peak period trips to the CBD (see Exhibit 5-8) MODE SHARE BY OCCUPATION Occupation type can be an important indicator of mode choice, reflecting such factors as income (which tends to be associated with higher vehicle ownership and vehicle use), the need to have a vehicle at work, the location of the workplace in the urban area, hours of work (i.e., perceived safety level), and the availability and level of service of alternatives to driving. The NHS data were grouped according to Statistics Canada s ten commonly used occupational categories. Exhibit 5-18 shows the EUA mode shares over all CMAs by occupation. Exhibit EUA Commute Mode Share by Occupation Commute Mode in EUA by Occupation 1. Management 2. Professional 3. Technical and paraprofessional 4. Administration and administrative support 5. Sales 6. Personal and customer information services 7. Industrial, construction and equipment operation trades 8. Workers and labourers in transport and construction 9. Natural resources, agriculture and related productions occupations 10. Occupations in manufacturing and utilities Auto Driver Auto Passenger Transit Walk Cycle Other 0% 20% 40% 60% 80% 100% 120% It can be seen that personal and customer information services (category 6), sales (5), and administration and administrative support (4) have the highest transit shares at 24%, 22% and 22% respectively. Professional (2) follows, with a 20% transit share. Walking is highest for personal and customer information services, and sales, at 9%. Professional occupations have the highest cycling share, at 2.5%, with natural resources, agriculture and related productions occupations (9) next at 2.2%. The last category has the highest auto passenger share, at 12%, which is much greater than the 8% shares associated with sales and with occupations in manufacturing and utilities (10): one possible reason for these higher shares could be the fixed start and end hours of many of these occupations (i.e., shifts), which is conductive to ridesharing. Finally, the auto driver share, which dominates all 80 April 2016
98 occupations, is highest for industrial, construction and equipment operation trades (7), at 88%, followed by workers and labourers in transport and construction (8), at 82%. The auto driver share is lowest for personal and customer information services, at 57%, and sales, at 59%: these mirror the higher transit and walking shares that are associated with these occupations, together possibly reflecting income levels and the localized nature of many retail jobs (i.e., home and work are close to each other, such as supermarkets, etc.). Going forward, comparisons with OD surveys, which provide more detailed information on vehicle availability, income, and so on would yield further insight. In the meantime, the NHS data provide a useful benchmark of the relationship between occupation and commute mode share. Exhibit 5-19 shows how the mode choice patterns vary by CMA size for each occupational category. Within the overall tendencies shown in Exhibit 5-18 for each occupational category, it can be seen that the transit share is highest in the largest CMAs and the reverse is true for the auto driver trip, which dominates all CMAs. Interestingly, the walk and cycling shares, in most cases, generally retain the same shares (or close to the same shares) regardless of CMA size for a given occupational category MODE SHARE BY GENDER Mode choice also has been shown to vary by gender. For the working-age population, a key factor has been occupation, which has been expressed in two ways: the proportion of females in the labour force, which is now approaching equal proportions with males, in Canada and in several other countries. Also important is the type of occupation, which is also a proxy for income, which in turn is a determinant of vehicle ownership and, ultimately, mode choice. Traditionally, on average females had tended to be employed in lower-paying occupations than males. The findings of some recent OD surveys in Canada suggest that females are now becoming equal to males in both the numbers and types of jobs, with some further suggestion that employed females are starting to drive more as they take on higher-paying occupations. If so, this is consistent with findings in the United States and elsewhere. However, more research is needed to explore this topic, which could have implications on estimating future travel demand. As a benchmark for future analysis, Exhibit 5-20 shows the EUA commuting shares by gender for each CMA. The exhibit also profiles commuting mode choice. For example, in many CMAs, the cycling share is higher for males than for females, whereas in some CMAs, the transit and walk shares are higher for females than for males. 5.4 ENERGY AND ENVIRONMENT Previous UTI surveys have tracked the consumption of gasoline fuel for road vehicles. This information in turn is used to track CO 2 emissions, which are the main component of greenhouse gases. For the purposes of this analysis, a constant factor of kg of CO 2 per litre of gasoline is used to estimate CO 2 emissions. For consistency, this is the same factor used in the previous UTI reports. 19 Exhibit 5-21 shows how total annual gasoline-fuel CO 2 emissions have changed since the 1991 UTI survey. It can be seen that, although emissions (and gasoline fuel consumption) continue to increase, the rate since has slowed. 19 Because the CO 2 factor is held constant, Exhibit 5-21 is really showing fuel consumption. A more indicative analysis would use varying CO 2 factors, to reflect efficiencies gained from improvements in emissions control technologies and fuels over time. However, these factors were not available. April


99 Exhibit EUA Commute Mode Share by Occupation by CMA Group Auto Driver Auto Passenger Transit Walk Cycle Other Technical and Paraprofessi onal Professional Management Administratio n and administrativ e support Personal and customer information services Sales Industrial, construction and equipment operation trades Workers and labourers in transport and construction Natural resources, agriculture and related production occupations Occupations in manufacturin g and utilities Group A Group B Group C Group D Group A Group B Group C Group D Group A Group B Group C Group D Group A Group B Group C Group D Group A Group B Group C Group D Group A Group B Group C Group D Group A Group B Group C Group D Group A Group B Group C Group D Group A Group B Group C Group D Group A Group B Group C Group D 0% 10% 20% 30% 40% 50% 60% 70% 80% 90% 100% Mode shares 82 April 2016


100 Exhibit EUA Commute Share by Gender Trois- Rivière Guelp Peterb oroug h s Auto Driver Auto Passenger Transit Walking Cycle Other Group D Group C Group B Group A Greate Toront Calgar Québe Londo St. Cathar ines - Niagar Victori Abbots ford - Missio o Montr éal Vanco uver Ottaw a - Gatine au y Edmon ton c Winni peg Hamilt on Kitche ner - Cambr idge - Waterl oo n a Oshaw a Halifax a Winds or Saskat oon Sherbr ooke Regina St. John's Kelow na Barrie n r Sudbu ry / Grand Sudbu ry Kingst on Sague nay Monct on Brantf ord Saint John Thund er Bay h Male Female Male Female Male Female Male Female Male Female Male Female Male Female Male Female Male Female Male Female Male Female Male Female Male Female Male Female Male Female Male Female Male Female Male Female Male Female Male Female Male Female Male Female Male Female Male Female Male Female Male Female Male Female Male Female Male Female Male Female Male Female Male Female Male Female 0% 10% 20% 30% 40% 50% 60% 70% 80% 90% 100% April
101 Exhibit Total Transportation-Related CO 2 Emissions (Gasoline), Total Anuual Tonnes of CO 2 Emissions Millions Year Source of fuel data: The Kent Group Ltd., annual retail gasoline fuel sales. 20 Exhibit 5-22 shows how daily gasoline fuel use and CO 2 emissions per capita have changed since. Per capita emissions (and gasoline fuel consumption) have decreased in the three largest CMAs since. They have dropped slightly Ottawa-Gatineau, Québec City and Hamilton, but they have increased in Edmonton, Winnipeg and, especially, in Calgary. The per capita emissions have increased in some Group C CMAs, especially in St. John s, Regina and Saskatoon, all of which were experiencing rapid economic growth in. Rates in other CMAs also grew, while the rates dropped in London, Sherbrooke and, especially, Windsor. Among the Group D CMAs, Abbotsford Mission increased significantly, with strong growth also recorded in Moncton, Peterborough, Greater Sudbury / Grand Sudbury and Kingston. Rates dropped in Barrie, Kelowna, Guelph and Thunder Bay. For the first time, the UTI5 acquired diesel fuel consumption data. 21 Although gasoline remains the dominant energy source for light-duty vehicles, diesel is the primary fuel source for medium- and heavyduty vehicles; that is, commercial vehicles, school buses, transit buses and so on. Exhibit 5-23 shows the per capita CO 2 emissions from diesel fuel for. It can be seen that Abbotsford Mission has the highest per capita rates, double almost all other CMAs. Edmonton is next highest, followed by Greater Sudbury / Grand Sudbury, Kelowna, Regina, Saskatoon and Calgary. These high rates may be attributable to the region s economic structure and also to the locations of these CMAs on major national truck corridors Source of CO 2 conversion factor: Transport Canada s Urban Transportation Emissions Calculator (retained from the Fourth UTI report, for consistency). Predicated by the analysis of air pollutants as part of the new health indicators. 84 April 2016

102 Exhibit Daily Gasoline Use and Annual CO 2 Emissions Per Capita, - Daily Fuel Use Per Capita Annual CO2 Emissions Per Capita Annual Tonnes of CO 2 Emissions per Capita Group B Group A Ottawa- Gatineau Vancouver Montréal Toronto Hamilton Winnipeg Québec Edmonton Calgary Daily Fuel Used per Capita Source of fuel data: The Kent Group Ltd., annual retail gasoline fuel sales. April

103 Exhibit Daily Gasoline Use and Annual CO 2 Emissions Per Capita, -, continued Daily Fuel Use Per Capita Annual CO2 Emissions Per Capita Annual Tonnes of CO 2 Emissions per Capita Kitchener - Cambridge - Waterloo Group C St. Catharines - Niagara London St. John's Sherbrooke Regina Saskatoon Windsor Victoria Oshawa Halifax Daily Fuel Used per Capita Source of fuel data: The Kent Group Ltd., annual retail gasoline fuel sales. 86 April 2016
104 Exhibit Daily Gasoline Use and Annual CO 2 Emissions Per Capita, -, continued Daily Fuel Use Per Capita Annual CO2 Emissions Per Capita Annual Tonnes of CO 2 Emissions per Capita Group D Kelown a Barrie Abbotsford - Mission Greater Sudbury / Grand Sudbury Trois- Rivières Saguenay Kingston Moncto n Guelph Brantfo rd Thunder Bay Saint John Peterbo rough Daily Fuel Used per Capita Source of fuel data: The Kent Group Ltd., annual retail gasoline fuel sales. April

105 Exhibit Daily Diesel Use and Annual CO 2 Emissions per Capita, Annual CO 2 Emissions Per Capita Group D Group C Group B Group A Toronto Montréal Vancouver Ottawa-Gatineau Calgary Edmonton Québec Winnipeg Hamilton Kitchener - Cambridge - Waterloo London St. Catharines - Niagara Halifax Oshawa Victoria Windsor Saskatoon Regina Sherbrooke St. John's Barrie Kelowna Abbotsford - Mission Greater Sudbury / Grand Sudbury Kingston Saguenay Trois-Rivières Guelph Moncton Brantford Saint John Thunder Bay Peterborough Daily Fuel Used per Capita Source of fuel data: The Kent Group Ltd., annual retail diesel fuel sales. 88 April 2016
106 6. PUBLIC TRANSIT 6.1 TRANSIT DEMAND ANNUAL TRANSIT RIDERSHIP Data on annual transit ridership are collected by the Canadian Urban Transit Association (CUTA) from its members. These provide a uniform, cross-canada assessment of transit demand. For the UTI5, CUTA provided the ridership figures for its member transit authorities, covering 31 CMAs. Data for the transit authorities of the other two CMAs Saguenay and Trois-Rivières - were provided by the Ministère des Transports du Québec. The data were then aggregated by CMA. Note that GO Transit ridership (bus and rail services in the Greater Toronto and Hamilton Area) was included, and was apportioned to each CMA according to trip origin and destination data from recent GO Transit surveys. Note also that for some CMAs the data reflect the sum of two or more transit authorities, and that the data did not allow the identification of possible duplications among transit systems. Exhibit 6-1 summarizes the annual transit ridership for the CMAs, from 1996 to. Almost all CMAs have gained in ridership, in some cases continuing longstanding trends. The gains are particularly strong for the five-year period from to for Oshawa (110%, including GO), Kelowna (54%), Moncton (49%), Abbotsford-Mission (47%), Kitchener-Cambridge-Waterloo (45%), and Vancouver and Edmonton (40%). Of the three CMAs that lost ridership, note that reductions in St. John s and Halifax might reflect lengthy transit strikes during the reporting period, and reductions in Regina reflect the introduction of a new system of counting passengers. The percentage changes over time are summarized in Exhibit PER CAPITA RIDERSHIP Exhibit 6-3 shows annual transit ridership per capita from 1996 to, and Exhibit 6-4 presents the percentage changes over each five-year interval. Montréal continues to have the highest per-capita ridership, at 143 rides per person per year, with Toronto just behind at 136 rides per person per year and Ottawa-Gatineau at 116 rides per person per year. Almost all the CMAs recorded increases in their per capita rates. Oshawa recorded the highest percentage change between and, at 98% (again, including GO), followed by Edmonton (45%), Kelowna (42%), Abbotsford-Mission (40%), Kitchener-Cambridge-Waterloo (38%), Windsor (36%), Moncton (35%) and Thunder Bay (30%) COMMUTE TRANSIT SHARES Exhibit 6-5 presents the NHS journey-to-work transit shares for the all-important home-to-work commute, for 1996 to. Exhibit 6-6 shows the percentage changes for each five-year interval. Toronto and Montréal have the highest transit share in, at 24% and 23%, respectively, followed by Vancouver at 21% and Ottawa-Gatineau at 20%. Kelowna and Peterborough showed the highest proportional increases from to, at 41% and 40%, respectively. Other CMAs with high percentage growth were Vancouver, Saskatoon and Kingston at 25%, Edmonton (24%) and St. Catharines Niagara (22%). April
107 Exhibit 6-1. Annual Transit Ridership, Group D Group C Group B Group A Toronto Montréal Vancouver Ottawa-Gatineau Calgary Edmonton Québec Winnipeg Hamilton Kitchener - Cambridge - Waterloo London St. Catharines - Niagara Halifax Oshawa Victoria Windsor Saskatoon Regina Sherbrooke St. John's Barrie Kelowna Abbotsford Greater Sudbury Kingston Saguenay Trois-Rivières Guelph Moncton Brantford Saint John Thunder Bay Peterborough Millions Annual Transit Riders Source: Canadian Urban Transit Association, except for Saguenay and Trois-Rivières for which the Ministère des Transports du Québec provided the data. Oshawa is based on Durham Region Transit data and a share of GO Transit data. Note that Barrie, Brantford, Guelph, Kelowna, Moncton and Peterborough were not CMAs in 1996 and. 90 April 2016


108 Exhibit 6-2. Percent Change in Annual Ridership, Group D Group C Group B Group A Toronto Montréal Vancouver Ottawa-Gatineau Calgary Edmonton Québec Winnipeg Hamilton Kitchener - Cambridge - Waterloo London St. Catharines - Niagara Halifax Oshawa Victoria Windsor Saskatoon Regina Sherbrooke St. John's Barrie Kelowna Abbotsford Greater Sudbury Kingston Saguenay Trois-Rivières Guelph Moncton Brantford Saint John Thunder Bay Peterborough % Change from previous survey year Note that Barrie, Brantford, Guelph, Kelowna, Moncton and Peterborough were not CMAs in 1996 and. April
109 Exhibit 6-3. Annual Transit Rides per Capita, Group D Group C Group B Group A Toronto Montréal Vancouver Ottawa-Gatineau Calgary Edmonton Québec Winnipeg Hamilton Kitchener - Cambridge - Waterloo London St. Catharines - Niagara Halifax Oshawa Victoria Windsor Saskatoon Regina Sherbrooke St. John's Barrie Kelowna Abbotsford - Mission Greater Sudbury / Grand Sudbury Kingston Saguenay Trois-Rivières Guelph Moncton Brantford Saint John Thunder Bay Peterborough Annual Transit Riders per Capita Source: Canadian Urban Transit Association, except for Saguenay and Trois-Rivières for which the Ministère des Transports du Québec provided the data. Oshawa is based on Durham Region Transit data and a share of GO Transit data. Note that Barrie, Brantford, Guelph, Kelowna, Moncton and Peterborough were not CMAs in 1996 and. 92 April 2016


110 Exhibit 6-4. Percent Change in Annual Transit Rides per Capita, Group D Group C Group B Group A Toronto Montréal Vancouver Ottawa-Gatineau Calgary Edmonton Québec Winnipeg Hamilton Kitchener - Cambridge - Waterloo London St. Catharines - Niagara Halifax Oshawa Victoria Windsor Saskatoon Regina Sherbrooke St. John's Barrie Kelowna Abbotsford - Mission Greater Sudbury / Grand Sudbury Kingston Saguenay Trois-Rivières Guelph Moncton Brantford Saint John Thunder Bay Peterborough -60% -40% -20% 0% 20% 40% 60% 80% 100% 120% % Change from previous year Note that Barrie, Brantford, Guelph, Kelowna, Moncton and Peterborough were not CMAs in 1996 and. April
111 Exhibit 6-5. CMA Journey-to-Work Transit Mode Shares, Group D Group C Group B Group A Toronto Montréal Vancouver Ottawa-Gatineau Calgary Edmonton Québec Winnipeg Hamilton Kitchener - Cambridge - Waterloo London St. Catharines - Niagara Halifax Oshawa Victoria Windsor Saskatoon Regina Sherbrooke St. John's Barrie Kelowna Abbotsford - Mission Greater Sudbury / Grand Sudbury Kingston Saguenay Trois-Rivières Guelph Moncton Brantford Saint John Thunder Bay Peterborough 0% 5% 10% 15% 20% 25% Mode Share Source: Statistics Canada. 94 April 2016


112 Exhibit 6-6. Percent Changes, CMA Journey-to-Work Transit Mode Shares, Group D Group C Group B Group A Toronto Montréal Vancouver Ottawa-Gatineau Calgary Edmonton Québec Winnipeg Hamilton Kitchener - Cambridge - Waterloo London St. Catharines - Niagara Halifax Oshawa Victoria Windsor Saskatoon Regina Sherbrooke St. John's Barrie Kelowna Abbotsford - Mission Greater Sudbury / Grand Sudbury Kingston Saguenay Trois-Rivières Guelph Moncton Brantford Saint John Thunder Bay Peterborough -60% -40% -20% 0% 20% 40% 60% % Change from previous survey year April
113 6.2 TRANSIT SUPPLY The availability of transit service the supply of transit - is an important indicator of an urban area s commitment to transit. The UTI5 marks a change in the measurement of transit supply: previous UTI surveys asked CMA respondents to report transit seat-kilometres, which were then measured per capita. Although this is a meaningful measure, it proved difficult for many CMAs to provide. As an alternative, CUTA provided two readily available indicators of supply, using data that it collects from its members. These are revenue-vehicle-kilometres and revenue-vehicle-hours. The term revenue refers to the use of transit vehicles in actual service for paying (revenue) customers; that is, as opposed to maintenance, etc. Both indicators measure the level of service provided by transit authorities, using terms that are meaningful to the industry. They account for both the spatial and temporal supply of transit. The basis in vehicles is perhaps less precise than the basis in seats; however, both vehiclebased indicators use terms that are meaningful to the industry and are easier to obtain. Data for the three non-member CMAs were secured directly from the relevant authority. Exhibit 6-7 summarizes annual revenue-vehicle-kilometres per capita for. Toronto offers the highest per-capita supply, at 61.1 revenue-vehicle-kilometres per capita, followed by Montréal at 54.9 and Vancouver at 53.7 revenue-vehicle-kilometres per capita. Victoria and Ottawa-Gatineau offer the next highest service levels, at 48.8 and 48.5 revenue-vehicle-kilometres per capita, respectively. Exhibit 6-8 tabulates annual revenue-vehicle-hours per capita for. Toronto again offers the highest temporal coverage, at 2.74 revenue-vehicle-hours per capita, followed by Victoria at 2.31, Ottawa- Gatineau at 2.23, Vancouver at 2.17 and Montréal at 2.02 revenues-vehicle-hours per capita. 96 April 2016
114 Exhibit 6-7. Annual Revenue-Vehicle-Kilometres per Capita, Group D Group C Group B Group A Toronto Montréal Vancouver Ottawa-Gatineau Calgary Edmonton Québec Winnipeg Hamilton Kitchener - Cambridge - Waterloo London St. Catharines - Niagara Halifax Oshawa Victoria Windsor Saskatoon Regina Sherbrooke St. John's Barrie Kelowna Abbotsford - Mission Greater Sudbury / Grand Sudbury Kingston Saguenay Trois-Rivières Guelph Moncton Brantford Saint John Thunder Bay Peterborough Revenue Vehicle Kms per Capita Source: Canadian Urban Transit Association, except for Saguenay and Trois-Rivières, for which the Ministère des Transports du Québec provided the data. April

115 Exhibit 6-8. Annual Revenue-Vehicle-Hours per Capita, Group D Group C Group B Group A Toronto Montréal Vancouver Ottawa-Gatineau Calgary Edmonton Québec Winnipeg Hamilton Kitchener - Cambridge - Waterloo London St. Catharines - Niagara Halifax Oshawa Victoria Windsor Saskatoon Regina Sherbrooke St. John's Barrie Kelowna Abbotsford - Mission Greater Sudbury / Grand Sudbury Kingston Saguenay Trois-Rivières Guelph Moncton Brantford Saint John Thunder Bay Peterborough Revenue Vehicle Hours per Capita Source: Canadian Urban Transit Association, except for Saguenay and Trois-Rivières, for which the Ministère des Transports du Québec provided the data. 98 April 2016
, rapid rail (subway or advanced guideway transit), and commuter rail.")
116 Exhibit 6-9 and Exhibit 6-10 present the supply of higher-order transit, broken out by three technologies / modes: Transitway (bus rapid transit or light rail transit, operating on exclusive rights of way or on nonexclusive rights of way, such as reserved bus lanes), rapid rail (subway or advanced guideway transit), and commuter rail. Exhibit 6-9 shows the total kilometres for each type of facility. Exhibit 6-9. Supply of Higher-Order Transit, Total Kilometres by Facility Type Group D Group C Group B Group A Transitway/right of way (km) Metro/subway/advanced guideway transit (km) Commuter Rail (km) Toronto Toronto (CSD) Mississauga (CSD) Brampton (CSD) Montréal Montréal (CD) Laval (CD) Longueuil (CD) Vancouver Vancouver (CSD) Surrey (CSD) Burnaby (CSD) Ottawa - Gatineau Ottawa (CSD) Gatineau (CSD) Calgary Edmonton Québec Winnipeg Kitchener - Cambridge - Waterloo London Oshawa Windsor St. John's Barrie Kelowna Greater Sudbury / Grand Sudbury Saguenay Moncton Saint John Total Kms It can be seen that a range of facility types exists in several urban areas: the Toronto and Montréal CMAs have all three types, the Vancouver CMA has advanced guideway transit and commuter rail, and, April

117 in Ottawa-Gatineau, the City of Ottawa has bus rapid transit and advanced guideway transit and the City of Gatineau has reserved bus lanes. 22 Exhibit 6-10 expresses the supply of the three facility types in terms of kilometres per 100,000 capita. 23 Exhibit Supply of Higher-Order Transit, Kilometres per 100,000 Capita Transitway/right of way (km) Metro/subway/advanced guideway transit (km) Commuter Rail (km) Group D Group C Group B Group A Toronto Toronto (CSD) Mississauga (CSD) Brampton (CSD) Montréal Montréal (CD) Laval (CD) Longueuil (CD) Vancouver Vancouver (CSD) Surrey (CSD) Burnaby (CSD) Ottawa - Gatineau Ottawa (CSD) Gatineau (CSD) Calgary Edmonton Québec Winnipeg Kitchener - Cambridge - Waterloo London Oshawa Windsor St. John's Barrie Kelowna Greater Sudbury / Grand Sudbury Saguenay Moncton Saint John Total Kms per 100,000 capita The City of Gatineau has the highest rate of transitway (i.e., reserved bus lanes), at 13.9 kilometres per 100,000 capita (the highest rate of any type of facility), followed by Longueuil at 9.8 kilometres per Gatineau s Rapibus BRT opened in 2013, and so it is not included in these tabulations. The values are too small if presented in terms of per capita. 100 April 2016
118 100,000 capita, Kelowna at 9.7 kilometres per 100,000 capita and Québec at 8.0 kilometres per 100,000 capita. The City of Burnaby has the highest rate of advanced guideway, at 7.6 kilometres per 100,000 capita, followed by the City of Calgary at 4.3 kilometres per 100,000 capita. Finally, the Montréal CMA has the highest rate of commuter rail, at 6.3 kilometres per 1000,000 capita, with the City of Montréal having a rate of 5.2 kilometres per 100,000 capita, followed by the City of Toronto at 4.9 kilometres per 1000,000 capita. 6.3 PARK-AND-RIDE Many urban areas have established park-and-ride lots in order to attract drivers, who otherwise would use their vehicle for the entire trip, at strategically located intercept points close to their homes. Thus, an expansion of this incentive parking is one way to encourage transit ridership to increase as an urban area grows. Exhibit 6-11 shows the evolution of park-and-ride spaces per 1,000 capita in the EUA since Note that the and earlier rates were estimated according to the EUA boundaries, whereas the EUA boundaries were used for. It can be seen that the per capita park-and-ride supply rate has kept increased with growth in most reporting CMAs, with significant growth reported in Oshawa and Edmonton. In Calgary, the number of park-and-ride spaces increased, although at a rate less than that of the population. April
 Group D")
 Gatineau (CSD) Calgary Edmonton Québec Winnipeg")

119 Exhibit Park-and-Ride Spaces per 1,000 Capita, Toronto Toronto (CSD) Group D Group C Group B Group A Montréal Montréal (CD) Vancouver Surrey (CSD) Burnaby (CSD) Ottawa - Gatineau Ottawa (CSD) Gatineau (CSD) Calgary Edmonton Québec Winnipeg Kitchener - Cambridge - Waterloo Oshawa Windsor Sherbrooke St. John's Kelowna Abbotsford - Mission Greater Sudbury / Grand Sudbury Saguenay Trois-Rivières Moncton Park and Ride spaces per 1,000 capita 102 April 2016
120 7. ACTIVE TRANSPORTATION 7.1 WALKING AND CYCLING DEMAND The commute to work is an important indication of active transportation (cycling and walking). Exhibit 7-1 shows the evolution of the cycling share of the NHS journey-to-work, from to, with the absolute five-year changes shown in Exhibit 7-2. It can be seen that Victoria continues to have the highest share, at 6.2% of all commute trips, followed by Kelowna at 2.9%, Ottawa-Gatineau at 2.2%, Kingston and Saskatoon at 2.1% and Winnipeg at 2.0%. Kelowna had the biggest gain between and, at 0.8%, followed by Victoria at 0.6%. The three largest CMAs all showed an increased cycling share, with shares at 1.1% in Toronto, 1.7% in Montréal and 1.9% in Vancouver. However, just over half the CMA showed either no change or reductions in the cycling share, with Guelph (-0.9% reduction in absolute share) and Peterborough (-0.7%) changing the most. Exhibit 7-3 shows the evolution of the walking share of the NHS journey-to-work from to. Generally, the walk share is higher than the cycling share. It can be seen that Victoria (10.6%), Kingston (8.8%), Halifax (8.7%) and Peterborough (7.0%) have the highest walk shares. Abbotsford-Mission has the lowest share, at 3.3%, followed by Windsor at 3.7% and Saguenay and Edmonton at 4.4%. Overall, the walk share declined in 24 CMAs. As shown in Exhibit 7-4, the greatest absolute reductions were in Moncton (-1.7%) and Halifax (-1.4%). On the other hand, Oshawa s absolute share increased by 1.3%, Barrie s share by 0.9% and Vancouver s share by 0.5%. 24 How has active transportation overall fared? Exhibit 7-5 shows the evolution of the combined shares of walking and cycling. It can be seen that Victoria has the highest share, at 16.8%, followed by Kingston (10.9%), Halifax (9.9%), and Vancouver, Ottawa-Gatineau and Peterborough (8.7%). Since, the active transportation shares have grown only in seven CMAs: Victoria, Vancouver, Kelowna, St. Catharines-Niagara, Barrie, Oshawa and Abbotsford-Mission (which, at 4.3%, has the lowest active transportation share among all CMAs). Among the Group A and Group B urban areas, the combined active transportation share ranges from 5.6% in Edmonton and 5.7% in Toronto to Vancouver and Ottawa-Gatineau s 8.7% shares. 24 Note that these differences reflect absolute changes in shares, and not the proportional changes. For example, Oshawa s walk share increased from 3.4% in to 4.7% in, for an absolute increase of 1.3%. April

121 Exhibit 7-1. CMA Journey-to-Work Cycling Mode Shares, - Group D Group C Group B Group A Toronto Montréal Vancouver Ottawa-Gatineau Calgary Edmonton Québec Winnipeg Hamilton Kitchener - Cambridge - Waterloo London St. Catharines - Niagara Halifax Oshawa Victoria Windsor Saskatoon Regina Sherbrooke St. John's Barrie Kelowna Abbotsford - Mission Greater Sudbury / Grand Sudbury Kingston Saguenay Trois-Rivières Guelph Moncton Brantford Saint John Thunder Bay Peterborough 0.0% 1.0% 2.0% 3.0% 4.0% 5.0% 6.0% 7.0% Proportion of Work Trips by Bike 104 April 2016


122 Exhibit 7-2. CMA Journey-to-Work Cycling Mode Shares, Five-Year Changes to Group D Group C Group B Group A Toronto Montréal Vancouver Ottawa-Gatineau Calgary Edmonton Québec Winnipeg Hamilton Kitchener - Cambridge - Waterloo London St. Catharines - Niagara Halifax Oshawa Victoria Windsor Saskatoon Regina Sherbrooke St. John's Barrie Kelowna Abbotsford - Mission Greater Sudbury / Grand Sudbury Kingston Saguenay Trois-Rivières Guelph Moncton Brantford Saint John Thunder Bay Peterborough -60% -40% -20% 0% 20% 40% 60% 80% 100% 120% % Change in shares from previous survey year April

123 Exhibit 7-3. CMA Journey-to-Work Walking Mode Shares, - Group D Group C Group B Group A Toronto Montréal Vancouver Ottawa-Gatineau Calgary Edmonton Québec Winnipeg Hamilton Kitchener - Cambridge - Waterloo London St. Catharines - Niagara Halifax Oshawa Victoria Windsor Saskatoon Regina Sherbrooke St. John's Barrie Kelowna Abbotsford - Mission Greater Sudbury / Grand Sudbury Kingston Saguenay Trois-Rivières Guelph Moncton Brantford Saint John Thunder Bay Peterborough 0.0% 2.0% 4.0% 6.0% 8.0% 10.0% 12.0% Proportion of Work Trips by Foot 106 April 2016


124 Exhibit 7-4. CMA Journey-to-Work Walking Mode Shares, Five-Year Changes to Group D Group C Group B Group A Toronto Montréal Vancouver Ottawa-Gatineau Calgary Edmonton Québec Winnipeg Hamilton Kitchener - Cambridge - Waterloo London St. Catharines - Niagara Halifax Oshawa Victoria Windsor Saskatoon Regina Sherbrooke St. John's Barrie Kelowna Abbotsford - Mission Greater Sudbury / Grand Sudbury Kingston Saguenay Trois-Rivières Guelph Moncton Brantford Saint John Thunder Bay Peterborough -30% -20% -10% 0% 10% 20% 30% 40% 50% % Change in shares from previous survey year April
125 Exhibit 7-5. CMA Journey-to-Work Active Transportation Mode Shares, - Group D Group C Group B Group A Toronto Montréal Vancouver Ottawa-Gatineau Calgary Edmonton Québec Winnipeg Hamilton Kitchener - Cambridge - Waterloo London St. Catharines - Niagara Halifax Oshawa Victoria Windsor Saskatoon Regina Sherbrooke St. John's Barrie Kelowna Abbotsford - Mission Greater Sudbury / Grand Sudbury Kingston Saguenay Trois-Rivières Guelph Moncton Brantford Saint John Thunder Bay Peterborough 0.0% 2.0% 4.0% 6.0% 8.0% 10.0% 12.0% 14.0% 16.0% 18.0% Proportion of Work Trips by Active Transportation 108 April 2016
126 7.2 CYCLING SUPPLY Exhibit 7-6 shows how total EUA bikeway kilometres have changed between and. The exhibit combines dedicated on-street lanes, marked on-street lanes and marked off-street facilities. Increases can be seen for all CMAs that reported values in, and this was true for CMAs of all sizes. The greatest increases were recorded in Vancouver, whose bikeway supply doubled from 1,757 km in to 3,535 km in. The bikeway supply doubled in Windsor, Saskatoon and Kelowna, more than tripled in Winnipeg, London and Guelph, and more than quadrupled in Moncton. Exhibit 7-7 compares on-street bikeway kilometres with road lane kilometres, both measured per capita. This compares the expansion rate of the on-street bikeway network (i.e., facilities that are included in the road cross-section) against that of the actual road network. Exhibit 7-8 shows the five-year rates of change: It can be seen that the on-street bikeway system expanded faster than the road network in several CMAs, of all sizes. Notable were Vancouver, Hamilton, Victoria, Windsor (at more than twice the rate), Kelowna (three times the rate), Trois-Rivières and Guelph (more than twice the rate). In some CMAs, such as Calgary, the bikeway expansion rate slowed, although the total bikeway kilometres increased (see Exhibit 7-6). Exhibit 7-9 compares off-street bikeway path-km with EUA urbanized area, measured in square kilometres. This tracks the extent of the off-street bikeway path network as the urban area expands. Exhibit 7-10 shows the five-year rates of change. It can be seen that several CMAs extended their bikeway network as the urban area grew: Winnipeg, London, Windsor, Saskatoon, Trois-Rivières, Guelph and Moncton all had significantly greater rates compared with. Vancouver, Calgary, Edmonton, Hamilton, Oshawa and Victoria also grew, albeit at smaller rates. April
 Mississauga (CSD) Brampton (CSD) Montréal Montréal (CD) Laval (CD) Longueuil (CD) Vancouver Vancouver (CSD)")
127 Exhibit 7-6. Total EUA Bikeway Kilometres, - Group D Group C Group B Group A Toronto Toronto (CSD) Mississauga (CSD) Brampton (CSD) Montréal Montréal (CD) Laval (CD) Longueuil (CD) Vancouver Vancouver (CSD) Surrey (CSD) Burnaby (CSD) Ottawa - Gatineau Ottawa (CSD) Gatineau (CSD) Calgary Edmonton Québec Winnipeg Hamilton Kitchener - Cambridge - Waterloo London St. Catharines - Niagara Halifax Oshawa Victoria Windsor Saskatoon Regina Sherbrooke St. John's Barrie Kelowna Abbotsford - Mission Greater Sudbury / Grand Sudbury Kingston Saguenay Trois-Rivières Guelph Moncton Brantford Saint John Thunder Bay Peterborough Bikeway km 110 April 2016
 Mississauga (CSD) Brampton (CSD) Montréal Montréal (CD) Laval (CD)")

128 Exhibit 7-7. EUA Route-Km of On-Street Bikeways per Roadway Lane-Km, - Group D Group C Group B Group A Toronto Toronto (CSD) Mississauga (CSD) Brampton (CSD) Montréal Montréal (CD) Laval (CD) Longueuil (CD) Vancouver Vancouver (CSD) Surrey (CSD) Burnaby (CSD) Ottawa - Gatineau Ottawa (CSD) Gatineau (CSD) Calgary Edmonton Québec Winnipeg Hamilton Kitchener - Cambridge - Waterloo London St. Catharines - Niagara Halifax Oshawa Victoria Windsor Saskatoon Regina Sherbrooke St. John's Barrie Kelowna Abbotsford - Mission Greater Sudbury / Grand Sudbury Kingston Saguenay Trois-Rivières Guelph Moncton Brantford Saint John Thunder Bay Peterborough On-Street Bikeways per Roadway Lane-Km April
 Mississauga (CSD) Brampton (CSD) Montréal Montréal (CD) Laval (CD) Longueuil (CD)")
129 Exhibit 7-8. EUA Route-Km of On-Street Bikeways per Roadway Lane-Km, Changes Group D Group C Group B Group A Toronto Toronto (CSD) Mississauga (CSD) Brampton (CSD) Montréal Montréal (CD) Laval (CD) Longueuil (CD) Vancouver Vancouver (CSD) Surrey (CSD) Burnaby (CSD) Ottawa - Gatineau Ottawa (CSD) Gatineau (CSD) Calgary Edmonton Québec Winnipeg Hamilton Kitchener - Cambridge - Waterloo London St. Catharines - Niagara Halifax Oshawa Victoria Windsor Saskatoon Regina Sherbrooke St. John's Barrie Kelowna Abbotsford - Mission Greater Sudbury / Grand Sudbury Kingston Saguenay Trois-Rivières Guelph Moncton Brantford Saint John Thunder Bay Peterborough -100% 0% 100% 200% 300% 400% 500% % Change from previous survey year 112 April 2016
")
 Ottawa - Gatineau Ottawa (CSD) Gatineau (CSD) Calgary Edmonton Québec Winnipeg Hamilton Kitchener -")

130 Exhibit 7-9. EUA Off-Street Bikeway Path-Km per Km 2 Urbanized Area, - Group D Group C Group B Group A Toronto Toronto (CSD) Mississauga (CSD) Brampton (CSD) Montréal Montréal (CD) Laval (CD) Longueuil (CD) Vancouver Vancouver (CSD) Surrey (CSD) Burnaby (CSD) Ottawa - Gatineau Ottawa (CSD) Gatineau (CSD) Calgary Edmonton Québec Winnipeg Hamilton Kitchener - Cambridge - Waterloo London St. Catharines - Niagara Halifax Oshawa Victoria Windsor Saskatoon Regina Sherbrooke St. John's Barrie Kelowna Abbotsford - Mission Greater Sudbury / Grand Sudbury Kingston Saguenay Trois-Rivières Guelph Moncton Brantford Saint John Thunder Bay Peterborough EUA Off-Street Bikeway Path-Km per Km 2 Urbanized Area April
 Mississauga (CSD) Brampton (CSD) Montréal Montréal (CD) Laval (CD)")

131 Exhibit EUA Off-Street Bikeway Path-Km per Km 2 Urbanized Area, Changes Group D Group C Group B Group A Toronto Toronto (CSD) Mississauga (CSD) Brampton (CSD) Montréal Montréal (CD) Laval (CD) Longueuil (CD) Vancouver Vancouver (CSD) Surrey (CSD) Burnaby (CSD) Ottawa - Gatineau Ottawa (CSD) Gatineau (CSD) Calgary Edmonton Québec Winnipeg Hamilton Kitchener - Cambridge - Waterloo London St. Catharines - Niagara Halifax Oshawa Victoria Windsor Saskatoon Regina Sherbrooke St. John's Barrie Kelowna Abbotsford - Mission Greater Sudbury / Grand Sudbury Kingston Saguenay Trois-Rivières Guelph Moncton Brantford Saint John Thunder Bay Peterborough -150%-100% -50% 0% 50% 100% 150% 200% 250% 300% 350% % Change from previous survey year 114 April 2016

132 7.3 WALKING SUPPLY New to UTI5, a measure of the walking supply was introduced, paralleling the existing cycling measures. The new measure tabulates the EUA kilometres of sidewalks per capita. This is an indication of the pedestrian-friendliness of an urban area measuring, among other things, how accessible a road corridor is to pedestrians, or whether a safe, defined walking path actually exists alongside a road. Going forward, the measure can show the extent to which existing roads are retrofitted or whether new suburbs are supplied with sidewalks. Exhibit 7-11 shows that the per capita rate varies among the reporting CMAs, with the highest rates recorded in Vancouver, Guelph, Kitchener-Cambridge-Waterloo and Edmonton. Exhibit EUA Kilometres of Sidewalks per Capita, Group D Group C Group B Group A Toronto Toronto (CSD) Mississauga (CSD) Brampton (CSD) Montréal (CD) Vancouver Vancouver (CSD) Surrey (CSD) Burnaby (CSD) Ottawa - Gatineau Ottawa (CSD) Gatineau (CSD) Calgary Edmonton Winnipeg Hamilton Kitchener - Cambridge - Waterloo London Oshawa Windsor St. John's Kelowna Abbotsford - Mission Greater Sudbury / Grand Sudbury Trois-Rivières Guelph Moncton Saint John EUA Kilometres of Sidewalks per Capita, April
133 116 April 2016
134 8. ROADS AND MOTOR VEHICLE USE The private vehicle remains the dominant mode of personal transportation in urban Canada, as is the case in urban regions in other advanced economies. This chapter considers both the supply of the road system and its usage. 8.1 ROAD SUPPLY Exhibit 8-1 shows the evolution of EUA road lane-kilometres per 1,000 capita from to. The exhibit profiles the extent to which the expansion of the road network is keeping pace with urban population growth. It can be seen that this is true of most of the reporting CMAs reversing a trend that was observed in the previous UTI. Factors that influenced the earlier decline were the desire to avoid urban disruption, environmental concerns and high costs. The earlier decline is still in some CMAs: Calgary, Edmonton, London, Oshawa, Kelowna, Guelph and especially Kitchener-Cambridge-Waterloo have not grown as fast as their populations. Exhibit 8-2 breaks down the road lane-kilometres per capita rate by facility type. It can be seen that local roads dominate each of the reporting communities, followed by arterial roads. Of interest, eight CMAs report the existence of High Occupancy Vehicle (HOV) lanes, which promote multi-occupant vehicle trips as a means of avoiding delays on congested facilities (mainly expressways). The rates vary from 0.01 HOV lane-kilometres per capita in Saguenay to 0.17 HOV lane-kilometres per capita in Ottawa-Gatineau, with the City of Ottawa reporting the highest overall rate, at 0.18 HOV lane-kilometres per capita. 8.2 PARKING SUPPLY The availability of parking at the workplace and other destinations outside the home is an important factor in mode choice. This is especially true of the CBD, which tends to be the focus of the transit system and where alternatives to driving tend to be most readily available. Exhibit 8-3 presents the supply of on- and off-street parking spaces in the CBD, measured against the number of CBD jobs. The exhibit refers to spaces that are available to the public, meaning that the actual supply is inevitably understated. It can be seen that the availability varies significantly among the reporting CMAs, with Vancouver recording the lowest rate, at 0.02 parking spaces per CBD job, followed by Edmonton and Winnipeg at 0.09 and Moncton at 0.10 parking spaces per CBD job. Kitchener- Cambridge-Waterloo recorded the highest rate, of 0.65 parking spaces per CBD job, followed by London at 0.40 parking spaces per CBD job. Interestingly, the on-street supply significantly exceeds the off-street supply in Saskatoon and St. John s: the reverse is true in most other CMAs. The cost of parking also is an important factor in mode choice. Exhibit 8-4 and Exhibit 8-5 show the maximum hourly and monthly CBD parking costs for the reporting CMAs. Again, a range is reported, with the highest hourly cost being $6 in Vancouver and Hamilton, Greater Sudbury / Grand Sudbury and Trois-Rivières reporting the lowest costs, at $1 per hour. On a monthly basis, Edmonton reports the highest cost, at $400 per month, followed by Saskatoon, at $300 per month. The lowest monthly costs were recorded at $70 in Trois-Rivières, $85 in Barrie, $87 in Oshawa and $93 in Guelph. April
 Mississauga (CSD) Brampton (CSD) Montréal Montréal (CD) Laval (CD)")

135 Exhibit 8-1. EUA Road-Lane-Kilometres per 1,000 Residents, - Group D Group C Group B Group A Toronto Toronto (CSD) Mississauga (CSD) Brampton (CSD) Montréal Montréal (CD) Laval (CD) Longueuil (CD) Vancouver Vancouver (CSD) Surrey (CSD) Burnaby (CSD) Ottawa-Gatineau Ottawa (CSD) Gatineau (CSD) Calgary Edmonton Québec Winnipeg Hamilton Kitchener - Cambridge - Waterloo London St. Catharines - Niagara Halifax Oshawa Victoria Windsor Saskatoon Regina Sherbrooke St. John's Barrie Kelowna Abbotsford - Mission Greater Sudbury / Grand Sudbury Kingston Saguenay Trois-Rivières Guelph Moncton Brantford Saint John Thunder Bay Peterborough Road lane km per 1,000 capita 118 April 2016

 Brampton (CSD) Montréal Montréal (CD) Laval (CD) Longueuil (CD) Vancouver")


136 Exhibit 8-2. EUA Road-Lane-Kilometres per 1,000 Residents by Facility Type, Local Roads Collector Roads Arterial Roads Highways HOV Lanes Group D Group C Group B Group A Toronto Toronto (CSD) Mississauga (CSD) Brampton (CSD) Montréal Montréal (CD) Laval (CD) Longueuil (CD) Vancouver Vancouver (CSD) Surrey (CSD) Burnaby (CSD) Ottawa - Gatineau Ottawa (CSD) Gatineau (CSD) Calgary Edmonton Québec Winnipeg Hamilton Kitchener - Cambridge - Waterloo London St. Catharines - Niagara Halifax Oshawa Victoria Windsor Saskatoon Regina Sherbrooke St. John's Barrie Kelowna Abbotsford - Mission Greater Sudbury / Grand Sudbury Kingston Saguenay Trois-Rivières Guelph Moncton Brantford Saint John Thunder Bay Peterborough Road lane km per 1000 capita April
 On Street Parking Spaces per CBD Employee (jobs) Off Street Parking Spaces per CBD Employee")


137 Exhibit 8-3. Parking Supply per Job in the CBD, (Public Parking Spaces) On Street Parking Spaces per CBD Employee (jobs) Off Street Parking Spaces per CBD Employee (jobs) Group A Group D Group C Group B Montréal Vancouver Ottawa - Gatineau Calgary Edmonton Winnipeg Hamilton Kitchener - Cambridge - Waterloo London Halifax Oshawa Windsor Saskatoon St. John's Kelowna Greater Sudbury / Grand Sudbury Trois-Rivières Guelph Moncton Parking Supply per Job in the CBD Exhibit 8-4. Maximum Hourly Cost, On-Street Parking in the CBD, Group A Group D Group C Group B Montréal Vancouver Ottawa - Gatineau Edmonton Winnipeg Hamilton Kitchener - Cambridge - Waterloo London Halifax Oshawa Windsor Saskatoon St. John's Barrie Kelowna Greater Sudbury / Grand Sudbury Trois-Rivières Guelph Moncton Maximum Hourly Cost, On-Street Parking in the CBD 120 April 2016

138 Exhibit 8-5. Maximum Monthly Permit Cost, Off-Street Parking in the CBD, Group D Group C Group B Ottawa - Gatineau Edmonton Winnipeg Hamilton Kitchener - Cambridge - Waterloo London Halifax Oshawa Windsor Saskatoon St. John's Barrie Kelowna Greater Sudbury / Grand Sudbury Trois-Rivières Guelph Moncton Maximum Monthly Permit Cost, Off-Street Parking in the CBD 8.3 MOTOR VEHICLE OWNERSHIP It is well established that vehicle ownership is a key indicator both of mode choice, meaning that travellers will tend to use their automobiles, even if other modes are available; and of activity generally, meaning that some urban areas have recorded increasing trip rates with higher rates of household vehicle availability. Statistics Canada collects data on motor vehicle registrations from each provincial and territorial registry. Statistics Canada reports these data by CSD and CD, and so it is possible to approximate the vehicle registrations for each EUA. 25 These data are categorized by vehicle type: of interest are light duty vehicles having a gross vehicle weight less than 4,500 kg. These include passenger vehicles, light trucks and vans. There is no way to distinguish between personal and commercial uses of the vehicles; however, the data are considered to be a reasonable proxy and, in any event, the only comprehensive source for personal vehicles. Exhibit 8-6 shows the rate of EUA light-duty vehicle ownership (registrations) per capita, from to. Exhibit 8-7 shows the five-year changes. For the UTI5, note that data were available only for 2009, and the registrations were extrapolated by combining the observed growth rates in the respective provincial registrations with the individual population growth rates for each EUA. (For the purpose of this analysis, it was reasonably assumed that the vehicle population grew uniformly within each province.) 25 The method used to approximate the EUA motor vehicle registrations for the UTI5 was developed in previous UTIs. April
 Mississauga (CSD) Brampton")
 Gatineau (CSD) Calgary Edmonton Québec Winnipeg Hamilton Kitchener - Cambridge - Waterloo")

139 Exhibit 8-6. EUA Light-Duty Vehicles per Capita, - Group D Group C Group B Group A Toronto Toronto (CSD) Mississauga (CSD) Brampton (CSD) Montréal Montréal (CD) Laval (CD) Longueuil (CD) Vancouver Vancouver (CSD) Surrey (CSD) Burnaby (CSD) Ottawa-Gatineau Ottawa (CSD) Gatineau (CSD) Calgary Edmonton Québec Winnipeg Hamilton Kitchener - Cambridge - Waterloo London St. Catharines - Niagara Halifax Oshawa Victoria Windsor Saskatoon Regina Sherbrooke St. John's Barrie Kelowna Abbotsford - Mission Greater Sudbury / Grand Sudbury Kingston Saguenay Trois-Rivières Guelph Moncton Brantford Saint John Thunder Bay Peterborough Light duty vehicle per capita 122 April 2016
 Mississauga (CSD) Brampton (CSD) Montréal Montréal (CD) Laval (CD)")

140 Exhibit 8-7. EUA Light-Duty Vehicles per Capita, Five-Year Changes to Group D Group C Group B Group A Toronto Toronto (CSD) Mississauga (CSD) Brampton (CSD) Montréal Montréal (CD) Laval (CD) Longueuil (CD) Vancouver Vancouver (CSD) Surrey (CSD) Burnaby (CSD) Ottawa-Gatineau Ottawa (CSD) Gatineau (CSD) Calgary Edmonton Québec Winnipeg Hamilton Kitchener - Cambridge - Waterloo London St. Catharines - Niagara Halifax Oshawa Victoria Windsor Saskatoon Regina Sherbrooke St. John's Barrie Kelowna Abbotsford - Mission Greater Sudbury / Grand Sudbury Kingston Saguenay Trois-Rivières Guelph Moncton Brantford Saint John Thunder Bay Peterborough -20% -15% -10% -5% 0% 5% 10% 15% 20% 25% 30% % Change from previous year April
141 The two exhibits show the per capita ownership rates have generally held steady in the larger CMAs, with some slight increases in Calgary, Québec and Winnipeg. The changes are mixed in the Group C and Group D CMAs: rates in most municipalities have held steady; however, there have been significant increases in Halifax, Regina, St. John s Moncton and Saint John as well as lesser increases in London, Greater Sudbury / Grand Sudbury and Saguenay. The rate dropped slightly in Kelowna (still the highest overall rate) and Trois-Rivières. Overall, the ratio of approximately 1 vehicle for every 2 urban residents continues to hold. Exhibit 8-8 compares the light-duty vehicle ownership rates with the NHS journey-to-work auto mode shares. Although, as noted above, there tends to be a strong relationship between vehicle ownership and auto mode choice, there continue to be several exceptions to this tendency: this is exemplified by the larger CMAs, many of which have well-developed higher-order transit systems, and by fast-growing CMAs such as Calgary, Kelowna and Victoria, which have recorded high active transportation shares. Exhibit 8-8. Light-Duty Vehicles per Capita and Journey-to-Work Auto Mode Shares, Journey to work mode share Abbotsford - Mission Saguenay Windsor Trois-Rivières St. John's Thunder Bay St. Catharines - Niagara Brantford Barrie Oshawa Saint John Regina Moncton Sherbrooke Brampton (CSD) Kitchener - Cambridge - Waterloo Surrey (CSD) Mississauga (CSD) Saskatoon Greater Sudbury / Grand Sudbury Peterborough Laval (CD) Hamilton London Guelph Kingston Québec Edmonton Winnipeg Halifax Calgary Burnaby (CSD) Kelowna y = 0.375x R² = Toronto Ottawa-Gatineau Montréal Vancouver Victoria Light duty vehicles per capita 124 April 2016
142 Recent research has found that a better indication of work trip mode share is the relationship between the journey-to-work mode share and the vehicle rate per worker. Exhibit 8-9 shows this relationship for. It can be seen that the plot is less scattered than Exhibit 8-8, which indicates a stronger relationship. The R 2 value for the linear plot also is higher, although further research would be needed to develop a more meaningful mathematical formulation. Exhibit 8-9. Light-Duty Vehicles per Worker and Journey-to-Work Auto Mode Shares, 100% y = x R² = % Abbotsford - Mission Saguenay Trois-Rivières 90% Brantford St. John's Moncton Windsor St. Catharines - Niagara Kitchener - Cambridge - Waterloo Oshawa Saint John Thunder Bay Greater Sudbury / Grand Sudbury Barrie Regina Brampton (CSD) Peterborough Journey to work mode share 85% 80% Longueuil (CD) Sherbrooke Saskatoon Mississauga (CSD) Guelph Hamilton London Kingston Québec Laval (CD) Surrey (CSD) Kelowna Edmonton Gatineau (CSD) Winnipeg 75% Halifax Calgary Burnaby (CSD) 70% Victoria Ottawa (CSD) Ottawa-Gatineau Toronto Montréal Vancouver 65% Light duty vehicles per worker April
143 Exhibit 8-10 plots the auto mode share and the light-duty vehicle rate per worker for (green triangles), (red square) and (blue diamond). (Note that CMA names are not shown, for readability.) The plot shows how the relationship changes over time, also using a linear plot: again, further research is needed to develop a more definitive relationship. Exhibit Light-Duty Vehicles per Worker and Journey-to-Work Auto Mode Shares, - 100% Linear () Linear () Linear () y = x R² = % 90% Journey to work mode share 85% 80% 75% 70% 65% Light duty vehicles per worker Note: CMA names not shown, for readability 126 April 2016

144 8.4 VEHICLE-KILOMETRES TRAVELLED Vehicle-kilometres travelled (VKT) is a widely-used measure of activity, in this case measuring travel by personal automobile. For the UTI5, CMAs were offered the ability to calculate VKT using one of two common sources: a metropolitan travel demand forecasting model or with observed traffic counts. 26 Exhibit 8-11 summarizes the daily EUA VKT per capita for. A range in VKT per capita rates can be seen, with the highest rates observed in Windsor and the lowest rate in the Toronto CSD. It is difficult to discern any patterns in the VKT, given differences not only in the method of calculation but also in the underlying data and assumptions. Exhibit Daily EUA Vehicle-Kilometres Travelled Per Capita, Toronto Toronto (CSD) Group C Group B Group A Montréal Vancouver Vancouver (CSD) Surrey (CSD) Burnaby (CSD) Ottawa - Gatineau Ottawa (CSD) Gatineau (CSD) Calgary Québec Winnipeg Kitchener - Cambridge - Waterloo Oshawa Windsor Sherbrooke Daily vehicle km travelled per capita for all vehicle types 26 For methodological options, the CMA respondents were referred to Canadian Institute of Transportation Engineers Technical Liaison Committee, Vehicle Kilometres Travelled Canadian Methodology, Canadian Institute of Transportation Engineers, April
145 128 April 2016
146 9. ECONOMIC PERFORMANCE This is a reworked, streamlined and updated discussion that replaces the UTI4 s Transportation Costs and Finance chapter. The revision addresses difficulties that CMAs reported in preparing the cost and financial information. It also provides a indication of the economic importance of investments in transportation, and it recognizes the emergence of alternate funding sources. 9.1 REVENUE SOURCES Respondents were asked to describe the sources of funding for their CMA transportation investments. This meant that some respondents had to isolate the contributions to multi-year investments. Exhibit 9-1 summarizes the findings. The first column describes the different sources of funding. These are based on the UTI4 descriptions, in some cases aggregated. In addition, private funding was included as a new, sixth source. Note that approximately half the CMAs (14 or 16 CMAs) did not respond, whereas many of the respondents indicated multiple sources. The two most common sources were Federal or Provincial transfers and grants, and local taxes, at 28 responses each. Development charges followed, with 24 respondents, and then user fees, with 22 respondents. Exhibit 9-1. Summary of Responses to Sources of Transportation Funding, Sources of Transportation Funding No Response Utilized Being Considered Not Utilized freq. freq. % freq. % freq. % a. Federal / Provincial transfers / grants (e.g., recurring / ongoing Federal or Provincial contribution, onetime Federal or Provincial grants). Include funds related to parts of the network operated by a provincial or a national government % 0 0% 0 0% b. User fees / parking taxes / surcharges (e.g., parking surcharge, tax on private parking revenues / facilities, transit fares, road pricing [including tolls], designated fuel tax, vehicle registration tax) c. Local taxes / surcharges (e.g., municipal property tax, municipally- / regionally-levied tax on fuel emissions) d. Development levies / cost recovery (e.g., benefitsharing levy on development, frontage levy on development, cost recovery for new development) e. Private funding sources (e.g., public-private partnerships for the provision of transportation infrastructure, services, operations and maintenance, rehabilitation, etc.) % 5 17% 3 10% % 1 3% 1 3% % 3 10% 3 10% % 3 11% 15 54% f. Other % 0 0% 3 43% April
147 Overall, the exhibit shows that CMAs used a variety of public funding sources, with almost equal frequency. In addition, 10 CMAs indicated that they had used private funding as a source. However, only two CMAs reported the actual percent of transportation funding that was provided by private sources: the City of Ottawa reported 7% and Oshawa reported 3.5% of funding was from private sources. Vancouver, Calgary and St. John s all indicated that 0% of their funding came from private sources. 9.2 TRANSPORTATION EXPENDITURES This section discusses transportation expenditures. Transit expenditures are separated from all other transportation expenditures, which are grouped together. The two categories are then distinguished between capital and operating and maintenance expenditures. This grouping represents a consolidation of the categories that were used in the previous UTI surveys: this was done in response to the difficulties encountered by several CMAs in preparing the necessary details. Exhibit 9-2 presents the total municipal / regional transportation budgets (excluding transit) per capita. It can be seen that the budgets vary considerably, with the City of Gatineau, Calgary and Québec having the highest per capita expenditures, and the City of Vancouver and St. John s having the lowest rates. 27 Exhibit 9-3 shows the percentages of these expenditures that are allocated between capital costs and operating and maintenance costs. Again, the reporting CMAs demonstrate a range, although most of the expenditures are for capital costs: 100% of the City of Brampton and 94% of Oshawa s costs are at the upper end of this range, and Halifax is at the lower end, at 23%. Exhibit 9-4 shows the municipal / regional transit budgets per capita for the reporting CMAs. Again, a range of rates is evident, with Toronto highest at $804 per person (and the City of Toronto highest overall at $1,133 per person), and St. John s and Moncton lowest at $79 and $82 per person, respectively. Note that for most CMAs, the transit rate is lower than the rate for all other transportation. Notable exceptions are Toronto, Vancouver and Ottawa-Gatineau. Exhibit 9-5 shows the percentage of expenditures that are allocated to capital and operating and maintenance costs. In contrast to all other transportation expenditures, transit expenditures tend to be dominated by operating and maintenance costs, with most CMAs reporting the latter to be of the order of 80%. Notable exceptions are Calgary, whose transit capital costs represent 62% of the total, the City of Ottawa (50%), the City of Toronto (48%), the City of Mississauga (43%), the City of Brampton (37%) and Kitchener-Cambridge-Waterloo (33%). 27 Note that TransLink, the regional transportation authority, is responsible for much of the infrastructure in Metropolitan Vancouver. Hence, the Vancouver and Surrey rates are much lower than that for the Vancouver CMA, although Burnaby s rate is closer to the regional rate. Similar, though less emphasized, circumstances occur in Toronto. Thus, caution is needed in comparing CSD / CD rates with those for the entire CMA. 130 April 2016
 Group D Group C Group B Group A Toronto Toronto (CSD) Mississauga (CSD) Montréal Vancouver Vancouver")
148 Exhibit 9-2. Municipal / Regional Transportation Budgets per Capita in CMA, (all expenditures, LESS transit) Group D Group C Group B Group A Toronto Toronto (CSD) Mississauga (CSD) Montréal Vancouver Vancouver (CSD) Surrey (CSD) Burnaby (CSD) Ottawa - Gatineau Ottawa (CSD) Gatineau (CSD) Calgary Québec Winnipeg Hamilton Kitchener - Cambridge - Waterloo Halifax Oshawa Windsor Sherbrooke St. John's Kelowna Greater Sudbury / Grand Sudbury Saguenay Trois-Rivières Guelph Moncton Saint John $- $100 $200 $300 $400 $500 $600 $700 $800 $900 $1,000 Municipal / Regional Transportation Budgets per Capita April
 Capital Expenditures Operating/Maintenance")
 Gatineau (CSD) Calgary Québec Winnipeg Hamilton Kitchener - Cambridge - Waterloo Halifax Oshawa Windsor Sherbrooke St.")
149 Exhibit 9-3. Municipal / Regional Transportation Budgets, % breakdown in CMA, (all capital and operating/maintenance expenditures, LESS transit) Capital Expenditures Operating/Maintenance Expenditures Group D Group C Group B Group A Toronto Toronto (CSD) Mississauga (CSD) Brampton (CSD) Montréal Vancouver Vancouver (CSD) Surrey (CSD) Burnaby (CSD) Ottawa - Gatineau Ottawa (CSD) Gatineau (CSD) Calgary Québec Winnipeg Hamilton Kitchener - Cambridge - Waterloo Halifax Oshawa Windsor Sherbrooke St. John's Kelowna Greater Sudbury / Grand Sudbury Saguenay Trois-Rivières Guelph Moncton Saint John 0% 10% 20% 30% 40% 50% 60% 70% 80% 90% 100% Municipal / Regional Capital /Operating Transportation Budgets breakdown 132 April 2016
 Group D Group C Group B Group A Toronto Toronto (CSD) Mississauga (CSD) Brampton (CSD) Montréal Montréal (CD) Laval")
150 Exhibit 9-4. Municipal / Regional Transit Budgets per Capita in CMA, (all transit expenditures) Group D Group C Group B Group A Toronto Toronto (CSD) Mississauga (CSD) Brampton (CSD) Montréal Montréal (CD) Laval (CD) Longueuil (CD) Vancouver Ottawa - Gatineau Ottawa (CSD) Gatineau (CSD) Calgary Québec Winnipeg Hamilton Kitchener - Cambridge - Waterloo Halifax Oshawa Windsor Sherbrooke St. John's Kelowna Greater Sudbury / Grand Sudbury Saguenay Trois-Rivières Guelph Moncton $- $200 $400 $600 $800 $1,000 $1,200 Municipal / Regional Transit Budgets per Capita April
 Capital Transit Expenditures Operating Transit")
 Gatineau (CSD) Calgary Québec Winnipeg Hamilton Kitchener - Cambridge - Waterloo Halifax Oshawa Windsor Sherbrooke St.")
151 Exhibit 9-5. Municipal / Regional Transit Budgets, % breakdown in CMA, (all transit capital and operating/maintenance expenditures) Capital Transit Expenditures Operating Transit Expenditures Toronto Toronto (CSD) Mississauga (CSD) Group D Group C Group B Group A Brampton (CSD) Montréal Montréal (CD) Laval (CD) Longueuil (CD) Vancouver Ottawa - Gatineau Ottawa (CSD) Gatineau (CSD) Calgary Québec Winnipeg Hamilton Kitchener - Cambridge - Waterloo Halifax Oshawa Windsor Sherbrooke St. John's Kelowna Greater Sudbury / Grand Sudbury Saguenay Trois-Rivières Guelph Moncton 0% 10% 20% 30% 40% 50% 60% 70% 80% 90% 100% Municipal / Regional Capital /Operating Transit Budgets breakdown 134 April 2016
. In other words, this measure describes the importance of transportation investment to the local economy.")
152 9.3 ROLE OF TRANSPORTATION INVESTMENT IN THE LOCAL ECONOMY New to the UTI5, respondents were asked to express their transportation expenditures as a percentage of the CMA s gross domestic product (GDP). In other words, this measure describes the importance of transportation investment to the local economy. Among the reporting CMAs, Exhibit 9-6 shows that Ottawa-Gatineau s investment was highest, at 2.4% of the CMA s GDP. Ottawa-Gatineau s share of transit investment was also highest, at 1.5% of GDP, followed by Vancouver at 1.4% of GDP. Greater Sudbury / Grand Sudbury s share of all other transportation investments was highest, at 1.2% of GDP, followed by Kitchener-Cambridge-Waterloo at 1.0%, and Ottawa-Gatineau and Calgary at 0.9%. Exhibit 9-6. Transportation Expenditures as % of CMA GDP, Other spending as % of regional GDP Transit spending as % of regional GDP Group D Group C Group B Group A Vancouver Ottawa - Gatineau Calgary Winnipeg Kitchener - Cambridge - Waterloo Halifax Windsor St. John's Kelowna Greater Sudbury / Grand Sudbury Moncton 0.0% 0.5% 1.0% 1.5% 2.0% 2.5% 3.0% Transportation Expenditures as % of CMA GDP, April
153 136 April 2016
154 10. HEALTH INDICATORS 10.1 INTRODUCTION Transportation policy addresses a wide range of issues including safety, infrastructure, and the built environment. These policies influence the way people access services, encourage or discourage healthy lifestyle choices, and place environmental risks on vulnerable communities. By considering specific health indicators and outcomes, which have been found to be associated with transportation and land use, policymakers and planners can make informed decisions to improve physical and mental health, reduce environmental risks, and increase modal options for accessing destinations. 28 The indicators reported on here come from two primary sources: the Canadian Community Health Survey, and from the survey of the local CMA representatives directly. The local CMA representatives also are the source of the data for many of the other types of indicators in this document, and similarly obtain the data for specific indicators from the best available local sources. Most of the indicators in this section are new, and as a result complete data are not always available from the CMAs. The content and format presented here are therefore subject to the availability and quality of the data. The CMA representatives provided notes about the data (e.g. time of collection, unique definitions, geographic coverage, or calculations), and these are indicated in the text and/or exhibits, as appropriate. The specific indicators from each primary data set are described below. The Canadian Community Health Survey (CCHS) is a cross-sectional survey that collects self-reported health information on Canadians related to health status, utilization of health care and other health determinates. 29 The survey utilizes a large sample of respondents and is designed to provide reliable health estimates at the regional level for CMAs. The CCHS is conducted by Statistics Canada and the most recent survey available is for and Thirty-two health-related variables are collected for the CCHS including several measures of perceived health status, specific health conditions such as diabetes, asthma and high blood pressure, smoking status and exposure to second-hand smoke as well as self-reported body mass index (BMI) and physical activity. For this survey, eleven of the most relevant measures of health status potentially related to physical activity and the impact of the built environment are used: Perceived health, very good or excellent Perceived health, fair or poor Perceived mental health, very good or excellent Perceived mental health, fair or poor Life satisfaction, satisfied or very satisfied Diabetes Asthma High blood pressure Physical activity during leisure-time, moderately active or active Body mass index, self-reported, adult (18 years and over), overweight or obese 28 Centers for Disease Control and Prevention. Transportation Health Impact Assessment Toolkit. October Statististics Canada -- April
155 Community connectedness (sense of belonging to local community, somewhat strong or very strong) In addition to these eleven measures of health status from the CCHS, this report also synthesizes CMAreported measures related to: Walking and bicycling to school Time spent traveling in vehicles Distance to school Sidewalk coverage Vehicle emissions Traffic injuries and fatalities Distance to major roads Distance to public parks Impervious (built) areas The measures discussed in this report provide insight on the relationship between transportation, the built environment, and related health outcomes in Canada. They also reveal the disparities in health outcomes across CMAs that may be partly attributable to transportation policies. As noted above, health indicators are a new topic for the UTI. In addition, some UTI4 indicators have been relocated to this discussion, given their pertinence to the topic: These are safety (UTI4 section 5.3), pedestrian and cyclist safety (UTI4 section 7.3) and energy and environment (parts of UTI4 section 5.4) PHYSICAL ACTIVITY, OBESITY AND RELATED CONDITIONS The built environment, which includes transportation, housing, and land use has an impact on human health. It plays an important role in population health behaviours and outcomes including physical activity, obesity, and other related health conditions. The CCHS findings detailed in this section reveal important and measurable differences in physical activity, obesity, and related conditions across 33 CMAs. In general, for the measures of health used in this report, CMA Groups A and B (populations over 500,000) reported better perceived health, had lower prevalence of specific health conditions and obesity compared to CMA Groups C and D (populations under 500,000). These disparities in self-reported weight and related health conditions are potentially related to differences in transportation, the built environment, access to health services, and opportunities for physical activity within each CMA GENERAL CCHS asks respondents to rate their level of physical activity in the past three months. As shown in Exhibit 10-1, nearly 50% of respondents across all CMAs are found to be moderately active or active. Kelowna has the highest percent of respondents indicating they are moderately active or active (67.5%) while Montréal has the lowest percent (49%). CMA Group D has the highest average percent of respondents indicating they are moderately active or active (58.6%) while Group A has the lowest percent (51.8%) Note: All group level averages are reported in this section are simple, non-weighted averages of the CMA values within each group. 138 April 2016

156 Exhibit Physical activity during leisure time, moderately active or active, Group D Group C Group B Group A Toronto Montréal Vancouver Ottawa-Gatineau Calgary Edmonton Québec Winnipeg Hamilton Kitchener-Cambridge-Waterloo London St. Catharines-Niagara Halifax Oshawa Victoria Windsor Saskatoon Regina Sherbrooke St. John's Barrie Kelowna Abbotsford-Mission Greater Sudbury / Grand Sudbury Kingston Saguenay Trois-Rivières Guelph Moncton Brantford Saint John Thunder Bay Peterborough 0% 20% 40% 60% 80% Source: Canadian Community Health Survey. Note that the exhibit refers to the population aged 12 and over who reported a level of physical activity, based on their responses to questions about the nature, frequency and duration of their participation in leisure-time physical activity. Respondents are classified as active, moderately active or inactive based on an index of average daily physical activity over the past 3 months. April
157 Respondents BMI is calculated using their self-reported weight and height. Exhibit 10-2 summarizes the findings. Over 40% of respondents across all CMAs are obese or overweight. Vancouver has the lowest percent of overweight or obese respondents (42%) while Greater Sudbury / Grand Sudbury has the highest percent (65.1%). CMA Group A has the lowest average percent of respondents that are overweight or obese (46%) while Group D has the highest average percent (55.2%). 31 Exhibit Percent of respondents (18 years and over) with overweight or obese BMI, Group A Group D Group C Group B Toronto Vancouver Calgary Québec Hamilton London Halifax Victoria Saskatoon Sherbrooke Barrie Abbotsford-Mission Kingston Trois-Rivières Moncton Saint John Peterborough 0% 20% 40% 60% 80% Source: Canadian Community Health Survey. 31 From Statistics Canada, Body Mass Index is calculated by dividing the respondent's body weight (in kilograms) by their height (in metres) squared. The index for body weight classification is: less than (underweight); to (normal weight); to (overweight); to (obese, class I); to (obese, class II); or greater (obese, class III). According to the World Health Organization (WHO) and Health Canada guidelines, health risk levels are associated with each of the following BMI categories: normal weight = least health risk; underweight and overweight = increased health risk; obese, class I = high health risk; obese, class II = very high health risk; obese, class III = extremely high health risk. According to WHO and Health Canada guidelines, the index is calculated for the population aged 18 and over, excluding pregnant females and persons less than 3 feet (0.914 metres) tall or greater than 6 feet 11 inches (2.108 metres). 140 April 2016
 while Saskatoon has the lowest (11.5%).")
158 As shown in Exhibit 10-3, less than 25% of respondents across all CMAs indicate they have been diagnosed by a health professional as having high blood pressure. Saguenay has the highest percent of respondents indicating they have high blood pressure (22.4%) while Saskatoon has the lowest (11.5%). CMA Group D has the highest average percent of respondents saying they have high blood pressure (18.7%) while Group A has the lowest percent (15.3%). Exhibit Percent of respondents with high blood pressure diagnosis, Group D Group C Group B Group A Toronto Montréal Vancouver Ottawa-Gatineau Calgary Edmonton Québec Winnipeg Hamilton Kitchener-Cambridge-Waterloo London St. Catharines-Niagara Halifax Oshawa Victoria Windsor Saskatoon Regina Sherbrooke St. John's Barrie Kelowna Abbotsford-Mission Greater Sudbury / Grand Sudbury Kingston Saguenay Trois-Rivières Guelph Moncton Brantford Saint John Thunder Bay Peterborough 0% 5% 10% 15% 20% 25% Source: Canadian Community Health Survey. Note that the exhibit refers to the population aged 12 and over who reported that they have been diagnosed by a health professional as having high blood pressure. Exhibit 10-4 summarizes the CCHS findings for people who have been diagnosed with diabetes by a health professional. Less than 9% of respondents across all CMAs, except Windsor (10.4%) report having diabetes. Windsor has the highest percent of respondents indicating that they have diabetes (10.4%) while Saskatoon has the lowest percent of respondents (3.8%). CMA Group C has the highest average April

159 percent of respondents indicating they have diabetes (6.9%) while Group B has the lowest average percent (5.7%). Exhibit Percent of respondents with diabetes diagnosis, Group D Group C Group B Group A Toronto Montréal Vancouver Ottawa-Gatineau Calgary Edmonton Québec Winnipeg Hamilton Kitchener-Cambridge-Waterloo London St. Catharines-Niagara Halifax Oshawa Victoria Windsor Saskatoon Regina Sherbrooke St. John's Barrie Kelowna Abbotsford-Mission Greater Sudbury / Grand Sudbury Kingston Saguenay Trois-Rivières Guelph Moncton Brantford Saint John Thunder Bay Peterborough 0% 5% 10% 15% Source: Canadian Community Health Survey. The exhibit refers to the population aged 12 and over who reported that they have been diagnosed by a health professional as having Type 1 or Type 2 diabetes. Diabetes includes females 15 and over who reported that they have been diagnosed with gestational diabetes. Light blue, dashed findings represent data with a coefficient of variation (CV) from 16.6% to 33.3%. CCHS recommends these findings to be used with caution. The CV indicates the reliability of the estimates in the context of survey data, generally coming from a sample. For more information, see April 2016
160 TRAVEL TO SCHOOL Transportation infrastructure and the built environment shape the conditions around schools and subsequently the safety and accessibility of those schools. The built environment can support the safety, health, and wellbeing of students and families by allowing and encouraging students to walk and bicycle to school. In environments that are conducive to walking and bicycling, active transportation can become a more appealing choice than other modes of transportation. As a result, children can engage in physical activity from an early age if active transportation is a safe option. Furthermore, promoting walking and bicycling to school can reduce air pollution, traffic, and traffic hazards around schools, all of which have an impact on safety, health, and wellbeing. 32 The importance of these points is illustrated by Toronto Public Health s 2012 Road to Health report. 33 The report concluded the benefits of increased physical activity through walking and cycling are numerous and diverse, including: significantly reducing the risk of all-cause mortality, cardiovascular disease, obesity, type II diabetes, and certain types of cancer.... generat[ing] significant social, environmental, economic and transportation system benefits.... the health benefits experienced by individuals who increase their physical activity through the use of active transportation greatly outweigh the risks [from traffic collisions]. Walking and cycling infrastructure investments are extremely cost-effective, even when considering the health benefits alone. Better design for active modes, such as walking and cycling, can greatly increase safety for all modes; increasing the proportion of trips made by walking and cycling can also independently lower collision and injury rates (the 'safety in numbers' effect). Exhibit 10-5 shows that, for those CMAs reporting data, the percent of students in grades K-12 who walk or bicycle to school. A greater percentage of students walk than bicycle to school in all the CMAs. There is great variability in the percent of students walking to school among the CMAs; 62% of Oshawa students walk to school while only 14.3% of Trois-Rivières students walk to school. Similarly, the percent of students bicycling to school varies among the CMAs; 10% of Moncton students bicycle to school 0.48% of Trois-Rivières bicycle to school National Center for Safe Routes to School. What is Safe Routes to School? Lightman D, Winters M, Heeney D, Mee C, Chirrey S, Campbell M, Mishaiel R. Road to Health: Improving Walking and Cycling in Toronto. Toronto Public Health April
 students walking or cycling to school 5-18 year old students (grades K-12) cycling to school 5-18 year old students (grades K-12) walking to school Group")

161 Exhibit Percent of all 5 to 18 year old (grades K-12) students walking or cycling to school 5-18 year old students (grades K-12) cycling to school 5-18 year old students (grades K-12) walking to school Group D Group C Group B Group A Montréal Vancouver Ottawa-Gatineau Calgary Québec Winnipeg Kitchener-Cambridge-Waterloo Oshawa Sherbrooke Kelowna Trois-Rivières Guelph Moncton 0% 10% 20% 30% 40% 50% 60% 70% Source: Data supplied by individual CMAs for the following years -- Moncton 2014; Guelph ; Kelowna 2013; Oshawa 2012; Kitchener-Cambridge-Waterloo ; Winnipeg 2007; Calgary 2012, Ottawa-Gatineau ; Vancouver. Partial data available for Oshawa. Unavailable data do not imply 0 percent cycling. Data supplied by Guelph and Winnipeg are for students between years old PROXIMITY TO SCHOOLS An overlapping, but not the exact same, set of CMAs provided information on the percent of students (5 to 18 years old) live 400m, 1km, 2km and 3km from a school. Exhibit 10-6 shows that, of 13 CMAs reporting, all but 5 (Montréal, Québec, Sherbrooke, Trois-Rivières and the Gatineau CSD), have over 90% of their students living within 3km of a school. Seven CMAs have over 90% of students within 1km of school. Shorter distances to school increase the feasibility, and therefore the likelihood, of walking or bicycling to school. 144 April 2016
 students living within a certain distance of a school 5-18 year olds (grades K-12) living within 3km of a school 5-18 year olds (grades K-12) living within 2km")
 Calgary Québec Winnipeg Kitchener - Cambridge - Waterloo Oshawa Sherbrooke Kelowna Greater Sudbury / Grand Sudbury Trois-Rivières Moncton 0% 20% 40% 60% 80% 100% Source: Data supplied")
162 Exhibit Percent of 5-18 year old (grades K-12) students living within a certain distance of a school 5-18 year olds (grades K-12) living within 3km of a school 5-18 year olds (grades K-12) living within 2km of a school 5-18 year olds (grades K-12) living within 1km of a school 5-18 year olds (grades K-12) living within 400m of a school Group D Group C Group B Group A Montréal Vancouver Ottawa (CSD) Gatineau (CSD) Calgary Québec Winnipeg Kitchener - Cambridge - Waterloo Oshawa Sherbrooke Kelowna Greater Sudbury / Grand Sudbury Trois-Rivières Moncton 0% 20% 40% 60% 80% 100% Source: Data supplied by individual CMAs. Moncton 2013; Greater Sudbury / Grand Sudbury ; Kelowna ; Oshawa ; Kitchener-Cambridge-Waterloo ; Winnipeg 2007; Calgary ; Ottawa-Gatineau 2013; Vancouver. Findings for Ottawa-Gatineau are shown separately for each CSD. April
163 TIME SPENT IN VEHICLES Transportation infrastructure and the built environment can influence the amount of time people spend in their car or transit vehicles in order to get from one destination to another. Time spent sitting in vehicles contributes to sedentary behaviours, which are known to be associated with increased weight gain, obesity, and poor metabolic health. 34,35,36 Exhibit 10-7 and Exhibit 10-8 show, for those CMAs reporting data, the average minutes spent in a car or transit vehicle per trip, by trip type. As shown in Exhibit 10-7, respondents average work trip time exceeds the average for all trip types by car, except in Moncton, where they are both 30 minutes, which also was the maximum time for all CMAs. Sherbrooke has the shortest average trip time for all trip types by car 12.5 minutes, and London shows the shortest average work trip time 15.9 minutes. Exhibit 10-8 shows that respondents spend up to an average of slightly over one hour per trip travelling by transit vehicles. Kitchener-Cambridge-Waterloo has the shortest average trip time for both work and all trip types 18.9 minutes. Even though transit users, while riding, are similarly sedentary to those in cars, they have been found to engage in more physical activity than non-transit users. 37,38 The trip to and from the transit system can be done by an active mode (walking or bicycling), whereas the trip to or from the car will typically be a shorter walk trip. The density of transit stops/stations or shorter distance from home to the nearest stop/station is associated with more physical activity and lower body weight. 39,40 Note, again, that the average times discussed here, which are derived from CMA origin-destination surveys, are not comparable with the median NHS times that are reported in Section 5.1. This is due to differences in survey method, sample size and so on Frank, Lawrence D, Martin A Andresen, and Thomas L Schmid Obesity Relationships with Community Design, Physical Activity, and Time Spent in Cars. American Journal of Preventive Medicine 27 (2): doi: /j.amepre Wen, L M, N Orr, C Millett, and C Rissel.. Driving to Work and Overweight and Obesity: Findings from the 2003 New South Wales Health Survey, Australia. International Journal of Obesity (2005) 30 (5) (May): doi: /sj.ijo Lindström, Martin Means of Transportation to Work and Overweight and Obesity: A Population-Based Study in Southern Sweden. Preventive Medicine 46 (1) (January): doi: /j.ypmed Lachapelle U, Noland RB. Does the commute mode affect the frequency of walking behavior? The public transit link. Transp. Policy. Elsevier; 2012 May;21: Freeland AL, Banerjee SN, Dannenberg AL, Wendel AM. Walking associated with public transit: moving toward increased physical activity in the United States. Am. J. Public Health Mar;103(3): Rundle A, Roux AV, Free LM, Miller D, Neckerman KM, Weiss CC. The urban built environment and obesity in New York City: a multilevel analysis. Am J Health Promot 2007;21(4S): Forsyth A, Hearst M, Oakes JM, Schmitz KH. Design and Destinations: Factors Influencing Walking and Total Physical Activity. Urban Stud Aug 1;45(9): April 2016


164 Exhibit Average minutes per trip, per person spent in car by trip type Average minutes per trip, per person spent in car for all trip types Average minutes per trip, per person spent in car for journey to work Group D Group C Group B Group A Montréal Vancouver Ottawa-Gatineau Québec Winnipeg Kitchener-Cambridge-Waterloo London Halifax Oshawa Sherbrooke Kelowna Greater Sudbury / Grand Sudbury Moncton Minutes Source: Data supplied by individual CMAs. Moncton 2014; Greater Sudbury / Grand Sudbury ; Kelowna 2013; Oshawa ; Halifax ; London ; Kitchener-Cambridge-Waterloo ; Winnipeg ; Ottawa-Gatineau ; Vancouver. Partial data available for Quebec, Winnipeg, Halifax, Oshawa, Sherbrooke, and Greater Sudbury / Grand Sudbury. Unavailable data do not imply zero minutes per trip. April


165 Exhibit Average minutes per trip, per person spent in transit vehicle by trip type Average minutes per trip, per person spent in transit vehicle for all trip types Average minutes per trip, per person spent in transit vehicle for journey to work Group D Group C Group B Group A Montréal Vancouver Ottawa-Gatineau Winnipeg Kitchener-Cambridge-Waterloo Oshawa Kelowna Greater Sudbury / Grand Sudbury Moncton Minutes Source: Data supplied by individual CMAs. Moncton 2014; Greater Sudbury / Grand Sudbury ; Kelowna 2013; Oshawa ; Halifax ; London ; Kitchener-Cambridge-Waterloo ; Winnipeg ; Ottawa-Gatineau ; Vancouver. Partial data available for Winnipeg and Greater Sudbury / Grand Sudbury. Unavailable data do not imply zero minutes per trip SIDEWALK COVERAGE Sidewalks are a major component of walking and bicycling infrastructure, which affect peoples ability to safely and conveniently engage in physical activity and active transportation. 41,42 Sidewalks association with safety includes both reducing vehicle-pedestrian collisions, and if properly constructions and maintained reducing trip hazards, especially for the physically or visually impaired. 43,44 Thus, access to Ewing R, Dumbaugh E. The Built Environment and Traffic Safety: A Review of Empirical Evidence. J. Plan. Lit May 21;23(4): Retting R a, Ferguson S a, McCartt AT. A review of evidence-based traffic engineering measures designed to reduce pedestrian-motor vehicle crashes. Am. J. Public Health Sep;93(9): Lockett D, Willis A, Edwards N. Through seniors' eyes: an exploratory qualitative study to identify environmental barriers to and facilitators of walking. Can J Nurs Res Sep;37(3): Li W, Keegan TH, Sternfeld B, Sidney S, Quesenberry CP, Kelsey JL. Outdoor falls among middle-aged and older adults: a neglected public health problem. Am J Public Health. Jul; 96(7): April 2016

166 sidewalks can potentially affect physical activity and its associated health outcomes. 45 Measures of sidewalk coverage can provide insight on accessibility to sidewalks and, furthermore, opportunities for outdoor physical activity. 46 As shown in Exhibit 10-9, sidewalk coverage varies greatly across the six reporting CMAs. Moncton reported the highest percent of streets with sidewalks on both sides of the street (80%) while Greater Sudbury / Grand Sudbury reported the lowest percent (13%). Exhibit Percent of streets with sidewalks on both sides of the street Group D Group C Group BGroup A Vancouver Calgary Kitchener-Cambridge-Waterloo Oshawa Greater Sudbury / Grand Sudbury Moncton 0% 20% 40% 60% 80% 100% Source: Data supplied by individual CMAs. Moncton 2014; Greater Sudbury / Grand Sudbury 2014; Oshawa 2012; Kitchener-Cambridge-Waterloo 2014; Vancouver PEDESTRIAN / CYCLIST SAFETY AND TRAFFIC COLLISIONS There are many potential reasons for traffic collisions involving pedestrians and cyclists, including impairment due to drugs and alcohol, distractions (e.g. texting) and unsafe driving (e.g. speeding). 47 Street design is a way to minimize potential conflicts between automobiles and the more vulnerable users who share the roadway space. Motor vehicle speeds can be reduced through street designs, which help to decrease the likelihood of collisions. Injuries are less severe and the likelihood of death is Kahn EB, Ramsey LT, Brownson RC, Heath GW, Howze EH, Powell KE, Stone EJ, Rajab MW, Corso P. The effectiveness of interventions to increase physical activity. A systematic review. Am J Prev Med May; 22(4 Suppl): June Brownson, Ross C. et al. Measuring the Built Environment for Physical Activity: State of the Science. American journal of preventive medicine 36.4 Suppl (2009): S e12. PMC. Web. 22 June Note that some of the discussion in this section updates and reworks UTI4 sections 5.3 (safety) and 7.3 (pedestrian and cyclist safety). April
167 decreased when collisions involve slower vehicle travel speeds. 48 A pedestrian has a 90 percent chance of surviving a crash that happens at 30 km/h or below. 49,50 If the crash happens at double the speed (60 km/h), the pedestrian is unlikely to survive. 51 A similar relationship between speed and survival rates has been shown for cyclists. 52 Exhibit through Exhibit summarize the impact of traffic-related injuries and fatalities by mode type and across years. Exhibit shows traffic-related fatalities by mode type (vehicle occupant, pedestrian, or cyclist) with Montréal having the greatest total number of fatalities (111) and Saint John having the least (0). Exhibit shows traffic-related injuries by mode type with Vancouver having the greatest total number of injuries (17,952) and Saint John having the least (0) World Health Organization. World report on road traffic injury prevention Khan FM, Jawaid M, Chotani H, Luby S. Pedestrian environment and behavior in Karachi, Pakistan. Accid Anal Prev Jul;31(4): Herrstedt L. Planning and safety of bicycles in urban areas. In: Proceedings of the Traffic Safety on Two Continents Conference, Lisbon, September Linköping, Swedish National Road and Transport Research Institute, 1997: Anderson RWG, McLean AJ, Farmer MJB, Lee, BH, Brooks, CG. Vehicle travel speeds and the incidence of fatal pedestrian crashes. Accident analysis and prevention.1997;29(5): Kim JK, Kim S, Ulfarsson GF, Porrello LA. Bicyclist injury severities in bicycle-motor vehicle accidents. Accid Anal Prev Mar;39(2): Epub Sep April 2016
 Mississauga (CSD) Brampton (CSD) Montréal Montréal (CD) Laval (CD)")
168 Exhibit Traffic-related fatalities by mode type, Vehicle occupant Pedestrian Cyclist Group D Group C Group B Group A Toronto Toronto (CSD) Mississauga (CSD) Brampton (CSD) Montréal Montréal (CD) Laval (CD) Longueuil (CD) Vancouver Vancouver (CSD) Surrey (CSD) Burnaby (CSD) Ottawa - Gatineau Ottawa (CSD) Gatineau (CSD) Calgary Edmonton Québec Winnipeg Hamilton Kitchener - Cambridge - Waterloo London St. Catharines - Niagara Halifax Oshawa Victoria Windsor Saskatoon Regina Sherbrooke St. John's Barrie Kelowna Abbotsford - Mission Greater Sudbury / Grand Sudbury Kingston Saguenay Trois-Rivières Guelph Moncton Brantford Saint John Thunder Bay Peterborough Fatalities Source: Data supplied by individual CMAs. Burnaby (CSD), Surrey (CSD), Vancouver 2014; Calgary, Gatineau (CSD), Greater Sudbury / Grand Sudbury, Moncton, Oshawa, St. John s, Toronto (CSD), Windsor, Winnipeg ; Guelph, Kitchener-Cambridge-Waterloo 2012; Kelowna 2013; London 2009; Ottawa (CSD), Saint John, Saskatoon April
169 Exhibit Traffic-related injuries by mode type, Vehicle occupant Pedestrian Cyclist Group D Group C Group B Group A Toronto Toronto (CSD) Mississauga (CSD) Brampton (CSD) Montréal Montréal (CD) Laval (CD) Longueuil (CD) Vancouver Vancouver (CSD) Surrey (CSD) Burnaby (CSD) Ottawa - Gatineau Ottawa (CSD) Gatineau (CSD) Calgary Edmonton Québec Winnipeg Hamilton Kitchener - Cambridge - Waterloo London St. Catharines - Niagara Halifax Oshawa Victoria Windsor Saskatoon Regina Sherbrooke St. John's Barrie Kelowna Abbotsford - Mission Greater Sudbury / Grand Sudbury Kingston Saguenay Trois-Rivières Guelph Moncton Brantford Saint John Thunder Bay Peterborough 0 1,000 2,000 3,000 4,000 5,000 6,000 7,000 Injuries Source: Data supplied by individual CMAs. Burnaby (CSD), Surrey (CSD), Vancouver 2014; Calgary, Gatineau (CSD), Greater Sudbury / Grand Sudbury, Moncton, Oshawa, St. John s, Toronto (CSD), Windsor, Winnipeg ; Guelph, Kitchener-Cambridge-Waterloo 2012; Kelowna 2013; London 2009; Ottawa (CSD), Saint John, Saskatoon Exhibit and Exhibit provide fatality and injury data over three time periods, and. Most CMAs did not provide data for all three periods, which hampers the ability to discern any 152 April 2016
170 upward or downward trends. For those CMAs with multiple time periods of data for fatality counts (Exhibit 10-12), many saw decreases in as compared to the previous year (Toronto, Montréal, Vancouver, Calgary, Winnipeg, Hamilton, Oshawa, Windsor, Saskatoon, Sherbrooke and Greater Sudbury / Grand Sudbury), while others showed an increase in (Ottawa-Gatineau, Québec, Kitchener-Cambridge-Waterloo, Kelowna, Saguenay and Trois-Rivières). Injury counts also showed many reductions and some increases (Exhibit 10-13). April
171 Exhibit Traffic-related fatalities by all modes for,, and Group D Group C Group B Group A Ottawa- Gatineau Vancouver Montréal Toronto Toronto Toronto (CSD) Mississauga (CSD) Brampton (CSD) Montréal Montréal (CD) Laval (CD) Longueuil (CD) Vancouver Vancouver (CSD) Surrey (CSD) Burnaby (CSD) Ottawa-Gatineau Ottawa (CSD) Gatineau (CSD) Calgary Edmonton Québec Winnipeg Hamilton Kitchener-Cambridge-Waterloo London St. Catharines-Niagara Halifax Oshawa Victoria Windsor Saskatoon Regina Sherbrooke St. John's Barrie Kelowna Abbotsford-Mission Greater Sudbury / Grand Sudbury Kingston Saguenay Trois-Rivières Guelph Moncton Brantford Saint John Thunder Bay Peterborough Fatalities Source: Data supplied by individual CMAs. 154 April 2016
172 Exhibit Traffic-related injuries by all modes for,, and Group D Group C Group B Group A Ottawa- Gatineau Vancouver Montréal Toronto Toronto Toronto (CSD) Mississauga (CSD) Brampton (CSD) Montréal Montréal (CD) Laval (CD) Longueuil (CD) Vancouver Vancouver (CSD) Surrey (CSD) Burnaby (CSD) Ottawa-Gatineau Ottawa (CSD) Gatineau (CSD) Calgary Edmonton Québec Winnipeg Hamilton Kitchener-Cambridge-Waterloo London St. Catharines-Niagara Halifax Oshawa Victoria Windsor Saskatoon Regina Sherbrooke St. John's Barrie Kelowna Abbotsford-Mission Greater Sudbury / Grand Sudbury Kingston Saguenay Trois-Rivières Guelph Moncton Brantford Saint John Thunder Bay Peterborough Injuries April
173 10.4 EXPOSURE TO AIR POLLUTION AND NOISE POLLUTION Transportation and its related vehicle emissions contribute to air and noise pollution. 53 Air pollution is a major environmental health risk, which increases the burden of chronic diseases including asthma, lung cancer, heart disease, and stroke. Exposure to air pollution in urban and rural areas was estimated to cause nearly 3.7 million premature deaths worldwide in Noise pollution, which is unwanted or disturbing sound, also poses human health risks. These risks include stress-related illnesses, high blood pressure, hearing and speech problems, sleep disruption, and lost productivity. Research has shown that repeated exposure to noise pollution can adversely impact health. 55 Lowering the levels of air pollution can result in immediate and long-term benefits to respiratory, cardiovascular, and mental health AIR POLLUTION GENERATED BY BURNING OF TRANSPORTATION FUELS Air pollutants generated by burning transportation fuels include carbon dioxide, nitrous oxides, hydrocarbons, and carbon monoxide. Exposure to these pollutants near major roadways is higher than in other areas at greater distance. These pollutants are linked to increased prevalence of respiratory and cardiovascular illness including asthma, bronchitis, emphysema, pneumonia, and heart disease. 56 Exhibit summarizes four key Criteria Air Contaminants (CACs): CO (carbon monoxide), VOC (volatile organic compounds), HC (hydrocarbons) and NO x (nitrogen oxides). The CACs are calculated as a function of VKT, as provided by the CMAs, using rates developed by the US Environmental Protection Agency. 57 Using data on fuel (diesel and gasoline) sales, 58 conversion factors were used to calculate tonnes of CO 2 emissions. 59 Not surprisingly given the size of their populations, the CMAs of Toronto, Montréal, Vancouver, Calgary and Edmonton show the largest number of tonnes of CO 2 emissions per day from daily diesel sales (Exhibit 10-15). Note that the available data represent retail diesel fuel sales for all vehicle types, including medium- and heavy-duty vehicles U.S. Environmental Protection Agency. Mobile Source Air Toxics Health Effects and Risk. October World Health Organization. Ambient (outdoor) air quality and health, Fact Sheet No March U.S. Environmental Protection Agency. Noise Pollution. July B.C. Air Quality. How vehicle emissions affect us. U.S. Environmental Protection Agency, Average Annual Emissions and Fuel Consumption for Gasoline-Fueled Passenger Cars and Light Trucks, EPA420-F , October Source of fuel data: The Kent Group Ltd., annual retail gasoline and diesel fuel sales. See also Section 5.4. To ensure consistency between diesel and gasoline fuels, CO 2 conversion rates for both fuel types were taken from the same source. See Greenhouse Gas Emissions from a Typical Passenger Vehicle, EPA-420-F a, United States Environmental Protection Agency, Washington, DC, May The rates are kg/litre of gasoline fuel, and kg/litre of diesel fuel (note that both are based on passenger vehicles). The UTI4 report used a CO 2 factor of kg/litre of gasoline fuel, drawn from a Transport Canada source that no longer is available: the EPA and Transport Canada rates are close, and so it is reasonable to use the EPA rate. 156 April 2016
174 Exhibit Daily Criteria Air Contaminants, CO VOC HC NOx Group C Group B Group A Ottawa-Gatineau Vancouver Toronto Toronto Toronto (CSD) Vancouver Vancouver (CSD) Surrey (CSD) Burnaby (CSD) Ottawa-Gatineau Ottawa (CSD) Gatineau (CSD) Calgary Winnipeg Kitchener-Cambridge-Waterloo Oshawa , , , , , , , Kg of emissions per day April
175 Exhibit Tonnes of CO 2 emissions per day from daily diesel sales, Group D Group C Group B Group A Toronto Montréal Vancouver Ottawa-Gatineau Calgary Edmonton Québec Winnipeg Hamilton Kitchener-Cambridge-Waterloo London St. Catharines-Niagara Halifax Oshawa Victoria Windsor Saskatoon Regina Sherbrooke St. John's Barrie Kelowna Abbotsford-Mission Greater Sudbury / Grand Sudbury Kingston Saguenay Trois-Rivières Guelph Moncton Brantford Saint John Thunder Bay Peterborough ,000 1,500 2,000 2,500 3,000 Tonnes of CO 2 per day Source of CO 2 conversion rates: Greenhouse Gas Emissions from a Typical Passenger Vehicle, US EPA, May Unlike for diesel where numbers are only available for, tonnes of CO 2 emissions per day from gasoline sales are available for five time periods 1991, 1996,, and (Exhibit 10-16). The trends within a CMA vary between CMAs. Several CMAs show steadily increasing tonnes from 1991 to, and then a decline in (e.g., Toronto, Montréal, London and Windsor); however others show increases across all five time periods. 158 April 2016
176 Exhibit Tonnes of CO 2 emissions per day from daily gasoline sales Group D Group C Group B Group A Toronto Montréal Vancouver Ottawa-Gatineau Calgary Edmonton Québec Winnipeg Hamilton Kitchener-Cambridge-Waterloo London St. Catharines-Niagara Halifax Oshawa Victoria Windsor Saskatoon Regina Sherbrooke St. John's Barrie Kelowna Abbotsford-Mission Greater Sudbury / Grand Sudbury Kingston Saguenay Trois-Rivières Guelph Moncton Brantford Saint John Thunder Bay Peterborough 0 10,000 20,000 30,000 40,000 Tonnes of CO 2 per day Source of CO 2 conversion rates: Greenhouse Gas Emissions from a Typical Passenger Vehicle, US EPA, May April
177 PROXIMITY TO MAJOR ROADS People who live, work, or attend school near major roads 60 are at greater risk of health problems associated with air and noise pollution. Health effects associated with major roads and near-source pollutants pose a disproportionate burden on children and the elderly and include cardiovascular disease, asthma, low birth weight, pre-term birth, impaired lung function and development. 61 Long-term exposure to roadways is associated with increased risk of death from all causes, especially in people with pre-existing cardiovascular conditions. 62 Exhibit below shows the percent of people living, working, or attending school within 100m of a major road. Greater Sudbury / Grand Sudbury has the greatest percent of people living within 100m of a major road (63.5%) while Moncton has the lowest percent (5.9%). Winnipeg has the greatest percent of people working within 100m of a major road (60.6%) while Oshawa and the Gatineau CSD have the lowest percent (9.2% and 9.3%, respectively). Lastly, Kitchener-Cambridge-Waterloo has the greatest percent of people attending school within 100m of a major road (44%) while Moncton has the lowest percent (1.4%) A major road is an arterial, highway or expressway. U.S. Environmental Protection Agency. Too close for comfort? Living near major roads may impact your health. Science Matters Newsletter. June Rosenbloom, JI, Wilker, EH, Mukamal, JK, Schwartz, J, Mittleman MA. Residential proximity to major roadway and 10-year all-cause mortality after myocardial infarction. Circulation. May 2012; 125(18): June April 2016


178 Exhibit Percent of population living, working, or attending school within 100m of a major road Percent of population attending school within 100m of a major road Percent of population working within 100m of a major road Percent of population living within 100m of a major road Group D Group C Group B Group A Montréal Vancouver Ottawa (CSD) Gatineau (CSD) Calgary Québec Winnipeg Kitchener - Cambridge - Waterloo Oshawa Sherbrooke Kelowna Greater Sudbury / Grand Sudbury Saguenay Trois-Rivières Moncton 0% 10% 20% 30% 40% 50% 60% 70% Source: Data supplied by individual CMAs. Moncton 2013; Greater Sudbury / Grand Sudbury ; Kelowna ; Oshawa ; Kitchener-Cambridge-Waterloo ; Winnipeg 2007,, 2013; Calgary ; Ottawa-Gatineau 2013; Vancouver. Partial data available for Greater Sudbury / Grand Sudbury and Saguenay. Unavailable data do not imply zero percent working or attending school within 100m of a major road. Findings for Ottawa-Gatineau are shown separately for each CSD ASTHMA PREVALENCE As shown in Exhibit 10-18, less than 15% of respondents across all CMAs indicate that a health professional diagnosed them with asthma. However, there are measurable differences in asthma prevalence across the 33 CMAs, potentially revealing differences in exposure to air pollution by region. Moncton has the highest percent of respondents indicating that they have asthma (12.8%) while Windsor has the lowest percent (5.8%). CMA Group D has the highest average percent asthma (10%) while Group A has the lowest average percent (7.2%). April

179 Exhibit Percent of respondents with asthma diagnosis, Group D Group C Group B Group A Toronto Montréal Vancouver Ottawa-Gatineau Calgary Edmonton Québec Winnipeg Hamilton Kitchener-Cambridge-Waterloo London St. Catharines-Niagara Halifax Oshawa Victoria Windsor Saskatoon Regina Sherbrooke St. John's Barrie Kelowna Abbotsford-Mission Greater Sudbury / Grand Sudbury Kingston Saguenay Trois-Rivières Guelph Moncton Brantford Saint John Thunder Bay Peterborough 0% 5% 10% 15% Source: Canadian Community Health Survey. The exhibit refers to the population aged 12 and over who reported that they have been diagnosed by a health professional as having asthma. Light blue, dashed findings represent data with a coefficient of variation (CV) from 16.6% to 33.3%. CCHS recommends these findings to be used with caution. The CV indicates the reliability of the estimates in the context of survey data, generally coming from a sample. For more information, see April 2016
180 10.5 COMMUNITY COHESION / SOCIAL NETWORKS / MENTAL HEALTH The built and natural environment can encourage or discourage the interactions that people have with each other and their surroundings. Positive interactions with other people can strengthen peoples sense of belonging and community cohesion, both of which influence physical and mental health. 63 The CCHS asks respondents to rate their own health on a spectrum from poor to excellent. As shown in Exhibit 10-19, over 50% of respondents in every CMA indicate that their health is very good or excellent. Calgary respondents reported the highest percent of very good or excellent health (66.1%) while Moncton respondents reported the lowest percent (52%). CMA Group B has the highest average percent of very good or excellent health ratings (62%) while Group D has the lowest average percent (59.5%). At the other end of the spectrum of self-rated health, less than 20% of respondents across all CMAs rate their health as fair or poor, as shown in Exhibit Moncton has the highest percent of respondents indicating fair or poor health (18.3%) while Québec has the lowest percent (7.6%). CMA Group D has the highest average percent of fair or poor health ratings (12.5%) while CMA Group A has the lowest average percent (10.5%). 63 Dannenberg AL, Jackson RJ, Frumkin H, Schieber RA, Pratt M, Kochtitzky C, Tilson HH. The Impact of Community Design and Land-Use Choices on Public Health: A Scientific Research Agenda. American Journal of Public Health. 2003;93: June April
181 Exhibit Percent of respondents rating their health as very good or excellent, Group D Group C Group B Group A Toronto Montréal Vancouver Ottawa-Gatineau Calgary Edmonton Québec Winnipeg Hamilton Kitchener-Cambridge-Waterloo London St. Catharines-Niagara Halifax Oshawa Victoria Windsor Saskatoon Regina Sherbrooke St. John's Barrie Kelowna Abbotsford-Mission Greater Sudbury / Grand Sudbury Kingston Saguenay Trois-Rivières Guelph Moncton Brantford Saint John Thunder Bay Peterborough 0% 10% 20% 30% 40% 50% 60% 70% Source: Canadian Community Health Survey. The exhibit refers to the population aged 12 and over who reported perceiving their own health status as being either excellent or very good. 164 April 2016

182 Exhibit Percent of respondents rating their health as fair or poor, Group D Group C Group B Group A Toronto Montréal Vancouver Ottawa-Gatineau Calgary Edmonton Québec Winnipeg Hamilton Kitchener-Cambridge-Waterloo London St. Catharines-Niagara Halifax Oshawa Victoria Windsor Saskatoon Regina Sherbrooke St. John's Barrie Kelowna Abbotsford-Mission Greater Sudbury / Grand Sudbury Kingston Saguenay Trois-Rivières Guelph Moncton Brantford Saint John Thunder Bay Peterborough 0% 5% 10% 15% 20% Source: Canadian Community Health Survey. The exhibit refers to the population aged 12 and over who reported perceiving their own health status as being either fair or poor. The CCHS asks respondents to rate their sense of belonging to their local community on a spectrum from very weak to very strong. As shown in Exhibit 10-21, over 50% of respondents across all CMAs indicate that they have a somewhat strong or very strong sense of belonging. Guelph has the highest percent of respondents indicating that they have a somewhat strong or very strong sense of belonging (72.4%) while Québec and Montréal both have the lowest percent (55%). CMA Group D has the highest average percent of respondents indicating that they have a somewhat strong or very strong sense of belonging (67.6%) while Group B has the lowest average percent (60.6%). April
183 Exhibit Percent of respondents with a somewhat strong or very strong sense of belonging to their community, Group D Group C Group B Group A Toronto Montréal Vancouver Ottawa-Gatineau Calgary Edmonton Québec Winnipeg Hamilton Kitchener-Cambridge-Waterloo London St. Catharines-Niagara Halifax Oshawa Victoria Windsor Saskatoon Regina Sherbrooke St. John's Barrie Kelowna Abbotsford-Mission Greater Sudbury / Grand Sudbury Kingston Saguenay Trois-Rivières Guelph Moncton Brantford Saint John Thunder Bay Peterborough 0% 20% 40% 60% 80% Source: Canadian Community Health Survey. The exhibit refers to the population aged 12 and over who reported their sense of belonging to their local community as being very strong or somewhat strong. Research shows a high correlation of sense of community-belonging with physical and mental health. CCHS respondents are also asked to rate their own mental health on a spectrum from poor to excellent. As shown in Exhibit 10-22, over 60% of respondents across all CMAs rate their mental health as very good or excellent. Québec has the highest percent of respondents rating their mental health as very good or excellent (78.8%) while Moncton has the lowest percent (65.3%). CMA Group B has the highest average percent of very good or excellent mental health ratings (73.7%) while Group D has the lowest average percent (69.9%). 166 April 2016
184 Exhibit Percent of respondents with very good or excellent self-reported mental health status, Group D Group C Group B Group A Toronto Montréal Vancouver Ottawa-Gatineau Calgary Edmonton Québec Winnipeg Hamilton Kitchener-Cambridge-Waterloo London St. Catharines-Niagara Halifax Oshawa Victoria Windsor Saskatoon Regina Sherbrooke St. John's Barrie Kelowna Abbotsford-Mission Greater Sudbury / Grand Sudbury Kingston Saguenay Trois-Rivières Guelph Moncton Brantford Saint John Thunder Bay Peterborough 0% 20% 40% 60% 80% Source: Canadian Community Health Survey. The exhibit refers to the population aged 12 and over who reported perceiving their own mental health status as being excellent or very good. As shown in Exhibit 10-23, less than 10% of CCHS respondents across all CMAs rate their own mental health as fair or poor. There is a wide range of findings across CMAs, with Peterborough having the highest percent of respondents rating their mental health as fair or poor (8.7%) and Saguenay having the lowest percent (2.4%). CMA Group B has the lowest average percent of respondents rating their mental health as fair or poor (5.5%) while Group D has the highest average percent (6.6%). April

185 Exhibit Percent of respondents with fair or poor self-reported mental health status, Group D Group C Group B Group A Toronto Montréal Vancouver Ottawa-Gatineau Calgary Edmonton Québec Winnipeg Hamilton Kitchener-Cambridge-Waterloo London St. Catharines-Niagara Halifax Oshawa Victoria Windsor Saskatoon Regina Sherbrooke St. John's Barrie Kelowna Abbotsford-Mission Greater Sudbury / Grand Sudbury Kingston Saguenay Trois-Rivières Guelph Moncton Brantford Saint John Thunder Bay Peterborough 0% 2% 4% 6% 8% 10% Source: Canadian Community Health Survey. The exhibit refers to the population aged 12 and over who reported perceiving their own mental health status as fair or poor. Light blue, dashed findings represent data with a coefficient of variation (CV) from 16.6% to 33.3%. CCHS recommends these findings to be used with caution. The CV indicates the reliability of the estimates in the context of survey data, generally coming from a sample. For more information, see The CCHS asks respondents to rate their life satisfaction on a spectrum from very dissatisfied to very satisfied. As summarized in Exhibit 10-24, nearly 90% of respondents across all CMAs rated their life satisfaction as satisfied or very satisfied. Québec has the highest percent of respondents rating their life satisfaction as satisfied or very satisfied (95.8%) while Kitchener-Cambridge-Waterloo has the lowest percent (89.2%). CMA Group A has the lowest average percent of respondents rating their life satisfaction as satisfied or very satisfied (91.7%) while Group B has the highest average percent (93.1%). 168 April 2016
186 Exhibit Percent of respondents rating their life satisfaction as satisfied or very satisfied, Group D Group C Group B Group A Toronto Montréal Vancouver Ottawa-Gatineau Calgary Edmonton Québec Winnipeg Hamilton Kitchener-Cambridge-Waterloo London St. Catharines-Niagara Halifax Oshawa Victoria Windsor Saskatoon Regina Sherbrooke St. John's Barrie Kelowna Abbotsford-Mission Greater Sudbury / Grand Sudbury Kingston Saguenay Trois-Rivières Guelph Moncton Brantford Saint John Thunder Bay Peterborough 0% 20% 40% 60% 80% 100% Source: Canadian Community Health Survey. The exhibit refers to the population aged 12 and over who reported being satisfied or very satisfied with their life in general. Studies have shown that better access to nature and green space is associated with more physical activity and better physical, mental, and social health. 64,65,66 Green space can support mental health by Lee ACK, Maheswaran R. The health benefits of urban green spaces: a review of the evidence. J Public Health (Oxf). ;33(2): Lachowycz K, Jones AP. Greenspace and obesity: a systematic review of the evidence. Obes Rev. ;12(5):e April
 of a public park. All but two CMAs showed 80% or more, with five at 90% or more.")
187 providing a buffer against the negative impacts of stressful life events. 67 Exhibit shows the results for the nine CMAs that reported the percent of their populations near (400m) of a public park. All but two CMAs showed 80% or more, with five at 90% or more. Calgary reported that 100% of its residents have such close proximity to parks. Exhibit Percent of population living within 400m of a public park that allows passive or active use in a natural, green space Group A Vancouver Ottawa-Gatineau Group D Group C Group B Calgary Winnipeg Kitchener-Cambridge-Waterloo Oshawa Kelowna Greater Sudbury / Grand Sudbury Moncton 0% 10% 20% 30% 40% 50% 60% 70% 80% 90% 100% Source: Data supplied by individual CMAs. Moncton 2013; Greater Sudbury / Grand Sudbury ; Kelowna ; Oshawa 2013; Kitchener-Cambridge-Waterloo ; Winnipeg ; Calgary ; Ottawa-Gatineau 2013; Vancouver HEAT / HEAT ISLANDS As urban areas develop, vegetation and open land are replaced by buildings, roads, and impermeable surfaces. Changes to land cover and the moisture and permeability of surfaces can cause urbanized areas to become warmer than their rural surroundings, creating a heat island of elevated Bratman GN, Hamilton JP, Daily GC. The impacts of nature experience on human cognitive function and mental health. Ann. N. Y. Acad. Sci Feb;1249: van den Berg AE, Maas J, Verheij RA, Groenewegen PP. Green space as a buffer between stressful life events and health. Soc Sci Med. 2010;70(8): June April 2016
, increased emissions and pollution")

188 temperatures. 68 These elevated temperatures can affect health in a variety of ways including heatrelated illness (cramping, exhaustion, heat-stroke, and heat-related mortality), increased emissions and pollution as a result of heightened energy demand, and decreased water quality. 69 Measures of built or impervious areas as a proportion of total land area provide insight about the presence and risk of heat islands across the CMAs. As shown in Exhibit 10-26, there is a wide range of imperviousness across CMAs. When making comparisons is important to note that CMAs used different measurements and definitions for impervious surface and comparisons should be made with caution. For example, Kitchener-Cambridge-Waterloo considers all built areas to be impervious, while Victoria estimates imperviousness from a grid and not an exact area, and Vancouver estimates imperviousness based on census tracts by air photos. Exhibit Impervious (built) area as a proportion of total land area Percent built area in CBD Percent built area in EUA Group A Vancouver Ottawa-Gatineau Group C Group B Calgary Winnipeg Kitchener-Cambridge-Waterloo Oshawa Victoria Source: Data supplied by individual CMAs. 0% 10% 20% 30% 40% 50% 60% 70% 80% 90% 100% Note: CMAs used different measurements and definitions for impervious surface and comparisons should be made with caution. For example, Kitchener-Cambridge-Waterloo considers all built areas to be impervious, while Victoria estimates imperviousness from a grid and not an exact area, and Vancouver estimates imperviousness based on Census Tracts by air photos U.S. Environmental Protection Agency. Basic information: What is an urban heat island? August U.S. Environmental Protection Agency. Heat Island Impacts. August April
189 172 April 2016
190 11. CONCLUSIONS AND POSSIBLE IMPROVEMENTS FOR FUTURE SURVEYS With the fifth survey, the Urban Transportation Indicators survey describes two decades of sustainable travel trends. The UTI5 showed how five key trends have evolved over time and added two new trends, as synopsised in Section 2.2. As these trends have evolved, so has the UTI: each successive version of the UTI has had an increasingly ambitious brief. The UTI5 is no exception, continuing the excellent base provided by its four predecessors. It again covered all 33 CMAs, although with a slightly reduced response rate of 28 CMAs. Like its predecessors, the UTI5 can be considered a success, in several ways. However, the UTI5 differed from its predecessors in that it was subjected to a critical review and rebasing, in order to meet new conditions and emerging needs. The UTI5: Streamlined the sustainability indicators. Rebased the questions to account for critical demographic and workforce trends that are influencing urban travel characteristics. Added an entirely new section that profiles the relationship between health and transportation. The new section also enhances the treatment of air quality. Deployed a convenient web-based survey to gather the data. Provided expanded insight into methods that CMAs could use for their calculations. Enhanced the accessibility and user-friendliness of the series database. Overall, the rebased survey with its new indicators broadens and updates its utility to account for the key factors that influence travel behaviour. The rebasing and streamlining benefited significantly from a best practices comparison of the UTI5 with other sustainability, travel and demographic trends studies from elsewhere in Canada and around the world. Notable among these were the Queen s University analysis of urban densities and new sustainable indicators studies from the Canadian Urban Transit Association and others. The design of the revised UTI5 survey also was informed by consultations among the Project Steering Committee members and with the CMAs. The UTI5 results were strengthened by a more detailed analysis of national Statistics Canada Census and National Household Survey data, as well as new types of data from other cross-country sources: the Canadian Urban Transit Association, the Kent Group Ltd. and the Canadian Community Health Survey. In addition, many CMAs were able to deploy new or updated origin-destination surveys. The Transportation Association of Canada, the Urban Transportation Council, the UTI funding partners and the user community have all recognized the value of this ongoing initiative. Going forward, the rebased and streamlined survey will provide a solid base to analyze well-established topics such as sustainability and emerging topics such as health and changing demographic and economic conditions. With this base, some opportunities for future UTIs are presented below: There is a need to establish more strongly the relationship between travel behaviour and the underlying demographic, workforce and economic factors, and also to monitor how changes in these attributes generate changes in travel behaviour. These factors are expressed by such April
191 attributes as age, gender, worker occupation and vehicle availability. Future analytical research should be considered, to build on the reporting and profiling of the trends that the UTI provides. The need for a more robust understanding of these relationships was established clearly in the best practice review of other similar analyses, synopsised in Section 1.2.1: the understanding is critical in allowing urban transportation authorities to identify and deliver new investments and services most effectively and cost-efficiently an issue that is of paramount importance in an era of continued fiscal constraints. The new health and transportation indicators similarly provide a basis that relates human health, transportation choices, air quality and the built environment. These relationships are becoming increasingly topical in urban transportation plans, hence their inclusion in the UTI5. With these benchmarks now established, future UTIs should continue to analyze these relationships in greater depth. The new indicators and the broadened understanding of relationships positions future UTI surveys to address essential questions, which will continue to evolve. The rebasing of the UTI5 reinforced the unique aspects of the UTI series: this in turn promotes complementarity with other analyses, so as to broaden the understanding of critical outcomes while avoiding a duplication of efforts. For example, the Queen s University analysis of densities and the UTI both use the Census and NHS data in many complementary ways. Both provide an improved understanding of how urban areas work and what their needs are in the face of evolving populations, economies and urban form. Future UTI surveys should be reviewed periodically, to ensure they continue to provide unique perspectives on travel behaviour, and continue to complement other initiatives. In this vein, all indicators that are developed by the CMAs, both old and new, should be reviewed preparatory to each UTI, in order to ensure their relevance to current needs as well as the ability for CMAs to develop the data. This keeps the UTI current while acknowledging the ongoing need to reduce the response burden and the resources that CMAs must engage when they participate in the UTI. Scoping the next UTI could benefit from a brief post-uti5 survey of CMAs now, asking them to comment on the ease with which data were prepared. Chapter 9 has of this report has reworked questions about transportation funding and investment into economic performance. As with all the other indicators in this report, the data refer to a single year in this case,. However, many capital investments and decisions cover more than one year, and these can vary considerably year-to-year. As a result, it can be difficult to isolate the expenditures of a single year. Accordingly, future UTIs might consider utilizing five-year capital investments instead of those for a single year (i.e., the five-year interval between UTIs), perhaps calculating an average annual expenditure over the five-year period. This would also provide a continuous examination of transit investment, as described in Section Consideration should be given to focusing on national data sources, complemented by data from the CMAs. The review of other studies established that national data sources are the only effective basis for measuring trends and conditions on a uniform basis. Much of this basis has now been established in the UTI5, expanding on previous UTI surveys. The use of this basis in future UTI surveys would reduce the response burden by CMAs, perhaps thereby allowing the CMA survey to focus on a smaller number of key indicators and enable other topics be treated 174 April 2016
192 anecdotally for illustration. This is an approach that other sustainable indicators surveys are now using, the idea being to build the knowledge base while recognizing that many respondents do not have all the necessary data, do not share common definitions for the data, or use different methods for calculating the information. At the same time, a reliance on only national data sources can be an obstacle to adding new measures, such as those related to transportation behaviour and health that are included in this UTI survey for the first time. Not all CMAs were able to provide their data for all these measures. However, inclusion of them in the UTI5 allows the funding partners of future UTI surveys to consider their value, which may result in more complete reporting next time, and perhaps an effort to include them in a national data source as well. April
193 176 April 2016
194 Appendix A Other Survey Contributors April
195 178 April 2016
196 OTHER SURVEY CONTRIBUTORS In addition to the municipal partners and technical contacts listed at the beginning of the report, the individuals listed below were identified as contributors to the survey. Their contributions and participation are gratefully acknowledged. CMA Barrie Edmonton Greater Sudbury / Grand Sudbury Guelph Halifax Hamilton Kelowna Kitchener-Cambridge-Waterloo London Moncton Oshawa Contributor Ralph Scheunemann (City of Barrie) Richard Forward (City of Barrie) Rhonda Toohey (City of Edmonton) Arun Bhowmick (City of Edmonton) David Shelsted (City of Greater Sudbury / Grand Sudbury) Joe Rocca (City of Greater Sudbury / Grand Sudbury) David Grieve (City of Greater Sudbury / Grand Sudbury) Jennifer Babin-Fenske (City of Greater Sudbury / Grand Sudbury) Krista Carre (City of Greater Sudbury / Grand Sudbury) Jason Ferrigan (City of Greater Sudbury / Grand Sudbury) Gloria Kindrat (City of Greater Sudbury / Grand Sudbury) Robert Gauthier (City of Greater Sudbury / Grand Sudbury) Rajan Philips (formerly with the City of Guelph) Jennifer Juste (City of Guelph) Dean McMillan (Guelph Transit) David McCusker (Halifax Regional Municipality) Ken Reashor (Halifax Regional Municipality Alan Kirkpatrick (City of Hamilton) Ron Gallo (City of Hamilton) Lorissa Skrypniak (City of Hamilton) Ron Westlake (City of Kelowna) Moudud Hasan (City of Kelowna) Acuere Consulting John Cicuttin (Regional Municipality of Waterloo) Tabot Eneme (Regional Municipality of Waterloo) Gregg Barret (City of London) John Paul Sousa (City of London) Rhys Wolff (HDR) Ranjit Gill (City of Oshawa) April
197 CMA Ottawa-Gatineau Saint John Saskatoon St. John s St. Catharines Niagara Toronto Windsor Winnipeg Contributor Paul Ralph (City of Oshawa) John Moser (City of Ottawa) Kornel Mucsi (City of Ottawa) Steven Boyle (City of Ottawa) Robert Grimwood (City of Ottawa) Joanne Farnand (City of Ottawa) Marie-Claude Martel (Ville de Gatineau) Renée Roberge (Ville de Gatineau) William Edwards (City of Saint John) Mark Reade (City of Saint John) David Leboutillier (City of Saskatoon) Marina Melchiorre (City of Saskatoon) Brendan O Connell (City of St. John s) Phil Bergen (formerly with the Regional Municipality of Niagara) Greg Bowie (Regional Municipality of Niagara) Mike Wehkind (City of Toronto) David Cooper (City of Toronto) Sabbir Saiyed (Regional Municipality of Peel) Lisa Salsberg (Metroliinx) Josette Eugeni (City of Windsor) Brad Sacher (City of Winnipeg) David Tang (City of Winnipeg) Sean Madden (City of Winnipeg) David Patman (Winnipeg Transit) Susanne Dewey Povoledo (City of Winnipeg) Kevin Nixon (City of Winnipeg) Luis Escobar (City of Winnipeg) 180 April 2016
198 Appendix B Survey Questionnaire April
199 Urban Transportation Indicators - Survey #5 LOGIN Welcome to the Fifth Urban Transportation Indicators (UTI) Survey. Please enter your access code to enter the online survey. 18/04/2016 Survey Questionnaire - CMA Login
200 Urban Transportation Indicators - Survey #5 Contributor Sign-In We understand that the completion of this survey may involve many individuals. In order to help ensure the integrity of the data provided, we ask that you sign in as a contributor for your region each time you visit the survey. If you are already registered as a contributor, please select your name from the list below. If you have not yet registered, please click the "Add Contributor" button to register. Name Agency Position Phone Role in Survey 18/04/2016 Survey Questionnaire - Contributor
201 Urban Transportation Indicators - Survey #5 Survey Overview and General Instructions Survey Overview The Fifth Urban Transportation Indicators (UTI) Survey performed by the Transportation Association of Canada (TAC) tracks sustainable transportation performance measures over time for urban areas across Canada. The current survey is intended to reflect conditions, corresponding to the most recent Census. The 33 Census Metropolitan Areas from across Canada have been asked to complete the survey. Survey Instructions The survey consists of SEVEN sections which correspond to the Indicator Groups established for the UTI Survey. You may use the tabs at the top of each page to navigate among these sections. Survey Geographic Areas Three geographic areas are considered in this survey: Region: Defined as the Census Metropolitan Area (CMA) (as defined in the Census) Existing Urban Area (EUA): Representing the current built-up area within the Region Central Business District (CBD): Representing the pre-eminent employment centre for the urban area The Region, EUA and CBD have been pre-defined by TAC and are shown on the Background tab. The first step in the survey is to confirm the boundaries of the geographic areas for your CMA as shown on the Background tab. Please review and confirm these boundaries no later than July 16, Instructions for Responding for Multiple Municipalities In some cases respondents will be required to answer for several municipalities making up an urban area. If this is the case for your urban area, please use your judgement to provide an answer that would be most representative to all the municipalities inside the EUA combined. Survey Submission Please complete the online version of the survey and submit it by August 29, Sub-CMA reporting [only for Montreal, Ottawa-Gatineau, Toronto, Vancouver - all other CMAs should have a button to proceed directly to the CMA survey] In addition to providing data for the entire Census Metropolitan Area, you are also asked to provide some data for the major Census Subdivisions/Census Divisions within your CMA. Please use the links below to choose whether you would like to enter data for the entire CMA or for one of the Census Subdivisions / Census Divisions listed below: 18/04/2016 Survey Questionnaire - Intro
202 Urban Transportation Indicators - Survey #5 UTI Survey #5 is being adminstered on behalf of TAC by David Kriger Consultants Inc., in association with R.A. Malatest & Associates Ltd., Urban Design 4 Health Ltd. and Alan Pisarski. Should you have any questions regarding the survey, please do not hesitate to contact us. David Kriger (david@davidkriger.com) Erhan Baydar (e.baydar@malatest.com or ext. 416) 18/04/2016 Survey Questionnaire - Intro
203 Urban Transportation Indicators - Survey #5 Overview 1 Background The Background Section of the UTI Survey defines the boundaries of the various geographies used in the UTI 5 Survey along with basic demographic information for these geographies. Geographies The first step of the survey is to review and confirm the boundaries presented in the map below. You may also download a zip file containing shapefiles with the boundaries of each geography. Please confirm that the boundaries are correct before proceeding with the subsequent sections of the survey. CMA - the boundary of your Census Metroplitan Area according to the Census EUA - the boundary of your Existing Urban Area - defined as those Census Tracts in which more than 33% of the land area is classified as Urbanized by Statistics Canada. For some CMAs, there may be one or more discontinuous areas (generally smaller outlying communities) which meet the criteria of 33% urbanized. You may decide whether or not you wish to include some or all of these outlying areas within your EUA definition. CBD - the boundary of your Central Business District (the area or areas within the CMA with the highest concentration of employment) as was used in the 4th UTI Survey - Please review this boundary and describe any modifications in the box below. If modifications are noted, please also provide a GIS shapefile with the new boundary. Note: if the boundary of your CBD does not align with the boundary of one or more Census Tracts, you will also be required to provide the population, labour force, and employment figures for the CBD geography. [INSERT MAP OF CMA HERE] GEOGRAPHY 1.1 EUA Geography. (a) The EUA geography in the map provided is correct. Yes No Explain (b) [if EUA contains discontinuous areas] I wish to exclude some or all of the discontinuous outlying areas from the EUA geography. Please identify (by census tract ID) which specific census tracts to exclude from the EUA. 1.2 CBD Geography (a) The CBD geography in the map provided is correct [if CBD boundaries do not align with census tract boundaries] and I will provide the demographic information for the CBD below. Yes No Census Tract(s) to exclude Yes No Explain any required changes to the CBD boundary. You may also upload a new boundary shapefile. 18/04/2016 Survey Questionnaire - Background 5 of 20
204 Urban Transportation Indicators - Survey #5 URBAN STRUCTURE YOUR AREA DATA YEAR REMARKS (SOURCES) 1.3 Residential population (a) CMA population CMA Statistics Canada (b) EUA population EUA Statistics Canada (c) CBD population CBD Note: If the boundary of your CBD aligns exactly with the boundary of one or more Census Tracts from the Census, the population can be obtained from the Census and you are not required to provide it here. 1.4 Labour force (working population) (a) CMA labour force CMA Statistics Canada (b) EUA labour force EUA Statistics Canada (c) CBD labour force CBD Note: If the boundary of your CBD aligns exactly with the boundary of one or more Census Tracts from the Census, the labour force can be obtained from the National Household Survey and you are not required to provide it here. 1.5 Total employment (jobs) (a) CMA employment CMA Statistics Canada (b) EUA employment EUA Statistics Canada (c) CBD employment CBD Note: If the boundary of your CBD aligns exactly with the boundary of one or more Census Tracts from the Census, the employment can be obtained from the National Household Survey and you are not required to provide it here. 1.6 Land area (sq.km.) (a) CMA land area CMA Statistics Canada (b) EUA land area EUA Statistics Canada (c) CBD land area CBD Note: If the boundary of your CBD aligns exactly with the boundary of one or more Census Tracts from the Census or if you upload a GIS shapefile containing the boundary of the CBD, you do not need to provide the land area here. 18/04/2016 Survey Questionnaire - Background 6 of 20
205 Urban Transportation Indicators - Survey #5 2 Land Use and Transportation Initiatives Adopted by CMAs Overview This section deals with the status of land use and transportation initiatives inside the Existing Urban Area (EUA). The section lists various initiatives grouped into 12 categories. For each initiative, respondents are asked to indicate the level of implementation within their EUA. Following each category, space is provided for respondents to indicate examples of initiatives that are considered to be representative of key examples of progress or 'best practices' within the EUA. This is not intended to be comprehensive, but rather an opportunity for municipalities to showcase initiatives, which may be included in the final survey report. As noted in the instructions, if the area you are dealing with consists of several municipalities, then use your judgement to provide an answer that would be most representative to the majority of municipalities inside the EUA. For example, if only one municipality out of several has fully implemented the initiative, you would check "Implementing in specific cases or areas." 2.1 URBAN STRUCTURE / LAND USE (a) Long-term, integrated municipal or regional land-use/transportation plan (b) Density targets for mixed-use centres/nodes (c) Limiting urban development within designated urban boundaries (d) Incentives/special policies for brownfield development (e) Taxation and/or other incentives for compact, mixed-use development (f) Other (please describe) Comments or examples: check which box applies most (one box only in each row) Not Applicable Low Not a priority at present Studying the issue Have adopted policies/ guidelines Implementing pilot project(s) Level of Deployment Implementing in specific case(s) or area(s) Implementing throughout EUA High 2.2 URBAN DESIGN (a) Transit-supportive site design guidelines or policies (b) Cycling-supportive streetscaping (c) Pedestrian-supportive streetscaping (d) Traffic calming (e) Other (please describe) Comments or examples: check which box applies most (one box only in each row) 2.3 WALKING (a) Pedestrian plan (b) Mid-block pedestrian crossings in areas of high pedestrian activity (c) Pedestrian-friendly intersection design (d) Clearing of snow and ice from sidewalks (e) Municipal participation on pedestrian advisory/awareness committees (f) Other (please describe) Comments or examples: check which box applies most (one box only in each row) 18/04/2016 Survey Questionnaire - Land Use & Transp Init 7 of 20
206 Urban Transportation Indicators - Survey #5 2.4 CYCLING (a) Cycling plan with proposed cycling network (b) Municipal bike parking program (c) Municipal participation on cycling advisory/awareness committees check which box applies most (one box only in each row) Not Applicable Low Not a priority at present Studying the issue Have adopted policies/ guidelines Implementing pilot project(s) Level of Deployment Implementing in specific case(s) or area(s) Implementing throughout EUA High (d) Zoning by-laws require end of trip cycling facilities (bike parking, showers, etc.) in new development (e) Bike sharing programs (f) Delivery of/support for cycling skills training (g) Other (please describe) Comments or examples: 2.5 TRANSIT check which box applies most (one box only in each row) (a) Transit priority by means of HOV or reserved bus lanes (b) Other transit priority measures (c) Bike'n'ride facilities (d) Inter-municipal service coordination (e) Inter-municipal fare coordination (e.g., regional smart-card) (f) Integration of urban transit with inter-city services (e.g., intermodal transit station) (g) University/college student transit pass program (e.g., U-Pass) (h) Bulk purchase transit discount program (e.g., employer transit discount) (i) Web-based trip planning information (j) Real-time transit arrival information (k) Other (please describe) Comments or examples: 2.6 PARKING (a) Parking standards related to local conditions (e.g., level/ proximity of transit service, walkability of area, etc.) (b) Encouragement of shared parking arrangements (c) Maximum parking standards (d) Pricing to discourage use of public parking lots by commuters (e) Tax or other measure to discourage use of private lots by commuters (f) Other (please describe) Comments or examples: check which box applies most (one box only in each row) 18/04/2016 Survey Questionnaire - Land Use & Transp Init 8 of 20
207 Urban Transportation Indicators - Survey #5 2.7 ROAD SYSTEM OPTIMIZATION check which box applies most (one box only in each row) Not Applicable Not a priority at present Studying the issue Have adopted policies/ guidelines Implementing pilot project(s) Implementing in specific case(s) or area(s) Implementing throughout EUA (a) Transportation/traffic impact studies must consider all modes of transportation (e.g. Complete Streets approach) (b) HOV lanes (c) Carpool parking lots (d) Transportation systems management program (e) Master plan identifies intersections requiring improvement (f) Real-time traffic signal control and coordinated signal timing (g) Incident management system (h) Other (please describe) Low Level of Deployment High Comments or examples: 2.8 GOODS MOVEMENT (a) Goods movement strategy (stand-alone or part of transportation master plan) (b) Freight Council / Task Force made up of public / private goods movement stakeholders (c) Freight-friendly land use plans, regulations and zoning (d) Courier-friendly urban design and site planning (e) Strategic goods movement network or permitted / restricted truck route designations (f) Existence of intermodal freight terminals and/or freight consolidation terminals (g) Economic development strategy (h) Other (please describe) check which box applies most (one box only in each row) Comments or examples: 2.9 SPECIAL USER NEEDS (a) Transit vehicles accessible to persons with disabilities (b) Transit stations/stops accessible to persons with disabilities (c) Paratransit to supplement regular transit for special needs (d) Curb cuts/ramps at designated pedestrian crossing points (e) Mobility disabled parking requirements (f) Treatments for disabled travellers (e.g., audible pedestrian signals, textured pavements, etc.) check which box applies most (one box only in each row) (g) Other (please describe) Comments or examples: 18/04/2016 Survey Questionnaire - Land Use & Transp Init 9 of 20
208 Urban Transportation Indicators - Survey # ENERGY AND EMISSIONS check which box applies most (one box only in each row) Not Applicable Not a priority at present Studying the issue Have adopted policies/ guidelines Implementing pilot project(s) Implementing in specific case(s) or area(s) Implementing throughout EUA (a) Alternative fuels/high efficiency vehicles for municipal fleets (b) Alternative fuels/high efficiency vehicles for transit vehicles (c) Infrastructure for alternative fuels (e.g., fuel / recharge stations) (d) Mandatory / voluntary emissions control strategies, including vehicle inspection and maintenance programs (e) Established target for air pollutant reduction (f) Other (please describe) Low Level of Deployment High Comments or examples: 2.11 TRANSPORTATION DEMAND MANAGEMENT (TDM), INCLUDING ROAD PRICING (a) Regional/municipal TDM strategy (b) Road pricing initiatives (e.g. tolls, HOT lanes, cordon pricing, parking surcharges, etc.) (c) Pilot / demonstration programs (d) Awareness and education / outreach programs (e) TDM services delivered to/by workplaces (f) TDM services delivered to/by schools (e.g., walk/bike to school programs) (g) Carpool ridematching services (h) Support for private or non-profit car sharing services (i) Other (please describe) check which box applies most (one box only in each row) Comments or examples: 2.12 GHG REDUCTION INITIATIVES (a) Established target for GHG reduction (b) Climate Change mitigation plan or strategy (c) Climate Change adaptation plan or strategy (d) Other (please describe) check which box applies most (one box only in each row) Comments or examples: 18/04/2016 Survey Questionnaire - Land Use & Transp Init 10 of 20
209 Urban Transportation Indicators - Survey #5 Overview 3 Transportation Supply The Transportation Supply of the UTI Survey deals with data on the supply or transportation infrastructure within the CMA. In all cases, data for are requested. If data for are not available for some questions, please provide data for the next closest year, indicating the year of data in the column provided. DEFINITIONS AND DATA AVAILABILITY How does your area differentiate between multi-lane highways/expressways and arterial roads? TRANSPORTATION SUPPLY 3.1 Roadway lane-kilometres EUA Note: If lane-kilometres cannot be determined for these categories, please report the closest available data and provide a description in the column provided. YOUR AREA DATA YEAR REMARKS (SOURCES) (a) Local road lane-km (b) Collector road lane-km (c) Arterial (or regional) lane-km (d) Highway/expressway lane-km (non-hov) (e) HOV lane-km (incl. exclusive/reserved transit lanes) (f) Total road lane-km (report only if unable to provide subtotals for each road type; if providing only a total, please indicate which road types are included in the total) 3.2 Kilometres of rapid transit infrastructure EUA Note: Measured by the length of the line, not route-km or lane-km (a) Transitway/right of way (km) (b) Metro/subway/advanced guideway transit (km) (c) Commuter Rail (km) 3.3 Kilometres of walking and cycling infrastructure EUA (a) Dedicated, on-street bike lanes and cycle tracks route-km) (b) Marked on-street shared bike route route-km) (c) Marked off-street facilities (route-km) (d) Sidewalks (km) 3.4 Designated park-and -ride spaces EUA CBD parking spaces CBD (a) Publicly owned on-street (available for use by public) (b) Publicly owned off-street (available for use by public) (c) Maximum cost of one hour of parking (on-street) (d) Maximum cost of monthly permit parking (off-street) 18/04/2016 Survey Questionnaire - Transp Supply 11 of 20
210 Urban Transportation Indicators - Survey #5 Overview 4 Transportation Demand The Transportation Demand section of the UTI Survey deals with data on mode shares and other transportation indicators which are usually obtained through conducting an Origin-Destination type of survey. If your CMA has conducted such a survey, please ensure you provide detailed meta-data about the survey to help ensure that the transportation demand data is presented consistently across all CMAs. If your CMA does not regularly conduct travel surveys, or if you feel that the data from a travel survey do not reflect conditions, you may use other sources to provide the requested data. If this is the case, please explain the source of the data in as much detail as possible. DEFINITIONS AND DATA AVAILABILITY Has your region conducted a travel origin-destination survey? If yes, please provide the year and time of year in which the survey was conducted (e.g. typical Fall workday). Y/N Year Time of Year Please select the option(s) which best describes the mode of survey administration [check all that apply]. Telephone recall Describe Survey Online trip diary Mail out trip diary with telephone retrieval Mail out trip diary with online retrieval Mail out / mail back trip diary Other (please describe) Please provide any other relevant information about how the origin destination survey was conducted Origin Destination Survey Parameters: For each of the following parameters, the preferred definition is presented at right. If your O-D survey uses a different definition of a trip, please specify any differences in the right hand column Preferred Include all trips that have an origin and/or a destination within Origin / Destination within CMA: the CMA. Trips that start or end outside the CMA would be included, so long as one end of the trip is within the CMA. Minum Ages surveyed 5 years of age Multiple modes of transportation Multi-modal trips allowed per trip (e.g., park and ride) Your CMA Does your region have a transportation demand model? If yes, please provide the base year and time period covered by the model. Y/N Base Year Time Period Please describe your model (if available). (e.g. modes included, data used to develop the model, etc.) In your responses below, what is the time period defined for the AM peak period: the PM peak period: (e.g. 6:00 AM - 8:59 AM) (e.g. 3:00 PM - 5:59 PM) What information does your region collect on commercial vehicle movements? (e.g. road truck counts, O-D survey, roadside surveys, etc.) 18/04/2016 Survey Questionnaire - Transp Demand 12 of 20
211 Urban Transportation Indicators - Survey #5 TRANSPORTATION SYSTEM USE Mode Shares TO Central Business District YOUR AREA DATA YEAR REMARKS (SOURCES) Note: Modal shares are for trips destined to the CBD (including those originating within the CBD). Do not include trips passing through the CBD. 4.1 AM peak period modal shares TO CBD [%] (a) -Private vehicle driver CBD (b) -Private vehicle passenger (c) -Transit (all transit modes, including paratransit) (d) -Cycle (e) -Walk (f) -Other (taxi, motorcycle, school bus etc.) 4.2 Auto occupancy for AM peak period trips CBD 4.3 Total number of AM peak period trips CBD hour modal shares TO CBD [%] (a) -Private vehicle driver CBD (b) -Private vehicle passenger (c) -Transit (all transit modes, including paratransit) (d) -Cycle (e) -Walk (f) -Other (taxi, motorcycle, school bus etc.) 4.5 Total number of trips in 24-hour period CBD 100% 100% 18/04/2016 Survey Questionnaire - Transp Demand 13 of 20
212 Urban Transportation Indicators - Survey #5 TRANSPORTATION SYSTEM USE Mode Shares for EUA Note: Modal shares are for trips to, from, and within the EUA (I.e. includes trips within the EUA). If unable to provide a breakdown by age cohort for the 24 hour mode share, report for all age cohorts combined. 4.6 AM peak period modal shares (a) -Private vehicle driver EUA (b) -Private vehicle passenger (c) -Transit (all transit modes, including paratransit) (d) -Cycle (e) -Walk (f) -Other (taxi, motorcycle, school bus etc.) 4.7 Auto occupancy for AM peak period trips EUA 4.8 Total AM Peak Period Trips in EUA EUA hour modal shares (ages 0-19) (a) -Private vehicle driver EUA (b) -Private vehicle passenger (c) -Transit (all transit modes, including paratransit) (d) -Cycle (e) -Walk (f) -Other (taxi, motorcycle, school bus etc.) 4.10 Auto occupany - 24 hour trips ages 0-19 EUA 4.11 Total 24-hour Trips in EUA (ages 0-19) EUA hour modal shares (ages 20-64) (a) -Private vehicle driver EUA (b) -Private vehicle passenger (c) -Transit (all transit modes, including paratransit) (d) -Cycle (e) -Walk (f) -Other (taxi, motorcycle, school bus etc.) 4.13 Auto occupany - 24 hour trips ages EUA 4.14 Total 24-hour Trips in EUA (ages 20-64) EUA hour modal shares (ages 65+) (a) -Private vehicle driver EUA (b) -Private vehicle passenger (c) -Transit (all transit modes, including paratransit) (d) -Cycle (e) -Walk (f) -Other (taxi, motorcycle, school bus etc.) 4.16 Auto occupany - 24 hour trips ages Total 24-hour Trips in EUA (ages 65+) 4.18 Transit use EUA Note: To be consistent with CUTA statistics, one ride represents a trip using a single transit operator. Trips that transfer between transit operators should be counted as multiple trips. (a) Annual transit riders (excludes school buses) (b) Riders on a typical weekday 4.19 Vehicle Kilometres Travelled - 24 hour total for all road types and all vehicle EUA Note: Vehicle-km can be calculated using one of the following two methods (see Vehicle Kilometres-Travelled Canadian Methodology (City of Calgary / CITE, 2012): a) Traffic counts: product of counted volume and road segment length, summed for all segments having counts b) Travel model: product of simulated volume and road segment (link) length, summed over all links Please specify which of these methods is used to obtain the data provided and which vehicle types are included. YOUR AREA DATA YEAR REMARKS (SOURCES) 100% 100% 100% 100% 18/04/2016 Survey Questionnaire - Transp Demand 14 of 20
213 Urban Transportation Indicators - Survey #5 Overview 5 Transportation System Performance Most of the data for the Transportation System Performance section of the UTI Survey will be obtained from higher level sources such as the National Household Survey and fuel market data. As the median commute distance may not be available from Statistics Canada for the EUA geography, please provide it if this value can be calculated from existing sources (e.g. an Origin-Destination survey) TRANSPORTATION SYSTEM YOUR PERFORMANCE AREA DATA YEAR REMARKS (SOURCES) (a) Median commute trip distance (straight line distance in km 5.1 between residence and place of work) for EUA EUA (b) Median commute trip distance (straight line distance in km between residence and place of work) for CMA CMA Statistics Canada 18/04/2016 Survey Questionnaire - Transp System Performance 15 of 20
214 Urban Transportation Indicators - Survey #5 Overview 6 Economic Performance The Economic Performance section of the UTI Survey contains questions about revenue sources and expenditures for your transportation system. In all cases, data for are requested. If data for are not available for some questions, please provide data for the next closest year, indicating the year of data in the column provided. If the area you are dealing with consists of several municipalities, then use your judgement to provide an answer that would be representative to the majority of municipalities inside the EUA combined. ECONOMIC PERFORMANCE 6.1 Which of the following revenue sources does your area utilize to finance (directly or indirectly) transportation system improvements and how is it applied? (a) Federal / Provincial transfers / grants (e.g., recurring / ongoing Federal or Provincial contribution, one-time Federal or Provincial grants) Include funds related to parts of the network operated by a provincial or a national government. (b) User fees / parking taxes / surcharges (e.g., parking surcharge, tax on private parking revenues / facilities, transit fares, road pricing [including tolls], designated fuel tax, vehicle registration tax) (c) Local taxes / surcharges (e.g., municipal property tax, municipally- / regionally-levied tax on fuel emissions) (d) Development levies / cost recovery (e.g., benefit-sharing levy on development, frontage levy on development, cost recovery for new development) Utilized? Being Considered Not Utilized (e) Private funding sources (e.g., public-private partnerships for the provision of transportation infrastructure, services, operations and maintenance, rehabilitation, etc.) (f) Other (please describe) 6.2 If you identified 'Private funding' as a source of funding in the previous question (response 'e'), approximately what percent of total transportation % funding do private sources actually represent? YOUR AREA DATA YEAR REMARKS (SOURCES) 6.3 Total Transportation Expenditures Note: Total includes all urban transportation systems including transit. Report costs (not subsidies) and expenditures (not transfers). Please elaborate on what is included and how the figures are calculated. (a) Annual Municipal/Regional transportation capital budget (b) Annual Municipal/Regional transportation operating & maintenance budget CMA 6.4 Transit Expenditures (a) Annual transit capital budget (b) Annual transit operating & maintenance budget 6.5 Gross Domestic Product of CMA CMA CMA 18/04/2016 Survey Questionnaire - Economic Performance 16 of 20
215 Urban Transportation Indicators - Survey #5 Overview 7 Health The Health Section of the UTI Survey contains a number of items which are new to the UTI survey. Many items will require GIS analysis of transportation and other urban infrastructure. Other data may require that an Origin-Destination survey has been conducted in your region. For data on injuries and fatalities, police records may be required as a source. Please provide as much data as feasible. In all cases, data for are requested. If data for are not available for some questions, please provide data for the next closest year, indicating the year of data in the column provided. PHYSICAL ACTIVITY, OBESITY AND RELATED CONDITIONS 7.1 Travel to school (a) % of all 5 to 18 year old (grades K-12) students walking to school (b) % of all 5 to 18 year old (grades K-12) students cycling to school 7.2 Time spent in vehicles (a) Average daily minutes per day, per person spent in car for journey to work YOUR AREA DATA YEAR REMARKS (SOURCES) CMA (b) Average daily minutes per day, per person spent in car for all trip types (c) Average daily minutes per day, per person spent in transit vehicle for journey to work (d) Average daily minutes per day, per person spent in transit vehicle for all trip types CMA 7.3 Proximity to schools (a) % of CMA 5-18 year old (grades K-12) population living within 400m of a school (b) % of CMA 5-18 year old (grades K-12) population living within 1 km of a school (c) % of CMA 5-18 year old (grades K-12) population living within 2 km of a school (d) % of CMA 5-18 year old (grades K-12) population living within 3 km of a school CMA 7.4 Sidewalk coverage % of streets with sidewalks on both sides of the street CMA PEDESTRIAN / CYCLIST SAFETY AND YOUR TRAFFIC ACCIDENTS AREA DATA YEAR REMARKS (SOURCES) 7.5 Annual traffic-related injuries & fatalities EUA Note: If possible, please break down data on fatalities and injuries into separate categories for vehicle occupants, pedestrians, and cyclists. If this is not possible, please provide total fatalities and injuries for your EUA. Please note the source(s) of these data. (a) Vehicle Occupant Fatalities (b) Vehicle Occupant Injuries (c) Pedestrian Fatalities (d) Pedestrian Injuries (e) Cyclist Fatalities (f) Cyclist Injuries (g) Total Fatalities (h) Total Injuries EXPOSURE TO AIR POLLUTION 7.6 Air pollution generated by burning of transportation fuels YOUR AREA DATA YEAR REMARKS (SOURCES) (a) Average tonnes/day of CO 2 generated from burning transportation fuels (b) Average tonnes/day of NO X generated from burning transportation fuels (c) Average tonnes/day of HC generated from burning transportation fuels (d) Average tonnes/day of CO generated from burning transportation fuels 7.7 Exposure to air pollution Note: Major roads include arterial, highway, and expressway (a) % of population living within 100m of a major road (b) % of population working within 100m of a major road (c) % of population attending school within 100m of a major road CMA CMA 18/04/2016 Survey Questionnaire - Health 17 of 20
216 Urban Transportation Indicators - Survey #5 Community Cohesion / Social Networks / Mental Health 7.8 Access to green spaces % of CMA population living within 400m of public park that allows passive or active use in a natural space Heat / Heat Islands 7.9 Built area Note: Provide percentages or provide impervious area and total land area (a) % built area (impervious area) in the EUA (b) % built area (impervious area) in the CBD YOUR AREA DATA YEAR REMARKS (SOURCES) CMA YOUR AREA DATA YEAR REMARKS (SOURCES) EUA CBD 18/04/2016 Survey Questionnaire - Health 18 of 20
217 Urban Transportation Indicators - Survey #5 UPLOAD / DOWNLOAD Please use this tab to upload and/or download any files required for the UTI 5 survey. Download The following files are available for you to download: Upload Region Map - a jpeg image showing the various geographies and census boundaries in your region. This is the map shown on the Background tab GIS boundary files - a zip file containing shapefiles of the CMA, EUA, and CBD boundaries. Please use these to confirm that the boundaries of all these geographies are correct. Census Tract table - an Excel file listing the Census Tracts within your CMA, including an indicator for whether or not each Census Tract falls within the EUA and/or CBD. Please use this page to upload relevant files or supporting documentation. Example of uploads may include: GIS shapefiles for new boundaries for your EUA or CBD (please upload any shapefiles zipped into a.zip file) methodology report for your CMA's Origin-Destination survey list of definitions used by your CMA (e.g., road types) other documents relevant to contextualize or clarify the information you are providing on the UTI survey For each file uploaded, please provide a brief description of the contents of the file. Alternatively, you may submit supporting files directly via to j.moore@malatest.com File upload button Previously uploaded files File 1 Description Delete File 2 Description Delete etc. 18/04/2016 Survey Questionnaire - Upload Download

218 Urban Transportation Indicators - Survey #5 18/04/2016 Survey Questionnaire - Upload Download
219 Appendix C Definition of Geographic Areas April
220 184 April 2016

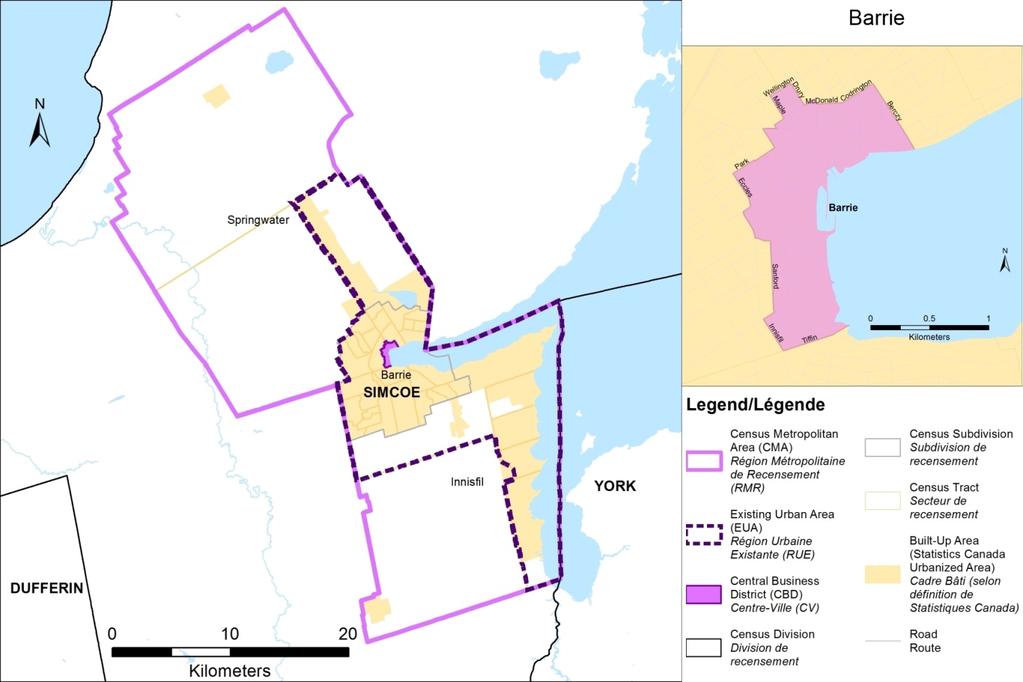
221 April

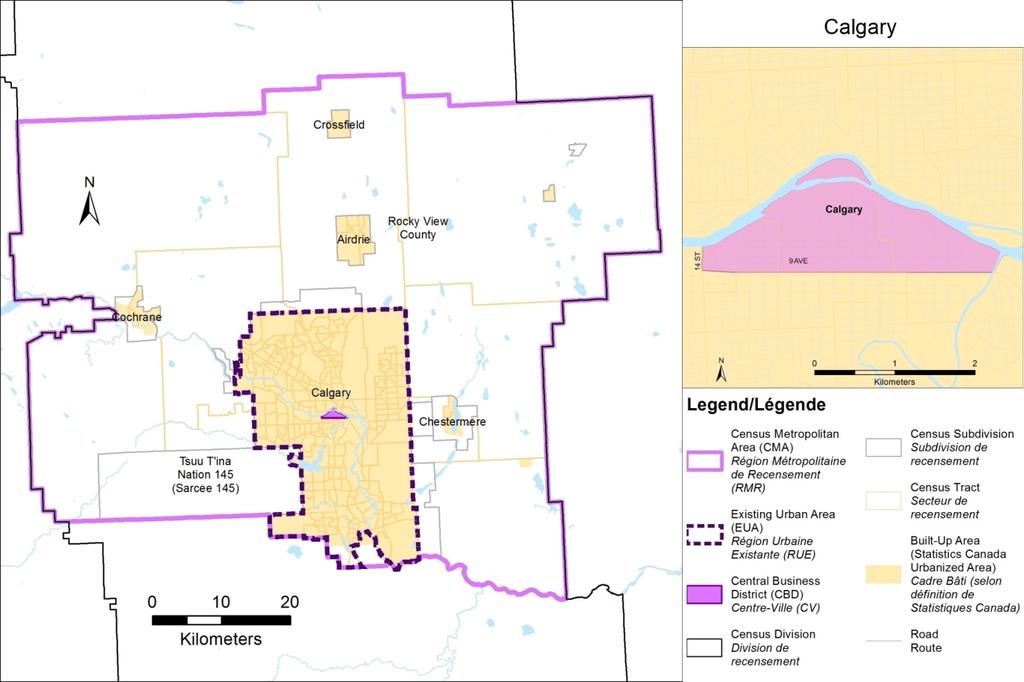
222 186 April 2016

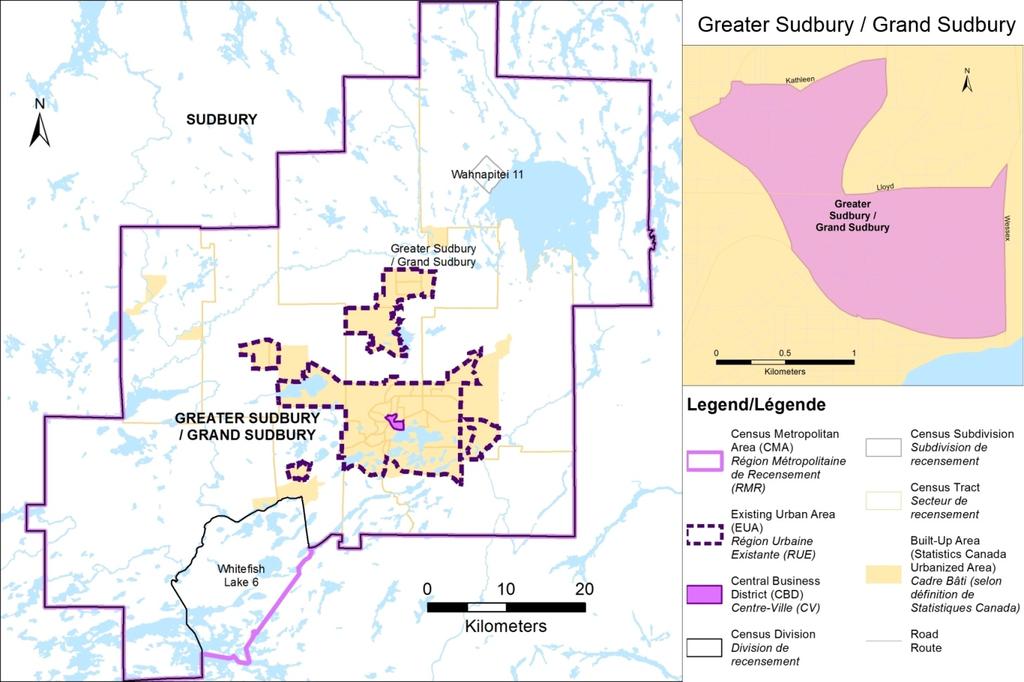
223 April

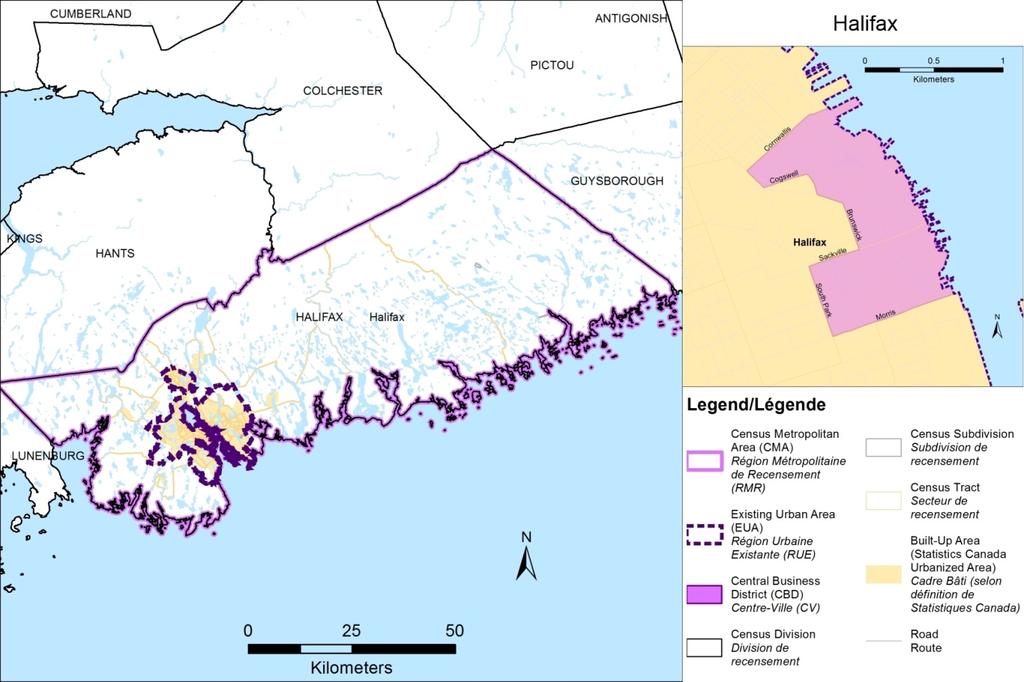
224 188 April 2016

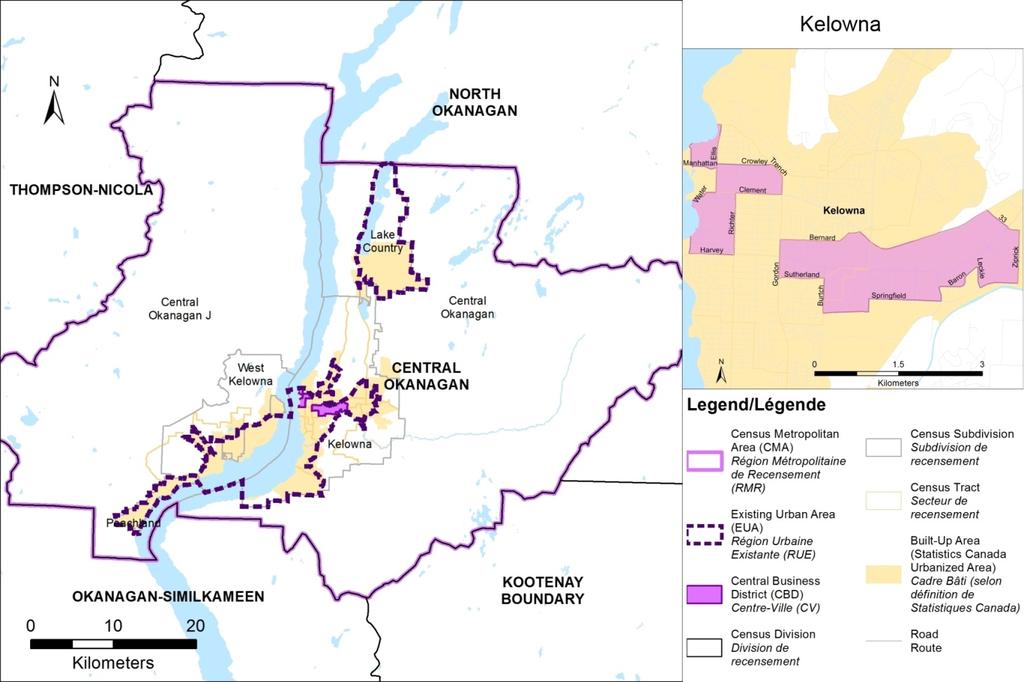
225 April

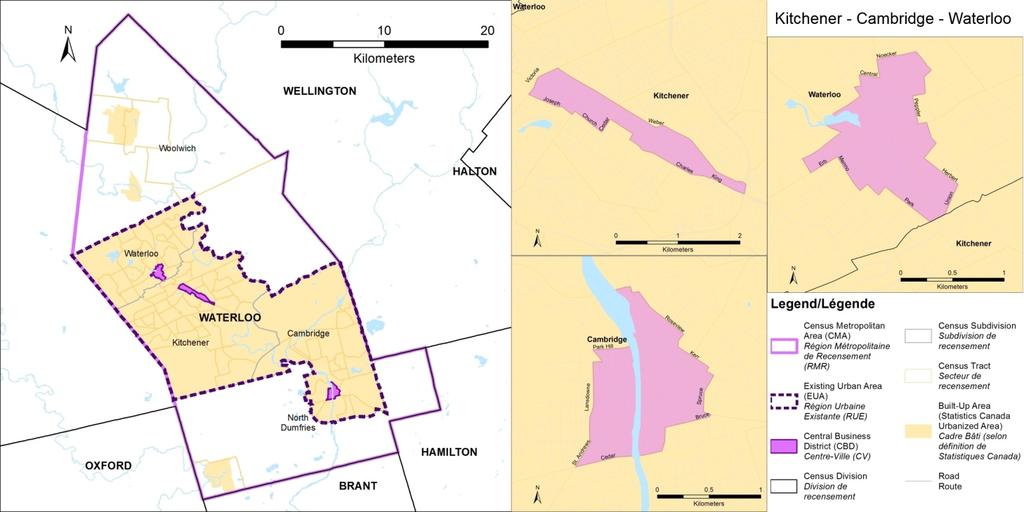
226 190 April 2016

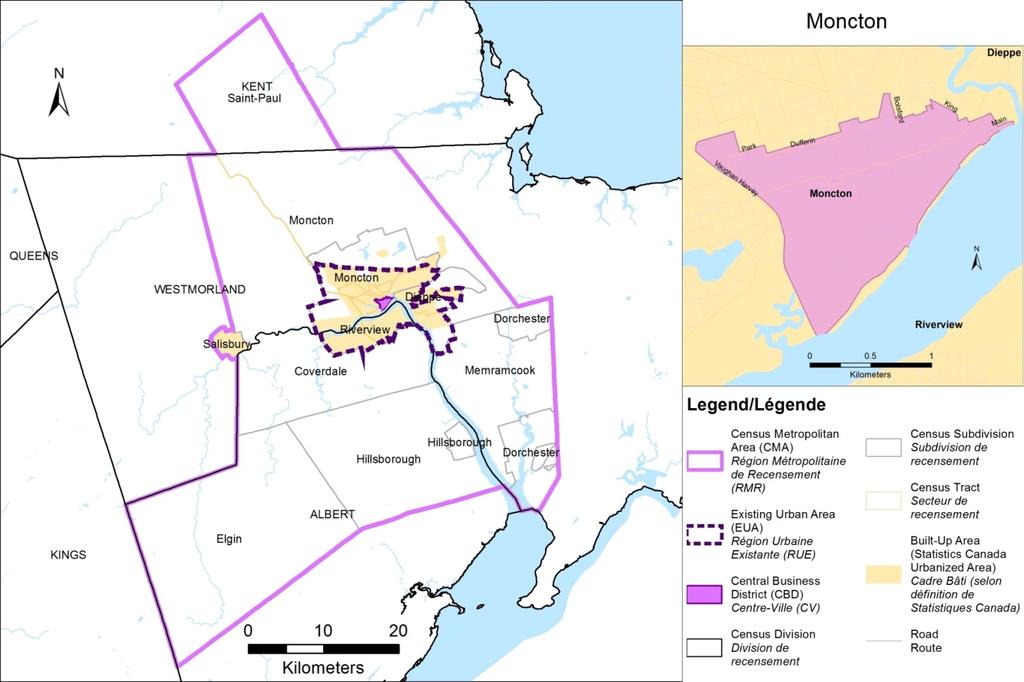
227 April

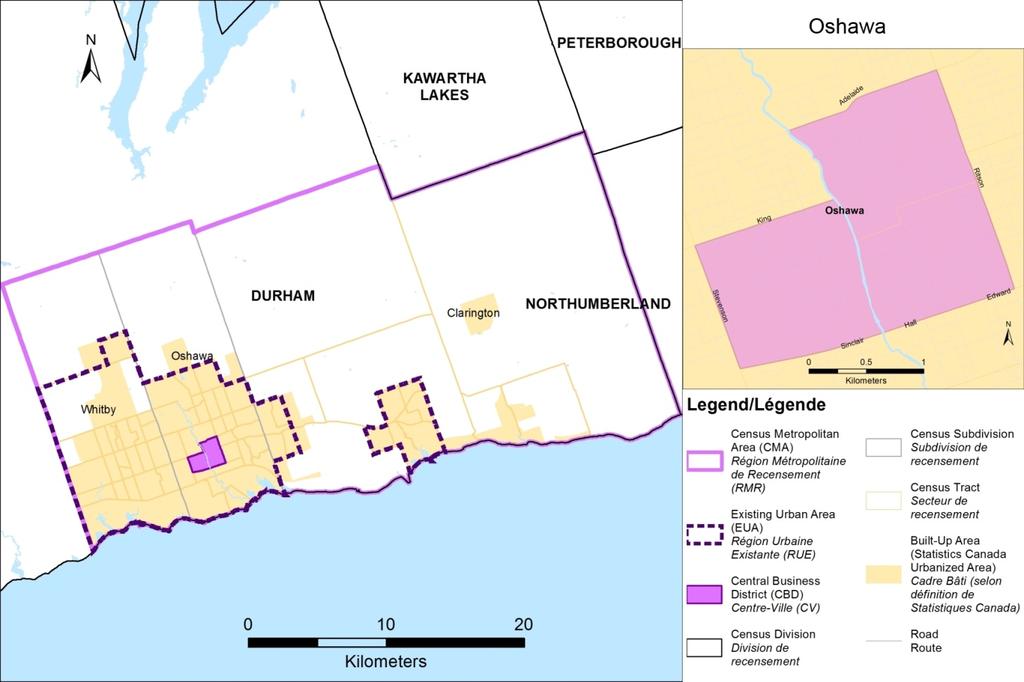
228 192 April 2016

229 April

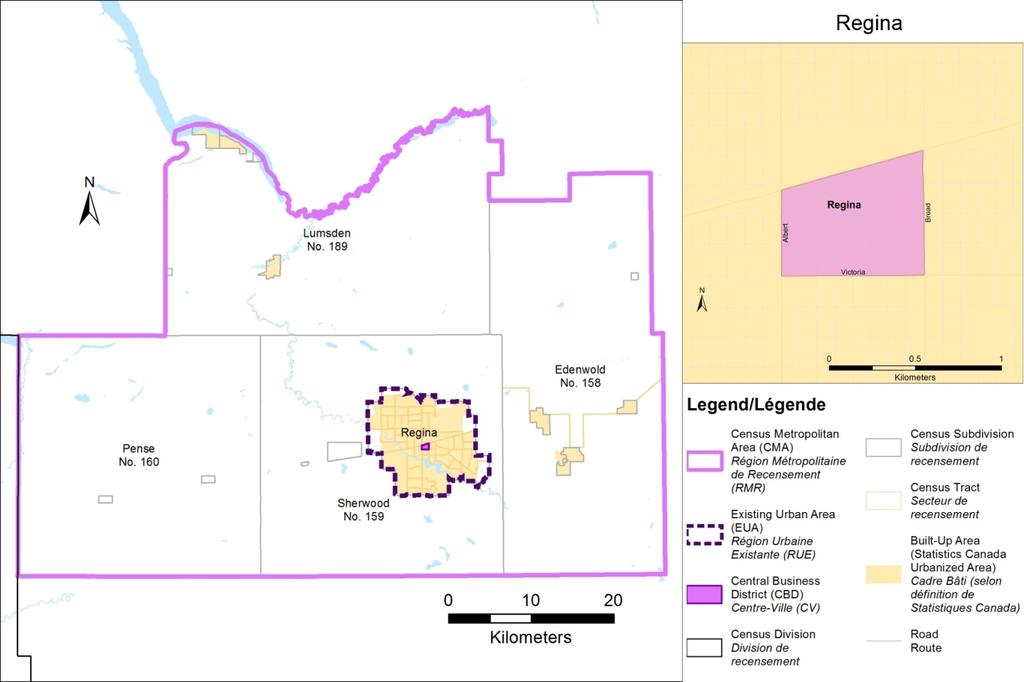
230 194 April 2016

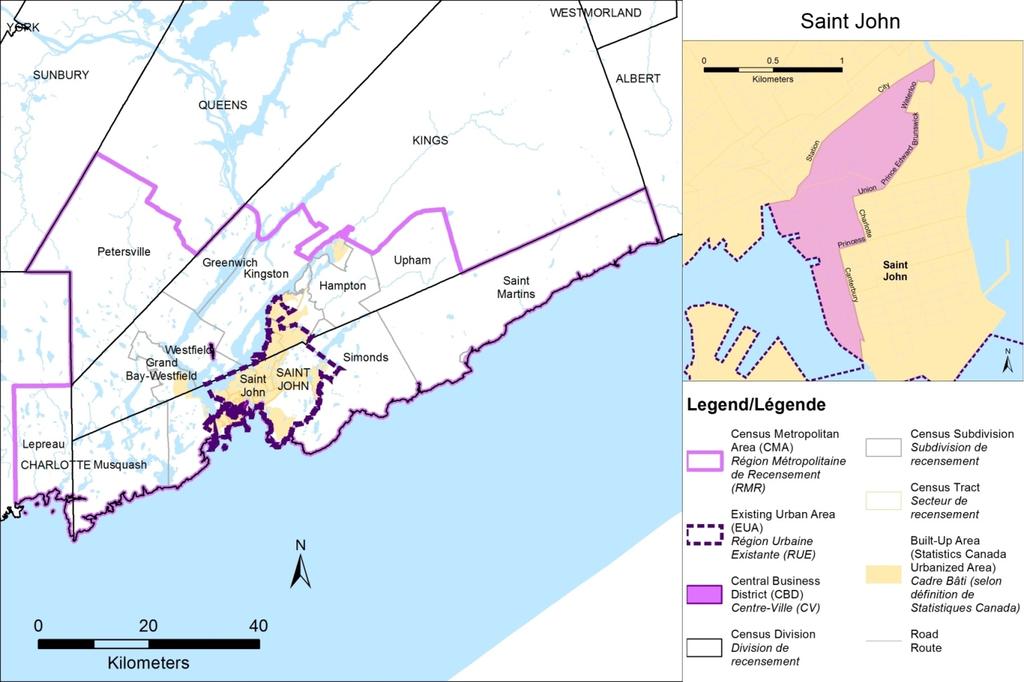
231 April

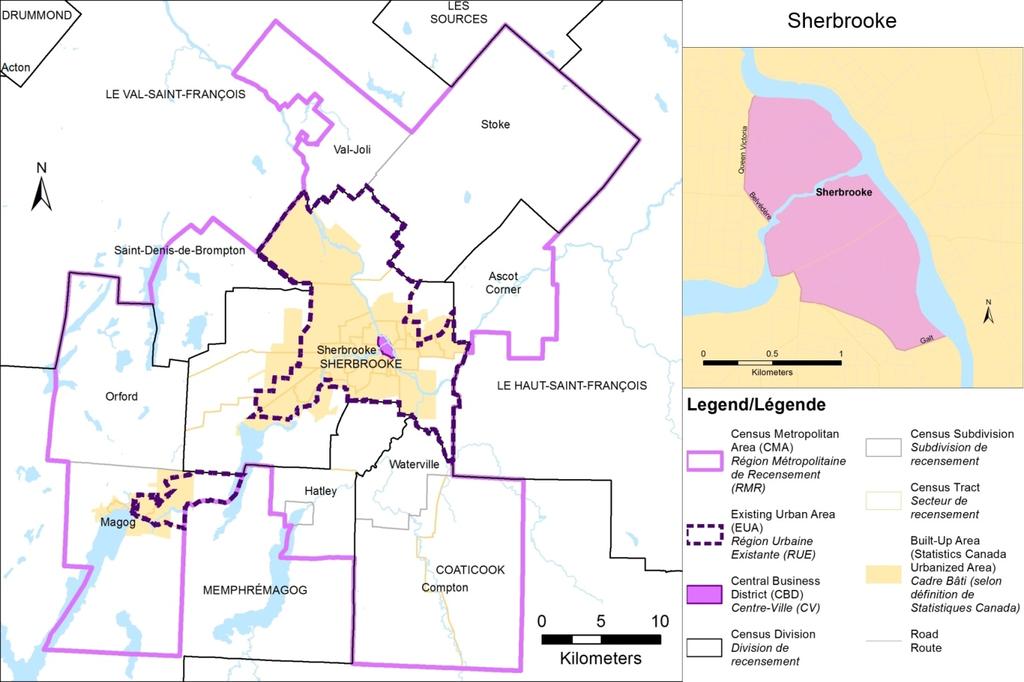
232 196 April 2016

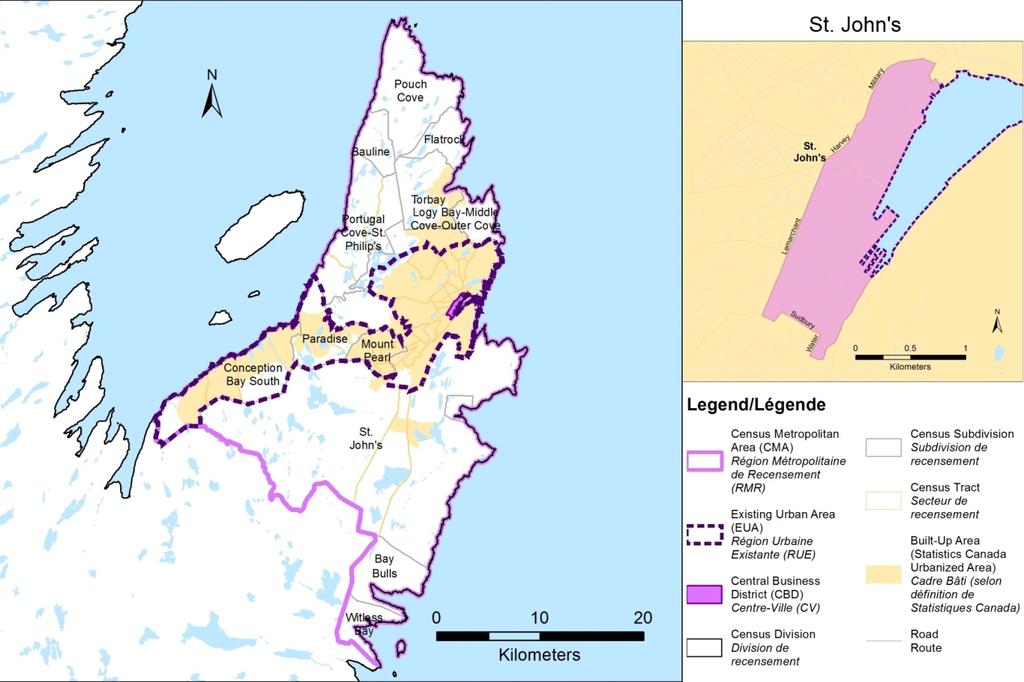
233 April

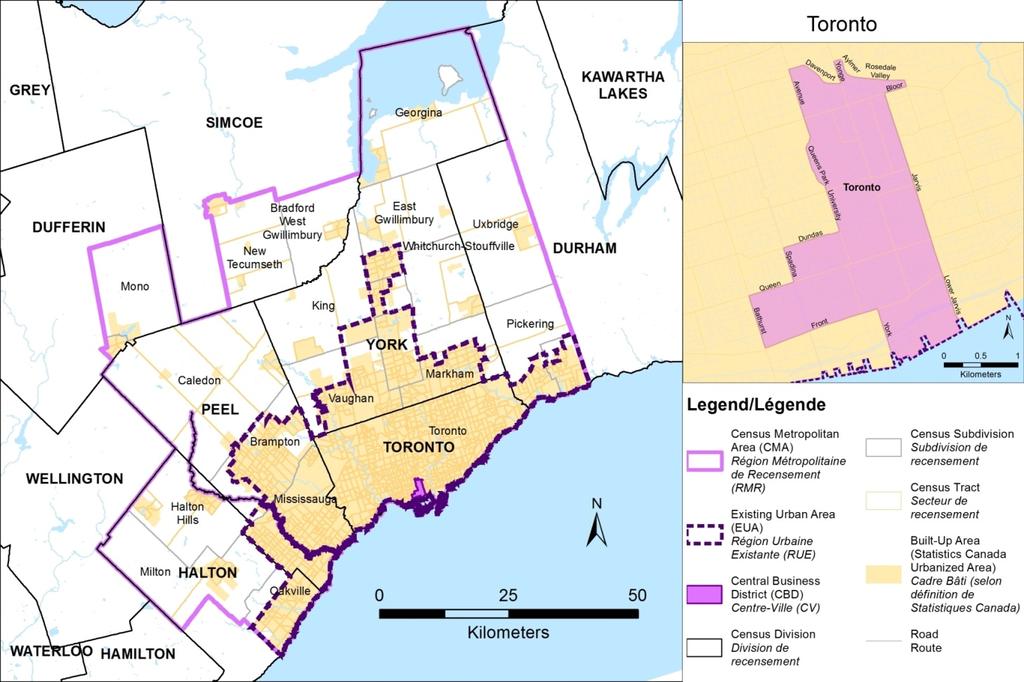
234 198 April 2016

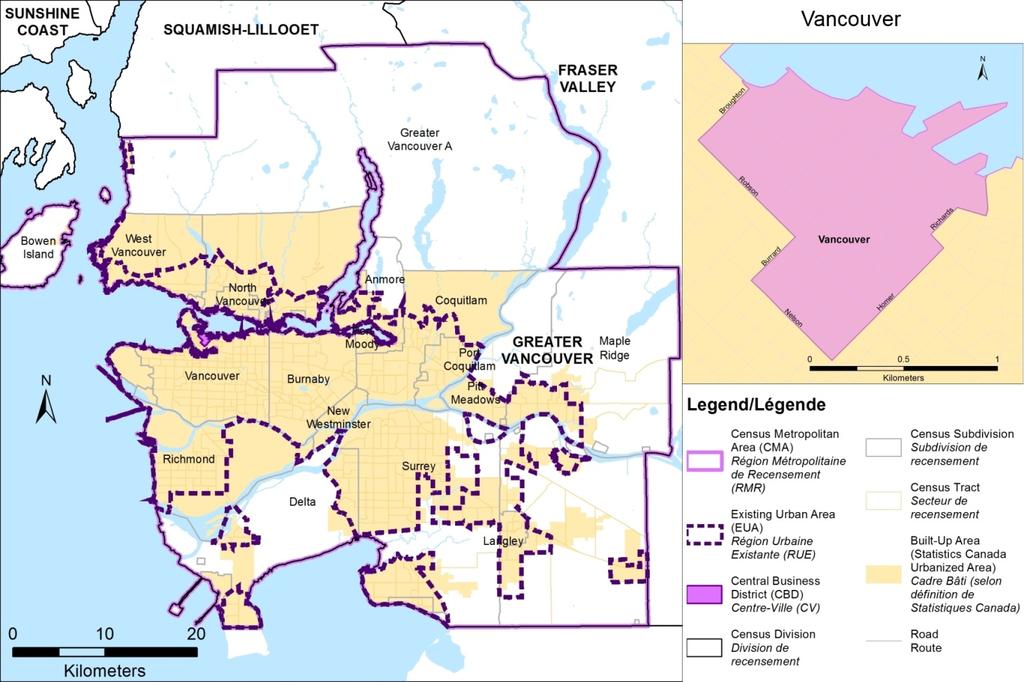
235 April


236 200 April 2016

237 April
Coolest Cities Results Summary
 Coolest Cities Results Summary About Coolest Cities Canada s six largest urban areas provide homes and jobs for almost 15 million people, nearly half of our population. Transporting these citizens to and
TRANSPORTATION TOMORROW SURVEY
 Clause No. 15 in Report No. 7 of was adopted, without amendment, by the Council of The Regional Municipality of York at its meeting held on April 17, 2014. 15 2011 TRANSPORTATION TOMORROW SURVEY recommends
Bill C-19: An Act to amend the Criminal Code and the Firearms Act
 Bill C-19: An Act to amend the Criminal Code and the Firearms Act Presentation to the Senate Committee on Legal and Constitutional Affairs By Julie McAuley Director, Canadian Centre for Justice Statistics
The Canadian Real Estate Association News Release
 The Canadian Real Estate Association News Release Canadian home sales activity strengthens in July Ottawa, ON, August 15, 2018 Statistics 1 released today by The Canadian Real Estate Association (CREA)
Tulsa Metropolitan Area LONG RANGE TRANSPORTATION PLAN
 Tulsa Metropolitan Area LONG RANGE TRANSPORTATION PLAN Indian Nations Council of Governments August 2005 CONTACTING INCOG In developing the Destination 2030 Long Range Transportation Plan, INCOG s Transportation
Public Consultation Centre For. Transportation Master Plan Update. Information Package
 Public Consultation Centre For Transportation Master Plan Update Information Package Date Location Hours Tuesday, September 12, 2017 Wednesday, September 13, 2017 Tuesday, September 19, 2017 Cambridge
Transportation Master Plan Advisory Task Force
 Transportation Master Plan Advisory Task Force Network Alternatives & Phasing Strategy February 2016 BACKGROUND Table of Contents BACKGROUND Purpose & Introduction 2 Linking the TMP to Key Council Approved
The Canadian Real Estate Association News Release
 The Canadian Real Estate Association News Release Canadian home sales at five-year low in May Ottawa, ON, June 15, 2018 Statistics 1 released today by The Canadian Real Estate Association (CREA) show national
Travel Patterns and Characteristics
 DRAFT 2006 Transportation Fact Book SECTION 4 Travel Patterns and Characteristics 43 2006 Transportation Fact Book DRAFT 44 DRAFT 2006 Transportation Fact Book Why do we conduct travel surveys? The main
Climate Change Action Plan: Transportation Sector Discussion Paper: Cycling
 Climate Change Action Plan: Transportation Sector Discussion Paper: Cycling ontario.ca/climatechange Contents 1. Minister of Transportation s message... 3 2. Introduction... 5 3. Sector Overview and Support
STAFF REPORT ACTION REQUIRED
 STAFF REPORT ACTION REQUIRED 2016 Ridership Update Date: March 23, 2016 To: From: TTC Board Chief Executive Officer Summary This report provides an update of TTC ridership results to the end of February
University of Victoria Campus Cycling Plan Terms of Reference. 1.0 Project Description
 University of Victoria Campus Cycling Plan Terms of Reference 1.0 Project Description The Campus Cycling Plan, a first for the University, will provide a comprehensive and coordinated approach to support
Moving Cambridge. City of Cambridge Transportation Master Plan Public Consultation Centre. March 7, :00 8:00 PM.
 City of Cambridge Transportation Master Plan Public Consultation Centre March 7, 2018 5:00 8:00 PM Region of Waterloo City of Cambridge Transportation Master Plan Public Consultation Centre March 7, 2018
Discussion Paper 1 June 2014 Current State of Transportation in Burlington
 Discussion Paper 1 June 2014 Current State of Transportation in Burlington www.burlington.ca/goyourway Discussion Paper 1: Current State of Transportation in Burlington The City of Burlington is developing
2. Context. Existing framework. The context. The challenge. Transport Strategy
 Transport Strategy Providing quality connections Contents 1. Introduction 2. Context 3. Long-term direction 4. Three-year priorities 5. Strategy tree Wellington City Council July 2006 1. Introduction Wellington
Briefing Paper #1. An Overview of Regional Demand and Mode Share
 2011 Metro Vancouver Regional Trip Diary Survey Briefing Paper #1 An Overview of Regional Demand and Mode Share Introduction The 2011 Metro Vancouver Regional Trip Diary Survey is the latest survey conducted
WELCOME. City of Greater Sudbury. Transportation Demand Management Plan
 WELCOME City of Greater Sudbury Transportation Demand Management Plan Public Consultation Session St. Andrew s Place, Activity Hall 111 Larch Street Wednesday September 13, 2017 6:00 to 8:00 pm Welcome
2. Transportation in Ottawa Today and Tomorrow
 2. Transportation in Ottawa Today and Tomorrow 2.1 Transportation System Overview The City. The City of Ottawa is the largest municipality in the National Capital Region (NCR). Urban development covers
WELCOME Region of Waterloo Transportation Master Plan Update Public Consultation Centre
 WELCOME Region of Waterloo Transportation Master Plan Update Public Consultation Centre 1. What is the purpose of this event? To introduce Moving Forward and collect public input on: The Region s future
Social Indicators and Trends 2014
 Social Indicators and Trends 2014 Healthy City for All Target By 2020: make the majority (over 50 per cent) of trips on foot, bike or transit (Greenest City Action Plan/Transportation 2040). Indicators
Exhibit 1 PLANNING COMMISSION AGENDA ITEM
 Exhibit 1 PLANNING COMMISSION AGENDA ITEM Project Name: Grand Junction Circulation Plan Grand Junction Complete Streets Policy Applicant: City of Grand Junction Representative: David Thornton Address:
Chapter 2 Current and Future Conditions
 Chapter 2 Current and Future Conditions 2.1 An Overview of Ottawa s Transportation System The City of Ottawa is home to about 870,700 people. The city covers an area of 2,760 square kilometres of which
Exceeding expectations: The growth of walking in Vancouver and creating a more walkable city in the future through EcoDensity
 Exceeding expectations: The growth of walking in Vancouver and creating a more walkable city in the future through EcoDensity Melina Scholefield, P. Eng. Manager, Sustainability Group, City of Vancouver
2.2 TRANSIT VISION 2040 FROM VISION TO ACTION. Emphasize transit priority solutions STRATEGIC DIRECTION
 TRANSIT VISION 2040 FROM VISION TO ACTION TRANSIT VISION 2040 defines a future in which public transit maximizes its contribution to quality of life with benefits that support a vibrant and equitable society,
NASHUA REGIONAL PLANNING COMMISSION REGIONAL BICYCLE AND PEDESTRIAN PLAN
 NASHUA REGIONAL PLANNING COMMISSION REGIONAL BICYCLE AND PEDESTRIAN PLAN June, 2005 Prepared by the Nashua Regional Planning Commission 2005 NRPC Regional Bicycle and Pedestrian Plan- JUNE 2005 ACKNOWLEDGEMENTS
2011 Origin-Destination Survey Bicycle Profile
 TRANS Committee 2011 Origin-Destination Survey National Capital Region December 2012 TRANS Committee Members: City of Ottawa, including OC Transpo Ville de Gatineau Société de transport de l Outaouais
Corporate. Report COUNCIL DATE: June 26, 2006 NO: C012 COUNCIL-IN-COMMITTEE. TO: Mayor & Council DATE: June 22, 2006
 Corporate NO: C012 Report COUNCIL DATE: June 26, 2006 COUNCIL-IN-COMMITTEE TO: Mayor & Council DATE: June 22, 2006 FROM: General Manager, Engineering FILE: 0410-20(MoT/Gate) SUBJECT: Surrey Response on
South King County High-Capacity Transit Corridor Study
 HIGH-CAPACITY TRANSIT CORRIDOR STUDY South King County Corridor South King County High-Capacity Transit Corridor Study Corridor Report August 2014 South King County High Capacity Transit Corridor Report
Summary Report: Built Environment, Health and Obesity
 Research and education Built Environment Edmonton Project Summary Report: Built Environment, Health and Obesity Introduction In 2007 the Canadian Institutes of Health Research and the Heart and Stroke
2016 Census: Release 2 Age, Sex, Dwelling types
 2016 Census: Release 2 Age, Sex, Dwelling types Dr. Doug Norris Senior Vice President and Chief Demographer May 11, 2017 Agenda A look at major age sex trends National Provincial/territorial Urban and
Quebec City tops poll of city services second year in a row
 lbozinoff@ FOR IMMEDIATE RELEASE Quebec City tops poll of city services second year in a row Burnaby, Mississauga, Sherbrooke, Oakville round out top five Toronto, May 29th, 2012 In a sampling of opinion
CITY OF COCOA BEACH 2025 COMPREHENSIVE PLAN. Section VIII Mobility Element Goals, Objectives, and Policies
 CITY OF COCOA BEACH 2025 COMPREHENSIVE PLAN Section VIII Mobility Element Goals, Objectives, and Policies Adopted August 6, 2015 by Ordinance No. 1591 VIII MOBILITY ELEMENT Table of Contents Page Number
Chapter 7. Transportation. Transportation Road Network Plan Transit Cyclists Pedestrians Multi-Use and Equestrian Trails
 Chapter 7 Transportation Transportation Road Network Plan Transit Cyclists Pedestrians Multi-Use and Equestrian Trails 7.1 TRANSPORTATION BACKGROUND The District of Maple Ridge faces a number of unique
Active Transportation Infrastructure Investment A Business Case
 Active Transportation Infrastructure Investment A Business Case In 2016, the Real Estate Foundation awarded the Capital Regional District a $50,000 grant for Shifting Gears: Land Use Change through Active
Public Consultation Centre
 Region of Waterloo Transportation Master Plan Update Public Consultation Centre See the Information Package on how to contact the Project Team and complete the Comment Sheet www.regionofwaterloo.ca/en/exploring-the-region/transportation-master-plan.aspx
2011 Transportation Tomorrow Survey. Data Presentation
 2011 Transportation Tomorrow Survey Data Presentation Participating Agencies Conduct of the Survey Supporting Agencies of TTS Agency 1986 1991 1996 2001 2006 2011 Mininstry of Transportation, Ontario Y
CITY OF KINGSTON INFORMATION REPORT TO ENVIRONMENT, INFRASTRUCTURE & TRANSPORTATION POLICIES COMMITTEE Report No.: EITP
 CITY OF KINGSTON INFORMATION REPORT TO ENVIRONMENT, INFRASTRUCTURE & TRANSPORTATION POLICIES COMMITTEE TO: FROM: RESOURCE STAFF: Chair and Members of Environment, Infrastructure & Transportation Policies
June 2015 REGIONAL TRANSPORTATION SNAPSHOT
 June 2015 REGIONAL TRANSPORTATION SNAPSHOT THE REGION Who are we? The Greater Toronto and Hamilton Area (GTHA), consisting of Durham Region, Halton Region, the City of Hamilton, Peel Region, the City of
Bicycle Master Plan Goals, Strategies, and Policies
 Bicycle Master Plan Goals, Strategies, and Policies Mobilizing 5 This chapter outlines the overarching goals, action statements, and action items Long Beach will take in order to achieve its vision of
July 23, Transit Workshop
 Agenda 1. Introductions 2. Presentation: Public Transit in Regina Review of Practices Elsewhere 3. Discussion #1: Transit Today 4. Break 5. Discussion #2: Transit Tomorrow Corridors, Service, and Amenities
4 Ridership Growth Study
 Clause 4 in Report No. 15 of Committee of the Whole was adopted, without amendment, by the Council of The Regional Municipality of York at its meeting held on November 16, 2017. 4 Ridership Growth Study
a) receiving of legal advice subject to solicitor client privilege and labour relations regarding contract negotiations
 receiving of legal advice subject to solicitor client privilege and labour relations regarding contract negotiations") Regional Municipality of Waterloo Planning and Works Committee Agenda Tuesday, April 4, 2017 9:30 a.m. (Following Closed Session) Regional Council Chamber 150 Frederick Street, Kitchener Media Release:
Regional Municipality of Waterloo Planning and Works Committee Agenda Tuesday, April 4, 2017 9:30 a.m. (Following Closed Session) Regional Council Chamber 150 Frederick Street, Kitchener Media Release:
Rochester Area Bike Sharing Program Study
 roc bike share Rochester Area Bike Sharing Program Study Executive Summary ~ January 2015 JANUARY 2015 8484 Georgia Avenue, Suite 800 Silver Spring, MD 20910 3495 Winton Pl., Bldg E, Suite 110 Rochester,
WEST AND SOUTH WEST RING ROAD DOWNSTREAM TRAFFIC IMPACTS
 Page 1 of 9 EXECUTIVE SUMMARY Alberta Transportation ( AT ) is preparing to construct the final sections of the Calgary Ring Road. This includes the South West Ring Road ( SWRR ) (from Lott Creek Blvd
2014 peterborough city and county. active. transportation. & health. indicators primer
 2014 city and county active transportation & health indicators primer executive summary Walking, cycling and transit are good for our personal health, our local economies, and the environment. Understanding
Appendix A-K Public Information Centre 2 Materials
 Appendix A-K Public Information Centre 2 Materials Our Rapid Transit Initiative Make an impact on the future of transit Join the discussion on Rapid Transit in London You re invited to a Public Information
Service Business Plan
 Service Business Plan Service Name Transportation Planning Service Type Public Service Owner Name Kaylan Edgcumbe Budget Year 2019 Service Owner Title Service Description Manager of Transportation Planning
Regina Bikeways Needs Assessment Study: Measuring the value of the bikeway infrastructure
 Regina Bikeways Needs Assessment Study: Measuring the value of the bikeway infrastructure Norma Moores, P.Eng. ProWalk/ProBike 2008 Regina Bikeway Needs Assessment Study To measure use of the on-road bikeways
Cycling in Québec : From Hollydays to Every Day
 Cycling in Québec : From Hollydays to Every Day Marc Panneton, Urban Planner Bicycle Coordinator Ministère des Transports du Québec Pro Walk Pro Bike 2002 Seattle, WA Presentation Summary The 1995 cycling
Hamilton Transportation Master Plan Public Consultation. Public Information Centre One Summary
 Hamilton Transportation Master Plan Public Consultation Public Information Centre One Summary Table of Contents Introduction 1 Purpose 2 What Was Presented 2 Who Came to the Meeting 2 The Breakout Sessions
Take the Bus. Project Proposal AUSTRALIA. Bus Industry Confederation. Take the Bus. Bus Australia Network WARTA. BusS. Bus & Coach Association SA
 Project Proposal Bus Industry Confederation Bus Australia Network BusS Bus & Coach Association SA WARTA Bus Australia Network BusS Bus & Coach Association SA 2 Project Proposal Bus Industry Confederation
Cycling in Québec : From Hollydays to Every Day
 Cycling in Québec : From Hollydays to Every Day Marc Panneton, Urban Planner Bicycle Coordinator Ministère des Transports du Québec Green Mobillity Forum, Wolfville, NS May 21-22, 2008 Presentation Summary
WALKNBIKE DRAFT PLAN NASHVILLE, TENNESSEE EXECUTIVE SUMMARY NASHVILLE, TENNESSEE
 NASHVILLE, TENNESSEE EXECUTIVE SUMMARY Executive Summary A world-class multi-modal transportation system is essential to a vibrant city and better quality of life. -Mayor Barry The WalknBike plan aims
Chapter 14 PARLIER RELATIONSHIP TO CITY PLANS AND POLICIES. Recommendations to Improve Pedestrian Safety in the City of Parlier (2014)
") Chapter 14 PARLIER This chapter describes the current status and future plans for biking and walking in the City of Parlier. RELATIONSHIP TO CITY PLANS AND POLICIES The Parlier General Plan is the primary
Chapter 14 PARLIER This chapter describes the current status and future plans for biking and walking in the City of Parlier. RELATIONSHIP TO CITY PLANS AND POLICIES The Parlier General Plan is the primary
CITY OF HAMILTON PLANNING AND ECONOMIC DEVELOPMENT DEPARTMENT Transportation Planning and Parking Division
 CITY OF HAMILTON PLANNING AND ECONOMIC DEVELOPMENT DEPARTMENT Transportation Planning and Parking Division TO: Chair and Members Public Works Committee COMMITTEE DATE: June 18, 2018 SUBJECT/REPORT NO:
8 PROPOSED ROUNDABOUT DUFFERIN STREET AND KING VAUGHAN ROAD INTERSECTION CITY OF VAUGHAN
 8 PROPOSED ROUNDABOUT DUFFERIN STREET AND KING VAUGHAN ROAD INTERSECTION CITY OF VAUGHAN The Transportation Services Committee recommends the adoption of the recommendation contained in the following report
TOWARDS A BIKE-FRIENDLY CANADA A National Cycling Strategy Overview
 TOWARDS A BIKE-FRIENDLY CANADA A National Cycling Strategy Overview NationalCyclingStrategFrameworkv3.indd 1 Potential for this modal shift can be found in municipalities of all sizes, in every population
Kelowna On the Move. Pedestrian and Bicycle Master Plan
 Kelowna On the Move Pedestrian and Bicycle Master Plan Executive Summary April 2016 Purpose of the Plan The Pedestrian and Bicycle Master Plan identifies infrastructure, planning, and policy requirements
TRANSIT & NON-MOTORIZED PLAN DRAFT FINAL REPORT Butte County Association of Governments
 1 INTRODUCTION Maintaining a high quality of life is the essence of this plan for transit and non-motorized transportation in Butte County. Curbing greenhouse gas emissions (GHG) by reducing congestion,
Nomination. Halton Region in Context
 Transportation Association of Canada Sustainable Urban Transportation Award Nomination of: Region of Halton Regional Transportation Master Plan Study March 2005 Nominated by: Nomination The TAC Sustainable
APPENDIX B. TDM Existing Conditions
 APPENDIX B TDM Existing Conditions SCARBOROUGH CENTRE TMP TRANSPORTATION DEMAND MANAGEMENT INTRODUCTION Scarborough Centre has grown into a mixed-use hub for population, transportation, and employment
RESOLUTION NO ?? A RESOLUTION OF THE CITY OF NEPTUNE BEACH ADOPTING A COMPLETE STREETS POLICY
 RESOLUTION NO. 2018-?? A RESOLUTION OF THE CITY OF NEPTUNE BEACH ADOPTING A COMPLETE STREETS POLICY WHEREAS, safe, convenient, and accessible transportation for all users is a priority of the City of Neptune
York Region Population and Employment Growth
 March 1, 2016 1 York Region Population and Employment Growth York Region needs to comply with The Provincial Growth Plan and new forecasts introduced to 2036 and 2041 2 Regional Official Plan Review York
A Bicycle Network for a North American Metropolis: The Case of Montreal
 A Bicycle Network for a North American Metropolis: The Case of Montreal Marc Jolicoeur, Research Coordinator, Vélo Québec 1251 Rue Rachel Est, Montreal H2 J2J9, Canada marc-jolicoeur@velo.qb.ca Summary
Cycling Master Plan Community Engagement Session WELCOME
 Cycling Master Plan Community Engagement Session WELCOME WHY COMMUNITIES PLAN Considering Short Term and Long Term Needs City of Lethbridge is committed to planning - to determine short term goals along
EXECUTIVE SUMMARY OF CALEDON TRANSPORTATION NEEDS STUDY
 EXECUTIVE SUMMARY OF CALEDON TRANSPORTATION NEEDS STUDY The Caledon Transportation Needs Study has been undertaken as a joint project by the Town of Caledon and the Region of Peel to determine the existing
We support the following: Tom Davies Square 200 Brady Street Sudbury, Ontario
 April 4, 2014 Tom Davies Square 200 Brady Street Sudbury, Ontario RE: Second Avenue Reconstruction Project and Panel Consultation Dear City of Greater Sudbury Mayor and Council: The (SMAP), a council appointment
GD 0043/18 ACTIVE TRAVEL STRATEGY
 GD 0043/18 ACTIVE TRAVEL STRATEGY 2018-2021 May 2018 Minister s Introduction There is strong evidence that regular physical activity reduces the risk of a range of health conditions. The best way to increase
Five Ways the 2016 Census Affects Marketers
 Five Ways the 2016 Census Affects Marketers February 15, 2018 Dr. Doug Norris Senior Vice President and Chief Demographer Rupen Seoni Senior Vice President and Practice Leader Today s presenters Dr. Doug
5. Pedestrian System. Accomplishments Over the Past Five Years
 5. Pedestrian System Accomplishments Over the Past Five Years The Alamo Area Metropolitan Planning Organization (MPO) and its partner agencies recognize the importance of improving pedestrian mobility.
City of Novi Non-Motorized Master Plan 2011 Executive Summary
 City of Novi Non-Motorized Master Plan 2011 Executive Summary Prepared by: February 28, 2011 Why Plan? Encouraging healthy, active lifestyles through pathway and sidewalk connectivity has been a focus
Appendix 1 Transit Network Analysis
 Appendix 1 Transit Network Analysis APPENDIX 1 TRANSIT NETWORK ANALYSIS The purpose of this appendix is to provide an update on the transit network analysis as it pertains to: i. SmartTrack ii. Scarborough
Regional Transportation Needs Within Southeastern Wisconsin
 Regional Transportation Needs Within Southeastern Wisconsin #118274 May 24, 2006 1 Introduction The Southeastern Wisconsin Regional Planning Commission (SEWRPC) is the official areawide planning agency
CITY OF ABBOTSFORD TRANSPORTATION AND TRANSIT MASTER PLAN
 CITY OF ABBOTSFORD TRANSPORTATION AND TRANSIT MASTER PLAN EXECUTIVE COMMITTEE MONDAY, OCTOBER 2, 2017 TRANSPORTATION & TRANSIT AGENDA 1. Plan Overview 2. Shaping Influences 3. Existing Conditions and What
Shifting Gears for a Healthier City
 Shifting Gears for a Healthier City Mississauga s Cycling Master Plan is an ambitious strategy that sets out to transform Mississauga into a city that is conducive to cycling for daily transportation needs.
ADOT Statewide Bicycle and Pedestrian Program Summary of Phase IV Activities APPENDIX B PEDESTRIAN DEMAND INDEX
 ADOT Statewide Bicycle and Pedestrian Program Summary of Activities APPENDIX B PEDESTRIAN DEMAND INDEX May 24, 2009 Pedestrian Demand Index for State Highway Facilities Revised: May 29, 2007 Introduction
TR NEWS. Public Health and Transportation. Innovation, Intervention, and Improvements NUMBER 299 SEPTEMBER OCTOBER 2015
 TR NEWS NUMBER 299 SEPTEMBER OCTOBER 2015 Public Health and Transportation Innovation, Intervention, and Improvements Public Health and Transportation Measuring the Health Benefits of Walking and Bicycling
To secure Council approval for a pilot expansion of Transit service to the villages of St. Davids and Queenston.
 Operations Telephone (905) 468-4261 Facsimile (905) 468-4555 1565 Creek Road P.O. Box 190 Virgil, Ontario L0S 1T0 Report: OPS-15-026 Committee Date: May 04, 2015 Due in Council: May 11, 2015 Report To:
This objective implies that all population groups should find walking appealing, and that it is made easier for them to walk more on a daily basis.
 Walking for life The Norwegian Walking Strategy Guro Berge Norwegian public Roads Administration "Walking for life" is the slogan for the National Walking Strategy that is now being formulated in Norway.
WHITE PAPER: TRANSIT SERVICE FOR SOUTH SHAGANAPPI
 9/27/2012 TRANSIT PLANNING WHITE PAPER: TRANSIT SERVICE FOR SOUTH SHAGANAPPI 2012 Calgary Transit 1 Table of Contents Purpose... 3 Area of Change... 3 Background... 3 Access to destinations... 5 Connecting
1999 On-Board Sacramento Regional Transit District Survey
 SACOG-00-009 1999 On-Board Sacramento Regional Transit District Survey June 2000 Sacramento Area Council of Governments 1999 On-Board Sacramento Regional Transit District Survey June 2000 Table of Contents
SANTA CLARA COUNTYWIDE BICYCLE PLAN August 2008
 SANTA CLARA COUNTYWIDE BICYCLE PLAN August 2008 To assist VTA and Member Agencies in the planning, development and programming of bicycle improvements in Santa Clara County. Vision Statement To establish,
Planning Daily Work Trip under Congested Abuja Keffi Road Corridor
 ISBN 978-93-84468-19-4 Proceedings of International Conference on Transportation and Civil Engineering (ICTCE'15) London, March 21-22, 2015, pp. 43-47 Planning Daily Work Trip under Congested Abuja Keffi
Appendix A. Road Classification Review of Outstanding Issues and Proposed Classifications (All Wards) Staff Report Road Classification System
 Staff Report Road Classification System") Appendix A Road Classification Review of Outstanding Issues and Proposed Classifications (All Wards) Staff Report 2000 A.1 of A.10 A.2 of A.10 STAFF REPORT January 26, 2000 To: From: Works Committee Barry
Appendix A Road Classification Review of Outstanding Issues and Proposed Classifications (All Wards) Staff Report 2000 A.1 of A.10 A.2 of A.10 STAFF REPORT January 26, 2000 To: From: Works Committee Barry
CITY OF HAMILTON. PUBLIC WORKS DEPARTMENT Transportation Division
 CITY OF HAMILTON PUBLIC WORKS DEPARTMENT Transportation Division TO: Mayor and Members General Issues Committee WARD(S) AFFECTED: CITY WIDE COMMITTEE DATE: February 25, 2013 SUBJECT/REPORT NO: Public Bike
Douglas Land Use and Transportation Strategy (DLUTS) Summary. August 2013
 Summary. August 2013") Douglas Land Use and Transportation Strategy (DLUTS) Summary August 2013 Background Douglas is a large and popular residential suburb of approximately 30,000 persons on the periphery of Cork City along
Douglas Land Use and Transportation Strategy (DLUTS) Summary August 2013 Background Douglas is a large and popular residential suburb of approximately 30,000 persons on the periphery of Cork City along
Standing Committee on Policy and Strategic Priorities. Mount Pleasant Industrial Area Parking Strategy and Access Improvements
 POLICY REPORT Report Date: April 23, 2018 Contact: Lon LaClaire Contact No.: 604.873.7722 RTS No.: 9944 VanRIMS No.: 08-2000-20 Meeting Date: May 16, 2018 TO: FROM: SUBJECT: Standing Committee on Policy
Shifting Gears for a Healthier City.
 Shifting Gears for a Healthier City. Mississauga s Cycling Master Plan is an ambitious strategy that sets out to transform Mississauga into a city that is conducive to cycling for daily transportation
AMATS Complete Streets Policy
 AMATS Complete Streets Policy Table of Contents: Section 1. Definition of Complete Streets Section 2. Principles of Complete Streets Section 3. Complete Streets Policy Section 4. Consistency Section 5.
TABLE OF CONTENTS EXECUTIVE SUMMARY... ES INTRODUCTION STRATEGY DEVELOPMENT AND GUIDING PRINCIPLES NEEDS DEFINITION...
 TABLE OF CONTENTS EXECUTIVE SUMMARY... ES-1 1.0 INTRODUCTION... 1 2.0 STRATEGY DEVELOPMENT AND GUIDING PRINCIPLES... 3 2.1 SUMMARY OF FINDINGS FROM PRECEDING TECHNICAL MEMORANDA... 3 2.2 GUIDING PRINCIPLES...
Walking and Cycling Action Plan Summary. A Catalyst for Change The Regional Transport Strategy for the west of Scotland
 Walking and Cycling Action Plan Summary A Catalyst for Change The Regional Transport Strategy for the west of Scotland 2007-2021 Strathclyde Partnership for Transport Contents Purpose...2 Issues, Constraints
APPENDIX 2 LAKESHORE ROAD TRANSPORTATION REVIEW STUDY EXECUTIVE SUMMARY
 APPENDIX 2 LAKESHORE ROAD TRANSPORTATION REVIEW STUDY EXECUTIVE SUMMARY Appendix 2 City of Mississauga Lakeshore Road FINAL REPORT Transportation Review Study December 2010 EXECUTIVE SUMMARY Study Purpose
What s Health Got to Do With It? Health and Land Use Planning
 What s Health Got to Do With It? Health and Land Use Planning CANDACE RUTT, PH.D. EXECUTIVE DIRECTOR APRIL 13 TH, 2016 Planning and Public Health Planning + Public Health Healthy Communities Healthier
Active Transportation Master Plan
 Prepared by: BT Engineering Inc. 100 Craig Henry Drive, Suite 201 Ottawa, Ontario K2G 5W3 June 2017 Table of Contents TABLE of CONTENTS Introduction... 1 Tourism... 2 Health... 3 Safety... 4 Environment...
Transportation and Health Tool
 Working together to evolve the Transportation and Health Tool APHA Webinar March 22, 2016 Ann Steedly, PE Overview THT Development Context Development of Indicators Strategies, Interventions & Policies
Mobility and Congestion
 Technical Memorandum Mobility and Congestion Prepared for: Prepared by: September 25, 2013 1 Table of Contents 1. Introduction... 1 2. Congestion Forecasting Process... 1 2.1 Mobility and Congestion Terms...
Pedestrian Crosswalk Audit
 1200, Scotia Place, Tower 1 10060 Jasper Avenue Edmonton, Alberta T5J 3R8 edmonton.ca/auditor Pedestrian Crosswalk Audit June 19, 2017 The conducted this project in accordance with the International Standards
T1-A - Service Reduction (Re-sizing)
") Key T1-A Choice A Key T1-B Choice B Key T1-C Choice C Key T1-D Choice D Key T1-E Choice E Key T1-F Choice F Key Choice G T2 T1-A - Service Reduction (Re-sizing) Description This key choice would represent
Key T1-A Choice A Key T1-B Choice B Key T1-C Choice C Key T1-D Choice D Key T1-E Choice E Key T1-F Choice F Key Choice G T2 T1-A - Service Reduction (Re-sizing) Description This key choice would represent
Public Health in the Public Realm: Influencing Street Design with Health in Mind Dr. David McKeown Medical Officer of Health
 Public Health in the Public Realm: Influencing Street Design with Health in Mind Dr. David McKeown Medical Officer of Health Complete Streets Forum April 23, 2010 Common Goals of Public Health and Complete
Proposed. City of Grand Junction Complete Streets Policy. Exhibit 10
 Proposed City of Grand Junction Complete Streets Policy Exhibit 10 1 City of Grand Junction Complete Streets Policy Vision: The Complete Streets Vision is to develop a safe, efficient, and reliable travel