Traffic Impact Study. Roderick Place Columbia Pike Thompson s Station, TN. Transportation Group, LLC Traffic Engineering and Planning
|
|
|
- Scot Chandler
- 6 years ago
- Views:
Transcription
1 F i s c h b a c h Transportation Group, LLC Traffic Engineering and Planning Traffic Impact Study Roderick Place Columbia Pike Thompson s Station, TN Prepared March 2016 Ms. Gillian L. Fischbach, P.E., PTOE P.O. Box Franklin, TN (615) phone Gillian@FTGtraffic.com
2 Traffic Impact Study Roderick Place Columbia Pike Thompson s Station, Tennessee Prepared March 2016 PREPARED FOR: Mr. Leon Heron, Jr. C&L Development P.O. Box 241 Thompson s Station, TN PREPARED BY: Ms. Gillian L. Fischbach, P.E., PTOE Fischbach Transportation Group (FTG, LLC) P.O. Box Franklin, TN Phone: (615) FTG Project Number: G I L S L T A I T E A N I R EG C S AGRICULTURE O M M N T O. O F L. E R ED E T F R I ENG I C S CH B N E E E R E E NN S A S C H E E
3 Roderick Place, Thompson s Station, TN Traffic Impact Study March 2016 Table of Contents 1. INTRODUCTION PROJECT DESCRIPTION... 5 FIGURE 1. LOCATION OF THE PROJECT SITE... 6 FIGURE 2. CURRENT PROJECT SITE PLAN EXISTING TRAFFIC VOLUMES... 8 FIGURE 3. EXISTING PEAK HOUR TRAFFIC VOLUMES PROJECTION OF BACKGROUND TRAFFIC VOLUMES TABLE 1. HISTORICAL TRAFFIC VOLUMES IN THE STUDY AREA FIGURE 4. BACKGROUND PEAK HOUR TRAFFIC VOLUMES IMPACTS OF PROPOSED DEVELOPMENT TRIP GENERATION TABLE 2. TRIP GENERATION TRIP DISTRIBUTION AND TRAFFIC ASSIGNMENT FIGURE 5A. DIRECTIONAL DISTRIBUTION (RESTAURANT AND GAS STATION) FIGURE 5B. DIRECTIONAL DISTRIBUTION (RESIDENTIAL) FIGURE 5C. DIRECTIONAL DISTRIBUTION (RESORT HOTEL) FIGURE 6A. PRIMARY PEAK HOUR SITE TRAFFIC (REST. AND GAS STATION) FIGURE 6B. PASS-BY PEAK HOUR SITE TRAFFIC (REST. AND GAS STATION) FIGURE 6C. PEAK HOUR SITE TRAFFIC (RESIDENTIAL) FIGURE 6D. PEAK HOUR SITE TRAFFIC (RESORT HOTEL) CAPACITY ANALYSES FIGURE 7. TOTAL PEAK HOUR TRAFFIC VOLUMES TABLE 3. DESCRIPTIONS OF LOS FOR UNSIGNALIZED INTERSECTIONS TABLE 4. TOTAL PEAK HOUR LEVELS OF SERVICE TRAFFIC SIGNAL WARRANT ANALYSES TABLE 5. HOURLY TRAFFIC VOLUMES TABLE 6. HOURLY TRAFFIC VOLUMES TABLE 7. HOURLY TRAFFIC VOLUMES TABLE 8. TRAFFIC SIGNAL WARRANT ANALYSIS TABLE 9. TRAFFIC SIGNAL WARRANT ANALYSIS TABLE 10. TRAFFIC SIGNAL WARRANT ANALYSIS Fischbach Transportation Group (FTG, LLC) 2 of 69
4 Roderick Place, Thompson s Station, TN Traffic Impact Study March CONCLUSIONS AND RECOMMENDATIONS APPENDIX A APPENDIX B APPENDIX C APPENDIX D APPENDIX E Fischbach Transportation Group (FTG, LLC) 3 of 69
5 Roderick Place, Thompson s Station, TN Traffic Impact Study March INTRODUCTION This traffic study has been prepared in order to identify the traffic impacts of a mixed-use development that is proposed to be constructed on the east side of Columbia Pike, approximately half way between State Route 840 and Thompson s Station Road, in Thompson s Station, Tennessee. For the purposes of this study, existing and background traffic volumes were established. Also, trip generation calculations were performed, and the trips which are expected to be generated by the proposed project were distributed to the roadway system and added to the background traffic volumes. The intersections which provide access to the site were then re-evaluated to determine the traffic impacts of the proposed project. Access needs for the project were evaluated, and the necessary roadway and/or traffic control improvements were identified. This report presents the results of these analyses and the subsequent recommendations. Fischbach Transportation Group (FTG, LLC) 4 of 69
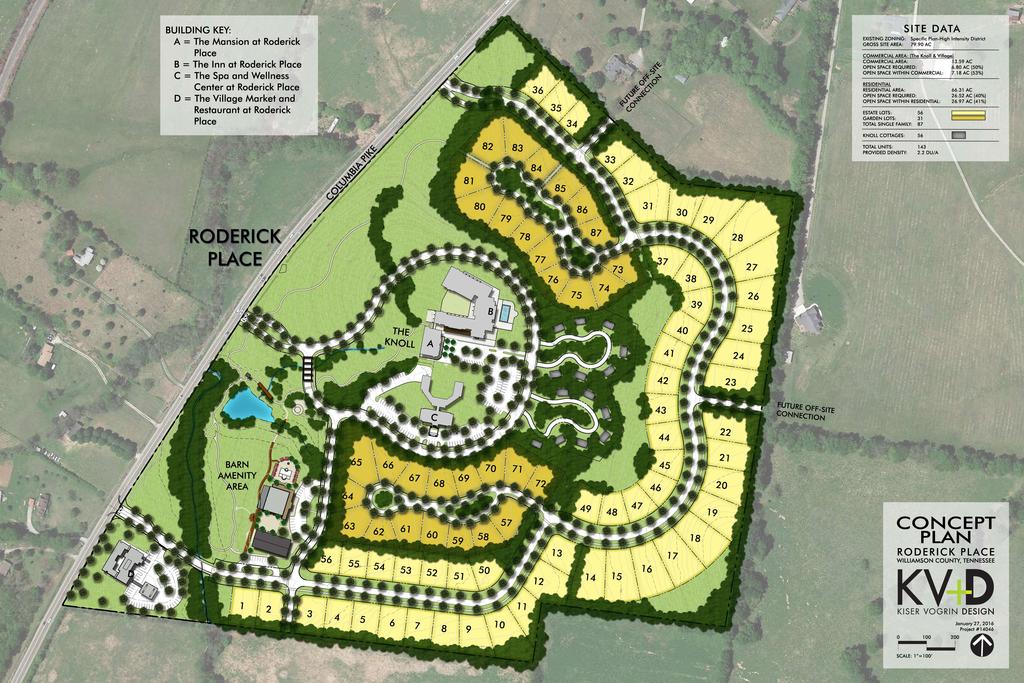
6 Roderick Place, Thompson s Station, TN Traffic Impact Study March PROJECT DESCRIPTION The location of the proposed project is shown in Figure 1. As shown, the project site is located on the east side of Columbia Pike, approximately half way between State Route 840 and Thompson s Station Road, in Thompson s Station, Tennessee. Along the frontage of the Roderick Place project site, Columbia Pike includes two 12-foot travel lanes and 6-foot shoulders. A 45 mph speed limit is posted on this roadway segment. Currently, the project site includes an historic single-family house that is included on the National register. Also, the site includes several outbuildings and a second single-family home, which is not historic. The developer of the proposed project plans to construct the following land uses: A restaurant with 3,768 sq.ft. of space A convenience store / gas station with four (4) fuel pumps 87 single-family homes A resort hotel with 75 rooms, 56 cottages, a restaurant, and a spa. Access to the proposed project will be provided at three locations on Columbia Pike. The current project site plan is shown in Figure 2. In large part, economic and market considerations will dictate the pace and timing with which the proposed project is actually completed. For the purposes of this study, it was assumed that the proposed project will be completed in three years. Fischbach Transportation Group (FTG, LLC) 5 of 69
 - PM Peak Hour Volumes Figure 1.")
7 F i s c h b a c h Transportation Group, LLC Traffic Engineering and Planning Project Site N No Scale XX - AM Peak Hour Volumes (XX) - PM Peak Hour Volumes Figure 1. Location of the Project Site
8
9 Roderick Place, Thompson s Station, TN Traffic Impact Study March EXISTING TRAFFIC VOLUMES In order to provide data for the traffic impact analysis, current peak hour traffic volumes were identified for Columbia Pike in the vicinity of the project site. Specifically, hourly, directional data was collected on this roadway segment by the Tennessee Department of Transportation (TDOT). This raw count data is included in Appendix A, and the existing peak hour traffic volumes are shown in Figure 3. Fischbach Transportation Group (FTG, LLC) 8 of 69
10 F i s c h b a c h Transportation Group, LLC Traffic Engineering and Planning 542(884) 542(884) (619)1207 (619) (884) (619)1207 N No Scale XX - AM Peak Hour Volumes (XX) - PM Peak Hour Volumes Figure 3. Existing Peak Hour Traffic Volumes
11 Roderick Place, Thompson s Station, TN Traffic Impact Study March PROJECTION OF BACKGROUND TRAFFIC VOLUMES In order to account for the traffic growth which will occur within the study area because of typical growth, historical volumes within the study area were considered. Specifically, the Tennessee Department of Transportation (TDOT) conducts an annual count program throughout the state, and this count program includes the annual collection of average daily traffic (ADT) counts at numerous fixed locations. As shown in Table 1, the daily traffic volumes on Columbia Pike, between State Route 840 and Thompson s Station Road, has remained relatively stable since State Route 840 opened in However, in order to present a conservative analysis for the purposes of this study, the existing traffic volumes were increased by 6% in order to represent the background conditions in 2019, as shown in Figure 4. TABLE 1. HISTORICAL TRAFFIC VOLUMES IN THE STUDY AREA Station 67 Year Columbia Pike ADT ,645 Annual Growth , % , % , % , % , % , % , % Overall Growth , % -0.36% Fischbach Transportation Group (FTG, LLC) 10 of 69
12 F i s c h b a c h Transportation Group, LLC Traffic Engineering and Planning 575(937) 575(937) (656)1279 (656) (937) (656)1279 N No Scale XX - AM Peak Hour Volumes (XX) - PM Peak Hour Volumes Figure 4. Background Peak Hour Traffic Volumes (Existing Traffic Volumes Increased by 6%)
13 Roderick Place, Thompson s Station, TN Traffic Impact Study March IMPACTS OF PROPOSED DEVELOPMENT 5.1 TRIP GENERATION Trip generation calculations were conducted in order to identify how much traffic will be generated by the proposed project. Trip generation data for daily and peak hour trips were identified from Trip Generation, Ninth Edition, which was published by the Institute of Transportation Engineers (ITE) in Table 2 presents the daily and peak hour trip generations for proposed project, and these calculations are included in Appendix B. TABLE 2. TRIP GENERATION LAND USE Single-Family (LUC 210) Sit-Down Restaurant (LUC 932) Convenience Store / Gas Station (LUC 852) Resort (LUC 330) SIZE DAILY TRAFFIC GENERATED TRAFFIC AM PEAK HOUR PM PEAK HOUR ENTER EXIT ENTER EXIT 87 homes ,768 sq.ft pumps 2, rooms 1,168 * TOTAL ENTERING AND EXITING TRIPS 4, NEW TRIPS TO THE COLUMBIA PIKE CORRIDOR ** 3, Daily trips identified using LUC 310 (Inn) because no such data is available for LUC 330 *Resort) ** Based on the assumption that 75% of the traffic generated by the convenience store/gas station will be pass-by trips that are already traveling on Columbia Pike during the peak hours. For the purposes of this study, it was estimated that 75% of the traffic generated by the proposed convenience store and gas station will be captured, or "pass-by" trips from the adjacent street system. However, it was estimated that none of the traffic generated by the other proposed land uses will be captured, or "pass-by" trips from the adjacent street system. Also, even though studies have shown that it is common for a portion of the trips generated by mixed-use developments will be internal to the site, it was assumed for the purposes of this study Fischbach Transportation Group (FTG, LLC) 12 of 69
14 Roderick Place, Thompson s Station, TN Traffic Impact Study March 2016 that none of the traffic generated by the proposed project will be internal. These assumptions were made because the proposed land use mixed includes relatively small-scale development, and so the potential for diverted trips and/or shared trips is reduced. Also, the conservative approach leads to projected traffic volumes and capacity analyses that will include ample storage for dedicated turn lanes. This is particularly important for intersections on major arterial roadways such as Columbia Pike. Fischbach Transportation Group (FTG, LLC) 13 of 69
15 Roderick Place, Thompson s Station, TN Traffic Impact Study March TRIP DISTRIBUTION AND TRAFFIC ASSIGNMENT For the purposes of this study, it was estimated that the trips generated by the proposed development will access the project site according to the directional distributions shown in Figures 5A, 5B, and 5C. The development of these distributions was based on the following factors: existing land use characteristics, the directions of approach of the existing traffic, the access proposed for the project, and the locations of population centers in the area. The peak hour trip generations and directional distributions were used to add the site-generated trips to the roadway system. Figures 6A, 6B, 6C, and 6D include the peak hour traffic volumes that are expected to be generated by the proposed project. Fischbach Transportation Group (FTG, LLC) 14 of 69
16 F i s c h b a c h Transportation Group, LLC Traffic Engineering and Planning 50% (50%) (50%) 50% N No Scale XX - Entering Volumes (XX) - Exiting Volumes Figure 5A. Directional Distribution of Traffic Generated by the Restaurant and Gas Station
17 10% 25% 10% 55% F i s c h b a c h Transportation Group, LLC Traffic Engineering and Planning (55%) (10%) (10%) 10% 10%(10%) (10%)10% (10%) 10% (10%) (25%) N No Scale XX - Entering Volumes (XX) - Exiting Volumes Figure 5B. Directional Distribution of Traffic Generated by the Residential Land Uses
18 F i s c h b a c h Transportation Group, LLC Traffic Engineering and Planning 65% (65%) 65% (65%) (30%) 30% (30%) (5%) 30% 5% N No Scale XX - Entering Volumes (XX) - Exiting Volumes Figure 5C. Directional Distribution of Traffic Generated by the Resort (Inn, Cottages, Restaurant, and Spa)
19 F i s c h b a c h Transportation Group, LLC Traffic Engineering and Planning 7(8) (7)6 7(8) (7)6 7(8) 6(7) 6(7) (8)7 N No Scale XX - AM Peak Hour Volumes (XX) - PM Peak Hour Volumes Figure 6A. Primary Peak Hour Traffic Volumes Generated by the Restaurant and Gas Station
20 F i s c h b a c h Transportation Group, LLC Traffic Engineering and Planning (-2)-2 (-2)-2-21(-22) 21(22) 19(20) 19(20) (-22)-21 (22)21 N No Scale XX - AM Peak Hour Volumes (XX) - PM Peak Hour Volumes Figure 6B. Pass-by Peak Hour Traffic Volumes Generated by the Restaurant and Gas Station
21 F i s c h b a c h Transportation Group, LLC Traffic Engineering and Planning 2(5) 9(31) 27(18) 5(3) (3)5 (5)2 7(8) (8)7 5(3) 2(5) 5(3) 12(8) (5)2 (14)4 N No Scale XX - AM Peak Hour Volumes (XX) - PM Peak Hour Volumes Figure 6C. Peak Hour Traffic Volumes Generated by the Residential Land Uses
22 F i s c h b a c h Transportation Group, LLC Traffic Engineering and Planning 23(19) (24)9 23(19) 9(24) 4(11) (8)10 4(11) 1(2) (8)10 (1)2 N No Scale XX - AM Peak Hour Volumes (XX) - PM Peak Hour Volumes Figure 6D. Peak Hour Traffic Volumes Generated by the Resort (Inn, Cottages, Restaurant, and Spa)
23 Roderick Place, Thompson s Station, TN Traffic Impact Study March CAPACITY ANALYSES In order to identify the projected peak hour traffic volumes at the completion of the proposed project, the trips generated by the proposed project were added to the background peak hour traffic volumes within the study area. The resulting peak hour volumes are shown in Figure 7. Using the total projected peak hour traffic volumes, capacity analyses were conducted in order to determine the impact of the proposed project on the roadway system. Specifically, in order to evaluate the need for roadway and traffic control improvements within the study area, capacity calculations were performed for the project accesses, based on the methods outlined in the Highway Capacity Manual 2010 (HCM2010). These analyses result in the determination of a Level of Service (LOS), which is a measure of evaluation is used to describe how well an intersection or roadway operates. LOS A represents free flow traffic operations, and LOS F suggests that average vehicle delays are relatively high. Table 3 presents the descriptions of LOS for unsignalized intersections. For the purposes of these analyses, two laneage scenarios were considered: 1. Initially, it was assumed that all existing laneage on Columbia Pike will be maintained. Specifically, it was assumed that Columbia Pike will continue to include one travel lane in each direction, and no dedicated left and/or right turn lanes will be provided at the project access. Also, it was initially assumed that the project access will be constructed to include one eastbound entering lane and one westbound exiting lane. 2. Additional consideration was given to a laneage scenario that includes a dedicated southbound left turn lane at each project access, as well as dedicated northbound right turn lanes at the middle and southern project accesses. Also, for this scenario, it was assumed that the project access will be constructed to include one eastbound entering lane and two westbound exiting lanes, striped as separate left and right turn lanes. The results of the capacity analyses for the existing peak hour traffic volumes are shown in Table 4, and Appendix C includes the capacity analyses worksheets. These analyses indicate the following: 1. With a two-lane cross-section on Columbia Pike and without dedicated turn lanes at the project accesses, the average delay for westbound turning movements from the project accesses will exceed 50 seconds per vehicle. However, the vehicle queues on the westbound approaches of the project accesses will be low. 2. With a two-lane cross-section on Columbia Pike, as well as a southbound left turn lane at each project access, northbound right turn lanes at the middle and southern project accesses, and separate westbound left and right turn lanes at the project access, the vehicle delays and queues will be reduced. Fischbach Transportation Group (FTG, LLC) 22 of 69
24 Roderick Place, Thompson s Station, TN Traffic Impact Study March 2016 Additional analyses were conducted to determine whether or not dedicated left and/or right turn lanes are warranted for construction on Columbia Pike at the project access. These analyses were based on the method outlined in NCHRP Report 457: Engineering Study Guide for Evaluating Intersection Improvements. The relevant charts and the results are included in Appendix D. As shown, a southbound left turn lane is warranted at each project access on Columbia Pike. Also, northbound right turn lanes are warranted at the middle and southern project accesses on Columbia Pike. Fischbach Transportation Group (FTG, LLC) 23 of 69
25 F i s c h b a c h Transportation Group, LLC Traffic Engineering and Planning 607(969) 9(31) 27(18) 5(3) (688)1297 (5)2 589(953) 23(19) 9(24) 4(11) (669)1290 (8)10 563(929) 30(35) 30(30) 38(37) (647)1270 (45)34 N No Scale XX - AM Peak Hour Volumes (XX) - PM Peak Hour Volumes Figure 7. Total Projected Peak Hour Traffic Volumes with the Completion of the Proposed Project
26 Roderick Place, Thompson s Station, TN Traffic Impact Study March 2016 TABLE 3. DESCRIPTIONS OF LOS FOR UNSIGNALIZED INTERSECTIONS Level of Service Description Average Control Delay (sec/veh) A Minimal delay < 10 B Brief delay > 10 and < 15 C Average delay > 15 and < 25 D Significant delay > 25 and < 35 E Long delay > 35 and < 50 F Extreme delay > 50 Source: Highway Capacity Manual 2010 (HCM 2010) Fischbach Transportation Group (FTG, LLC) 25 of 69
27 Roderick Place, Thompson s Station, TN Traffic Impact Study March 2016 TABLE 4. TOTAL PEAK HOUR LEVELS OF SERVICE INTERSECTION Columbia Pike and the Northern Project Access (with existing laneage) Columbia Pike and the Northern Project Access (with southbound left turn lane and separate westbound left and right turn lanes) Columbia Pike and the Middle Project Access (with existing laneage) Columbia Pike and the Middle Project Access (with southbound left turn lane and separate westbound left and right turn lanes) Columbia Pike and the Southern Project Access (with existing laneage) Columbia Pike and the Southern Project Access (with southbound left turn lane, northbound right turn lane, and separate westbound left and right turn lanes) TURNING MOVEMENT Southbound Left Turns / Thrus Westbound Left and Right Turns Southbound Left Turns Westbound Left Turns Westbound Right Turns Southbound Left Turns / Thrus Westbound Left and Right Turns Southbound Left Turns Westbound Left Turns Westbound Right Turns Southbound Left Turns / Thrus Westbound Left and Right Turns Southbound Left Turns Westbound Left Turns Westbound Right Turns AM PEAK HOUR LEVEL OF SERVICE 95 th %-ILE QUEUE PM PEAK HOUR LEVEL OF SERVICE 95 th %-ILE QUEUE LOS B 1 veh LOS A 1 veh LOS F 1 veh LOS C 1 veh LOS B 1 veh LOS A 1 veh LOS F 1 veh LOS F 1 veh LOS E 1 veh LOS B 1 veh LOS B 1 veh LOS A 1 veh LOS F 1 veh LOS E 1 veh LOS B 1 veh LOS A 1 veh LOS F 1 veh LOS F 1 veh LOS D 1 veh LOS B 1 veh LOS B 1 veh LOS A 1 veh LOS F 7 veh LOS F 4 veh LOS B 1 veh LOS A 1 veh LOS F 4 veh LOS F 3 veh LOS E 1 veh LOS B 1 veh Fischbach Transportation Group (FTG, LLC) 26 of 69
28 Roderick Place, Thompson s Station, TN Traffic Impact Study March TRAFFIC SIGNAL WARRANT ANALYSES Based on the daily trip generations and the directional distribution, hourly traffic volumes entering and exiting each project access for the Roderick Place project site were estimated, as shown in Tables 5, 6, and 7. Fischbach Transportation Group (FTG, LLC) 27 of 69
29 Roderick Place, Thompson s Station, TN Traffic Impact Study March 2016 TABLE 5. HOURLY TRAFFIC VOLUMES EXPECTED TO BE GENERATED BY THE RODERICK PLACE DEVELOPMENT INTERSECTION OF COLUMBIA PIKE AND THE NORTHERN PROJECT ACCESS HOUR % OF DAILY TRAFFIC TOTAL TRAFFIC % ENTER ENTERING TRAFFIC % EXIT EXITING TRAFFIC 12:00-1:00 AM 0.5% 3 60% 2 40% 1 1:00-2:00 AM 1.0% 5 50% 3 50% 3 2:00-3:00 AM 1.5% 8 40% 3 60% 5 3:00-4:00 AM 2.0% 11 30% 3 70% 8 4:00-5:00 AM 2.0% 11 25% 3 75% 8 5:00-6:00 AM 3.0% 16 25% 4 75% 12 6:00-7:00 AM 5.0% 27 25% 7 75% 20 7:00-8:00 AM 7.9% 42 25% 11 75% 32 8:00-9:00 AM 5.0% 27 30% 8 70% 19 9:00-10:00 AM 4.0% 22 35% 8 65% 14 10:00-11:00 AM 4.0% 22 40% 9 60% 13 11:00-12:00 N 4.0% 22 50% 11 50% 11 12:00-1:00 PM 5.0% 27 50% 13 50% 13 1:00-2:00 PM 5.0% 27 50% 13 50% 13 2:00-3:00 PM 6.0% 32 50% 16 50% 16 3:00-4:00 PM 6.0% 32 60% 19 40% 13 4:00-5:00 PM 7.0% 38 60% 23 40% 15 5:00-6:00 PM 10.5% 57 63% 36 37% 21 6:00-7:00 PM 7.0% 38 65% 24 35% 13 7:00-8:00 PM 5.0% 27 70% 19 30% 8 8:00-9:00 PM 4.0% 22 75% 16 25% 5 9:00-10:00 PM 3.0% 16 75% 12 25% 4 10:00-11:00 PM 1.0% 5 80% 4 20% 1 11:00-12:00 M 0.6% 3 70% 2 30% 1 TOTAL 100.0% Fischbach Transportation Group (FTG, LLC) 28 of 69
30 Roderick Place, Thompson s Station, TN Traffic Impact Study March 2016 TABLE 6. HOURLY TRAFFIC VOLUMES EXPECTED TO BE GENERATED BY THE RODERICK PLACE DEVELOPMENT INTERSECTION OF COLUMBIA PIKE AND THE MIDDLE PROJECT ACCESS HOUR % OF DAILY TRAFFIC TOTAL TRAFFIC % ENTER ENTERING TRAFFIC % EXIT EXITING TRAFFIC 12:00-1:00 AM 1:00-2:00 AM 2:00-3:00 AM 3:00-4:00 AM 4:00-5:00 AM 5:00-6:00 AM 3.0% 33 75% 25 25% 8 6:00-7:00 AM 4.0% 44 75% 33 25% 11 7:00-8:00 AM 4.1% 46 72% 33 28% 13 8:00-9:00 AM 5.0% 56 70% 39 30% 17 9:00-10:00 AM 6.0% 67 65% 43 35% 23 10:00-11:00 AM 7.0% 78 60% 47 40% 31 11:00-12:00 N 8.0% 89 55% 49 45% 40 12:00-1:00 PM 9.0% % 50 50% 50 1:00-2:00 PM 9.0% % 50 50% 50 2:00-3:00 PM 9.0% % 50 50% 50 3:00-4:00 PM 8.0% 89 45% 40 55% 49 4:00-5:00 PM 6.0% 67 45% 30 55% 37 5:00-6:00 PM 5.5% 61 43% 26 57% 35 6:00-7:00 PM 5.0% 56 30% 17 70% 39 7:00-8:00 PM 4.0% 44 25% 11 75% 33 8:00-9:00 PM 3.0% 33 20% 7 80% 27 9:00-10:00 PM 2.0% 22 15% 3 85% 19 10:00-11:00 PM 1.4% 16 10% 2 90% 14 11:00-12:00 M 1.0% 11 5% 1 95% 11 TOTAL 100.0% 1, Fischbach Transportation Group (FTG, LLC) 29 of 69
31 Roderick Place, Thompson s Station, TN Traffic Impact Study March 2016 TABLE 7. HOURLY TRAFFIC VOLUMES EXPECTED TO BE GENERATED BY THE RODERICK PLACE DEVELOPMENT INTERSECTION OF COLUMBIA PIKE AND THE SOUTHERN PROJECT ACCESS HOUR % OF DAILY TRAFFIC TOTAL TRAFFIC % ENTER ENTERING TRAFFIC % EXIT EXITING TRAFFIC 12:00-1:00 AM 0.5% 15 50% 7 50% 7 1:00-2:00 AM 1.0% 30 50% 15 50% 15 2:00-3:00 AM 1.0% 30 50% 15 50% 15 3:00-4:00 AM 2.0% 60 50% 30 50% 30 4:00-5:00 AM 2.0% 60 50% 30 50% 30 5:00-6:00 AM 2.0% 60 50% 30 50% 30 6:00-7:00 AM 2.0% 60 50% 30 50% 30 7:00-8:00 AM 2.1% 63 48% 30 52% 33 8:00-9:00 AM 4.0% % 60 50% 60 9:00-10:00 AM 6.0% % 90 50% 90 10:00-11:00 AM 7.0% % % :00-12:00 N 8.0% % % :00-1:00 PM 9.0% % % 135 1:00-2:00 PM 9.0% % % 135 2:00-3:00 PM 8.0% % % 120 3:00-4:00 PM 7.0% % % 105 4:00-5:00 PM 5.0% % 75 50% 75 5:00-6:00 PM 4.9% % 81 45% 66 6:00-7:00 PM 5.0% % 75 50% 75 7:00-8:00 PM 5.0% % 75 50% 75 8:00-9:00 PM 5.0% % 75 50% 75 9:00-10:00 PM 3.0% 90 45% 40 55% 49 10:00-11:00 PM 1.0% 30 45% 13 55% 16 11:00-12:00 M 0.5% 15 45% 7 55% 8 TOTAL 100.0% 2,998 1,498 1,500 Fischbach Transportation Group (FTG, LLC) 30 of 69
32 Roderick Place, Thompson s Station, TN Traffic Impact Study March 2016 The Federal Highway Administration has published the Manual on Uniform Traffic Control Devices (MUTCD 2010), which includes traffic signal warrants that help traffic engineering professionals to identify when a traffic signal installation is justified at a particular location. The warrants include minimum conditions that are compared to existing or projected traffic conditions, and typically, traffic signals should not be installed unless at least one of the MUTCD warrants, as described in Appendix E, is met. It is important to note that the Manual on Uniform Traffic Control Devices (MUTCD 2010) stipulates that the signal warrant thresholds may be reduced by 30% if the posted or statutory speed limit or the 85 th percentile speed on the major street exceeds 40 mph Since a 45 mph speed limit is currently posted on Columbia Pike, the reduced traffic signal warrant thresholds were considered appropriate for the intersection of Columbia Pike and the project accesses. The projected traffic volumes at the intersection of Columbia Pike and the project accesses were compared to the reduced signal warrant thresholds, and the results of these analyses are included in Tables 8, 9, and 10. These results indicate that the total projected hourly traffic volumes at the intersection of Columbia Pike and the southern project site will satisfy two of the volume-related traffic signal warrants. Fischbach Transportation Group (FTG, LLC) 31 of 69
33 Roderick Place, Thompson s Station, TN Traffic Impact Study March 2016 TABLE 8. TRAFFIC SIGNAL WARRANT ANALYSIS INTERSECTION OF COLUMBIA PIKE AND THE NORTHERN PROJECT ACCESS HOUR TRAFFIC VOLUMES Northern Access SATISFY REDUCED WARRANTS? Warrant 1 Condition A Warrant 1 Condition B Warrant 2 10:00-11:00 AM :00-12:00 noon :00 noon - 1:00 PM :00-2:00 PM :00-3:00 PM :00-4:00 PM :00-5:00 PM :00-6:00 PM :00-7:00 PM :00-8:00 PM Fischbach Transportation Group (FTG, LLC) 32 of 69
34 Roderick Place, Thompson s Station, TN Traffic Impact Study March 2016 TABLE 9. TRAFFIC SIGNAL WARRANT ANALYSIS INTERSECTION OF COLUMBIA PIKE AND THE MIDDLE PROJECT ACCESS HOUR TRAFFIC VOLUMES Middle Access (Westbound) SATISFY REDUCED WARRANTS? Warrant 1 Condition A Warrant 1 Condition B Warrant 2 10:00-11:00 AM :00-12:00 noon :00 noon - 1:00 PM :00-2:00 PM :00-3:00 PM :00-4:00 PM :00-5:00 PM :00-6:00 PM :00-7:00 PM :00-8:00 PM Fischbach Transportation Group (FTG, LLC) 33 of 69
35 Roderick Place, Thompson s Station, TN Traffic Impact Study March 2016 TABLE 10. TRAFFIC SIGNAL WARRANT ANALYSIS INTERSECTION OF COLUMBIA PIKE AND THE SOUTHERN PROJECT ACCESS HOUR TRAFFIC VOLUMES Southern Access (Westbound) SATISFY REDUCED WARRANTS? Warrant 1 Condition A Warrant 1 Condition B Warrant 2 10:00-11:00 AM Yes Yes 11:00-12:00 noon Yes Yes 12:00 noon - 1:00 PM Yes Yes 1:00-2:00 PM Yes Yes 2:00-3:00 PM Yes Yes 3:00-4:00 PM Yes Yes 4:00-5:00 PM Yes -- 5:00-6:00 PM :00-7:00 PM Yes -- 7:00-8:00 PM Yes -- Fischbach Transportation Group (FTG, LLC) 34 of 69
36 Roderick Place, Thompson s Station, TN Traffic Impact Study March CONCLUSIONS AND RECOMMENDATIONS The analyses presented in this study indicate that the following infrastructure improvements should be provided in order to accommodate the total projected traffic volumes with the completion of the proposed mixed-use project: 1. Each project access should be constructed to include one eastbound entering lane and two westbound exiting lanes. At the northern and middle project accesses, each of the westbound exiting lanes should include at least 100 feet of storage and should be designed and constructed according to AASHTO standards. At the southern project access, the westbound left turn lane should include at least 200 feet of storage, and the westbound right lane should include at least 100 feet of storage. These turn lanes should be designed and constructed according to AASHTO standards. 2. A southbound left turn lane should be constructed on Columbia Pike at each project access. Each of these turn lanes should be 12 feet wide and include at least 100 feet of storage, designed and constructed according to AASHTO standards. It is important to note that these turn lanes are warranted because of the significantly high northbound and southbound peak hour traffic volumes on Columbia Pike. Therefore, these turn lanes should be provided when each project access is constructed in order to facilitate safe and efficient turning movements at these locations. 3. Northbound right turn lanes should be constructed on Columbia Pike at the middle and southern project accesses. Each of these turn lanes should be 12 feet wide and include at least 100 feet of storage, designed and constructed according to AASHTO standards. It is important to note that these turn lanes are warranted because of the significantly high northbound peak hour traffic volumes on Columbia Pike. Therefore, these turn lanes should be provided when each project access is constructed in order to facilitate safe and efficient turning movements at these locations. It is important to note that the westbound left turns from the project accesses onto southbound Columbia Pike are expected to operate at poor LOS during both peak hours. However, these results are typical for unsignalized accesses on major arterial roadways. Also, the vehicle queues expected for each of these turning movements indicate that the turning movements at these locations will operate acceptably and appropriately. Therefore, the recommended laneage and stop control on the project accesses are the appropriate initial treatments for these intersections. However, the projected traffic volumes at the intersection of Columbia Pike and the southern project access exceed the thresholds that would indicate that traffic signalization will be warranted at this location. Therefore, peak hour traffic counts should be conducted at all three project accesses when the development is complete. Based on the updated traffic counts, capacity analyses and signal warrant analyses should be completed in order to confirm the appropriate traffic control at the intersection of Columbia Pike and the southern project access. Fischbach Transportation Group (FTG, LLC) 35 of 69
37 Roderick Place, Thompson s Station, TN Traffic Impact Study March 2016 Finally, consideration was given to the existing laneage on northbound and southbound Columbia Pike in the vicinity of the project site. Currently, this major arterial roadway includes one travel lane in each direction and provides a connection between the Cities and Towns of Columbia, Spring Hill, Thompson s Station, and Franklin. Also, this facility includes an interchange with State Route 840 approximately ½ mile north of the proposed project site. In the vicinity of the bridge over State Route 840, Columbia Pike has been widened to a five-lane cross-section, and this laneage extends approximately 1,250 feet south of the ramps for eastbound State Route 840. Based on the significant northbound and southbound traffic volumes on Columbia Pike through Thompson s Station, it would be reasonable to pursue an extension of this five-lane cross-section from its existing terminus north of Critz Lane to Thompson s Station Road. However, this additional capacity would likely mean higher vehicle speeds on Columbia Pike and, potentially, even higher northbound and southbound traffic volumes. Therefore, the ultimate character and cross-section of Columbia Pike will likely be an on-going discussion between the Town of Thompson s Station and the Tennessee Department of Transportation (TDOT). Whether Columbia Pike includes one or two travel lanes in each direction along the frontage of the project site, the recommended laneage and traffic control at the project accesses will facilitate safe and efficient turning movements for the Roderick Place project. Fischbach Transportation Group (FTG, LLC) 36 of 69
38 Roderick Place, Thompson s Station, TN Traffic Impact Study March 2016 APPENDIX A EXISTING TRAFFIC COUNTS Fischbach Transportation Group (FTG, LLC) 37 of 69
39
40
41
42
43 Roderick Place, Thompson s Station, TN Traffic Impact Study March 2016 APPENDIX B TRIP GENERATION Fischbach Transportation Group (FTG, LLC) 42 of 69
44 Roderick Place, Thompson s Station, TN Traffic Impact Study March 2016 TRIP GENERATION CALCULATIONS High-Turnover Sit-Down Restaurant The following calculations are based on the data compiled for ITE Land Use Code 932. Average Daily Traffic T = (X) T = (3.768) T = 480 vehicles Enter = 0.50 (480) = 240 vehicles Exit = 0.50 (480) = 240 vehicles AM traffic during peak hour of adjacent street T = (X) T = (3.768) T = 41 vehicles Enter = 0.55 (41) = 23 vehicles Exit = 0.45 (41) = 18 vehicles PM traffic during peak hour of adjacent street T = 9.85 (X) T = 9.85 (3.768) T = 37 vehicles Enter = 0.60 (37) = 22 vehicles Exit = 0.40 (37) = 15 vehicles Fischbach Transportation Group (FTG, LLC) 43 of 69
45 Roderick Place, Thompson s Station, TN Traffic Impact Study March 2016 TRIP GENERATION CALCULATIONS Convenience Store and Gas Station The following calculations are based on the data compiled for ITE Land Use Code 852. Average Daily Traffic T = (X) T = (4) T = 2,170 vehicles Enter = 0.50 (2,170) = 1,085 vehicles Exit = 0.50 (2,170) = 1,085 vehicles AM traffic during peak hour of adjacent street T = (X) T = (4) T = 66 vehicles Enter = 0.50 (66) = 33 vehicles Exit = 0.50 (66) = 33 vehicles PM traffic during peak hour of adjacent street T = (X) T = (4) T = 76 vehicles Enter = 0.50 (76) = 38 vehicles Exit = 0.50 (76) = 38 vehicles Fischbach Transportation Group (FTG, LLC) 44 of 69
46 Roderick Place, Thompson s Station, TN Traffic Impact Study March 2016 TRIP GENERATION CALCULATIONS - Single-family Homes The following calculations are based on the data compiled for ITE Land Use Code 210. Average Daily Traffic T = 9.52 (X) T = 9.52 (87) T = 828 vehicles Enter = 0.50 (828) = 414 vehicles Exit = 0.50 (828) = 414 vehicles AM traffic during peak hour of adjacent street T = 0.75 (X) T = 0.75 (87) T = 65 vehicles Enter = 0.25 (65) = 16 vehicles Exit = 0.75 (65) = 49 vehicles PM traffic during peak hour of adjacent street T = 1.00 (X) T = 1.00 (87) T = 87 vehicles Enter = 0.63 (87) = 55 vehicles Exit = 0.37 (87) = 32 vehicles Fischbach Transportation Group (FTG, LLC) 45 of 69
47 Roderick Place, Thompson s Station, TN Traffic Impact Study March 2016 TRIP GENERATION CALCULATIONS Resort Hotel The following calculations are based on the data compiled for ITE Land Use Code 330. Average Daily Traffic (from LUC 310) T = 8.92 (X) T = 8.92 (131) T = 1,168 vehicles Enter = 0.50 (1,168) = 584 vehicles Exit = 0.50 (1,168) = 584 vehicles AM traffic during peak hour of adjacent street T = 0.37 (X) T = 0.37 (131) T = 49 vehicles Enter = 0.72 (49) = 35 vehicles Exit = 0.28 (49) = 14 vehicles PM traffic during peak hour of adjacent street T = 0.49 (X) T = 0.49 (131) T = 65 vehicles Enter = 0.49 (65) = 28 vehicles Exit = 0.51 (65) = 37 vehicles Fischbach Transportation Group (FTG, LLC) 46 of 69
48 Roderick Place, Thompson s Station, TN Traffic Impact Study March 2016 APPENDIX C CAPACITY ANALYSES Fischbach Transportation Group (FTG, LLC) 47 of 69
49 HCS 2010 Two-Way Stop Control Summary Report General Information Site Information Analyst FTG Intersection Columbia and N. Project Agency/Co. FTG Jurisdiction Thompson's Station, TN Date Performed Mar 2016 East/West Street N. Project Access Analysis Year 2016 North/South Street Columbia Pike Time Analyzed AM Peak Hour Peak Hour Factor 0.85 Intersection Orientation North-South Analysis Time Period (hrs) 0.25 Project Description (Total) Lanes Major Street: North-South Vehicle Volumes and Adjustments Approach Eastbound Westbound Northbound Southbound Movement U L T R U L T R U L T R U L T R Priority U U Number of Lanes Configuration LR TR LT Volume (veh/h) Percent Heavy Vehicles Proportion Time Blocked Right Turn Channelized No No No No Median Type Undivided Median Storage Delay, Queue Length, and Level of Service Flow Rate (veh/h) Capacity v/c Ratio % Queue Length Control Delay (s/veh) Level of Service (LOS) F B Approach Delay (s/veh) Approach LOS F A Copyright 2016 University of Florida. All Rights Reserved. HCS 2010 TWSC Version 6.70 Generated: 3/23/ :53:26 AM 1_fuam.xtw
50 HCS 2010 Two-Way Stop Control Summary Report General Information Site Information Analyst FTG Intersection Columbia and N. Project Agency/Co. FTG Jurisdiction Thompson's Station, TN Date Performed Mar 2016 East/West Street N. Project Access Analysis Year 2016 North/South Street Columbia Pike Time Analyzed AM Peak Hour Peak Hour Factor 0.85 Intersection Orientation North-South Analysis Time Period (hrs) 0.25 Project Description (Total) Lanes Major Street: North-South Vehicle Volumes and Adjustments Approach Eastbound Westbound Northbound Southbound Movement U L T R U L T R U L T R U L T R Priority U U Number of Lanes Configuration L R TR L T Volume (veh/h) Percent Heavy Vehicles Proportion Time Blocked Right Turn Channelized No No No No Median Type Undivided Median Storage Delay, Queue Length, and Level of Service Flow Rate (veh/h) Capacity v/c Ratio % Queue Length Control Delay (s/veh) Level of Service (LOS) F E B Approach Delay (s/veh) Approach LOS E A Copyright 2016 University of Florida. All Rights Reserved. HCS 2010 TWSC Version 6.70 Generated: 3/23/ :55:17 AM 1_fuam_imp.xtw
51 HCS 2010 Two-Way Stop Control Summary Report General Information Site Information Analyst FTG Intersection Columbia and N. Project Agency/Co. FTG Jurisdiction Thompson's Station, TN Date Performed Mar 2016 East/West Street N. Project Access Analysis Year 2016 North/South Street Columbia Pike Time Analyzed PM Peak Hour Peak Hour Factor 0.85 Intersection Orientation North-South Analysis Time Period (hrs) 0.25 Project Description (Total) Lanes Major Street: North-South Vehicle Volumes and Adjustments Approach Eastbound Westbound Northbound Southbound Movement U L T R U L T R U L T R U L T R Priority U U Number of Lanes Configuration LR TR LT Volume (veh/h) Percent Heavy Vehicles Proportion Time Blocked Right Turn Channelized No No No No Median Type Undivided Median Storage Delay, Queue Length, and Level of Service Flow Rate (veh/h) Capacity v/c Ratio % Queue Length Control Delay (s/veh) Level of Service (LOS) C A Approach Delay (s/veh) Approach LOS C A Copyright 2016 University of Florida. All Rights Reserved. HCS 2010 TWSC Version 6.70 Generated: 3/23/ :56:13 AM 1_fupm.xtw
52 HCS 2010 Two-Way Stop Control Summary Report General Information Site Information Analyst FTG Intersection Columbia and N. Project Agency/Co. FTG Jurisdiction Thompson's Station, TN Date Performed Mar 2016 East/West Street N. Project Access Analysis Year 2016 North/South Street Columbia Pike Time Analyzed PM Peak Hour Peak Hour Factor 0.85 Intersection Orientation North-South Analysis Time Period (hrs) 0.25 Project Description (Total) Lanes Major Street: North-South Vehicle Volumes and Adjustments Approach Eastbound Westbound Northbound Southbound Movement U L T R U L T R U L T R U L T R Priority U U Number of Lanes Configuration L R TR L T Volume (veh/h) Percent Heavy Vehicles Proportion Time Blocked Right Turn Channelized No No No No Median Type Undivided Median Storage Delay, Queue Length, and Level of Service Flow Rate (veh/h) Capacity v/c Ratio % Queue Length Control Delay (s/veh) Level of Service (LOS) F B A Approach Delay (s/veh) Approach LOS C A Copyright 2016 University of Florida. All Rights Reserved. HCS 2010 TWSC Version 6.70 Generated: 3/23/ :56:56 AM 1_fupm_imp.xtw
53 HCS 2010 Two-Way Stop Control Summary Report General Information Site Information Analyst FTG Intersection Columbia and Mid Project Agency/Co. FTG Jurisdiction Thompson's Station, TN Date Performed Mar 2016 East/West Street Middle Project Access Analysis Year 2016 North/South Street Columbia Pike Time Analyzed AM Peak Hour Peak Hour Factor 0.85 Intersection Orientation North-South Analysis Time Period (hrs) 0.25 Project Description (Total) Lanes Major Street: North-South Vehicle Volumes and Adjustments Approach Eastbound Westbound Northbound Southbound Movement U L T R U L T R U L T R U L T R Priority U U Number of Lanes Configuration LR TR LT Volume (veh/h) Percent Heavy Vehicles Proportion Time Blocked Right Turn Channelized No No No No Median Type Undivided Median Storage Delay, Queue Length, and Level of Service Flow Rate (veh/h) Capacity v/c Ratio % Queue Length Control Delay (s/veh) Level of Service (LOS) F B Approach Delay (s/veh) Approach LOS F A Copyright 2016 University of Florida. All Rights Reserved. HCS 2010 TWSC Version 6.70 Generated: 3/23/ :57:44 AM 2_fuam.xtw
54 HCS 2010 Two-Way Stop Control Summary Report General Information Site Information Analyst FTG Intersection Columbia and Mid Project Agency/Co. FTG Jurisdiction Thompson's Station, TN Date Performed Mar 2016 East/West Street Middle Project Access Analysis Year 2016 North/South Street Columbia Pike Time Analyzed AM Peak Hour Peak Hour Factor 0.85 Intersection Orientation North-South Analysis Time Period (hrs) 0.25 Project Description (Total) Lanes Major Street: North-South Vehicle Volumes and Adjustments Approach Eastbound Westbound Northbound Southbound Movement U L T R U L T R U L T R U L T R Priority U U Number of Lanes Configuration L R T R L T Volume (veh/h) Percent Heavy Vehicles Proportion Time Blocked Right Turn Channelized No No No No Median Type Undivided Median Storage Delay, Queue Length, and Level of Service Flow Rate (veh/h) Capacity v/c Ratio % Queue Length Control Delay (s/veh) Level of Service (LOS) F D B Approach Delay (s/veh) Approach LOS F A Copyright 2016 University of Florida. All Rights Reserved. HCS 2010 TWSC Version 6.70 Generated: 3/23/2016 1:00:18 PM 2_fuam_imp.xtw
55 HCS 2010 Two-Way Stop Control Summary Report General Information Site Information Analyst FTG Intersection Columbia and Mid Project Agency/Co. FTG Jurisdiction Thompson's Station, TN Date Performed Mar 2016 East/West Street Middle Project Access Analysis Year 2016 North/South Street Columbia Pike Time Analyzed PM Peak Hour Peak Hour Factor 0.85 Intersection Orientation North-South Analysis Time Period (hrs) 0.25 Project Description (Total) Lanes Major Street: North-South Vehicle Volumes and Adjustments Approach Eastbound Westbound Northbound Southbound Movement U L T R U L T R U L T R U L T R Priority U U Number of Lanes Configuration LR TR LT Volume (veh/h) Percent Heavy Vehicles Proportion Time Blocked Right Turn Channelized No No No No Median Type Undivided Median Storage Delay, Queue Length, and Level of Service Flow Rate (veh/h) Capacity v/c Ratio % Queue Length Control Delay (s/veh) Level of Service (LOS) E A Approach Delay (s/veh) Approach LOS E A Copyright 2016 University of Florida. All Rights Reserved. HCS 2010 TWSC Version 6.70 Generated: 3/23/ :59:12 AM 2_fupm.xtw
56 HCS 2010 Two-Way Stop Control Summary Report General Information Site Information Analyst FTG Intersection Columbia and Mid Project Agency/Co. FTG Jurisdiction Thompson's Station, TN Date Performed Mar 2016 East/West Street Middle Project Access Analysis Year 2016 North/South Street Columbia Pike Time Analyzed PM Peak Hour Peak Hour Factor 0.85 Intersection Orientation North-South Analysis Time Period (hrs) 0.25 Project Description (Total) Lanes Major Street: North-South Vehicle Volumes and Adjustments Approach Eastbound Westbound Northbound Southbound Movement U L T R U L T R U L T R U L T R Priority U U Number of Lanes Configuration L R T R L T Volume (veh/h) Percent Heavy Vehicles Proportion Time Blocked Right Turn Channelized No No No No Median Type Undivided Median Storage Delay, Queue Length, and Level of Service Flow Rate (veh/h) Capacity v/c Ratio % Queue Length Control Delay (s/veh) Level of Service (LOS) F B A Approach Delay (s/veh) Approach LOS D A Copyright 2016 University of Florida. All Rights Reserved. HCS 2010 TWSC Version 6.70 Generated: 3/23/2016 1:00:49 PM 2_fupm_imp.xtw
57 HCS 2010 Two-Way Stop Control Summary Report General Information Site Information Analyst FTG Intersection Columbia and S. Project Agency/Co. FTG Jurisdiction Thompson's Station, TN Date Performed Mar 2016 East/West Street S. Project Access Analysis Year 2016 North/South Street Columbia Pike Time Analyzed AM Peak Hour Peak Hour Factor 0.85 Intersection Orientation North-South Analysis Time Period (hrs) 0.25 Project Description (Total) Lanes Major Street: North-South Vehicle Volumes and Adjustments Approach Eastbound Westbound Northbound Southbound Movement U L T R U L T R U L T R U L T R Priority U U Number of Lanes Configuration LR TR LT Volume (veh/h) Percent Heavy Vehicles Proportion Time Blocked Right Turn Channelized No No No No Median Type Undivided Median Storage Delay, Queue Length, and Level of Service Flow Rate (veh/h) Capacity v/c Ratio % Queue Length Control Delay (s/veh) Level of Service (LOS) F B Approach Delay (s/veh) Approach LOS F A Copyright 2016 University of Florida. All Rights Reserved. HCS 2010 TWSC Version 6.70 Generated: 3/23/ :00:48 PM 3_fuam.xtw
58 HCS 2010 Two-Way Stop Control Summary Report General Information Site Information Analyst FTG Intersection Columbia and S. Project Agency/Co. FTG Jurisdiction Thompson's Station, TN Date Performed Mar 2016 East/West Street S. Project Access Analysis Year 2016 North/South Street Columbia Pike Time Analyzed AM Peak Hour Peak Hour Factor 0.85 Intersection Orientation North-South Analysis Time Period (hrs) 0.25 Project Description (Total) Lanes Major Street: North-South Vehicle Volumes and Adjustments Approach Eastbound Westbound Northbound Southbound Movement U L T R U L T R U L T R U L T R Priority U U Number of Lanes Configuration L R T R L T Volume (veh/h) Percent Heavy Vehicles Proportion Time Blocked Right Turn Channelized No No No No Median Type Undivided Median Storage Delay, Queue Length, and Level of Service Flow Rate (veh/h) Capacity v/c Ratio % Queue Length Control Delay (s/veh) Level of Service (LOS) F E B Approach Delay (s/veh) Approach LOS F A Copyright 2016 University of Florida. All Rights Reserved. HCS 2010 TWSC Version 6.70 Generated: 3/23/ :01:23 PM 3_fuam_imp.xtw
59 HCS 2010 Two-Way Stop Control Summary Report General Information Site Information Analyst FTG Intersection Columbia and S. Project Agency/Co. FTG Jurisdiction Thompson's Station, TN Date Performed Mar 2016 East/West Street S. Project Access Analysis Year 2016 North/South Street Columbia Pike Time Analyzed PM Peak Hour Peak Hour Factor 0.85 Intersection Orientation North-South Analysis Time Period (hrs) 0.25 Project Description (Total) Lanes Major Street: North-South Vehicle Volumes and Adjustments Approach Eastbound Westbound Northbound Southbound Movement U L T R U L T R U L T R U L T R Priority U U Number of Lanes Configuration LR TR LT Volume (veh/h) Percent Heavy Vehicles Proportion Time Blocked Right Turn Channelized No No No No Median Type Undivided Median Storage Delay, Queue Length, and Level of Service Flow Rate (veh/h) Capacity v/c Ratio % Queue Length Control Delay (s/veh) Level of Service (LOS) F A Approach Delay (s/veh) Approach LOS F A Copyright 2016 University of Florida. All Rights Reserved. HCS 2010 TWSC Version 6.70 Generated: 3/23/ :02:12 PM 3_fupm.xtw
60 HCS 2010 Two-Way Stop Control Summary Report General Information Site Information Analyst FTG Intersection Columbia and S. Project Agency/Co. FTG Jurisdiction Thompson's Station, TN Date Performed Mar 2016 East/West Street S. Project Access Analysis Year 2016 North/South Street Columbia Pike Time Analyzed PM Peak Hour Peak Hour Factor 0.85 Intersection Orientation North-South Analysis Time Period (hrs) 0.25 Project Description (Total) Lanes Major Street: North-South Vehicle Volumes and Adjustments Approach Eastbound Westbound Northbound Southbound Movement U L T R U L T R U L T R U L T R Priority U U Number of Lanes Configuration L R T R L T Volume (veh/h) Percent Heavy Vehicles Proportion Time Blocked Right Turn Channelized No No No No Median Type Undivided Median Storage Delay, Queue Length, and Level of Service Flow Rate (veh/h) Capacity v/c Ratio % Queue Length Control Delay (s/veh) Level of Service (LOS) F B A Approach Delay (s/veh) Approach LOS F A Copyright 2016 University of Florida. All Rights Reserved. HCS 2010 TWSC Version 6.70 Generated: 3/23/ :02:40 PM 3_fupm_imp.xtw
61 Roderick Place, Thompson s Station, TN Traffic Impact Study March 2016 APPENDIX D RELEVANT PAGES FROM NCHRP REPORT 457: ENGINEERING STUDY GUIDE FOR EVALUATING INTERSECTION IMPROVEMENTS Fischbach Transportation Group (FTG, LLC) 60 of 69

62 Tlr Ir TRANSPORTATION RESEARCH BOARD


63 21 can also indirectly reduce the delay to the left-tum or through movements by lessening their need to compete for service with the light-tum movement. One disadvantage of adding a lane to the minor-road apploach is that it may require reallocating the existing pavement or widening of the approach cross section, Sometimes the pavement width needed for the additional lane is available within the existing roadway cross section. In this instance, the only impact is a realiocation ofthe paved surface through modification of the pavement markings. However, in downtown settings this reallocation may require the removal of some ctub parking stalls and can affect adjacent business significantly. Occasionally, the cross section must be widened to provide for the additional lane. If the needed lane width can be provided within the available right-of-way, the cost may be limited to that of construction. However, if additional right-of-way is needed, the costs of acquiring this property in urban settings can be high. Guidance. The literature does not offer guidance regarding conditions where a second approach lane would benefit from the operation of a minor-road approach. However, the procedures in Chapter 17 of the Highway Capacity Mawnl 2000 (1 5) can be used to identifli major- and minor- road volume combinations that would beneflt operationally from flre provision ofa second approach lane or bay. Bonneson and Fontaine (20) developed Figure 2-4 usrng these procedures and an assumed upper limit of 0.7 for the shared-lane, minorroad volume-to-capacity ratio. Applica-tion. Fi e 2-4 indicates thc eonditions that may justifi the use of two approach lanes. Use of the information in this figure requires two types of data: 1. Major-road approach volume for the peak hour of the average day and 2. Minor-road tum movement volume for the peak hour of the average ciay (used to compute right-turn percentage). Ef!> =o Sc.!o r!.jf oo trg b!-.ee =E s ttre=ff--eht-."-".:kl Bo Major Road Volume (total of bolh dlrections), veh/h l;igure 2-4. Guidr:finc Jitr dereruinirtg rtittorr.oud uplttttrtr.:lt,,qcontcfrr {.ti l:,l)tl-t\'oy tlt,tls-r:ontrollell inltttset:littu-t Figure 2-4 would be used once for each minor-road approach to the intersection. The appropriate trend line would be ideutified on the basis of the percentage of right-tums on the subject minor-road approach. If the volume combination for the major and minor roads intersects above or to the right ofthis trend line. a second traffic lane should be considered for the subject minor-road approach. Ifa bay is selected for addition to the intersection, it should be long enough to store vehicles 95 percent of the time (i.e., the bay should not overflow more than 5 percent of the tirne). Techniques for estimating the 95rh percentile storage length are provided in the section, Increase the Length of the Bay. Add a Left-Turn Bay on the Major Road Introduction. Provision of a left-hun bay on the rnajor road to a twc-way stop-controlled intersection can significantly improve operations and safety at the intersection. A left-tum bay effectively separates those vehicles that are slowing or stopped to turn from those vehicles in through traffic lanes. This separation minimizes turn-related crashes and eliminates unnecessary delay to through vehicles. Data reported by Neuman (2 l) indicale that the crash rate for' unsignalized intersections can be reduced by 35 to 75 percent through the provision of a left-turn bay. One disadvantage of adding a bay to the major-road approach is that it may require reallocating the existing pavement or widening of the approach cross section. Sornetirnes the pavement width needed for the additional lane is available within the existing roadway cross section. However, in downtown settings this reallocation may require the rernoval of some culb parking stalls and can affect adjacentbusiness significantly. Occasionally, the cross section mustbe widened to provide for the tum bay, Ifthe needed width can be provided within the available right-of-way, the cost may be limited to that of construction. Howeveq if additional right-of-way is needed, tlle sosts ofacquiring this property in urban settings can be high. Guidance. Neuman (21) suggests that the following guidelines should be used to determine when to provide a leffturu bary on the major road of a two-way stop-controlled intersection: l. A left-hrn lane should be considered at any median crossover on a divided, high-speed road. 2. A left-tum lane should be provided on the unstopped approach of a high-speed nu'al highway when it intersects with other arterials or collectors. 3. A left-hun lane is recommended on the unstopped approach of any intersection when the combination of intersection volumes intersect above or.to the right of the appropriate trend line shown in Figure 2-5.
 Advanclng Volure (Vj, veh/h (cl! -^^ = ruu f soo tl E 4oo I.oo Et) E i; 200 oc.")

, veh/h (d) Application.")
64 f zoo o U ooo yl E 400 g 3oo.E 2oo o.t 1oo o U eft-tum lfeatmont notwanant d. TwGLane Road - 60 k wtl 5% lett-turns in VA f zoo {J 1 ooo 3 uoo tf E rnn I.oo E'' tr '6 700 o & roo o i":#ii, l\,.l',\ \ \ Mvancing Volune (VJ, veh/h (a) Advanclng Volure (Vj, veh/h (cl! -^^ = ruu f soo tl E 4oo I.oo Et) E i; 200 oc.^^ o F igtrrt )--5 Two-Lane Road - 80 km/h (50 mph) 5% l tt-h,rrns h V^ )itt.lwaranted, Advancing Volure (Vj, vehlh (h) 2000 o 1 rsoo I! rooo E ctl 'a 500 o e o 0 Uuit e!iele/rlt"rlcrt:rminingtltantetl'lilrumuftlr-rllttdlefl-ttlrno.vtl!cl f,lote: When Vo < 400 veh/h (dashed tine), a t ft{um hre b rct norrelv warrant d unle6s the advanchg volure (Va) in lh 6are direcilon as tho left.turning lrafftc exceeds 4O0 veh/h (V^ >,loo veh/h) Four-Lane LJndi\,lded Road Left.Turn Volune (Vr), veh/h (d) Application. The guidance stated in the preceding section defines the conditions that rnay justifu the provision of a left-turn bay. Application of this guidance requires two types ofdata: 1. Major-road turn movement volume for the peak hour ofthe average day and 2. Major-road 85tr'percentile speed (posted speed can be substituted if data are unavailable). Use of Figure 2-5 requires determination of the opposing volume, the advancing vohune, and the operating speed. The opposing volume should include only the right-turn and through movements on the approach across from (and heading in the opposite direction of) the subject major-road approach. 'fhe advancing volume should inclucie the left-turn, right-furn, and through movements on the subject approach. The operating speed can be estimated as the 85d'percentile speed. Ifthe operating speed does not coincide with 60, 80, or 100 km/h (i.e., 40, 50, or 60 mph), then interpolation can be used or, as a more conselyative approach, the operating speed can be rounded up to the nearest speed for which a figure is provided. 'In appiication, Figure 2-5 is used once for each major-road approach to the intersection. The appropriate trend line is identified on the basis of the percentage of left-trrns on the subject major-road approach. Ifthe advancing and opposing volune combination intersects above or to the right of this trend line, a left-turn bay should be considered for the subject apploach" Ifa bay is inciudeci at the intersection, it shouid be long enough to store left-tuin vehicles 99.5 percent of the time (i.e., the bay should not overflow more than 0.5 percent of the time). Techniques for estimating this storage length ar-e provided in the section, lncrease the Length ofthe Tum Bay. Add a Right-Turn Bay on the Major Road Introduction. Provision of a right-tum bay on the major road to a two-way stop-controlled intersection can signifi-
 and eliminates rmnecessary delay to through vehicles.")

65 LJ cantly improve operations and safety at the intersection. A right-tum bay effectively separates those vehicles that are slowing or stopped to tum frorn those vehicles in the through traffic lanes. This separation minimizes turn-related collisions (e.g,, angle, rear:end, and same-direction-sidesv/ipe) and eliminates rmnecessary delay to through vehicles. One disadvantage of adding a bay to the major-road approach is tlmt it may require reallocafing the existing pavement or widening of the approach cross section. Sometimes the pavement width needed for the additional lane is available withinfhe existing roadway cross section. However, in downtown settings this reallocation may require the removal of some curb parking stalls ancl can affect adjacent business significantly. Occasionally, the cross section must be widened to provide for the turn bay. Ifthe needed width can be provided within the available right-of-way, the cost may be limited to that of construction. However, if additional right-of-way is needed, the costs ofacquiring this property in urban settings can be high. Guidance. Hasan and Stokes (22) developed guidelines for determining when to provide a right-tum bay on the major road of a two-way stop-controlled intersection. These guidelincs wcre based on an evaluation of the opcrating and collision costs associated with the right-turn maneuver relative to the cost of constructing a right-turn bay. The operating costs included those of road-user fuel and delay. Separate guidelines were developed for two-lane and fourjane roadways, These guidelines are shown in Figule 2-6. Application. The guiciance described in the preceding section defines conditions that may justify the prorrision of a right-tum bay. Application ofthis guidance requires two types ofdata: L Major-road tum movement volume for the peak hour. ofthe average day and 2. Major-road 85d'percentile speed (posted speed can be substinrted if data are unavailable). Figure 2-6 should be consulted once for each major-road approach. Ifthe combination of major-road approach volume arrd riglrt-furn volume irrterseets above or to the r.ight of the trend line corresponding to the major-road operating speed, then a right-tum bay is a viable alternative. 140 ).rcn 0) o;" 100 E EEO o cou L E40.!.gf 20 tr i 100 EBO o Major-Road Volume (one direction), veh/h i40 {r c trt 1u E tat Major-Road Volume (one direction), vehlh ft) f"igure 2-6. {'}rriclcline./or ileterniniug tht' necd /r.tr u utr$or-rrsacl righutrn bat) d a two-tte.l;,\io!1-r:t;nlr.rt!ed inlefi{;t ti0jt. Increase Length ofturn Bay Introduction. Turn bay length can affect the safety and operation of the intersection approach signifrcantiy. This effect becomes more negative as the frequency with which vehicles exceed the available storage increases. Also, for unstopped approaches, this effect becomes more negative as more of the turning vehicle's deceleration occurs in the through lane, prior to the bay. The need to provide adequate iitorage length, decelerati()n length, or br:th is tlependent on the type ofapproach control used and whether the vehicle is turning left orright. Table 2-13 identifies the appropriate bay TAtsLE 2-13 Turn-ba1' lcngfh components at unsignnlizerl iutersections Approach Control Length Components Left-Turn Bay Rtght-Turn Bay Unstopped Storage Length + Deceleration Length Deceleration Length Stopped Storagc Length Storage Length
TRAFFIC IMPACT STUDY COMPREHENSIVE UPDATE TOWN OF THOMPSON S STATION, TENNESSEE PREPARED FOR: THE TOWN OF THOMPSON S STATION
 TRAFFIC IMPACT STUDY COMPREHENSIVE UPDATE TOWN OF THOMPSON S STATION, TENNESSEE PREPARED FOR: THE TOWN OF THOMPSON S STATION Transportation Consultants, LLC 1101 17 TH AVENUE SOUTH NASHVILLE, TN 37212
MEETING FACILITY 2901 GIBFORD DRIVE CITY OF OTTAWA TRANSPORTATION BRIEF. Prepared for: Holiday Inn Express 2881 Gibford Drive Ottawa, ON K1V 2L9
 MEETING FACILITY 2901 GIBFORD DRIVE CITY OF OTTAWA TRANSPORTATION BRIEF Prepared for: Holiday Inn Express 2881 Gibford Drive Ottawa, ON K1V 2L9 December 18, 2012 112-566 Brief_1.doc D. J. Halpenny & Associates
INDUSTRIAL BUILDING 3009 HAWTHORNE ROAD CITY OF OTTAWA TRANSPORTATION OVERVIEW REVISED. Prepared for: Canada Inc.
 INDUSTRIAL BUILDING 3009 HAWTHORNE ROAD CITY OF OTTAWA TRANSPORTATION OVERVIEW REVISED Prepared for: 7849648 Canada Inc. Octiober 1, 2015 114-598 Overview_2.doc D. J. Halpenny & Associates Ltd. Consulting
HILTON GARDEN INN HOTEL HOTEL EXPANSION 2400 ALERT ROAD, OTTAWA TRANSPORTATION BRIEF. Prepared for:
 HILTON GARDEN INN HOTEL HOTEL EXPANSION 2400 ALERT ROAD, OTTAWA TRANSPORTATION BRIEF Prepared for: Bona Building & Management Co. Ltd. Place Vanier, 333 North River Road Vanier, Ontario K1L 8B9 October
INDUSTRIAL BUILDING 1660 COMSTOCK ROAD CITY OF OTTAWA TRANSPORTATION OVERVIEW. Prepared for:
 INDUSTRIAL BUILDING 1660 COMSTOCK ROAD CITY OF OTTAWA TRANSPORTATION OVERVIEW Prepared for: Simluc Contractors Limited 2550 Blackwell Street, Ottawa K1B 5R1 October 18, 2013 113-584 Overview_1.doc D. J.
QUICKIE C STORE AND GAS BAR 1780 HERON ROAD OTTAWA, ONTARIO TRANSPORTATION BRIEF. Prepared for:
 QUICKIE C STORE AND GAS BAR 1780 HERON ROAD OTTAWA, ONTARIO TRANSPORTATION BRIEF Prepared for: Quickie Convenience Stores Larny Holdings Ltd. c/o PBC Group April 15, 2015 115-615 Report_1.doc D. J. Halpenny
Signal Warrant Studies
 Signal Warrant Studies Seven Locations Piqua, Ohio December 12, 217 Signal Warrant Studies Seven Locations Piqua, Ohio TABLE OF CONTENTS Executive Summary... 3 Introduction... 5 Study Location... 5 Data
List of Attachments. Location Map... Site Plan... City of Lake Elsinore Circulation Element... City of Lake Elsinore Roadway Cross-Sections...
 List of Attachments Exhibits Location Map... Site Plan... City of Lake Elsinore Circulation Element... City of Lake Elsinore Roadway Cross-Sections... Existing Lane Geometry and Traffic Controls... Existing
URBAN QUARRY HEADQUARTERS 2717 STEVENAGE DRIVE CITY OF OTTAWA TRANSPORTATION OVERVIEW. Prepared for: Urban Quarry 4123 Belgreen Drive, Ottawa K1G 3N2
 URBAN QUARRY HEADQUARTERS 2717 STEVENAGE DRIVE CITY OF OTTAWA TRANSPORTATION OVERVIEW Prepared for: Urban Quarry 4123 Belgreen Drive, Ottawa K1G 3N2 February 27, 2014 113-584 Overview_1.doc D. J. Halpenny
APPENDIX C Additional Traffic Data
 APPENDIX C Additional Traffic Data Raleigh and Heiden Properties FEIS F- ATTACHMENT Response.8- Traffic Count WEEKENDPEAK5MINUTECOUNTSPROJECTRaleighandHeidenPropertiesLOCATIONCR6,andCR9DATEFridayAugust6,TIME:PMto6:PM5MinuteTraficCR6SBCR9EBCR6NBSTARTENDleftthrurightTotalleftthrurightTotalleftthrurightTotalleftthrurightTotalGRANDTIMETIME56TAL-------------------:PM:5PM56:5PM:PM666566:PM:5PM685886:5PM:PM555585:PM:5PM5856889:5PM:PM8656:PM:5PM955656885:5PM:PM65986858:PM:5PM66855:5PM:PM69898:PM:5PM895858959:5PM:PM8589:PM:5PM85569:5PM:PM586985:PM:5PM55859565:5PM5:PM886559655:PM5:5PM56699595:5PM5:PM668955:PM5:5PM666856555:5PM6:PM95885-------------------TAL85896959688668
Traffic Impact Analysis Walton Acres at Riverwood Athletic Club Clayton, NC
 Traffic Impact Analysis Walton Acres at Riverwood Athletic Club Clayton, NC 1. TABLE OF CONTENTS INTRODUCTION...1 1.1. Site Location and Study Area...1 1.2. Proposed Land Use and Site Access...2 1.3.
FAIRFIELD INN & SUITES HOTEL 135 THAD JOHNSON PRIVATE OTTAWA TRANSPORTATION BRIEF. Prepared for:
 FAIRFIELD INN & SUITES HOTEL 135 THAD JOHNSON PRIVATE OTTAWA TRANSPORTATION BRIEF Prepared for: Bona Building & Management Co. Ltd. Place Vanier, 333 North River Road Vanier, Ontario K1L 8B9 August 12,
TRAFFIC IMPACT STUDY And A TRAFFIC SIGNAL WARRANT ANALYSIS FOR A SENIOR LIVING AND APARTMENT DEVELOPMENT
 TRAFFIC IMPACT STUDY And A TRAFFIC SIGNAL WARRANT ANALYSIS FOR A SENIOR LIVING AND APARTMENT DEVELOPMENT DEERFIELD TOWNSHIP, WARREN COUNTY, OHIO Nantucket Circle and Montgomery Road () Prepared for: ODLE
Traffic Impact Analysis Chatham County Grocery Chatham County, NC
 Chatham County Grocery Chatham County, NC TABLE OF CONTENTS 1. INTRODUCTION... 1 1.1. Location and Study Area... 1 1.2. Proposed Land Use and Access... 2 1.3. Adjacent Land Uses... 2 1.4. Existing ways...
OFFICE/RETAIL DEVELOPMENT 1625 BANK STREET OTTAWA, ONTARIO TRANSPORTATION BRIEF. Prepared for: Canada Inc.
 OFFICE/RETAIL DEVELOPMENT 1625 BANK STREET OTTAWA, ONTARIO TRANSPORTATION BRIEF Prepared for: 9402209 Canada Inc. December 15, 2015 115-625 Report_2.doc D. J. Halpenny & Associates Ltd. Consulting Transportation
REDEVELOPMENT TRAFFIC IMPACT STUDY
 REDEVELOPMENT TRAFFIC IMPACT STUDY For Wendy s Parker, Colorado January 215 Prepared for: Sterling Design Associates, LLC 29 W. Littleton Boulevard #3 Littleton, Colorado 812 Prepared by: 1233 Airport
Traffic Impact Study. Westlake Elementary School Westlake, Ohio. TMS Engineers, Inc. June 5, 2017
 TMS Engineers, Inc. Traffic Impact Study Westlake Elementary School Westlake, Ohio June 5, 2017 Prepared for: Westlake City Schools - Board of Education 27200 Hilliard Boulevard Westlake, OH 44145 TRAFFIC
TRANSPORTATION ANALYSIS REPORT US Route 6 Huron, Erie County, Ohio
 TRANSPORTATION ANALYSIS REPORT US Route 6 Huron, Erie County, Ohio December 12, 2012 Prepared for: The City of Huron 417 Main Huron, OH 44839 Providing Practical Experience Technical Excellence and Client
TRAFFIC IMPACT STUDY. Creekside Thornton, Colorado. For. August 2015 November 2015 Revised: August Prepared for:
 TRAFFIC IMPACT STUDY For Creekside Thornton, Colorado August 215 November 215 Revised: August 216 Prepared for: Jansen Strawn Consulting Engineers 45 West 2 nd Avenue Denver, Colorado 8223 Prepared by:
MEDICAL/OFFICE BUILDING 1637 BANK STREET OTTAWA, ONTARIO TRANSPORTATION OVERVIEW. Prepared for:
 MEDICAL/OFFICE BUILDING 1637 BANK STREET OTTAWA, ONTARIO TRANSPORTATION OVERVIEW Prepared for: 2434984 Ontario Inc. 13-5510 Canotek Road Ottawa, Ontario K1J 9J5 June 4, 2015 115-613 Report_2.doc D. J.
HOLIDAY INN HOTEL 235 KING EDWARD AVENUE CITY OF OTTAWA TRANSPORTATION BRIEF. Prepared for:
 HOLIDAY INN HOTEL 235 KING EDWARD AVENUE CITY OF OTTAWA TRANSPORTATION BRIEF Prepared for: Momentum Planning & Communications 1165 Greenlawn Crescent Ottawa, ON K1L 6C2 June 29, 2015 115-618 Brief_1.doc
EXECUTIVE SUMMARY. Page 1 of 6
 EXECUTIVE SUMMARY The purpose of this report is to identify conformance with the original traffic impact study for the proposed retail development on Lot 5 of Riverdale Retail Filing No. 1 located on the
TRANSPORTATION IMPACT STUDY PROPOSED RIVERFRONT 47 MIXED USE DEVELOPMENT
 November 2016 TRANSPORTATION IMPACT STUDY PROPOSED RIVERFRONT 47 MIXED USE DEVELOPMENT & Aspinwall Borough, Sharpsburg Borough & O Hara Township, Allegheny County, Pennsylvania Prepared for: Riverfront
Henderson Avenue Mixed-Use Development
 Zoning Case: Z145-3 Traffic Impact Analysis Henderson Avenue Mixed-Use Development Dallas, TX October 26 th, 216 Kimley-Horn and Associates, Inc. Dallas, Texas Project #644827 Registered Firm F-928 Traffic
Traffic Impact Study WestBranch Residential Development Davidson, NC March 2016
 Traffic Impact Study WestBranch Residential Development Davidson, NC March 216 TRAFFIC IMPACT STUDY FOR THE WestBranch Residential Development LOCATED IN DAVIDSON, NC Prepared For: Lennar Carolinas, LLC
The proposed development is located within 800m of an existing Transit Station where infill developments and intensification are encouraged.
 Stantec Consulting Ltd. 1331 Clyde Avenue, Suite 4 Ottawa ON K2C 3G4 Tel: (613) 722-442 Fax: (613) 722-2799 May 14, 213 File: 1638823 Robinson Park Development Corp. 5699 Power Road Ottawa, ON, K1G 3N4
Traffic Circulation Study for Neighborhood Southwest of Mockingbird Lane and Airline Road, Highland Park, Texas
 ARIZONA TEXAS NEW MEXICO OKLAHOMA February 13, 2015 Mr. Meran Dadgostar P.E., R.S. Town of Highland Park 4700 Drexel Dr. Highland Park, Texas 75205 Re: Traffic Circulation Study for Neighborhood Southwest
Chapter 4 Traffic Analysis
 Chapter 4 Traffic Analysis PURPOSE The traffic analysis component of the K-68 Corridor Management Plan incorporates information on the existing transportation network, such as traffic volumes and intersection
TRAFFIC ASSESSMENT River Edge Colorado
 TRAFFIC ASSESSMENT River Edge Colorado Submitted by: Fehr & Peers 621 17th Street, Ste. 231 Denver, CO 8293 (33) 296-43 December, 21 App. M-2 Traffic Assessment River Edge Colorado December 21 TABLE OF
Glenn Avenue Corridor Traffic Operational Evaluation
 Glenn Avenue Corridor Traffic Operational Evaluation PREPARED FOR: THE CITY OF AUBURN PREPARED BY: DECEMBER 2007 Glenn Avenue Corridor Study--Auburn, Alabama TABLE OF CONTENTS Introduction... 1 Background
METHODOLOGY. Signalized Intersection Average Control Delay (sec/veh)
") Chapter 5 Traffic Analysis 5.1 SUMMARY US /West 6 th Street assumes a unique role in the Lawrence Douglas County transportation system. This principal arterial street currently conveys commuter traffic
Chapter 5 Traffic Analysis 5.1 SUMMARY US /West 6 th Street assumes a unique role in the Lawrence Douglas County transportation system. This principal arterial street currently conveys commuter traffic
joint access drive. will be
 Date: To: From: Subject: June 22, 2015 Bradley Reiner, PE Bowman Consulting David R. Kline, PE, PTOE, Incline Associates Thornton Self-Storage Traffic Analysis (DRAFT) - Thornton, Colorado INTRODUCTION
Subject: Solberg Avenue / I-229 Grade Separation: Traffic Analysis
 MEMORANDUM Transportation Bill Troe, AICP Jason Carbee, AICP 12120 Shamrock Plaza Suite 300 Omaha, NE 68154 (402) 334-8181 (402) 334-1984 (Fax) To: Project File Date: Subject: Solberg Avenue / I-229 Grade
APARTMENT BUILDING DEVELOPMENT 1161 HERON ROAD OTTAWA, ONTARIO TRANSPORTATION IMPACT STUDY. Prepared for:
 APARTMENT BUILDING DEVELOPMENT 1161 HERON ROAD OTTAWA, ONTARIO TRANSPORTATION IMPACT STUDY Prepared for: 1649362 Ontario Inc. c/o Manor Park Management 231 Brittany Drive, Suite D Ottawa ON K1K 0R8 July
Traffic Impact Statement
 Traffic Impact Statement Mixed Use Development, US 41 and Old Trail Drive aka Tide-Starbucks 4900 9 th Street North General Development Site Plan (GDSP) Collier County, FL 10/6/2015 Prepared for: Prepared
Existing Conditions. Date: April 16 th, Dan Holderness; Coralville City Engineer Scott Larson; Coralville Assistant City Engineer
 Date: April 16 th, 2015 To: From: Re: Dan Holderness; Coralville City Engineer Scott Larson; Coralville Assistant City Engineer Darian Nagle-Gamm, Traffic Engineering Planner Highway 6 (2 nd Street) /
OTTAWA TRAIN YARDS PHASE 3 DEVELOPMENT CITY OF OTTAWA TRANSPORTATION IMPACT STUDY. Prepared for:
 OTTAWA TRAIN YARDS PHASE 3 DEVELOPMENT CITY OF OTTAWA TRANSPORTATION IMPACT STUDY Prepared for: The Ottawa Train Yards Inc. 223 Colonnade Road South, Suite 212 Nepean, Ontario K2E 7K3 January 17, 2012
3 Department of Development Services Tim Snellings, Director Pete Calarco, Assistant Director
 3 Department of Development Services Tim Snellings, Director Pete Calarco, Assistant Director 7 County Center Drive T: 53.552.37 Oroville, California 95965 F: 53.538.7785 buttecounty.net/dds BUTTE COUNTY
Troutbeck Farm Development
 Troutbeck Farm Development Willistown Township, Chester County PA For Submission To: Willistown Township Last Revised: October, 4 TPD# INLM.A. 5 E. High Street Suite 65 Pottstown, PA 9464 6.36.3 TPD@TrafficPD.com
TABLE OF CONTENTS TABLE OF CONTENTS... I APPENDICES... III LIST OF EXHIBITS... V LIST OF TABLES... VII LIST OF ABBREVIATED TERMS...
 TABLE OF CONTENTS TABLE OF CONTENTS... I APPENDICES... III LIST OF EXHIBITS... V LIST OF TABLES... VII LIST OF ABBREVIATED TERMS... IX 1 INTRODUCTION... 1 1.1 Project Overview... 1 1.2 Analysis Scenarios...
THIS PAGE LEFT BLANK INTENTIONALLY
 GA SR 25 Spur at Canal Road Transportation Impact Analysis PREPARED FOR GLYNN COUNTY, GEORGIA 1725 Reynolds Street, Suite 300 Brunswick, Georgia 31520 PREPARED BY 217 Arrowhead Boulevard Suite 26 Jonesboro,
Truck Climbing Lane Traffic Justification Report
 ROUTE 7 (HARRY BYRD HIGHWAY) WESTBOUND FROM WEST MARKET STREET TO ROUTE 9 (CHARLES TOWN PIKE) Truck Climbing Lane Traffic Justification Report Project No. 6007-053-133, P 101 Ι UPC No. 58599 Prepared by:
Project Report. South Kirkwood Road Traffic Study. Meadows Place, TX October 9, 2015
 Meadows Place, TX October 9, 2015 Contents 1 Introduction... 1 2 Data Collection... 1 3 Existing Roadway Network... 2 4 Traffic Volume Development... 2 5 Warrant Analysis... 3 6 Traffic Control Alternative
Transportation Impact Study for Abington Terrace
 Transportation Impact Study for Abington Terrace Abington Township, Montgomery County, PA Sandy A. Koza, P.E., PTOE PA PE License Number PE059911 Prepared by McMahon Associates, Inc. 425 Commerce Drive,
APPENDIXB. Traffic Operations Technical Memorandum
 APPENDIXB Traffic Operations Technical Memorandum Environmental Assessment - Lincoln County, SD 85 th Street: Sundowner Avenue to Louise Avenue November 2017 MEMORANDUM Transportation Jim Kollbaum, PE
Highway 111 Corridor Study
 Highway 111 Corridor Study June, 2009 LINCOLN CO. HWY 111 CORRIDOR STUDY Draft Study Tea, South Dakota Prepared for City of Tea Sioux Falls Metropolitan Planning Organization Prepared by HDR Engineering,
5858 N COLLEGE, LLC N College Avenue Traffic Impact Study
 5858 N COLLEGE, LLC nue Traffic Impact Study August 22, 2016 Contents Traffic Impact Study Page Preparer Qualifications... 1 Introduction... 2 Existing Roadway Conditions... 5 Existing Traffic Conditions...
Road Conversion Study Plumas Street
 Plumas Street Phase I Submitted to The Regional Transportation Commission of Washoe County Submitted by Zong Tian, Ph.D., P.E. Saeedeh Farivar Haiyuan Li, Ph.D. Center for Advanced Transportation Education
TRAFFIC STUDY GUIDELINES Clarksville Street Department
 TRAFFIC STUDY GUIDELINES Clarksville Street Department 9/1/2009 Introduction Traffic studies are used to help the city determine potential impacts to the operation of the surrounding roadway network. Two
EXISTING (2006) CONDITIONS
 CONDITIONS") Section 2 EXISTING (2006) CONDITIONS This section provides a description of the existing transportation system in the study area and a comprehensive analysis of existing traffic operations and crash history.
Section 2 EXISTING (2006) CONDITIONS This section provides a description of the existing transportation system in the study area and a comprehensive analysis of existing traffic operations and crash history.
Walton Acres at Riverwood Athletic Club Clayton, North Carolina
 9. CONCLUSIONS This Traffic Impact Analysis Update was conducted to determine the potential traffic impacts of the proposed Walton Acres at Riverwood Athletic Club residential development, located east
Walmart (Store # ) 60 th Street North and Marion Road Sioux Falls, South Dakota
 60 th Street North and Marion Road Sioux Falls, South Dakota") Walmart (Store #4865-00) 60 th Street North and Marion Road Sioux Falls, South Dakota Prepared for: Wal-Mart Stores, Inc. Bentonville, Arkansas Prepared by: Kimley-Horn and Associates, Inc. ã2013 Kimley-Horn
Walmart (Store #4865-00) 60 th Street North and Marion Road Sioux Falls, South Dakota Prepared for: Wal-Mart Stores, Inc. Bentonville, Arkansas Prepared by: Kimley-Horn and Associates, Inc. ã2013 Kimley-Horn
FINAL DESIGN TRAFFIC TECHNICAL MEMORANDUM
 FINAL DESIGN TRAFFIC TECHNICAL MEMORANDUM July 2014 FINAL (SR 43) Project Development and Environment Study From State Road 60 (Adamo Drive) to I-4 (SR 400) Hillsborough County, Florida Work Program Item
6060 North Central Expressway Mixed-Use Site Dallas, Texas
 Volume 1 Traffic Impact Analysis 6060 North Central Expressway Mixed-Use Site Dallas, Texas April 30, 2018 Kimley-Horn and Associates, Inc. Dallas, Texas Project #063238300 Registered Firm F-928 Traffic
INTERSECTION SAFETY STUDY State Route 57 / Seville Road
 INTERSECTION SAFETY STUDY State Route 57 / Seville Road City of Wadsworth, Medina County, Ohio Prepared For: City of Wadsworth Engineering Department 120 Maple Street Wadsworth, OH 44281 Prepared By: GPD
TRAFFIC IMPACT STUDY CRITERIA
 Chapter 6 - TRAFFIC IMPACT STUDY CRITERIA 6.1 GENERAL PROVISIONS 6.1.1. Purpose: The purpose of this document is to outline a standard format for preparing a traffic impact study in the City of Steamboat
TRAFFIC IMPACT STUDY
 675 Millcreek Drive, Unit 1 Mississauga, Ontario L5N 5M4 T: 416.213.7121 F: 95.89.8499 www.transtech.co TRAFFIC IMPACT STUDY PROPOSED MOSQUE DEVELOPMENT 4269 REGIONAL ROAD 25 TOWN OF OAKVILLE PREPARED
Grant Avenue Streetscape
 REPORT TYPE GOES HERE Grant Avenue Streetscape PREPARED FOR City of Manassas 9027 Center Street Manassas, VA 20110 PREPARED BY 8300 Boone Boulevard Suite 700 Vienna, Virginia 22182 571.389.8121 July 31,
Place Vanier 250 Montreal Road Transportation Impact Study Addendum. Prepared for Broccolini Construction September 20 th, 2012
 Update for the May 31 st, 2012 Traffic Impact Study Prepared for Broccolini Construction 111-23596-00 September 20 th, 2012 2611 Queensview Drive, Suite 300, Ottawa, Ontario CANADA K2B 8K2 Telephone: 613-829-2800
DUNBOW ROAD FUNCTIONAL PLANNING
 DUNBOW ROAD FUNCTIONAL PLANNING Final Report August 3, 216 #31, 316 5th Avenue NE Calgary, AB T2A 6K4 Phone: 43.273.91 Fax: 43.273.344 wattconsultinggroup.com Dunbow Road Functional Planning Final Report
MEMORANDUM. Matt Folden, AICP, MNCPPC Rebecca Torma, MCDOT. Nancy Randall, AICP, PTP Barbara Mosier, P.E., PTOE Kevin Berger
 To: From: Matt Folden, AICP, MNCPPC Rebecca Torma, MCDOT Nancy Randall, AICP, PTP Barbara Mosier, P.E., PTOE Kevin Berger 1110 Bonifant Street Suite 210, Silver Spring, MD 20910 301-448-1333 WellsandAssociates.com
FRONT RANGE CROSSINGS TRAFFIC IMPACT STUDY
 FRONT RANGE CROSSINGS TRAFFIC IMPACT STUDY Prepared for: City of Thornton And Colorado Department of Transportation Prepared by: 11 Blake Street, Suite 2 Denver, Colorado 822 Contact: Brian Bern, PE, PTOE
Highway 49, Highway 351 and Highway 91 Improvements Feasibility Study Craighead County
 Highway 49, Highway 351 and Highway 91 Improvements Feasibility Study Craighead County Executive Summary March 2015 Highway 49, Highway 351 and Highway 91 Improvements Feasibility Study Craighead County
Design Traffic Technical Memorandum
 State Road 7 Extension PD&E Study Design Traffic Technical Memorandum Palm Beach County, FL October 2010 State Road 7 Extension PD&E Study Design Traffic Technical Memorandum Palm Beach County, FL Prepared
ORLEANS GARDENS SHOPPING CENTRE 1615 ORLEANS BOULEVARD CITY OF OTTAWA, ONTARIO TRANSPORTATION IMPACT STUDY. Prepared for:
 ORLEANS GARDENS SHOPPING CENTRE 1615 ORLEANS BOULEVARD CITY OF OTTAWA, ONTARIO TRANSPORTATION IMPACT STUDY Prepared for: Orleans Gardens Shopping Centre Inc. 2851 John Street, Suite 1 Markham, ON K3R 5R7
1609 E. FRANKLIN STREET HOTEL TRAFFIC IMPACT STUDY EXECUTIVE SUMMARY
 1609 E. FRANKLIN STREET HOTEL TRAFFIC IMPACT STUDY EXECUTIVE SUMMARY Prepared for: The Town of Chapel Hill Public Works Department Traffic Engineering Division Prepared by: HNTB North Carolina, PC 343
2. Existing Conditions
 2. Existing Conditions The existing traffic and parking conditions on the site and the surrounding area were reviewed based on the study methodology in Section 1.2. 2.1 Existing Land Use The portion of
TRAFFIC IMPACT ANALYSIS
 TRAFFIC IMPACT ANALYSIS FOR THE CHAMPAIGN UNIT#4 SCHOOL DISTRICT PROPOSED HIGH SCHOOL (SPALDING PARK SITE) IN THE CITY OF CHAMPAIGN Final Report Champaign Urbana Urbanized Area Transportation Study 6/24/2014
FINAL Albertville Business Park AUAR Update Traffic Study
 FINAL Albertville Business Park AUAR Update Traffic Study Prepared for City of Albertville, MN July 20, 2017 SRF No. 10060.00 Table of Contents Introduction... 1 Existing Conditions... 1 Data Collection...
LIBERTY TREE ACADEMY TRAFFIC IMPACT STUDY
 LIBERTY TREE ACADEMY TRAFFIC IMPACT STUDY Prepared for: Liberty Tree Academy Prepared by: 161 Blake Street, Suite 2 Denver, Colorado 822 Contact: David Kline, PE, PTOE (33)-572-2 On Behalf of: Liberty
Technical Memorandum TRAFFIC IMPACT STUDY. RIDLEY ROAD CONVENIENCE STORE Southampton County, VA. Prepared for: Mr. David Williams.
 Technical Memorandum TRFFIC IMPCT STUDY RIDLEY ROD CONVENIENCE STORE Southampton County, V Prepared for: Mr. David Williams By: Charles Smith, P.E., PTOE EPR Charlottesville, V July 2014 1 TBLE OF CONTENTS
CarMax Auto Superstore/ Reconditioning Center #6002 Murrieta, California
 CarMax Auto Superstore/ Reconditioning Center #6002 Murrieta, California TUSTIN 17782 17th Street Suite 200 Tustin, CA 92780-1947 714.665.4500 Fax: 714.665.4501 LOS ANGELES 145 S. Spring Street Suite 120
THE LANDMARK AT TALBOT PARK
 TRAFFIC IMPACT STUDY FOR THE LANDMARK AT TALBOT PARK IN NORFOLK, VA INTERMODAL ENGINEERING, P.C. OCTOBER, 200 The Landmark at Talbot Park is a proposed redevelopment of the existing apartments along the
Shockoe Bottom Preliminary Traffic and Parking Analysis
 Shockoe Bottom Preliminary Traffic and Parking Analysis Richmond, Virginia August 14, 2013 Prepared For City of Richmond Department of Public Works Prepared By 1001 Boulders Pkwy Suite 300, Richmond, VA
Date: September 7, Project #: Re: Spaulding Youth Center Northfield, NH Property. Traffic Impact Study
 To: Ms. Susan C. Ryan Spaulding Youth Center 72 Spaulding Road Northfield, NH 03276 Date: September 7, 2017 Project #: 52455.00 From: Robin Bousa Director of Transportation Systems Re: Spaulding Youth
Donahue Drive Corridor Traffic Operational Evaluation
 Donahue Drive Corridor Traffic Operational Evaluation PREPARED FOR: THE CITY OF AUBURN PREPARED BY: JANUARY 2007 Donahue Drive Corridor Study--Auburn, Alabama TABLE OF CONTENTS Introduction... 1 Background
King Soopers #116 Thornton, Colorado
 Traffic Impact Study King Soopers #116 Thornton, Colorado Prepared for: Galloway & Company, Inc. 1.0 EXECUTIVE SUMMARY King Soopers #116, a grocery marketplace anchored commercial development, is proposed
Route 28 (South Orleans Road)/Route 39 (Harwich Road)/Quanset Road Intersection
/Route 39 (Harwich Road)/Quanset Road Intersection") TRAFFIC FEASIBILITY STUDY Route 28 (South Orleans Road)/Route 39 (Harwich Road)/Quanset Road Intersection Orleans, Massachusetts Prepared for: Town of Orleans Prepared by: Fay, Spofford & Thorndike, LLC
TRAFFIC FEASIBILITY STUDY Route 28 (South Orleans Road)/Route 39 (Harwich Road)/Quanset Road Intersection Orleans, Massachusetts Prepared for: Town of Orleans Prepared by: Fay, Spofford & Thorndike, LLC
Bistro 6. City of Barrie. Traffic Impact Study for Pratt Hansen Group Inc. Type of Document: Final Report. Project Number: JDE 1748
 City of Barrie Traffic Impact Study for Pratt Hansen Group Inc. Type of Document: Final Report Project Number: JDE 1748 Date Submitted: June 12 th, 2017 06/12/17 John Northcote, P.Eng. Professional License
Figure 1: East West Connector Alignment Alternatives Concept Drawing
 Page 2 of 9 Figure 1: East West Connector Alignment Alternatives Concept Drawing The Montebello Drive extension will run north south and connect Wilsonville Road to the Boones Ferry Road to Brown Road
HCM 2010: ROUNDABOUTS. PRAVEEN EDARA, PH.D., P.E., PTOE UNIVERSITY OF MISSOURI - COLUMBIA
 HCM 2010: ROUNDABOUTS PRAVEEN EDARA, PH.D., P.E., PTOE UNIVERSITY OF MISSOURI - COLUMBIA EMAIL: edarap@missouri.edu OUTLINE Terminology used Input data needs Capacity of single and multilane roundabouts
APPENDIX D. Traffic Impact Study Creighton Manning Engineering, LLP
 APPENDIX D Traffic Impact Study Creighton Manning Engineering, LLP Traffic Impact Study Catskill Access Evaluation NYS Thruway Exit 21 Town of Catskill, New York CM Project No. 114-232 Prepared For: Greene
DRAFT. Corridor study. Honeysuckle Road. October Prepared for the City of Dothan, AL. Prepared by Gresham, Smith and Partners
 DRAFT Corridor study Honeysuckle Road October 2017 Prepared for the City of Dothan, AL Prepared by TABLE OF CONTENTS SECTION I... 1 STUDY SUMMARY... 1 INTRODUCTION... 1 CONCLUSIONS... 5 SECTION II... 7
NEW YORK CENTRAL PARK SUBDIVISION BLAIS STREET/ST-PIERRE STREET EMBRUN, ONTARIO TRAFFIC IMPACT STUDY. Prepared for:
 NEW YORK CENTRAL PARK SUBDIVISION BLAIS STREET/ST-PIERRE STREET EMBRUN, ONTARIO TRAFFIC IMPACT STUDY Prepared for: Solidex Holdings Limited & Investissement Maurice Lemieux Investments Attn: Mr. Anthony
George Street Transportation Impact Study. Paradigm Transportation Solutions Limited
 George Transportation Impact Study Paradigm Transportation Solutions Limited January 217 Project Summary Project Number 16191 January 217 Client Wastell Homes 5-1895 Blue Heron Drive London ON N6H 5L9
List of Exhibits...ii
 One Brickell Traffic Study TABLE OF CONTENTS List of Exhibits...ii EXECUTIVE SUMMARY...1 1. INTRODUCTION...2 1.1 Study Area...2 1.2 Study Objective...5 2. EXISTING TRAFFIC CONDITIONS...6 2.1 Data Collection...6
Volume 1 Traffic Impact Analysis. Texas Odyssey TIA Dallas, Texas. Kimley-Horn and Associates, Inc. Dallas, Texas. May 23, 2018
 Volume 1 Traffic Impact Analysis Texas Odyssey TIA Dallas, Texas May 23, 2018 Kimley-Horn and Associates, Inc. Dallas, Texas Project #064529800 Registered Firm F-928 Traffic Impact Analysis Texas Odyssey
Memorandum Pershing Road Suite 400 Kansas City, MO Tel Fax
 Memorandum 2400 Pershing Road Suite 400 Kansas ity, MO 64108 Tel 816 329 8600 Fax 816 329 8601 www.transystems.com To: Mr. avid Gurss Kansas epartment of Transportation wight. Eisenhower State Office ldg.
TRAFFIC IMPACT STUDY
 TRAFFIC IMPACT STUDY for the GLEN ELLEN COUNTRY CLUB SENIOR RESIDENTIAL REDEVELOPMENT 84 Millis, Massachusetts Prepared by: McMahon Associates, Inc. Prepared for: Toll Brothers, Inc. August 216 DRAFT
Harrah s Station Square Casino
 Transportation Analysis Harrah s Station Square Casino Pittsburgh, Pennsylvania Submitted To: City of Pittsburgh and Pennsylvania Gaming Control Board Prepared By: DKS Associates GAI Consultants December
COMMERCIAL DEVELOPMENT 2015 ROBERTSON ROAD OTTAWA, ONTARIO TRANSPORTATION BRIEF. Prepared for:
 COMMERCIAL DEVELOPMENT 2015 ROBERTSON ROAD OTTAWA, ONTARIO TRANSPORTATION BRIEF Prepared for: First Bay Properties Inc. 311 Richmond Road, Suite 203 Ottawa, ON K1Z 6X3 August 8, 2017 117-663 Brief_1.doc
Abrams Associates. Transportation Impact Analysis. City of Rocklin. Prepared for: David Mohlenbrok City of Rocklin 4081 Alvis Court Rocklin, CA 95677
 Transportation Impact Analysis Sierra College Boulevard Commercial Project City of Rocklin Prepared for: David Mohlenbrok City of Rocklin 081 Alvis Court Rocklin, CA 95677 Prepared by: 1875 Olympic Boulevard,
Traffic Impact Study for Rolling Ridge Redevelopment
 Traffic Impact Study for Rolling Ridge Redevelopment Webster Groves, Missouri October 19, 2018 Prepared For: Gershman Commercial Real Estate 150 North Meramec Avenue Suite 500 St. Louis, Missouri 63105
DIMARCO CANANDAIGUA PROPERTIES HOUSING PROJECT CANANDAIGUA, ONTARIO COUNTY, NEW YORK
 TRAFFIC IMPACT STUDY FOR THE DIMARCO CANANDAIGUA PROPERTIES HOUSING PROJECT CANANDAIGUA, ONTARIO COUNTY, NEW YORK MARCH 14, 2017 PREPARED FOR: 1950 Brighton Henrietta Town Line Rd Rochester, NY 14623 PREPARED
Intersection Control Evaluation
 Intersection Control Evaluation Lor Ray Drive at Howard Drive in North Mankato, Nicollet County, Minnesota Mankato/North Mankato Area Planning Organization October 2016 SRF No. 016 09243 Table of Contents
Intersection of Massachusetts Avenue and Maple Street in Lexington Signalized Intersection and Roundabout Comparison
 Intersection of Massachusetts Avenue and Maple Street in Lexington Signalized Intersection and Roundabout Comparison Michael Wallwork, Roundabout Expert, Orange Park, Florida Tom Bertulis (MS, PE, PTOE),
V. ENVIRONMENTAL IMPACT ANALYSIS K. TRANSPORTATION AND CIRCULATION
 V. ENVIRONMENTAL IMPACT ANALYSIS K. TRANSPORTATION AND CIRCULATION ENVIRONMENTAL SETTING The following section is based on the Draft Traffic Circulation Study for the Malibu La Paz Project (Traffic Study),
Traffic Impact and Access Study PROPOSED DURKEE FARM ESTATES. Foster Street Littleton, Massachusetts. Prepared for: Grimes Road, LLC.
 Traffic Impact and Access Study PROPOSED DURKEE FARM ESTATES Foster Street Littleton, Massachusetts Prepared for: Grimes Road, LLC. Westford, MA Prepared by: MDM Transportation Consultants, Inc. 28 Lord
2136 And 2148 Trafalgar Road Townhouse Development Traffic Brief. Paradigm Transportation Solutions Limited
 2136 And 2148 Trafalgar Road Townhouse Development Traffic Brief Paradigm Transportation Solutions Limited March 217 March 217 Project: 1627 Diana Vlasic, M.C.I.P., R.P.P Metropolitan Consulting 445 Paletta
Draft Report. Traffic Impact Study. Superstore, Wal-Mart, and Kent Development. Yarmouth, Nova Scotia. Prepared for
 oad & Traffic Management Road & Traffic Management R Atlantic Traffic Engineering Specialists Draft Report Traffic Impact Study Superstore, Wal-Mart, and Kent Development Yarmouth, Nova Scotia Prepared