Field Testing the Upright Versus the Aero Cycling Position
|
|
|
- Christopher Neal
- 6 years ago
- Views:
Transcription

1 UNLV Theses, Dissertations, Professional Papers, and Capstones Field Testing the Upright Versus the Aero Cycling Position Curtis Scrugham University of Nevada, Las Vegas, Follow this and additional works at: Part of the Biomechanics Commons, and the Sports Studies Commons Repository Citation Scrugham, Curtis, "Field Testing the Upright Versus the Aero Cycling Position" (2013). UNLV Theses, Dissertations, Professional Papers, and Capstones This Thesis is brought to you for free and open access by Digital It has been accepted for inclusion in UNLV Theses, Dissertations, Professional Papers, and Capstones by an authorized administrator of Digital For more information, please contact
2 FIELD TESTING THE UPRIGHT VERSUS THE AERO CYCLING POSITIONS by Curtis R. Scrugham Bachelor of Science in Natural Resources Oregon State University 2006 A thesis submitted in partial fulfillment of the requirements for the Master of Science Exercise Physiology Department of Kinesiology and Nutrition Sciences School of Allied Health Sciences Division of Health Sciences The Graduate College University of Nevada Las Vegas December 2013

3 THE GRADUATE COLLEGE We recommend the thesis prepared under our supervision by Curtis Scrugham entitled Field Testing the Upright versus the Aero Cycling Positions is approved in partial fulfillment of the requirements for the degree of Master of Science - Exercise Physiology Department of Kinesiology and Nutrition Sciences John Mercer, Ph.D., Committee Chair Dick Tandy, Ph.D., Committee Member James Navalta, Ph.D., Committee Member Tim Bungum, Ph.D., Graduate College Representative Kathryn Hausbeck Korgan, Ph.D., Interim Dean of the Graduate College December 2013 ii
4 ABSTRACT Field Testing the Upright versus the Aero Cycling Position By Curtis R Scrugham Dr. John Mercer, Examination Committee Chair Associate Dean, School of Allied Health Sciences University of Nevada, Las Vegas Body position can be of great importance to athletes who want to maximize their performance on the bike. Aerodynamic resistance can account for 70-90% of resistance encountered by cyclists, and a strategy used to reduce this resistance is riding in the aero position Research has been done in the lab to determine if there are trade-offs to using this position (Jobson et al. 2008, Welbergen and Clijsen 1990, Hubenig, Game and Kennedy 2011, Peveler 2004, Origenes et al. 1993, Ryschon and Stray-Gunderson 1991, Gnehm et al. 1997, Ashe et al. 2003).. Researchers have reported that riders untrained in the aero position will have a lower power output in this position, and that riders will be stronger in the position they train in. Researchers have also reported that there are difference between riding in the lab and riding outdoors (Richardson & Johnson 2004, Bertucci et al 2007, Bertucci et al 2012).. Therefore, the purpose of this study is to conduct a field test, testing the power output between the two positions. Seven riders with experience riding in both positions were recruited and completed 2 x one-mile time trials. Cycling power, heart rate, and speed were measured using a power meter (CycleOps, Madison, USA). Each dependent variable was compared between positions using a iii
5 paired t-test. Power (upright ± 77.4 Watts (W), aero ± 91.1W), heart rate (upright ± 19.6 beats per minute (bpm), aero ± 32.0 bpm), speed (upright 26.1 ± 2.9 miles per hour (mph), aero 26.9 ± 3.1 mph) and cadence (upright 96.9 ± 9.6 revolutions per minute (rpm), aero 98.3 ± 7.5 rpm) were not different (p>0.05) between positions. Although the group response was not different for power output and speed between positions, 5 of 7 participants had at least 20 W more power output during upright versus aero position. It seems these subjects were able to achieve the same speed using less power during aero vs. upright position. Nevertheless, for a 1-mile time trial effort, the influence of position on power was not dramatic and for the group, position did not influence power. iv
6 TABLE OF CONTENTS ABSTRACT... iii LIST OF TABLES..vi LIST OF FIGURES... vii CHAPTER 1 CHAPTER 2 INTRODUCTION LITERATURE REVIEW..4 CHAPTER 3 METHODS CHAPTER 4 CHAPTER 5 APPENDIX A RESULTS DISCUSSION INFORMED CONSENT FORM APPENDIX B TEST DATA CHARTS.. 37 REFERENCES.. 42 CURRICULUM VITAE 45 v
7 LIST OF TABLES Table 1 Table 2 Table 3 Means and standard deviations for each variable measured Individual data sets for the upright position Individual data sets for the aero position vi
8 LIST OF FIGURES Figure 1 Figure 2 Figure 3 Figure 4 Figure 5 Figure 6 Figure 7 Figure 8 Figure 9 The upright position....2 The Aero position...2 The PowerTap rear wheel hub The PowerTap cycling computer The data chart for participant number Magnitude of difference in power between positions 28 Magnitude of difference in heart rate between positions...29 Magnitude of difference in speed between positions.29 Magnitude of difference in cadence between positions.30 vii
9 CHAPTER 1 INTRODUCTION Body position can be of great importance to athletes who want to maximize their performance on the bike. Aerodynamic resistance accounts for 70-90% of resistance encountered by cyclists, and approximately 66% of that resistance is from the cyclist s body (Chowdbury et al. 2011). One strategy used to reduce this resistance is the adoption of a position that decreases frontal surface area, thereby reducing drag. Anecdotally, it is thought that possible tradeoffs for this position are a loss of power output and comfort. While comfort is subjective and easy for an athlete to assess, power is directly measurable. Power is used to quantify cycling performance in the laboratory and increasingly, outside of the laboratory. The advent and increasing proliferation of consumer-affordable instruments to measure power while cycling allows even recreational cyclists to monitor, collect and analyze the data they produce. Two typical body positions used on bikes with aerobars are the standard upright position, where the cyclists hands are on the brake hoods (Fig. 1), and the aero position, where the rider s elbows and hands are on aero bars, and the trunk is closer to parallel with the ground (Fig. 2). 1
.")
 have reported that the aero position can negatively affect power output, ventilation, mechanical efficiency and pedal force profile.")
10 Figure 1: The upright position. Figure 2: The aero position. The aero position is adopted to reduce the rider s frontal surface area, thereby reducing air resistance and increasing overall performance (Debraux et al. 2011). Riding in the aero position can have negative effects as well. Researchers (Dorel et al. 2009, Gnehm et al. 1997, Emanule & Denoth 2012, Ashe et al. 2003, Welbergen & Cljsen 1990) have reported that the aero position can negatively affect power output, ventilation, mechanical efficiency and pedal force profile. However, there are conflicting results on the influence of the aero position on cycling mechanics. For instance, Peveler (2004) reported that cyclists who trained exclusively in the aero position did not have a lower power output in that position compared to cyclists who did not train in that position. Furthermore, Hubenig et al. (2011) found no difference in between positions among female cyclists. Even though there is a discrepancy regarding power output in the literature, it is clear that adopting an aero position reduces the drag force which riders must overcome. 2
11 A limitation of the current research is that it is conducted mostly in the laboratory on a stationary bike that is in a fixed position with a constant resistance. For the purpose of this paper, riding in the laboratory, or riding indoors, will refer to riding either on an ergometer or a road bike placed on a trainer. Where appropriate, references to riding on an ergometer or a road bike on a trainer will specify the mode of indoor riding. Riding on the road is different than riding in the laboratory in that the rider has to balance the bike at speeds in excess of 20 mph on an imperfect road surface with a freewheel mechanism in their drivetrain which allows for variable pedaling effort. Additionally, the wind speed and direction is not constant while riding outdoors. Combined, it seems that these variables could make enough of a difference that the observations of the laboratory based research may not be generalizable to outdoor riding. There is some insight into comparing laboratory versus field measurements. Bertucci et al and 2012 concluded that ergometer riding as opposed to road cycling yielded a modified crank torque profile, higher ratings of perceived exertion (RPE), and lower gross efficiency and cycling economy. However, there are limited data on lab versus field power measurements as they relate to body position. Therefore, the purpose of the current research is to compare power in the upright position versus the aero position while riding on the road. The hypothesis is that riders will produce the same power in the aero position as the upright position. 3
12 CHAPTER 2 LITERATURE REVIEW This chapter reviews previous research done comparing the power output during cycling using the upright and aero positions. It will be emphasized that the majority of the research reviewed was completed in a laboratory (versus in the field) on cycle ergometers. These papers serve as a reference point for the current research which is comparing the power output between the upright and aero positions on the road, instead of in a laboratory. Laboratory Research of Body Position of Cyclists Jobson et al. (2008) studied the physiological demands of, and responses to, both road and laboratory time trials. Additionally, they compared the responses of the upright and aero cycling positions in the laboratory. For subjects, they recruited nine competitive cyclists who all had experience in 40 km time trials. Each participant completed two 40 km time-trials (TTs) in the laboratory, one in each position, and one 40 km TT on the road in the aero position. For all conditions the subjects used their own bikes. For the laboratory TTs the bikes were mounted on an air-braked cycle ergometer and power output data was recorded (SRM power meter). Respiratory gases, heart rate and RPE data was also collected. For the road TTs, heart rate (polar S610 heart rate monitor), power ( SRM power meter) and respiratory gasses (Metamax system) were also collected. The course was simply described as a relatively flat course that was approved for competitive regional time trail events. The independent variables were the different cycling positions, and the road TT versus the lab trial. The dependent variables were time, speed, power output, heart rate, 4
13 oxygen consumption, minute ventilation, breathing frequency, respiratory exchange ratio (RER), cadence and RPE. Looking specifically at the results for power output, the road condition power was greater than the lab aero position (p=.013), and the upright power (in lab) was greater than the lab aero power (p=.003). While the power output difference between the upright and aero position in the laboratory was expected, they did not expect road aero power output to be equal to the upright lab position (road aero:266 ± 21 Watts/ lab upright:267 ± 56 Watts). The authors noted two possible reasons to explain this outcome. First they noted the possible effect of wind on the participants. In the lab, fans were used to provide a 7 km h -1 wind over the cyclists. During the road tests, the observed meteorological wind speed was 4.9 ± 4.2 km h -1, though when accounting for the airspeed relative to the cyclist s motion, the effective wind speed was 39.8 km h -1. This higher effective wind speed would lead to an apparent wind chill temperature reduction of 6 C. This would provide higher evaporative heat loss and improved thermoregulatory control, possible leading to higher power output outdoors versus indoors. Second they postulated that the different environments of the lab and road could account for the higher road-trial power output. The road trial provided a much higher level of visual stimuli than a laboratory setting. The greater external sensory feedback while completing the trial outside of the lab could cause less attention to be paid to the internal sensory inputs of fatigue, allowing for a greater power output. As far as the other physiological factors measured in this study, the only other differences between trials 5
14 were lower minute ventilation (p=.019) and breathing frequency (p=.003) in the laboratory trials. Welbergen and Clijsen (1990) studied four different cycling positions on an indoor ergometer. Their purpose was to study the influence of trunk and saddle angle on maximal external power and VO 2max. Position was the independent variable with four levels; the upright position and the racing position (seat tube angle 21 ), and the recumbent backwards and recumbent forward positions (seat tube angle 60 ). The upright position was defined as trunk near vertical and the racing position as trunk near horizontal. While they described placing anatomical markers to determine trunk and hip angle, they did not report or refer to any of these values. Six males were recruited as subjects; three were well trained competitive cyclists/triathletes and three were experienced recumbent cyclists. These participants performed the tests on a modified Monark ergometer. The test protocol, referred to as a 3-min supra-maximal test, consisted of three periods of 3 minutes. During the first two periods the participants cycled at 90 rpm. The first 3 minutes was at 100 Watts and the next 3 minutes at 200 watts. For the last 3 minutes the participants were asked to pedal at maximum effort with the cadence and resistance being self-selected. The power output of the upright position was significantly higher (p=.05) when compared to all other positions. Power for the rest of the positions was not significantly different from each other. The upright position had the greatest power output at 381 ± 49 Watts with the racing position being 364 ± 49 Watts. Next was the recumbent backward at 355 ± 44 watts followed by the recumbent forward at 341± 54 Watts. All individual subjects showed the same trend. None of the VO 2 differences were significant. 6
15 This is another study indicating that higher power output can be obtained in the upright versus aero position (p=05). While the purpose of this study was to investigate the effect of trunk angle and saddle angle on maximum power output, a weakness of this study is that the seat tube angles and positions used are not representative of typical cyclist s riding geometry or position. Hubenig, Game and Kennedy (2011) examined the effect of body position on power output of conditioned females. Their purpose was to determine differences in power output between upright and aero cycling positions at submaximal intensities in trained females. They posited that since females have different hip geometry and greater lower body flexibility, that previous studies done with males which showed a higher power output in the upright position (Ashe et al. 2003, Welbergen & Clijsen 1990) may not apply. As subjects, they used eighteen female cyclists and triathletes with a minimum of one year experience using aero bars. All tests were done on a Velotron cycle ergometer set as closely as possible to each subject s own bike. The first test was a graded exercise test to fatigue. The test was used to determine the first and second ventilatory thresholds (VT-1 and VT-2) for each participant. VT-1 and VT-2 were not further defined other than being two different heart rate intensities that were tested. The remaining tests consisted of testing both the upright and aero positions at each VT-1 and VT-2. The remaining test consisted of a 5 minute warm up, a 5 minute transition phase and a steady state phase. In the transition phase the power output was adjusted in five watt increments leading up to the heart rate intensity desired for the steady state phase. 7
16 During the steady state phase, power output was adjusted to keep the participants heart rate within three beats of the target heart rate. Power output at VT-1 was significantly higher (p =.03) in the upright position by 7.0 ±12.8 watts. There was no significant difference in power output between the two positions at VT-2 (p =.57). All other measured variables (heart rate, cadence, VO 2 and minute ventilation) showed no significant difference between the two positions or the two intensity levels. Individual power responses were different. At VT-1, ten subjects had a decrease in power output in the aero position as compared to the upright position, and at VT-2 ten had a drop in power out in the aero versus the upright. Five subjects were consistent between intensities while 12 subjects had different responses to aero versus upright positions between VT-1 and VT-2. In this study, the position with the highest power output is individual. The results of this study differ from male-centric studies and shows those results can not necessarily be applied to females. Peveler (2004) studied the effect of both positions on metabolic economy and anaerobic power output of experienced cyclists and triathletes. 10 male cyclists and 10 male triathletes were used for this study. The cyclists trained only in the upright position and the triathletes trained only in the aero position. In the test of economy, the cyclists rode two 30 minute tests, one in each position at 70% VO 2max. The power tests were a 30 second Wingate test on a cycle ergometer, one in each position. After a 30 second rolling start and 10 second countdown, resistance of.075 kp per kg of body mass was applied. The subjects then pedaled at an all-out effort for 30 seconds. It was observed that the triathletes had greater power output (p =.003) in the aero position and the road cyclists had higher power output in the upright position (p =.000). 8
17 The road cyclist s peak power (PP) in the upright position was 768 ± 74.7 watts and 706 ± 69.4 watts in the aero position. The triathlete s PP in the aero position was ± watts and in the upright position was 697 ± 75.9 watts. The subjects were stronger in the position they trained in. Origenes et al. (1993) investigated the exercise ventilator response of the upright and aero cycling positions. Their hypothesis was that the aero position potentially restricted the thorax and would therefore have a higher ventilation frequency and inspiratory flows, and lower tidal volume. They used 10 moderately trained athletes and conducted the tests on an electrically braked ergometer. The Up position consisted of the participant riding with their hands on the brake hoods with elbows slightly bent (approximately 10 of flexion). To assume the aero position, the riders placed their elbows on the aero bars and adjusted the handlebar stem height so the upper back was close to parallel to the floor. Each test began, without a warm-up, at 50 watts. Every 3 minutes the power output was increased another 50 watts until the participants reached volitional exhaustion. The following variables were measured and recorded throughout each test: O 2 consumption and CO 2 production, ventilation, tidal volume, respiratory rate, mean inspiratory flow and heart rate. None of the results for any of the tested variables were significantly different between the two tested positions. In this study, the aero position did not negatively affect ventilation, cardiac or metabolic responses. 9
18 Ryschon and Stray-Gunderson (1991) examined the effect of body position on the energy cost of cycling. They specifically tested the effect of the upright and drop-bar hand positions. They used 10 subjects and tested them on their own bike. Each bike was fitted with a standard set of wheels inflated to a standard pressure to keep air resistance from spoke movement and rolling resistance the same for all riders. Each test was completed on a treadmill fitted with appropriate safety harnesses. Speed, grade and gear ratio was constant for each trial. Each participant completed four trials lasting 5 minutes each, in the following positions: 1) seated, upright, 80 rpm, 2) seated, drop bar, 80 rpm, 3) standing, hands on hoods, 60 rpm, and 4) seated, upright, 60 rpm. A stop watch was used to monitor the participant s cadence. The trails were done at 4% grade incline at a speed of 19.3 km h -1. Between each trial the incline was decreased to 1% and the participants recovered until their heart rate dropped below 100 bpm. For each trial, VO 2, HR and RER were averaged over the last three minutes of each 5 minute trial. The results between the two positions were not significant: VO 2 was upright: 2.34 ± 10 l m -1, Drop bar:2.37 ± 10 l m -1, for RER.93 ± 1/.93 ± 1 and for heart rate 129 ± 4/130 ± 4 bpm. From the results, the authors concluded that the minor body position change due to different hand placement had no effect on energy expenditure during moderate intensity exercise. Gnehm et al. (1997) explored the effect of the aero and upright positions on metabolic costs in elite athletes in laboratory conditions. They hypothesized that heart rate and VO 2 would be higher in the aero position. Fourteen elite male cyclists first 10
19 completed an incremental test to determine VO 2 max. Each participant s own bicycle was mounted on a wind braked roller, with handlebars fixed to the roller. After a 5 minute warm up the riders began the incremental test at 25 kp h -1 in the upright position, after which the speed was increased by 1 km h -1 every 400 meters until exhaustion. After a 4 hour break the riders commenced the test protocol with a 10 minute warm up. During the entire test power output was maintained at 70% of the individual s VO 2max. They spent 5 minutes in each of the positions: upright at 90 rpm, the drop bar position at 90 rpm and the aero position at 90 rpm. During the tests the following information was collected and recorded: O 2 consumption, CO 2 production, HR, and mechanical power output (which was held constant for each test. The more aero positions yielded some significantly higher VO 2, heart rate and RER values. The mean heart rate results were (UP/Drop/Aero) UP: ± 2, Drop: ± 1.9, Aero: Drop: ± 2.2 bpm. The difference between UP and Drop was not statistically significant while the differences between Aero and UP, and Aero and Drop were significant. Mean VO 2 was UP: 47.3 ± 1.2, Drop: 48.0 ± 1.3, Aero: 48.8 ± 1.3 l m -1, all were significant (p=.002). Mean RER was UP: ± Drop: ± , Drop: ± , only the difference between Aero and Up was statistically significant (p=.008). The authors suggested a number of possible factors to explain the significant differences. First, the aero position requires recruitment of additional shoulder neck and arm muscles to maintain the position. Second, the change in mean hip angles affects the 11
20 muscles acting on the hip and knee joints. Third, increased hip flexion may offer flow resistance in the iliac and femoral vessels resulting in higher cardiac energy expenditure. Ashe et al. (2003) studied the physiological effect of the two body positions on untrained cyclists, measuring O 2 uptake, ventilation and maximum workload. Ten subject were used and each rode four tests on a Monark stationary bicycle; maximal exercise in both positions and steady state cycling in both positions. The steady state cycling tests consisted of a 45 minute protocol that involved pedaling at 50, 100 and 150 watts for 15 minutes each, maintaining 60 rpm throughout the entire test. The tests were counterbalanced, having half the participants test in the upright position first and the remaining participants testing in the aero position first. During the upright position the participants sat on the bike with their trunks held perpendicular to the ground. For the aero position test, the participants held their trunks parallel to the ground. Tests were completed on a Monark stationary bike with clip-on aerobars. The tests were completed on separate days with the maximum tests completed one to two weeks apart. The participant s results for the maximal exercise tests were significantly higher in the upright position for all variables measured: VO 2 max Upright: ±5.11, Aer: ± 4.23 l min -1 (p= 0.038), HR max Upright: ± 4.53, Aero: ± 3.64 bpm (p= 0.015), VE max Upright: ±14.45, Aero: ± l min -1 (p= ) and workload max Upright: ± Watts, Aero: ± Watts (p= 0.035). For steady state exercise, VO 2 was significantly different (p= 0.00), but none of the other measured variables were significantly different. 12
21 Outdoor Research and Outdoor versus Indoor Research Richardson & Johnson (2004) investigated the effect of aerobars, and thus body position, on oxygen consumption. They conducted their experiment in the field and tested their hypothesis that aerodynamic handlebars would result in as lower VO 2 than standard bars. They recruited 11 elite men cyclists and had each subject perform four consecutive 4 km TTs within a 60 minute period on the same day. For the first test, each subject was randomly assigned a handlebar type and then alternated the type for each of the four tests. Each test was conducted in the same direction on the course followed by a low intensity ride back to the start. The only difference between the trials was the handlebar type; the bicycle, wheels and tire pressures were the same. Speed was held constant at 40 km hr -1 and monitored by both the cyclists and the driver of the motor scooter which followed the cyclists carrying the gas analysis equipment. The scooter rode to the side and behind the cyclists. Gas was collected for the last 45 seconds of each trial using a 1501 Douglas bag. A modified headpiece was used to mount a three-way valve to 1.5 m of tubing that went to the Douglas bag. The authors observed a significant reduction in both VO 2 (p = 0.013) and RER (p = 0.018) with the aerodynamic bars when compared to the standard bars. Given that speed remained constant for each condition and the aerodynamic bars resulted in a lower VO 2, it can be concluded that the aerodynamic bars, and the resulting body position, is more economical, and therefore beneficial to the cyclist. The authors suggested that the reduced wind drag was responsible for the 2% decrease in VO 2. 13
22 Bertucci et al (2007) examined the difference in pedaling biomechanics between laboratory and outdoor cycling conditions. They observed that because of the inertia of the Monark ergometer flywheel, riding on the ergometer does not replicate riding on the road in terms of crank inertial load and cyclist s kinetic energy. They also believed that the difference in crank inertial load could affect the cyclist s RPE. They designed their experiment to compare the crank torque profiles and the perceived exertion between riding on the ergometer and riding outdoors in the seated position on level ground and uphill. Seven male cyclists were tested both on a classical race bicycle and a modified Monark ergometer. The ergometer was fitted with a race saddle, handlebars and an SRM crank power meter which was also used on the road bicycles. The first test consisted of an incremental test to determine mean aerobic power (MAP). To do this the participants rode at 80 rpm for two minutes at 120 watts. The power output was then increased by 30 watts every 2 minutes until volitional exhaustion. The second test session was completed on the Monark ergometer in laboratory conditions where the participants rode at 60, 80 and 100rpm for 1 minute at MAP (Lab 60, Lab 80, and Lab 100 ). The final test session comprised four tests, again performed for 1 minute at MAP; level ground at 80 and 100 RPM (L 80 and L 100 ), and uphill (9.25%grade) at 60 and 80 RPM (U 60 and U 80 ). For all tests there was a 5 minute warm up, as well as 5 minutes of recovery between each 1 minute MAP effort. During the tests, the following mechanical variables were measured: power output, cadence, and propulsive torque at crank angles 0, 45, 90, 135 and 180. The 14
23 minimal torque and crank angle (CA) values at the beginning of the left pedal down stroke ( T min1 and CA min1), and at the end of the left pedal down stroke (T min2, CA min2 ) were also measured. T delta was calculated as T peak - T min1. For all test conditions, there was no significant difference of propulsive torque at all crank angles between the road cycling and laboratory conditions. During U 60, the T peak and T delta were significantly higher (7.7% and 9.4%) than Lab 60 (p< 0.05). The CA min1 during Lab 60 was significantly lower (4.1%) when compared to U 60 (p< 0.05). The CA min2 during Lab 80 was lower ( 6.8 ) compared to L 80 (p< 0.05). The T min1 was lower (30%) during Lab 100 compared to L 100 (p< 0.05). The ergometer crank inertial load value was 5.2 kg m 2 while the field values were (in kg m 2 ) 21.8, 36.6, 137.2, and 93.1 for U 60, U 80, L 80 and L 100. The RPE was significantly higher compared to all road cycling conditions (p< 0.05). There was an altered crank torque between ergometer cycling and road cycling, as well as altered RPE, while cycling at the same mean aerobic power. The authors suggest the altered torque profile might be from the mechanical differences between the ergometer and road bikes. They offered several explanations for the higher RPE during the indoor tests: 1) when the ergometer inertial load was low, riders had to compensate by supplemental work of the hands arms and shoulders, 2) because of the crank torque profile difference, lower limb mechanoreceptor stimulation may effect RPE, and 3) if a condition is distasteful (such as, indoor cycling), the activity may be rated as requiring more effort. 15
24 Bertucci et al (2012) investigated whether cycling simulations of level and uphill cycling on an indoor ergometer (Axiom) would be the same as riding in the field. They examined preferred cadences, cycling economy and gross efficiency. Nine wellconditioned male cyclists were used in this study. A single SRM crank power meter was used for all test conditions; fitted on a Monark cycle ergometer for the indoor tests and on each participant s own bicycle for the field tests. An initial laboratory test was conducted to determine VO 2 max and peak power output. The test protocol in the field consisted of three tests on level terrain and three uphill (4.8% grade). Each test was performed at a power output of 90% ventilation threshold with each test lasting 5-7 minutes. There was a minimum of 5-10 minutes of active recovery between trials. One test each was conducted at the preferred cadence on level and uphill terrain, as well as tests above and below the preferred gear ratio on level and uphill terrain. The tests were performed in randomized order. The following variables were measured and calculated: crank inertial load (CIL), gross efficiency (GE= (power output/metabolic power) 100), and cycling economy (CE= ratio of power output to oxygen consumption). Upon examining the results, preferred cadence was lower (P =0.016) for the uphill cycling in the field compared the uphill cycling on the trainer. Both GE and CE were higher (12% and 11%) in the field than on the trainer. Except for the uphill preferred cadence test, VO 2 was lower in the field (-9%) than on the trainer. From their results, the authors suggested that with the same VO 2 consumption used in the laboratory, a cyclist could generate close to 10% higher power output in the 16
25 field than on the Axiom ergometer. CE, GE and preferred cadence were different in laboratory conditions on an Axiom ergometer than in the field. Summary Considering all of the reviewed research, there can be a difference in power output between the two cycling positions. There can also be differences between indoor and outdoor cycling, both mechanical and mental. It is unclear if differences noted in the lab can be generalized to cyclists riding on the road. Therefore, the purpose of the current research is to compare power in the upright position versus the aero position while riding on the road. 17
26 CHAPTER 3 METHODS Participants Seven participants (6 male, 1 female, age 39.6 ± 11 years, height 71.7 ± 1.79 inches, weight ± 25.3 pounds) volunteered to participate in the experiment with demographic data self-reported. Cycling experience ranged from recreational to competitive cycling and all were familiar with the test course. All subjects had a minimum of six months experience riding in the aero position and all had experience competing in some type of time trial event (e.g., bike race or triathlon), and all routinely engaged in interval training similar to a 1 mile or 3 minute all-out effort. The participants used their own bike; six were road bikes fitted with aero bars and one used a triathlonspecific bike. Instruments Power was measured while cycling using a hub-based power meter (Figure 3; PowerTap, CycleOps, Madison, USA). This power meter has been shown to be accurate and suitable for both laboratory and field testing of cycling power output (Bertucci et al. 2005, Gardner et al. 2004). 18
. To retrieve data from the computer, free software called Device Agent (Peaksware LLC, Boulder CO, USA) was used.")

27 Figure 3 The PowerTap rear wheel hub. Figure 4 The PowerTap cycling computer. Cycling power, heart rate, speed, and cadence data were recorded using the CycleOps PowerTap 2.4 (Figure 4) computer. The sample rate on this device was set to on sample every 2 seconds (i.e., 0.5 Hz). To retrieve data from the computer, free software called Device Agent (Peaksware LLC, Boulder CO, USA) was used. Once uploaded from the bike computer, the data were then imported to WKO+ software for analysis. Course The course used was on the Antelope Island State Park causeway near Syracuse, Utah that connects an island to the mainland. The causeway is a seven mile flat road with bike lanes and no cross-traffic The mile markers begin with the island and increase going from west to east. The course used was between mile markers 4 and 5 with participants completing the time trial in the west to east direction. Procedures Due to participant availability, tests were conducted on different days spanning a three week period but all participants completed both riding conditions on the same day. Each participant read and signed the informed consent form (Appendix A) and was 19
28 briefed on the procedures. The PowerTap wheel was mounted to their bike and the bike computer was taped to their aerobar, stem or frame in a way that the display was hidden from view. They donned the heart rate monitor chest strap, and then made sure all the equipment was functioning. Once warmed up and ready to begin their test, they were assigned a position for the first test, and then their pre-ride heart rate was taken and recorded. Orange cones were placed approximately 75 feet before the start-line, and 75 feet after the finish line. These cones demarcated no pedal zones in which participants were instructed not to pedal. This allowed for identifying the beginning and ending points of the time trial. All rides had a rolling start through the no-pedal zone with participants starting maximal effort at the second (start) cone. Once they reached the finish line, they again coasted through a no-pedal zone and then turned around to ride back to the start line at a self directed pace for active recovery. Once back to the start area, heart rate was monitored and they were allowed to start the 2 nd condition only when heart rate was with 10% of their pre-ride heart rate. Data Reduction Data were reduced viewing the data in chart view. The begin and end points for each condition were noted by identifying where power was zero (i.e., the no-pedal zones). Data were analyzed in the middle minute between these two times with average power, heart rate, speed, and cadence recorded for analysis. 20
29 Statistical Analysis The dependent variables (average power, heart rate, speed, and cadence) were compared between cycling positions (upright or aero) using a paired t-test (Excel, version information). Alpha level was set to α=
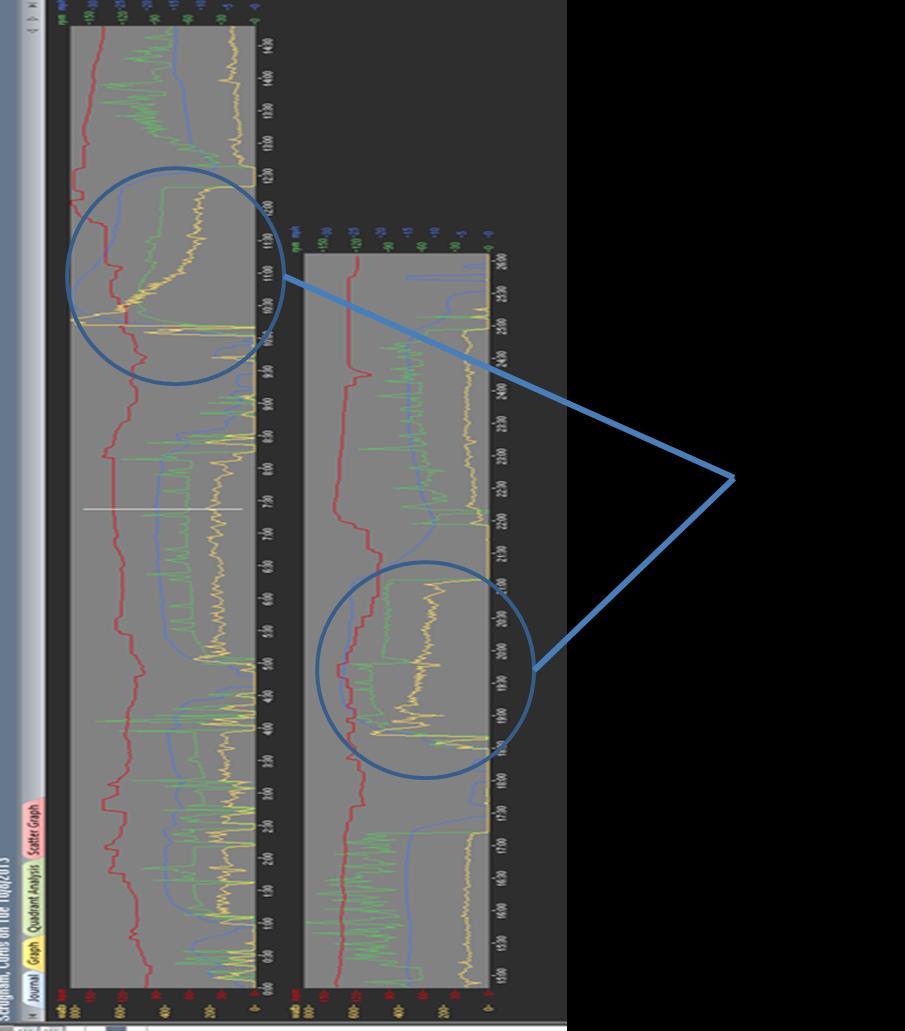
30 CHAPTER 4 RESULTS Average power was not different between the positions (upright: ± 77.4 W; aero: ± 91.1 W; Table 1; p>0.05). Average speed was not different between the positions (upright: 26.1 ± 2.9 mph; aero 26.9 ± 3.11 mph; Table 1; p>0.05). The average cadence was not different between the positions (upright: ± 9.62 rpm; aero ± 7.48 rpm; Table 1; p>0.05). There was concern regarding validity of heart rate data for a participant (#2) since the average heart rates for upright was only 70 bpm (Table 2), with his pre-ride heart rate being 72. Inspecting the heart rate graphs for this subject there appeared to be some type of interference or equipment malfunction for the heart rate measurement (Figure 5). There were long plateaus and instantaneous large jumps in heart rate which are indicative of false readings. Since the data set seemed erroneous, average heart rate for the group was compared with and without that participant s data. In both cases, average heart rate was not different between positions (p>0.05). Though there was no influence in the statistical outcome, participant 2 s heart rate data were not included in the reported data. The average heart rate was not different between the positions (upright: ± bpm; aero ± bpm; Table 1; p>0.05). Individual responses are presented in Tables 2 and 3. 22

31 Figure 5 The data chart for participant number 2. Shows long plateaus and instantaneous large jumps in heart rate (red line), indicative of erroneous data. Table 1. Means and standard deviations for each variable measured. W= Watts, mph= miles per hour, rpm= revolutions per minute and bpm= beats per minute. None of the dependent variables were different between upright and aero positions (p>0.05). Upright Aero P Value Average Power (W) Average Speed (mph) Average Cadence (rpm) Average Heart Rate (bpm) ± ± ± ± ± ± ± ±
32 Table 2. Individual data sets for the upright position. W= Watts, mph= miles per hour, rpm= revolutions per minute and bpm= beats per minute. Table 3. Individual data sets in for aero position. W= Watts, mph= miles per hour, rpm= revolutions per minute and bpm= beats per minute. 24
33 CHAPTER 5 DISCUSSION The most important observation of this study was that during a 1-mile time trial at maximal effort, average power was not different when riding in the aero versus upright position. Therefore, the hypothesis that there would be no difference in power output between the positions is accepted. The power data collected in this study compares well with data collected in other studies (Aisbett, Le Rossignol, McConell, Abiss, 2009; Watson & Swensen, 2006; Wilson, Lane, Beedie, & Farooq, 2011). For example, it has been reported that average power was about W for a 5 mile TT (Wilson, Lane, Beedie, & Farooq, 2011), and W for a 5 minute TT (Aisbett, Le Rossignol, McConell, Abiss, 2009). In the present study, power output was ± W for a 1 mile TT and seem reasonable. Likewise, the heart rate observed during the 1 mile TT in this study ( bpm) are as expected. In comparison, during a 10 mile TT (Wilson, Lane, Beedie, & Farooq, 2011), average heart rate values of bpm were recorded. Heart Rate values for a 5 mile TT (Watson & Swensen, 2006) were bpm. The average speed observed during the 1-mile TT (26 mph) was indicative of a competitive cyclist and in line with speeds from other studies. For example, speed for a 10 mile TT (Wilson, Lane, Beedie, & Farooq, 2011) averaged about 23 mph and the speed for the 5 mile TT (Watson & Swensen, 2006) averaged about 24 mph. As the present study used a notably shorter TT, it seems reasonable that the speed is higher (26 mph). Lastly, cadence during a 10 mile TT (Wilson, Lane, Beedie, & Farooq, 2011) 25
34 averaged about 100 rpm which reasonably compares with the present study values of about rpm. A unique aspect of this study was that it was done outdoors. Despite this, the results were similar to lab based research (Hubenig, Game and Kennedy, 2011) in which the authors also observed no significant power difference between the upright and aero positions. In the study by Origenes et al. (1993), no difference between the positions was observed in the ventilatory response of the participants, indicating that there was no metabolic difference in the participants between the two positions. Ryschon and Stray-Gunderson (1991) examined the energy cost of cycling between the upright and the drop-bar position, which is similar to the aero position. No significant difference was observed in VO 2, RER, or heart rate. These findings are in line with the current study as no difference was observed in the heart rate of the participants between the positions. Therefore, the lab-based research seems to be a good model and the results can be generalized to field testing for at least a 1 mile TT effort. To better understand the group results, individual responses were inspected. Figures 6-9 illustrate the difference in each dependent variable between the upright and aero positions for each subject. Individual responses were fairly well distributed and somewhat consistent. For example, participants #2 and 4 had their largest values for the aero position in three of the four variables, and participant s #3 and 6 had their largest values for the upright position in three of the four variables. There are some factors which may have influenced the outcome of the current study. For example, this study was conducted at the end of the participants cycling season. Three of the participants (#3, 5, and7) had not cycled for a month prior to testing. 26
35 It may have been that the 2 x 1 mile TTs may have been influenced by fatigue. However, the tests were counterbalanced; every other participant conducted their first test in a different order. Additionally, it was required that each participant reach a recovery heart rate within 10% of their pre-first-condition test before they began their second condition test. It is believed that this allowed the participants to start each test at the same metabolic state. The difference in power, heart rate and speed between positions for these participants was small (Figures 6, 7 and 8). Nevertheless, it is not known if the results would be different if the testing were done at a different point in the cycling season. Another confounding factor might be the experience of the participants. The experience ranged from recreational riders to active racers. Participant inclusion criteria were set such that there was a minimum of six months experience riding in the aero position was required. It was thought that any recruited riders would be currently conditioned in both the upright and aero positions. What was not accounted for was that four of the participants (#1, 2, 3, and 5) would have the requisite experience, but it was not recent (e.g., not within the previous year). Peveler (2004) reported that cyclists had greater power output in the position they trained in. It is not clear if position-specific training influenced the outcome of the study. Future research may benefit by setting a more stringent inclusion criterion based on position training. Lastly, two of the participants (#4 and 6) rode their bike to the testing site while others drove. While the test protocol called for a standard warm up, these two had a few more miles of riding before their tests. These participants could be either more adequately warmed up than the other participants, of perhaps slightly more fatigued. 27
36 Difference in Watts However, these participants were the more experienced and more active of the participants. It is thought that they were better conditioned and that a few more miles of moderate intensity riding would not impact their performance. As it turned out, one completed the first test in the aero position while the other tested in the upright first. Often in field testing it is difficult to control all aspects of a subject behavior prior to testing. In future research, it might be important to consider limiting the amount of riding subjects participate in prior to testing Difference in Power Between Positions (upright-aero) Participant Figure 6. Magnitude of difference in power between positions. A positive number indicates a higher power output in the upright position; a negative number means higher power in the aero position. 28
37 Difference in mph Difference in bpm 60 Difference in Heart Rate Between Positions (upright- aero) Participant Figure 7. Magnitude of difference in heart rate between positions. A positive number indicates a higher heart rate in the upright position; a negative number means higher heart rate in the aero position Difference in Speed Between Positions (upright-aero) Participant Figure 8. Magnitude of difference in speed between positions. A positive number indicates a higher speed in the upright position; a negative number means higher speed in the aero position. 29
38 Difference in rpm Difference in Cadence Between Positions (upright-aero) Participant Figure 9. Magnitude of difference in cadence between positions. A positive number indicates a higher cadence in the upright position, a negative number means higher cadence in the aero position. The study is limited based on the number of participants. Inspecting the individual responses, it was noted that all but one participant (#4) had a higher power output in the upright position, and that difference was the largest difference of all the participants (Figure 6). Data were re-analyzed without participant 4 s data and it was determined that power was different between cycling positions (p<0.05). However, there was still no difference in heart rate, speed, or cadence between positions (p>0.05). That raises the question whether or not participant #4 was a statistical outlier or if he was a typical part of the population not appropriately sampled. Furthermore, another participant (#5) had less than 20 W difference between positions. Taken together, 5 of 7 participants had achieved at least 20 W more cycling power in the upright vs. aero position. This difference in power, however, did not result in an increase in speed. 30
39 An area of concern for this study is whether the time between TTs was sufficient for the participants to recover, even though the conditions were counterbalanced. To address this concern, statistical analysis was done to test for order to see if there was a difference between the first and second TT regardless of cycling position. The average power output of the first TTs was ±92.8 and the second TTs 270.4±73.9. These were not significantly different (p= 0.096). Therefore, it seems there was no influence of order of conditions. Another point of note based on data analysis was that not only was power not significantly different, but neither was speed. It is widely known in the cycling/triathlon community that the aero position is faster than the upright position, especially on a flat course such as the one used in this study. It may be that the aero position for each cyclist was not more aerodynamic than the upright positions. In this study, participants had set their own aero position prior to volunteering to participate in the study and no adjustment or feedback was provided to the participants. Alternatively, it may have been that participants assumed a more aero upright position. In either case, if cycling power and speed are the same between positions, the drag force would be the same (given that rolling resistance, slope resistance, and bearing resistance remained the same between conditions). The only instructions given were for the upright position, hands needed to be kept on the break hoods, and for aero, elbows needed to stay on the aero bar pads. Another explanation for why aero position was not faster is that the course was only one mile long, taking the participant only minutes to complete. Such a short course may not provide enough time for the aerodynamic advantage to be significant. A confounding factor in field work like this is the weather. Although each participant 31
40 completed both conditions on the same day, participants were tested on different days. However, as previously stated, there was no order effect. Nevertheless, weather was checked via The Weather Channel and it was determined that maximum winds for each test day was at, or below, 9 mph. Temperature and humidity were measured on site and were similar for all tests. However, exact wind speed could not be determined on site during testing. Qualitatively, the observed wind direction, when wind was detectable, was always from the west, giving the riders a tail wind for the tests. Wind direction is important in determining the drag force. It may be that there was no difference in speed or power because the drag force was minimized in both conditions due to a tail wind. In future research, equipment such as an anemometer should be used on site to determine actual wind speed and direction. Future research should better control for the conditioning of the participants, such as conducting the tests inside of the training season. The conditioning of the participants could be better controlled by requiring them to have currently trained in the aero position. Requiring strict adherence to a standard warm up would also benefit any future research. Lastly, increasing the number of participants would add to the validity of the results. In summary, seven moderately trained cyclists with experience in the upright and aero positions completed two one-mile TTs. Position was the independent variable while power, heart rate, speed and cadence were the independent variables. The power output, heart rate, speed and cadence were not significantly different (p>0.05) between the upright and aero positions. Although the group response was not different for power output and speed between positions, 5 of 7 participants had at least 20 W more power output during upright versus aero position. This means that in a 1 mile TT, most subjects 32
41 were able to achieve the same speed while using less power during aero vs. upright cycling positions. 33
42 APPENDIX A: INFORMED CONSENT FORM 34
43 35
44 36


45 APPENDIX B: TEST DATA GRAPHS 37
46 38
47 39
48 40

49 41
Validity and Reproducibility of the Garmin Vector Power Meter When Compared to the SRM Device
 Journal of Sports Science 5 (2017) 235-241 doi: 10.17265/2332-7839/2017.05.001 D DAVID PUBLISHING Validity and Reproducibility of the Garmin Vector Power Meter When Compared to the SRM Device Randolph
Myths and Science in Cycling
 Myths and Science in Cycling John McDaniel, PhD Kent State University Jim Martin, PhD - U of Utah Steve Elmer, PhD- Michigan Tech Who am I PhD in Exercise Physiology under Dr. Jim Martin at the University
Innovation Report. Physiological and Biomechanical Testing of EasyPedal Pedal Prototypes. Jan 2012
 Innovation Report Physiological and Biomechanical Testing of EasyPedal Pedal Prototypes Jan 2012 Report: Data collection: Dr. Michael Hanlon and Dr. Rodney Kennedy Sport and Exercise Research Institute,
BEGINNER /INTERMEDIATE OSWEGO TRIATHLON - SPRINT TRIATHLON PLAN
 www.outrivalracing.com BEGINNER /INTERMEDIATE OSWEGO TRIATHLON - SPRINT TRIATHLON PLAN This plan is 10 weeks long and will prepare you for the Oswego Sprint Triathlon. It can be used by both beginners
University of Canberra. This thesis is available in print format from the University of Canberra Library.
 University of Canberra This thesis is available in print format from the University of Canberra Library. If you are the author of this thesis and wish to have the whole thesis loaded here, please contact
Positioned For Speed
 Positioned For Speed Positioned For Speed Global Network Retül Alphamantis Technologies PowerTap VELO Sports Center Pro Tour Level Team Support Team Sky Garmin Sharp Orica GreenEDGE Team Europcar Columbia
A Re-Examination of Running Energetics in Average and Elite Distance Runners
 University of Colorado, Boulder CU Scholar Integrative Physiology Graduate Theses & Dissertations Integrative Physiology Spring 1-1-2013 A Re-Examination of Running Energetics in Average and Elite Distance
12 Week SPRINT BEGINNER TRIATHLON TRAINING PLAN
 RG Active 12 Week Sprint Triathlon Plan Page 1 12 Week SPRINT BEGINNER TRIATHLON TRAINING PLAN Key Notes RG Active 12 Week Sprint Triathlon Plan Page 2 The NSPCC has teamed up with RG Active to be the
12 Week Winter Maintenance Olympic Bridge to Half Ironman
 12 Week Winter Maintenance Olympic Bridge to Half Ironman This program should be used for an athlete who is coming off an Olympic Distance Race and: 1. They have a very strong base of 4-6 months of consistent
RG Active 12 Week Super Sprint Triathlon Plan Page Week SUPER SPRINT BEGINNER TRIATHLON TRAINING PLAN
 RG Active 12 Week Super Sprint Triathlon Plan Page 1 12 Week SUPER SPRINT BEGINNER TRIATHLON TRAINING PLAN RG Active 12 Week Super Sprint Triathlon Plan Page 2 Key Notes The NSPCC has teamed up with RG
If you have a swimming background and you want to add distance or repetitions to the workouts, you are more than welcome to do that.
 12 Week Sprint Distance Plan, Int-Adv. This program should be used by an athlete in their second year or triathlon or beyond. The program consists of 3 workouts per week in each sport, 1-2 days of strength
Personal Bicycle Fitting Report Rider Information
 5/19/2011 Retül Notes Report Specialized Dolce PRE-FIT NOTES Courtney is a recreational cyclist coming in today for a fit on her road bike. She enjoys riding with friends and in group rides. She has had
12. Laboratory testing
 12. Laboratory testing The performance lab of a Sports Medical Center offers various tests. In this paper we elaborate the testing of the aerobic system of a runner on a treadmill. To test the aerobic
RG Active 12 Week Olympic Triathlon Plan Page Week OLYMPIC INTERMEDIATE TRIATHLON TRAINING PLAN
 RG Active 12 Week Olympic Triathlon Plan Page 1 12 Week OLYMPIC INTERMEDIATE TRIATHLON TRAINING PLAN RG Active 12 Week Olympic Triathlon Plan Page 2 Key Notes The NSPCC has teamed up with RG Active to
Anaerobic and aerobic contributions to 800 m and 8 km season bests
 Short Communication Anaerobic and aerobic contributions to 8 m and 8 km season bests Julia C. Blumkaitis, Christopher L. Sandefur, Christopher A. Fahs, Lindy M. Rossow Objective: Both anaerobic and aerobic
Variability of pacing in marathon distance running
 UNLV Theses, Dissertations, Professional Papers, and Capstones 12-2010 Variability of pacing in marathon distance running Thomas A. Haney Jr. University of Nevada, Las Vegas Follow this and additional
A Novel Gear-shifting Strategy Used on Smart Bicycles
 2012 International Conference on Industrial and Intelligent Information (ICIII 2012) IPCSIT vol.31 (2012) (2012) IACSIT Press, Singapore A Novel Gear-shifting Strategy Used on Smart Bicycles Tsung-Yin
WHITE PAPER THE SCIENCE BEHIND NON-CIRCULAR CHAINRINGS
 WHITE PAPER THE SCIENCE BEHIND NON-CIRCULAR CHAINRINGS PREFACE Since the origin of the bicycle more than a century ago, improving pedaling efficiency has long been identified as an area warranting research.
Watson's Workouts. Supercharge. Your Cycling. By Lance Watson. Photographs by Scott Draper. triathlete.com 93
 Watson's Workouts Supercharge Your Cycling By Lance Watson Photographs by Scott Draper triathlete.com 93 T he use of power meters in cycling workouts is becoming more more prevalent. Heart rate monitoring
Physiological Assessment: Summary Report 11 December 2011
 Physiological Assessment: Summary Report 11 December 211 Katie Parry MD/LD Runner Athlete Test conducted and report compiled by: Dr Andi Drake England Athletics, Leeds Metropolitan University Headingley
Training Program. Definitions. Preparation for Training
 Training Program The attached 8 week program is designed for EXPERIENCED cyclists aiming for the Grafton to Inverell Cycle Classic 228km ride. It can be used as a guide to assist you prepare for the event
Using Hexoskin Wearable Technology to Obtain Body Metrics During Trail Hiking
 Technical Note Using Hexoskin Wearable Technology to Obtain Body Metrics During Trail Hiking JEFF MONTES 1, TORI M. STONE 1, JACOB W. MANNING 2, DAMON MCCUNE 1, DEBRA K. TACAD 1, JOHN C. YOUNG 1, MARK
HPA Power Transmission. Everardo Uribe
 HPA Power Transmission There are several forces the HPA has to overcome, most of these forces will have to be overcome by the power transmission component. The main force will of course be aerodynamic
Summary of Preliminary Report on the Performance Enhancements provided by ROTOR Q-Rings Foreword
 Summary of Preliminary Report on the Performance Enhancements provided by ROTOR Q-Rings Foreword This document is an abridged version of a larger study. For more detailed information, please refer to the
Steeplechase Hurdle Economy, Mechanics, and Performance
 Brigham Young University BYU ScholarsArchive All Theses and Dissertations 2013-06-27 Steeplechase Hurdle Economy, Mechanics, and Performance Sarah Ingebretsen Brigham Young University - Provo Follow this
8-week Olympic training plan for intermediate triathletes
 INVEST IN YOUR HEALTH AND YOUR WEALTH 8-week Olympic training plan for intermediate triathletes Official title sponsor of the www.ajbell.co.uk RG Active 8 Week COMPETE Olympic Triathlon Plan Page 2 Key
Create a road in your house
 2016.5.20 All cyclists should be able to enjoy sport cycling without regard for the place or time. We want cyclists to be able to ride as hard as they want indoors regardless of the weather or time of
Changes in a Top-Level Soccer Referee s Training, Match Activities, and Physiology Over an 8-Year Period: A Case Study
 Case Study International Journal of Sports Physiology and Performance, 2011, 6, 281-286 2011 Human Kinetics, Inc. Changes in a Top-Level Soccer Referee s Training, Match Activities, and Physiology Over
TRAINING PLAN WATTBIKE.COM BASE PLAN
 PLAN WATTBIKE.COM BASE PLAN BASE PLAN ABOUT The term base training is common in cycling speak but what does it mean and why do you do it? Base training is the process of gradually developing a platform
RESPIRATORY REGULATION DURING EXERCISE
 RESPIRATORY REGULATION DURING EXERCISE Respiration Respiration delivery of oxygen to and removal of carbon dioxide from the tissue External respiration ventilation and exchange of gases in the lung Internal
Lucy Gossage 12 Week. Desirable Triathlon Training Plan
 Lucy Gossage 12 Week Desirable Triathlon Training Plan Key points This is a 12 week training program aimed at novices working towards their first Olympic distance triathlon (1500m swim, 40km bike, 10km
KEVIN BATCHELOR :01 SITE FITTER
 Personal Bicycle Fitting Report KEVIN BATCHELOR 2014-05-30 15:01 RIDER Kevin Batchelor Age: 32 Male Blank@Blank.com BIKE MAKE/MODEL: Mosaic, RT-1 SIZE: Custom YEAR: 2013 TYPE: Road SITE Retul HQ 5445 Conestoga
Optimization of an off-road bicycle with four-bar linkage rear suspension
 Proceedings of MUSME 2008, the International Symposium on Multibody Systems and Mechatronics San Juan (Argentina), 8-12 April 2008 Paper n. 02-MUSME08 Optimization of an off-road bicycle with four-bar
Influence of Angular Velocity of Pedaling on the Accuracy of the Measurement of Cyclist Power
 Influence of Angular Velocity of Pedaling on the Accuracy of the Measurement of Cyclist Power Abstract Almost all cycling power meters currently available on the market are positioned on rotating parts
The Physical and Physiological Characteristics of 3x3. Results of Medical Study & Scientific Test
 The Physical and Physiological Characteristics of 3x3 Results of Medical Study & Scientific Test Prepared by Dr. Paul Montgomery & Brendan Maloney (Aspetar Orthopaedic Hospital) In cooperation with FIBA
JOHN SHORTT :14. Personal Bicycle Fitting Report RIDER SITE BIKE FITTER SUMMARY OF SESSION. John Shortt Age: 57 Male
 Personal Bicycle Fitting Report JOHN SHORTT 2014-04-30 11:14 RIDER John Shortt Age: 57 Male john.shortt@cycle.ie BIKE MAKE/MODEL: BMC, Road Racer SL02 SIZE: 54 YEAR: 2012 TYPE: Road SITE Bike Fit Studio
Bicycle Fit Services
 Bicycle Fit Services Fitting Services (click to go to) - Premium 3D Motion Capture Bike Fit ~ $399 - Complete 3D Motion Capture Bike Fit ~ $299 - Multi-Bike Complete 3D Motion Capture Bike Fit ~ $474-2D
COMPARISON OF BIOMECHANICAL DATA OF A SPRINT CYCLIST IN THE VELODROME AND IN THE LABORATORY
 COMPARISON OF BIOMECHANICAL DATA OF A SPRINT CYCLIST IN THE VELODROME AND IN THE LABORATORY Louise Burnie 1,2, Paul Barratt 3, Keith Davids 1, Paul Worsfold 2,4, Jon Wheat 1 Centre for Sports Engineering
COMPARISON OF RESULTS OF AEROBIC POWER VALUE DERIVED FROM DIFFERENT MAXIMUM OXYGEN CONSUMPTION TESTING METHODS
 COMPARISON OF RESULTS OF AEROBIC POWER VALUE DERIVED FROM DIFFERENT MAXIMUM OXYGEN CONSUMPTION TESTING METHODS LI JIA A THESIS SUBMITTED IN PARTIAL FULFILLMENT OF THE REQUIREMENTS FOR THE MASTER DEGREE
JEPonline Journal of Exercise Physiologyonline
 Walking Technique and Estimated VO 2 max Values 21 JEPonline Journal of Exercise Physiologyonline Official Journal of The American Society of Exercise Physiologists (ASEP) ISSN 1097-9751 An International
Products for life and performance
 OUR PROUD HISTORY CHOSEN BY KNOWLEDGE A century has passed since the first Monark bike left the factory. Today, Monark has achieved recognition as the leading brand worldwide. A large part of this success
Exploring the relationship between Heart Rate (HR) and Ventilation Rate (R) in humans.
 and Ventilation Rate (R) in humans.") Exploring the relationship between Heart Rate (HR) and Ventilation Rate (R) in humans. The Research Question In this investigation I will be considering the following general research question: Does increased
Exploring the relationship between Heart Rate (HR) and Ventilation Rate (R) in humans. The Research Question In this investigation I will be considering the following general research question: Does increased
Comparison of Ventilatory Measures and 20 km Time Trial Performance
 Original Research Comparison of Ventilatory Measures and 20 km Time Trial Performance WILLARD W. PEVELER 1, BRANDY SHEW 1, SAMANTHA JOHNSON 3, GABE SANDERS 1, and ROGER KOLLOCK 2 1 Department of Kinesiology
Pedaling effectiveness. Jon Iriberri & Javier Sola WKO4
 Pedaling effectiveness Jon Iriberri & Javier Sola WKO4 About us Jon Iriberri @iriberrijon ceo@custom4.us Javier Sola @jsolalo jsola@training4ll.com 2 Usefull & useless forces Osorio Valencia 2007 Tangential
Biomechanics of Parkour: The Vertical Wall-Run Technique
 University of Colorado, Boulder CU Scholar Undergraduate Honors Theses Honors Program Spring 2015 Biomechanics of Parkour: The Vertical Wall-Run Technique Integrative Physiology, Peter.Lawson@Colorado.EDU
Journal of Human Sport and Exercise E-ISSN: Universidad de Alicante España
 Journal of Human Sport and Exercise E-ISSN: 1988-5202 jhse@ua.es Universidad de Alicante España KALINA, TOMAS; CACEK, JAN; KMETOVA, LINDA The running economy difference between running barefoot and running
Available online at Prediction of energy efficient pedal forces in cycling using musculoskeletal simulation models
 Available online at www.sciencedirect.com Engineering 2 00 (2010) (2009) 3211 3215 000 000 Engineering www.elsevier.com/locate/procedia 8 th Conference of the International Sports Engineering Association
GROUND REACTION FORCE DOMINANT VERSUS NON-DOMINANT SINGLE LEG STEP OFF
 GROUND REACTION FORCE DOMINANT VERSUS NON-DOMINANT SINGLE LEG STEP OFF Sara Gharabaghli, Rebecca Krogstad, Sara Lynch, Sofia Saavedra, and Tamara Wright California State University, San Marcos, San Marcos,
SQUASH CANADA TECHNICAL AND FITNESS TESTING PROTOCOL MANUAL
 SQUASH CANADA TECHNICAL AND FITNESS TESTING PROTOCOL MANUAL Revised April 2010 Table of Contents Introduction to Squash Canada... 3 Need for Technical & Fitness Testing Protocols... 3 Long Term Player
PEDALING ANALYSIS Pedaling Analysis monitor the power output variations coordinated action the smoothness of the pedaling
 Pedaling Analysis is a new and exclusive DIRETO feature developed by Elite to monitor the rider s power output throughout each pedal stroke. The rider can monitor the power output variations of each pedal
Technical Report: Accuracy Testing of 4iiii Innovations PRECISION Powermeter Technology
 Technical Report: Accuracy Testing of 4iiii Innovations PRECISION Powermeter Technology Scott Cooper, Ph.D, 4iiii Innovations Inc. Wouter Hoogkramer, Ph.D and Rodger Kram, Ph.D, University of Colorado
Head Set 1-1/8 1-1/4 Brake Front / Rear brake calipers Frame 100% 40T high-modulus carbon 1,350g Fork Full carbon fork 680g BB Type BB 386
 2014 Head Set 1-1/8 1-1/4 Brake Front / Rear brake calipers Frame 100% 40T high-modulus carbon 1,350g Fork Full carbon fork 680g BB Type BB 386 The VIPER geometry is designed for long distance triathlon
The Effect of a Seven Week Exercise Program on Golf Swing Performance and Musculoskeletal Screening Scores
 The Effect of a Seven Week Exercise Program on Golf Swing Performance and Musculoskeletal Screening Scores 2017 Mico Hannes Olivier Bachelor of Sport Science Faculty of Health Sciences and Medicine Bond
Effects of foot-pedal interface rigidity on high frequency cycling acceleration. John Romanishin
 Thursday 14:00-17:00 Go forth final Paper Assignment Effects of foot-pedal interface rigidity on high frequency cycling acceleration John Romanishin 5/9/2011 2.671 Measurement and Instrumentation Professor
The Weekend Warrior. VeloSano Training Guide
 VeloSano Training Guide The Weekend Warrior By Dr. Michael Schaefer This guide includes suggestions for training for the VeloSano Bike to cure event of your chosen distance. If you are new to bicycling,
Here you should be building a routine and allocating time to train, learning skills and using drill work to improve technique.
 WEEK 1 Here you should be building a routine and allocating time to train, learning skills and using drill work to improve technique. Remember to adapt sessions if you cannot complete them due to your
T R A F F I C S K IL L S 101
 page 1/5 GENERAL INSTRUCTIONS Mark your answers on the answer sheet provided. DO NOT make any marks on the test. Please read the following definitions and assumptions carefully before answering the test
18-week training program
 MARA T HON 18-week training program T H E G O A L O F T H I S P L A N I S N T T O G E T Y O U A C R O S S T H E F I N I S H L I N E, I T S T O G E T T H E B E S T V E R S I O N O F Y O U A C R O S S T
PowerStroke TM Operating Instructions. November 2015 PROTECTED BY ONE OR MORE OF THE FOLLOWING US PATENTS 7,387,029; 7,377,180; D528,451
 PowerStroke TM Operating Instructions November 2015 PROTECTED BY ONE OR MORE OF THE FOLLOWING US PATENTS 7,387,029; 7,377,180; D528,451 NOTE: THESE INSTRUCTIONS ARE TO BE USED IN CONJUNCTION ISAAC SOFTWARE
15KM 14-WEEK TRAINING PROGRAMME
 15KM 14-WEEK TRAINING PROGRAMME T H E G O A L O F T H I S P L A N I S N T T O G E T Y O U A C R O S S T H E F I N I S H L I N E, I T S T O G E T T H E B E S T V E R S I O N O F Y O U A C R O S S T H E
IRONMAN NUTRITION ESSENTIALS:
 A lot of people are deterred from doing Ironman because they don t think they have the time to train. Although a 15- to 20-hour training schedule is ideal to maximize your Ironman potential, you can accomplish
REVBOX MK7.0 INSTRUCTION MANUAL
 REVBOX MK7.0 INSTRUCTION MANUAL WELCOME TO THE REVBOX COMMUNITY... Congratulations on the purchase of your new Revbox a low inertia, stationary air resistance trainer with no fly wheel assistance, designed,
University of Canberra. This thesis is available in print format from the University of Canberra Library.
 University of Canberra This thesis is available in print format from the University of Canberra Library. If you are the author of this thesis and wish to have the whole thesis loaded here, please contact
Dublin to Paris 12 Week Training Plan
 Dublin to Paris 12 Week Training Plan Before you Start There is no suggested route through the mix of road and Wattbike sessions - mix and match - we suggestthat a good mix would be a ratio of :1 / 4:1
Nathaniel T. Berry. Chapel Hill Approved By: Claudio L. Battaglini, Ph.D. Anthony C. Hackney, Ph.D., D.Sc. Edgar W. Shields, Ph.D.
 THE EFFECTS OF A 10 KM RUN AND 30 KM CYCLING TIME-TRIAL ON VENTILATORY THRESHOLD DURING THE FINAL RUNNING LEG OF AN ITU DUATHLON IN HIGHLY-TRAINED MULTI-SPORT ATHLETES Nathaniel T. Berry A thesis submitted
Walking Simulator Mechanism
 The Downtown Review Volume 2 Issue 2 Article 4 2015 Walking Simulator Mechanism Titus Lungu Cleveland State University Igor Tachynskyy Cleveland State University Omri Tayyara Cleveland State University
EUCLID AVENUE PARKING STUDY CITY OF SYRACUSE, ONONDAGA COUNTY, NEW YORK
 EUCLID AVENUE PARKING STUDY CITY OF SYRACUSE, ONONDAGA COUNTY, NEW YORK CITY OF SYRACUSE DEPARTMENT OF PUBLIC WORKS 1200 CANAL STREET EXTENSION SYRACUSE, NEW YORK 13210 DRAFT REPORT DATE: November 13,
Ground Forces Impact on Release of Rotational Shot Put Technique
 Brigham Young University BYU ScholarsArchive All Theses and Dissertations 2014-12-01 Ground Forces Impact on Release of Rotational Shot Put Technique Niklas B. Arrhenius Brigham Young University - Provo
An Analysis of the Bicycle-Rider Interface Forces in Stationary Road Cycling
 University of Colorado, Boulder CU Scholar Integrative Physiology Graduate Theses & Dissertations Integrative Physiology Spring 1-1-2015 An Analysis of the Bicycle-Rider Interface Forces in Stationary
Relationship Between Glide Speed and Olympic Cross-Country Ski Performance
 JOURNAL OF APPLIED BIOMECHANICS, 1994,10, 393-399 O 1994 by Human Kinetics Publishers, Inc. Relationship Between Glide Speed and Olympic Cross-Country Ski Performance Glenn M. Street and Robert W. Gregory
TRAINING WITH! PHYSICLO RESISTANCE GEAR. Testing & Validation
 TRAINING WITH! PHYSICLO RESISTANCE GEAR Testing & Validation WHAT IS PHYSICLO? Physiclo is a novel type of compression pants with built-in resistance bands, designed to enhance training efficiency by increasing
Assessment of an International Breaststroke Swimmer Using a Race Readiness Test
 International Journal of Sports Physiology and Performance, 2009, 4, 139-143 2009 Human Kinetics, Inc. Assessment of an International Breaststroke Swimmer Using a Race Readiness Test Kevin G. Thompson
ME217 Fall 2017 Calibration Assignment
 ME217 Fall 2017 Calibration Assignment Jane Doe November 6, 2017 1 1 Summary of problem statement Prof. Mammoli seeks to estimate the mechanical energy needed to propel himself and his roadbike from his
Biomechanical analysis of the medalists in the 10,000 metres at the 2007 World Championships in Athletics
 STUDY Biomechanical analysis of the medalists in the 10,000 metres at the 2007 World Championships in Athletics by IAAF 23:3; 61-66, 2008 By Yasushi Enomoto, Hirosuke Kadono, Yuta Suzuki, Tetsu Chiba,
Kiss Shoulder Pain Goodbye: Proper Technique - The Key to Preventing and Relieving Shoulder Pain
 Kiss Shoulder Pain Goodbye: Proper Technique - The Key to Preventing and Relieving Shoulder Pain Al Dodson - Head Coach, Egyptian National Team Shoulder pain is a common phenomenon in competitive swimming.
EPICYCLIC POWERED BICYCLE
 EPICYCLIC POWERED BICYCLE Prof. S. V. Deshpande¹, Ajinkya V. Waghade², Mayur D. Wadulkar³, Madhusudan M. Sonwane 4 Sunilkumar Wagh 5 1 Asst. Professor, Dept of Mechanical engg, GSMCOE Balewadi, Pune. (India)
A New Approach to Modeling Vertical Stiffness in Heel-Toe Distance Runners
 Brigham Young University BYU ScholarsArchive All Faculty Publications 2003-12-01 A New Approach to Modeling Vertical Stiffness in Heel-Toe Distance Runners Iain Hunter iain_hunter@byu.edu Follow this and
EFFECTS OF CHAINRING DESIGN ON PERFORMANCE IN COMPETITIVE CYCLISTS
 i EFFECTS OF CHAINRING DESIGN ON PERFORMANCE IN COMPETITIVE CYCLISTS A Thesis presented to the Faculty of California Polytechnic State University, San Luis Obispo In partial fulfillment of the requirements
60bbm and less 60-50bbm 50-30bbm 30-20bbm 20-10bbm (incorporates a significant aerobic component)
") TRAINING SPECIFICS IN RELATION TO AEROBIC & ANAEROBIC CONDITIONING OF SWIMMERS By Leigh Nugent, National Youth Coach Training specificity is a term mentioned often in the literature published on the physiological
TRAINING SPECIFICS IN RELATION TO AEROBIC & ANAEROBIC CONDITIONING OF SWIMMERS By Leigh Nugent, National Youth Coach Training specificity is a term mentioned often in the literature published on the physiological
18-WEEK MARATHON TRAINING PROGRAM
 18-WEEK MARATHON TRAINING PROGRAM OCTOBER 9TH, 2016 T H E G O A L O F T H I S P L A N I S N T T O G E T Y O U A C R O S S T H E F I N I S H L I N E, I T S T O G E T T H E B E S T V E R S I O N O F Y O
Duration of exercise and anaerobic energy share. Assesment of anaerobic capabilities in elite athletes. Evaluation of anaerobic capabilities
 Assesment of anaerobic capabilities in elite athletes Dušan Hamar Dept. of Sports Medicine Inst. of Sports Sciences Bratislava Slovakia Energy share (%) Duration of exercise and anaerobic energy share
WHAT CAN WE LEARN FROM COMPETITION ANALYSIS AT THE 1999 PAN PACIFIC SWIMMING CHAMPIONSHIPS?
 WHAT CAN WE LEARN FROM COMPETITION ANALYSIS AT THE 1999 PAN PACIFIC SWIMMING CHAMPIONSHIPS? Bruce Mason and Jodi Cossor Biomechanics Department, Australian Institute of Sport, Canberra, Australia An analysis
Bicycling Simulator Calibration: Proposed Framework
 Article Bicycling Simulator Calibration: Proposed Framework Transportation Research Record 1 8 Ó National Academy of Sciences: Transportation Research Board 2018 Reprints and permissions: sagepub.com/journalspermissions.nav
Week 9 Training Programme
 Week 9 Training Programme Week 9 Congratulations, week 9, you are now 2/3 s the way through the Blueway 10K programme, just 4 weeks to go to the Blueway 10K events on the 20 th August. This week we re
Joint Torque Evaluation of Lower Limbs in Bicycle Pedaling
 11th conference of the International Sports Engineering Association, ISEA 216 Delft University of Technology; July 12 th Joint Torque Evaluation of Lower Limbs in Bicycle Pedaling Hiroki Yamazaki Akihiro
Monitoring of performance an training in rowers
 Monitoring of performance an training in rowers Jaak Jürimäe Demands of the Sport High maximal oxygen consumption (VO 2max ); Ability to perform at a high percentage of VO 2max for the duration of event;
Model based automated cycling ergometer
 Loughborough University Institutional Repository Model based automated cycling ergometer This item was submitted to Loughborough University's Institutional Repository by the/an author. Citation: CHAKRAVORTI,
APPLICATION OF FILMING AND MOTION ANALYSIS IN MOVEMENT STUDIES. Xie Wei Sports Medicine and Research Center, Singapore Sports Council, Singapore
 APPLICATION OF FILMING AND MOTION ANALYSIS IN MOVEMENT STUDIES Xie Wei Sports Medicine and Research Center, Singapore Sports Council, Singapore The sports biomechanics branch of Singapore Sports Council
1. Zinn, L. (2009). Zinn and the Art of Road Bike Maintenance, 3rd Ed. Boulder, CO: Velo Press.
. Zinn and the Art of Road Bike Maintenance, 3rd Ed. Boulder, CO: Velo Press.") Bike Fit Clinic 3/11/2014 James Cunningham, PT, DPT, OCS 1. Zinn, L. (2009). Zinn and the Art of Road Bike Maintenance, 3rd Ed. Boulder, CO: Velo Press. Basic frame guidelines Should be able to have at
Bike Fit Clinic 3/11/2014 James Cunningham, PT, DPT, OCS 1. Zinn, L. (2009). Zinn and the Art of Road Bike Maintenance, 3rd Ed. Boulder, CO: Velo Press. Basic frame guidelines Should be able to have at
Mixed Handcycle - 10 kilometers Classifications H1 H5 will race together but will scored separately
 Cycling Rules. Please note: The 2014 Warrior Games is not a qualifying event for the Paralympic Games or any other U.S. Paralympics or International Paralympic Committee sanctioned event. Disability/Classification
INVESTIGATION OF POWER OUTPUT ON A NOVEL BICYCLE DRIVE IN COMPARISON WITH THE COMMON BICYCLE DRIVE
 117 Biomechanics Symposia 2001 / University of San Francisco INVESTIGATION OF POWER OUTPUT ON A NOVEL BICYCLE DRIVE IN COMPARISON WITH THE COMMON BICYCLE DRIVE T. Angeli and R. Pawlik Institute for Machine
Sledge Hockey NatioNal team FitNeSS testing guidelines
 Sledge Hockey National Team Fitness Testing Guidelines ABOUT THIS RESOURCE This manual is designed to serve as a guideline for sledge hockey players and coaches who are striving to take their game to the
MANUAL POSITION SIMULATOR
 Introduction The Position Simulator has been developed to round off the Bikefitting.com Standard analysis. This device is very unique because you can determine exactly the right seat-angle. The measurement
18-WEEK BANK OF AMERICA CHICAGO MARATHON TRAINING PROGRAM OCTOBER 7, 2018
 18-WEEK BANK OF AMERICA CHICAGO MARATHON TRAINING PROGRAM OCTOBER 7, 2018 CONTENTS 04 INTRODUCTION 05 WEEKLY WORKOUTS 08 PACE CHART 09 GLOSSARY 10 IF YOU... 11 2018 BANK OF AMERICA CHICAGO MARATHON WEEK-BY-WEEK
The Optimal Downhill Slope for Acute Overspeed Running
 International Journal of Sports Physiology and Performance, 2008, 3, 88-93 2008 Human Kinetics, Inc. The Optimal Downhill Slope for Acute Overspeed Running William P. Ebben Purpose: This study evaluated
The running economy difference between running barefoot and running shod
 Proceeding 9th INSHS International Christmas Sport Scientific Conference, 4-6 December 2014. International Network of Sport and Health Science. Szombathely, Hungary The running economy difference between
Validation of a Step Test in Children Ages 7-11
 Validation of a Step Test in Children Ages 7-11 Emilene Clark Aurora Fry Colleen Smith Tonya Thomas Primary Advisor: Jim Farris, PT, PhD April 20, 2011 Background Exercise Testing Maximal Testing Sub-maximal
RELATION BETWEEN MAXIMAL ANAEROBIC POWER OUTPUT AND TESTS ON ROWING ERGOMETER
 Acta Facultatis Educationis Physicae Universitatis Comenianae Vol. 57 No 1 2017 RELATION BETWEEN MAXIMAL ANAEROBIC POWER OUTPUT AND TESTS ON ROWING ERGOMETER Matej Šmída, Michal Clementis, Dušan Hamar,
OXYGEN POWER By Jack Daniels, Jimmy Gilbert, 1979
 1 de 6 OXYGEN POWER By Jack Daniels, Jimmy Gilbert, 1979 Appendix A Running is primarily a conditioning sport. It is not a skill sport as is basketball or handball or, to a certain extent, swimming where
General Design Factors
 Chapter 3: 3-1.0 Introduction General Design Factors Mn/DOT s goals include encouraging and accommodating safe bicycling. From a design perspective, these goals are achieved by first having an understanding