Bureau of Planning and Research. Project No.: (C14) Phase II Final Report March 2, 2007 CMA
|
|
|
- Katherine Magdalene Gibson
- 6 years ago
- Views:
Transcription

1 Bureau of Planning and Research Safer Driver Actions at Stop Signs Project No.: (C14) Phase II Final Report March 2, 2007 CMA
2 Technical Report Documentation Page 1. Report No. 2. Government Accession No. 3. Recipient s Catalog No. FHWA-PA Title and Subtitle Safer Driver Actions at Stop Signs: Phase II (Final Report) 5. Report Date March 2, Performing Organization Code 7. Author(s) Tom Fox, P.E., Robert Dudash, P.E., Adam Smith, E.I.T., Catherine Anderson 8. Performing Organization Report No. 9. Performing Organization Name and Address URS Corporation Foster Plaza Holiday Drive, Suite 300 Pittsburgh, PA Sponsoring Agency Name and Address The Pennsylvania Department of Transportation Bureau of Planning and Research 400 North Street, 6 th Floor East Harrisburg, PA Work Unit No. (TRAIS) 11. Contract or Grant No (C14) 13. Type of Report and Period Covered Final Report 14. Sponsoring Agency Code 15. Supplementary Notes Phase II study incorporates results of the Phase I study previously conducted. 16. Abstract Final report covering driver stopping habits at stop-controlled intersections in Clearfield and Centre Counties. This was a two (2) phase project. Phase I dealt with finding out negative trends and problems in driver actions at stop signs, while Phase II evaluated the effectiveness of a variety of intersection improvements which sought to correct these negative trends and problems. 17. Key Words Traffic control devices, stop signs, safety, sight distance 18. Distribution Statement No restrictions. This document is available from the National Technical Information Service, Springfield, VA Security Classif. (of this report) 20. Security Classif. (of this page) 21. No. of Pages 22. Price Unclassified Unclassified 131 Form DOT F (8-72) Reproduction of completed page authorized
3 CMA Executive Summary The stop sign is one of the most common traffic control devices used by motorists daily, yet many people still are unsure or misinterpret the correct way to navigate through a stop-controlled intersection. With this in mind, this study was undertaken to determine the specific problems drivers were having and then to conceive ways to help correct these problems. The project was divided into two (2) phases. Phase I studied thirty-two (32) intersections in Clearfield and Centre Counties. After field observations and research (including crash history, pavement history, and Average Daily Traffic), analysis determined several trends in drivers stopping behavior. The physical location of the stop sign was determined to be the most important factor in where drivers stopped. Physical obstructions to sight distance also pulled drivers closer to the intersections, however stop bar and dashed edge-line pavement markings seemed to have little effect by themselves. A list of low-cost improvements was then developed which sought to help reduce the negative trends which were found. Phase II studied twenty-four (24) of the original intersections where low-cost improvements were made. The intersections were divided into three (3) groups. One (1) group had the pavement marking painted at each intersection near the edge of the main road. Another group had an AT WHITE LINE sign mounted below the stop sign at each intersection. Finally, the third group had both of these improvements installed at each intersection. Once the improvements were installed, each intersection, with the exception of one (1) where a paving project delayed the installation process, was observed once again in the field. The observations from Phase I and Phase II were then compared to determine which improvement was most effective. Age, gender, and speed limit were included in the evaluation. The main categories of data that emerged were: How many drivers rolled through the stop signs How many drivers did not stop at the stop signs What was the average stopping distance from the edge of the main road The table on the following page summarizes the relevant data from the analysis. The numerical increase or decrease from Phase I to Phase II in rolling stops, did not stops, and average stopping distance is shown. Also included is the numerical increase or decrease in average stopping distance from the edge of road. From the data it can be seen that the combination of on the pavement and the AT WHITE LINE sign proved most effective in reducing rolling stops and did not stops. Meanwhile, used by itself, the pavement marking reduced average distance from the edge of road by the greatest margin. All three improvements showed a reduction in this category, albeit fairly minimal. PROJECT NUMBER 04-01(C14) District 2-0 Safer Driver Actions at Stop Signs Executive Summary
4 CMA Type of Improvement "" on Pavement "AT WHITE LINE" Sign "" on Pavement & "AT WHITE LINE" Sign Summary of Relevant Data from Phase I to Phase II Intersection Number Rolling Stops (Numerical Increase/Decrease) Did Not Stops (Numerical Increase/Decrease) Average Distance from (Numerical Increase/Decrease) Increase Decrease Increase Decrease Increase Decrease AVERAGE AVERAGE AVERAGE Note: Increase (+) : Decrease (-) : Indicates more rolling stops or did not stops were recorded in Phase II than in Phase I, or drivers are stopping at a location farther from the edge of road. For example, at Intersection 141, +13 indicates that thirteen (13) more rolling stops were recorded after the improvements were installed. Indicates less rolling stops or did not stops were recorded in Phase II than in Phase I, or drivers are stopping at a location closer to the edge of road. For example, at Intersection 312, indicates that drivers stopped over seven (7) feet closer to the edge of roadway after the improvements were installed. PROJECT NUMBER 04-01(C14) District 2-0 Safer Driver Actions at Stop Signs Executive Summary
5 CMA Table of Contents I. Purpose of the Study...2 II. Project Overview...4 III. Intersections...8 Stop Sign At Intersection...9 Stop Sign At A Distance...13 Stop Sign With Dashed Edge-Line...17 Stop Sign With A Stop Bar...21 IV. Overall Analysis...26 V. Summary of Findings...40 VI. Conclusions Appendix A: Before & After Summary Sheets...51 Appendix B: Comparison Summary Sheets...75 Appendix C: Visual Analysis Diagrams...99 Appendix D: Analysis of the Effect of Age 108 Appendix E: Analysis of the Effect of Gender..110 Appendix F: Analysis of the Effect of Speed 112 Appendix G: Phase I Only Intersection Reports..114 Appendix H: Phase I Low-Cost Improvement Diagrams 121 Appendix I: Contact Information for Interview Participants 130 PROJECT NUMBER 04-01(C14) District 2-0 Safer Driver Actions at Stop Signs
6 CMA I. Purpose of the Study The stop sign is one of the most recognizable traffic control devices in the country. The command is quite simple and easy to understand, yet there are many drivers that fail to follow the instructions. This failure to comply has the potential to create devastating results. Though most drivers encounter stop signs several times on a daily basis, their understanding of rules governing placement of signs as well as the proper procedure for safe movement through the intersection is lacking. The Federal Highway Administration governs the use and proper placement of the R1-1 Stop Sign on the national level. The most recent version of their publication, the Manual on Traffic Control Devices (MUTCD), was released in In the Commonwealth of Pennsylvania, Publication 212: Official Traffic Control Devices (Pub. 212) adopts the National MUTCD on the state level. Pub. 212 was released in March It is important to note that, while both these documents are quite specific as to how the stop sign is to be used, none of the documents actually mandate how drivers navigate the stop-controlled intersection. The duties of the driver are thoroughly stated in Pa. Code Title 75, which is commonly referred to as the Vehicle Code. In section 3323, part b, it states: Except when directed to proceed by a police officer or appropriately attired persons authorized to direct, control or regulate traffic, every driver of a vehicle approaching a stop sign shall stop at a clearly marked stop line or, if no stop line is present, before entering a crosswalk on the near side of the intersection or, if no crosswalk is present, then at the point nearest the intersecting roadway where the driver has a clear view of approaching traffic on the intersecting roadway before entering. If, after stopping at a crosswalk or clearly marked stop line, a driver does not have a clear view of approaching traffic, the driver shall after yielding the right-of-way to any pedestrian in the crosswalk slowly pull forward from the stopped position to a point where the driver has a clear view of approaching traffic. The driver shall yield the right-ofway to any vehicle in the intersection or approaching on another roadway so closely as to constitute a hazard during the time when the driver is moving across or within the intersection or junction of roadways and enter the intersection when it is safe to do so. According to the MUTCD, the use of a stop sign may be warranted at an intersection where one or more of the following conditions exist: PROJECT NUMBER 04-01(C14) District 2-0 Safer Driver Actions at Stop Signs 2
7 CMA 1. Intersection of a less important road with a main road where application of the normal right-of-way rule would not be expected to provide reasonable compliance with the law 2. Street entering a through highway or street 3. Unsignalized intersection in a signalized area 4. High speeds, restricted view, or crash records indicate a need for control by the sign The proper type and placement of a stop sign is also governed by the MUTCD. Generally, this document provides the requirements and guidance as to the size of the sign, height of the sign, and actual placement of the sign. For a stop sign or any traffic control device to be effective, it has to be visible to the motorist and placed in such a location as to allow enough time for the driver to follow the instructions safely. Having a stop sign with restricted sight distance is maybe as bad as not having a stop sign at all. These factors make it very important to examine the placement and visibility of the stop signs at rural intersections. The rules that govern the placement of stop signs as well as the proper method for drivers approaching a stop-controlled intersection are listed in the documents previously discussed. Because of the issues discussed above, PennDOT commissioned a study to be conducted to evaluate possible improvements on how drivers are to negotiate through an unsignalized intersection. The study was conducted in two (2) phases: Phase I The purpose of Phase I of the study was to observe drivers actions at the intersections and to identify improper driving habits, if they existed, as well as analyze the intersections themselves in a manner similar to that of safety review. Phase II In Phase II, a series of low-cost improvements were then implemented at selected intersections from Phase I. These locations were then observed and analyzed in order to find the most effective means of improving driver behavior and awareness. Also, an implementation plan for a media campaign, public awareness, and public educational programs were provided. PROJECT NUMBER 04-01(C14) District 2-0 Safer Driver Actions at Stop Signs 3
8 II. Project Overview CMA The process of finding bad driver habits and developing low cost solutions to ensure safer driver actions at stop signs has been divided into multiple phases with several tasks performed in each phase. These tasks are listed and briefly summarized below: Literature Search: An extensive search was performed of available literature involving stop signs. Most of the sources were found online through searches on library databases as well as general searches on the Internet. These documents were reviewed and summarized, highlighting any information pertinent to this study including findings and recommendations made in previous studies. This information was summarized in table format along with the supporting literature. There was not an abundance of pertinent information found through the literature search, though some ideas presented were helpful through the progression of this study. Observations: Phase I In Phase I, a two-person team traveled to 32 intersections to observe driver actions. Most of the work was completed during November and December of 2004, but a few intersections were done in April 2005 in order to complete the first phase. The goal was 200 observations at each intersection or two 8-hour days of observations. In observing drivers at the selected intersections, a few factors had to be taken into account before any observations were made. First, in order to judge where drivers stop in relation to the edge of the road, the approach was marked in five-foot increments using a measuring wheel and marking paint. From there, a location was selected in which the observers had a good view of the drivers while at the same time not distracting the approaching motorists. As drivers pulled up to the stop approach, the two observers noted the following measurable items: total time spent at the intersection until completion of the movement where the driver stopped how many times the driver looked in each direction what type of turning movement was performed length of gaps in seconds on the main road whether the gap was accepted or rejected Other observations were made which are more qualitative such as whether the driver was distracted, gender and age of the driver, if the driver had difficulty seeing approaching traffic, if the main road traffic was speeding, and if there was a conflict. PROJECT NUMBER 04-01(C14) District 2-0 Safer Driver Actions at Stop Signs 4
9 CMA Phase II In Phase II, 24 intersections were chosen from Phase I to be observed again once improvements had been implemented. This work was completed in July and August of Once again the goal was 200 observations or two 8-hour days of observations. These observations were made in a similar fashion to Phase I, however only one person was used to collect data at each intersection instead of two people. Previously, in Phase I, a second person was needed to collect time of gap and other data. For both phases of the project, all of the observations were recorded on-site onto observation recording sheets by each of the observers. From the recording sheets, the data was entered into a spreadsheet so that queries and summaries could be conducted to help with the analysis of the field observations. Data Collection: Phase I Several measurements were taken prior to observing drivers as they negotiated the stop approach. Using a 100 foot measuring tape, a distance of 14.4 feet from the edge of the road was measured out and marked on the pavement with marking paint. This point is the decision point of the departure sight triangle on the minor road as directed in PennDOT s Publication 13M: Design Manual, Part 2, Highway Design (Pub. 13M, July 2002), section 2.18, part F, for assessing sight distance at a stop-controlled intersection. The grades for both the left and the right approaches on the main road were the second measurement. Using these grades, as well as the design speed for the road, the minimum stopping sight distances were calculated using a sight distance table. One observer would stand at the pavement marking while the other observer walked off the designated sight distance using a measuring wheel. A traffic cone with a reference marking 3.5 feet high, representing the object height specified in PennDOT s Publication 282: Highway Occupancy Permit Guidelines (Pub. 282, April 2004), was placed at the proper sight distance and the observer remaining at the intersection looked from an eye height of 3.5 feet to see if sight distance was adequate. If the sight distance was not adequate, the position of the driver s eye was moved closer to the intersection at a distance of 10 feet from the edge of the main road to verify that the proper stopping sight distance was available from that point. Similarly, the stopping sight distance was checked to verify proper sight distance was available for the stopping approach. The next step in the process was to make a sketch of the intersection, including an approximate north arrow, any pavement markings, widths of lanes and shoulders, any signs, sight obstructions, pavement condition, and any vertical geometric features such as the grades of the left and right approach. All of these PROJECT NUMBER 04-01(C14) District 2-0 Safer Driver Actions at Stop Signs 5
10 CMA items were included in the sketch as well as any other characteristics of the surrounding area that are pertinent to the study. To accompany the sketches, photographs were taken at each intersection to further document the conditions specific to each intersection. Along with measuring the available sight distances and making the sketches, traffic volumes for each intersection were obtained through PennDOT s computer database. These volumes were in terms of Average Daily Traffic (ADT). Phase II A comparison chart is included in the Part III: Intersections section for each of the study intersections. This chart shows the basic observational data which is expanded upon in the Part IV: Analysis section. The average distance a driver stops from the edge of roadway is given in feet. The average number of times a driver looks to the left and to the right is given as an average, rounded to the nearest 0.5 looks. Then, the most common maneuver (left, through, or right) is shown with the accompanying average time which was required for drivers to find a gap and complete their turning movement. Finally, the percentage of drivers that performed a rolling stop, as well the percentage of drivers that did not stop at all is shown. Analysis/Conclusions: Phase I Utilizing the data collected from the PennDOT files as well as the Phase I observation data, an analysis was performed to discover possible causation factors for drivers not stopping properly at stop signs. General trends and patterns were examined through visual analysis diagrams, tables, and figures to explore the differences in effect that the intersection scenarios had on drivers advancing on the stop-controlled approaches. From the information gained through the analysis, a list of eight (8) low-cost improvements was prepared. These deal mainly with altering or introducing new pavement markings, as well as a slight change in the use of signing. Diagrams of these changes can be seen in Appendix H. Phase II Three (3) of the low-cost improvements were implemented, Phase II data was collected, then observation data from Phase I and from Phase II was used to perform a detailed analysis in a before and after manner. As in Phase I, visual analysis diagrams were completed first, followed by a series of tables and figures which sought to explore the effectiveness of the three types of improvements which were installed at designated intersections. From the insight gained in this analysis, a series of conclusions were then compiled. Through these conclusions, suggested further actions to take in PROJECT NUMBER 04-01(C14) District 2-0 Safer Driver Actions at Stop Signs 6
11 CMA regards to each of the improvements can be found. Also included is updated information on the Public Awareness Campaign which considers the conclusions found in Phase II observations and analysis. PROJECT NUMBER 04-01(C14) District 2-0 Safer Driver Actions at Stop Signs 7
12 CMA III. Intersections Phase I A total of 32 intersections were studied throughout Clearfield and Centre Counties. These intersections were chosen because of physical characteristics that matched one of the 16 distinct scenarios for the intersection layouts. Two locations of each scenario were observed and analyzed in order to determine the differences, if any, in the way that drivers react to the different layouts. A coding system was developed for the different scenarios as follows: The first digit describes the intersection by its stop sign location and pavement markings o 1XX: Stop Sign at Intersection o 2XX: Stop Sign at a Distance (from the intersection) o 3XX: Stop Sign with a Dashed Edge-Line (on the major road) o 4XX: Stop Sign with a Stop Bar The second digit describes the intersection by main line speed limit and the presence of sight obstructions o X1X: Low Speed (25-40 mph)/no Sight Obstruction o X2X: Low Speed (25-40 mph)/sight Obstruction o X3X: High Speed (> 40 mph)/no Sight Obstruction o X4X: High Speed (> 40 mph)/sight Obstruction The third digit differentiates between the two examples of each scenario o XX1: First example of a particular scenario o XX2: Second example of a particular scenario Table 1 Intersection Numbers Low Speed (25-40 mph) No Sight Obstruction at Stop Sign Low Speed (25-40 mph) With a Sight Obstruction at Stop Sign High Speed (> 40 mph) No Sight Obstruction at Stop Sign High Speed (> 40 mph) With a Sight Obstruction at Stop Sign Stop Sign At Intersection Stop Sign A Distance From Intersection With Dashed Edge-Line With a Stop Bar PROJECT NUMBER 04-01(C14) District 2-0 Safer Driver Actions at Stop Signs 8
13 Table 2 Intersection Locations CMA Int. No. Intersection Name Int. No. Intersection Name Int. No. Intersection Name Int. No. Intersection Name 111 S.R & S.R S.R & Blue Course Dr 311 S.R & S.R S.R & Fourth St 112 S.R & Wilson St. 212 S.R & S.R T 919 & S.R S.R & Loop Rd. 121 S.R & Wilson St. 221 S.R & S.R S.R. 550 & S.R S.R. 322 & Ninth St 122 S.R & S.R S.R. 969 & S.R S.R. 550 & S.R S.R. 26 & T T 919 & S.R S.R & T S.R & S.R S.R. 322 & S.R S.R & S.R S.R. 153 & S.R S.R. 150 & S.R S.R. 45 & T S.R. 45 & S.R. 970 & S.R S.R. 144 & S.R S.R. 45 & T S.R & S.R S.R. 729 & S.R S.R. 219 & S.R S.R. 45 & T-354 Phase II A total of 24 intersections were chosen from Phase I to be studied in Phase II. These included six locations from each of the main categories (represented by the first digit in the intersection coding). They were then divided into three groups. The first group would have Modification Option 3 ( on Pavement) installed. The second group would have Modification Option 4 ( AT WHITE LINE Sign) installed. Finally, the third group would have Modification Option 7 ( on Pavement and AT WHITE LINE sign) installed together. Also, it was decided that each intersection would also have a dashed edge-line painted at the edge of roadway. This dashed edge-line is the white line referred to in the sign posted in Modification Option 4 and Modification Option 7. These intersections were then observed and analyzed to determine differences in the ways drivers stopping habits changed due to the three (3) improvements. Modification Options 1, 2, 5, 6, and 8 were not implemented. Stop Sign At Intersection Low Speed, No Sight Obstruction 111-S.R & S.R. 0053: Clearfield County- S.R is the major road with an Average Daily Traffic (ADT) of 6,300 vehicles and S.R is the stopping approach with an ADT of 1,700 vehicles. From field measurements it was determined that the corner sight distance in both directions is adequate as is the stopping sight distance. The posted speed limit on all approaches is 35 miles per hour. Due to driver behavior and proper road conditions, no specific recommendations for improvement were initially made in Phase I. However, it was later decided to modify the intersection by painting on the pavement and installing an AT WHITE LINE sign directly below the current stop sign prior to Phase II observations. The following table illustrates pertinent data comparing the Phase I and Phase II observations: PROJECT NUMBER 04-01(C14) District 2-0 Safer Driver Actions at Stop Signs 9
14 CMA Average Stopping Edge of Roadway (Feet) Table 3 Intersection 111 Average Number of Times Looked in Each Direction Maneuver (L T R) Time Required to Complete Movement (Seconds) % of That Performed a Rolling Stop % of That Did Not Stop Phase I L, 1.5R R Phase II L, IR R Notes: L = left, T = through, R = right 112-S.R & Wilson Street: Centre County S.R is the major road with an ADT of 3,500 vehicles and Wilson Street is the stopping approach with an ADT of 900 vehicles. The stop sign observed is for the southbound leg of Wilson Street. Corner sight distance to the left is obstructed only for drivers stopped at the stop sign and all other sight distances are proper. The posted speed limit on all approaches is 25 miles per hour. Initially, no improvements were recommended for this intersection due to the driver behavior exhibited at the stop sign. Though there have been reported crashes, drivers that were observed stopped at a point that provided more than adequate sight distance for them to enter the intersection. Eventually, an AT WHITE LINE sign was chosen to be installed below the stop sign on the side street as part of the improvements prior to conducting Phase II observations. However, for the Phase II observations only a dashed edge-line existed at this location. The following table illustrates pertinent data comparing the Phase I and Phase II observations: Average Stopping Edge of Roadway (Feet) Table 4 Intersection 112 Average Number of Times Looked in Each Direction Maneuver (L T R) Time Required to Complete Movement (Seconds) % of That Performed a Rolling Stop % of That Did Not Stop Phase I L, 2R T Phase II L, 1.5R T Notes: L = left, T = through, R = right PROJECT NUMBER 04-01(C14) District 2-0 Safer Driver Actions at Stop Signs 10
15 CMA Low Speed, Sight Obstruction 121-S.R & Wilson Street: Centre County S.R is the major road with an ADT of 3,500 vehicles and Wilson Street is the stopping approach with an ADT of 900 vehicles. The stop sign observed is for the northbound leg of Wilson Street. Proper corner sight distance to the right is obstructed by a set of stairs on a hill only when drivers are stopped at the stop sign. Sight distances are more than adequate when stopped closer to the edge of the main road. This is the other approach on Wilson Street that intersects S.R opposite intersection 112 listed above. The initial improvement suggested for Phase I to add a stop bar 11 feet from the intersection in order to encourage drivers to stop at a location where the proper corner sight distance is available. This was not installed, but instead it was decided to paint the word near the edge of roadway prior to Phase II observations. However for the Phase II evaluation, an AT WHITE LINE sign was also installed at this location. The following table illustrates pertinent data comparing the Phase I and Phase II observations: Average Stopping Edge of Roadway (Feet) Table 5 Intersection 121 Average Number of Times Looked in Each Direction Maneuver (L T R) Time Required to Complete Movement (Seconds) % of That Performed a Rolling Stop % of That Did Not Stop Phase I L, 2R T Phase II L, 1.5R T Notes: L = left, T = through, R = right High Speed, Sight Obstruction 141-S.R & S.R. 2012: Centre County S.R is the major road with an ADT of 6,000 vehicles and S.R is the stopping approach with an ADT of 1,500 vehicles. The corner sight distance to the left is not adequate if drivers stop at the stop sign. The sight distance is obstructed by the supports of a bridge, though before arriving at the stop sign, the sight distance is sufficient. The corner sight distance to the right and the stopping sight distance are proper. Speed limits are 45 miles per hour for S.R and 30 miles per hour for S.R PROJECT NUMBER 04-01(C14) District 2-0 Safer Driver Actions at Stop Signs 11
16 CMA Due to the behavior of the drivers and the lack of crashes, no specific recommendations for improvement were initially made for this intersection in Phase I. However, for Phase II of the project, both the on pavement and the AT WHITE LINE sign were utilized as improvements. The following table illustrates pertinent data comparing the Phase I and Phase II observations: Table 6 Intersection 141 Average Stopping Edge of Roadway (Feet) Average Number of Times Looked in Each Direction Maneuver (L T R) Time Required to Complete Movement (Seconds) % of That Performed a Rolling Stop % of That Did Not Stop Phase I L, 3R L Phase II L, 1.5R L Notes: L = left, T = through, R = right 142-S.R & S.R. 2007: Clearfield County S.R is the major road and S.R is the stopping approach with both roads having a comparable ADT of 300 vehicles. A house constructed very close to the intersection obstructs the corner sight distance to the right only if drivers stop at the stop sign. The sight distance to the left and approaching the stop sign are proper. The speed limit on all approaches is 45 miles per hour. Due to the house on the right obstructing the view of oncoming traffic if drivers stop at the stop sign, and drivers stopping just inside of the range of good visibility, it was proposed in Phase I that a dashed edge-line be added to the intersection. The dashed edge-line provides drivers with a visual mark of the edge of the main road, allowing them to pull up closer to the intersection and allowing better corner sight distance. In addition to the dashed edge-line, for Phase II of observations, an AT WHITE LINE sign was also added to the stop sign on the approach. The following table illustrates pertinent data comparing the Phase I and Phase II observations: PROJECT NUMBER 04-01(C14) District 2-0 Safer Driver Actions at Stop Signs 12
17 Average Stopping Edge of Roadway (Feet) Phase I 7.28 Table 7 Intersection 142 Average Number of Times Looked in Each Direction 1.5L 1.5R Maneuver (L T R) Time Required to Complete Movement (Seconds) % of That Performed a Rolling Stop CMA % of That Did Not Stop T Phase II L, 1R T Notes: L = left, T = through, R = right Stop Sign At A Distance Low Speed, No Sight Obstruction 211-S.R & Blue Course Drive: Centre County S.R is the main road with an ADT of 12,000 vehicles and Blue Course Drive is the stopping approach with an ADT of 4,000 vehicles. The sight distances in both directions as well as the stopping sight distance are all proper based on the posted speeds of 45 miles per hour and 35 miles per hour, respectively. In an effort to encourage drivers to pull even closer to the road, it was suggested in Phase I that a dashed edge-line be painted through the intersection. This was installed along with the pavement marking, which was painted near the edge of roadway on Blue Course Drive as preparation for Phase II of the project. The following table illustrates pertinent data comparing the Phase I and Phase II observations: Average Stopping Edge of Roadway (Feet) Table 8 Intersection 211 Average Number of Times Looked in Each Direction Maneuver (L T R) Time Required to Complete Movement (Seconds) % of That Performed a Rolling Stop % of That Did Not Stop Phase I L, 2R L Phase II L, 1R L Notes: L = left, T = through, R = right PROJECT NUMBER 04-01(C14) District 2-0 Safer Driver Actions at Stop Signs 13
18 CMA Low Speed, Sight Obstruction 221-S.R & S.R. 3011: Centre County S.R is the major road with an ADT of 3,600 vehicles and S.R is the stopping approach with an ADT of 2,300 vehicles. Proper corner sight distance is obstructed in both directions only if drivers stop at the stop sign, due to bushes on both sides. The stopping sight distance is proper due to a long straightaway leading to the intersection on the stopping approach. The speed limit on the major road (25 miles per hour) is lower than the speed limit on the minor approach (35 miles per hour). Due to the driver behavior exhibited, no recommendations for improvement were initially made in Phase I. For Phase II, the pavement marking and the AT WHITE LINE sign were installed. The following table illustrates pertinent data comparing the Phase I and Phase II observations: Table 9 Intersection 221 Average Stopping Edge of Roadway (Feet) Average Number of Times Looked in Each Direction Maneuver (L T R) Time Required to Complete Movement (Seconds) % of That Performed a Rolling Stop % of That Did Not Stop Phase I L, 1.5R L Phase II L, 1R L Notes: L = left, T = through, R = right 222-S.R & S.R. 0453: Clearfield County S.R is the major road with an ADT of 7,100 vehicles and S.R is the stopping approach with an ADT of 1,600 vehicles. The corner sight distance is obstructed in both directions by a building on the left and a phone booth and signs on the right, only if drivers stop at the stop sign. The stopping sight distance is adequate for the 35 mile per hour speed of the minor approach. The major road has a speed limit of 25 miles per hour. A dashed edge-line was initially installed at the location in Phase I. Also, an AT WHITE LINE sign was installed on the stop sign post for Phase II observations. The following table illustrates pertinent data comparing the Phase I and Phase II observations: PROJECT NUMBER 04-01(C14) District 2-0 Safer Driver Actions at Stop Signs 14
19 CMA Average Stopping Edge of Roadway (Feet) Table 10 Intersection 222 Average Number of Times Looked in Each Direction Maneuver (L T R) Time Required to Complete Movement (Seconds) % of That Performed a Rolling Stop % of That Did Not Stop Phase I L, 2R L Phase II L, 1.5R L Notes: L = left, T = through, R = right High Speed, No Sight Obstruction 231-S.R & T-344: Centre County S.R is the major road with an ADT of 5,100 vehicles and T-344 is the stopping approach with an ADT of 600 vehicles. Corner sight distances as well as the stopping sight distance are proper. Speed limits posted for S.R and T-344 are 45 and 35 miles per hour respectively. Due to the lack of a crash history and the driving habits exhibited during observation, no recommendations for improvement were initially suggested for this intersection in Phase I. Eventually, it was decided to paint on the pavement and mount an AT WHITE LINE sign below the current stop sign for Phase II observations. The following table illustrates pertinent data comparing the Phase I and Phase II observations: Average Stopping Edge of Roadway (Feet) Table 11 Intersection 231 Average Number of Times Looked in Each Direction Maneuver (L T R) Time Required to Complete Movement (Seconds) % of That Performed a Rolling Stop % of That Did Not Stop Phase I L, 1R R Phase II L, 1R R Notes: L = left, T = through, R = right 232-S.R & S.R. 2012: Clearfield County S.R is the major road with an ADT of 3,100 vehicles and S.R is the stopping road PROJECT NUMBER 04-01(C14) District 2-0 Safer Driver Actions at Stop Signs 15
20 CMA with an ADT of 550 vehicles. The corner sight distances and the stopping sight distance are proper. The speed limit on S.R is 55 miles per hour and on S.R it is 35 miles per hour. Due to driver behavior, lack of crashes, and adequate corner sight distance in both directions, there was no need for improvements to this intersection in Phase I. However, an AT WHITE LINE sign was added for Phase II observations. The following table illustrates pertinent data comparing the Phase I and Phase II observations: Table 12 Intersection 232 Average Stopping Edge of Roadway (Feet) Average Number of Times Looked in Each Direction Maneuver (L T R) Time Required to Complete Movement (Seconds) % of That Performed a Rolling Stop % of That Did Not Stop Phase I L, 2R R Phase II L, 1R L Notes: L = left, T = through, R = right High Speed, Sight Obstruction 242-S.R & S.R. 0969: Clearfield County S.R is the major roadway with an ADT of 1,000 vehicles and S.R is the stopping approach with an ADT of 1,800 vehicles. The corner sight distance in both directions is obstructed on the left by poles and some bushes, and on the right by a shed only if drivers stop at the stop sign. The stopping sight distance is proper. The speed limit on S.R is 55 miles per hour and on S.R it is 35 miles per hour. There is a stop bar located sixty (60) feet back from the edge of roadway. After analyzing the intersection as well as the behavior of the drivers, it was recommended in Phase I that the stop sign should be moved closer to the intersection and a dashed edge-line be carried through the intersection. This would prompt drivers to stop closer to the intersection. The dashed edge-line was painted, however the stop sign remained at the same location. In addition, the word was painted near the edge of roadway as part of Phase II. The following table illustrates pertinent data comparing the Phase I and Phase II observations: PROJECT NUMBER 04-01(C14) District 2-0 Safer Driver Actions at Stop Signs 16
21 CMA Average Stopping Edge of Roadway (Feet) Table 13 Intersection 242 Average Number of Times Looked in Each Direction Maneuver (L T R) Time Required to Complete Movement (Seconds) % of That Performed a Rolling Stop % of That Did Not Stop Phase I L, 1R R Phase II L, 1.5R L Notes: L = left, T = through, R = right Stop Sign With Dashed Edge-Line Low Speed, No Sight Obstruction 311-S.R & S.R. 0729: Clearfield County S.R is the major road with an ADT of 900 vehicles and S.R is the stopping road with an ADT of 350 vehicles. The corner sight distances and the stopping sight distance are proper. The speed limit on all of the approaches is 35 miles per hour. Due to the driver behavior exhibited, the absence of any crashes, and the adequate intersection geometry, it was initially deemed that no improvements were necessary in Phase I. Eventually, for Phase II observations, the pavement marking was added to the S.R approach being studied. The following table illustrates pertinent data comparing the Phase I and Phase II observations: Average Stopping Edge of Roadway (Feet) Table 14 Intersection 311 Average Number of Times Looked in Each Direction Maneuver (L T R) Time Required to Complete Movement (Seconds) % of That Performed a Rolling Stop % of That Did Not Stop Phase I L, 1R L Phase II L, 1R R Notes: L = left, T = through, R = right PROJECT NUMBER 04-01(C14) District 2-0 Safer Driver Actions at Stop Signs 17
22 CMA 312-S.R & T-919: Clearfield County S.R is the major road with an ADT of 1,600 vehicles and T-919 is the stopping approach with an ADT of 250 vehicles. All of the sight distances are proper. The speed limit on S.R is 35 miles per hour and 25 miles per hour on T-919. Due to the lack of crashes and the geometry of the intersection, no recommendations for improvement were made in Phase I. However, an AT WHITE LINE sign was added to the stop sign for Phase II observations. The following table illustrates pertinent data comparing the Phase I and Phase II observations: Average Stopping Edge of Roadway (Feet) Phase I Table 15 Intersection 312 Average Number of Times Looked in Each Direction 1.5L 1.5R Maneuver (L T R) Time Required to Complete Movement (Seconds) % of That Performed a Rolling Stop % of That Did Not Stop L Phase II L, 1R L Notes: L = left, T = through, R = right Low Speed, Sight Obstruction 322-S.R & S.R. 3008: Centre County S.R is the major roadway with an ADT of 3,500 vehicles and S.R is the stopping road with an ADT of 2,700 vehicles. stopped only at the stop sign do not have the required corner sight distance to the left due to trees. The corner sight distance to the right and the stopping sight distance are both proper. The speed limits on S.R and S.R are 40 miles per hour and 35 miles per hour, respectively. From the driver behavior observed, and the geometry of the intersection, no recommendations for improvement were made in Phase I. An AT WHITE LINE sign was mounted below the stop sign on the side street approach for the purpose of Phase II. The following table illustrates pertinent data comparing the Phase I and Phase II observations: PROJECT NUMBER 04-01(C14) District 2-0 Safer Driver Actions at Stop Signs 18
23 CMA Average Stopping Edge of Roadway (Feet) Table 16 Intersection 322 Average Number of Times Looked in Each Direction Maneuver (L T R) Time Required to Complete Movement (Seconds) % of That Performed a Rolling Stop % of That Did Not Stop Phase I L, 1R R Phase II L, 0.5R R Notes: L = left, T = through, R = right High Speed, No Sight Obstruction 331-S.R & S.R. 0119: Clearfield County S.R is the major road with an ADT of 6,800 vehicles and S.R is the stopping approach with an ADT of 900 vehicles. The corner sight distances and the stopping sight distance are proper. The speed limit on S.R to the left is 45 miles per hour and to the right is 35 miles per hour. The speed limit on S.R is 35 miles per hour. In Phase I, it was suggested that a stop bar be placed at the stop sign as a pavement marking emphasizing the stop sign. This was not done, but instead both the pavement marking and the AT WHITE LINE sign were added to the approach for Phase II observations. The following table illustrates pertinent data comparing the Phase I and Phase II observations: Average Stopping Edge of Roadway (Feet) Table 17 Intersection 331 Average Number of Times Looked in Each Direction Maneuver (L T R) Time Required to Complete Movement (Seconds) % of That Performed a Rolling Stop % of That Did Not Stop Phase I L, 0R R Phase II L, 0R R Notes: L = left, T = through, R = right PROJECT NUMBER 04-01(C14) District 2-0 Safer Driver Actions at Stop Signs 19
24 CMA High Speed, Sight Obstruction 341-S.R & S.R. 0504: Centre County S.R is the major road with an ADT of 13,000 vehicles and S.R is the stopping approach with an ADT of 3,900 vehicles. The corner sight distances are not proper only if drivers stop at the stop sign, due to a gas station sign on the left and a series of utility poles on the right. The stopping sight distance is proper. The speed limit on S.R is 35 miles per hour and on S.R is 45 miles per hour. It was suggested in Phase I that a stop bar could be placed close to the intersection at a location enabling better corner sight distance. Instead, the word was painted at the intersection as an improvement prior to Phase II observations. The following table illustrates pertinent data comparing the Phase I and Phase II observations: Average Stopping Edge of Roadway (Feet) Table 18 Intersection 341 Average Number of Times Looked in Each Direction Maneuver (L T R) Time Required to Complete Movement (Seconds) % of That Performed a Rolling Stop % of That Did Not Stop Phase I L, 2.5R L Phase II L, 1.5R L Notes: L = left, T = through, R = right 342-S.R & S.R. 0036: Clearfield County S.R is the major road with an ADT of 2,300 vehicles and S.R is the stopping approach with an ADT of 2,000 vehicles. The stop sign is 75 feet from the intersection. The proper corner sight distance in both directions is unavailable if a driver pulls out from the stop sign. The stopping sight distance is proper. Phase I recommendations at this intersection included an 8-inch dashed edge-line and a stop bar placed close to the road. The dashed edge-line was painted, but the stop bar was not. Instead, the pavement marking and an AT WHITE LINE sign were added to S.R prior to Phase II observations. The following table illustrates pertinent data comparing the Phase I and Phase II observations: PROJECT NUMBER 04-01(C14) District 2-0 Safer Driver Actions at Stop Signs 20
25 CMA Average Stopping Edge of Roadway (Feet) Table 19 Intersection 342 Average Number of Times Looked in Each Direction Maneuver (L T R) Time Required to Complete Movement (Seconds) % of That Performed a Rolling Stop % of That Did Not Stop Phase I L, 2R L Phase II L, 1R L Notes: L = left, T = through, R = right Stop Sign With A Stop Bar Low Speed, No Sight Obstruction 412-S.R & Loop Road: Centre County S.R is the major road with an ADT of 5,500 vehicles and Loop Road is the stopping approach with an ADT of 300 vehicles. The stopping and corner sight distances in both directions are proper. The speed limit is 40 miles per hour on S.R and 25 miles per hour on Loop Road. Also, there was a stop bar located 17 feet from the edge of roadway. In view of the driver behavior that was observed, the good sight distances, and the absence of crashes, no recommendations for improvement were made in Phase I. For Phase II, it was decided to add the word to the pavement near the intersection with S.R The following table illustrates pertinent data comparing the Phase I and Phase II observations: Average Stopping Edge of Roadway (Feet) Table 20 Intersection 412 Average Number of Times Looked in Each Direction Maneuver (L T R) Time Required to Complete Movement (Seconds) % of That Performed a Rolling Stop % of That Did Not Stop Phase I L, 2R L Phase II L, 2R L Notes: L = left, T = through, R = right PROJECT NUMBER 04-01(C14) District 2-0 Safer Driver Actions at Stop Signs 21
26 CMA Low Speed, Sight Obstruction 421-S.R & Ninth Street: Centre County S.R is the major road with an ADT of 12,000 vehicles and Ninth Street is the stopping approach with an ADT of 6,800 vehicles. Rows of trees exist on both sides of the intersection making the proper corner sight distance deficient when drivers are positioned at the stop sign. The speed limit on S.R is 35 miles per hour and 25 miles per hour on Ninth Street. From observations of driver behavior and intersection marking and geometry, it was recommended in Phase I that the stop bar be repainted in hopes of lowering the number of rolling stops. When the intersection was observed during Phase II, the stop bar had not been repainted but was painted on the pavement and an AT WHITE LINE sign was installed below the stop sign, as specified prior to Phase II observations. The following table illustrates pertinent data comparing the Phase I and Phase II observations: Average Stopping Edge of Roadway (Feet) Table 21 Intersection 421 Average Number of Times Looked in Each Direction Maneuver (L T R) Time Required to Complete Movement (Seconds) % of That Performed a Rolling Stop % of That Did Not Stop Phase I L, 2R R Phase II L 0.5R Notes: L = left, T = through, R = right High Speed, No Sight Obstruction R S.R & S.R. 0144: Centre County S.R is the major road with an ADT of 11,000 vehicles and S.R is the stopping approach with an ADT of 5,200 vehicles. The corner sight distances on both sides as well as the stopping sight distance are proper. The speed limit is 45 miles per hour on S.R and 35 miles per hour on S.R Two improvements were suggested in Phase I at this intersection due to the number of rolling stops and crash history. They included repainting the stop bar and placing an 8-inch dashed edge-line. The stop bar was not repainted but was painted on the pavement as well as adding an AT WHITE LINE sign to the stop sign installation. This was done PROJECT NUMBER 04-01(C14) District 2-0 Safer Driver Actions at Stop Signs 22
27 CMA prior to Phase II observations. The following table illustrates pertinent data comparing the Phase I and Phase II observations: Table 22 Intersection 431 Average Stopping Edge of Roadway (Feet) Phase I 9.83 Average Number of Times Looked in Each Direction 2.5L 2.5R Maneuver (L T R) Time Required to Complete Movement (Seconds) % of That Performed a Rolling Stop % of That Did Not Stop L Phase II L, 1.5R L Notes: L = left, T = through, R = right 432-S.R & T-718: Centre County S.R is the major road with an ADT of 10,000 vehicles and T-718 is the stopping approach with an ADT of 900 vehicles. The corner sight distances in both directions as well as the stopping sight distance are all proper. The speed limit on S.R is 45 miles per hour and 25 miles per hour on T-718. Initially there was a dashed edge-line as well as a stop bar painted twenty (20) feet behind it. These were both removed during a paving project and were not replaced at the time of Phase II observations. Due to observed driver behavior, minimal crash history, and good visibility, no recommendations were made in Phase I. However, as part of Phase II, an AT WHITE LINE sign was added below the stop sign on the minor approach. The following table illustrates pertinent data comparing the Phase I and Phase II observations: Average Stopping Edge of Roadway (Feet) Table 23 Intersection 432 Average Number of Times Looked in Each Direction Maneuver (L T R) Time Required to Complete Movement (Seconds) % of That Performed a Rolling Stop % of That Did Not Stop Phase I L, 1R R Phase II L 0.5R Notes: L = left, T = through, R = right R PROJECT NUMBER 04-01(C14) District 2-0 Safer Driver Actions at Stop Signs 23
28 CMA High Speed, Sight Obstruction 441-S.R & T-845: Centre County S.R is the major road with an ADT of 5,000 vehicles and T-845 is the stopping approach with an ADT of 2,000 vehicles. For drivers stopped at the stop sign, corner sight distances in both directions are obstructed due to a combination of intersection geometry and bushes on both sides of the road. The speed limit on S.R is 45 miles per hour. The stopping sight distance is more than adequate for the posted speed of 25 miles per hour on T-845. A stop bar is located 22 feet from the edge of roadway. After examining the driver behavior and the intersection geometry, two suggestions for Phase I were considered. The first was to remove the stop bar or move it closer to the edge of S.R. 0045, and the second was to add a dashed edge-line along the edge of S.R Also, trimming or removing the bushes was discussed as a quick way to provide additional corner sight distance. The stop bar remained in the same location, but the dashed edge-line was painted. In addition, the word was painted on the pavement between the stop bar and the edge line prior to the start of Phase II observations. The following table illustrates pertinent data comparing the Phase I and Phase II observations: Average Stopping Edge of Roadway (Feet) Table 24 Intersection 441 Average Number of Times Looked in Each Direction Maneuver (L T R) Time Required to Complete Movement (Seconds) % of That Performed a Rolling Stop % of That Did Not Stop Phase I L, 1R R Phase II L, 1R R Notes: L = left, T = through, R = right 442-S.R & T-354: Centre County S.R is the major road with an ADT of 5,400 vehicles and T-354 is the stopping approach with an ADT of 300 vehicles. The corner sight distance to the left is not adequate only for drivers stopped at the stop sign due to trees and bushes located on the side of S.R The corner sight distance to the right and the stopping sight distance are both sufficient for the speeds of 45 miles per hour on S.R and 25 miles per hour on T-354. A stop bar is located 18 feet from the edge of roadway. PROJECT NUMBER 04-01(C14) District 2-0 Safer Driver Actions at Stop Signs 24
29 CMA In order to encourage drivers to stop closer to the edge of the major road for better visibility and increased ease of entering traffic, it was suggested in Phase I that the stop bar be removed and a dashed edge-line be placed along S.R In addition, trimming or removing the trees and bushes causing sight obstructions was suggested to help improve sight distances. The stop bar was not removed but the dashed edge-line was placed along the main road. At the time of Phase II observations, the trees along the main road still appeared to be overgrown. Also, for the minor approach of this intersection, an AT WHITE LINE sign was added below the current stop sign for Phase II observations. The following table illustrates pertinent data comparing the Phase I and Phase II observations: Average Stopping Edge of Roadway (Feet) Table 25 Intersection 442 Average Number of Times Looked in Each Direction Maneuver (L T R) Time Required to Complete Movement (Seconds) % of That Performed a Rolling Stop % of That Did Not Stop Phase I L, 1R R Phase II L 0.5R Notes: L = left, T = through, R = right R PROJECT NUMBER 04-01(C14) District 2-0 Safer Driver Actions at Stop Signs 25
30 CMA IV. Overall Analysis Phase I In order to fully analyze the data collected and the observations noted, it is necessary to search for trends in the data in broader groups. Each individual intersection was already examined in terms of trends occurring in driver behavior and intersection geometry. These items were examined and some conclusions could be drawn about each intersection, though in a very focused scale. Broadening the extent of the analysis was necessary in order to discern any universal trends that existed in each of the four family groupings (At Intersection, At a Distance, With a Dashed Edge-Line, With a Stop Bar). The ultimate goal was to discover if the intersections in each grouping presented any data that stood out in both expected and unexpected ways. The first step taken in the overall analysis was the creation of visual analysis diagrams. These diagrams were made as a result of the preliminary study, in which one of the main focuses emerging was the point at which drivers stopped. There were four sheets made in total, one for each group. A T-shaped, scaled diagram was created for each intersection with markings on the left side to signify the location of the physical characteristics of the intersection (i.e. edge of shoulder, stop sign, stop bar). On the right side, the drivers stopping points were placed based on the statistical average, mean, and 85 th percentile. This allowed for an instant image of where drivers stopped in relation to the physical characteristics and, in the case of intersections with sight obstructions present, if the drivers were stopping past the point where the required corner sight distance became available. Also, these analysis diagrams made it possible to overlap sheets to examine differences between different groups, which was made easier due to the same scale being used on all of the diagrams. These diagrams are included in Appendix C. Once the diagrams were created and examined, an investigation was made of the effects of particular intersection types on approaching drivers. The accepted gap times were excluded from this analysis as no trends were evident, as well as the large number of gaps of 20 seconds or more. The results of the comparisons follow: 1. Average Stopping Point by Family Grouping The first item that was examined involved which of the four overall groupings caused drivers to stop the closest to the intersection. From Table 26 below, it is clear that when the stop sign is placed close to the intersection, the drivers are more inclined to stop in a closer proximity to the intersection than in the other scenarios. PROJECT NUMBER 04-01(C14) District 2-0 Safer Driver Actions at Stop Signs 26
31 CMA Average Stopping Point (ft) Table 26 Family Groupings At Intersection At a Distance Dashed Edge-line Stop Bar Average Stopping Point by Sight Obstruction These groups were then subdivided into intersections where sight obstructions were present and intersections without sight obstructions. From this comparison, it was clear that the scenario that encouraged drivers to stop the closest to the intersection was at those intersections where the stop sign is close to the intersection and sight obstructions were present. This showed that drivers were inclined to pull up to a point where the sight obstruction was no longer problematic in viewing oncoming traffic before stopping. Below is Table 27 showing the average stopping points for all of these subdivisions: Table 27 Sight Obstructions At Intersection At a Distance Average Stopping No Obstruction Sight Obstruction No Obstruction Sight Obstruction Point (ft) Dashed Edge Line Stop Bar Average Stopping No Obstruction Sight Obstruction No Obstruction Sight Obstruction Point (ft) Comparison of Average Stopping Point and Stop Sign Location After seeing that the presence of sight obstructions had such an effect on drivers stopping closer to the intersection, graphs were created comparing the stopping points and stop sign locations across each of the four parent groups as well as the average first available sight distances. The graphs confirmed the perceived trend that drivers are more affected by the sight obstructions than the placement of the stop sign. Figure 1 shows the stop sign placement and the stopping points. Notice the large difference between the two: PROJECT NUMBER 04-01(C14) District 2-0 Safer Driver Actions at Stop Signs 27
32 CMA Figure 1 Distance From (ft) At Intersection Sight Obstruction Intersections and Stopping Points Average Stopping Point Average Stop Sign Distance At a Distance Dashed Edge-Line Family Groupings Stop Bar 4. Comparison of Average Stopping Point and First Available Sight Distance Figure 2 demonstrates that the point of first available proper corner sight distance has more of an effect on how close to the intersection drivers stop. Figure 3 at the bottom of the page combines the previous two graphs and further exhibits the greater effect sight distance has on drivers than the location of the stop sign. PROJECT NUMBER 04-01(C14) District 2-0 Safer Driver Actions at Stop Signs 28
33 CMA Figure 2 Distance From (ft) Sight Obstruction Intersections and Stopping Points At Intersection At a Distance Dashed Edge-Line Family Groupings 8.99 Stop Bar Average Stopping Point Average First Available Sight Distance Figure 3 Distance From (ft) Sight Obstruction Intersections and Stopping Points At Intersection At a Distance Dashed Edge-Line Family Groupings Stop Bar Average Stopping Point Average First Available Sight Distance Average Stop Sign Distance PROJECT NUMBER 04-01(C14) District 2-0 Safer Driver Actions at Stop Signs 29
34 CMA 5. Effect of Dashed Edge-Line and Stop Sign Placement One initial assumption tested was if the dashed edge-line had the effect of drawing drivers closer to the edge of the main road, increasing visibility, and making traversing the intersection safer. Upon examining the average stopping points again, it was discovered that drivers stopped farthest away from the intersection in these cases, which was contrary to the assumption. After looking into stop sign placement, it was revealed that at these intersections with a dashed edge-line, the stop sign was placed farthest away from the edge of the main road, leading to the finding that placement of the stop sign does affect where drivers stop. This can be demonstrated below in Table 28. For example as the location of the stop sign is located further away from the intersection, the average stopping point also increases away from the edge of pavement. Table 28 Dashed Edge-Line and Stop Sign Placement Average Stop Sign Distance (ft) Average Stopping Point (ft) At Intersection At a Distance Dashed Edge-line Stop Bar At Intersection At a Distance Dashed Edge-line Stop Bar To more easily see the trends this data was graphed and shown in Figure 4: PROJECT NUMBER 04-01(C14) District 2-0 Safer Driver Actions at Stop Signs 30
35 CMA Figure 4 Average Stopping Points For Different Intersection Types Distance (ft) Average Stopping Point Average Stop Sign Distance At Intersection At a Distance Dashed Edge-Line Stop Bar 6. Proportional Comparison of Stopping Point to Stop Sign Distance It was established in Figure 4 that the location of a stop sign does have an effect on how close to the intersection the drivers stop, though it was determined that the effect is lessened the farther the stop sign is from the intersection. To test this, a simple proportion was used by dividing the stopping point distance by the stop sign distance, multiplied by 100. Therefore if the average place the drivers stopped was at the stop sign, the proportion would be 100; conversely, if the drivers stopped at the edge of the main road, the proportion would produce a result of zero. Table 29 Proportional Comparison of Stopping Point to Stop Sign Distance Proportion of At Intersection At a Distance Dashed Edge-line Stop Bar stopping point to stop sign distance* *-Based on proportion: (stopping point distance/stop sign distance) x 100 As can be seen from Table 29 above, at the two types of intersections that have the stop signs the farthest distance from the edge of the main road (At a Distance, Dashed Edge-line) the drivers stop less than a third of the distance PROJECT NUMBER 04-01(C14) District 2-0 Safer Driver Actions at Stop Signs 31
36 CMA from the edge of the road to the stop sign, demonstrating the stop sign has less of an effect on the drivers stopping points. Likewise, at the two types that place the stop sign close to the intersection (At Intersection, Stop Bar), drivers were stopping around halfway between the stop sign and the edge of the road. 7. Comparison of Low Speed and High Speed Intersections The final test involving the stopping points that resulted in a conclusive comparison was between how far from the intersection drivers were found stopping at high speed and low speed main roads. As was expected, the drivers at the low speed intersections for each scenario stopped at a point closer to the edge of the main road than at the high speed intersections. Table 30 below illustrates the findings: Table 30 Comparison of Low Speed and High Speed Intersections At Intersection At a Distance Dashed Edge-line Stop Bar Low Speed Ave High Speed Ave Time Required to Complete Turning Movements The other aspect of the drivers actions that was explored and resulted in conclusive findings dealt with the amount of time required for drivers to complete turning movements. This was examined to see if the intersection layout or pavement markings had an effect on how quickly or slowly the motorists negotiated the intersections. Again, the four major groupings were examined and compared as seen in Table 31. Table 31 Time Required to Complete Turning Movements At Intersection At a Distance Dashed Edge-line Stop Bar Average Time (sec) The results were quite similar to the results for the stopping points, as the fastest time to complete a turning movement occurred at intersections where the stop sign is close to the edge of the main road. The scenario that made drivers take the most time was when a stop bar is at the intersection, presumably due to the line on the road having the effect of slowing down the drivers more as they approach the intersection. Lastly, there was a discernable difference in the amount of time required to navigate the intersection with and without sight obstructions present in each of the main intersection groupings. PROJECT NUMBER 04-01(C14) District 2-0 Safer Driver Actions at Stop Signs 32
37 CMA Table 32 Time to Complete Turning Movements Related to Sight Obstructions At Intersection At a Distance No Obstruction Sight Obstruction No Obstruction Sight Obstruction Average Time (sec) Average Time (sec) Dashed Edge Line Stop Bar No Obstruction Sight Obstruction No Obstruction Sight Obstruction Examining Table 32 above, it is evident that drivers tend to take more time while at an intersection in which there is some difficulty seeing the oncoming traffic due to the presence of a sight obstruction. This appears to be a demonstration of somewhat cautious driver behavior, as drivers require slightly more time to acquire the proper corner sight distance before proceeding into traffic on the major road. 9. Other Analysis The findings discussed in this section were a result of several analyses conducted using the data collected and observations made at the intersections for Phase I. There were also several comparisons checked and data analyzed in groupings that produced no pattern and no conclusions could be drawn from the data. These tests included: Examining the driver age and average time at each type of intersection The rate of rolling stops and incidents of drivers failing to stop, as related to: - Category of intersection (at intersection, at a distance, dashed edge-line, or stop bar) - High speed/low speed - Sight obstructions/no sight obstructions Likewise, some of the categories of data did not produce enough significant results to allow for analysis. Overall, these examinations as well as others proved inconclusive and offered no insight into the effects on drivers behavior. Phase II The analysis of the first phase focused around finding trends in how people stop at different types of intersections and providing the Department with various types of enhancements that may improve the stopping characteristics of the driver. With these trends in mind, several improvements were installed at the intersections prior to conducting Phase II observations. In Phase II, the analysis dealt with finding out how effective the various improvements were on driver PROJECT NUMBER 04-01(C14) District 2-0 Safer Driver Actions at Stop Signs 33
38 CMA behavior. This included conducting two rounds of observations at a few of the same intersections. The second round of observations was conducted to determine if the drivers have the same response to the improvements over time. Once again, the first step for Phase II was to compile the visual analysis diagrams. This time, the T-shaped diagrams were arranged so that the Phase I and Phase II figures were next to each other. This way a person could review and more easily determine where stopping habits improved and where they did not between Phase I and Phase II. Once again, on the left side of the diagrams the physical characteristics (i.e., edge of shoulder, stop sign, and stop bar) were marked, and on the right side the drivers stopping points were marked. These points included the statistical average, mean, and 85 th percentile. The drawings are to scale so these characteristics can easily be compared visually. The diagrams are included in Appendix C. Once the diagrams were updated with the data from Phase II, an analysis was conducted to determine which of the three improvements that were put in place at the various intersections was most effective. The results of the comparisons follow: 1. Overall Data by Family Grouping In addition to the stopping distance from the intersection, Phase II observations also focused on the amount of rolling stops and did not stops. First, the 23 intersections were examined altogether to determine, in general, which of the three improvements worked the best. Table 42 shows this data by the type of improvement. From this table it can be seen that the combination of the At White Line sign and the on pavement provided the greatest reduction in rolling stops and did not stops. Meanwhile, the pavement marking of brought about the largest decrease in stopping distance. Table 43 shows the percentage of decrease in each category. PROJECT NUMBER 04-01(C14) District 2-0 Safer Driver Actions at Stop Signs 34
39 CMA Table 33 Overall Data by Family Groupings between Phase I and Phase II Phase II Improvement Phase ROLLING (Observations) (Observations) Distance from Edge of Road (Feet) "" on Pavement "AT WHITE LINE" Sign I II I II "" on Pavement & I "AT WHITE LINE" Sign II Table 34 Overall by Percentages by Family Grouping between Phase I and Phase II Phase II Improvement ROLLING (Observations) (Observations) Distance from Edge of Road (Feet) "" on Pavement "AT WHITE LINE" Sign "" on Pavement & "AT WHITE LINE" Sign -4.5% -76.0% -12.0% -21.0% -66.7% -6.9% -24.4% -79.4% -6.5% 2. Comparison of Data by Age The next step was to determine if these general trends carried through to more specific subdivisions. One of these cases was to determine if a driver s age had any effect on which improvement worked the best. In the observations, age was broken down into the categories of Youth (under 25), Experienced (25-60), and Senior. When the data was compiled, no definitive trends could be found. However it could be seen that, for youth drivers, the combination of both improvements provided a much larger positive change than the use of either of the improvements individually. For experienced and senior drivers, the improvement in driving habits stayed more consistently positive throughout the three different installations. A visual representation of the data can be seen below in Figure 5. PROJECT NUMBER 04-01(C14) District 2-0 Safer Driver Actions at Stop Signs 35
40 CMA Figure 5 Decrease in Stopping Edge of Road Decrease in Stopping Distance (Feet) "" on Pavement "AT WHITE LINE" Sign "" on Pavement & "AT WHITE LINE" Sign Youth Experienced Senior Type of Improvement 3. Comparison of Data by Gender Gender was also analyzed but no important differences could be discerned from this data. Male and Female stopping distances were very similar to one another. When the AT WHITE LINE sign and the on pavement were both used, male drivers had the greatest reduction in rolling stops while females showed the greatest increase in rolling stops. When these improvements were used separately, there was little difference between the stopping habits of the genders. PROJECT NUMBER 04-01(C14) District 2-0 Safer Driver Actions at Stop Signs 36
41 CMA Figure 6 Decrease in Stopping Edge of Road Decrease in Stopping Distance (Feet) "" on Pavement "AT WHITE LINE" Sign "" on Pavement & "AT WHITE LINE" Sign Male Female Type of Improvem ent 4. Comparison of Data by Speed Limit on Main Road Another aspect analyzed was whether or not the speed limit of the main road had any effect on stopping behavior on the side road. Overall, drivers entering high speed roads improved their stopping distance more than drivers entering low speed roads. At low speeds the AT WHITE LINE sign worked best to pull drivers closer to the intersection, while at high speeds it was the least effective. Meanwhile the pavement marking was most effective at high speeds, but the least effective at low speeds. The results of this comparison can be seen below in Table 35. Type of Improvement Table 35 Comparison of Speed on Main Road Main Road Speed (Before) (After) (Feet) "" on Pavement "AT WHITE LINE" Sign "" on Pavement & "AT WHITE LINE" Sign Overall Low High Low High Low High Low High PROJECT NUMBER 04-01(C14) District 2-0 Safer Driver Actions at Stop Signs 37
42 CMA 5. Driver s Stopping Before Adequate Sight Distance A concern at the beginning of the study was to determine how many drivers were stopping before they reached adequate sight distance. These were assumed to be people who were unaware that they could pull up to the edge of roadway and as a result stopped farther back at a stop sign or stop bar. A goal of the project was that the improvements that were installed would help to bring these people closer to the intersection, thereby improving their sight distance. Surprisingly, at intersections with sight obstructions, stopping distances actually increased for all types of improvement and intersection categories. Sight obstructions were defined as any objects which hindered a driver s view so that they had less than the required sight distance when stopped at the intersection. Only a slight increase in stopping distance was evident at intersections with on the pavement, while the other two improvements caused increases in stopping distance of between 36-50%. The data can be seen below in Figure 7. Figure 7 Driver's Stopping Before Adequate Sight Distance Number of Occurences "" on Pavement "AT WHITE LINE" Sign Type of Improvement "" on Pavement & "AT WHITE LINE" Sign Phase I Phase II 6. Effect of Passage of Time on Effectiveness of Improvements The Department requested that the study evaluate if the effectiveness of the improvement would change over time, i.e., would drivers revert to their old habits after the improvements had been installed for some period of time. With this in mind, a second round of Phase II observations was taken at six intersections during October 2006, approximately three (3) months after the first round of observations and approximately five (5) moths after they were originally installed. PROJECT NUMBER 04-01(C14) District 2-0 Safer Driver Actions at Stop Signs 38
43 CMA These intersections represented two examples of each of the types of improvements. In this round of observations, the data reflected that, in general, drivers had returned to their old habits in many cases. The three different improvements all yielded a larger stopping distance than they had in the first part of Phase II. The largest increase in stopping distance was where intersections with both the on Pavement and the AT WHITE LINE Sign improvements were installed. At intersections with the pavement marking, stopping distances returned to an average very close to that of Phase I. At intersections with the other two improvements, average stopping distances actually increased even beyond the distances recorded in Phase I. The stopping distances can more easily be examined below in Figure 8. Meanwhile, the amount of rolling stops and did not stops was more erratic from intersection to intersection. Figure 8 Passage of Time Comparison (Feet) "" on Pavement "AT WHITE LINE" Sign "" on Pavement & "AT WHITE LINE" Sign Phase I Phase II (Initial) Phase II (Passage of Time) PROJECT NUMBER 04-01(C14) District 2-0 Safer Driver Actions at Stop Signs 39
44 CMA V. Summary of Findings Phase I Based on the observations and analysis performed on all 32 intersections, the following is a summary of the findings: 1. The physical location of a stop sign is the single most important factor in determining where a driver will stop on a side road in relationship to the main road. That is: The closer the stop sign is to the intersection the more likelihood of the driver pulling up close to the edge of the main road to assess his or her ability to safely enter the intersection. As the distance from the edge of the main road to the stop sign increases, so does the driver s tendency to stop further back from the main road even if he or she could safely move closer to the main road before stopping. 2. The presence of either a stop bar or the painted extension of the main road edge-line through the intersection does not significantly increase the probability that a driver will pull up to either the edge of the main road or to the stop bar. 3. A sight obstruction at a stop sign will cause a driver to mover closer to the edge of the main road to improve his or her sight distance. Phase II Based on the observations and analysis performed on the 23 selected intersections, the following is a summary of our findings: 1. There was an overall reduction in rolling stops, did not stops, and average stopping distance as a result of installing improvements. Rolling stops decreased at 13 intersections, while they increased at 10 intersections. Did not stops decreased at 13 intersections, while they increased at four intersections. At six intersections, there were no drivers who did not stop. Average stopping distance decreased at 14 intersections, while increasing at nine intersections. PROJECT NUMBER 04-01(C14) District 2-0 Safer Driver Actions at Stop Signs 40
45 CMA The combination of the word on the pavement and the AT WHITE LINE sign decreased rolling stops and did not stops by the greatest margin. The pavement marking placed at the edge of the road led to the largest improvement in stopping distance. 2. Overall, drivers entering high speed roads improved their stopping distance (i.e., stopped closer to the edge line) more than drivers entering low speed roads. At low speeds, the AT WHITE LINE sign was most effective, while the pavement marking was least effective At high speeds, the on pavement was the most effective, while the AT WHITE LINE sign was least effective 3. No definitive trends were found when stopping habits were compared within the categories of age and gender. 4. The number of drivers stopping before they reached adequate sight distance increased for all three improvements, especially in both cases where the AT WHITE LINE sign was used. This implied that drivers were still stopping around the location of the stop sign instead of pulling up to the edge of the road to improve their sight distance. 5. Based on the second set of observations in Phase II, it was determined that over time the improvements became less effective, as drivers reverted to their old habits and stopped further back from the edge of road. In the two scenarios where the AT WHITE LINE sign was utilized, drivers actually stopped farther back in the second part of Phase II observations than they had in the original Phase I observations. This was of course over a limited time frame. PROJECT NUMBER 04-01(C14) District 2-0 Safer Driver Actions at Stop Signs 41
46 CMA VI. Conclusions Phase I 1. As the distance from the edge of the main road to the stop sign increases, drivers appear to enter a gray area, which is defined as that distance from the stop sign to the edge of road, and unless there is a sight obstruction at the stop sign the driver is unsure of where he or she should stop. 2. are unaware of their responsibilities regarding where they can and should stop when approaching a stop sign, especially if there is no main road edge line or stop bar to guide them. 3. Motorists need to be better informed of their duties at a stop sign. Assuming that there are no pedestrian(s), crosswalks or a stop bar present at the intersection, motorists need to be encouraged to pull as close to the edge of the main road as possible to assess their ability to enter the intersection. Phase II 1. The on pavement and AT WHITE LINE sign improvements encouraged drivers to pull somewhat closer to the edge of the main road. The most noticeable change, however, was the dramatic reduction in the number of drivers who executed rolling stops and those who did not stop at all when negotiating the stop-controlled approach of the intersection. 2. Based on the small sample taken, it seemed that over time the improvements may become less effective. This was seen from the second round of observations taken in Phase II, which were recorded 2-3 months after the first round of Phase II observations. Stopping distances increased at all six intersections that were monitored. At intersections with an AT WHITE LINE sign stopping distances actually increased beyond the average stopping distance observed in Phase I. 3. The use of the pavement marking could become more effective if used more consistently. In most locations it was painted directly before the dashed edge-line and/or edge of the main road. However, at other intersections it was painted at a distance from the intersection, such as directly after a stop bar. Finally, at other locations it was painted somewhere in the gray area between the stop sign and the edge of roadway. The optimal location for this pavement marking should be at the edge of roadway, if no stop bar is present, in order to best pull the driver PROJECT NUMBER 04-01(C14) District 2-0 Safer Driver Actions at Stop Signs 42
47 CMA closer towards the intersection. However, each intersection is unique and should be evaluated as to how the improvements should be best made. 4. The AT WHITE LINE sign could potentially cause confusion when used in conjunction with a stop bar. Leaving the driver to wonder whether the white line referred to is the stop bar, the dashed edge-line, or both lines. 5. The Phase II observations showed that motorists still need to be better informed of their duties at a stop sign. In addition, they also need to be informed about the new improvements if they are indeed used on a larger scale. In some cases, the pavement marking and the AT WHITE LINE sign caused confusion for drivers unfamiliar with them. 6. The goal of the project was to get drivers to pull up closer to the edge of the roadway but, on average, stopping distances improved by less than 11 inches. 7. With the improvement in stopping distance combined with the sizeable improvement in rolling stops and did not stops, one or more of the options could begin to be installed at more intersections. One of the improvements could be implemented. If stopping distance is taken as the top priority, the pavement marking would be the most effective scenario to utilize. If, however, the comparatively large improvements in reduction of rolling stops and did not stops are taken as more important, then the combination of on the pavement and the AT WHITE LINE would be the most effective method of improvement. Another option which could be taken would be to examine each intersection on a case-by-case basis. The characteristics of each intersection would be looked at and compared to similar study intersections to determine which improvement would be the most effective for each case. For example, at high speed intersections (main line speed limit greater than 40 miles per hour) the pavement marking would be most effective in pulling drivers closer to the edge of the road. Meanwhile at low speed intersections the AT WHITE LINE would be the best choice. Based on the findings from Phase I, a two part program was developed to better inform motorists of their duties and responsibilities when approaching a stop sign at an intersection that has no pedestrian traffic, no crosswalks and no stop bars. The first part of the program was executed in Phase II of this project by developing and evaluating a series of traffic control devices as far as their PROJECT NUMBER 04-01(C14) District 2-0 Safer Driver Actions at Stop Signs 43
48 CMA potential to encourage drivers to advance safely to the edge line of the main road before coming to a stop. The second part of the program would be a Media and Public Information Program to inform motorists of how to properly stop at a stop sign controlled intersection. The Media and Public Information Program 1. Observations The on-site surveys conducted throughout this project revealed significant differences in the stop-sign behavior of motorists. While some of the physical features that were added to the study intersections proved to be moderately effective in causing drivers to move closer before actually entering the intersection, their effectiveness appears to have diminished significantly within a very short period. Although the stopping behavior that was observed varied considerably in relation to the actual location of the stop sign, virtually all drivers exhibited that most valuable trait: common sense. However, it appears to be evident that drivers are ambivalent about exactly where they are supposed to stop when a stop sign lies between their vehicle and the intersecting roadway. More troubling is the fact that the guidance for stopping at stop signs is weak, confusing and frequently contradictory. Several quotes from current Department of Transportation publications clearly illustrate this confusion: Pennsylvania Driver s Manual (Pub 95 (4-05) When you see a crosswalk or a stop line, stop before the front of your car reaches the painted line. If you cannot see traffic, yield to any pedestrians, then carefully pull forward past the line until you can see clearly. Stop, check for traffic and pedestrian then go ahead when the intersection is clear. This text does not address stopping at a stop sign at all. It does not address the need to move beyond the stop sign to a position where the driver has an unobstructed view of oncoming traffic. Commercial Driver s Manual (PUB 223 (*-05) Two quotes from Section 12: On Road Driving Test follow which both relate to stop sign behavior: Turns: If you must stop before making a turn, come to a complete stop behind the stop line, crosswalk or stop sign. PROJECT NUMBER 04-01(C14) District 2-0 Safer Driver Actions at Stop Signs 44
49 CMA Intersections: As you approach an intersection, if necessary, come to a complete stop (no coasting) behind any stop signs, signals, sidewalks or stop lines maintaining a safe gap behind any vehicle in front of you. This text directs the driver to stop BEHIND the stop sign and makes no provision for the fact that the driver might actually have to move forward in order to obtain a position from which he can view oncoming traffic clearly. School Bus Driver s Manual (PUB. 117 (6-05) Unit F: Driving Fundamentals Entering the Flow of Traffic: Stop just before the point of entry. In a preceding paragraph, are given this advice: In other cases, the merging points or intersections will be controlled only by stop or yield signs and your good judgment. While the advice does not specifically address the presence of a stop sign, it is clear and unambiguous: stop just before the point of entry. Special Point Examination Driver s Handbook (PUB. 248 (1-04) Part Z: Avoiding Accidents Through Safe Driving Decisions: The possibility of conflict with other vehicles is a fact of driving. This is true in the city, the suburbs, and even on country roads. The chances of an accident go up as the amount of traffic increases. The chances of an accident also go up at intersections This publication uses diagrams to present the driver with a situation and various driver actions that result in an accident. The driver is asked to assume the role of one of the drivers and to choose actions that would have avoided the incident. This same technique could be used to show drivers where to stop at a stop-sign controlled intersection, including visual obstructions, etc. to teach the driver to move beyond the stop sign to the point of entry. Stop for Your Safety (tri-fold brochure) Come to a full stop and pay close attention to oncoming traffic. This is the only reference to a stop even though the word stop is prominently featured on the front cover along with a red stop sign. There PROJECT NUMBER 04-01(C14) District 2-0 Safer Driver Actions at Stop Signs 45
50 CMA are no instructions about where to stop and how to move forward to the point of entry safely. Teaching your teen to survive the Fatal Five (8 panel brochure) Under left turn strategies: If you are turning left from a driveway, a parking lot or a stop sign, pull up close enough that you have a good view of cross traffic. Although this deals with making a left turn, it does direct the teen-age driver to move up close enough. This technique could be developed more thoroughly with appropriate sketches. 2. Interview Results As part of this project, a number of organizations and individuals were contacted to ascertain the stop sign guidance they provide or, in the case of the Pennsylvania State Police, enforce. Those contacts are shown in Appendix I. There was universal agreement that the regulations were unclear and that the behavior of drivers mirrored that confusion. Every person interviewed admitted that proper stop sign behavior was seldom, if ever, clearly identified. The American Automobile Association (AAA) provides training for novice and mature drivers, as well as other defensive driving courses. The Lead Instructor for Driver Training at their national headquarters in Florida indicated that AAA was very aware of this ambivalence and is in the process of revising their materials to better address this and other problems. They do not anticipate that any revisions or new publications will appear before 2009 at the earliest. At the National Safety Council s Headquarters in Illinois, the librarian and the Director of Program Development for the NSC s Defensive Driving course agreed that there is confusion about appropriate behavior related to stop signs, not just in Pennsylvania but across the country. A trooper at the Pennsylvania State Police barracks in Findlay Township originally said that a driver had to stop at the stop sign but later admitted that a stop sign is just to show that a stop-controlled intersection is ahead. have two legal options: Stop at the sign and then pull up to the intersection where they can see clearly, stop again and proceed into the intersection when it is safe to do so. Observe the stop sign, be alert, move carefully to the intersection where they will come to a full stop, and then proceed into the intersection when conditions permit. PROJECT NUMBER 04-01(C14) District 2-0 Safer Driver Actions at Stop Signs 46
51 CMA While both options are legal according to the Pennsylvania Motor Vehicle Code, enforcement depends on an officer s interpretation of them, and, if it goes farther, to the Magistrate s understanding of the regulations. At the Pennsylvania State Police Academy in Hershey, PA, there was additional agreement that, while the bottom line is the Motor Vehicle Code, messages are confusing and enforcement is uneven. While common sense should prevail, one can t be sure that all drivers have or use it. During the discussion, two scenarios were presented based on the following conditions: A driver is approaching a stop sign located 20 feet before an intersection that has a white stop line at the edge of the intersection. Driver #1 stops directly opposite the stop sign and then proceeds cautiously forward into the intersection Driver #2 observes stop sign but does not stop there, proceeding forward cautiously until he reaches the white stop line where he comes to a full stop before entering the intersection. The Colonel was asked which driver would be ticketed and responded by saying that the second driver would not be given a citation. Driver #1 would be cited because he violated regulations about entering an intersection which require vehicles to stop at a stop line. In neither case was the behavior at the stop sign relevant to the behavior at the stop line painted on the pavement, which ultimately dictates driver behavior. The President of a large local Driver Training School indicated that they use a variety of training materials in their program which includes 30 hours of theory and 6 hours of on-road instruction. There are several books available to augment the knowledge of their instructors who are certified by the Pennsylvania Department of Education. However, the teachers are very cognizant of the expectations of area License Examiners relative to behavior at stop signs. Consequently, they teach what the License Examiner is going to expect. Unfortunately that lesson varies since there are several different instructors and different examiners. The Examiners, in turn, expressed a wish for a consistent message relative to stop sign behavior. While they take guidance from the Driver s Manual, individual examiners might each interpret the regulations slightly differently. The strongest message is the requirement to stop at a white line before entering an intersection. The supervisor believes that Driver Education teachers tell novice drivers to stop twice once at the stop sign and again before the point of entry. Supervisors audit examiners every 3 months, frequently riding along when a student driver is being tested. The student is asked for permission for the supervisor to ride along and is made aware that while he or she is being tested PROJECT NUMBER 04-01(C14) District 2-0 Safer Driver Actions at Stop Signs 47
52 CMA by the examiner, the supervisor is also auditing the examiner himself. According to the Supervisor, different examiners evaluate stopping behaviors differently with old school examiners most likely to insist on a stop at the stop sign (The Supervisor himself actually failed his Commercial Truck Driver s exam when he didn t stop at the sign but moved up to the intersection before stopping. He was immediately told that he had failed because he didn t stop at the stop sign). As part of this investigation into behavior at stop signs, we became aware of the American Driver and Traffic Safety Education Association (ADTSEA), a professional association which represents traffic safety educators throughout the United States and abroad. ADTSEA has over 1000 professional and corporate members and is located at the Indiana University of Pennsylvania Highway Safety Center in Indiana, PA. ADTSEA produces curriculum materials in both written and DVD formats which are used by Driver Training schools as well as public and private high school and college courses. One of the new discs in Driver Education Curriculum 2.0 is entitled Signs, Signals and Markings; Understanding the Language of the Road, produced by AAA Foundation for Traffic Safety. Included in the content of Unit 4-7 is this message: Stopping at Intersections When approaching an intersection with a stop sign, stop line or crosswalk, it may be necessary to stop where visibility is totally or partially blocked. The driver must then pull ahead slightly, after stopping at the legal position behind the stop line or crosswalk, and stop again where visibility is improved. Once again, there is no mention of stopping behind, at or in front of the stop sign. In Where to Stop at Intersections, Unit 4-26 of the same document, this guidance is provided: If there are no identifying pavement markings and the sign or traffic control device says stop, then the stop must be made with the front bumper behind an imaginary line called a curb line which stretches from curb to curb closest to the driver. If there are no curbs present, then it must be imagined where they would be and the stop completed at that imaginary line. It is hard enough to get drivers to stop at real markings, asking them to stop at imaginary lines may put an even greater burden on our drivers. 3. Conclusions A. There is widespread agreement that guidance for appropriate behavior at stop sign-controlled intersections is unclear, ambiguous and frequently contradictory. PROJECT NUMBER 04-01(C14) District 2-0 Safer Driver Actions at Stop Signs 48
53 CMA B. Interpretations of the appropriate behavior for stopping at stop signcontrolled intersections differ significantly among publications, educators, trainers, examiners and police officers. C. Despite this ambiguity, drivers almost invariably exhibit common sense and do not enter an intersection foolishly. It is clear that we have two tasks before us: To develop legal, enforceable and clear guidelines for stop sign behavior and to ensure consistency of these guidelines within all PennDOT publications and among all personnel charged with teaching, evaluating, auditing and enforcing them. To develop a methodology to educate drivers about the appropriate behavior when they come upon a stop sign that is some distance from an intersection. (It should be noted that our study focused only on relatively low occupancy roadways and our findings may not necessarily be replicated at more heavily traveled intersections in urban and suburban areas.) In discussions with the various agencies and individuals, it was discussed how best to educate (or re-educate) drivers about stop sign behavior. While attention has been focused on stop signs, it is recognized that this issue is not critical in and of itself. Common sense prevails, despite guidance that only confuses the issue. Therefore a public relations campaign, complete with television ads, public meetings, press conferences, would seem to be over kill and inappropriate. In addition, these measures have been shown to have only a limited effect on people s behavior, especially if there is no enforcement. Given this information and observing behavior at relatively rural intersections, it would appear that publications used to prepare new and experienced drivers must clarify the guidance for stopping at stop signs and stop sign-controlled intersections. It is equally important that we emphasize the need to differentiate between normal stop sign behavior and behavior when the stop sign is, of necessity, situated some distance before an intersection. The new guidance for behavior at stop signs must not undermine the traditional stop at the stop sign message. Because confusing advice could lead to possible accidents and some liability for PennDOT, it is essential that the wording and any accompanying graphics are unambiguous and specific to intersection locations. The first task to clarify the regulations rightly belongs to PennDOT and its legal staff although we would be pleased to help develop and test new language to ensure that it is user friendly and clearly understood. The second task involves dealing with the drivers themselves and is more challenging. Basically we see two segments of the driving community. PROJECT NUMBER 04-01(C14) District 2-0 Safer Driver Actions at Stop Signs 49

54 CMA The first segment consists of novice or mature drivers who are taking instruction from a reputable training facility. For them, we recommend that once the rules for stop sign behavior have been clarified, the new regulations should be made available to all Driver Training schools, private instructors, and organizations such as the AAA and NSC. This new information should also be provided to magistrates at their periodic training sessions and to State, County, and Local law enforcement personnel. License examiners should also receive training related to the new regulations. This should ensure that new drivers and those older drivers seeking a refresher course learn the rules as part of their education. The second segment is the cohort of experienced drivers, those between 21 and 65 who know how to drive. Reaching them presents more of a challenge, especially since their driving habits are fully ingrained. To reach those drivers we recommend several techniques that could be adopted simultaneously: Public Service Announcements (PSAs) on television and radio. Most stations will air these announcements, without charge, if they are provided in a usable format. Unfortunately, most PSAs are aired after midnight when few if any people see or hear them. Prepare an article for publication in AAA and AARP newsletters. Develop a 4x7 flyer that could be inserted into the envelopes with the applications for renewal of automobile registrations. It would be glossy, colorful, and easily understood. We propose that it include a diagram, showing the unique situation where drivers might pass a stop sign prior to stopping at an intersection. Develop a paper placemat with a Driver s quiz that would include several diagrams showing tricky traffic situations and 4 or 5 possible responses. Stop sign behavior could be one of several tests including the new regulations for snow removal and use of headlights. Answers would appear at the bottom of the placemat. These could be mass-produced and distributed to restaurants along the turnpike as well as at a variety of fast food establishments. People enjoy reading placemats while they wait for their meals and this would not only be educational but fun. PROJECT NUMBER 04-01(C14) District 2-0 Safer Driver Actions at Stop Signs 50
55 Appendix A Before & After Summary Sheets 51
56 Intersection Name: 111 SR: SR 1009 & SR 0053 Type: At Intersection, Low Speed, No Sight Obstruction Municipality: Morrisdale County: Clearfield Date of Observations: Weather Conditions: Left Right Stopping Posted Speed Limits: Approach Grade: 0% 1% Is SD Adequate: yes yes yes How Far to Adeq: Avail SD to : 410 First Avail. SD Stop Sign: Stop Bar: Edge of Shoulder: Crash History (5 year): 1 Angle Dist. From (ft): 10 Pavement History: SR Surface Treatment- Seal Coat SR Resurfacing- Bituminous Wearing Course Volume: Main Road: SR ADT Crossing Road: SR ADT 5 "" on Pavement "AT WHITE LINE" sign Type of Improvement: X X Phase I R: Right Turn S: Senior Time Required to Complete Gender of Driver Driver Age Group 0-5 Ft Ft Ft Ft Ft. Count Ft. 30+ Ft. Average / Percent 6.0% 3.0% % 2.0% % Median Phase II R: Right Turn Time Required to Complete S: Senior Gender of Driver Driver Age Group 0-5 Ft Ft. Count Ft Ft Ft Ft. 30+ Ft. Average / Percent 2.5% % 0.5% % 33% 4% 86% 11% 85% Median
57 Intersection Name: 112 SR: SR 1008 & Wilson St Type: At Intersection, Low Speed, No Sight Obstruction Municipality: Bellefonte County: Centre Date of Observations: Weather Conditions: Left Right Stopping Posted Speed Limits: Approach Grade: -5% 7% Is SD Adequate: NO yes yes How Far to Adeq: 10 Avail SD to : 200+ First Avail. SD Dist. From (ft): Stop Sign: 12 Stop Bar: Edge of Shoulder: Crash History (5 year): 5 Angles, 1 Rear End Pavement History: 1987 Resurfacing- Bituminous Wearing Course Volume: Main Road: SR ADT Crossing Road: Wilson St 900 ADT "" on Pavement "AT WHITE LINE" sign Type of Improvement: X Before R: Right Turn S: Senior Time Required to Complete Gender of Driver Driver Age Group 0-5 Ft. Count Ft Ft Ft Ft Ft. 30+ Ft. Average / Percent 5.5% % 1.5% % Median After R: Right Turn Time Required to Complete S: Senior Gender of Driver Driver Age Group 0-5 Ft Ft. Count Ft Ft Ft Ft. 30+ Ft. Average / Percent 3.5% 0.5% % 0.5% % 43% 3% 70% 27% 85% Median
58 Intersection Name: 121 SR: SR 1008 & Wilson St Type: At Intersection, Low Speed, Sight Obstruction Municipality: Bellefonte County: Centre Date of Observations: Weather Conditions: Left Right Stopping Posted Speed Limits: Approach Grade: 4% -5% Is SD Adequate: yes yes yes How Far to Adeq: Avail SD to : 200+ First Avail. SD N/A 11 Dist. From (ft): Stop Sign: 15 Stop Bar: Edge of Shoulder: Crash History (5 year): 3 Angles Pavement History: 1987 Resurfacing- Bituminous Wearing Course Volume: Main Road: SR ADT Crossing Road: Wilson St 900 ADT "" on Pavement "AT WHITE LINE" sign Type of Improvement: X Before R: Right Turn S: Senior Time Required to Complete Gender of Driver Driver Age Group 0-5 Ft Ft Ft Ft Ft. Count Ft. 30+ Ft. Average / Percent 14.5% % 1.0% % Median After R: Right Turn Time Required to Complete S: Senior Gender of Driver Driver Age Group 0-5 Ft Ft. Count Ft Ft Ft Ft. 30+ Ft. Average / Percent 4.0% % 3.0% % 41% 4% 72% 24% 85% Median
59 Intersection Name: 141 SR: SR 45 & SR 2012n Type: At Intersection, High Speed, Sight Obstruction Municipality: Gregg County: Centre Date of Observations: Weather Conditions: Left Right Stopping Posted Speed Limits: Approach Grade: 0% 0% Is SD Adequate: NO yes yes How Far to Adeq: Avail SD to : 230 First Avail. SD 5.5 N/A Stop Sign: Stop Bar: Edge of Shoulder: Crash History (5 year): 1 Angle Dist. From (ft): 18.5 Pavement History: Resurfacing- Bituminous Wearing Course 2 Volume: Main Road: SR ADT Crossing Road: SR ADT "" on Pavement "AT WHITE LINE" sign Type of Improvement: X X Before R: Right Turn S: Senior Time Required to Complete Gender of Driver Driver Age Group 0-5 Ft Ft Ft Ft Ft. Count Ft. 30+ Ft. Average / Percent 3.5% % 0.5% % 47% 13% 72% 16% 85% Median After R: Right Turn Time Required to Complete S: Senior Gender of Driver Driver Age Group 0-5 Ft Ft. Count Ft Ft Ft Ft. 30+ Ft. Average / Percent 10.0% % 1.0% % 42% 6% 73% 22% 85% Median
60 Intersection Name: 142 SR: SR 2014 & SR 2007 Type: At Intersection, High Speed, Sight Obstruction Municipality: Ashland County: Clearfield Date of Observations: Weather Conditions: Left Right Stopping Posted Speed Limits: Approach Grade: -4% 8% Is SD Adequate: yes NO yes How Far to Adeq: 10 Avail SD to : 450 First Avail. SD N/A 7.5 Dist. From (ft): Stop Sign: 15 Stop Bar: Edge of Shoulder: 2 Crash History (5 year): No Crashes Pavement History: Volume: Main Road: SR ADT Crossing Road: SR ADT "" on Pavement "AT WHITE LINE" sign Type of Improvement: X Before R: Right Turn S: Senior Time Required to Complete Gender of Driver Driver Age Group 0-5 Ft. Count Ft Ft Ft Ft Ft. 30+ Ft. Average / Percent 7.5% 0.5% % 1.0% % 25% 25% 45% 1% 85% Median After R: Right Turn Time Required to Complete S: Senior Gender of Driver Driver Age Group 0-5 Ft Ft. Count Ft Ft Ft Ft. 30+ Ft. Average / Percent 16.0% % 0.0% % 28% 4% 64% 12% 85% Median
61 Intersection Name: 211 SR: SR 3018 & Blue Course Drive Type: At a distance, Low Speed, No Sight Obstruction Municipality: State College County: Centre Date of Observations: Weather Conditions: Left Right Stopping Posted Speed Limits: Approach Grade: -2% 2% Is SD Adequate: yes yes yes How Far to Adeq: Avail SD to : 300+ First Avail. SD Stop Sign: Stop Bar: Edge of Shoulder: Dist. From (ft): 20 Crash History (5 year): 1 Fixed Object, 1 Rear End, 1 Angle Pavement History: Resurfacing- Bituminous Wearing Course 2 Volume: Main Road: SR ADT Crossing Road: Blue Course D 4000 ADT "" on Pavement "AT WHITE LINE" sign Type of Improvement: X Before R: Right Turn S: Senior Time Required to Complete Gender of Driver Driver Age Group 0-5 Ft Ft Ft Ft Ft. Count Ft. 30+ Ft. Average / Percent 7.0% % 2.0% % 46% 40% 47% 14% 85% Median After R: Right Turn Time Required to Complete S: Senior Gender of Driver Driver Age Group 0-5 Ft Ft. Count Ft Ft Ft Ft. 30+ Ft. Average / Percent 12.5% 0.5% % 1.5% % 50% 12% 74% 15% 85% Median
62 Intersection Name: 221 SR: SR 3011 & SR 3012 Type: At a distance, Low Speed, Sight Obstruction Municipality: State College County: Centre Date of Observations: Weather Conditions: Left Right Stopping Posted Speed Limits: Approach Grade: 2% -1% Is SD Adequate: yes yes yes How Far to Adeq: Avail SD to : 285 First Avail. SD Dist. From (ft): Stop Sign: 45 Stop Bar: Edge of Shoulder: Crash History (5 year): 1 Rear End, 1 Angle Pavement History: SR Resurfaced- Bituminous Wearing Course SR Resurfaced- Bituminous Wearing Course Volume: Main Road: SR ADT Crossing Road: SR ADT "" on Pavement "AT WHITE LINE" sign Type of Improvement: X X Before R: Right Turn S: Senior Time Required to Complete Gender of Driver Driver Age Group 0-5 Ft Ft Ft Ft Ft. Count Ft. 30+ Ft. Average / Percent 8.0% 1.0% % 4.5% % Median After R: Right Turn Time Required to Complete S: Senior Gender of Driver Driver Age Group 0-5 Ft Ft. Count Ft Ft Ft Ft. 30+ Ft. Average / Percent 0.5% % 0.5% % 31% 7% 77% 17% 85% Median
63 Intersection Name: 222 SR: SR 453 & SR 969 Type: At a distance, Low Speed, Sight Obstruction Municipality: Curwensville County: Clearfield Date of Observations: Weather Conditions: Left Right Stopping Posted Speed Limits: Approach Grade: -4% 4% Is SD Adequate: yes yes yes How Far to Adeq: Avail SD to : 300 First Avail. SD Dist. From (ft): Stop Sign: 60 Stop Bar: Edge of Shoulder: Crash History (5 year): 3 Fixed Object Pavement History: SR Resurfacing- Bituminous Wearing Course SR Resurfacing- Bituminous Wearing Course Volume: Main Road: SR ADT Crossing Road: SR ADT "" on Pavement "AT WHITE LINE" sign Type of Improvement: X Before R: Right Turn S: Senior Time Required to Complete Gender of Driver Driver Age Group 0-5 Ft Ft Ft Ft Ft. Count Ft. 30+ Ft. Average / Percent 16.0% 1.0% % 1.5% % Median After R: Right Turn Time Required to Complete S: Senior Gender of Driver Driver Age Group 0-5 Ft Ft. Count Ft Ft Ft Ft. 30+ Ft. Average / Percent 1.5% 0.5% % 0.0% % 38% 3% 83% 15% 85% Median
64 Intersection Name: 231 SR: SR 3005 & T 344 Type: At a distance, High Speed, No Sight Obstruction Municipality: Patten County: Centre Date of Observations: Weather Conditions: Left Right Stopping Posted Speed Limits: Approach Grade: -2% 2% Is SD Adequate: yes yes yes How Far to Adeq: Avail SD to : 500+ First Avail. SD Dist. From (ft): Stop Sign: 30 Stop Bar: Edge of Shoulder: 3 Crash History (5 year): 1 Rear End Pavement History: Resurfacing- Bituminous Wearing Course Volume: Main Road: SR ADT Crossing Road: T ADT "" on Pavement "AT WHITE LINE" sign Type of Improvement: X X Before R: Right Turn S: Senior Time Required to Complete Gender of Driver Driver Age Group 0-5 Ft Ft Ft Ft Ft. Count Ft. 30+ Ft. Average / Percent 7.5% 3.5% % 1.5% % 40% 24% 64% 13% 85% Median After R: Right Turn Time Required to Complete S: Senior Gender of Driver Driver Age Group 0-5 Ft Ft. Count Ft Ft Ft Ft. 30+ Ft. Average / Percent 9.5% 1.5% % 0.5% % 38% 5% 85% 11% 85% Median
65 Intersection Name: 232 SR: SR 153 & SR 2012w Type: At a distance, High Speed, No Sight Obstruction Municipality: Decatur County: Clearfield Date of Observations: Weather Conditions: Left Right Stopping Posted Speed Limits: Approach Grade: 0% -1% Is SD Adequate: yes yes yes How Far to Adeq: Avail SD to : 350+ First Avail. SD Stop Sign: Stop Bar: Edge of Shoulder: Crash History (5 year): 1 Angle Dist. From (ft): 38.5 Pavement History: Resurfacing- Bituminous Wearing Course 10 Volume: Main Road: SR ADT Crossing Road: SR 2012w 550 ADT "" on Pavement "AT WHITE LINE" sign Type of Improvement: X Before R: Right Turn S: Senior Time Required to Complete Gender of Driver Driver Age Group 0-5 Ft Ft Ft Ft Ft Ft. 30+ Ft. Count Average / Percent 2.5% 0.5% % 1.5% % 25% 8% 44% 15% 85% Median After R: Right Turn Time Required to Complete S: Senior Gender of Driver Driver Age Group 0-5 Ft Ft Ft Ft Ft Ft. Count Ft. Average / Percent 12.4% 0.6% % 1.2% % 39% 4% 78% 19% 85% Median
66 Intersection Name: 242 SR: SR 729n & SR 969 Type: At a distance, High Speed, Sight Obstruction Municipality: Lumber City County: Clearfield Date of Observations: Weather Conditions: Left Right Stopping Posted Speed Limits: Approach Grade: -1% 1% Is SD Adequate: yes yes yes How Far to Adeq: Avail SD to : 300+ First Avail. SD Stop Sign: Stop Bar: Edge of Shoulder: Crash History (5 year): 1 Angle Dist. From (ft): 60 Pavement History: SR Surface Treatment- Seal Coat SR Heavy Duty Bituminous Wearing Course Volume: Main Road: SR ADT Crossing Road: SR 729n 1800 ADT 8 "" on Pavement "AT WHITE LINE" sign Type of Improvement: X Before R: Right Turn S: Senior Time Required to Complete Gender of Driver Driver Age Group 0-5 Ft Ft Ft Ft Ft Ft. 30+ Ft. Count Average / Percent 16.5% 9.0% % 0.5% % 31% 13% 68% 20% 85% Median After R: Right Turn S: Senior Time Required to Complete Gender of Driver Driver Age Group 0-5 Ft Ft Ft Ft Ft Ft. 30+ Ft. Count Average / Percent 9.5% % 0.0% % 28% 5% 87% 9% 85% Median
67 Intersection Name: 311 SR: SR 729 & SR 3022 Type: Dashed Edge Line, Low Speed, No Sight Obstruction Municipality: Ferguson County: Clearfield Date of Observations: Weather Conditions: Left Right Stopping Posted Speed Limits: Approach Grade: -3% 9% Is SD Adequate: yes yes yes How Far to Adeq: Avail SD to : 400+ First Avail. SD Dist. From (ft): Stop Sign: 15 Stop Bar: Edge of Shoulder: 3 Crash History (5 year): No Crashes Pavement History: SR Resurfacing- Bituminous Wearing Course SR Resurfacing- Bituminous Wearing Course Volume: Main Road: SR ADT Crossing Road: SR ADT "" on Pavement "AT WHITE LINE" sign Type of Improvement: X Before R: Right Turn S: Senior Time Required to Complete Gender of Driver Driver Age Group 0-5 Ft. Count Ft Ft Ft Ft Ft. 30+ Ft. Average / Percent 5.0% 0.5% % 0.5% % 36% 14% 83% 4% 85% Median After R: Right Turn Time Required to Complete S: Senior Gender of Driver Driver Age Group 0-5 Ft Ft Ft Ft Ft Ft. Count Ft. Average / Percent 2.0% % 0.0% % 28% 2% 86% 13% 85% Median
68 Intersection Name: 312 SR: SR 253 & T 919 Type: Dashed Edge Line, Low Speed, No Sight Obstruction Municipality: Gulich County: Clearfield Date of Observations: Weather Conditions: Left Right Stopping Posted Speed Limits: Approach Grade: 1% -2% Is SD Adequate: yes yes yes How Far to Adeq: Avail SD to : 300+ First Avail. SD Dist. From (ft): Stop Sign: 45.5 Stop Bar: Edge of Shoulder: 3 Crash History (5 year): No Crashes Pavement History: Resurfacing- Bituminous Wearing Course Volume: Main Road: SR ADT Crossing Road: T ADT "" on Pavement "AT WHITE LINE" sign Type of Improvement: X Before R: Right Turn S: Senior Time Required to Complete Gender of Driver Driver Age Group 0-5 Ft Ft Ft Ft Ft Ft. 30+ Ft. Count Average / Percent 12.5% 5.5% % 1.0% % 16% 23% 29% 2% 85% Median After R: Right Turn Time Required to Complete S: Senior Gender of Driver Driver Age Group 0-5 Ft Ft Ft Ft Ft Ft. Count Ft. Average / Percent 4.5% 1.0% % 0.0% % 31% 3% 84% 13% 85% Median
69 Intersection Name: 322 SR: SR 550 & SR 3008 Type: Dashed Edge Line, Low Speed, Sight Obstruction Municipality: Fillmore County: Centre Date of Observations: Weather Conditions: Left Right Stopping Posted Speed Limits: Approach Grade: -2% 1% Is SD Adequate: yes yes yes How Far to Adeq: Avail SD to : 300+ First Avail. SD 25 N/A Dist. From (ft): Stop Sign: 35 Stop Bar: Edge of Shoulder: 4 Crash History (5 year): 5 Angles Pavement History: SR Full Depth Road Construction- Asphalt MX HMA Wearing SR Full Depth Road Construction- Asphalt MX HMA Wearing + Curbed Gutter Installed Volume: Main Road: SR ADT Crossing Road: SR ADT "" on Pavement "AT WHITE LINE" sign Type of Improvement: X Before R: Right Turn S: Senior Time Required to Complete Gender of Driver Driver Age Group 0-5 Ft Ft Ft Ft Ft. Count Ft. 30+ Ft. Average / Percent 16.5% % 2.5% % 47% 6% 76% 18% 85% Median After R: Right Turn Time Required to Complete S: Senior Gender of Driver Driver Age Group 0-5 Ft Ft Ft Ft Ft Ft. Count Ft. Average / Percent 12.5% % 0.5% % 46% 7% 69% 24% 85% Median
70 Intersection Name: 331 SR: SR 119 & SR 4003 Type: Dashed Edge Line, High Speed, No Sight Obstruction Municipality: Brady County: Clearfield Date of Observations: Weather Conditions: Left Right Stopping Posted Speed Limits: Approach Grade: 8% -8% Is SD Adequate: yes yes yes How Far to Adeq: Avail SD to : 400+ First Avail. SD Stop Sign: Stop Bar: Edge of Shoulder: Dist. From (ft): 52 Crash History (5 year): 4 Rear End, 2 Fixed Object Pavement History: Resurfacing- Bituminous Wearing Course 5 Volume: Main Road: SR ADT Crossing Road: SR ADT "" on Pavement "AT WHITE LINE" sign Type of Improvement: X X Before R: Right Turn S: Senior Time Required to Complete Gender of Driver Driver Age Group 0-5 Ft Ft Ft Ft Ft Ft. 30+ Ft. Count Average / Percent 11.5% 17.0% % 1.0% % 39% 24% 56% 21% 85% Median After R: Right Turn Time Required to Complete S: Senior Gender of Driver Driver Age Group 0-5 Ft Ft Ft Ft Ft Ft. Count Ft. Average / Percent 24.5% 4.0% % 0.5% % 47% 10% 74% 17% 85% Median
71 Intersection Name: 341 SR: SR 144 & SR 504 Type: Dashed Edge Line, High Speed, Sight Obstruction Municipality: Wingate County: Centre Date of Observations: Weather Conditions: Left Right Stopping Posted Speed Limits: Approach Grade: 0% 0% Is SD Adequate: NO NO yes How Far to Adeq: Avail SD to : 350+ First Avail. SD Stop Sign: Stop Bar: Edge of Shoulder: Crash History (5 year): 5 Angle Pavement History: Dist. From (ft): 35 5 Volume: Main Road: SR ADT Crossing Road: SR ADT "" on Pavement "AT WHITE LINE" sign Type of Improvement: X Before R: Right Turn S: Senior Time Required to Complete Gender of Driver Driver Age Group 0-5 Ft Ft Ft Ft Ft. Count Ft. 30+ Ft. Average / Percent 10.0% 2.0% % 2.0% % 32% 11% 69% 21% 85% Median After R: Right Turn Time Required to Complete S: Senior Gender of Driver Driver Age Group 0-5 Ft Ft Ft Ft Ft Ft. Count Ft. Average / Percent 10.5% 2.5% % 0.5% % 39% 8% 75% 18% 85% Median
72 Intersection Name: 342 SR: SR 219 & SR 36 Type: Dashed Edge Line, High Speed, Sight Obstruction Municipality: Mahaffey County: Clearfield Date of Observations: Weather Conditions: Left Right Stopping Posted Speed Limits: Approach Grade: -3% 0% Is SD Adequate: yes yes yes How Far to Adeq: Avail SD to : 500+ First Avail. SD Stop Sign: Stop Bar: Edge of Shoulder: Dist. From (ft): 75 Crash History (5 year): 1 Fixed Object, 1 Rear End, 1 Angle Pavement History: 2 Volume: Main Road: SR ADT Crossing Road: SR ADT "" on Pavement "AT WHITE LINE" sign Type of Improvement: X X Before R: Right Turn S: Senior Time Required to Complete Gender of Driver Driver Age Group 0-5 Ft Ft Ft Ft Ft Ft. 30+ Ft. Count Average / Percent 13.0% 2.0% % 1.5% % 30% 10% 70% 21% 85% Median After R: Right Turn Time Required to Complete S: Senior Gender of Driver Driver Age Group 0-5 Ft Ft Ft Ft Ft Ft. Count Ft. Average / Percent 3.5% 0.5% % 0.0% % 30% 2% 90% 8% 85% Median
73 Intersection Name: 412 SR: SR 3014 & Loop Rd Type: Stop Bar, Low Speed, No Sight Obstruction Municipality: Bellefonte County: Centre Date of Observations: Weather Conditions: Left Right Stopping Posted Speed Limits: Approach Grade: 2% -1% Is SD Adequate: yes yes yes How Far to Adeq: Avail SD to : 200+ First Avail. SD Dist. From (ft): Stop Sign: 18 Stop Bar: 17 Edge of Shoulder: 6 Crash History (5 year): 1 Rear End Pavement History: Resurfacing- Bituminous Wearing Curve Volume: Main Road: SR ADT Crossing Road: Loop Rd. 300 ADT "" on Pavement "AT WHITE LINE" sign Type of Improvement: X Before R: Right Turn S: Senior Time Required to Complete Gender of Driver Driver Age Group 0-5 Ft Ft Ft Ft Ft. Count Ft. 30+ Ft. Average / Percent 11.0% 0.0% % 1.5% % 34% 19% 78% 4% 85% Median After R: Right Turn Time Required to Complete S: Senior Gender of Driver Driver Age Group 0-5 Ft Ft. Count Ft Ft Ft Ft. 30+ Ft. Average / Percent 20.9% % 0.6% % 28% 6% 78% 16% 85% Median
74 Intersection Name: 421 SR: SR 322 & Ninth St Type: Stop Bar, Low Speed, Sight Obstruction Municipality: Philipsburg County: Centre Date of Observations: Weather Conditions: Left Right Stopping Posted Speed Limits: Approach Grade: -3% 3% Is SD Adequate: NO yes yes How Far to Adeq: Avail SD to : 200+ First Avail. SD 9 11 Dist. From (ft): Stop Sign: 31 Stop Bar: 30 Edge of Shoulder: Crash History (5 year): 1 Rear End, 3 Angle Pavement History: Heavy Bituminous Wearing Course Volume: Main Road: SR ADT Crossing Road: Ninth St 6800 ADT "" on Pavement "AT WHITE LINE" sign Type of Improvement: X X Before R: Right Turn S: Senior Time Required to Complete Gender of Driver Driver Age Group 0-5 Ft Ft Ft Ft Ft. Count Ft. 30+ Ft. Average / Percent 17.0% 0.5% % 4.5% % 42% 12% 69% 20% 85% Median After R: Right Turn Time Required to Complete S: Senior Gender of Driver Driver Age Group 0-5 Ft Ft Ft Ft Ft Ft. Count Ft. Average / Percent 5.5% % 0.6% % 43% 7% 80% 14% 85% Median
75 Intersection Name: 431 SR: SR 322 & SR 144 Type: Stop Bar, High Speed, No Sight Obstruction Municipality: Potter County: Centre Date of Observations: Weather Conditions: Left Right Stopping Posted Speed Limits: Approach Grade: -6% 3% Is SD Adequate: yes yes yes How Far to Adeq: Avail SD to : 300 First Avail. SD Stop Sign: Stop Bar: Edge of Shoulder: Dist. From (ft): 20 Crash History (5 year): 6 Angle, 1 Sideswipe, 1 Head On Pavement History: SR Bituminous Wearing Course SR Bituminous Wearing Course Volume: Main Road: SR ADT Crossing Road: SR ADT 9 "" on Pavement "AT WHITE LINE" sign Type of Improvement: X X Before R: Right Turn S: Senior Time Required to Complete Gender of Driver Driver Age Group 0-5 Ft Ft Ft Ft Ft. Count Ft. 30+ Ft. Average / Percent 17.5% 4.5% % 1.0% % 28% 5% 68% 27% 85% Median After R: Right Turn Time Required to Complete S: Senior Gender of Driver Driver Age Group 0-5 Ft Ft Ft Ft Ft Ft. Count Ft. Average / Percent 7.5% 0.5% % 4.0% % 31% 2% 90% 8% 85% Median
76 Intersection Name: 432 SR: SR 45 & T 718 Type: Stop Bar, High Speed, No Sight Obstruction Municipality: Harris County: Centre Date of Observations: Weather Conditions: Left Right Stopping Posted Speed Limits: Approach Grade: 0% 0% Is SD Adequate: yes yes yes How Far to Adeq: Avail SD to : 300+ First Avail. SD Dist. From (ft): Stop Sign: 22 Stop Bar: 20 Edge of Shoulder: 4 Crash History (5 year): 1 Rear End Pavement History: Resurfacing- Bituminous Wearing Course Volume: Main Road: SR ADT Crossing Road: T ADT "" on Pavement "AT WHITE LINE" sign Type of Improvement: X Before R: Right Turn S: Senior Time Required to Complete Gender of Driver Driver Age Group 0-5 Ft Ft Ft Ft Ft. Count Ft. 30+ Ft. Average / Percent 14.0% % 1.0% % 45% 9% 62% 29% 85% Median After R: Right Turn Time Required to Complete S: Senior Gender of Driver Driver Age Group 0-5 Ft Ft. Count Ft Ft Ft Ft. 30+ Ft. Average / Percent 15.0% % 1.0% % 51% 4% 66% 30% 85% Median
77 Intersection Name: 441 SR: SR 45 & T 845 Type: Stop Bar, High Speed, Sight Obstruction Municipality: Harris County: Centre Date of Observations: Weather Conditions: Left Right Stopping Posted Speed Limits: Approach Grade: -4% 5% Is SD Adequate: yes yes yes How Far to Adeq: Avail SD to : 300+ First Avail. SD Dist. From (ft): Stop Sign: 23 Stop Bar: 22 Edge of Shoulder: 4 Crash History (5 year): No Crashes Pavement History: Resurfacing- Bituminous Wearing Course Volume: Main Road: SR ADT Crossing Road: T ADT "" on Pavement "AT WHITE LINE" sign Type of Improvement: X Before R: Right Turn S: Senior Time Required to Complete Gender of Driver Driver Age Group 0-5 Ft Ft Ft Ft Ft. Count Ft. 30+ Ft. Average / Percent 14.0% 1.0% % 0.5% % 45% 21% 68% 12% 85% Median After R: Right Turn Time Required to Complete S: Senior Gender of Driver Driver Age Group 0-5 Ft Ft Ft Ft Ft Ft. Count Ft. Average / Percent 17.5% % 0.5% % 50% 6% 75% 19% 85% Median
78 Intersection Name: 442 SR: SR 45 & T 354 Type: Stop Bar, High Speed, Sight Obstruction Municipality: Harris County: Centre Date of Observations: Weather Conditions: Left Right Stopping Posted Speed Limits: Approach Grade: -1% 1% Is SD Adequate: yes yes NO How Far to Adeq: Avail SD to : 125 First Avail. SD 13 N/A Dist. From (ft): Stop Sign: 20 Stop Bar: 18 Edge of Shoulder: 3 Crash History (5 year): No Crashes Pavement History: Resurfacing- Bituminous Wearing Course Volume: Main Road: SR ADT Crossing Road: T ADT "" on Pavement "AT WHITE LINE" sign Type of Improvement: X Before R: Right Turn S: Senior Time Required to Complete Gender of Driver Driver Age Group 0-5 Ft. Count Ft Ft Ft Ft Ft. 30+ Ft. Average / Percent 6.5% % 1.0% % 37% 23% 62% 15% 85% Median After R: Right Turn Time Required to Complete S: Senior Gender of Driver Driver Age Group 0-5 Ft Ft. Count Ft Ft Ft Ft. 30+ Ft. Average / Percent 1.0% % 0.5% % 30% 5% 80% 16% 85% Median
79 Appendix B Comparison Summary Sheets 75
80 Intersection Name: 111 SR: SR 1009 & SR 0053 Type: At Intersection, Low Speed, No Sight Obstruction Municipality: Morrisdale County: Clearfield Date of Observations: Weather Conditions: Left Right Stopping Posted Speed Limits: Approach Grade: 0% 1% Is SD Adequate: yes yes yes How Far to Adeq: Avail SD to : 410 First Avail. SD Stop Sign: Stop Bar: Edge of Shoulder: Crash History (5 year): 1 Angle Dist. From (ft): 10 Pavement History: SR Surface Treatment- Seal Coat SR Resurfacing- Bituminous Wearing Course Volume: Main Road: SR ADT Crossing Road: SR ADT 5 "" on Pavement "AT WHITE LINE" sign Type of Improvement: X X Numerical Increase/Decrease R: Right Turn S: Senior Time Required to Complete Gender of Driver Driver Age Group 0-5 Ft Ft Ft Ft Ft Ft. 30+ Ft. Count Average / Percent % Median % Increase/Decrease R: Right Turn S: Senior Time Required to Complete Gender of Driver Driver Age Group 0-5 Ft Ft Ft Ft Ft Ft. 30+ Ft. Count % % % 61.54% 86.96% % 36.92% -1.02% % % % % Average / Percent % % % % % % 85% Median
81 Intersection Name: 112 SR: SR 1008 & Wilson St Type: At Intersection, Low Speed, No Sight Obstruction Municipality: Bellefonte County: Centre Date of Observations: Weather Conditions: Left Right Stopping Posted Speed Limits: Approach Grade: -5% 7% Is SD Adequate: NO yes yes How Far to Adeq: 10 Avail SD to : 200+ First Avail. SD Dist. From (ft): Stop Sign: 12 Stop Bar: Edge of Shoulder: Crash History (5 year): 5 Angles, 1 Rear End Pavement History: 1987 Resurfacing- Bituminous Wearing Course Volume: Main Road: SR ADT Crossing Road: Wilson St 900 ADT "" on Pavement "AT WHITE LINE" sign Type of Improvement: X Numerical Increase/Decrease R: Right Turn S: Senior Time Required to Complete Gender of Driver Driver Age Group 0-5 Ft. Count Ft Ft Ft Ft Ft. 30+ Ft. Average / Percent % Median % Increase/Decrease R: Right Turn Time Required to Complete S: Senior Gender of Driver Driver Age Group 0-5 Ft Ft. Count % #DIV/0! % % 46.67% % 40.00% 9.50% % % Ft Ft Ft Ft. 30+ Ft. Average / Percent % -1.87% % -0.56% % % 85% Median
82 Intersection Name: 121 SR: SR 1008 & Wilson St Type: At Intersection, Low Speed, Sight Obstruction Municipality: Bellefonte County: Centre Date of Observations: Weather Conditions: Left Right Stopping Posted Speed Limits: Approach Grade: 4% -5% Is SD Adequate: yes yes yes How Far to Adeq: Avail SD to : 200+ First Avail. SD N/A 11 Dist. From (ft): Stop Sign: 15 Stop Bar: Edge of Shoulder: Crash History (5 year): 3 Angles Pavement History: 1987 Resurfacing- Bituminous Wearing Course Volume: Main Road: SR ADT Crossing Road: Wilson St 900 ADT "" on Pavement "AT WHITE LINE" sign Type of Improvement: X Numerical Increase/Decrease R: Right Turn S: Senior Time Required to Complete Gender of Driver Driver Age Group 0-5 Ft Ft Ft Ft Ft. Count Ft. 30+ Ft. Average / Percent % Median % Increase/Decrease R: Right Turn Time Required to Complete S: Senior Gender of Driver Driver Age Group 0-5 Ft Ft Ft Ft Ft Ft. Count % % % -6.76% 0.99% 16.00% 26.15% -7.84% % % % 30+ Ft. Average / Percent -7.33% -4.74% % % 0.20% 26.04% 85% Median
83 Intersection Name: 141 SR: SR 45 & SR 2012n Type: At Intersection, High Speed, Sight Obstruction Municipality: Gregg County: Centre Date of Observations: Weather Conditions: Left Right Stopping Posted Speed Limits: Approach Grade: 0% 0% Is SD Adequate: NO yes yes How Far to Adeq: Avail SD to : 230 First Avail. SD 5.5 N/A Stop Sign: Stop Bar: Edge of Shoulder: Crash History (5 year): 1 Angle Dist. From (ft): 18.5 Pavement History: Resurfacing- Bituminous Wearing Course 2 Volume: Main Road: SR ADT Crossing Road: SR ADT "" on Pavement "AT WHITE LINE" sign Type of Improvement: X X Numerical Increase/Decrease R: Right Turn S: Senior Time Required to Complete Gender of Driver Driver Age Group 0-5 Ft Ft Ft Ft Ft Ft. 30+ Ft. Count #REF! Average / Percent % Median % Increase/Decrease R: Right Turn S: Senior Time Required to Complete Gender of Driver Driver Age Group 0-5 Ft Ft Ft Ft Ft Ft. 30+ Ft. Count % % % % % % % 49.28% 28.00% % #REF! Average / Percent 8.05% % % % 31.90% % 85% Median
84 Intersection Name: 142 SR: SR 2014 & SR 2007 Type: At Intersection, High Speed, Sight Obstruction Municipality: Ashland County: Clearfield Date of Observations: Weather Conditions: Left Right Stopping Posted Speed Limits: Approach Grade: -4% 8% Is SD Adequate: yes NO yes How Far to Adeq: 10 Avail SD to : 450 First Avail. SD N/A 7.5 Dist. From (ft): Stop Sign: 15 Stop Bar: Edge of Shoulder: 2 Crash History (5 year): No Crashes Pavement History: Volume: Main Road: SR ADT Crossing Road: SR ADT "" on Pavement "AT WHITE LINE" sign Type of Improvement: X Numerical Increase/Decrease R: Right Turn S: Senior Time Required to Complete Gender of Driver Driver Age Group 0-5 Ft Ft Ft Ft Ft. Count Ft. 30+ Ft. Average / Percent % Median % Increase/Decrease R: Right Turn Time Required to Complete S: Senior Gender of Driver Driver Age Group 0-5 Ft Ft. Count % % % % % % 44.44% % 8.64% % #DIV/0! Ft Ft Ft Ft. 30+ Ft. Average / Percent 1.37% % % 8.18% 4.68% % 85% Median
85 Intersection Name: 211 SR: SR 3018 & Blue Course Drive Type: At a distance, Low Speed, No Sight Obstruction Municipality: State College County: Centre Date of Observations: Weather Conditions: Left Right Stopping Posted Speed Limits: Approach Grade: -2% 2% Is SD Adequate: yes yes yes How Far to Adeq: Avail SD to : 300+ First Avail. SD Stop Sign: Stop Bar: Edge of Shoulder: Dist. From (ft): 20 Crash History (5 year): 1 Fixed Object, 1 Rear End, 1 Angle Pavement History: Resurfacing- Bituminous Wearing Course 2 Volume: Main Road: SR ADT Crossing Road: Blue Course D 4000 ADT "" on Pavement "AT WHITE LINE" sign Type of Improvement: X Numerical Increase/Decrease R: Right Turn S: Senior Time Required to Complete Gender of Driver Driver Age Group 0-5 Ft Ft Ft Ft Ft. Count Ft. 30+ Ft. Average / Percent % Median % Increase/Decrease R: Right Turn Time Required to Complete S: Senior Gender of Driver Driver Age Group 0-5 Ft Ft. Count 78.57% % 3.97% -6.76% % % % % Ft Ft Ft Ft. 30+ Ft. Average / Percent % % % % % 85% Median
86 Intersection Name: 221 SR: SR 3011 & SR 3012 Type: At a distance, Low Speed, Sight Obstruction Municipality: State College County: Centre Date of Observations: Weather Conditions: Left Right Stopping Posted Speed Limits: Approach Grade: 2% -1% Is SD Adequate: yes yes yes How Far to Adeq: Avail SD to : 285 First Avail. SD Dist. From (ft): Stop Sign: 45 Stop Bar: Edge of Shoulder: Crash History (5 year): 1 Rear End, 1 Angle Pavement History: SR Resurfaced- Bituminous Wearing Course SR Resurfaced- Bituminous Wearing Course Volume: Main Road: SR ADT Crossing Road: SR ADT "" on Pavement "AT WHITE LINE" sign Type of Improvement: X X Numerical Increase/Decrease R: Right Turn S: Senior Time Required to Complete Gender of Driver Driver Age Group 0-5 Ft Ft Ft Ft Ft. Count Ft. 30+ Ft. Average / Percent % Median % Increase/Decrease R: Right Turn Time Required to Complete S: Senior Gender of Driver Driver Age Group 0-5 Ft Ft. Count % % % % % #DIV/0! 32.86% % 28.57% 66.67% 0.00% Ft Ft Ft Ft. 30+ Ft. Average / Percent 5.93% % % 6.74% #DIV/0! 4.95% 85% Median
87 Intersection Name: 222 SR: SR 453 & SR 969 Type: At a distance, Low Speed, Sight Obstruction Municipality: Curwensville County: Clearfield Date of Observations: Weather Conditions: Left Right Stopping Posted Speed Limits: Approach Grade: -4% 4% Is SD Adequate: yes yes yes How Far to Adeq: Avail SD to : 300 First Avail. SD Dist. From (ft): Stop Sign: 60 Stop Bar: Edge of Shoulder: Crash History (5 year): 3 Fixed Object Pavement History: SR Resurfacing- Bituminous Wearing Course SR Resurfacing- Bituminous Wearing Course Volume: Main Road: SR ADT Crossing Road: SR ADT "" on Pavement "AT WHITE LINE" sign Type of Improvement: X Numerical Increase/Decrease R: Right Turn S: Senior Time Required to Complete Gender of Driver Driver Age Group 0-5 Ft Ft Ft Ft Ft. Count Ft. 30+ Ft. Average / Percent % Median % Increase/Decrease R: Right Turn Time Required to Complete S: Senior Gender of Driver Driver Age Group 0-5 Ft Ft. Count % % % % -5.56% #DIV/0! 40.00% 54.93% % % 0.00% Ft Ft Ft Ft. 30+ Ft. Average / Percent % -6.73% % % #DIV/0! % 85% Median
88 Intersection Name: 231 SR: SR 3005 & T 344 Type: At a distance, High Speed, No Sight Obstruction Municipality: Patten County: Centre Date of Observations: Weather Conditions: Left Right Stopping Posted Speed Limits: Approach Grade: -2% 2% Is SD Adequate: yes yes yes How Far to Adeq: Avail SD to : 500+ First Avail. SD Dist. From (ft): Stop Sign: 30 Stop Bar: Edge of Shoulder: 3 Crash History (5 year): 1 Rear End Pavement History: Resurfacing- Bituminous Wearing Course Volume: Main Road: SR ADT Crossing Road: T ADT "" on Pavement "AT WHITE LINE" sign Type of Improvement: X X Numerical Increase/Decrease R: Right Turn S: Senior Time Required to Complete Gender of Driver Driver Age Group 0-5 Ft Ft Ft Ft Ft. Count Ft. 30+ Ft. Average / Percent % Median % Increase/Decrease R: Right Turn Time Required to Complete S: Senior Gender of Driver Driver Age Group 0-5 Ft Ft. Count 26.67% % % % 16.82% % % % 50.00% Ft Ft Ft Ft. 30+ Ft. Average / Percent % -6.88% % % % 85% Median
89 Intersection Name: 232 SR: SR 153 & SR 2012w Type: At a distance, High Speed, No Sight Obstruction Municipality: Decatur County: Clearfield Date of Observations: Weather Conditions: Left Right Stopping Posted Speed Limits: Approach Grade: 0% -1% Is SD Adequate: yes yes yes How Far to Adeq: Avail SD to : 350+ First Avail. SD Stop Sign: Stop Bar: Edge of Shoulder: Crash History (5 year): 1 Angle Dist. From (ft): 38.5 Pavement History: Resurfacing- Bituminous Wearing Course 10 Volume: Main Road: SR ADT Crossing Road: SR 2012w 550 ADT "" on Pavement "AT WHITE LINE" sign Type of Improvement: X Numerical Increase/Decrease R: Right Turn S: Senior Time Required to Complete Gender of Driver Driver Age Group 0-5 Ft Ft Ft Ft Ft Ft. 30+ Ft. Count Average / Percent % Median % Increase/Decrease R: Right Turn Time Required to Complete S: Senior Gender of Driver Driver Age Group 0-5 Ft Ft Ft Ft Ft Ft. Count % 0.00% % -7.25% % % % % % 12.50% % % 30+ Ft. Average / Percent 28.62% % % -4.34% % 85% Median
90 Intersection Name: 242 SR: SR 729n & SR 969 Type: At a distance, High Speed, Sight Obstruction Municipality: Lumber City County: Clearfield Date of Observations: Weather Conditions: Left Right Stopping Posted Speed Limits: Approach Grade: -1% 1% Is SD Adequate: yes yes yes How Far to Adeq: Avail SD to : 300+ First Avail. SD Stop Sign: Stop Bar: Edge of Shoulder: Crash History (5 year): 1 Angle Dist. From (ft): 60 Pavement History: SR Surface Treatment- Seal Coat SR Heavy Duty Bituminous Wearing Course Volume: Main Road: SR ADT Crossing Road: SR 729n 1800 ADT 8 "" on Pavement "AT WHITE LINE" sign Type of Improvement: X Numerical Increase/Decrease R: Right Turn S: Senior Time Required to Complete Gender of Driver Driver Age Group 0-5 Ft Ft Ft Ft Ft Ft. 30+ Ft. Count Average / Percent % Median % Increase/Decrease R: Right Turn Time Required to Complete S: Senior Gender of Driver Driver Age Group 0-5 Ft Ft Ft Ft Ft Ft. Count % % % % % % % % % % % % 30+ Ft. Average / Percent % % 22.86% 5.49% % 85% Median
91 Intersection Name: 311 SR: SR 729 & SR 3022 Type: Dashed Edge Line, Low Speed, No Sight Obstruction Municipality: Ferguson County: Clearfield Date of Observations: Weather Conditions: Left Right Stopping Posted Speed Limits: Approach Grade: -3% 9% Is SD Adequate: yes yes yes How Far to Adeq: Avail SD to : 400+ First Avail. SD Dist. From (ft): Stop Sign: 15 Stop Bar: Edge of Shoulder: 3 Crash History (5 year): No Crashes Pavement History: SR Resurfacing- Bituminous Wearing Course SR Resurfacing- Bituminous Wearing Course Volume: Main Road: SR ADT Crossing Road: SR ADT "" on Pavement "AT WHITE LINE" sign Type of Improvement: X Numerical Increase/Decrease Distance from Edge of Road Left Right Difficulty Seeing Traffic? R: Right Turn S: Senior Time Required to Complete Gender of Driver Count Driver Age Group 0-5 Ft Ft Ft Ft Ft Ft. 30+ Ft. Average / Percent % Median % Increase/Decrease Distance from Edge of Road Left Right Difficulty Seeing Traffic? R: Right Turn Time Required to Complete Ft Ft Ft Ft. Count % % % % % % % 6.74% % #DIV/0! #DIV/0! Gender of Driver S: Senior Driver Age Group 0-5 Ft Ft. 30+ Ft. Average / Percent 45.96% 15.32% % 22.89% 42.15% -3.31% 85% Median
92 Intersection Name: 312 SR: SR 253 & T 919 Type: Dashed Edge Line, Low Speed, No Sight Obstruction Municipality: Gulich County: Clearfield Date of Observations: Weather Conditions: Left Right Stopping Posted Speed Limits: Approach Grade: 1% -2% Is SD Adequate: yes yes yes How Far to Adeq: Avail SD to : 300+ First Avail. SD Dist. From (ft): Stop Sign: 45.5 Stop Bar: Edge of Shoulder: 3 Crash History (5 year): No Crashes Pavement History: Resurfacing- Bituminous Wearing Course Volume: Main Road: SR ADT Crossing Road: T ADT "" on Pavement "AT WHITE LINE" sign Type of Improvement: X Numerical Increase/Decrease R: Right Turn S: Senior Time Required to Complete Gender of Driver Driver Age Group 0-5 Ft Ft Ft Ft Ft Ft. 30+ Ft. Count Average / Percent % Median % Increase/Decrease R: Right Turn Time Required to Complete S: Senior Gender of Driver Driver Age Group 0-5 Ft Ft Ft Ft Ft Ft. Count % % #DIV/0! % -5.58% % % % % % % % 0.00% 30+ Ft. Average / Percent % 13.39% % 4.98% -3.58% 85% Median
93 Intersection Name: 322 SR: SR 550 & SR 3008 Type: Dashed Edge Line, Low Speed, Sight Obstruction Municipality: Fillmore County: Centre Date of Observations: Weather Conditions: Left Right Stopping Posted Speed Limits: Approach Grade: -2% 1% Is SD Adequate: yes yes yes How Far to Adeq: Avail SD to : 300+ First Avail. SD 25 N/A Dist. From (ft): Stop Sign: 35 Stop Bar: Edge of Shoulder: 4 Crash History (5 year): 5 Angles Pavement History: SR Full Depth Road Construction- Asphalt MX HMA Wearing SR Full Depth Road Construction- Asphalt MX HMA Wearing + Curbed Gutter Installed Volume: Main Road: SR ADT Crossing Road: SR ADT "" on Pavement "AT WHITE LINE" sign Type of Improvement: X Numerical Increase/Decrease R: Right Turn S: Senior Time Required to Complete Gender of Driver Driver Age Group 0-5 Ft Ft Ft Ft Ft Ft. 30+ Ft. Count Average / Percent % Median % Increase/Decrease R: Right Turn Time Required to Complete S: Senior Gender of Driver Driver Age Group 0-5 Ft Ft Ft Ft Ft Ft. Count % % % % % 12.70% 10.17% 19.32% % % % % #DIV/0! 30+ Ft. Average / Percent -7.88% % % 4.09% % % 85% Median
94 Intersection Name: 331 SR: SR 119 & SR 4003 Type: Dashed Edge Line, High Speed, No Sight Obstruction Municipality: Brady County: Clearfield Date of Observations: Weather Conditions: Left Right Stopping Posted Speed Limits: Approach Grade: 8% -8% Is SD Adequate: yes yes yes How Far to Adeq: Avail SD to : 400+ First Avail. SD Stop Sign: Stop Bar: Edge of Shoulder: Dist. From (ft): 52 Crash History (5 year): 4 Rear End, 2 Fixed Object Pavement History: Resurfacing- Bituminous Wearing Course 5 Volume: Main Road: SR ADT Crossing Road: SR ADT "" on Pavement "AT WHITE LINE" sign Type of Improvement: X X Numerical Increase/Decrease R: Right Turn S: Senior Time Required to Complete Gender of Driver Driver Age Group 0-5 Ft Ft Ft Ft Ft Ft. 30+ Ft. Count Average / Percent % Median % Increase/Decrease R: Right Turn Time Required to Complete S: Senior Gender of Driver Driver Age Group 0-5 Ft Ft Ft Ft Ft Ft. Count % % % 20.00% -0.51% % % 21.57% % % 62.50% % 30+ Ft. Average / Percent 52.56% % % % -5.21% 85% Median
95 Intersection Name: 341 SR: SR 144 & SR 504 Type: Dashed Edge Line, High Speed, Sight Obstruction Municipality: Wingate County: Centre Date of Observations: Weather Conditions: Left Right Stopping Posted Speed Limits: Approach Grade: 0% 0% Is SD Adequate: NO NO yes How Far to Adeq: Avail SD to : 350+ First Avail. SD Stop Sign: Stop Bar: Edge of Shoulder: Crash History (5 year): 5 Angle Pavement History: Dist. From (ft): 35 5 Volume: Main Road: SR ADT Crossing Road: SR ADT "" on Pavement "AT WHITE LINE" sign Type of Improvement: X Numerical Increase/Decrease R: Right Turn S: Senior Time Required to Complete Gender of Driver Driver Age Group 0-5 Ft Ft Ft Ft Ft Ft. 30+ Ft. Count Average / Percent % Median % Increase/Decrease R: Right Turn Time Required to Complete S: Senior Gender of Driver Driver Age Group 0-5 Ft Ft Ft Ft Ft Ft. Count 5.00% 25.00% % % -7.09% 16.95% % % % 81.82% % 0.00% #DIV/0! 30+ Ft. Average / Percent 19.16% % % -7.22% 8.75% 85% Median
96 Intersection Name: 342 SR: SR 219 & SR 36 Type: Dashed Edge Line, High Speed, Sight Obstruction Municipality: Mahaffey County: Clearfield Date of Observations: Weather Conditions: Left Right Stopping Posted Speed Limits: Approach Grade: -3% 0% Is SD Adequate: yes yes yes How Far to Adeq: Avail SD to : 500+ First Avail. SD Stop Sign: Stop Bar: Edge of Shoulder: Dist. From (ft): 75 Crash History (5 year): 1 Fixed Object, 1 Rear End, 1 Angle Pavement History: 2 Volume: Main Road: SR ADT Crossing Road: SR ADT "" on Pavement "AT WHITE LINE" sign Type of Improvement: X X Numerical Increase/Decrease R: Right Turn S: Senior Time Required to Complete Gender of Driver Driver Age Group 0-5 Ft Ft Ft Ft Ft Ft. 30+ Ft. Count Average / Percent % Median % Increase/Decrease R: Right Turn Time Required to Complete S: Senior Gender of Driver Driver Age Group 0-5 Ft Ft Ft Ft Ft Ft. Count % % % % % % % % 26.92% % % % % 30+ Ft. Average / Percent % -5.78% % % % 85% Median
97 Intersection Name: 412 SR: SR 3014 & Loop Rd Type: Stop Bar, Low Speed, No Sight Obstruction Municipality: Bellefonte County: Centre Date of Observations: Weather Conditions: Left Right Stopping Posted Speed Limits: Approach Grade: 2% -1% Is SD Adequate: yes yes yes How Far to Adeq: Avail SD to : 200+ First Avail. SD Dist. From (ft): Stop Sign: 18 Stop Bar: 17 Edge of Shoulder: 6 Crash History (5 year): 1 Rear End Pavement History: Resurfacing- Bituminous Wearing Curve Volume: Main Road: SR ADT Crossing Road: Loop Rd. 300 ADT "" on Pavement "AT WHITE LINE" sign Type of Improvement: X Numerical Increase/Decrease R: Right Turn S: Senior Time Required to Complete Gender of Driver Driver Age Group 0-5 Ft Ft Ft Ft Ft Ft. 30+ Ft. Count Average / Percent % Median % Increase/Decrease R: Right Turn Time Required to Complete S: Senior Gender of Driver Driver Age Group 0-5 Ft Ft Ft Ft Ft Ft. Count 68.18% % % 4.76% % % % % #DIV/0! #DIV/0! #DIV/0! 30+ Ft. Average / Percent -9.07% % -9.13% 0.17% 48.11% 85% Median
98 Intersection Name: 421 SR: SR 322 & Ninth St Type: Stop Bar, Low Speed, Sight Obstruction Municipality: Philipsburg County: Centre Date of Observations: Weather Conditions: Left Right Stopping Posted Speed Limits: Approach Grade: -3% 3% Is SD Adequate: NO yes yes How Far to Adeq: Avail SD to : 200+ First Avail. SD 9 11 Dist. From (ft): Stop Sign: 31 Stop Bar: 30 Edge of Shoulder: Crash History (5 year): 1 Rear End, 3 Angle Pavement History: Heavy Bituminous Wearing Course Volume: Main Road: SR ADT Crossing Road: Ninth St 6800 ADT "" on Pavement "AT WHITE LINE" sign Type of Improvement: X X Numerical Increase/Decrease R: Right Turn S: Senior Time Required to Complete Gender of Driver Driver Age Group 0-5 Ft Ft Ft Ft Ft. Count Ft. 30+ Ft. Average / Percent % Median % Increase/Decrease R: Right Turn Time Required to Complete S: Senior Gender of Driver Driver Age Group 0-5 Ft Ft Ft Ft Ft Ft. Count % % % % % 50.00% 44.92% % 53.73% % % #DIV/0! 30+ Ft. Average / Percent 64.12% % % % % % 85% Median
99 Intersection Name: 431 SR: SR 322 & SR 144 Type: Stop Bar, High Speed, No Sight Obstruction Municipality: Potter County: Centre Date of Observations: Weather Conditions: Left Right Stopping Posted Speed Limits: Approach Grade: -6% 3% Is SD Adequate: yes yes yes How Far to Adeq: Avail SD to : 300 First Avail. SD Stop Sign: Stop Bar: Edge of Shoulder: Dist. From (ft): 20 Crash History (5 year): 6 Angle, 1 Sideswipe, 1 Head On Pavement History: SR Bituminous Wearing Course SR Bituminous Wearing Course Volume: Main Road: SR ADT Crossing Road: SR ADT 9 "" on Pavement "AT WHITE LINE" sign Type of Improvement: X X Numerical Increase/Decrease R: Right Turn S: Senior Time Required to Complete Gender of Driver Driver Age Group 0-5 Ft Ft Ft Ft Ft Ft. 30+ Ft. Count Average / Percent % Median % Increase/Decrease R: Right Turn Time Required to Complete S: Senior Gender of Driver Driver Age Group 0-5 Ft Ft Ft Ft Ft Ft. Count % % % 10.32% % 82.22% % % % #DIV/0! 30+ Ft. Average / Percent % % % -8.43% 14.38% 85% Median
100 Intersection Name: 432 SR: SR 45 & T 718 Type: Stop Bar, High Speed, No Sight Obstruction Municipality: Harris County: Centre Date of Observations: Weather Conditions: Left Right Stopping Posted Speed Limits: Approach Grade: 0% 0% Is SD Adequate: yes yes yes How Far to Adeq: Avail SD to : 300+ First Avail. SD Dist. From (ft): Stop Sign: 22 Stop Bar: 20 Edge of Shoulder: 4 Crash History (5 year): 1 Rear End Pavement History: Resurfacing- Bituminous Wearing Course Volume: Main Road: SR ADT Crossing Road: T ADT "" on Pavement "AT WHITE LINE" sign Type of Improvement: X Numerical Increase/Decrease R: Right Turn S: Senior Time Required to Complete Gender of Driver Driver Age Group 0-5 Ft Ft Ft Ft Ft. Count Ft. 30+ Ft. Average / Percent % Median % Increase/Decrease R: Right Turn Time Required to Complete S: Senior Gender of Driver Driver Age Group 0-5 Ft Ft. Count % 0.00% 23.53% -4.82% % 27.78% % 0.00% Ft Ft Ft Ft. 30+ Ft. Average / Percent % % % % 8.89% 85% Median
101 Intersection Name: 441 SR: SR 45 & T 845 Type: Stop Bar, High Speed, Sight Obstruction Municipality: Harris County: Centre Date of Observations: Weather Conditions: Left Right Stopping Posted Speed Limits: Approach Grade: -4% 5% Is SD Adequate: yes yes yes How Far to Adeq: Avail SD to : 300+ First Avail. SD Dist. From (ft): Stop Sign: 23 Stop Bar: 22 Edge of Shoulder: 4 Crash History (5 year): No Crashes Pavement History: Resurfacing- Bituminous Wearing Course Volume: Main Road: SR ADT Crossing Road: T ADT "" on Pavement "AT WHITE LINE" sign Type of Improvement: X Numerical Increase/Decrease R: Right Turn S: Senior Time Required to Complete Gender of Driver Driver Age Group 0-5 Ft Ft Ft Ft Ft. Count Ft. 30+ Ft. Average / Percent % Median % Increase/Decrease R: Right Turn Time Required to Complete S: Senior Gender of Driver Driver Age Group 0-5 Ft Ft Ft Ft Ft Ft. Count 25.00% % % 0.00% -4.60% 3.54% % % % % #DIV/0! 30+ Ft. Average / Percent % % % % % 85% Median
102 Intersection Name: 442 SR: SR 45 & T 354 Type: Stop Bar, High Speed, Sight Obstruction Municipality: Harris County: Centre Date of Observations: Weather Conditions: Left Right Stopping Posted Speed Limits: Approach Grade: -1% 1% Is SD Adequate: yes yes NO How Far to Adeq: Avail SD to : 125 First Avail. SD 13 N/A Dist. From (ft): Stop Sign: 20 Stop Bar: 18 Edge of Shoulder: 3 Crash History (5 year): No Crashes Pavement History: Resurfacing- Bituminous Wearing Course Volume: Main Road: SR ADT Crossing Road: T ADT "" on Pavement "AT WHITE LINE" sign Type of Improvement: X Numerical Increase/Decrease R: Right Turn S: Senior Time Required to Complete Gender of Driver Driver Age Group 0-5 Ft Ft Ft Ft Ft. Count Ft. 30+ Ft. Average / Percent % Median % Increase/Decrease R: Right Turn Time Required to Complete S: Senior Gender of Driver Driver Age Group 0-5 Ft Ft. Count % % % 12.90% -1.79% 12.50% % % #DIV/0! Ft Ft Ft Ft. 30+ Ft. Average / Percent 12.66% % % % % 85% Median
103 Appendix C Visual Analysis Diagrams 99
104
105
106
107
108
109
110
111
112 Appendix D Analysis of the Effect of Age 108
113 "" on Pavement "AT WHITE LINE" Sign "" on Pavement & "AT WHITE LINE" Sign Overall Before/After by Type of Improvement Comparison of Age ROLLING (Phase I) ROLLING (Phase II) % of ROLLING S (Phase I) (Phase II) % of S Edge of Road (Phase I) Edge of Road (Phase II) (Feet) Youth 14.3% 19.3% 5.0% 2.5% 0.0% -2.5% Experienced 10.7% 11.6% 0.8% 1.7% 0.6% -1.2% Senior 9.2% 4.1% -5.1% 0.0% 0.0% 0.0% Youth 10.2% 11.7% 1.5% 3.6% 1.7% -1.9% Experienced 8.4% 9.5% 1.1% 0.0% 0.3% 0.3% Senior 3.0% 3.6% 0.6% 0.0% 0.0% 0.0% Youth 13.3% 11.1% -2.2% 9.1% 1.2% -7.9% Experienced 10.7% 8.1% -2.5% 4.0% 0.8% -3.1% Senior 7.3% 5.7% -1.6% 2.8% 0.5% -2.3% Youth 12.9% 14.3% 1.4% 4.6% 0.9% -3.7% Experienced 10.2% 9.6% -0.6% 2.0% 0.6% -1.4% Senior 6.7% 4.3% -2.4% 1.0% 0.1% -0.9%
114 Appendix E Analysis of the Effect of Gender 110
115 "" on Pavement "AT WHITE LINE" Sign "" on Pavement & "AT WHITE LINE" Sign Overall Before/After by Type of Improvement Comparison of Gender ROLLING (Phase I) ROLLING (Phase II) % of ROLLING S (Phase I) (Phase II) % of S Edge of Road (Phase I) Edge of Road (Phase II) (Feet) Male 11.7% 11.4% -0.3% 1.6% 0.5% -1.2% Female 10.1% 13.5% 3.3% 1.6% 0.4% -1.3% Male 7.4% 8.8% 1.3% 1.0% 0.5% -0.5% Female 12.1% 13.6% 1.5% 0.0% 0.0% 0.0% Male 11.9% 8.1% -3.8% 4.8% 0.8% -4.0% Female 8.4% 13.3% 4.9% 4.3% 1.4% -3.0% Male 10.6% 9.3% -1.3% 2.3% 0.6% -1.7% Female 10.2% 13.5% 3.3% 1.9% 0.6% -1.4%
116 Appendix F Analysis of the Effect of Speed 112
117 25 MPH 35 MPH 40 MPH 45 MPH 55 MPH Before/After by Type of Improvement Comparison of Speed ROLLING (Phase I) ROLLING (Phase II) % of ROLLING S (Phase I) (Phase II) % of S Edge of Road (Phase I) Edge of Road (Phase II) (Feet) % 3.5% -2.0% 0.0% 0.5% 0.5% % 4.0% -10.5% 0.0% 0.0% 0.0% % 0.5% -7.5% 1.0% 0.0% -1.0% % 1.5% -14.5% 1.0% 0.5% -0.5% % 2.5% -3.5% 3.0% 0.0% -3.0% % 2.0% -3.0% 0.5% 0.0% -0.5% % 4.5% -8.0% 5.5% 1.0% -4.5% % 24.5% 13.0% 17.0% 4.0% -13.0% % 10.5% 0.5% 2.0% 2.5% 0.5% % 3.5% -9.5% 2.0% 0.5% -1.5% % 5.5% -11.5% 0.5% 0.0% -0.5% % 12.5% -4.0% 0.0% 0.0% 0.0% % 20.9% 9.9% 0.0% 0.0% 0.0% % 0.0% % 10.0% 6.5% 0.0% 0.0% 0.0% % 20.3% 12.8% 0.5% 0.0% -0.5% % 12.5% 5.5% 0.0% 0.5% 0.5% % 9.5% 2.0% 3.5% 1.5% -2.0% % 7.5% -10.0% 4.5% 0.5% -4.0% % 15.0% 1.0% 0.0% 0.0% 0.0% % 17.5% 3.5% 1.0% 0.0% -1.0% % 1.0% -5.5% 0.0% 0.0% 0.0% % 12.4% 9.9% 0.5% 0.6% 0.1% % 9.5% -7.0% 9.0% 0.0% -9.0%
118 Appendix G Phase I Only Intersection Reports 114
119 122-S.R & S.R. 3030: Centre County- S.R is the major road with an ADT of 350 vehicles and S.R is the stopping road with an ADT of 450 vehicles. If drivers are stopped at the stop sign, corner sight distance to the left is obstructed by a row of trees. The sight distance to the right is proper. The posted speed limit on S.R is 40 miles per hour and is 35 miles per hour on S.R The review of the crash history indicated that there were no crashes in the past five years at this intersection. Pavement history indicates that S.R was resurfaced in Low volumes on the main road made it easier for drivers on the stopped approach as the gaps in traffic were often in terms of minutes, providing plenty of time for navigation of the intersection. There were no specific recommendations made in Phase I for improvement at this intersection due to the observed driving habits, low volumes, and lack of crash activity. This intersection was not chosen for Phase II. The following table illustrates pertinent data from Phase I observations: Average Stopping Edge of Roadway (Feet) Phase I 7.50 Table 6 Intersection 122 Average Number of Times Looked in Each Direction 1.5L 1.5R Maneuver (L T R) Time Required to Complete Movement (Seconds) % of That Performed a Rolling Stop % of That Did Not Stop L Phase II Notes: L = left, T = through, R = right 131-T-919 & S.R. 2001: Clearfield County- S.R is the major road with an ADT of 250 vehicles and T-919 is the stopping approach with an ADT of 200 vehicles. Corner sight distances and the stopping sight distance are all adequate. The speed limit on S.R is 45 miles per hour and is 25 miles per hour on T There have been no crashes at this intersection in the past five years. The roads were resurfaced in Low volumes on both roads made it difficult to find situations where drivers had to perform the task of gap acceptance/rejection before proceeding. Due to the observed driver behavior and the absence of crashes, recommendations for improvement were not deemed necessary for this intersection in Phase I. Despite these favorable conditions, it was decided that the word would be painted on the pavement at this intersection for the second phase of
120 observations. A paving project delayed the implementation of this improvement, however, and this intersection could not be studied for Phase II. The following table illustrates pertinent data from Phase I observations: Table 7 Intersection 131 Average Stopping Edge of Roadway (Feet) Average Number of Times Looked in Each Direction Maneuver (L T R) Time Required to Complete Movement (Seconds) % of That Performed a Rolling Stop % of That Did Not Stop Phase I L 1R L Phase II Notes: L = left, T = through, R = right 132-S.R & S.R. 2017: Clearfield County- S.R is the major road with an ADT of 350 vehicles and S.R is the stopping approach with an ADT of 100 vehicles. Sight distances approaching the stop sign in each direction are proper. The speed limit on S.R is 45 miles per hour and on is 35 miles per hour S.R Upon reviewing the crash history, it was found that no crashes had occurred in the past five (5) years at this intersection. The roadway was resurfaced in Due to the low volumes on the intersecting roads, the drivers observed did not need to make a judgment on gaps in oncoming traffic. Due to the observed driving habits, the crash history, and the intersection geometry, no need for improvements was specified in Phase I. The location was not chosen for Phase II, but the following table illustrates pertinent data from Phase I observations: Table 8 Intersection 132 Average Stopping Edge of Roadway (Feet) Average Number of Times Looked in Each Direction Maneuver (L T R) Time Required to Complete Movement (Seconds) % of That Performed a Rolling Stop % of That Did Not Stop Phase I L 1R R Phase II Notes: L = left, T = through, R = right
121 212-S.R & S.R. 2018: Centre County- S.R is the major roadway with an ADT of 750 vehicles and S.R is the stopping approach with 250 vehicles. The sight distance is proper at the approach. The speed limit on the mainline is 35 miles per hour and the speed limit on the stopping approach is 25 miles per hour. There were no crashes at this intersection. S.R was last resurfaced in 1989 and S.R in The average gap in traffic on S.R was seconds. Based on observations, no improvements were specified during Phase I at this intersection. The location was not chosen for Phase II. The following table illustrates pertinent data from Phase I observations: Table 12 Intersection 212 Average Stopping Edge of Roadway (Feet) Average Number of Times Looked in Each Direction Maneuver (L T R) Time Required to Complete Movement (Seconds) % of That Performed a Rolling Stop % of That Did Not Stop Phase I L 0.5R R Phase II Notes: L = left, T = through, R = right 241-S.R & S.R. 1010: Clearfield County- S.R is the major road with an ADT of 6,100 vehicles and S.R is the stopping road with an ADT of 2,000 vehicles. The proper corner sight distance to the left is obstructed by bushes and some rock piles only if the driver stops at the stop sign. The corner sight distance to the right and the stopping sight distance are proper. The speed limit is 45 miles per hour on S.R and 35 miles per hour on S.R There were two (2) relevant crashes at this intersection. One (1) of them placed fault on a driver pulling into traffic on S.R from S.R S.R and S.R were resurfaced in 1993 and 1999 respectively. The average accepted gap time was seconds. After studying the intersection geometry and driver behavior it was recommended in Phase I that a dashed edge-line be placed along S.R in order to encourage drivers to pull up closer to the intersection, providing additional sight distance and safer advancement into traffic. This intersection was not included in Phase II though, so it can not be certain that this edge-line was indeed painted. The following table illustrates pertinent data from Phase I observations:
122 Average Stopping Edge of Roadway (Feet) Table 17 Intersection 241 Average Number of Times Looked in Each Direction Maneuver (L T R) Time Required to Complete Movement (Seconds) % of That Performed a Rolling Stop % of That Did Not Stop Phase I L 1.5R R Phase II Notes: L = left, T = through, R = right 321-S.R & S.R. 3003: Centre County- S.R is the main road with an ADT of 3,000 vehicles and S.R is the stopping road with an ADT of 3,600 vehicles. Bushes and trees obstruct the proper corner sight distance in both directions only if drivers stop at the stop sign. The stopping sight distance is proper. The speed limit on S.R is 35 miles per hour and on S.R it is 40 miles per hour. One (1) crash occurred at this intersection in the past five (5) years and that crash was a driver hitting a fixed object due to drowsiness. S.R was last resurfaced in 1987 and S.R was last resurfaced in The average accepted gap time was 13.3 seconds. Even though there was no crash history, the removal of the trees and bushes were mentioned as possible improvements in Phase I in order to provide for additional visibility. The completion of this suggestion could not be confirmed though, because this intersection was not chosen for Phase II. The following table illustrates pertinent data from Phase I observations: Table 21 Intersection 321 Average Stopping Edge of Roadway (Feet) Average Number of Times Looked in Each Direction Maneuver (L T R) Time Required to Complete Movement (Seconds) % of That Performed a Rolling Stop % of That Did Not Stop Phase I L 1R R Phase II Notes: L = left, T = through, R = right 332-S.R & S.R. 1002: Centre County- S.R is the major road with an ADT of 4,400 vehicles and S.R is the stopping road with an ADT of 600 vehicles. The corner sight distances as well as the stopping sight distance are
123 proper. The speed limit is 55 miles per hour on S.R and 35 miles per hour on S.R There were two (2) crashes that occurred--both angle collisions. The drivers pulled out in front of traffic on S.R S.R was resurfaced in 2000 and S.R was resurfaced in The average length of accepted gaps was seconds. Due to the intersection geometry and an uphill grade from S.R onto S.R. 0150, it was difficult for driver s to see the dashed edge-line along S.R It was recommended in Phase I that a thicker dashed edge-line be painted along S.R in order for drivers to more easily be able to see it and encourage drivers to stop closer to the intersection. The completion of this can not be confirmed since the location was not chosen for Phase II. The following table illustrates pertinent data from Phase I observations: Average Stopping Edge of Roadway (Feet) Phase I Table 24 Intersection 332 Average Number of Times Looked in Each Direction 1.5L 1.5R Maneuver (L T R) Time Required to Complete Movement (Seconds) % of That Performed a Rolling Stop % of That Did Not Stop L Phase II Notes: L = left, T = through, R = right 411-S.R & Fourth Street: Clearfield County- S.R is the major road with an ADT of 5,200 vehicles and Fourth Street is the stopping road with an ADT of 500 vehicles. All sight distances are proper. The speed limit on Fourth Street and S.R is 25 miles per hour. Two (2) crashes occurred at this intersection. They were both angle collisions occurring due to the driver not stopping on the Fourth Street approach. Both of the roads were resurfaced in The average length of accepted gaps was seconds. The crash analysis and driver habits did not justify any specific improvements at the intersection during Phase I and it was not chosen to be observed for Phase II. The following table illustrates pertinent data from Phase I observations:
124 Average Stopping Edge of Roadway (Feet) Table 27 Intersection 411 Average Number of Times Looked in Each Direction Maneuver (L T R) Time Required to Complete Movement (Seconds) % of That Performed a Rolling Stop % of That Did Not Stop Phase I L 1.5R R Phase II Notes: L = left, T = through, R = right 422-S.R & T-334: Centre County- S.R is the major road with an ADT of 10,000 vehicles and T-334 is the stopping approach with an ADT of 500 vehicles. Houses built close to the road make it difficult to obtain proper corner sight distance to the left; only if drivers stop at the stop sign and to the right there is proper sight distance. Stopping sight distance is proper. The speed limit on all approaches is 25 miles per hour. One (1) relevant crash occurred as a result of improper turning from the stopped approach and resulted in an angle collision. Both roads were resurfaced in The averaged accepted gap time was just over ten (10) seconds. Due to observed driving behavior and the lack of a crash history at this intersection, no recommendations for improvements were made in Phase I. The intersection was not chosen for Phase II, but the following table illustrates pertinent data from Phase I observations: Table 30 Intersection 422 Average Stopping Edge of Roadway (Feet) Average Number of Times Looked in Each Direction Maneuver (L T R) Time Required to Complete Movement (Seconds) % of That Performed a Rolling Stop % of That Did Not Stop Phase I L 1R R Phase II Notes: L = left, T = through, R = right
125 Appendix H Phase I Low-Cost Improvement Diagrams 121
126
127
128
129
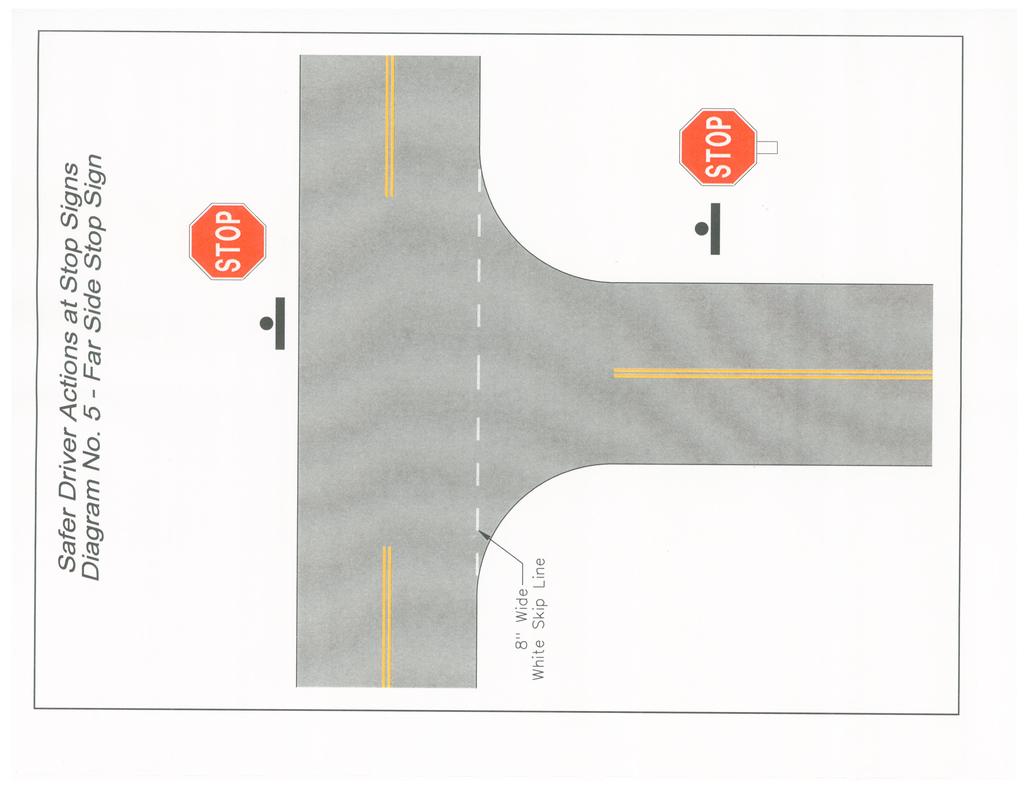
130
131
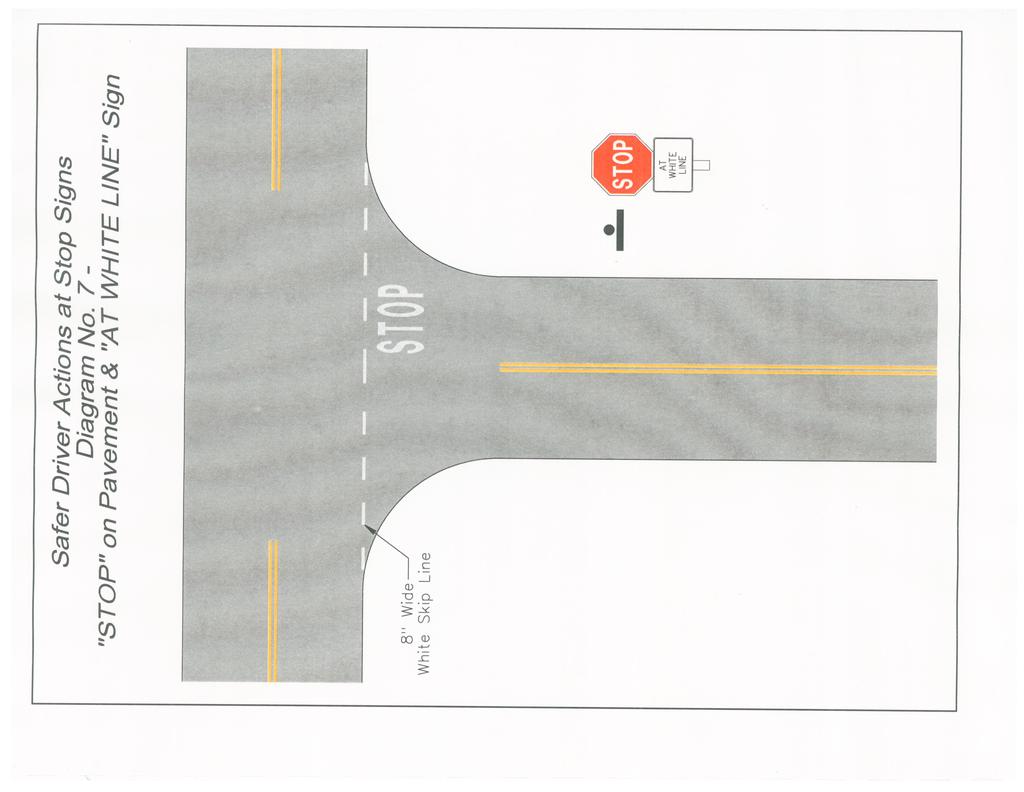
132
Access Location, Spacing, Turn Lanes, and Medians
 Design Manual Chapter 5 - Roadway Design 5L - Access Management 5L-3 Access Location, Spacing, Turn Lanes, and Medians This section addresses access location, spacing, turn lane and median needs, including
CROSSING GUARD PLACEMENT CONSIDERATIONS AND GAP ASSESSMENT
 CROSSING GUARD PLACEMENT CONSIDERATIONS AND GAP ASSESSMENT Many factors contribute to the need for a Crossing Guard. General federal guidance, provided by the FHWA MUTCD, states that adult crossing guards
Chapter Twenty-eight SIGHT DISTANCE BUREAU OF LOCAL ROADS AND STREETS MANUAL
 Chapter Twenty-eight SIGHT DISTANCE BUREAU OF LOCAL ROADS AND STREETS MANUAL Jan 2006 SIGHT DISTANCE 28(i) Chapter Twenty-eight SIGHT DISTANCE Table of Contents Section Page 28-1 STOPPING SIGHT DISTANCE
GUIDELINES FOR USING DECISION SIGHT DISTANCE AT IGNALIZED INTERSECTIONS NEAR VERTICAL CURVES
 1. Report No. FHWA/TX-05/0-4084-P2 4. Title and Subtitle 2. Government Accession No. 3. Recipient's Catalog No. GUIDELINES FOR USING DECISION SIGHT DISTANCE AT IGNALIZED INTERSECTIONS NEAR VERTICAL CURVES
Abstract. Background. protected/permissive operation. Source: Google Streetview, Fairview/Orchard intersection
 ITE 2015 Western District Annual Meeting Ada County Highway District s Flashing Yellow Arrow Initiative Primary Author: Tim Curns, PE Ada County Highway District Traffic Engineer Author: Andrew Cibor,
CHAPTER 1 STANDARD PRACTICES
 CHAPTER 1 STANDARD PRACTICES OBJECTIVES 1) Functions and Limitations 2) Standardization of Application 3) Materials 4) Colors 5) Widths and Patterns of Longitudinal Pavement Marking Lines 6) General Principles
133 rd Street and 132 nd /Hemlock Street 132 nd Street and Foster Street MINI ROUNDABOUTS. Overland Park, Kansas
 133 rd Street and 132 nd /Hemlock Street 132 nd Street and Foster Street MINI ROUNDABOUTS Overland Park, Kansas September 1, 2017 TABLE OF CONTENTS 1. INTRODUCTION... 1 2. LITERATURE REVIEW... 1 3. CONCEPT
Railroad Inspection Procedure Manual
 Railroad Inspection Procedure Manual Railroad Inspection Procedure Manual Table of Contents Introduction... 1 Inspection Report t For orm... 3 Instructions for Completing Inspection Report t For orms...
Hidden Oaks Elementary School
 Hidden Oaks Elementary School SCHOOL ROUTE PLAN For HIDDEN OAKS ELEMENTARY SCHOOL LOCATION 13 ORANGE COUNTY Prepared for: ORANGE COUNTY SCHOOL ASSESSMENT PROGRAM ORANGE COUNTY PUBLIC WORKS Traffic Engineering
Windy Ridge Elementary School
 Windy Ridge Elementary School SCHOOL ROUTE PLAN For WINDY RIDGE ELEMENTARY SCHOOL LOCATION 54 ORANGE COUNTY Prepared for: ORANGE COUNTY SCHOOL ASSESSMENT PROGRAM ORANGE COUNTY PUBLIC WORKS Traffic Engineering
WEST AVENUE AND NEW ROAD TRAFFIC STUDY PART III WEST AVENUE CLOSURE ALTERNATIVES ANALYSIS
 WEST AVENUE AND NEW ROAD TRAFFIC STUDY PART III WEST AVENUE CLOSURE ALTERNATIVES ANALYSIS CITY OF LINWOOD ATLANTIC COUNTY, NEW JERSEY March 30, 2006 PREPARED FOR: City of Linwood 400 Poplar Avenue Linwood,
Glenn Avenue Corridor Traffic Operational Evaluation
 Glenn Avenue Corridor Traffic Operational Evaluation PREPARED FOR: THE CITY OF AUBURN PREPARED BY: DECEMBER 2007 Glenn Avenue Corridor Study--Auburn, Alabama TABLE OF CONTENTS Introduction... 1 Background
Chapter 4 TOOLBOX AND SAMPLE BIKE BOULEVARD LAYOUT
 Chapter 4 TOOLBOX AND SAMPLE BIKE BOULEVARD LAYOUT OVERVIEW This chapter describes a cohesive set of strategies to create a bicycle boulevard, namely to make streets safer and more efficient for bicycle
Date: 09/22/2016 Subject: To: From: PennDOT Engineering District 5-0. Dear Applicant,
 Date: 09/22/2016 Subject: Highway Occupancy Permit Application No. 112807 Returned For Revisions To: Wal-Mart Real Estate Business Trust 2001 SE 10th Street Bentonville, AR 72716 From: PennDOT Engineering
Traffic Signal Redesign 50% Design Report
 Traffic Signal Redesign 50% Design Report Joseph Davis, Jace Elkins, Jordan Weyrauch and Zach Crimmins CENE 486 Capstone J3Z Engineering March 10 th, 2016 Table of Contents 1.0 Project Description...1
Turn Lane Warrants: Concepts, Standards, Application in Review
 Turn Lane Warrants: Concepts, Standards, Application in Review David J. DeBaie P.E., P.T.O.E. 2004 ITE, District 1 Annual Meeting Burlington, Vermont Introduction Turning lanes at intersections reduce
PEDESTRIAN SAFETY IMPROVEMENT EVALUATION GUIDELINE FOR UNCONTROLLED CROSSINGS
 PEDESTRIAN SAFETY IMPROVEMENT EVALUATION GUIDELINE FOR UNCONTROLLED CROSSINGS Traffic Safety Engineering Division Updated: April 2018 EXECUTIVE SUMMARY NDOT Traffic Safety Engineering Division developed
Transportation Impact Study for Abington Terrace
 Transportation Impact Study for Abington Terrace Abington Township, Montgomery County, PA Sandy A. Koza, P.E., PTOE PA PE License Number PE059911 Prepared by McMahon Associates, Inc. 425 Commerce Drive,
SCHOOL ROUTE PLAN. For HUNTER S CREEK ELEMENTARY SCHOOL LOCATION 14 ORANGE COUNTY. Prepared for:
 SCHOOL ROUTE PLAN For HUNTER S CREEK ELEMENTARY SCHOOL LOCATION 14 ORANGE COUNTY Prepared for: ORANGE COUNTY SCHOOL ASSESSMENT PROGRAM ORANGE COUNTY PUBLIC WORKS Traffic Engineering Division 42 South John
THE FUTURE OF THE TxDOT ROADWAY DESIGN MANUAL
 THE FUTURE OF THE TXDOT ROADWAY DESIGN MANUAL Kenneth Mora, P.E. (Design Division) 10/10/2017 Table of contents 1 2 Reduction in FHWA design controlling criteria Innovative Intersection Guidance 3-7 8-42
Grade Separated Intersection
 Grade Separated Intersection Lecture Notes in Transportation Systems Engineering Prof. Tom V. Mathew Contents 1 Overview 1 2 Classification of Intersection 2 2.1 Grade Separated Intersection...........................
DEPARTMENT OF ENVIRONMENTAL SERVICES. North Harrison Street (Lee Highway to Little Falls Road) Comparative Analysis. Prepared for:
 Comparative Analysis. Prepared for:") DEPARTMENT OF ENVIRONMENTAL SERVICES North Harrison Street (Lee Highway to Little Falls Road) Comparative Analysis Prepared for: Arlington County Department of Environmental Services 2100 Clarendon Boulevard,
DEPARTMENT OF ENVIRONMENTAL SERVICES North Harrison Street (Lee Highway to Little Falls Road) Comparative Analysis Prepared for: Arlington County Department of Environmental Services 2100 Clarendon Boulevard,
Table of Contents. I. Introduction 1. II. Elements of the School Crossing Program 1
 Table of Contents Page I. Introduction 1 II. Elements of the School Crossing Program 1 a. Identifying Locations Where School Crossing Guards are Needed 1 b. The Role of the School Crossing Guard 1 c. Hiring
Attachment No. 13. National Committee on Uniform Traffic Control Devices RWSTC RECOMMENDATION FOLLOWING SPONSOR COMMENTS
 1 2 3 4 Attachment No. 13 5 6 7 8 9 10 11 12 13 14 15 16 17 18 19 20 21 22 23 24 25 26 27 28 29 30 31 32 33 34 35 36 37 38 39 40 41 42 43 RWSTC agenda item IV. 2 June 2011 National Committee on Uniform
Lake Whitney Elementary School
 Lake Whitney Elementary School SCHOOL ROUTE PLAN For LAKE WHITNEY ELEMENTARY SCHOOL LOCATION 18 ORANGE COUNTY Prepared for: ORANGE COUNTY SCHOOL ASSESSMENT PROGRAM ORANGE COUNTY PUBLIC WORKS Traffic Engineering
Safety Assessment of Installing Traffic Signals at High-Speed Expressway Intersections
 Safety Assessment of Installing Traffic Signals at High-Speed Expressway Intersections Todd Knox Center for Transportation Research and Education Iowa State University 2901 South Loop Drive, Suite 3100
EVALUATION OF HAWK SIGNAL AT GEORGIA AVENUE AND HEMLOCK STREET, NW IN THE DISTRICT OF COLUMBIA FINAL REPORT. August 30, 2010
 EVALUATION OF HAWK SIGNAL AT GEORGIA AVENUE AND HEMLOCK STREET, NW IN THE DISTRICT OF COLUMBIA FINAL REPORT August 30, 2010 Submitted to: Mr. George Branyan Pedestrian Program Manager Policy, Planning
ENGINEER S PRELIMINARY REPORT. for the #######-###### COLLISION
 ENGINEER S PRELIMINARY REPORT for the #######-###### COLLISION By: Lance E. Robson, P.E. October 3, 2005 1 INVESTIGATION OF THE #######-###### COLLISION ENGINEER S PRELIMINARY REPORT October 3, 2005 ---------------------------------------------------------------------------------------------------------------
A Traffic Operations Method for Assessing Automobile and Bicycle Shared Roadways
 A Traffic Operations Method for Assessing Automobile and Bicycle Shared Roadways A Thesis Proposal By James A. Robertson Submitted to the Office of Graduate Studies Texas A&M University in partial fulfillment
Addendum to SDDCTEA Pamphlet 55 17: Better Military Traffic Engineering Revision 1 Effective: 24 Aug Crosswalk Guidelines
 Addendum to SDDCTEA Pamphlet 55 17: Better Military Traffic Engineering Revision 1 Effective: 24 Aug 2017 Crosswalk Guidelines Warrants for Uncontrolled Crosswalk Locations Crosswalks at Midblock Locations
Act 47 Exception Application Process (Permitting Bicycle Travel on Freeways)
") Act 47 Exception Application Process (Permitting Bicycle Travel on Freeways) Attached is a revised application process to permit Pedalcycle travel on the shoulders of freeways within the Commonwealth.
Act 47 Exception Application Process (Permitting Bicycle Travel on Freeways) Attached is a revised application process to permit Pedalcycle travel on the shoulders of freeways within the Commonwealth.
Broad Street Bicycle Boulevard Design Guidelines
 Broad Street Bicycle Boulevard Design Guidelines Building from the strategies introduced in the 2013 Bicycle Transportation Plan and community input received thus far, City Transportation Staff have identified
Appendix A. Knoxville TPO Greenway Signage Guidelines. Appendix A: Knoxville TPO Greenway Signage Guidelines Knox to Oak Ridge Greenway Master Plan
 Appendix A Knoxville TPO Greenway Signage Guidelines 75 Overview: Adequate signing and marking are essential on shared-use paths, especially to alert bicyclists to potential conflicts and to convey regulatory
ALLEY 24 TRAFFIC STUDY
 ALLEY 24 TRAFFIC STUDY in City of Frostburg, Maryland January 2013 3566 Teays Valley Road Hurricane, WV Office: (304) 397-5508 www.denniscorporation.com Alley 24 Traffic Study January 2013 Frostburg, Maryland
US Hwy. 64/264 Pedestrian Crossing at the Little Bridge Alternatives Analysis Public Meeting
 Town of Nags Head US Hwy. 64/264 Pedestrian Crossing at the Little Bridge Alternatives Analysis Public Meeting Prepared by: Department of Public Works August 8, 2013 Where traffic-control signals are not
TRAFFIC CALMING PLANNER S PORTFOLIO
 TRAFFIC CALMING PLANNER S PORTFOLIO ISSUE 8 January 2017 PLANNER S PORTFOLIO TRAFFIC CALMING 1 OVERVIEW 2 3 4 ENGINEERED TRAFFIC CALMING MEASURES SIGNS AND PAVEMENT MARKINGS EMERGENCY RESPONSE DELAYS 5
The Corporation of the City of Sarnia. School Crossing Guard Warrant Policy
 The Corporation of the City of Sarnia School Crossing Guard Warrant Policy Table of Contents Overview And Description... 2 Role of the School Crossing Guard... 2 Definition of a Designated School Crossing...
FORM A PASCO COUNTY ACCESS CONNECTION PERMIT APPLICATION
 FORM 901.3.A PASCO COUNTY ACCESS CONNECTION PERMIT APPLICATION The following information is required from all applicants directly or indirectly accessing any collector or arterial road or as otherwise
Town of Mooresville, North Carolina Neighborhood Traffic Calming and Control Device Policy
 Town of Mooresville, North Carolina Neighborhood Traffic Calming and Control Device Policy Adopted January 6, 2014 Town of Mooresville Development Services Department TOWN OF MOORESVILLE NEIGHBORHOOD TRAFFIC
Intersection Safety 6/7/2015 INTERSECTIONS. Five basic elements should be considered in intersection design. Intersection Safety (continued)
") Intersection Safety S. M. SOHEL MAHMUD Assistant Professor Accident Research Institute (ARI), Bangladesh University of Engineering and Technology (BUET) Dhaka-1000, Bangladesh 1 Outline of the Presentation
Intersection Safety S. M. SOHEL MAHMUD Assistant Professor Accident Research Institute (ARI), Bangladesh University of Engineering and Technology (BUET) Dhaka-1000, Bangladesh 1 Outline of the Presentation
2014 FHWA Aging Road User Handbook. Recommendations to Accommodate Aging Pedestrians. Lifesaver National Conference. What is the Handbook?
 2014 FHWA Aging Road User Handbook Recommendations to Accommodate Aging Pedestrians Lifesaver National Conference March 17, 2015 Revised June 2014 1 What is the Handbook? 1998 1st Edition 2001 2nd Edition
Pavement Markings (1 of 3)
") Pavement Markings (1 of 3) DESCRIPTION AND DEFINITION Disadvantages Relatively high cost (over typical Crash reduction as yet unknown painted edge line) No tactile effect The STOP AHEAD pavement marking
Pavement Markings (1 of 3) DESCRIPTION AND DEFINITION Disadvantages Relatively high cost (over typical Crash reduction as yet unknown painted edge line) No tactile effect The STOP AHEAD pavement marking
Document 2 - City of Ottawa Pedestrian Crossover (PXO) Program
 Program") 40 Document 2 - City of Ottawa Pedestrian Crossover (PXO) Program OVERVIEW The City of Ottawa Pedestrian Crossover (PXO) Program provides the basis for PXO implementation in Ottawa. The program s processes
40 Document 2 - City of Ottawa Pedestrian Crossover (PXO) Program OVERVIEW The City of Ottawa Pedestrian Crossover (PXO) Program provides the basis for PXO implementation in Ottawa. The program s processes
Traffic Impact Study. Westlake Elementary School Westlake, Ohio. TMS Engineers, Inc. June 5, 2017
 TMS Engineers, Inc. Traffic Impact Study Westlake Elementary School Westlake, Ohio June 5, 2017 Prepared for: Westlake City Schools - Board of Education 27200 Hilliard Boulevard Westlake, OH 44145 TRAFFIC
PLACEMENT OF SIGNS RECOMMENDED PRACTICES SUB-SECTION
 Page 1 of 6 RECOMMENDED PRACTICES PART SECTION SUB-SECTION HIGHWAY SIGNS GENERAL General Proper positioning of signs is an important element in the overall control of traffic within a roadway network.
TRAFFIC IMPACT STUDY And A TRAFFIC SIGNAL WARRANT ANALYSIS FOR A SENIOR LIVING AND APARTMENT DEVELOPMENT
 TRAFFIC IMPACT STUDY And A TRAFFIC SIGNAL WARRANT ANALYSIS FOR A SENIOR LIVING AND APARTMENT DEVELOPMENT DEERFIELD TOWNSHIP, WARREN COUNTY, OHIO Nantucket Circle and Montgomery Road () Prepared for: ODLE
Orange Center Elementary School
 Drag and drop pic and stretch/crop to the limits of the blue rectangle (delete this text box) Orange Center Elementary School Drag and drop pic and stretch/crop to the limits of the blue rectangle (delete
Chapter 5 DATA COLLECTION FOR TRANSPORTATION SAFETY STUDIES
 Chapter 5 DATA COLLECTION FOR TRANSPORTATION SAFETY STUDIES 5.1 PURPOSE (1) The purpose of the Traffic Safety Studies chapter is to provide guidance on the data collection requirements for conducting a
Appendix C. Bicycle Route Signage
 Appendix C Bicycle Route Signage This page intentionally left blank. APPENDIX C - BICYCLE ROUTE AND WAYFINDING SIGNAGE Bicycle route signs are wayfinding signs that guide bicyclists along preferred, designated
City of Albert Lea Policy and Procedure Manual 4.10 ALBERT LEA CROSSWALK POLICY
 4.10 ALBERT LEA CROSSWALK POLICY PURPOSE: Pedestrian crosswalks are an integral part of our transportation infrastructure. To be effective and promote safety, marked crosswalks must be installed after
Proposed changes to Massachusetts MUTCD Supplement
 Proposed changes to Massachusetts MUTCD Supplement John F. Carr National Motorists Association October 24, 2002 This document contains recommendations as to the contents of the Massachusetts MUTCD supplement
TOWN OF CHAPEL HILL POLICY AND PROCEDURES FOR TRAFFIC CALMING MEASURES
 TOWN OF CHAPEL HILL POLICY AND PROCEDURES FOR TRAFFIC CALMING MEASURES (Adopted by the Town Council on June 30, 2004) (Revised December 6, 2010) (Revised February 8, 2016) POLICY AND PROCEDURES FOR TRAFFIC
Texas Transportation Institute The Texas A&M University System College Station, Texas
 1. Report No. FHWA/TX-05/0-4084-P1 4. Title and Subtitle GUIDELINES FOR THE USE OF COUNTERMEASURES TO REDUCE CRASHES ON APPROACHES TO SIGNALIZED INTERSECTIONS NEAR VERTICAL CURVES 2. Government Accession
Traffic Study of Fuller Street, Cady Street, West Street and West Avenue. Final Report
 Traffic Study of Fuller Street, Cady Street, West Street and West Avenue Final Report July 2005 Prepared for: Town of Ludlow Prepared by: Pioneer Valley Planning Commission 26 Central Street West Springfield,
DRAFT Old Worthington Mobility Study Phase 2 High Street Pedestrian Crossings City of Worthington, Ohio
 DRFT Old Worthington Mobility Study Phase 2 High Street Pedestrian Crossings City of Worthington, Ohio Prepared By: DLZ OHIO, INC. DLZ Job No. 1521-1009-00 October 20, 2015 6121 Huntley Rd, Columbus, OH
TRANSPORTATION ANALYSIS REPORT US Route 6 Huron, Erie County, Ohio
 TRANSPORTATION ANALYSIS REPORT US Route 6 Huron, Erie County, Ohio December 12, 2012 Prepared for: The City of Huron 417 Main Huron, OH 44839 Providing Practical Experience Technical Excellence and Client
Intersection Traffic Control Feasibility Study
 Intersection Traffic Control Feasibility Study CSAH 9 at CSAH 60 (185th Avenue) Prepared For: Dakota County Transportation Department Western Service Center 14955 Galaxie Avenue, 3rd Floor Apple Valley,
INTERSECTION SAFETY STUDY State Route 57 / Seville Road
 INTERSECTION SAFETY STUDY State Route 57 / Seville Road City of Wadsworth, Medina County, Ohio Prepared For: City of Wadsworth Engineering Department 120 Maple Street Wadsworth, OH 44281 Prepared By: GPD
Borough of Danville, PA Traffic Calming Program Guidelines
 Borough of Danville, PA Traffic Calming Program Guidelines Adopted by Borough Council on 1 INTRODUCTION Speeding Traffic is a major concern in the Borough of Danville because of its detrimental impacts
TRANSMITTAL LETTER. Revision to Publication 149, Chapter 20 (Criteria for the Design of Traffic Signal Supports) - March 2009 Edition
 - March 2009 Edition") OS-299 (7-08) TRANSMITTAL LETTER PUBLICATION: Publication 149 - Traffic Signal Design Handbook DATE: 10/14/10 SUBJECT: Revision to Publication 149, Chapter 20 (Criteria for the Design of Traffic Signal
OS-299 (7-08) TRANSMITTAL LETTER PUBLICATION: Publication 149 - Traffic Signal Design Handbook DATE: 10/14/10 SUBJECT: Revision to Publication 149, Chapter 20 (Criteria for the Design of Traffic Signal
DUNBOW ROAD FUNCTIONAL PLANNING
 DUNBOW ROAD FUNCTIONAL PLANNING Final Report August 3, 216 #31, 316 5th Avenue NE Calgary, AB T2A 6K4 Phone: 43.273.91 Fax: 43.273.344 wattconsultinggroup.com Dunbow Road Functional Planning Final Report
Chapter 33. Grade Separated Intersection Overview Classification of Intersection Grade Separated Intersection
 Chapter 33 Grade Separated Intersection 33.1 Overview An intersection is the area shared by the joining or crossing of two or more roads. Since the main function of an intersection is to enable the road
Evaluation of M-99 (Broad Street) Road Diet and Intersection Operational Investigation
 Road Diet and Intersection Operational Investigation") Evaluation of M-99 (Broad Street) Road Diet and Intersection Operational Investigation City of Hillsdale, Hillsdale County, Michigan June 16, 2016 Final Report Prepared for City of Hillsdale 97 North Broad
Evaluation of M-99 (Broad Street) Road Diet and Intersection Operational Investigation City of Hillsdale, Hillsdale County, Michigan June 16, 2016 Final Report Prepared for City of Hillsdale 97 North Broad
Traffic Impact Analysis Chatham County Grocery Chatham County, NC
 Chatham County Grocery Chatham County, NC TABLE OF CONTENTS 1. INTRODUCTION... 1 1.1. Location and Study Area... 1 1.2. Proposed Land Use and Access... 2 1.3. Adjacent Land Uses... 2 1.4. Existing ways...
SCHOOL CROSSING PROTECTION CRITERIA
 CITY OF MADISON TRAFFIC ENGINEERING SCHOOL CROSSING PROTECTION CRITERIA January 2016 Adopted as Policy on August 31, 1976, by Common Council by Amended Resolution #29,540 Amended on September 14, 1976,
City of Elizabeth City Neighborhood Traffic Calming Policy and Guidelines
 City of Elizabeth City Neighborhood Traffic Calming Policy and Guidelines I. Purpose: The City of Elizabeth City is committed to ensure the overall safety and livability of residential neighborhoods. One
Traffic Impact Analysis Walton Acres at Riverwood Athletic Club Clayton, NC
 Traffic Impact Analysis Walton Acres at Riverwood Athletic Club Clayton, NC 1. TABLE OF CONTENTS INTRODUCTION...1 1.1. Site Location and Study Area...1 1.2. Proposed Land Use and Site Access...2 1.3.
RAMP CROSSWALK TREATMENT FOR SAN DIEGO AIRPORT, TERMINAL ONE
 RAMP CROSSWALK TREATMENT FOR SAN DIEGO AIRPORT, TERMINAL ONE AUTHORS Faisal Hamood, P.Eng, M.Eng. Scott O. Kuznicki, P.E. Leonard Perry, Ph.D. SUBMITTAL DATE Friday, May 12 th, 2017 SUBMITTED FOR THE Annual
DEFINITIONS Activity Area - Advance Warning Area Advance Warning Sign Spacing Advisory Speed Approach Sight Distance Attended Work Space
 DEFINITIONS Activity Area - that part of a TTC zone activity area where the work actually takes place. It consists of the work space, traffic space and one or more buffer spaces. Advance Warning Area -
Everyday Hazards for School Bus Drivers. Reference Guide and Test
 1 Everyday Hazards for School Bus Drivers Reference Guide and Test 2 Introduction One of the most important and often overlooked issues for school bus drivers is hazards. During the course of the video,
A Conceptual Approach for Using the UCF Driving Simulator as a Test Bed for High Risk Locations
 A Conceptual Approach for Using the UCF Driving Simulator as a Test Bed for High Risk Locations S. Chundi, M. Abdel-Aty, E. Radwan, H. Klee and E. Birriel Center for Advanced Transportation Simulation
Existing Conditions. Date: April 16 th, Dan Holderness; Coralville City Engineer Scott Larson; Coralville Assistant City Engineer
 Date: April 16 th, 2015 To: From: Re: Dan Holderness; Coralville City Engineer Scott Larson; Coralville Assistant City Engineer Darian Nagle-Gamm, Traffic Engineering Planner Highway 6 (2 nd Street) /
MUTCD Part 6G: Type of Temporary Traffic Control Zone Activities
 MUTCD Part 6G: Type of Temporary Traffic Control Zone Activities 6G.01 Typical Applications Each temporary traffic control (TTC) zone is different. Many variables, such as location of work, highway type,
IMPROVING PEDESTRIAN SAFETY AT UNCONTROLLED CROSSINGS. Guidelines for Marked Crosswalks
 IMPROVING PEDESTRIAN SAFETY AT UNCONTROLLED CROSSINGS Presented by Nazir Lalani P.E. Traffex Engineers Inc. N_lalani@hotmail.com Guidelines for Marked Crosswalks Source: FHWA, Safety Effects of Marked
SCHOOL CROSSING PROTECTION CRITERIA
 CITY OF MADISON TRAFFIC ENGINEERING SCHOOL CROSSING PROTECTION CRITERIA AUGUST 1990 Adopted as Policy on August 31, 1976, by Common Council by Amended Resolution #29,540 Amended on September 14, 1976,
Troutbeck Farm Development
 Troutbeck Farm Development Willistown Township, Chester County PA For Submission To: Willistown Township Last Revised: October, 4 TPD# INLM.A. 5 E. High Street Suite 65 Pottstown, PA 9464 6.36.3 TPD@TrafficPD.com
Traffic Control Inspection Checklist Segment:
 Traffic Control Inspection Checklist Segment: Simon Contractors Simon Contractors Originator: Description Reviewed by: Initials Date Distribution: Traffic Quality Manager, Site Assistant Traffic Manager
3-13 UFC - GENERAL PROVISIONS AND GEOMETRIC DESIGN FOR ROADS, STREETS, WALKS, AND OPEN
 maintenance, and erosion. Stability is required to maintain the integrity of the pavement structure, and a slope stability analysis should be conducted for cuts and fills greater than 15 feet. For lower
TRAFFIC CALMING GUIDE FOR TORONTO CITY OF TORONTO TRANSPORTATION SERVICES DIVISION
 TRAFFIC CALMING GUIDE FOR TORONTO CITY OF TORONTO TRANSPORTATION SERVICES DIVISION CITY OF TORONTO TRANSPORTATION SERVICES DIVISION 2016 TRAFFIC CALMING GUIDE FOR TORONTO TABLE OF CONTENTS Introduction
Residential Traffic Calming Program Guide. Town of Ashland, Virginia
 Residential Traffic Calming Program Guide Town of Ashland, Virginia August 1, 2006 TABLE OF CONTENTS A. INTRODUCTION... 1 B. GOALS... 1 C. CRITERIA... 1 D. IDENTIFYING NEIGHBORHOOD TRAFFIC CONCERNS...
This Chapter sets forth the minimum design, technical criteria and specifications to be used in the preparation of all roadway plans.
 4.1 GENERAL This Chapter sets forth the minimum design, technical criteria and specifications to be used in the preparation of all roadway plans. These Roadway Standards are for new construction and modification
Traffic Engineering and Highway Safety Bulletin June Overview
 Traffic Engineering and Highway Safety Bulletin 18-03 June 2018 INTERSECTION GEOMETRIC DESIGN In This Issue Overview... 1 Intersection Types... 2 Traffic Control Selection... 3 Capacity Analysis... 6 Design
Durrance Elementary School
 Durrance Elementary School SCHOOL ROUTE PLAN For DURRANCE ELEMENTARY SCHOOL LOCATION 9 ORANGE COUNTY Prepared for: ORANGE COUNTY SCHOOL ASSESSMENT PROGRAM ORANGE COUNTY PUBLIC WORKS Traffic Engineering
MUNICIPALITY OF ANCHORAGE TRAFFIC CODE UPDATE MASTER RECOMMENDATION REPORT: 9.14, 9.16, 9.18
 MUNICIPALITY OF ANCHORAGE TRAFFIC CODE UPDATE MASTER RECOMMENDATION REPORT: 9.14, 9.16, 9.18 Report Date: Please send all recommendations for update to Shane Locke (343-8413, lockesr@muni.org) 8-Apr-09
Toolbox of Countermeasures and Their Potential Effectiveness to Make Intersections Safer
 8 Toolbox of Countermeasures and Their to Make Intersections Safer Introduction Studies included in the NCHRP 17-18 (3), Guidance for Implementation of the AASHTO Strategic Highway Safety Plan, as well
Improving Pedestrian Safety at Unsignalized Crossings. Shawn Turner, P.E. Texas A&M Transportation Institute
 Improving Pedestrian Safety at Unsignalized Crossings Shawn Turner, P.E. Texas A&M Transportation Institute Overview of Presentation What are the issues/problems? Framework for crossing treatments Marked
Chapter 2: Standards for Access, Non-Motorized, and Transit
 Standards for Access, Non-Motorized, and Transit Chapter 2: Standards for Access, Non-Motorized, and Transit The Washtenaw County Access Management Plan was developed based on the analysis of existing
City of Dallas Standards and Guidelines for Traffic Control and Safety Treatments at Trail-Road Crossings
 City of Dallas Standards and Guidelines for Traffic Control and Safety Treatments at Trail-Road Crossings Prepared by Max Kalhammer Senior Planner (Bicycle Coordinator) Strategic Planning Division Department
A Study of Effectiveness of Midblock Pedestrian Crossings: Analyzing a Selection of High-Visibility Warning Signs
 : Analyzing a Selection of High-Visibility Warning Signs Rebekka Apardian Bhuiyan Monwar Alam Associate Professor, Department of Geography & Planning, The University of Toledo, Abstract The purpose of
Traffic Signs (1 of 3)
") Traffic Signs (1 of 3) DESCRIPTION AND DEFINITION 5. Initiate Projects Implement sign upgrade projects and consider sign removal. In the analytical process to determine an agency s annual sign maintenance
Traffic Signs (1 of 3) DESCRIPTION AND DEFINITION 5. Initiate Projects Implement sign upgrade projects and consider sign removal. In the analytical process to determine an agency s annual sign maintenance
Lf Wv-11 L_ Mario Dupigny-G iroux, P.E. Traffic Safety Engineer. ja WTtffiti. _J~?feL. \~tk 1pp Research Technician
 Activated Approach Flasher System Final Report October 2009 Report 2009-11 Reporting on Work Plan No. W P 2006-R-1 State of Vermont Agency of Transportation Materials and Research Section Prepared by:
Meadow Woods Elementary School
 Drag and drop pic and stretch/crop to the limits of the blue rectangle (delete this text box) Meadow Woods Elementary School Drag and drop pic and stretch/crop to the limits of the blue rectangle (delete
2016 Annual Report. Work Zone Traffic Control. Bureau of Maintenance and Operations Highway Safety and Traffic Operations Division
 2016 Annual Report Work Zone Traffic Control Bureau of Maintenance and Operations Highway Safety and Traffic Operations Division Table of Contents Introduction... 3 Executive Summary... 4 Work Zone QA
Access requests to County streets and roadways are processed through one of the following methods:
 13.1 GENERAL APPLICATION PROCESS Access requests to County streets and roadways are processed through one of the following methods: A. Planned Developments may set general locations for access points.
TRAFFIC LINE MANUAL. June 2011 TRAFFIC-ROADWAY SECTION
 TRAFFIC LINE MANUAL TRAFFIC-ROADWAY SECTION TABLE OF CONTENTS Foreword...iv Section A: General Principles A-1 Functions and Limitations... 1 A-2 Colors... 1 A-3 Colored Pavements... 1 A-4 Functions, Widths,
ADA PRESENTATION (CURB RAMPS)
") ADA PRESENTATION (CURB RAMPS) ACECNJ/NJDOT/FHWA DESIGN SUMMIT Warren Howard New Jersey Department of Transportation May 21, 2013 ADA Curb Ramps NJDOT wants curb ramps to be designed & constructed properly
ADA PRESENTATION (CURB RAMPS) ACECNJ/NJDOT/FHWA DESIGN SUMMIT Warren Howard New Jersey Department of Transportation May 21, 2013 ADA Curb Ramps NJDOT wants curb ramps to be designed & constructed properly
Road Safety Audit Review Burpee Plank Road Town of Bristol. July 2, 2008
 Road Safety Audit Review Burpee Road @ Plank Road Town of Bristol July 2, 2008 Note: THIS DOCUMENT IS EXEMPT FROM DISCOVERY OR ADMISSION UNDER 23 U.S.C 409 Burpee Road @ Plank Road Road Safety Audit Review
Module 3 Developing Timing Plans for Efficient Intersection Operations During Moderate Traffic Volume Conditions
 Module 3 Developing Timing Plans for Efficient Intersection Operations During Moderate Traffic Volume Conditions CONTENTS (MODULE 3) Introduction...1 Purpose...1 Goals and Learning Outcomes...1 Organization
Road Conversion Study Plumas Street
 Plumas Street Phase I Submitted to The Regional Transportation Commission of Washoe County Submitted by Zong Tian, Ph.D., P.E. Saeedeh Farivar Haiyuan Li, Ph.D. Center for Advanced Transportation Education
Donahue Drive Corridor Traffic Operational Evaluation
 Donahue Drive Corridor Traffic Operational Evaluation PREPARED FOR: THE CITY OF AUBURN PREPARED BY: JANUARY 2007 Donahue Drive Corridor Study--Auburn, Alabama TABLE OF CONTENTS Introduction... 1 Background