UNIVERSITY OF ARIZONA NEEDS ASSESSMENT STUDY
|
|
|
- Jayson Gordon
- 6 years ago
- Views:
Transcription

1
2
3 UNIVERSITY OF ARIZONA NEEDS ASSESSMENT STUDY Final Report Prepared for PIMA ASSOCIATION OF GOVERNMENTS AND THE UNIVERSITY OF ARIZONA Prepared by April 2008
4 Acknowledgments University of Arizona Parking and Transportation Services Tom Amparano Bill Davidson John Francisco David Heineking Patrick Kass University of Arizona Campus and Facilities Planning Grant McCormick Pima Association of Governments Cherie Campbell Robert Done Rita Hildebrand John Liosatos Jennifer O Connor Ruth Reiman City of Tucson Department of Transportation Vince Catalano Nicole Ewing-Gavin Shellie Ginn Lima and Associates Robert Bohannan
5 TABLE OF CONTENTS Page 1. INTRODUCTION 1-1 PROJECT BACKGROUND 1-1 PLANNED TRANSPORTATION SYSTEM IMPROVEMENTS 1-2 PROJECT GOALS AND OBJECTIVES 1-2 PROJECT STUDY AREA PREVIOUS PLANS AND STUDIES EXISTING AND FUTURE CONDITIONS 3-1 THE UNIVERSITY OF ARIZONA COMMUNITY POPULATION 3-1 SOURCES OF TRAVEL RELATED DATA FOR EACH UA COMMUNITY GROUP 3-2 EXISTING STUDENT MODE CHOICE AND PERMIT DATA 3-3 On-Campus Students 3-3 Off-Campus Students 3-4 EXISTING UA AND UMC EMPLOYEE RESIDENTIAL LOCATION, MODE CHOICE, AND PERMIT DATA 3-11 Estimated Overall UA and UMC Employee Mode Share by Distance from Campus 3-18 TOTAL COMBINED STUDENT AND EMPLOYEE MODE CHOICE FOR YEAR 2010 TRAVEL DEMAND FORECAST BY MODE 3-21 EXISTING TRANSIT SERVICE SERVING THE UNIVERSITY 3-23 U-PASS USAGE TREND PARKING PERMITS 3-30 UA PARKING COST COMPARISON 3-31 UA PARKING ACTIVITY 3-32 UMC PARKING 3-38 UA BICYCLE AND PEDESTRIAN FACILITIES 3-39 LAND DEVELOPMENT OPPORTUNITIES 3-45 Grant Road Corridor Plan 3-45 Grant Road and Campbell Avenue, Southeast Corner 3-45 Grant Road and Campbell Avenue, Northwest Corner 3-45 The Oracle Project 3-45 Oracle Road and Drachman Street, Northwest Corner 3-46 Oracle Road and Drachman Street, Northeast Corner 3-46
6 TABLE OF CONTENTS (Continued) Page 3. EXISTING AND FUTURE CONDITIONS (Continued) Stone Avenue Corridor Study 3-46 Speedway Boulevard and Stone Avenue, Southwest Corner 3-46 Speedway Boulevard and Stone Avenue, Northeast Corner 3-46 Speedway Boulevard and 6 th Avenue, Northeast Corner 3-46 Broadway Corridor Plan 3-47 Plumer Avenue and Broadway Boulevard, Northwest Corner 3-47 Broadway Boulevard and Park Avenue, Northeast and Northwest Corners nd Street Corridor Plan 3-47 Campbell Avenue and 36 th Street, The Bridges 3-47 Rio Nuevo and Downtown 3-47 IMPACT OF THE MODERN STREETCAR ON EXISTING UA AUTO TRAVEL DEMAND 3-50 YEAR 2005/2006 INTERESECTION LEVELS OF SERVICE TRAVEL DEMAND MANAGEMENT 4-1 TRAVEL DEMAND MANAGEMENT MEASURE ASSESSMENT 4-1 OPTIONS TO REDUCE AUTOMOBILE USE AND ROADWAY CONGESTION 4-1 Some Options That Directly Target and Decrease Automobile Use 4-2 Some Options That Increase Alternative Mode use 4-3 Some Options to Centralize the UA Population 4-4 Some Options to Spread Travel Demand to Off-Peak Periods 4-4 Some Options to Decrease Overall UA Trips 4-5 Some Options to Increase Roadway Capacity 4-5 TDM MEASURE DEVELOPMENT, EVALUATION, AND RANKING 4-5 ThinkTank Session Participants 4-6 ThinkTank Session Process 4-7 ThinkTank Session Results 4-8
7 TABLE OF CONTENTS (Continued) Page 5. PROJECT PUBLIC INVOLVEMENT PROGRAM AND COMMENTS 5-1 PUBLIC INVOLVEMENT PROGRAM 5-1 OPEN HOUSE ATTENDANCE AND COMMENTS UNIVERSITY OF ARIZONA PARTICIPATION IN THE PIMA ASSOCIATION OF GOVERNMENTS (PAG) TRANSPORTATION IMPROVEMENT PROGRAM (TIP) PROCESS 6-1 EXISTING CONDITIONS 6-1 TYPES OF PROJECTS CONSIDERED FOR THE TIP 6-2 POTENTIAL FUNDING SOURCES 6-4 COORDINATION AND DEVELOPMENT OF UA PROJECTS FOR THE REGIONAL TIP 6-4 Internal UA Coordination and Project Development Process 6-5 Coordination Between the UA and the Local Jurisdiction Project Sponsor 6-5 Coordination Between the UA and PAG 6-6 EVALUATION CRITERIA FOR INTERAL UA PROJECT EVALUATION 6-7 POTENTIAL UA PROJECTS FOR TIP CONSIDERATION SUMMARY OF CONCLUSIONS AND RECOMMENDATIONS 7-1 EXISTING AND YEAR 2010 TRAVEL DEMAND 7-1 TRAVEL DEMAND MANAGEMENT 7-1 UA PARTICIPATION IN THE PAG TIP PROCESS 7-1 APPENDIX A APPENDIX B APPENDIX C APPENDIX D Level of Service by Intersection Approach Based on 2005 and 2006 Data Think Tank Session Results Open House Sign-In Sheets Transportation Improvement Program Major and Minor Project Funding Applications
8 LIST OF EXHIBITS Page Exhibit 1-1 SUMMARY OF 2030 RTP IMPROVEMENTS IN THE UA AREA 1-4 AND FORECAST CONGESTION LEVELS Exhibit 1-2 RTA TRANSPORTATION SYSTEM IMPROVEMENTS NEAR 1-5 THE UA Exhibit 1-3 PROJECT STUDY AREA 1-6 Exhibit 2-1 SUMMARY OF DOCUMENTS COMPILED FOR REVIEW 2-2 Exhibit 2-2 SUMMARY OF RECOMMENDATIONS FROM PREVIOUS 2-3 PLANS AND STUDIES FOR FURTHER CONSIDERATION Exhibit 3-1 ESTIMATED UNIVERSITY POPULATION FOR THIS STUDY 3-1 Exhibit 3-2 ON-CAMPUS STUDENT MODE CHOICE 3-3 Exhibit 3-3 ON-CAMPUS STUDENT PARKING PERMIT AND BUS PASS 3-4 DATA Exhibit 3-4 OFF-CAMPUS STUDENT RESIDENTIAL LOCATION 3-5 Exhibit 3-5 ADDRESS MATCHED RESIDENTIAL LOCATION AND 3-5 DISTANCE FROM CAMPUS FOR OFF-CAMPUS STUDENTS Exhibit 3-6 PERCENT OF STUDENTS BY DISTANCE FROM CAMPUS 3-6 Exhibit 3-7 OFF-CAMPUS STUDENT MODE CHOICE 3-7 Exhibit 3-8 OFF-CAMPUS STUDENT MODE CHOICE VERSUS 3-7 DISTANCE FROM CAMPUS Exhibit 3-9 OFF-CAMPUS STUDENT PARKING PERMIT AND BUS PASS 3-8 DATA Exhibit 3-10 ESTIMATED NUMBER OF OFF-CAMPUS STUDENTS BY 3-9 MODE AND DISTANCE FROM CAMPUS Exhibit 3-11 ESTIMATED NUMBER OF OFF-CAMPUS STUDENTS BY 3-9 PERMIT TYPE AND DISTANCE FROM CAMPUS Exhibit 3-12 RESIDENTIAL LOCATION FOR OFF-CAMPUS STUDENTS 3-11 WITH PARKING PERMITS Exhibit 3-13 UA EMPLOYEE RESIDENTIAL LOCATION 3-12 Exhibit 3-14 RESIDENTIAL LOCATION FOR UA EMPLOYEES WITH 3-13 PARKING PERMITS Exhibit 3-15 UA AND UMC EMPLOYEE RESIDENTIAL DISTANCE FROM 3-14 CAMPUS Exhibit 3-16 UA EMPLOYEE MODE CHOICE 3-15 Exhibit 3-17 NUMBER OF UA EMPLOYEES PURCHASING PARKING 3-16 PERMITS AND BUS PASSES Exhibit 3-18 UMC EMPLOYEE MODE CHOICE 3-17 Exhibit 3-19 ESTIMATED NUMBER OF UA EMPLOYEES BY MODE AND 3-18 DISTANCE FROM CAMPUS Exhibit 3-20 ESTIMATED NUMBER OF UA EMPLOYEES BY PERMIT TYPE 3-18 AND DISTANCE FROM CAMPUS Exhibit 3-21 ESTIMATED NUMBER OF UMC EMPLOYEES BY MODE AND DISTANCE FROM UMC 3-19
9 LIST OF EXHIBITS Page Exhibit ESTIMATED TOTAL NUMBER OF PERSONS BY MODE 3-20 AND DISTANCE FROM THE STUDY AREA Exhibit ESTIMATED TOTAL MODE CHOICE VERSUS 3-20 DISTANCE Exhibit 3-24 YEAR 2010 NUMBER OF PERSONS BY MODE AND 3-22 DISTANCE FROM STUDY AREA Exhibit 3-25 YEAR 2010 MODE CHOICE BY DISTANCE FROM STUDY 3-22 AREA Exhibit 3-26 SUN TRAN BUS ROUTES NEAR THE UA 3-24 Exhibit 3-27 SUN TRAN BUS STOP LOCATIONS AT UA 3-25 Exhibit 3-28 EXISTING CATTRAN SERVICE MAP 3-26 Exhibit 3-29 CATTRAN SERVICE SUMMARY 3-27 Exhibit 3-30 CATTRAN SHUTTLE RIDERSHIP 3-27 Exhibit 3-31 PROPOSED MODERN STREET CAR ROUTE 3-28 Exhibit 3-32 SUMMARY OF OFF-CAMPUS HOUSING SHUTTLE SERVICE 3-29 DATA Exhibit 3-33 U-PASS USAGE TREND 3-30 Exhibit PARKING SPACES AND PARKING PERMITS 3-31 Exhibit 3-35 UA PARKING COST COMPARISON 3-31 Exhibit 3-36 UA PARKING LOT LAYOUT MAP 3-33 Exhibit 3-37 UA PARKING INVENTORY/UTILIZATION 3-34 Exhibit 3-38 UA GARAGE ACTIVITY FOR PERMIT HOLDERS 3-36 Exhibit 3-39 UA PARKING LOT ACTIVITY 3-36 Exhibit 3-40 COMBINED GARAE AND PARKING LOT ACTIVITY 3-37 Exhibit 3-41 HOURLY TRAFFIC VOLUME DISTRIBUTION AT SPEEDWAY/ 3-38 CAMPBELL INTERSECTION (Total Entering Volume by Hour) Exhibit 3-42 UMC PARKING INFORMATION 3-39 Exhibit 3-43 UA BIKE ROUTE MAP 3-40 Exhibit 3-44 UA FIELD INVENTORY DATA BICYCLE RACK LOCATIONS 3-41 Exhibit 3-45 ABSENCE OF SIDEWALK FIELD INVENTORY 3-43 Exhibit 3-46 PEDESTRIAN RAMP FIELD INVENTORY 3-44 Exhibit 3-47 SUMMARY OF NEW LAND DEVELOPMENT NEAR UA 3-49 Exhibit 3-48 ESTIMATED POTENTIAL OF THE INITIAL MODERN STREET 3-50 CAR SERVICE TO REDUCE AUTO TRAVEL TO THE UA BY STUDENTS AND EMPLOYEES Exhibit 3-49 YEAR 2005/2006 AM PEAK-HOUR INTERSECTION LEVEL OF 3-52 SERVICE Exhibit 3-50 YEAR 2005/2006 PM PEAK-HOUR INTERSECTION LEVEL OF SERVICE 3-53 Exhibit 4-1 UA COMMUNITY CONTRIBUTING TO TYPICAL RECURRING 4-6 CONGESTION Exhibit 4-2 THINKTANK SESSION PARTICIPANTS 4-6
10 LIST OF EXHIBITS Page Exhibit 4-3 NUMBER OF IDEAS GENERATED FOR EVALUATION 4-8 Exhibit 4-4 THINKTANK SESSION SUMMARY OF RESULTS (December 3, ) Exhibit 4-5 TOP 20 RATED TDM MEASURES 4-12 Exhibit 5-1 OPEN HOUSE POSTER 5-2 Exhibit 5-2 OPEN HOUSE PRESS RELEASE 5-3 Exhibit 5-3 OPEN HOUSE COMMENT FORM 5-4 Exhibit 5-4 OPEN HOUSE COMMENTS SUMMARY 5-5 Exhibit 6-1 UA CAMPUS BASEMAP SHOWING UNIVERSITY PROPERTY 6-3 Exhibit 6-2 POTENTIAL TIP FUNDING FOR UA PROJECTS 6-4
11 1. INTRODUCTION PROJECT BACKGROUND Over the past 10 years the University of Arizona (UA) has increased in size from a total student plus employee head count population of 46,300 to 51,300 in This makes the University one of the largest activity centers within metropolitan Tucson, attracting tens of thousands of person trips every weekday by all available modes of transportation. The growth of the University has occurred at the same time that Pima County population has increased from 866,000 to 980, The increase in size of both the UA and the region, coupled with the University s location along major commuting arterials within the City of Tucson, has resulted in significant congestion and conflicts between modes of travel both within and around the campus. The congestion has increased even with significant efforts by both the UA and the City of Tucson to provide multimodal transportation system improvements to increase the supply of transportation, separate alternative modes of travel, and manage travel demand. The rapid growth has simply outpaced the effectiveness of the implemented transportation supply and demand management measures. The 1997 University Area Circulation Study provided numerous recommendations to mitigate traffic congestion and conflicts between pedestrian, bicycle, and vehicular traffic. Many of these recommendations have been implemented, some have been partially implemented and some have not been implemented. For example, new parking garages have been built, transit service improved, and the residential parking permit program expanded, but the recommended pedestrian and bicycle improvements have only been partially implemented. As a result, some of the identified problems still exist, and some new problems have developed. The 2003 University of Arizona Comprehensive Plan provides a vision for the UA campus to support 40,000 full time equivalent students (FTES) and a University community of 75,000. This is an additional 5,500 FTES over the year 2006 enrollment and an increase in the University community (exclusive of visitors) of approximately 23,700. This level of University growth will add significant levels of traffic to an already congested roadway network within the UA planning area. The Comprehensive Plan includes observations on existing transportation system conditions and deficiencies, and the included Parking and Transportation Report provides many strong recommendations for the improvement of the campus area circulation system. The Parking and Transportation Report is particularly emphatic regarding future parking conditions on campus, indicating that the number of projected spaces falls far short of the projected demand for parking Attempting to meet this shortfall in spaces through further increases in on-campus parking is a problem in the extreme. 3 Thus the projected shortfall in parking and the anticipated increase in traffic congestion must be overcome through a reduction in automobile travel to campus through increased use of alternative modes, more on-campus housing, and implementation of travel demand management strategies targeted to reduce automobile travel to and from campus. It should be noted that the current University administration is committed to a position of smart growth for the University that does not cap total UA student population at 40,000. Therefore, the need to provide alternatives to automobile travel will likely be greater than that anticipated in the Comprehensive Plan. 1 Source: University of Arizona Fact Book , Office of Institutional Research & Evaluation. 2 Source: Online PAG Regional Data Center 1997 and 2006 population estimates University Comprehensive Plan, Appendix 4: Parking and Transportation Report, page 89. University of Arizona 1-1 Final Report, April 2008
12 The Comprehensive Plan also contains numerous goals, objectives, and policies that are specifically designed to address traffic congestion and the multimodal transportation needs of the campus area. These goals, objectives, and policies are to be implemented within the context of the Comprehensive Plan s guidelines for an Open Space Framework which provides corridors for pedestrian and bicycle circulation within the campus and connecting to the surrounding community. The Plan Highlights for each Precinct Plan within the Comprehensive Plan provide a summary project list for campus development. Only a very few of the transportation related projects have been implemented, for example, the Warren Avenue research corridor pedestrian and bicycle facility in Precinct 2. While the Comprehensive Plan provides strong general direction it stops short of recommending specific strategies to curb the anticipated growth in automobile travel to the UA. There is also a need to go beyond the prior planning work and provide more detail on the what, when, where and how much of specific projects so that the UA and the City of Tucson can program these projects into their respective five-year Transportation Improvement Programs. PLANNED TRANSPORTATION SYSTEM IMPROVEMENTS The Pima Association of Governments 2030 Regional Transportation Plan (RTP) provides for some multimodal transportation system improvements in the UA campus area. These improvements are summarized graphically in Exhibit 1-1. The 2030 RTP provides roadway improvements to Grant Road and Broadway Boulevard, and intersection improvements at Speedway Boulevard/Euclid Avenue and Campbell Avenue/6 th Street. Transit improvements include new rapid bus routes along Speedway and Broadway Boulevards, and a new modern street car connecting the UA area to the Tohono Tadai Transit Center and the downtown. The modern street car is also planned to extend to the east along Broadway Boulevard, connecting to the UA along Campbell Avenue. Modest bicycle and pedestrian improvements are also included. However, as Exhibit 1-1 also indicates, year 2030 traffic congestion in the UA area is expected to be heavy to severe. The 2006 Regional Transportation Authority (RTA) Plan includes many of the 2030 RTP planned improvements, but also expands upon the RTP by providing additional multimodal features. The RTA improvements are summarized graphically in Exhibit 1-2. The RTA roadway improvements include the Grant Road and Broadway Boulevard widening projects. Additional bike lanes and sidewalk improvements are included in the RTA as well as more extensive transit service improvements than are included in the RTP. The modern street car connection from the UA to the downtown is planned to be implemented as part of the RTA improvement package. Details of the transit system improvements planned through year 2011 are compiled in the Tucson Regional Short Range Transit Report (November 2006). PROJECT GOALS AND OBJECTIVES The primary goals and objectives of this study included the following: Provide the University with a general assessment of the existing and short-term future travel demand to and from campus by existing transportation modes. Provide a general means for developing planning level estimates of the potential impacts of TDM measures on automobile use for UA trips. Identify the target UA community for various TDM strategies. University of Arizona 1-2 Final Report, April 2008
13 Develop recommendations for specific travel demand management (TDM) measures to assist the University and the City of Tucson in addressing the growing congestion and traffic issues within the UA planning area. Provide recommendations for a process by which the UA can take better advantage of regional project funding available through the Pima Association of Governments (PAG) Transportation Improvement Program (TIP). Provide recommendations for future projects to address transportation system improvement needs within the campus planning area. Provide an inventory of specific alternative mode transportation facilities within the UA planning area. Schedule and conduct an open-house to gather public input on the recommended travel demand management solutions. PROJECT STUDY AREA The study area for this project was selected to generally coincide with the planning area included in the 2003 University of Arizona Comprehensive Plan. The Study Area as defined for this project is the area bounded by Euclid Avenue on the west, Campbell Avenue on the east, Broadway Boulevard on the south and Lester Street on the north. The Study Area is approximately 1.4 square miles in area and includes all of the UA main campus and the University Medical Center campus and UMC Hospital located north of the main campus. The project Study Area is graphically illustrated in Exhibit 1-3. University of Arizona 1-3 Final Report, April 2008


14 Exhibit 1-1 SUMMARY OF 2030 RTP IMPROVEMENTS IN THE UA AREA AND FORECAST CONGESTION LEVELS Source: PAG 2030 Regional Transportation Plan, Adopted June 29, University of Arizona 1-4 Final Report, April 2008


15 Exhibit 1-2 RTA TRANSPORTATION SYSTEM IMPROVEMENTS NEAR THE UA Source: Pima Association of Governments, Regional Transportation Authority, Our Mobility Tucson, Arizona A $2.1 Billion Regional Transportation Plan, May 16, University of Arizona 1-5 Final Report, April 2008
16 Exhibit 1-3 PROJECT STUDY AREA Lester St. Euclid Ave. Mountain Ave. Campbell Ave. Speedway Blvd. 6 th St.. Broadway Blvd. Study Area Boundary University of Arizona 1-6 Final Report, April 2008
17 2. PREVIOUS PLANS AND STUDIES Planning documents and previous studies were compiled for review as an element of this study. The list of the documents reviewed is provided in Exhibit 2-1. The review focused on the identification of transportation system projects, policies, and travel demand management recommendations having the potential to reduce traffic congestion specifically in the University planning area. Therefore, not all of the compiled materials contained information relevant to this assessment. The purpose of this review was to provide the following information: Previous recommendations to reduce congestion in the UA planning area that had not already been implemented, are not contained in the PAG Transportation Improvement Program (TIP), and are not included in the Regional Transportation Authority (RTA) funded projects. Long range projects contained in the PAG 2030 Regional Transportation Plan, and unfunded projects from the PAG TIP were included in the list of potential projects for further consideration. Assess whether these previous recommendations still have the potential to provide a viable approach to traffic congestion relief in the UA area. Identify recommendations with the potential to provide projects which the UA might advance to the PAG Regional TIP for funding consideration. This latter consideration is addressed in a later section of this report. The documents and studies were prepared by, or for, one or more of the following agencies: The University of Arizona The City of Tucson The Pima Association of Governments The status of previous recommendations gathered from these studies was reviewed by the Project Team and the Project Technical Advisory Committee (TAC) to determine the extent to which these recommendations had resulted in projects that were either implemented, programmed for implementation, planned for implementation, or abandoned. The remaining recommendations were summarized for further consideration. The summary of the viable recommendations gathered from previous plans and studies is provided in Exhibit 2-2. These recommendations were grouped into six categories which generally describe how congestion is addressed by the recommendation. These categories are the following: Decrease Automobile Use Increase Alternative Mode Use Centralize UA Population Spread Travel Demand Decrease UA Trips Increase Roadway Capacity These same categories and many of the recommendations contained in Exhibit 2-2 were also used to develop and evaluate TDM measures as part of this study effort, and to combine the recommendations from previous studies with the recommendations developed during this study. University of Arizona 2-1 Final Report, April 2008.
18 Exhibit 2-1 SUMMARY OF DOCUMENTS COMPILED FOR REVIEW University of Arizona, City of Tucson, and PAG, University of Arizona Circulation Study, University of Arizona, 2003 Comprehensive Campus Plan, University of Arizona, Space Needs Analysis for the Campus Master Plan, University of Arizona, Fact Book University of Arizona, Off-Campus Housing Guide and Commuter Resource Book, University of Arizona, Campus Parking Map University of Arizona, Shuttle Service Guide City of Tucson, University Area Plan, May City of Tucson, Tucson Transit On Board Origin and Destination Survey, City of Tucson, Major Transit Investment Study, Final Report and supporting documents, City of Tucson, Draft Tucson Regional Short Range Transit Report, November City of Tucson, SunTran, Tucson System-Wide Transit Map, PAG, 2030 Regional Transportation Plan, Adopted June 29, PAG Regional Transportation Authority, Our Mobility, A $2.1 Billion Regional Transportation Plan, PAG, 5-Year Regional Transportation Improvement Program , PAG, State Transportation System Mobility and Regional Circulation Needs Feasibility Study (PAG Loop Study), Working Papers 1, 2, and 3, PAG, Transit Element of the 2030 Regional Transportation Plan, Technical Memos 1, 2, and 3, PAG, Tucson Metro Bike Map, September PAG, Regional Plan for Bicycling, July PAG, Regional Pedestrian Plan, July University of Arizona 2-2 Final Report, April 2008.
19 Exhibit 2-2 SUMMARY OF RECOMMENDATIONS FROM PREVIOUS PLANS AND STUDIES FOR FURTHER CONSIDERATION DECREASE AUTOMOBILE USE TDM Measures, Policies, or Goals 1. Decrease the overall number of cars on campus by a percentage basis compared to the increasing population with the exception of needing to serve the hospital and clinics at the current ratio as they grow. This will be accomplished by: a. Park and ride lots serviced by shuttle buses. 8 INCREASE ALTERNATIVE MODE USE Projects 1. Warren Avenue Corridor Improvement near Hillenbrand Stadium Helen Street: Street enhancement Mountain Avenue corridor improvements including enhancing alternate modes of travel Various pedestrian related improvements in neighborhoods adjacent to the UA Separate bicycle and pedestrian traffic through grade and material changes on the mall and along bicycle routes Implement traffic control measures for bicycles/pedestrians to reduce conflicts Enhance bike and pedestrian signage and striping markings throughout campus Provide: a. More pedestrian scale lighting and shading. 7 b. Wider sidewalks. 7 c. Separation of pedestrian use areas from bicycle and vehicular traffic through change in grade, materials and possibly bollards Between University and North Campus Drive: New courtyards and pedestrian path West of Old Main: Pedestrian zone Park Avenue: Bicycle lanes and other bicycle improvements proposed (City of Tucson project) Reconstruct the intersection of the Highland bike route and the University bike route on the Mall Extended bike route access south on Warren Avenue to the Mall Improve the Highland bike route north of the Mall Ensure that traffic signals on the periphery of campus are bicycle activated Improve and expand bicycle parking facilities Tyndall Avenue: Enhancements and bicycle parking Transit Streetcar AHSC to Tohono Tadai via Campbell/Prince Transit Streetcar UA to El Con New limited stop/skip stop service along Speedway, Broadway, 6th Street/Wilmot/Stella from East Tucson to downtown Tucson In peak periods skip stop service on Campbell/Kino Parkway from Cortaro Farms Road connecting Tucson Mall, UA, and Tucson International Airport New limited stop/skip stop service from Pima CC West to Downtown Tucson/UA Bus Rapid Transit/Light Rail Transit recommended along Oracle Road/6th Avenue connecting Oro Valley, Tucson Mall, Downtown Tucson, and 6th/12th Avenue to South Tucson, Tucson International Airport and Southeast Industrial Area under Alternative Bus Rapid Transit/Light Rail Transit recommended along Broadway/Speedway/6th Street Corridors connecting East Tucson to UA and Downtown Tucson under Alternative Euclid/5th Street HAWK pedestrian crossing Euclid/2nd Street HAWK pedestrian crossing Undertake efforts to design and implement multi-modal streetscape designs and neighborhood buffer treatments for the following streets providing access to the UA regional activity center: a. Highland Avenue from Broadway to Sixth Street. 1 b. Mountain Avenue from Speedway to Grant Road. 1 c. Speedway Boulevard. 1 d. Park Avenue. 1 e. Euclid Avenue. 1 f. Campbell Avenue. 1 g. Sixth Street. 1 h. University Boulevard. 1 University of Arizona 2-3 Final Report, April 2008.
20 TDM Measures, Policies and Goals 1. Decrease the overall number of cars on campus by a percentage basis compared to the increasing population with the exception of needing to serve the Hospital and Clinics at the current ratio as they grow. This will be accomplished by: a. Increase in Sun Tran service. 8 b. An increase in ride sharing. 8 c. Higher utilization of bicycle facilities More delineation of bicycle routes to reduce conflict between pedestrians and wheeled vehicles Standard pedestrian amenities, such as seating drinking fountains, night lighting and defensible space Reduced vehicular penetration of campus Traffic calming devices at most points of vehicular/pedestrian overlap (conflict) within the campus Raised pedestrian crosswalks at locations where the primary pedestrian system crosses the campus roadway system Redistribution of pedestrian space versus automobile space on all campus streets Narrowing roadways and widening sidewalks on typical cross sections of mixed use corridors A bicycle path and lane system comprising 7.4 miles of route within the campus, both on street and off street paths with some segments of multi use paths Addition of smaller bicycle parking areas along the bicycle route system where space is available away from main pedestrian areas to reduce conflicts between the modes Raised pedestrian crossings where they cross bicycle traffic to act as a calming device for bicycle traffic Support the continued development of alternate modes of transportation facilities throughout the University Area, including the expansion of existing transit, bicycle, and pedestrian access to the UA regional activity center Encourage the University to continue to support the development and utilization of alternate modes of transportation through rideshare incentives, SunTran bus pass program, further restriction on parking, improved bicycle facilities, implementation of proposed campus shuttle system Provide more convenient transit service that meet needs of those who are dependent on public transportation for their mobility needs and those who can choose between driving and taking public transit Improve inter-modal connections and access to transit service for a variety of users, including pedestrians, as well as those who rely on park-and-ride services Reduce transit travel times so that they are more competitive with auto travel times To help mitigate future traffic congestion and reduce necessary additional street/highway capacity, increase transit ridership by those who can choose between driving and taking public transportation Pursue necessary local, state, and federal funding to support transit improvements Improve the overall image of public transit through improved maintenance, innovative marketing strategies, and the use of modern equipment and facilities Clarify campus navigation through clear pedestrian and bike paths Provide attractive, shaded and well lit paths Create a compact, walkable and pedestrian oriented campus To create and maintain a balanced multi-modal transportation system that provides choices among all modes, reduces reliance on any single mode and takes advantage of the inherent benefits of each mode Create a pedestrian, transit and bicycle-oriented circulation system on campus while maintaining access for emergency and service vehicles Encourage and endorse the University area land use decisions that will better support the transit, bicycle, and pedestrian systems, and improve the quality of life Develop off-campus park and ride lots and the supporting shuttle system to serve the University campus community Provide transit passes to all University populations at a user cost far below that of the current annual pass cost Revamp the route structures of the campus shuttle system, beginning the transition from loops to a radial route configuration Serve off-campus park and ride lots with high frequency transit service into the campus Traffic calming in adjacent neighborhoods Revise street cross sections to shift balance in favor of other modes of transportation rather than automobiles to better serve pedestrians and cyclists and to slow the automobile traffic To reach 800 miles of roadway bikeways by the year Engineer by planning, designing, constructing and maintaining bicycle facilities that meet or exceed standards and guidelines Encourage the increased use of bicycles for transportation and recreation Promote development and design of pedestrian facilities that are direct, safe, comfortable, interesting and provide continuity Promote the enhancement, improvement and maintenance of the regional pedestrian system Identify and secure funding sources to implement pedestrian programs and projects. 6 University of Arizona 2-4 Final Report, April 2008.
21 Projects CENTRALIZE UA POPULATION 1. 2nd Street: Residence hall additions with pedestrian path Between First Street and Second Street near Campbell Avenue: Infill residential units Former TUSD site: New graduate and married student housing between Park Avenue and Fremont Avenue north of Broadway Boulevard and south of Eighth Street. 8 TDM Measures, Policies and Goals 1. Encourage the University to provide for student housing needs and related services within the boundaries of the campus planning area Encourage more on campus and near campus housing so pedestrian and bicycle accessibility can be maximized Decrease the overall number of cars on campus by a percentage basis compared to the increasing population with the exception of needing to serve the Hospital and Clinics at the current ratio as they grow. This will be accomplished by: a. On campus housing. 8 SPREAD TRAVEL DEMAND TDM Measures, Policies and Goals 1. Revised class schedule shifting the starting time by minutes from the current on-hour schedule for both the University and Tucson High School Flexible work hours for non-academic staff Longer hours of operation for the University including more evening classes Examine possible modifications to the University work and class schedules that could provide positive impact to the community circulation system. 8 DECREASE UA TRIPS TDM Measures, Policies and Goals 1. Telecommuting options for students, faculty and staff. 7 INCREASE ROADWAY CAPACITY Projects 1. Speedway/Euclid intersection: add turn lanes to improve capacity. 2 Sources: 1. University Area Plan, May Pima Association of Governments, 2030 Regional Transportation Plan, Adopted June 29, Pima Association of Governments, 5 Year Regional Transportation Improvement Program (TIP ), September 28, 2006, Plus Amendments. 4. Pima Association of Governments, Transit Element of the 2030 Regional Transportation Plan, Technical Memorandum No. 3, Phase 3: Recommended Transit Service and Facility Improvements, October Pima Association of Governments, Regional Plan for Bicycling, July Pima Association of Governments, Regional Pedestrian Plan, July University Area Circulation Study, February University of Arizona Comprehensive Campus Plan, June University of Arizona 2-5 Final Report, April 2008.
22
23 3. EXISTING AND FUTURE CONDITIONS THE UNIVERSITY OF ARIZONA COMMUNITY POPULATION Understanding the characteristics and size of the UA community is a key element in determining the types of potential travel demand management (TDM) strategies and other improvements to address parking and congestion issues in the UA area. It is most important to understand the travel demand and mode choice characteristics of the various groups that make up the UA community and that are most likely to travel to the UA on a regular daily basis during the peak travel periods of the day. Employees that only come to campus for major sporting events or do not work at a site located within the study area are not considered a key element of the UA community for the purposes of this study. Data from the spring semester 2007 UA enrollment and employment records were provided by the University. After eliminating ancillary employees (part time employees, typically working major sporting events and other activities) and all student employees, the total University population for the purposes of this study was estimated at 47,815. Data for the existing condition and the year 2010 are provided in Exhibit 3-1. Forecast data are taken from the Space Needs Analysis for the Campus Master Plan, May It should be noted that while the travel forecasts developed for this study were based on a student enrollment limited to 40,000, the current University administration is committed to smart growth for the university community, which does not limit enrollment to the 40,000 student level. The data contained in Exhibit 3-1 differs slightly for the data contained in The University of Arizona Fact Book, which indicates a total head count population of students to be 36,805 and employees (excluding student employees) to be 11,520. These data differ primarily because of the time during the year that the data are prepared and the exclusion of ancillary employees from the study database. Exhibit 3-1 ESTIMATED UNIVERSITY POPULATION FOR THIS STUDY 2007 Spring Semester 1 Percent of Total Population Estimated Year 2010 Percent Increase Total Students 34, % 40, Off-Campus 28, % 32, On-Campus 5, % 7, UA Employees 10, % 12, UMC Employees 3, % 3, Total Population 47, % 56, Source: UA Student and Employee Address Databases, Spring Semester Employee data excludes all student employees, ancillary employees, and employees that do not work on the main UA campus. 2. Space Needs Analysis for the Campus Master Plan, May Assumes the same growth rate as that for Students from to Average based on PAG TRP 2006 and 2007 data indicating 2,890 and 3,214 employees, respectively. University of Arizona 3-1 Final Report, April 2008.
24 UMC employees are not reported as UA employees and are not included in the Fact Book figures. Based on UMC employment figures provided by UMC through the PAG Travel Reduction Program, it is estimated that there were 3,052 UMC employees for the year. From a transportation perspective, there are four separate UA community groups. These are: On-campus students Off-campus students UA Employees UMC Employees The following group characteristics have a direct impact on the travel demand generated by each group and the potential effectiveness of demand management options applied to each group: Number of individuals in each group. Existing mode choice for trips to the UA by members of the group. Residential distance from campus. The assessment of these characteristics for each UA community group is provided later in this document. SOURCES OF TRAVEL RELATED DATA FOR EACH UA COMMUNITY GROUP Four primary sources of recent travel related data were available. Not all sources of data applied to each UA community group, but sufficient data were available to develop the travel related information needed for this study. These sources of data were the following: U-Pass Student Survey Conducted for Sun Tran This survey of 422 UA students was conducted in March The survey was specifically designed to assess student knowledge and use of the subsidized student Sun Tran bus pass, U-Pass. Three questions included in the survey were specifically helpful for this study: - Do you live on or off campus? - How do you normally get to and from class from where you live? - How far from campus to you live? The complete data from the survey was acquired for this study. Review of the data determined that there were 409 surveys with sufficient information to be useful. Of the 409 surveys, 91 were from students living on-campus, and 318 were form off-campus students. Pima Association of Governments (PAG) Travel Reduction Program (TRP) Employee Survey 2005 The PAG TRP survey of major employers contains detailed work-trip travel related data regarding mode choice, travel distance and travel time for the home-to-work trip. The 2005 PAG survey included both UA and UMC employees. The complete survey data were provided by PAG for this study and included the following: - 6,947 UA employee surveys representing a 73.1percent response rate. - 2,650 UMC employee surveys representing a 94.9 percent response rate. University of Arizona 3-2 Final Report, April 2008.
25 UA employee and student parking permit and bus pass data for the academic year These data were provided by the UA Parking and Transportation Services for the employees and students that purchase parking permits and/or bus passes. UA employee and student administrative database These data, provided by UA Campus Facilities Planning, included information on employee and student residential address (all names were stripped from the data provided), employee type, student type, and student class. These data were merged with the employee and student parking permit and bus pass database into a single database providing information for all UA employees and students. EXISTING STUDENT MODE CHOICE AND PERMIT DATA On-Campus Students A total of 5,391 students lived on-campus during the 2007 spring semester. The estimated mode choice distribution from the U-Pass survey of 91 on-campus students is provided in Exhibit 2-2. The vast majority (93%) of on-campus students walk to class. Exhibit 3-2 ON-CAMPUS STUDENT MODE CHOICE On Campus Student Mode Choice 3% 2% 2% Bike Car CatTran Walk 93% Survey Sample Size = 91 UA Students Source: Sun Tran U-Pass Survey, March Data on the type of parking permits and bus passes purchased by on-campus students is provided in Exhibit ,878 (35%) on-campus students purchase a parking permit of some type. 1,188 (22%) on-campus students purchase a garage parking permit. Only about three percent of on-campus students purchase a bus pass. University of Arizona 3-3 Final Report, April 2008.
26 Off-Campus Students Exhibit 3-3 ON-CAMPUS STUDENT PARKING PERMIT AND BUS PASS DATA On Campus Students Permit Type Number % No Permit 3, % Garage 1, % Lot Specific % Zone % South of Sixth % Street Specific 5 0.1% Motorcycle % Disabled Lot 2 0.0% Disabled Garage 5 0.1% Stored Value Bus Pass % Academic/Semester Bus Pass % Annual Bus Pass % Bicycle % Cat Tran Pass 0.0% Total 5, % Source: UA Parking and Transportation Services database, academic year. An illustration of the residential location for off-campus students is provided in Exhibit 3-4. A summary table indicating the number of students living within a specified distance from campus is provided in Exhibit 3-5. ArcView was used to establish distance rings from the boundary of the study area, and this was used to estimate the number of students living in each distance ring for the address matched data. The review of these data provides the following information: 28,725 total student records for off-campus students. 16,077 records were address matched to Pima County s Geographical Information System (GIS) database, providing a 56% match rate. 66 percent of the students live within five miles of campus. 29 percent live within one mile of campus. The spatial representation of off-campus student residential location indicates a high concentration of students surrounding the campus area, and then extending primarily to the north and east of campus. University of Arizona 3-4 Final Report, April 2008.
27 Exhibit 3-4 OFF-CAMPUS STUDENT RESIDENTIAL LOCATION Exhibit 3-5 ADDRESS MATCHED RESIDENTIAL LOCATION AND DISTANCE FROM CAMPUS FOR OFF-CAMPUS STUDENTS Distance From Address Match Campus (Miles) Number % 0 to 1 4, % 1 to 2 1, % 2 to 5 3, % 5 to 8 2, % 8+ 2, % Total 16, % University of Arizona 3-5 Final Report, April 2008.
28 Exhibit 3-6 provides a comparison of the proportion of off-campus students living a specified distance from campus for data from two independent sources, the U-Pass Survey, and the address match from the UA database. A statistical comparison of the distributions using the Chi Square Goodness of Fit test indicates that these distributions are the same at a 95 percent confidence level. Because the address match data represents a much larger sample, the distribution from the address match data was used to estimate the total number of students by distance from campus. Exhibit 3-6 PERCENT OF STUDENTS BY DISTANCE FROM CAMPUS Percent of Students by Distance From Campus 35.0% 30.0% 29.9% 29.2% Percent of Sample 25.0% 20.0% 15.0% 10.0% 24.7% 23.0% 16.3% 15.1% 11.3% 11.7% 20.8% 18.1% U Pass Survey Address Match 5.0% 0.0% 0 to 1 1 to 2 2 to 5 5 to 8 8+ Distance From Campus (Miles) Exhibit 3-7 provides the overall mode choice distribution for off-campus students provided by the U-Pass Survey. The U-Pass Survey data was also used to develop the mode choice distributions for off-campus students by distance from campus shown in Exhibit 3-8. A statistical analysis of the mode choice distribution by distance from campus indicated that mode choice for off-campus students is dependent on distance with a very high confidence level (Chi Square Test of Independence, 99.5% confidence level). As distance increases, auto mode choice increases while walk and bicycle mode choices decrease. Sun Tran bus mode choice percentage is highest in the two to five-mile distance from campus. University of Arizona 3-6 Final Report, April 2008.
29 Exhibit 3-7 OFF-CAMPUS STUDENT MODE CHOICE Off Campus Student Mode Choice 1.3% 3.5% 17.6% 17.3% 4.4% 8.2% Apartment Shuttle Bike Car SunTran CatTran Walk Motorcycle 47.8% Survey Sample Size = 318 UA Students Exhibit 3-8 OFF-CAMPUS STUDENT MODE CHOICE VERSUS DISTANCE FROM CAMPUS 100% Off-Campus Student Mode Choice Vs. Distance From Campus Total For Each Distance % Proportion By Mode 80% 70% 60% 50% 40% 30% 20% Motorcycle Walk CatTran SunTran Car Bike Apartment Shuttle 10% 0% 0 to 1 1 to 2 2 to 5 5 to 8 8+ Total Distance From Campus (Miles) University of Arizona 3-7 Final Report, April 2008.
30 Exhibit 3-9 provides a summary of the number of off-campus students purchasing parking permits and bus passes from the UA database. A comparison of these data with the mode choice data indicates the following: 47 percent travel to class by auto. 32 percent (9,269) buy a parking permit. 1.6 students arrive by auto per parking permit. The levels of carpooling, parking in UA adjacent neighborhoods, or paying daily for parking by off-campus students are unknown. Eight percent ride Sun Tran, but only five percent buy a bus pass. 60 percent of off-campus students do not have a permit of any type. Exhibit 3-9 OFF-CAMPUS STUDENT PARKING PERMIT AND BUS PASS DATA Permit Type No Permit Garage Lot Specific Zone 1 South of Sixth Street Specific Motorcycle Disabled Lot Disabled Garage Stored Value Bus Pass Academic/Semester Bus Pass Annual Bus Pass Bicycle Cat Tran Pass Total Off Campus Students Number % 17, % 4, % 1, % 2, % 1, % % % % % % 1, % % % % 28, % Source: UA Parking and Transportation Services database, The mode choice estimates by distance from campus from the U-Pass survey were applied to the total population of off-campus students. The number of students in each distance category is based on the proportions from the UA address match data provided in Exhibit 3-5. The results of the distributions of the number of students by mode and distance from campus are provided in Exhibit The overall distribution by mode differs slightly from that shown in Exhibit 3-7 because it is based on the sum of the number of students across the distance parameter. Exhibit 3-11 provides the distribution of the number of off-campus students by permit type and distance from campus. These data along with the data in Exhibit 3-9 provide valuable insight into the size and location of potential target populations for TDM measures. Nearly as many students arrive by car from two to five miles away (4,089) as from eightplus miles (4,558). University of Arizona 3-8 Final Report, April 2008.
31 The students living two to five-miles away represent a large and potentially the best target for reducing auto use for trips to campus, as this group also demonstrates the highest percent of Sun Tran use. Students living five to eight miles and eight-plus miles from campus are also a potential target to reduce auto use, but these groups may be more difficult to move to alternative modes. 1.6 students arrive by car per parking permit sold. This ratio varies directly with distance from campus from 0.7 to 2.0. For students living in the zero to one mile and one to two mile groups the ratio of auto use to parking permits is less than one, suggesting that permits purchased do not always translate into the use of a car to get to campus. For students living farther away the ratio is greater than one, suggesting carpooling, students parking in neighborhoods, or paying daily parking fees. 55 percent of off-campus students with parking permits live within five miles of campus. 43 percent of students living within five miles of campus arrive by auto. Exhibit 3-10 ESTIMATED NUMBER OF OFF-CAMPUS STUDENTS BY MODE AND DISTANCE FROM CAMPUS Distance from Campus in Miles Mode Choice 0 to 1 1 to 2 2 to 5 5 to 8 8+ Total % Car ,089 3,211 4,558 13, % Bicycle 2,298 1, , % Walk 4, , % Sun Tran , , % CatTran , % Apartment Shuttle , % Motorcycle % Total 8,396 3,364 7,108 4,670 5,187 28, % % 29.2% 11.7% 24.7% 16.3% 18.1% 100.0% Exhibit 3-11 ESTIMATED NUMBER OF OFF-CAMPUS STUDENTS BY PERMIT TYPE AND DISTANCE FROM CAMPUS Distance from Campus in Miles Permit Type 0 to 1 1 to 2 2 to 5 5 to 8 8+ Total % No Permit 6,608 1,957 3,673 2,407 2,641 17, % Parking (all types) 1, ,830 1,957 2,270 9, % Sun Tran (all types) , % Motorcycle % Bicycle % Cat Tran Pass % Total 8,396 3,364 7,108 4,670 5,187 28, % University of Arizona 3-9 Final Report, April 2008.
32 Exhibit 3-12 illustrates the residential location distribution of off-campus students that purchase parking permits of any type. These data and the data provided in previous exhibits suggest the following: There is a substantial potential to reduce auto travel to campus by focusing TDMs on the student group living within five miles of campus, particularly the group living in the two to five-mile range. The spatial orientation of residential location for students with parking permits is similar to that exhibited for students in general, with a high concentration to the north and east of campus. Since students living within two miles of campus show a lower level of auto use per parking permit purchased it may be easier for these students to do without a parking permit. Examples of TDM options for consideration that are directed at off-campus students include the following: - Provision of a neighborhood transit circulator, particularly to the north and east of campus, extending out to approximately five miles from campus. - Establishing a UA transit shuttle system along existing bus routes, using small buses that operate at a high frequency of service, and with stops on campus. - The application of a universal bus pass given to all students. - Pay per use parking only, no parking permits. - Student rideshare matching. - Distance differential parking pass fee (closer in pay more). - Increased parking permit cost. University of Arizona 3-10 Final Report, April 2008.
33 Exhibit 3-12 RESIDENTIAL LOCATION FOR OFF-CAMPUS STUDENTS WITH PARKING PERMITS EXISTING UA AND UMC EMPLOYEE RESIDENTIAL LOCATION, MODE CHOICE, AND PERMIT DATA An illustration of the residential location for UA employees is provided in Exhibit ArcView was used to establish distance rings from the boundary of the study area, and this was used to estimate the number of UA employees living in each distance ring from the address matched data. An address database for UMC employees was not available for this study, so the PAG TRP Survey data on residential distance from campus was used for UMC employees. University of Arizona 3-11 Final Report, April 2008.
34 Exhibit 3-13 UA EMPLOYEE RESIDENTIAL LOCATION Exhibit 3-14 illustrates the residential location distribution of UA employees that purchase parking permits of any type. These data and the data provided in previous exhibits suggest the following: 44 percent of employees with parking permits live within five miles of campus. 57 percent of employees living within five miles of campus arrive by auto. There is a substantial potential to reduce auto travel to campus by focusing TDMs on the UA employee group living within five miles of campus, particularly the group living in the two to five-mile range. The spatial orientation of residential location for employees with parking permits is similar to that exhibited for employees and off-campus students in general, with a high concentration to the north and east of campus. Example TDM options for consideration that are directed at UA employees are similar to those indicated for off-campus students, and include the following: University of Arizona 3-12 Final Report, April 2008.
35 - Provision of a neighborhood transit circulator, particularly to the north and east of campus, extending out to approximately five miles from campus. - Establishing a UA transit shuttle system along existing bus routes, using small buses that operate at a high frequency of service, and with stops on campus. - The application of a universal bus pass given to all employees. - Pay per use parking only, no parking permits. - Distance differential parking pass fee (closer in pay more). - Increased parking permit cost. Exhibit 3-14 RESIDENTIAL LOCATION FOR UA EMPLOYEES WITH PARKING PERMITS A summary table indicating the number of UA and UMC employees living within a specified distance from campus is provided in Exhibit The review of these data provides the following information: 10,647 total UA employee records included in the address database. 7,447 address matches for a 76 percent match rate. University of Arizona 3-13 Final Report, April 2008.
36 53 percent of UA employees and 22 percent of UMC employees live within five miles of campus. 18 percent of UA employees and 2 percent of UMC employees live within one mile of campus. The spatial representation of UA employee residential location indicates a high concentration of employees surrounding the campus area, and then extending primarily to the north and east of campus. This is similar to the spatial distribution of off-campus students. The residential location distributions of UA and UMC employees are significantly different statistically (Chi Square Goodness of Fit Test with a 95 percent confidence level). UMC employees live farther away from campus than UA employees with a much higher percent of UMC employees (63%) living eight-plus miles from campus than UA employees (24%). The difference in the residential distance from campus between the UA and UMC employees suggests that these two groups should be treated separately in this analysis. Exhibit 3-15 UA AND UMC EMPLOYEE RESIDENTIAL DISTANCE FROM CAMPUS Distance From UA Employee Address Match UMC TRP Survey Total Campus (Miles) Number % Number % Number % 0 to 1 1,929 18% 68 2% 1,996 15% 1 to 2 1,044 10% 113 4% 1,157 8% 2 to 5 2,612 25% % 3,086 23% 5 to 8 2,492 23% % 2,960 22% 8+ 2,571 24% 1,929 63% 4,499 33% Total 10, % 3, % 13, % Exhibit 3-16 shows UA employee mode choice overall and as a function of distance from campus. The mode choice distribution is dependent on distance from the UA (Chi Square Test for Independence, 95 percent Confidence Level). Exhibit 3-16 provides data on the number of UA employees purchasing various parking permits and bus passes. Comparison of the information in these exhibits indicates the following: 69 percent of UA employees drive to work, but only 48 percent buy a parking permit. 5 percent ride a Sun Tran bus, while 7 percent buy a bus pass. 13 percent carpool UA employees have an overall auto occupancy of percent ride a bicycle to campus, but only 0.2 percent register their bicycles. 43 percent do not buy a permit of any type. Mode choice for UA employees is dependent on distance from campus (Chi Square Test of Independence, 95 percent confidence level). 1.4 UA employees drive to campus per parking permit purchased. University of Arizona 3-14 Final Report, April 2008.
37 Exhibit 3-16 UA EMPLOYEE MODE CHOICE UA Employee Mode Choice 7.6% 3.4% 13.4% 5.0% 1.3% 0.4% Drive Bike Walk Carpool Bus Telecommute 1 Field work 1. Field work means the employees commute to a location other than the UA campus. Values w eighted by number of days for each mode indicated. 68.9% Survey Sample Size = 6,947 UA Employees 100% 80% UA Employee Mode Choice Vs. Distance From Campus Total Employees For Each Distance Range ,406 1,200 3,462 Bus Carpool Walk Bike Drive Proportion By Mode 60% 40% 20% 0% 0 to 1 1 to 2 2 to 5 5 to 8 8+ Distance from Campus (Miles) Source: PAG TRP Survey data, University of Arizona 3-15 Final Report, April 2008.
38 Exhibit 3-17 NUMBER OF UA EMPLOYEES PURCHASING PARKING PERMITS AND BUS PASSES UA Employees Permit Type Number % No Permit 4, % Garage 2, % Lot Specific % Zone 1 1, % South of Sixth % Street Specific % Motorcycle % Disabled Lot % Disabled Garage % Stored Value Bus Pass % Academic/Semester Bus Pass % Annual Bus Pass % Bicycle % Cat Tran Pass % Total 10, % Source: UA Parking and Transportation Services database, Exhibit 3-18 shows UMC employee mode choice overall and as a function of distance from campus. Comparison of the information in Exhibit 3-17 to data for UA employees indicates the following: The mode choice distribution of UMC employees is significantly different from that of UA employees (Chi Square with 95% confidence level). More UMC employees drive and fewer use all other modes than UA employees. 84 percent of UMC employees drive to work. 11 percent of UMC employees carpool. UMC employee overall auto occupancy is percent ride a bicycle to UMC. 1.7 percent take the bus. The mode choice distribution for UMC employees is dependent on the distance from UMC (Chi Square Test for Independence, 95 percent Confidence Level). It should also be noted that parking is free for UMC employees, which may contribute to the higher levels of drive mode choice for this group. University of Arizona 3-16 Final Report, April 2008.
39 Exhibit 3-18 UMC EMPLOYEE MODE CHOICE UMC Employee Mode Choice 0.5% 0.8% 1.7% 0.8% 1.4% 10.8% 84.2% Drive Bike Walk Carpool Bus Telecommute 1 Field work 1. Field work means the employees commute to a location other than UMC. Survey Sample Size = 2,650 UMC Employees UMC Employee Mode Choice Vs. Distance From UMC Total Employees For Each Distance Range 100% ,655 Proportion By Mode 90% 80% 70% 60% 50% 40% 30% 20% 10% Bus Carpool Walk Bike Drive 0% 0 to 1 1 to 2 2 to 5 5 to 8 8+ Distance From UMC (Miles) Source: PAG TRP Survey data, University of Arizona 3-17 Final Report, April 2008.
40 Estimated Overall UA and UMC Employee Mode Share by Distance from Campus For the purpose of developing a mode share estimate of the total number of employees currently using each mode of travel as a function of distance from campus, the following assumptions and methods were used for this study. UA employees will be treated as a separate group. The number of individuals in each distance group was estimated based on the combined total distribution from the address match data shown in Exhibit The mode share distribution for each distance group was based on the 2005 PAG TRP Survey results shown in Exhibit UMC employees will be treated as a separate group. The number of individuals in each distance group was based on the distribution from the 2005 PAG TRP Survey shown in Exhibit The mode share distribution for each distance group was based on the 2005 PAG TRP Survey results shown in Exhibit The estimated number of UA employees by mode and distance from campus is provided in Exhibit The estimated number of employees by permit type and distance from campus is provided in Exhibit Exhibit 3-19 ESTIMATED NUMBER OF UA EMPLOYEES BY MODE AND DISTANCE FROM CAMPUS Distance from Campus in Miles Mode Choice 0 to 1 1 to 2 2 to 5 5 to 8 8+ Total % Drive ,821 1,963 2,080 7, % Bike % Walk % Carpool , % Bus % Total 1,929 1,044 2,612 2,492 2,571 10, % % 18.1% 9.8% 24.5% 23.4% 24.1% 100.0% Note that the above estimates exclude Telecommute and Field Work with a combined total of 1.7% of the mode share. Exhibit 3-20 ESTIMATED NUMBER OF UA EMPLOYEES BY PERMIT TYPE AND DISTANCE FROM CAMPUS Distance from Campus in Miles Permit Type 0 to 1 1 to 2 2 to 5 5 to 8 8+ Total % No Permit 1, , , % Parking (all types) ,305 1,454 1,476 5, % Sun Tran (all types) % Motorcycle % Bicycle % Cat Tran Pass % Total 1,929 1,044 2,612 2,492 2,571 10, % University of Arizona 3-18 Final Report, April 2008.
41 The estimated total number of UMC employees by mode and distance from UMC is provided in Exhibit Comparison of these data with the data in Exhibit 2-19 indicated the following: UMC employees live farther from campus than UA employees. Only 21 percent of UMC employees live within five miles of campus compared to 52 percent of UA employees. 63 percent of UMC employees live 8+ miles from campus, compared to only 24 percent of UA employees. Exhibit 3-21 ESTIMATED NUMBER OF UMC EMPLOYEES BY MODE AND DISTANCE FROM UMC Distance from UMC in Miles Mode Choice 0 to 1 1 to 2 2 to 5 5 to 8 8+ Total % Drive ,681 2, % Bike % Walk % Carpool % Bus % Total ,929 3, % % 2.2% 3.7% 15.5% 15.3% 63.2% 100.0% TOTAL COMBINED STUDENT AND EMPLOYEE MODE CHOICE FOR 2007 The estimates of individuals by mode and distance from campus contained in Exhibits 3-10, 3-19, and 3-21 were combined to provide a total estimate of the number of the UA community by mode and distance from campus. These data are shown in Exhibit 3-22, and represent a means to determine the target populations for TDM measures. For the lack of available data, the auto occupancy for off-campus students was assumed to be equal to that of UA employees (1.2 persons per vehicle) for the purpose of estimating the total level of carpooling. The combined estimate of mode choice by distance from the study area is provided in Exhibit Review of the mode choice estimates indicates the following: 59 percent of the total population of interest in this study lives within five miles of campus. 40 percent of the drive mode choice (8,556) lives within five miles of campus. 42,280 auto trips are made to and from campus by students and employees each day. 21,140 student and employee autos come to campus each day. 18,537 UA students and UA employees drive to campus each day, but only 16,848 permits are purchased, an overall drive/permit ratio of 1.1. Nine percent carpool, indicating that 59 percent arrive by auto. 14 percent ride a bicycle. 13 percent walk. Seven percent take a Sun Tran bus. Three percent use Cat Tran (some Cat Tran users drive to a remote parking lot first). University of Arizona 3-19 Final Report, April 2008.
42 2.5 percent are estimated to use privately operated apartment shuttles. These are all students. One percent ride a motorcycle. Off-campus students make up 53 percent of the drive mode, UA employees 35 percent, and UMC employees 12 percent. Exhibit ESTIMATED TOTAL NUMBER OF PERSONS BY MODE AND DISTANCE FROM THE STUDY AREA Distance from Study Area in Miles Mode Choice 0 to 1 1 to 2 2 to 5 5 to 8 8+ Total % Drive 1,585 1,345 5,625 5,026 7,559 21, % Bicycle 2,805 1,902 1, , % Walk 4, , % Carpool , ,357 4, % Sun Tran , , % CatTran , % Apartment Shuttle , % Motorcycle % Total 10,392 4,521 10,194 7,631 9,686 42, % % 24.5% 10.7% 24.0% 18.0% 22.8% 100.0% Assumes auto occupancy of 1.2 for off-campus students. Excludes all On-Campus Students Motorcycle 0 to 1 and 5 to 8 mile numbers adjusted to provide overall 1.0% mode choice. Exhibit ESTIMATED TOTAL MODE CHOICE VERSUS DISTANCE 100% Combined Mode Choice Vs. Distance From Study Area (Off-Campus Students, UA Employees, and UMC Employees) Total For Each Distance 10,392 4,521 10,194 7,631 9,686 42,424 Proportion By Mode 90% 80% 70% 60% 50% 40% 30% 20% 10% Motorcycle Apartment Shuttle CatTran Sun Tran Carpool Walk Bicycle Drive 0% 0 to 1 1 to 2 2 to 5 5 to 8 8+ Total Distance From Study Area (Miles) University of Arizona 3-20 Final Report, April 2008.
43 YEAR 2010 TRAVEL DEMAND FORECAST BY MODE The 2010 estimated mode choice and distance from campus values are based on the assumption that the overall distribution by distance from campus and mode remains the same as the existing condition. That is, nothing is done to change the status quo, except that an additional 1,688 students will be housed on-campus. 1 The 2010 forecast of the combined number of students, UA employees, and UMC employees by mode and distance from campus is provided in Exhibit This combined forecast is based on the 2010 total UA population shown in Exhibit 3-1 and the existing distribution of employees and students by mode and distance from campus shown in Exhibit Year 2010 mode choice by distance from campus is also presented graphically in Exhibit A comparison of the year 2010 forecast and the estimates for the existing condition indicate the following: The number of estimated daily auto trips to and from campus is forecast to increase 15 percent from 42,280 to 48,816, or 6,536 auto trips to and from campus per day. The number of automobiles coming to campus is estimated to increase by 3,265 per day for students and employees. It is estimated that the year 2010 travel demand will increase AM peak-hour traffic by 556 vehicles to a total of 4,145 vehicles per hour. It is estimated that the year 2010 travel demand will increase the PM peak-hour traffic by 569 vehicles to a total of 4,248 vehicles per hour. The year 2010 travel demand forecast indicates that there will be a substantial portion (20 percent) of the UA population living within 5 miles of campus and driving to work. 30 percent of the UA population will live more than 5 miles from campus and drive to work. It should be noted that while the forecast travel demand by mode for the university community is based on a student enrollment of 40,000, the procedure used to develop the forecast is completely scalable, and can be applied to estimate travel demand for higher levels of growth. This procedure can also be used to estimate the potential impacts of certain types of travel demand management strategies on auto travel, by estimating the size of the university community impacted. This latter point is demonstrated through a few examples provided in Chapter 4 of this document (see Options to Reduce Automobile Use and Roadway Congestion, page 4-1). 1 This estimate is based on forecasts and development recommendations contained in the Space Needs Analysis for the Campus Master Plan, May University of Arizona 3-21 Final Report, April 2008.
44 Exhibit 3-24 YEAR 2010 NUMBER OF PERSONS BY MODE AND DISTANCE FROM STUDY AREA Distance from Campus in Miles Mode Choice 0 to 1 1 to 2 2 to 5 5 to 8 8+ Total % Drive 1,830 1,553 6,494 5,803 8,727 24, % Bicycle 3,238 2,195 1, , % Walk 5, , % Carpool ,272 1,073 1,567 4, % Sun Tran , , % CatTran , % Apartment Shuttle , % Motorcycle % Total 11,998 5,220 11,770 8,811 11,183 48, % % 24.5% 10.7% 24.0% 18.0% 22.8% 100.0% Assumes auto occupancy of 1.2 for off-campus students. Excludes all On-Campus Students Motorcycle 0 to 1 and 5 to 8 mile numbers adjusted to provide overall 1.0% mode choice. Exhibit 3-25 YEAR 2010 MODE CHOICE BY DISTANCE FROM STUDY AREA 100% 2010 Projected Combined Mode Choice Vs. Distance From Study Area (Off-Campus Students, UA Employees, and UMC Employees) Total For Each Distance 11,998 5,220 11,770 8,811 11,183 48,982 Proportion By Mode 80% 60% 40% 20% Motorcycle Apartment Shuttle CatTran Sun Tran Carpool Walk Bicycle Drive 0% 0 to 1 1 to 2 2 to 5 5 to 8 8+ Total Distance From Study Area (Miles) University of Arizona 3-22 Final Report, April 2008.
45 EXISTING TRANSIT SERVICE SERVING THE UNIVERSITY The University area is currently served by Sun Tran, a fixed-route bus system operated by the City of Tucson, CatTran, a shuttle service operated by the University, and complementary paratransit service also operated by the City. A third City operation, TICET, a local downtown circulator, connects at the downtown Ronstadt Transit Center with many of the SunTran routes that serve the University. The Ronstadt Center is the closest transit center to the UA, and is also served by other SunTran routes connecting throughout the metropolitan Tucson area. Pursuant to the Regional Transportation Plan enacted by area voters in 2006, a number of public transportation improvements directly impacting the University area, including a new modern streetcar service, are programmed along with more evening and weekend service. Private shuttle service to the UA is also provided by several student apartment communities. Sun Tran routes serving the University area are shown in Exhibit 3-26 along with a detail of the routes serving the main UA campus. Exhibit 3-26 illustrates the importance of the transit system to the University and shows the significant amount of service available on or adjacent to campus. Exhibit 3-27 provides the locations of Sun Tran bus stops near the UA and indicates the presence/absence of shelters at the stops along these routes. Existing CatTran shuttle routes are shown in Exhibit The CatTran Shuttle operates Monday trough Friday, except holidays observed by the University. The shuttle also serves remote park-n-ride lots along the Orange, Mauve, and USA routes. The shuttle is available to all students and employees with a valid UA identification card. A CatTran service summary is provided in Exhibit A summary of CatTran shuttle ridership for is provided in Exhibit The historic Old Pueblo Trolley operates on Fridays, Saturdays, and Sundays between the West Entrance of the University on University Boulevard and the 4th Avenue district. The Old Pueblo Trolley alignment, with improvements such as double-tracking, will comprise a segment of the new modern streetcar system that is currently in the planning stages of implementation. The modern streetcar is currently anticipated to be fully operating by 2016, and will extend westward from the current end of the Old Pueblo Trolley operation on 4th Avenue through a new 4th Avenue underpass programmed to be constructed under the Union Pacific Railroad, past the Southern Pacific station, and on through downtown to the Rio Nuevo area as shown in Exhibit The streetcar will extend eastward through the University campus to the vicinity of the Arizona Health Sciences Center. A survey was conducted to investigate privately funded shuttle service to campus provided by various off campus housing communities. A list of all student housing communities indicated to provide UA shuttle service to its tenants was developed from the University of Arizona, Off- Campus Housing Guide and Commuter Resource Book, Housing Locater, This publication lists all student housing near campus and lists details of each community including whether or not it provides shuttle service to the UA. A telephone interview process was conducted to provide details on the shuttle service provided. Six housing communities were verified to provide UA shuttle service. A summary of the information gathered from the telephone interview process is provided in Exhibit University of Arizona 3-23 Final Report, April 2008.


46 Exhibit 3-26 SUN TRAN BUS ROUTES NEAR THE UA Source: SunTran University of Arizona 3-24 Final Report, April 2008.
47 Exhibit 3-27 SUN TRAN BUS STOP LOCATIONS AT UA Source: Sun Tran University of Arizona 3-25 Final Report, April 2008.

48 Exhibit 3-28 EXISTING CATTRAN SERVICE MAP Source: UA Parking and Transportation Services. University of Arizona 3-26 Final Report, April 2008.
49 Exhibit 3-29 CATTRAN SERVICE SUMMARY Route U.S.A. Purple Mauve Teal Orange Key Stops on Campus (Time Points) U.S.A. Building, 9006 Loop, Main Gate Garage, Student Union 6 th Street Garage, Shantz South, Main Library, AHS/Nursing 9008 Loop, N. Highland (East), Main Library, AHS/Nursing, N. Highland (West) ASHC Med. Library, McClelland Hall, Student Union, Main Gate Garage, Education Building 9004 Loop, 9007 Lot, 9005 Lot, Education Building Source: University of Arizona, CatTran Shuttle Service Guide, Service Hours Average Headway min min min min min. Exhibit 3-30 CATTRAN SHUTTLE RIDERSHIP Parking and Transportation Services / Alternative Transportation Fiscal Year Shuttle Service Cat Tran Ridership History Month FY Cat Tran Ridership Comparison to Last Year (05-06 FY) USA MAUVE ORANGE PURPLE TEAL NIGHTCAT TOTAL L.Y. TOTAL Variance % Jul ,312 7, ,120 12,140 1, % Aug-06 4,095 7,329 8,563 9,275 17, ,885 33,352 13, % Sep-06 6,043 13,574 15,791 11,424 23, ,108 62,211 8, % Oct-06 6,411 13,365 16,229 11,747 22, ,354 63,219 8, % Nov-06 4,912 10,072 12,889 9,178 16, ,243 50,581 3, % Dec-06 2,131 3,477 4,176 3,971 7, ,582 22,631-1, % Jan-07 4,327 7,418 9,260 7,150 13, ,238 38,049 4, % Feb-07 4,901 8,238 11,707 8,712 16, ,265 46,862 3, % Mar-07 4,433 7,422 9,014 7,735 14, ,238 42, % Apr-07 4,837 9,128 10,508 9,162 16, ,240 46,058 5, % YTD TOTALS 43,015 80,023 98,137 83, ,599 4, , ,688 48, % Source: University of Arizona Parking & Transportation Services. University of Arizona 3-27 Final Report, April 2008.

50 University of Arizona 3-28 Final Report, April Exhibit 3-31 PROPOSED MODERN STREET CAR ROUTE
51 Exhibit 3-32 SUMMARY OF OFF CAMPUS HOUSING SHUTTLE SERVICE DATA Community Name Country Club Terrace Deerfield Village Northpointe The Reserve at Star Pass Sahara Apartments College Place 1 Number of Shuttles in Service Trip Frequency 4 Per Day 4 Per Day Every 40 Minutes Every 40 Minutes Every Hour On The Half Hour Every Hour on the Hour Roundtrips/ Day 2 morning, 2 afternoon 2 morning, 2 afternoon Daily Passengers ~ 20 ~ 20 ~ 250 ~ 300 ~ 25 ~100 1 Service Schedule Fixed Fixed Fixed Fixed Fixed Fixed Hours of Operation 7:00 am to 8:00 am, 4:00 pm to 5:00 pm 7:00 am to 8:00am, 4:00 pm to 5:00 pm 6:40 am to 5:40 pm 7:00 am to 5:30 pm 7:30 am to 5:20 pm 7:30 am to 5:30 pm Days of Operation Mon Fri or every school day Mon Fri or every school day Mon Fri or every school day Mon Fri or every school day Mon Fri or every school day Mon Fri or every school day Additional Charge? No No No No Yes No Additional Notes 5 Stops at UA, Shares Van with Deerfield Village 5 Stops at UA, Shares Van with Country Club Terrace Stops at Pima CC Before Arriving at UA Old Main Stops at Pima CC Before Arriving at UA Old Main Stops at Student Union Memorial Center Only Stops at Old Main, Separate Runs to PCC as Needed University of Arizona 3-29 Final Report, April 2008.
52 U-PASS USAGE TREND The U-Pass is a Sun Tran transit pass available to both students and employees at a discounted price. A total of 2,248 U-Passes where reported by the UA to have been purchased by students and employees during the academic year. The pass allows unlimited rides on Sun Tran buses. Sun Tran data on overall U-Pass usage during calendar years 2006 and 2007 are provided in Exhibit The data included information on U-Pass usage by bus route. These data indicate the following: There were 37 Sun Tran routes with U-Pass usage. Overall, U-Pass usage declined by 8.7 percent from 2006 to routes exhibited declining U-Pass usage. 14 routes exhibited an increase or no change in U-Pass usage. These data do not necessarily indicate a decline in Sun Tran ridership by UA students, as 8.5 percent of students indicate a transit mode choice, but only 5.0 percent purchase a bus pass. It does indicate a decline in U-Pass use. A potential strategy to reduce traffic demand and congestion could be to encourage a mode shift from auto to transit by increasing the use of U-Pass by students and employees. The use of a universal U-Pass, where all students are given a bus pass for a small registration fee, is an option that could significantly increase transit use by students. Exhibit 3-33 U-PASS USAGE TREND Annual Ridership % Change Total 397, , PARKING PERMITS Exhibit 3-34 provides data on the number of parking permits sold during academic year and the number of parking spaces available for each permit type. The UA currently limits the number of parking permits sold, but does sell more permits than the spaces available to allow for high utilization of spaces while accounting for turnover in use. There is a waiting list for permit purchase. Based on information contained in the 2003 Comprehensive Plan, the number of non-visitor spaces is not expected to increase substantially by year 2010, and may decline due to new building construction that replaces existing parking lot space 2. 2 The University of Arizona Comprehensive Campus Plan, June 2003, Appendix 4, Parking and Transportation Report, page 88, Table 7-1. University of Arizona 3-30 Final Report, April 2008.
53 Exhibit PARKING SPACES AND PARKING PERMITS Permits Non-Visitor Permit/Space Sold 1 Spaces 1 Ratio Garages 8,499 6, Parking Lots/Street 7,811 6, Motorcycle Disabled Carpool TOTAL 16,848 13, Source: UA Parking and Transportation Services database and inventory, UA PARKING COST COMPARISON Exhibit 3-35 provides a summary of current UA parking cost and a comparison to costs for Arizona State University, Pima County, and the City of Tucson. These data suggest that UA parking cost is low in comparison to comparable parking costs at ASU and for Pima County and City of Tucson employees. Raising parking cost, or charging on a per use basis could help reduce parking demand at the UA and thus reduce traffic congestion in the area. To avoid an increase in the number of students and employees parking in adjacent neighborhoods, an expansion of the City of Tucson neighborhood parking ban program may be required with the increase in UA parking cost. Exhibit 3-35 UA PARKING COST COMPARISON FY Annual Parking Rates Parking Type UA 1 ASU 2 (Downtown) 3 ParkWise 4 Pima County Garages $494 $480 - $660 $1,020 $660 - $1,020 Lot Specific $143 - $394 $180 - $600 $300 - $480 Motorcycle $97 $240 Zone 1 $279 South of Sixth $279 Sources: 1. UA PTS (FY 07-08) 2. ASU PTS (FY 07-08) 3. Pima County Facilities Management Department 4. City of Tucson Deptartment of Transportation University of Arizona 3-31 Final Report, April 2008.
54 UA PARKING ACTIVITY As of September 2006 the UA managed a total of 17,403 parking spaces within the planning area. This includes on-street metered parking, parking for service vehicles, motorcycle parking, reserved parking, leased parking, and visitor parking, along with permit spaces in the parking lots and garages. The UA parking lot layout is provided in Exhibit The UA Parking and Transportation Services periodically conducts a parking lot inventory and utilization survey, the last one of which was conducted in September The results of the last parking utilization inventory are provided in Exhibit This inventory indicates that during peak utilization the UA parking facilities are near capacity, and during peak periods may be over capacity. The high peak utilization coupled with the anticipated growth in the UA community strongly indicates a need to reduce automobile travel demand to the campus. University of Arizona 3-32 Final Report, April 2008.

55 Exhibit 3-36 UA PARKING LOT LAYOUT MAP Source: University of Arizona Parking & Transportation Services. University of Arizona 3-33 Final Report, April 2008.
56 Exhibit 3-37 UA PARKING INVENTORY/ UTILIZATION UNIVERSITY OF ARIZONA PARKING AND TRANSPORTATION SERVICES PARKING INVENTORY Base Count - August 5, 1997 Last Update -September 5, 2006 LOT/ LOCATION ZONE 1 LOT SPECIFIC LOTS S. OF SIXTH ST. STREET SPECIFIC FLEX GARAGES S/V L/UL H/R H/C RES C/P Motorcycle Meter HC/ Meter MC/ Meter Visitor Other Leased TOTAL Total Spaces 3,259 1,502 1, , , ,403 Average Utilization 76% 55% 71% 42% 29% N/A 57% 38% 57% 40% 51% 24% 41% 53% N/A N/A N/A 45% 19% N/A Peak Utilization 91% 75% 84% 60% 47% N/A 90% 78% 96% 70% 79% 46% 68% 90% N/A N/A N/A 82% 64% N/A UA Garage Occupancy (All Garages) Average Maximum Total Garage Capacity Cumulative Entries :00 AM 8:00 AM 9:00 AM 10:00 AM 11:00 AM 12:00 PM 1:00 PM 2:00 PM 3:00 PM 4:00 PM Time of Day Source: University of Arizona Parking & Transportation Services. University of Arizona 3-34 Final Report, April 2008.
57 UA Parking and Transportation Services (PTS) also provided data on parking garage average entry and exit permit activity per hour facility wide (summer excluded). These data are plotted in Exhibit These data indicate the following: The peak activity periods for the UA garages by permit holders (students and employees) are from 7:00 9:00 AM and 4:00 6:00 PM. 9.6 percent of the garage activity occurs between 8:00 9:00 AM. 8.3 percent of the garage activity occurs between 5:00 6:00 PM. No data on the hourly activity for parking lots were available for this study. Entering and exiting 24-hour traffic counts were conducted at six UA parking lots locations on two consecutive weekdays during September The UA parking lot numbers and locations of the data collection are: Lots 4052, 4053, 4176 (considered a single lot for data collection) located between 1 st Street and Speedway Boulevard at North Vine Avenue. (Zone 1 lot). Lot 6098 located in the northeast corner of East Enke Street and North Martin Avenue. (Zone 1 lot) Lot 7103 located in the northeast corner of North Park Avenue and East 7 th Street. (South of 6 th lot) Lot 8106 located in the southeast corner of North Highland Avenue and East 7 th Street. (South of 6 th lot). Lot 9005 located on Plumer Avenue south of Broadway Boulevard (Lot Specific Park and Ride Lot). Lot 9008 located in the southeast corner on North Mountain Avenue and East Adelade Drive (Lot Specific Park and Ride Lot). The results of the traffic data collection for all of the parking lots combined are provided in Exhibit These data indicate the following: The peak activity periods for the six parking lots were 7:00 9:00 AM and 5:00 7:00 PM. The peak activity periods are slightly different than for the garage activity, with a less pronounced peak during the AM peak period. The AM peak-hour is 9:00 10:00 AM, which is an hour later than the peak-hour for the garages. 6.6 percent of daily activity occurs between 9:00 10:00 AM. 9.5 percent of daily activity occurs between 5:00 6:00 PM. University of Arizona 3-35 Final Report, April 2008.
58 Exhibit 3-38 UA GARAGE ACTIVITY FOR PERMIT HOLDERS 1600 Average Entry + Exit Permit Activity Per Hour Facility Wide (Summer Excluded) :00 1:00 2:00 3:00 4:00 5:00 6:00 7:00 8:00 9:00 10:00 11:00 12:00 13:00 14:00 15:00 16:00 17:00 18:00 19:00 20:00 21:00 22:00 23:00 Vehicles Per Hour Hour Beginning Permit Entries Permit Exits Source: UA Parking and Transportation Services, August (summer excluded). Exhibit 3-39 UA PARKING LOT ACTIVITY UA Surface Lot Average Activity Per Hour for 6 Lots 9/18/07-9/19/07 Vehicle Per Hour :00 1:00 2:00 3:00 4:00 5:00 6:00 7:00 8:00 9:00 10:00 11:00 12:00 13:00 14:00 15:00 16:00 17:00 18:00 19:00 20:00 21:00 22:00 23:00 Hour Beginning In (Average) Out (Average) Source: Morrison-Maierle, Inc. traffic counts, September University of Arizona 3-36 Final Report, April 2008.
59 Exhibit 3-40 provides the combined garage and parking lot activity from Exhibits 3-38 and Exhibit 3-41 provides the hourly traffic distribution of the total entering traffic for a typical day at the Speedway Boulevard / Campbell Avenue intersection adjacent to the UA campus. Examination of these data suggests the following: The peak-periods for the combined garage and lot data are from 7:00 9:00 AM and from 4:00 6:00 PM. This is coincident with the peak travel periods for the adjacent streets based on comparison to the data in Exhibit percent of the daily UA activity occurs between 8:00 9:00 AM. 8.7 percent of the daily UA activity occurs between 5:00 6:00 PM. There is a slightly higher peaking for UA traffic than other traffic in the area. Applying the peak-hour percentages from above to the estimated 42,280 daily student and employee auto trips to the UA yields the following peak-hour UA traffic estimates: - AM peak-hour UA traffic is approximately 3,590 vehicles per hour. - PM peak-hour UA traffic is approximately 3,680 vehicles per hour. The analysis of these data suggests that reducing UA peak-hour traffic demand can have a significant impact on adjacent street traffic volume and congestion. Strategies for reducing total demand, or for moving traffic out of the peak activity hours to other, less congested time periods, should be considered. Exhibit 3-40 COMBINED GARAGE AND PARKING LOT ACTIVITY 2,500 Average Entry + Exit Permit Activity Per Hour Garages & 6 Lots (Summer Excluded) 2,000 Vehicles Per Hour 1,500 1, :00 1:00 2:00 3:00 4:00 5:00 6:00 7:00 8:00 9:00 10:00 11:00 12:00 13:00 14:00 15:00 16:00 17:00 18:00 19:00 20:00 21:00 22:00 23:00 Hour Beginning Total Entries Total Exits University of Arizona 3-37 Final Report, April 2008.
60 Exhibit 3-41 HOURLY TRAFFIC VOLUME DISTRIBUTION AT SPEEDWAY/CAMPBELL INTERSECTION (Total entering volume by hour) 8,000 Campbell Ave & Speedway Blvd Intersection Hourly Volume Total Entering Vehicles 7,000 6,000 5,000 4,000 3,000 2,000 1, :00 1:00 2:00 3:00 4:00 5:00 6:00 7:00 8:00 9:00 10:00 11:00 12:00 13:00 14:00 15:00 16:00 17:00 18:00 19:00 20:00 21:00 22:00 23:00 Hour Beginning UMC PARKING Source: PAG Traffic Counts, Information and data describing UMC parking facilities and use were provided by UMC Security. The information, including number of spaces, utilization information, visitor lot information, patient lot information and payment information for those who are not there as a patient or visitor is summarized in Exhibit University of Arizona 3-38 Final Report, April 2008.
61 University of Arizona 3-39 Final Report, April Exhibit 3-42 UMC PARKING INFORMATION 2 (North garage- employee parking & South Number of parking garages garage-mixed use parking) North garage parking capacity 960 Filled to capacity Monday through Friday with North garage utilization lighter weekend use South garage capacity spaces used for valet, 225 medical staff/ South garage usage admin and 430 patient/visitor parking Filled to capacity Monday through Friday and South garage utilization ~40% utilization on weekends 2 (West lot-employee parking & East ER lotpatient parking) Number of surface lots West lot parking capacity 485 East lot capacity 75 West lot is currently being used as a staging area for construction of a six story addition to the hospital. To offset the parking loss, UMC is Temporary condition leasing the 200 space Catalina Theater garage at Grant & Campbell. Employees use this garage and a shuttle is provided to UMC. Utilization of the leased garage ~75% Employees are issued permits that are a fringe Parking Permits benefit and is no cost to the employees The parking fee is based on the time spent in the garage/lot. Hospital patients and visitors Parking fees can get their parking validated and park free; this is to discourage parking for people not going to the hospital. Source: UMC Security. UA BICYCLE AND PEDESTRIAN FACILITIES The UA campus has an exceptionally high level of bicycle and pedestrian activity. Many thousands of bicycles are used on campus on a daily basis by both students and employees. It is estimated the over 6,000 off-campus students and employees travel to campus by bicycle each day (see Exhibit 3-22), and the bicycle accounts for over 14 percent of the mode choice for trips to campus. It is estimated that over 12,000 bicycle trips are made to and from campus on a daily basis, not including the relatively small number bicycle trips to and from classes made by on-campus students. While on campus, bicycle commuters will often travel between University buildings by bicycle, increasing the daily bicycle traffic on campus. If each bicycle user made only two additional bicycle trips between University buildings while on campus, this would increase the daily number of bicycle trips to over 24,000. The bicycle facilities within the UA planning area are extremely important to accommodate the level of bicycle activity. The UA Bike Route Map is provided in Exhibit As part of this study, a field inventory of the number, size (spaces per rack), and location of bike rack facilities, provided by the UA within the planning area was conducted in June These data were mapped using ArcGIS. This inventory is summarized in Exhibit A total of 8,963 bike rack spaces were counted through this inventory. The University indicates that between 600 and 900 students and employees register their bicycles with the University each year.

62 University of Arizona 3-40 Final Report, April Exhibit 3-43 UA BIKE ROUTE MAP
63 Exhibit 3-44 UA FIELD INVENTORY DATA BICYCLE RACK LOCATIONS Source: Morrison Maierle, Inc. field inventory data collection, June 11, 2007 through June 25, University of Arizona 3-41 Final Report, April 2008.
64 The UA planning area has an extensive network of sidewalks, ramps, and grade separations for pedestrians. However, the UA is concerned that there may be gaps in the sidewalk network and that this network may not be totally ADA compliant. A field inventory of the UA planning area was conducted in June 2007 to identify gaps in the sidewalk network and to identify locations where the curbs at intersections may not be ADA compliant. The inventory was conducted by data collectors walking along each roadway and street within the UA planning area. The following pedestrian facility features were inventoried: Absence of sidewalk Absence of pedestrian ramp or curb cut Presence of truncated dome warning strip on pedestrian ramps Presence of textured warning strip on pedestrian ramps The inventory data were mapped using ArcGIS. A summary of the field inventory for the absence of sidewalk is provided Exhibit The summary of the data on the absence of pedestrian ramps or curb cuts, and the type of warning treatment used on the pedestrian ramps is provided in Exhibit Note that if a location with a sidewalk is not identified with the absence of a ramp or curb cut, and the presence of truncated domes or texture treatment is not indicated, this means that no differential pavement texture treatment is present on an existing ramp. An example is Speedway Boulevard between Euclid Avenue and Campbell Avenue, where the sidewalk has decorative textured, but there is no differential texture treatment at the corner ramps. The inventory of pedestrian facilities identified a particular lack of sidewalks in the residential areas north of Speedway Boulevard and south of 6 th Street. These areas coincide with locations of high levels of student and employee residential activity and high pedestrian mode choice for trips to the UA. This, along with the identification of locations lacking ADA ramp treatments, suggests the potential for the development of projects by the City of Tucson to provide pedestrian facility improvements in these areas. University of Arizona 3-42 Final Report, April 2008.
65 Exhibit 3-45 ABSENCE OF SIDEWALK FIELD INVENTORY Source: Morrison Maierle, Inc. field inventory data collection, June 11, 2007 through June 25, University of Arizona 3-43 Final Report, April 2008.
66 Exhibit 3-46 PEDESTRIAN RAMP FIELD INVENTORY Source: Morrison Maierle, Inc. field inventory data collection, June 11, 2007 through June 25, University of Arizona 3-44 Final Report, April 2008.
67 LAND DEVELOPMENT OPPORTUNITIES The transportation system serving University interacts with development in the surrounding community. To better understand the dynamics of this interaction in the future, key development plans and proposals were identified in the University area through contacts with the City of Tucson Departments of Planning and Urban Design, Development Services, Transportation and Real Estate. The projects described herein and shown on Exhibit 3-47 are in various stages of development ranging from conceptual planning to nearing construction. Grant Road Corridor Plan The City of Tucson has initiated the Grant Road Corridor Plan to prepare for the redevelopment of a five mile portion of Grant Road, between Oracle and Swan Roads to add an additional travel lane in each direction. Following a corridor alignment study and design, the project will culminate with a land use plan. The land use plan, to be adopted by Mayor and Council as a Corridor Overlay Plan, will identify opportunities for new development at key intersections along Grant Road and establish guidelines to shape the nature of that development. In addition, an opportunity may exist to develop one or more enhanced transit transfer points along Grant Road to serve UA commuters at the following locations: Grant Road and Mountain Avenue intersection to facilitate transfers between Sun Tran buses and the CatTran Orange Line serving the UA campus. Grant Road and Campbell Avenue intersection to facilitate transfers between Sun Tran routes service these corridors. Grant Road and Campbell Avenue, Southeast Corner Among the most significant intersections of the Grant Road Corridor is Grant Road and Campbell Avenue. The shopping center at the southeast corner of Grant Road and Campbell Avenue, including the existing Walgreens, Bookman s and the now closed Catalina Theater has been discussed for redevelopment as a four to six story mixed use development. Some coordination with the adjacent neighborhood has occurred but no formal development submittals have been submitted to the City of Tucson. The parking garage formerly utilized by the Catalina Theater is currently contracted to the University Medical Center in conjunction with a shuttle service. Grant Road and Campbell Avenue, Northwest Corner The City of Tucson owns vacant property at the Northwest corner of Grant Road and Campbell Avenue. Opportunities for development of this property will likely emerge as a result of the Grant Road Corridor Plan. The Oracle Project The Oracle Project is a collaborative effort between neighbors, businesses and the City of Tucson to plan revitalization of the Oracle Road corridor between Speedway Boulevard and Grant Road. The project is focused on identifying redevelopment and reinvestment opportunities and will ultimately culminate in a land use plan to encourage and guide revitalization of the corridor. University of Arizona 3-45 Final Report, April 2008.
68 Oracle Road and Drachman Street, Northwest Corner Northwest of the Drachman Street circle interchange at Oracle Road, the Arizona Plaza Hotel is planned for a renovation and conversion to rental student housing. The renovated facility, to be known as College Place will house approximately 185 students with 20 rooms set aside for short-term stay. The renovation is expected to be complete with rooms open to students by April Full occupancy is expected by August The project includes a private van shuttle with service to the University each hour. Managers are investigating acquiring a 35 to 40-seat bus to supplement the 15-seat van. Shuttle service is also provided to destinations such as grocery stores on a regular schedule. The cost of the service is included in the rent. Oracle Road and Drachman Street, Northeast Corner With the reconfiguration of the Oracle Road/Drachman Street circle interchange into a typical T intersection, land at the northeast corner is planned for assembly and redevelopment as a six-story mixed use development to include ground floor retail, second floor office and approximately 80 units of residential condominiums above. The residential portion is targeted at mid-level professionals. A Planned Area Development rezoning was approved by Tucson Mayor and Council in September of Completion is anticipated in late 2009 to early Stone Avenue Corridor Study Completed in 2001, the Stone Avenue Corridor Study defines strategies to encourage infill of vacant land and redevelopment of under utilized property along Stone Avenue. The study provides development prototypes to draw significant Mixed-Use Commercial and Residential projects to the corridor. Speedway Boulevard and Stone Avenue, Southwest Corner One West, a mixed use development including 100 to 110 condominium units, retail and office with an above ground parking garage has been proposed at the Southwest corner of Speedway Boulevard and Stone Avenue. The project will require sale of land owned by the City of Tucson and a Planned Area Development rezoning. Speedway Boulevard and Stone Avenue, Northeast Corner The property at the northeast corner of Speedway Boulevard and Stone Avenue is currently vacant and is listed for sale. Discussions with the real estate broker for the property indicate that, considering the parcel s size, the principal interest in the property to date has been for single story retail development. Speedway Boulevard and 6 th Avenue, Northeast Corner The property formerly occupied by Chevron north of Speedway Boulevard stretching between 5 th and 6 th Avenues is currently vacant and could represent a significant development opportunity. A rezoning for the property was submitted in the late 1990 s but was not finalized and no formal development submittals have been made to the City of Tucson since. University of Arizona 3-46 Final Report, April 2008.
69 Broadway Corridor Plan Work on an update to the 1987 Broadway Corridor Study is anticipated to begin in late 2007 to early 2008 to prepare for the programmed widening of Broadway Boulevard to six total travel lanes and two transit lanes from Euclid Avenue to Country Club Road. The study, like the ongoing Grant Road Corridor Study, will include a land use element identifying guidelines and opportunities for compatible redevelopment. Changes to the proposed alignment may create opportunities to develop land acquired for the corridor identified in the 1987 study. Plumer Avenue and Broadway Boulevard, Northwest Corner A two-acre site at the Northwest corner of Plumer Avenue and Broadway Boulevard has been identified for a 56-unit senior housing development. The project is currently in the pre-design phase with construction estimated to begin in early 2008 and completion anticipated in Broadway Boulevard and Park Avenue, Northeast and Northwest Corners In anticipation of opportunities created by the realignment of the Broadway corridor, developer interest has been expressed to City of Tucson staff in a land assemblage to support a mixeduse development on the east and west sides of Park Avenue north of Broadway Boulevard. Still in the formative stages, the preliminary concept discussed is for a mixed use development including retail, commercial and high density residential with an opportunity for student housing. 22 nd Street Corridor Plan The City of Tucson has initiated the 22 nd Street Corridor Plan to prepare for the widening of 22 nd Street between Interstate 10 and Kino Boulevard. Like the Grant Road and Broadway Boulevard Corridor plans, the 22 nd Street Corridor Plan will have a land use component to identify and guide land development opportunities along the corridor following the road widening. Campbell Avenue and 36 th Street, The Bridges The Bridges is a proposed 350-acre master-planned mixed-use development located south of 36 th Street and west of Campbell Avenue. The project recently received Mayor and Council approval for a Planned Area Development rezoning which will allow approximately 1,000,000 square feet of commercial / retail / office and an approximately 350 room hotel on 129 acres; a maximum of 1,084 residential units on 117 acres; and a 53 acre University of Arizona biotech research park. This project will reinforce the importance of the Campbell Avenue / Kino Parkway corridor with its direct connection to the University of Arizona Campus and University Medical Center. Rio Nuevo and Downtown The Regional Transportation Authority (RTA) improvement package includes the implementation of a modern streetcar connection between the University and downtown. The implementation of the modern streetcar provides an exceptional opportunity for the redevelopment of land uses along the street car route. It may be possible to encourage the development of high intensity housing along the route geared towards the UA community. The availability of the modern streetcar with a direct connection to the UA could significantly reduce the use of the automobile for travel to and from the UA. This redevelopment could occur University of Arizona 3-47 Final Report, April 2008.
70 through incentives to the private sector, or it could occur through the development of student housing along the streetcar route by the UA. Both options should be investigated to maximize the use of the modern streetcar as a travel demand management measure. The Rio Nuevo Master Plan will continue to revitalize the downtown with a variety of projects including cultural attractions, housing, commercial development and restaurants. Major projects include the University of Arizona Science Center, Tucson Origins Heritage Park, Arena, and Depot Plaza. A number of mixed use/condominium housing developments are proposed downtown and are in varying stages of progress. These include the Lofts at Fifth Avenue, Town West/Nimbus Brewery, The Post, Presidio Terrace, the Santa Rita Hotel, the Martin Luther King building and the Rialto Block redevelopment. University of Arizona 3-48 Final Report, April 2008.
71 Exhibit 3-47 SUMMARY OF NEW LAND DEVELOPMENT NEAR UA University of Arizona 3-49 Final Report, April 2008.
72 IMPACT OF THE MODERN STREETCAR ON EXISTING UA AUTO TRAVEL DEMAND The potential impact of the modern street car on auto travel to and from the UA was estimated based on the estimate of the number of UA off-campus students and UA employees with parking permits living with ¼-mile of the planned street car route. The ¼-mile distance was chosen because this is the typical distance transit users are willing to walk in order to access transit service. This estimate was made using the UA student and employee address and parking permit databases provided by the UA. The results of this estimation process are provided in Exhibit Exhibit 3-48 ESTIMATED POTENTIAL OF THE INITIAL MODERN STREET CAR SERVICE TO REDUCE AUTO TRAVEL TO THE UA BY STUDENTS AND EMPLOYEES UA Off-Campus Students Number with Auto Parking Permit Number of Address Matches Address Match Rate Address Match Number Within ¼ - Mile Of Modern Street Car Route Adjusted Number Within ¼-Mile Of Modern Street Car Route 7,885 7, UA Employees 5,216 5, Based on the data presented in Exhibit 3-48, a maximum of approximately 200 automobiles per day could be eliminated from the UA travel demand if all of these permit holders drive to the UA and if all of them changed modes to the modern street car. Based on the spatial analysis of residential location for UA off-campus students and employees, the following options should be considered to increase the potential of the modern street car to reduce auto travel to the UA: Extend the street car north of campus along one or more of the following streets: - Euclid Avenue - Mountain Avenue - Campbell Avenue Extend the street car east of campus along one or more of the following streets: - Speedway Boulevard - 6 th Street Perhaps the greatest long range potential of the initial modern street car implementation to reduce automobile travel to the UA exists through the redevelopment of property along the initial street car route into higher density university-oriented housing. The street car would then provide a direct connection to the UA campus for a much higher number of UA students and staff, and could significantly impact future auto travel to campus. The City of Tucson is currently investigating opportunity areas for redevelopment along the proposed initial street car route, some of which may provide opportunities for new university-oriented housing. Rather than wait for private housing University of Arizona 3-50 Final Report, April 2008.
73 investment along the street car route, an option for consideration may be for the UA to purchase one or more of these redevelopment opportunities with the express purpose of constructing off-campus University housing which would be connected to campus by the streetcar. YEAR 2005/2006 INTERSECTION LEVELS OF SERVICE Signalized intersection levels of service for the 2005/2006 time period were provided from a previous study that was performed for the City of Tucson 3. This study included a comprehensive Synchro model of every signalized intersection in the City of Tucson. The intersections near the UA Study area were examined from this study and the levels of service (LOS) for all intersections in the UA vicinity are provided in Exhibit 3-49 for the AM peak-hour and Exhibit 3-50 for PM peak-hour based on year 2005 and 2006 traffic counts, which were also provided by the City of Tucson. Levels of service by intersection approach are provided in Appendix A. 3 City of Tucson, Comprehensive Traffic Signal Analysis Tool, prepared by Morrison-Maierle, Inc., June University of Arizona 3-51 Final Report, April 2008.
74 Exhibit 3-49 YEAR 2005/2006 AM PEAK-HOUR INTERSECTION LEVEL OF SERVICE Source: City of Tucson, Comprehensive Traffic Signal Analysis Tool, prepared by Morrison-Maierle, Inc., June University of Arizona 3-52 Final Report, April 2008.
75 Exhibit 3-50 YEAR 2005/2006 PM PEAK-HOUR INTERSECTION LEVEL OF SERVICE Source: City of Tucson, Comprehensive Traffic Signal Analysis Tool, prepared by Morrison-Maierle, Inc., June University of Arizona 3-53 Final Report, April 2008.
76
77 4. TRAVEL DEMAND MANAGEMENT TRAVEL DEMAND MANAGEMENT MEASURE ASSESSMENT The primary goal of the TDM measure assessment was to identify and evaluate ways to reduce roadway congestion near the UA by managing UA traffic demand. The UA community travel demand and mode choice estimates presented earlier in this report provide a means to evaluate the trip reduction requirements associated with potential objectives of a TDM program. Example program objectives include the following: Maintain automobile travel at current levels for students and employees as the UA and UMC grow. This goal would require that the estimated year 2010 additional automobiles coming to campus be reduced by 3,265 autos per day. Decrease existing UA automobile travel to the UA by 10 percent and maintain at this level as the UA grows. This goal would require that a total reduction of 5,379 autos (22 percent) coming to campus each day by year Reduce vehicular travel by an amount sufficient to reduce traffic congestion near the UA during the AM and PM peak hours. The assessment of this objective requires the evaluation of AM and PM traffic demand at the intersections around the UA and the proportion of the total traffic consisting of UA trips. It is estimated that students, UA employees, and UMC employees currently contribute 3,590 and 3,680 vehicles to the AM and PM peak-hour traffic, respectively. This is estimated to increase in year 2010 to 4,145 and 4,248 for the AM and PM peak hours respectively. A very preliminary estimate is that the number of existing UA vehicles in the traffic around the study area would need to be decreased by at least 1,000 vehicles (approximately 28 percent) during the peak-hour for there to be a noticeable impact on traffic congestion at the major intersections around the campus. It is very unlikely that achieving any objective related to reducing congestion and UA automobile travel will be achieved solely through TDMs directed at the off-campus student population. UA off-campus students make up 53 percent of the drive mode choice, UA employees make up 35 percent, and UMC employees make up 12 percent of the drive mode choice. UA employees represent a meaningful proportion of the overall vehicular demand, while UMC employees are not as meaningful. For example, reducing UMC auto travel by 10 percent would provide only a 1.2 percent reduction in overall auto use by the UA population. UA off-campus students and employees make up 88 percent of the drive mode choice combined; therefore TDM strategies should be directed at both the UA employee and off-campus student population in order to achieve significant overall effectiveness. OPTIONS TO REDUCE AUTOMOBILE USE AND ROADWAY CONGESTION There are several general categories of options to reduce automobile use by the UA population. Within each general category, several specific TDM strategies can be formulated for evaluation. These general categories are: Decrease auto mode share and increase alternate mode use either by directly targeting auto use or by providing alternate mode options that will indirectly target auto use. This approach could directly target all or a portion of the UA population. Centralize the UA population and increase the UA population living on or near campus (ideally within one mile of campus). Although this approach does not directly target auto University of Arizona 4-1 Final Report, April 2008.
78 use, it could significantly reduce auto mode share. This approach would primarily impact UA students, unless increased housing for employees was specifically targeted. Spread travel demand to off-peak periods. This approach would affect travel by all modes, not just auto. This approach could also affect travel by all population groups. Decrease total trips to the UA study area. This approach would affect travel by all modes, not just auto, and could affect travel by all UA population groups. Increase roadway capacity. This is a supply side strategy affecting all travelers in the UA area. While this approach will address congestion issues around the UA, it does not reduce travel demand, and could increase travel demand. The TDM options in each category can be employed independently, but are generally most effective when applied in combinations of options that specifically target a UA group or are designed to achieve a specific overall objective. For example, options designed to decrease automobile use can be more effective if combined with options to provide improved alternative mode service. Some Options That Directly Target and Decrease Automobile Use Options to directly target and decrease UA automobile use include the following: Increase parking cost. - Targets on and off-campus students and UA employees. - Targets over 90 percent of the UA population. Institute parking fees for UMC employees. - Targets only UMC employees. - Targets approximately 6 percent of the UA population. Restrict parking permit availability Directly targets auto use. Numerous options could be considered: - Limit the number of permits to that currently being sold or reduce the number sold. Targets all on and off-campus students and UA employees. Eliminates future growth in demand. - No permits for students living within a specified distance from campus. Only 1,246 student permits within 1 mile of campus, and an estimated 740 autos driven to campus daily. Relatively small target group limits effectiveness. - Parking permits not allowed for freshmen. 541 permits for off-campus freshmen, 855 permits for on-campus freshmen for a total of 1,396 permits. Very small target group limits effectiveness. - Day of week parking permits for off-campus students (M, W, F or T, Th, F). Could reduce student autos coming to campus by half Monday through Thursday (5,560 autos or 11,120 daily auto trips eliminated). However, if the pass costs less, more students might buy, reducing effectiveness. Vanpool program for students and/or staff. University of Arizona 4-2 Final Report, April 2008.
79 - Would target all off-campus students and UA employees, but does not target auto use only. - Current alternative mode users might transfer to van pool. Time of day restrictions. - Could be used to target UA traffic peaking during the AM and PM peak hours by restricting parking to off-peak hours. - Primarily targets off-campus students. Single day use permits only. - Annual parking pass would be eliminated and replaced with single day use permits. - Targets off-campus students. - Encourages a shift to alternate modes by eliminating the convenience of the annual parking permit, and potentially increasing parking cost. Fee per use parking permit (all lots gated). - Annual parking pass would be eliminated. - Targets both off-campus students and employees. Increase peripheral parking with transit shuttle. - Lower priced parking in remote lots. - Targets off-campus students and employees that live more than five miles from campus. Restrict general use parking and add more carpool parking only permits and spaces. - Could be used to target students and employees, but is most likely applicable to employees. - Application to students may require student rideshare program as a support measure. Expand neighborhood parking bans (unfortunately, the level of neighborhood parking by students is unknown). - Targets students and employees parking in neighborhoods. Some Options That Increase Alternative Mode Use This approach employs the use of improved alternative mode service or alternative mode policies to increase alternative mode use. In general, options of this type do not specifically target auto users, but rather represent a broad appeal to all travelers to shift travel to a mode targeted with improvements in service. Options include: Expand CatTran service into neighborhoods surrounding campus. New neighborhood transit circulator system within 5-mile radius of campus circulating directly onto campus. UA transit shuttle within five miles of campus along existing Sun Tran routes. This service could circulate directly onto campus using small transit vehicles like those used for the City s Ticet service. Provide additionally subsidized or free transit pass. Universal transit pass deployment (all students get a pass with payment of tuition and fees). University of Arizona 4-3 Final Report, April 2008.
80 More SunTran express routes/service to UA with remote park-n-ride lots (serves travelers from more than 5 miles away from campus). Faculty/staff bicycle purchase subsidy. The potential effectiveness of these options is best estimated based on assumptions regarding frequency and location of service, and the coordination with other options to directly decrease auto use. This type of evaluation is beyond the scope of this study. Some Options to Centralize the UA Population This approach is primarily directed at students as the most effective target group. While providing housing options for UA employees on or near campus would also reduce auto trips, it would be more costly to develop the type of housing that would attract UA employees. Options to increase the UA population living on or near campus include the following: Build more on-campus student housing. - Targets off-campus students. - In comparison to students living more than two miles from campus, for every 10 students that move to on-campus housing, the number of autos coming to campus is reduced by approximately 8. Build more private student housing within one mile of campus. - Most effective target group is students living more than two miles from campus. - In comparison to students living more than two miles from campus, for every 10 students that move to within one mile of campus, the number of autos coming to campus is reduced by approximately six. Increase the number of UA employees living within one mile of campus. - In comparison to employees living more than two miles from campus, for every 10 additional employees living within one mile of campus, the number of autos coming to campus each day is reduced by approximately three. Increase the number of UMC employees within one mile of campus. - This has even less potential to reduce auto trips to campus than that for UA employees. For every 10 additional employees living within one mile of campus, the number of autos coming to campus each day is reduced by approximately two. A policy that freshmen must live on campus. - Of the 4,742 freshmen, 1,667 (35 percent) currently live off-campus. Of the freshmen living off-campus, 541 have parking permits. - This is a relatively small target group, but a policy of this type may act as one strategy in a more comprehensive grouping of measures to reduce auto use. Provide a financial incentive for students to live on-campus (e.g., tuition discount). Some Options to Spread Travel Demand to Off-Peak Periods It may be beneficial to move the peak demand for UA traffic to off-peak periods for the general traffic, thus reducing congestion near the UA. This approach would not directly reduce overall traffic or parking demand at the UA. Options include the following: Shift employee work schedule (e.g., 9:00 AM to 6:00 PM). University of Arizona 4-4 Final Report, April 2008.
81 Reduce the number of classes starting between 8:00 and 9:00 AM. Start more classes at 6:30 PM or later. Conduct classes on weekends. Some Options to Decrease Overall UA Trips Generally, efforts to reduce the total number of trips being made to the UA by students and employees would impact users across all modes, not just travel by auto. Options intended to decrease trip making include the following: Limit enrollment. Limit the number of UA employees. More internet/web based classes. More telecommuting for staff. Use of satellite campuses to disperse travel to other areas. Compressed work week for employees. Compressed class week. In general, for every 10 off-campus students that do not come to campus on a daily basis, the number of autos coming to campus would be reduced by four. For every 10 UA employees that do not come to campus on a daily basis, the number of autos coming to campus is reduced by approximately seven. Some Options to Increase Roadway Capacity Increasing roadway capacity will directly address traffic around the UA campus, but it does not target UA auto travel or parking demand. Based on existing traffic demand and intersection levels of service, the following options could be considered: Widen Speedway Boulevard to six lanes from Euclid Avenue to Stone Avenue, and from Main Street to I-10. Add intersection turn lanes (e.g., dual left-turn lanes on all approaches at Speedway Boulevard/Euclid Avenue intersection). Improve traffic signal timing to increase intersection capacity and traffic progression. Widen 6 th Street to six lanes from Campbell Avenue to Euclid Avenue. TDM MEASURE DEVELOPMENT, EVALUATION, AND RANKING Travel demand management measures to reduce traffic volume and congestion in the UA planning area were developed, evaluated, and ranked to provide a list of potential measures for implementation. These measures were specifically focused on the majority members of the UA community contributing to automobile traffic on a daily basis during the AM and PM peak traffic hours on typical weekdays. Thus, these TDM measures were developed to address typical recurring congestion issues in the UA campus planning area. The majority members of the UA community contributing to typical recurring traffic congestion are described in Exhibit 4-1. A brainstorming and evaluation workshop was held from 8:30 AM to 12:00 PM on December 3, 2007 at the Pima Association of Governments (PAG) offices. The workshop was conducted University of Arizona 4-5 Final Report, April 2008.
82 using the ThinkTank software product licensed to PAG. ThinkTank is a software application that allows participants to anonymously participate in a group decision making process. In this case the decision making involved the evaluation and ranking of TDM measures. Each participant provides input to the process through their own individual computer terminal (provided by PAG) and the software automatically records and summarizes the input from all participants. After the session was complete, the software automatically provided a verbatim compilation of all participants input and summarized the evaluation of the TDM measures. Exhibit 4-1 UA COMMUNITY CONTRIBUTING TO TYPICAL RECURRING CONGESTION Academic Year 1 Percent of Total Population Estimated Year 2010 Percent Increase Total Students 34, % 40, Off-Campus 28, % 32, On-Campus 5, % 7, UA Employees 10, % 12, UMC Employees 3, % 3, Total Population 47, % 56, ThinkTank Session Participants Twenty-one individuals representing the UA community, UMC, the Marshall Foundation, the City of Tucson, PAG staff, Sun Tran, and neighborhood associations in the UA area were invited to participate in the ThinkTank session. Of these 21 individuals, only 12 participated in the ThinkTank session. The organization or group represented by these participants is provided in Exhibit 4-2. Exhibit 4-2 THINKTANK SESSION PARTICIPANTS Number of Organization/Group Represented Participants University of Arizona 1 UA Parking and Transportation Services 3 Pima Association of Governments 1 Tucson Department of Transportation Transit 2 Tucson Department of Transportation 2 SunTran 1 Marshall Foundation 1 Feldman s Neighborhood Association 1 University of Arizona 4-6 Final Report, April 2008.
83 ThinkTank Session Process The ThinkTank session had the following stated purpose: Identify potential TDM and other measures to address congestion near the UA. Evaluated these measures for application. Prioritize and rank these measures for potential implementation. This ThinkTank session can be generalized as a four step process: 1. A brief presentation was made by the Project Team and PAG Staff to review the purpose of the project, the purpose of the ThinkTank session, the background materials and data generated by the project regarding UA community travel demand, and the ThinkTank session process and software. 2. Participants identified TDM measures for evaluation and ranking: In this case some TDM measures had been identified prior to the session and used as seed measures to begin the process. The TDM measures were grouped into the following seven general categories based on the primary purpose or focus of the measure: Decrease Automobile Use Increase Alternative Mode Use Centralize UA Population Spread Travel Demand Decrease UA Trips Increase Roadway Capacity Other 3. Participants commented on the TDM measures identified, expressing concerns and issues. All comments were recorded and displayed to all participants for review as they were input. 4. Participants evaluated each TDM measure against preselected criteria using a 1 to 10 sliding scale, with 1 being the lowest score and 10 being the highest score for each criteria. For this session the following criteria were applied: Cost: Defined as the monetary cost to the organization or jurisdiction to implement the idea. 1 = high cost (less desirable), 10 = low cost (most desirable). Benefit: Defined as the effectiveness of the idea to manage automobile travel demand and reduce congestion. 1 = little reduction in travel demand, 10 = high reduction in travel demand. Ease of Implementation: The effort required to overcome obstacles to the implementation of an idea. 1 = very difficult to implement, 10 = very easy to implement. The process resulted in over 100 ideas being generated, with 98 of these considered to be sufficiently unique to be evaluated and prioritized. Complete documentation of the ideas, comments, questions, and issues generated by the participants is provided in Appendix B. The number of ideas evaluated within each of the TDM categories is provided in Exhibit 4-3. University of Arizona 4-7 Final Report, April 2008.
84 ThinkTank Session Results Exhibit 4-3 NUMBER OF IDEAS GENERATED FOR EVALUATION Number of Ideas Category Generated Decrease Automobile Use 17 Increase Alternative Mode Use 46 Centralize UA Population 13 Spread Travel Demand 7 Decrease UA Trips 6 Increase Roadway Capacity 8 Other 1 Total 98 The complete and detailed results of the ThinkTank session are provided in Appendix B. This detailed listing of input and results is generated by the ThinkTank software and represents a verbatim transcript of participant input of ideas, comments, and ranking of the TDM measures. Once the ThinkTank session is completed, this information cannot be modified. A summary of the ThinkTank session results is provided in Exhibit 4-4. This summary is based on the ranking of the TDM ideas by the ThinkTank session participants. The ThinkTank software combines the ranking by individual participants for each criterion, and then combines the ranking across criteria to provide a total overall ranking of each TDM idea. The combination of ranking across criteria assumes that each criterion has equal weight in the ranking process. The summary information in Exhibit 4-4 provides the following information: The top five ranked TDM ideas by individual criteria within each TDM category. The top five ranked TDM ideas within each TDM category. The top 20 ranked TDM measures from the ThinkTank session are listed in Exhibit 4-5, along with overall ranking and average total score based on the combination of evaluation criteria. The total score is based on a 1 to 10 scale, with 10 being the highest rating. The overall top ranked TDM measure from the ThinkTank session is the deployment of a universal transit pass for UA students. Under this concept, all UA students would be provided a transit pass with class enrollment. The pass could be paid for through several options including a small additional enrollment fee or an increase in parking permit cost. The latter option would work in conjunction with the universal transit pass to reduce auto trips to the UA. All UA students would be required to pay the additional enrollment fee if this option is selected, whether or not they chose to use transit. The increased parking permit cost option would work in conjunction with the universal transit pass to reduce auto trips to the UA. The universal pass would allow unlimited access to SunTran service. University of Arizona 4-8 Final Report, April 2008.
85 A UA graduate student research project 1 conducted an extensive literature review and case study analysis of eight university universal pass programs. The literature review and case study analysis indicate that a universal pass program can be very effective at increasing student transit use (particularly when accompanied by transit and universal pass marketing towards students), and is effective at reducing automobile travel to campus by students. Several of the case studies cite the university s desire to reduce the need for new parking facilities and reduce roadway congestion near/on campus as motivating factors for initiating a universal pass program. The case studies indicate that the universal pass cost to students is generally heavily discounted in comparison to the per ride fare, and is also significantly less than the cost of discounted transit passes purchased individually by students under prior programs. A TDM measure tied for the second place ranking is to increase parking cost. Previous materials provided in this report indicate that the UA charge for student and staff parking passes is less than that charged by Arizona State University and is less than the current market rate for City of Tucson and Pima County employee parking passes. Emphasis from the ThinkTank session was also placed on marketing and ad campaigns to increase the awareness of available transit service to students and parents. Two TDM ideas regarding improved student marketing and information on alternative modes were ranked tied for second, a third similar idea was ranked tenth, and three other ideas were ranked among the top 20. These ideas are consistent with the findings of a recent UA student survey conducted by SunTran to gage student awareness of transit services and the current UA U-pass program 2. The analysis from the U-pass survey study indicated that 59 percent of UA students are unaware of the current U-pass discounted fare program. 1 Bommarito, Teresa, Unlimited Acesss Pass Program: The University of Arizona and SunTran Proposal, Fall Decision Support, Inc., Results of the U-Pass Study Prepared for SunTran, April University of Arizona 4-9 Final Report, April 2008.
86 Exhibit 4-4 THINKTANK SESSION SUMMARY OF RESULTS (December 3, 2007) Criteria Ranking Category/TDM Cost Benefit Implementation Category Rank Decrease Automobile Use Make parking permit rates equal to Tucson market. 3 No parking permits issued to students living on campus Prohibit driving if commute is less than 3 miles. 4 Higher parking rates for more convenient parking. 3 Incentives for not driving to campus. 1 Prohibit freshman from bringing cars to campus Increase parking cost Institute parking fees for UMC employees. 4 5 Restrict parking permit availability Single day use permits only. 1 Increase Alternative Mode Use Increase peripheral parking with transit shuttle. 2 Ad campaign to increase awareness of alternative modes available Freshman packets should contain only alternative transportation modes Increase marketing of alternatives to parents of incoming students Provide incoming students with user friendly information (via video, etc.) on how to 4 ride the bus. Rapid bus transit system for major arterials n/s and e/w. 5 More shuttles around neighborhoods. 3 Create a bike sharing program. 4 Work with off campus housing (student apartment complexes) to provide bus passes, or shuttle services to and from campus. 3 4 Provide additionally subsidized or free transit pass. 3 Universal transit pass deployment (all students get a pass with payment of tuition and fees) Overall Rank University of Arizona 4-10 Final Report, April 2008.
87 Exhibit 4-4 (Continued) THINKTANK SESSION SUMMARY OF RESULTS (December 3, 2007) Criteria Ranking Category/TDM Cost Benefit Implementation Centralize UA Population Do not rezone historic districts (Federal or city) near campus Capitalize on streetcar by pursuing all possible opportunities for university-oriented (faculty & students) housing along streetcar route Rezone areas closer to campus for higher densities and mixed uses Build more on-campus student housing. 2 4 Build more private student housing within one mile of campus A policy that freshmen must live on campus Spread Travel Demand Category Rank Use of satellite campuses to disperse travel to other areas. 1 2 Spread classes out more, night classes and Saturday Shift employee work schedule (e.g., 9:00 AM to 6:00 PM) Reduce the number of classes starting between 8:00 and 9:00 AM Start more classes at 6:30 PM or later Conduct classes on weekends Decrease UA Trips Limit enrollment Limit the number of UA employees. 5 More internet/web based classes More telecommuting for staff Compressed work week for employees Compressed class week Increase Roadway Capacity Park Avenue, 6th street to Speedway, needs improvements for better traffic management Create more right turn lanes st Avenue improved to 6 lanes from Speedway to River Road. 4 Better traffic flow... more or longer left arrows Widen Speedway Blvd. to 6 lanes from Euclid Ave. to Stone Ave., and from Main St. 1 5 to I-10. Add intersection turn lanes (e.g., dual left-turn lanes on all approaches at Speedway/Euclid intersections) Improve traffic signal timing to increase intersection capacity and traffic progression Overall Rank University of Arizona 4-11 Final Report, April 2008.
88 Exhibit 4-5 TOP 20 RATED TDM MEASURES Overall Rank Average Total Score (1-10) TDM Measure Universal transit pass deployment (all students get a Sun Tran/Modern Street car pass with payment of tuition and fees) Increase parking cost Freshman packets should contain only alternative transportation modes Increase marketing of alternatives to parents of incoming students More telecommuting for staff More internet/web based classes Compressed work week for employees No parking permits issued to students living on campus Prohibit freshman from bringing cars to campus Ad campaign to increase awareness of alternative modes available Restrict parking permit availability Increase marketing of existing and future TDMs to increase awareness Work with off-campus apartments to provide bus passes or shuttle service A policy that freshmen must live on campus Institute parking fees for UMC employees Improve traffic signal timing to increase intersection capacity Provide incoming freshmen user friendly information on how to ride the bus Provide a student ride matching service Create a bike sharing program Spread classes out, more night classes and Saturday Four of the top 20 ranked TDM measures are designed to reduce travel to the UA by increasing staff telecommuting, providing more internet/web based classes, instituting a compressed work week program for employees, or spreading classes out with more night classes or holding classes on Saturday. Four of the top 20 ranked TDM measures involve restricting the availability of parking or the use of automobiles by students. The top 20 ranked TDM measures were presented to the public for review and comment at a public open house conducted on February 6, A summary of the open house activities and comments received is provided in Chapter 5 of this document. University of Arizona 4-12 Final Report, April 2008.
89 5. PROJECT PUBLIC INVOLVEMENT PROGRAM AND COMMENTS PUBLIC INVOLVEMENT PROGRAM A project public Open House was held on February 6, 2008 from 12:00 to 4:00 PM on campus Student Union Memorial Center. Project materials available at the Open House included the following: Thirteen display boards describing the project and the results of the TDM evaluation and ranking. A handout consisting of the Open House display materials with additional details on the project. An Open House comment form and survey for attendees. Directions for attendees to provide additional comments through the UA PTS website. Project contact information. A sign-in sheet for attendees. Nine members of the Project Team and Project Technical Advisory Committee (TAC) were also in attendance to answer project related questions and provide additional explanation of project materials. A marketing program was developed by the UA PTS to promote attendance at the Open House and raise the level of awareness of all PTS parking and transportation programs by the campus community. The marketing program was initiated two weeks prior to the Open House. The marketing program included the following elements: Posters in CatTran Shuttles, the Student Union, the Recreation Center, library, Catcard Office, Garages, and the PTS lobby. A copy of the poster is provided in Exhibit 5-1. Electronic announcements and s. Personal contacts through s and telephone calls. A press kit and media release to the Wildcat student newspaper, Tucson Weekly, AZ Daily Star, KVOA, KOLD, KGUN, KUAT, the UA Communications Department, and UAnews.org. (See the press release in Exhibit 5-2.) Response mechanisms were established for web response at parking@arizona.edu and by telephone at 626-PARK. OPEN HOUSE ATTENDANCE AND COMMENTS The Open House was attended by approximately 53 individuals, including those associated with the project. The sign-in sheets from the Open House are provided in Appendix C. A comment form, shown in Exhibit 5-3, was used to solicit public input at the open house. A summary of the comments received via this form and through the other response mechanisms is provided in Exhibit 5-4. For reference, the top 20 TDM measures, as displayed at the Open House are also provided in Exhibit 5-4. Note that all comments received were transcribed verbatim to this report. University of Arizona 5-1 Final Report, April 2008.

90 University of Arizona 5-2 Final Report, April Exhibit 5-1 OPEN HOUSE POSTER
91 University of Arizona 5-3 Final Report, April Exhibit 5-2 OPEN HOUSE PRESS RELEASE

92 University of Arizona 5-4 Final Report, April Exhibit 5-3 OPEN HOUSE COMMENT FORM


93 University of Arizona 5-5 Final Report, April Exhibit 5-4 OPEH HOUSE COMMENTS SUMMARY
94 University of Arizona 5-6 Final Report, April Exhibit 5-4 (Continued) OPEH HOUSE COMMENTS SUMMARY
 OPEH HOUSE COMMENTS SUMMARY")
95 University of Arizona 5-7 Final Report, April Exhibit 5-4 (Continued) OPEH HOUSE COMMENTS SUMMARY
 OPEH HOUSE COMMENTS SUMMARY")
96 University of Arizona 5-8 Final Report, April Exhibit 5-4 (Continued) OPEH HOUSE COMMENTS SUMMARY
97 6. UNIVERSITY OF ARIZONA PARTICIPATION IN THE PIMA ASSOCIATION OF GOVERNMENTS (PAG) TRANSPORTATION IMPROVEMENT PROGRAM (TIP) PROCESS EXISTING CONDITIONS The UA is not directly eligible to receive regional transportation project funding from PAG. Project funding eligibility is confined to PAG governmental member jurisdictions, and thus the UA does not qualify. For the UA to submit a project to PAG for TIP consideration, the project must be sponsored by a PAG member jurisdiction, either the City of Tucson or Pima County. In that the UA planning area is entirely contained within the City of Tucson, the City is the jurisdiction that has in the past been approached by the UA to sponsor a UA project for the TIP. This coordination with the City has occurred infrequently in the past. The Regional Transportation Authority (RTA)/PAG TIP Subcommittee represents the entryway for the inclusion of projects in the TIP and consideration for regional funding of projects. For a project to be considered for the TIP a formal written submittal to the TIP Subcommittee must be made by the sponsoring jurisdiction. The UA does have voting member representation on the PAG TIP Subcommittee, which includes representatives from all member jurisdictions, ADOT, the Tohono O odham Nation, the Pascua Yaqui Tribe, and PAG. The PAG TIP Subcommittee evaluates and reviews project eligibility for inclusion in the TIP, and evaluates project funding availability and opportunities. Recommendations to include projects in the TIP from the PAG TIP Subcommittee are forwarded to the RTA and PAG Transportation Planning Committees (TPC) for approval, and are subsequently forwarded to the PAG Regional Council for final approval. The UA is a voting member of the PAG TPC, but is not a voting member of the RTA TIP Subcommittee, the RTA Transportation Planning Committee, or the Regional Council. The PAG TIP is updated annually, but amendments can be made to the TIP throughout the year to add projects or redistribute available funds. TIP amendments, which originate from the sponsoring jurisdiction, are subject to the same review and approval process as any TIP project. The UA has made project submittals to the PAG TIP Subcommittee on a very limited basis in the past, with the City of Tucson acting as the project sponsor for the submittal. This past coordination with the City of Tucson has been on an ad hoc basis with no formal project identification and development process within the UA structure, and no formal coordination process with the City. The lack of a formal structured process for developing UA projects for TIP consideration and funding has the following implications: Projects worthy of consideration for regional funding may not be identified or forwarded to PAG. The strength of project sponsorship, both internal to the UA and at the City, may be weakened by the informal nature of the existing process, possibly resulting in projects not being forwarded to PAG or being forwarded with less than full support. Transportation projects suitable for regional funding may have an origin in any of the following UA departments: Parking and Transportation Services (PTS) Campus Facilities Planning (CFP) Facilities Management Design and Construction University of Arizona 6-1 Final Report, April 2008.
98 UA Police Department Risk Management There has been only limited coordination between these UA departments in project development for the purpose of obtaining regional funding for project implementation. Most streets within the UA planning area boundaries are not controlled by the UA. The major arterials and many local streets are controlled and maintained by the City of Tucson. Some streets controlled by the UA must be maintained as public thoroughfares through an agreement with the City. Exhibit 1 indicates which streets within the UA planning area are controlled by the university. TYPES OF PROJECTS CONSIDERED FOR THE TIP There are several types of projects that may be considered for TIP funding. The TIP is a multimodal funding program for transportation system improvements, however not all funding sources can be applied to all types of improvements. For example, Highway User Revenue Funds (HURF) can only be applied to roadway improvement projects. A general list of the types of projects that can be considered for TIP funding is provided below: Roadway improvement: - Capacity improvements (adding lanes, including intersection turn lanes) - Safety improvements (projects specifically designed to reduce the number of crashes. - Traffic signal improvements. - Pavement improvements. - Engineering studies and design. Bridge improvements Transit improvements: - Service improvements and expansion. - Transit facilities. - Capital operating equipment (new buses). - Planning studies. Transportation enhancements project categories applicable to UA include: - Provision of pedestrian and bicycle facilities. - Provision of safety and educational activities for pedestrians and bicyclists. - Acquisition of scenic easements or historic sites. - Landscaping and other scenic beautification. - Historic preservation (must have a strong transportation link). Bicycle and pedestrian programs Rideshare Travel Reduction Clean Cities Alternate mode programs Airport improvements. There could be a significant potential for the UA to develop projects in several of these project areas for incorporation into the PAG TIP. University of Arizona 6-2 Final Report, April 2008.

99 Exhibit 6-1 UA CAMPUS BASEMAP SHOWING UNIVERSTIY PROPERTY University of Arizona 6-3 Final Report, April 2008.
100 POTENTIAL FUNDING SOURCES There are 41 categories of funding listed in the PAG TIP, but not all of them would be accessible for UA projects. Of the 41 funding categories, the 18 categories listed in Exhibit 6-2 could provide funding depending on the type of project being considered, as funding categories are generally applicable to specific types of projects. Exhibit 6-2 POTENTIAL TIP FUNDING FOR UA PROJECTS Fund Name Description 2.6% Highway User Revenue Funds reserved for State Highways 12.6% Highway User Revenue Funds (HURF) 5307 Federal FTA formula funds (Urbanized Area Transit) 5309 Federal FTA Capital Investment Grants & Loans (New starts) ACSTP Advance Construction STP Funds Programmed by PAG ADEQ Arizona Dept. of Environmental Quality ASTP Federal STP Funds Programmed by ADOT ATEA Federal Transportation Enhancement funds programmed for ADOT projects HELP Highway Expansion Loan Program (state infrastructure bank) HES Federal Safety Program Funds Programmed by ADOT ITS Special appropriations in TEA-21 for Intelligent Transportation Projects LTAF Local Transportation Assistance Fund (state lottery funds) PDAF Project Development Activity Funds (subcategory of 12.6%) STATE Non Federal State Funds STP Federal Surface Transportation Program Funds Programmed by PAG TEA Transportation Enhancement Funds Programmed by ADOT TENH STP Funds Programmed by PAG for Transit Enhancement Purposes TUC City of Tucson funds provided for projects sponsored by other agencies. Local jurisdictions are responsible for partial funding and costs associated with Federal-aid funded projects. In addition to the local jurisdiction s share of design, right-of-way and construction costs, the local jurisdiction must transmit sufficient funds to ADOT prior to any ADOT activity on a local government project to cover the cost of ADOT technical review. The UA would need to coordinate with the local jurisdiction sponsor and PAG to determine which funding source or sources could be applied to a specific project, and whether partial funding by the UA would be required. COORDINATION AND DEVELOPMENT OF UA PROJECTS FOR THE REGIONAL TIP There are three primary levels of coordination and development of UA projects for inclusion in the regional TIP process. These levels of coordination are: University of Arizona 6-4 Final Report, April 2008.
101 Internal UA coordination Coordination between the UA and the local jurisdiction project sponsor. Coordination between the UA and PAG. Internal UA Coordination and Project Development Process The UA internal process for developing and coordinating transportation projects for the regional TIP would begin at the departmental level and would include, but not be limited to the following UA departments: Parking and Transportation Services (PTS) Campus Facilities Planning (CFP) Facilities Management Design and Construction UA Police Department Risk Management The UA internal process would include the following general steps and activities: A specific individual within each of the departments indicated above should be assigned the responsibility of reviewing and evaluating transportation system needs and developing projects to address those needs. This individual would develop a brief project description and cost estimate for each prospective project. A project can be a study to identify needs, evaluate alternatives, and recommend projects for implementation. The prospective projects should be reviewed and approved by each respective department. The individuals from each department would meet as a committee to review and coordinate the projects for consideration. This committee would be the UA TIP Committee and would report to the individual department administrators and the UA Senior Vice President of Business Affairs. It is recommended that the UA staff member that is the Official Representative of the UA to the PAG Transportation Improvement Program Subcommittee act as the Chairman of the UA TIP Committee. The UA TIP Committee would develop a prioritized list of projects to be forwarded to the local jurisdiction sponsor (most likely the City of Tucson) for review. The UA TIP Committee would also be responsible for indentifying the most appropriate local jurisdiction sponsor for each project. The list of projects would first be sent to the UA Senior Vice President of Business Affairs for review and approval before being forwarded to the local jurisdiction sponsor. The UA TIP Committee would be responsible for providing the TIP project data and documentation, in accordance with PAG requirements, to support the project s funding application for those projects that will ultimately be forwarded to PAG for inclusion in the TIP. Coordination Between the UA and the Local Jurisdiction Project Sponsor The coordination between the UA and the local jurisdiction project sponsor should occur on a regular and formal basis. This coordination should occur at least annually and possibly more frequently, depending on the nature and timing of the projects being considered. Projects can be accepted into the PAG TIP at any time during the year through TIP amendments. The University of Arizona 6-5 Final Report, April 2008.
102 coordination between the UA and the local jurisdiction project sponsor should occur at two general levels: The first and highest level of coordination should be between the UA and the Director of Transportation for the local jurisdiction project sponsor. The purpose of this level of coordination would be to coordinate the UA projects with any related projects being developed by the local jurisdiction, and to achieve agreement for project support by the local jurisdiction sponsor. Any written agreements between the UA and the local jurisdiction required for project sponsorship would be coordinated at this level. This coordination would also identify the appropriate local jurisdiction staff personnel for the second level of coordination. The second level of coordination would be between the UA and the local jurisdiction staff personnel that would assist in developing the necessary project information and data needed for the funding application to PAG. This level of coordination would only be needed for those projects that advance through the first level of coordination indicated above. Coordination Between the UA and PAG The coordination between the UA and the PAG TIP Subcommittee would generally consist of the following activities: The members of the UA TIP Committee will document all of the information required by PAG to support major and minor project funding applications (see Appendix D for data requirements and forms). The provision of these data will most likely require information that will be obtained from the local jurisdiction (e.g., pavement condition, average daily traffic) or from PAG (e.g., forecast average daily traffic). Therefore, the UA will need to coordinate with the local jurisdiction and PAG to acquire the information needed for the project documentation. The UA representative to the PAG TIP Subcommittee will need to conduct the following coordination activities with PAG: - Identify the sources for the information required to document major or minor projects for PAG funding application. Contact these sources and acquire the information needed. - Coordinate with PAG to identify the appropriate funding source and UA fund match requirements for each project. - Prepare and submit the required documentation to PAG in a timely fashion consistent with the annual PAG TIP development process. - Attend PAG TIP Subcommittee meetings and champion UA projects. The UA representative to the PAG TIP Subcommittee may also be required to attend PAG Transportation Planning Committee and Regional Transportation Council meetings to support the funding applications for UA projects. The UA will also be required to provide information on the status of the development and implementation of funded projects to the PAG TIP Subcommittee and the PAG TPC. The UA must be prepared to advance funded projects in a timely fashion and expend the funds for project development and implementation during the time periods specified in the TIP. University of Arizona 6-6 Final Report, April 2008.
103 EVALUATION CRITERIA FOR INTERNAL UA PROJECT EVALUATION The following represents a general process for the internal evaluation and development for UA projects for prospective application for regional funding and inclusion in the PAG TIP: Determine whether the project is generally consistent with one or more of the project types considered for the TIP. Evaluate, rank and prioritize projects using appropriate criteria to identify those projects that are most likely to meet PAG criteria for funding. It is recommended that the UA base the internal screening evaluation of projects on the same general criteria used by PAG to evaluate projects for the TIP funding. Using the PAG criteria the UA can be assured that the highest ranking projects will have the best chance to qualify for regional funding. Using the PAG evaluation criteria for the internal evaluation will have the additional benefit of providing information required by PAG for project documentation. The general criteria categories used by PAG for project evaluation are the following: - Safety benefits - System preservation - Number of users who will benefit - Congestion benefits - Environmental benefits - Improved accessibility - Improved system continuity - Regional significance Additional information on how these general criteria categories are applied by PAG and how then can be applied to the internal UA evaluation process are contained in Appendix D in the Minor Projects Funding Application. This application of the PAG process for Minor Projects is generally easy to apply and can be easily adapted to an internal process for the UA. POTENTIAL UA PROJECTS FOR TIP CONSIDERATION The review of recommendations from previous studies, the field inventory of pedestrian and bicycle facilities, plus discussions with the project Technical Advisory Committee has provided information for the conceptualization of potential UA related projects for PAG TIP consideration. Several of these projects involve studies to specifically identify improvements for implementation, which would also have potential funding through the PAG TIP. The following provides a brief description of these potential projects: 1. Expansion of the Modern Street Car System This project would include the planning, design, and implementation of a system expansion beyond the initial implementation that is currently being planned. The system expansion would potentially be to the north and to the east of the UA campus. 2. Neighborhood Transit Circulation System Feasibility Study This study would evaluate the feasibility of providing a neighborhood transit circulation system focused on the UA community within an approximate 5-mile radius of campus. The study would also compare the cost effectiveness of providing this service in comparison to providing upgraded Sun Tran service along existing transit routes to serve the UA. This study should also include of the potential for new park-and-ride parking lot locations and shuttle connections to the UA campus. University of Arizona 6-7 Final Report, April 2008.
104 3. UA Neighborhoods Sidewalk Improvement Program This project would construct new sidewalks and provide ADA sidewalk ramps in the neighborhoods north and south of the main campus that currently lack these facilities. 4. UA Traffic Calming Study This study would identify specific locations for the implementation of traffic calming measures to reduce pedestrian/bicycle/vehicle conflicts. The study would provide specific recommendations for implementation that could then move to design and construction. 5. Speedway Boulevard / Euclid Avenue Intersection Capacity Improvements This project would identify and design capacity improvements for this intersection that would then be constructed. 6. UA Bicycle System Improvement Study This project would investigate and recommend bicycle system improvements both on campus and off-campus through connections to the neighborhoods surrounding the campus. Recommended improvements would then move to design and implementation. 7. New HAWK Pedestrian Signals Near the UA The potential for HAWK pedestrian signals has been previously identified for Euclid/5 th Street and Euclid/2 nd Street. 8. Multi-Modal Streetscape Design and Implementation The following provide potential locations for these projects as recommended in previous studies: a. Highland Avenue from Broadway to Sixth Street. b. Mountain Avenue from Speedway to Grant Road. c. Speedway Boulevard. d. Park Avenue. e. Euclid Avenue. f. Campbell Avenue. g. Sixth Street. h. University Boulevard. 9. UA Student Ride Share Program Feasibility Analysis This study would evaluate the feasibility of establishing a ride share matching program for UA students living offcampus. 10. UA Planning Area Roadway Improvements Study This study would evaluate roadway system improvement needs within the UA campus planning area, including traffic circulation, roadway capacity, signing, striping, and pavement rehabilitation needs. 11. UA Planning Area Traffic Safety Study This study would identify the locations, and evaluate the characteristics of traffic safety issues within the UA planning area, particularly vehicular, pedestrian, and bicycle conflicts, and develop recommendations to address the identified problems. This would include an evaluation of crash reports. University of Arizona 6-8 Final Report, April 2008.
105 7. SUMMARY OF CONCLUSIONS AND RECOMMENDATIONS The following represents a brief summary of the conclusions and recommendations developed through this study effort. The details on the development of these conclusions and recommendations can be found in the body of this report. EXISTING AND YEAR 2010 TRAVEL DEMAND Over 21,100 automobile trips are made to campus each day by students and employees. This does not include automobile trips made by visitors. It was estimated that this would increase to over 24,400 by year 2010, a 15 percent increase. Fifty-nine percent of the total off campus students, UA employees, and UMC employees live within five miles of campus. For UA employees, sixty-nine percent living within five miles of campus arrive by automobile (drive + carpool). There is a substantial potential to reduce auto travel to campus by focusing TDMs on the students and employees living within five miles of campus, particularly those living in the two to five-mile range. TRAVEL DEMAND MANAGEMENT Over 100 travel demand management (TDM) measures were evaluated as part of this study. The universal transit pass and increasing parking cost were the number one and two measures as rated by the public and other stakeholders. Other high ranking measures included: Freshman packets should contain only alternative transportation modes. Increase marketing of alternatives to parents of incoming students. More telecommuting for staff. More internet/web based classes. More TDM information is included in Chapter 4 with the top twenty rated TDM measures provided in Exhibit 4-5. UA PARTICIPATION IN THE PAG TIP PROCESS There are several types of projects that could potentially be funded through the PAG TIP process to support transportation needs affecting travel to and from the UA. There are also a variety of potential regional funding sources that could be used to fund these projects, but not all funding sources can be applied to all project types. A general list of the types of projects that can be considered for TIP funding can be found in Chapter 6. Also included in Chapter 6 are several project concepts that were identified through the activities of this study that have potential for being funding through the PAG TIP. These projects are: 1. Expansion of the Modern Street Car System 2. Neighborhood Transit Circulation System Feasibility Study 3. UA Neighborhoods Sidewalk Improvement Program 4. UA Traffic Calming Study University of Arizona 7-1 Final Report, April 2008.
106 5. Speedway Boulevard / Euclid Avenue Intersection Capacity Improvements 6. UA Bicycle System Improvement Study 7. New HAWK Pedestrian Signals Near the UA 8. Multi-Modal Streetscape Design and Implementation 9. UA Student Ride Share Program Feasibility Analysis 10. UA Planning Area Roadway Improvements Study 11. UA Planning Area Traffic Safety Study Finally, additional levels of coordination are recommended, which include: An internal UA TIP Committee to evaluate and develop a prioritized list of projects for potential PAG TIP funding. Regular and formal coordination between the UA and the local jurisdictional sponsor of any proposed TIP project. Increased coordination between the UA and PAG to provide any needed information for TIP consideration, including attendance by the UA at the appropriate PAG meetings. University of Arizona 7-2 Final Report, April 2008.
107 APPENDIX A LEVEL OF SERVICE BY INTERSECTION APPROACH BASED ON 2005 AND 2006 DATA
108 AM Level of Service Eastbound Westbound Northbound Southbound Int ID Intersection LT Thru RT LT Thru RT LT Thru RT LT Thru RT 347 Grant Rd & Stone Ave C D D C D C D D 348 Grant Rd & Sixth Ave A A A A D D B C C 349 Grant Rd & First Ave C D D F C C E D 350 Grant Rd & Park Ave B B C A C C C D 351 Grant Rd & Mountain Ave D C D A C D 352 Grant Rd & Campbell Ave C C B F C A B B A D F B 353 Grant Rd & Tucson Blvd C A C B C C A B C B 355 Grant Rd & Country Club Rd B C D E E C D E 398 Elm St & Campbell Ave D A D D C A A A 399 Elm St & Tucson Blvd B B B B A A A A 400 Pima St & Country Club Rd C C C D A A A B 420 Drachman St & Stone Ave C C B A A B B 438 Speedway Blvd & Stone Ave D D B F C D C A E F 439 Speedway Blvd & Sixth Ave A A A D 440 Speedway Blvd & Fourth Ave A B C A C C B D D 441 Speedway Blvd & Euclid Ave B D F C A D D B C E B 442 Speedway Blvd & Park Ave C C C A A C C A D D B 443 Speedway Blvd & Mountain Ave F C C A C C B D D C 444 Speedway Blvd & Cherry Ave D B C A D D C D D C 445 Speedway Blvd & Campbell Ave C C B F D A D D B C C B 447 Speedway Blvd & Tucson Blvd B A A B A D D B D D B 449 Speedway Blvd & Country Club Rd C B A E D A F C A E D B 482 University Blvd & Stone Ave A B B 485 University Blvd & Euclid Ave D D C C A A A A 487 University Blvd & Campbell Ave D C C A A A A 488 Third St & Tucson Blvd A A A A 489 Third St & Country Club Rd A A 500 Sixth St & Stone Ave C D F B B D C 501 Sixth St & Sixth Ave A A A C 502 Sixth St & Fourth Ave A A A A D C C D 503 Sixth St & Euclid Ave D D C C D B E D 504 Sixth St & Park Ave A A A A D A D A 506 Sixth St & Highland Ave B B A A A C D C C B 508 Sixth St & Campbell Ave D C A B C C B A C F 510 Sixth St & Tucson Blvd A A A A B B B C 512 Fifth St & Country Club Rd C C B C A B C B C D 572 Broadway Blvd & Aviation Pkwy C A C B F A 573 Broadway Blvd & Euclid Ave F C B C D B D D A F D C 575 Broadway Blvd & Highland Ave A A A A D C C C 577 Broadway Blvd & Campbell Ave E B A D E D E B B C A 579 Broadway Blvd & Tucson Blvd A A A B C D A C E C 581 Broadway Blvd & Country Club Rd C B C E A C D A D D
109 PM Level of Service Eastbound Westbound Northbound Southbound Int ID Intersection LT Thru RT LT Thru RT LT Thru RT LT Thru RT 347 Grant Rd & Stone Ave E D C D E D F D 348 Grant Rd & Sixth Ave A A A A C D B C C 349 Grant Rd & First Ave E E D F E E F D 350 Grant Rd & Park Ave A A C C C E F C 351 Grant Rd & Mountain Ave C A C A E C 352 Grant Rd & Campbell Ave D E A C B A C F A F D A 353 Grant Rd & Tucson Blvd B A B B C D B F C A 355 Grant Rd & Country Club Rd C D C D F D E D 398 Elm St & Campbell Ave D C C B A A A B 399 Elm St & Tucson Blvd B B A A A C B B 400 Pima St & Country Club Rd C D C D A A A A 420 Drachman St & Stone Ave E C C B B D D 438 Speedway Blvd & Stone Ave E D A D D F C A F C 439 Speedway Blvd & Sixth Ave D C A C 440 Speedway Blvd & Fourth Ave A A C A D D C D C 441 Speedway Blvd & Euclid Ave C C F C A F D B F E C 442 Speedway Blvd & Park Ave C D F C A C C A E C A 443 Speedway Blvd & Mountain Ave D B B B C C A D D C 444 Speedway Blvd & Cherry Ave C B E B C C C D C C 445 Speedway Blvd & Campbell Ave F D A E B A D D A D C A 447 Speedway Blvd & Tucson Blvd D D C A A C C A D C A 449 Speedway Blvd & Country Club Rd C D A D C A E D A C C A 482 University Blvd & Stone Ave A B A 485 University Blvd & Euclid Ave D C D D A A B A 487 University Blvd & Campbell Ave D C C B A D A 488 Third St & Tucson Blvd A A A A 489 Third St & Country Club Rd B B 500 Sixth St & Stone Ave D D D F C F C 501 Sixth St & Sixth Ave C B B C 502 Sixth St & Fourth Ave A A A A C D D D 503 Sixth St & Euclid Ave D D D F D C F D 504 Sixth St & Park Ave A B A A C A D A 506 Sixth St & Highland Ave A A A A A C C C D B 508 Sixth St & Campbell Ave F C A C C C C A E E 510 Sixth St & Tucson Blvd B A C A B C C C 512 Fifth St & Country Club Rd D D C C A C D C C C 572 Broadway Blvd & Aviation Pkwy C C A A F B 573 Broadway Blvd & Euclid Ave F B A F C B E D B E C B 575 Broadway Blvd & Highland Ave A A B A C C C B 577 Broadway Blvd & Campbell Ave F C A F D C D A C C A 579 Broadway Blvd & Tucson Blvd D B B B C D B B C A 581 Broadway Blvd & Country Club Rd F B C E A D F A F E
110
111 APPENDIX B THINK TANK SESSION RESULTS
112 ThinkTank Process and Outcome Disclaimer ThinkTank is a software application that allows participants to anonymously participate in a group decision making process. The results of these processes are not an official statement of PAG policy or practice. The results of these processes may be considered during the planning process.
113 1. Good Morning! 2. TDM Ideas 1. Decrease Automobile Use 1.1. make parking permit rates equal to Tucson Market 1.2. No parking permits issued to students living on campus 1.3. Pay studnts/employees not to bring their vehicle to cmpus 1.4. Prohibit driving if commute is less than 3 mies 1.5. Eliminate black market in residential parking pemits. Currenly, students sell/rent the permits on streets with residential permit parking only hgher parkig rates for more convenient parking 1.7. incentives for not driving to campus 1.8. mandate reomte parking for freshman. Provide shuttle servie to campus 1.9. Prohibit freshman from bringing cars to campus Increase parking cost Institute parking fees for UMC employees Restrict parking permit availability Time of day restrictions Single day use permits only Fee per use parking permit (all lots gated) Restrict general use parking and add more carpool parking only permits and spaces Expand neighborhood parking bans. 2. Increase Alternative Mode Use 2.1. Increase peripheral parking with transit shuttle Vanpool program for students and/or staff Mandate new building projects that will increase demand to pay a transportation fee to fun alternative transprtation pograms 2.4. Provide better transt linkages between PCC & UA (Downtown Campus) bus priority access on campus streets. Re-think circulation patterns 2.6. Increase Park and Ride useage (Additional Marketing) 2.7. ad campaign to increase awareness of alt. modes available 2.8. Increase the marketing of existing and future TDM programs to increse awareness 2.9. freshman packets should contain only alternative transportation mode increase marketing of alternatives to parents ofincoming students Provide incoming students with user friendly information (via video, etc.) on how to ride the bus Create auto free zone dedicated bus lanes or HOV lanes Look for mixed use uniersity-oriented housing development opportunities along RTA corridors like Grant, Broadway, 22nd Incentify private sector housing to provide alternat odes of transprt with flexible schedules increase subsidy for vanpools Reduce pedestrian fatalities and near-fatalities by strictly enforcing speed limits, stop signs, other signals and signs Improve local bicycle lanes to promote cycling
114 2.19. provide shower/clean up areas for bikers/walkers Identify a high-density pedestrian zone around the University with signage or colored pavement Improve pedestrian safety by installing additional HAWK crossings near the University Improve access to campus by pedestians and cyclists with overpasses, bike paths, sidewalks Improve lighting and sidewalk connections to promote walking Increase the number of express SuTran routes into the campus and add later evening service Build park and ride at locations that Cat Tran can use at 5 to 7 mile radius from campus Provide a student ride matching service transit priority lanes on surrounding roadways Rapid bus transit system for major arterials n/s and e/w more shuttles around neighborhoods make current transporttion sexierto proote ridership ie all new buses create a bike sharing program Extend the modern streetcar line into the neighbrhoods to provide a fixed rail line to the campus more grade-separated facilities: ped and bike underpassess, transit underpasses, underground parking access, pedestrian bridges Work with off campus housing (student apartment complexes)to provide bus passes, or shuttle sevices to and from campus better bus schedue hours to create convenience Move CatTran into SunTran so that transit can go where it needs not based on cost or artifical boundries Provide on-campus vehicle alternatives for those alternative mode users (zip car) to eliminate need for car during the day direct transit from larger populated areas..express routes Increase incentives for carpooling Expand CatTran service into neighborhoods surrounding campus New neighborhood transit circulator system within 5-mile radius of campus circulating directly onto campus UA transit shuttle within 5 miles of campus along existing SunTran routes Provide additionally subsidized or free transit pass Universal transit pass deployment (all students get a pass with payment of tuition and fees) More SunTran express routes/service to UA with remote park-n-ride lots Faculty/staff bicycle purchase subsidy. 3. Centralize UA Population 3.1. A better K-12 public school system in central Tucson will encourage faculty & grad students with families to live closer in 3.2. Do not rezone historic districts (Federal or city) near campus. This option shold be off the table, as it is streuously opposed by the residents and homewners in these neighborhoods. It is also problematic from many other perspectives (e.g. low-denisty housing plays a role in preserving mature vegetation that mitigates heat and pollution generated by autmobile traffic, high rental rates are corelated with increased crime) create ease and incentives for builders to build in core an renovate existing buildings 3.4. Provide financial incentive for faculty to purchase housing downtown (and use streetcar to work)
115 3.5. Capitalize on streetcar by pursuing all possible opportunties for university-oriented (faculty & students) housing along streetcar route rezone areas closer to campus for higher densities and mixed uses 3.7. provide more and better quality housing for UA employees in central Tucson 3.8. Build more on-campus student housing Build more private student housing within one mile of campus Increase the number of UA employees living within one mile of campus Increase the number of UMC employees within one mile of campus A policy that freshmen must live on campus Provide a financial incentive for students to live on-campus (e.g., tuition discount). 4. Spread Travel Demand 4.1. Use of satellite campuses to disperse travel to other areas Spread classes out more, night classes and Sarurday Hold core classes at highschools for freshman to limit their trips to campus 4.4. Shift employee work schedule (e.g., 9:00 AM to 6:00 PM) Reduce the number of classes starting between 8:00 and 9:00 AM Start more classes at 6:30 PM or later Conduct classes on weekends. 5. Decrease UA Trips 5.1. Limit enrollment Limit the number of UA employees More internet/web based classes More telecommuting for staff Compressed work week for employees Compressed class week. 6. Increase Roadway Capacity 6.1. Park Avene 6th street to Speedway needs improvements for better traffic management 6.2. create more right turn lanes st Avenue improve to 6 lanes from Speedway to River Road 6.4. better traffic flow... more or longer left arrows 6.5. Widen Speedway Blvd. to 6 lanes from Euclid Ave. to Stone Ave., and from Main St. to I Add intersection turn lanes (e.g., dual left-turn lanes on all approaches at Speedway/Euclid intersections) Improve traffic signal timing to increase intersection capacity and traffic progression Widen 6th St. to 6 lanes from Campbell Ave. to Euclid Ave. 7. Other 7.1. preferential parking/reduced rates for fuel efficient vehicles 8. Extra 8.1. Reduce parking costs for alternative fuel vehicles 8.2. lights timed according to flow...in A.M. have lights coming into campus be mor conducive to moving traffic from N to S 8.3. Widen Speedway to 6 lanes from I-10 to Euclid 8.4. more on-line learning avaiability 8.5. Higher subsidy for bs pass 8.6. Car pool incentives forboth aculty and students 8.7. Limit access to parking - higher costs, less availability, more restrictions on access 8.8. Provide incentives to produce preferable behavior, such as payments or reduced costs for carpoolers.
116 8.9. Universal Access Pass funded by combination minimal student fee and other source(s) Mandatory bus pass purchase built into tuition costs 3. Break 4. Decrease Automobile Use 1. Decrease Automobile Use Totals Decrease Automobile Use Totals Criteria Ease of Cost Benefit Implementation Voting Method: SlidingScale SlidingScale SlidingScale # Ballot Items Average STD
117 1. make parking permit rates equal to Tucson Market 2. No parking permits issued to students living on campus 3. Pay studnts/employees not to bring their vehicle to cmpus 4. Prohibit driving if commute is less than mies 5. Eliminate black market in residential parking pemits. Currenly, students sell/rent the permits on streets with residential permit parking only. 6. hgher parkig rates for more convenient parking incentives for not driving to campus mandate reomte parking for freshman. Provide shuttle servie to campus 9. Prohibit freshman from bringing cars to campus Increase parking cost Institute parking fees for 11. UMC employees Restrict parking permit 12. availability Time of day restrictions Single day use permits 14. only Fee per use parking 15. permit (all lots gated) Restrict general use parking and add more 16. carpool parking only permits and spaces. Expand neighborhood 17. parking bans Voting Details Criteria Statistic: Mean. Votes Cast: 23, Abstained: 0 2. Decrease Automobile Use Criteria: Cost Vote Method: SlidingScale

118 Decrease Automobile Use Criteria: Cost Vote Distribution # Ballot Items Avg Total STD Votes 1. make parking permit rates equal to Tucson Market No parking permits issued to students living on campus Pay studnts/employees not to bring their vehicle to cmpus Prohibit driving if commute is less than 3 mies Eliminate black market in residential parking pemits. Currenly, students sell/rent the permits on streets with residential permit parking only. 6. hgher parkig rates for more convenient parking incentives for not driving to campus mandate reomte parking for freshman
119 Provide shuttle servie to campus 9. Prohibit freshman from bringing cars to campus Increase parking cost Institute parking fees for UMC employees Restrict parking permit availability Time of day restrictions Single day use permits only Fee per use parking permit (all lots gated) Restrict general use parking and add more 16. carpool parking only permits and spaces Expand neighborhood parking bans Decrease Automobile Use Criteria: Benefit Vote Method: SlidingScale Decrease Automobile Use Criteria: Benefit Vote Distribution # Ballot Items Avg Total STD Votes
120 1. make parking permit rates equal to Tucson Market No parking permits issued to students living on campus Pay studnts/employees not to bring their vehicle to cmpus Prohibit driving if commute is less than 3 mies Eliminate black market in residential parking pemits. Currenly, students sell/rent the permits on streets with residential permit parking only. 6. hgher parkig rates for more convenient parking incentives for not driving to campus mandate reomte parking for freshman. Provide shuttle servie to campus Prohibit freshman from bringing cars to campus Increase parking cost Institute parking fees for UMC employees Restrict parking permit availability Time of day restrictions Single day use permits only Fee per use parking permit (all lots gated) Restrict general use parking and add more 16. carpool parking only permits and spaces Expand neighborhood parking bans Decrease Automobile Use Criteria: Ease of Implementation Vote Method: SlidingScale
121 Decrease Automobile Use Criteria: Ease of Implementation Vote Distribution # Ballot Items Avg Total STD Votes 1. make parking permit rates equal to Tucson Market No parking permits issued to students living on campus Pay studnts/employees not to bring their vehicle to cmpus Prohibit driving if commute is less than 3 mies Eliminate black market in residential parking pemits. Currenly, students sell/rent the permits on streets with residential permit parking only. 6. hgher parkig rates for more convenient parking incentives for not driving to campus mandate reomte parking for freshman
122 Provide shuttle servie to campus 9. Prohibit freshman from bringing cars to campus Increase parking cost Institute parking fees for UMC employees Restrict parking permit availability Time of day restrictions Single day use permits only Fee per use parking permit (all lots gated) Restrict general use parking and add more 16. carpool parking only permits and spaces Expand neighborhood parking bans Decrease Automobile Use Ballot Items with Comments 1. make parking permit rates equal to Tucson Market 1.1. Tucson does not have a parking market -look at ASU 1.2. What is Tucson market? 1.3. Parking rates in downtown Tucson are % more expensive than UA 1.4. ditto - #2 - whatis the Tucson mtk? Ithught current rates were based on costs to build garages/lots 2. No parking permits issued to students living on campus 2.1. Students on campus still have cars 2.2. students have jobs and need transportation 2.3. Not realistic 2.4. Increased SunTran routes and schedues can help make this more realisic 2.5. This will result in more parking in neighborhoods could encourage more traffic problems in neighborhoods. How about designated parking for Freshman only? 3. Pay studnts/employees not to bring their vehicle to cmpus 3.1. Difficult to use state funds for this. Lega concerns 4. Prohibit driving if commute is less than 3 mies 4.1. How do you know/impliment 4.2. Impossile to enforce 4.3. Could prohibit the sale of a parking permit to these individuas. 5. Eliminate black market in residential parking pemits. Currenly, students sell/rent the permits on streets with residential permit parking only not sure that the benefit would be worth the cost 5.2. Not sure how large the problem currently is. 6. hgher parkig rates for more convenient parking 6.1. could impact retailers or visitors to capus 7. incentives for not driving to campus 7.1. Would these be financial incentives? 8. mandate reomte parking for freshman. Provide shuttle servie to campus 8.1. Freshman need to come to campus the most 8.2. could potnetially cause problems in neighborhoods 8.3. Freshman are typically on the campus the gretest length of time for any given day. A shuttle could be a benefit 9. Prohibit freshman from bringing cars to campus 9.1. How would you enforce 9.2. few freshman have cars presently 9.3. Approximately 1200 freshman crrently have permits
123 10. Increase parking cost Unless you have enforcement, people will park in neighborhoods Neighborhoods have parking programs to enforce parking 11. Institute parking fees for UMC employees UMC needs to be competitive for employees Shift work makes this hard 12. Restrict parking permit availability This will definitely result in neighborhood parking congestion Unless the City program is managed properly 13. Time of day restrictions Difficult to manage with ope access to surfac parking lots 14. Single day use permits only would this mean ONLY daily permits would be sold? Or that daily permits would be available in addition to other permits? hard to know how many people would use. my make garages harder to manage Could be a mxture of both 15. Fee per use parking permit (all lots gated) Not all lots are gate so large infrasructure costs to implemmnent expensive and very difficult to enforce and manage Will require additional staff (lot attendants). 16. Restrict general use parking and add more carpool parking only permits and spaces. 17. Expand neighborhood parking bans Cntrolled by the City, not UA Not sure enough are not restricted to add significant benefit Current procedure is a cumbersome block-by-block petition process. Might need a citywide policy instead. 5. Increase Alternative Mode Use 1. Increase Alternative Mode Use Totals
124 Increase Alternative Mode Use Totals Criteria Cost Benefit Ease of Implementation Voting Method: SlidingScale SlidingScale SlidingScale # Ballot Items Average STD 1. Increase peripheral parking with transit shuttle Vanpool program for
125 students and/or staff. 3. Mandate new building projects that will increase demand to pay a transportation fee to fun alternative transprtation pograms 4. Provide better transt linkages between PCC & UA (Downtown Campus). 5. bus priority access on campus streets. Re-think circulation patterns 6. Increase Park and Ride useage (Additional Marketing) 7. ad campaign to increase awareness of alt. modes available 8. Increase the marketing of existing and future TDM programs to increse awareness 9. freshman packets should contain only alternative transportation mode increase marketing of 10. alternatives to parents ofincoming students Provide incoming students with user 11. friendly information (via video, etc.) on how to ride the bus. 12. Create auto free zone dedicated bus lanes or 13. HOV lanes Look for mixed use uniersity-oriented housing development 14. opportunities along RTA corridors like Grant, Broadway, 22nd Incentify private sector housing to provide 15. alternat odes of transprt with flexible schedules increase subsidy for 16. vanpools Reduce pedestrian
126 fatalities and nearfatalities by strictly enforcing speed limits, stop signs, other signals and signs. Improve local bicycle 18. lanes to promote cycling provide shower/clean up 19. areas for bikers/walkers Identify a high-density pedestrian zone around 20. the University with signage or colored pavement. Improve pedestrian safety by installing 21. additional HAWK crossings near the University. Improve access to campus by pedestians 22. and cyclists with overpasses, bike paths, sidewalks Improve lighting and 23. sidewalk connections to promote walking Increase the number of express SuTran routes 24. into the campus and add later evening service Build park and ride at locations that Cat Tran 25. can use at 5 to 7 mile radius from campus. Provide a student ride 26. matching service transit priority lanes on 27. surrounding roadways Rapid bus transit system 28. for major arterials n/s and e/w more shuttles around 29. neighborhoods make current transporttion sexierto 30. proote ridership ie all new buses create a bike sharing 31. program
127 Extend the modern streetcar line into the 32. neighbrhoods to provide a fixed rail line to the campus more grade-separated facilities: ped and bike underpassess, transit 33. underpasses, underground parking access, pedestrian bridges Work with off campus housing (student apartment complexes)to 34. provide bus passes, or shuttle sevices to and from campus better bus schedue hours 35. to create convenience Move CatTran into SunTran so that transit 36. can go where it needs not based on cost or artifical boundries Provide on-campus vehicle alternatives for those alternative mode 37. users (zip car) to eliminate need for car during the day direct transit from larger 38. populated areas..express routes Increase incentives for 39. carpooling Expand CatTran service 40. into neighborhoods surrounding campus. New neighborhood transit circulator system within mile radius of campus circulating directly onto campus. UA transit shuttle within miles of campus along existing SunTran routes. Provide additionally 43. subsidized or free transit pass
128 Universal transit pass deployment (all students 44. get a pass with payment of tuition and fees). More SunTran express 45. routes/service to UA with remote park-n-ride lots. Faculty/staff bicycle 46. purchase subsidy Voting Details Criteria Statistic: Mean. Votes Cast: 26, Abstained: 0 2. Increase Alternative Mode Use Criteria: Cost Vote Method: SlidingScale
129 Increase Alternative Mode Use Criteria: Cost Vote Distribution # Ballot Items Avg Total STD Votes 1. Increase peripheral parking with transit shuttle Vanpool program for students and/or staff Mandate new building projects that will 3. increase demand to pay a transportation fee to fun alternative transprtation pograms
130 4. Provide better transt linkages between PCC & UA (Downtown Campus) bus priority access on campus streets. Rethink circulation patterns Increase Park and Ride useage (Additional Marketing) ad campaign to increase awareness of alt. modes available Increase the marketing of existing and future TDM programs to increse awareness freshman packets should contain only alternative transportation mode increase marketing of alternatives to parents 10. ofincoming students Provide incoming students with user friendly 11. information (via video, etc.) on how to ride the bus. 12. Create auto free zone dedicated bus lanes or HOV lanes Look for mixed use uniersity-oriented housing 14. development opportunities along RTA corridors like Grant, Broadway, 22nd Incentify private sector housing to provide 15. alternat odes of transprt with flexible schedules 16.increase subsidy for vanpools Reduce pedestrian fatalities and nearfatalities by strictly enforcing speed limits, 17. stop signs, other signals and signs Improve local bicycle lanes to promote cycling provide shower/clean up areas for 19. bikers/walkers Identify a high-density pedestrian zone 20. around the University with signage or colored pavement. Improve pedestrian safety by installing 21. additional HAWK crossings near the University. Improve access to campus by pedestians and 22. cyclists with overpasses, bike paths, sidewalks Improve lighting and sidewalk connections to 23. promote walking Increase the number of express SuTran 24. routes into the campus and add later evening service Build park and ride at locations that Cat Tran 25. can use at 5 to 7 mile radius from campus
131 26. Provide a student ride matching service transit priority lanes on surrounding roadways Rapid bus transit system for major arterials 28. n/s and e/w more shuttles around neighborhoods make current transporttion sexierto proote 30. ridership ie all new buses create a bike sharing program Extend the modern streetcar line into the 32. neighbrhoods to provide a fixed rail line to the campus more grade-separated facilities: ped and bike underpassess, transit underpasses, 33. underground parking access, pedestrian bridges Work with off campus housing (student 34. apartment complexes)to provide bus passes, or shuttle sevices to and from campus better bus schedue hours to create 35. convenience Move CatTran into SunTran so that transit 36. can go where it needs not based on cost or artifical boundries Provide on-campus vehicle alternatives for 37. those alternative mode users (zip car) to eliminate need for car during the day direct transit from larger populated 38. areas..express routes Increase incentives for carpooling Expand CatTran service into neighborhoods 40. surrounding campus New neighborhood transit circulator system 41. within 5-mile radius of campus circulating directly onto campus. UA transit shuttle within 5 miles of campus 42. along existing SunTran routes Provide additionally subsidized or free transit 43. pass Universal transit pass deployment (all 44. students get a pass with payment of tuition and fees). More SunTran express routes/service to UA 45. with remote park-n-ride lots Faculty/staff bicycle purchase subsidy Increase Alternative Mode Use Criteria: Benefit Vote Method: SlidingScale
132 Increase Alternative Mode Use Criteria: Benefit Vote Distribution # Ballot Items Avg Total STD Votes 1. Increase peripheral parking with transit shuttle Vanpool program for students and/or staff Mandate new building projects that will 3. increase demand to pay a transportation fee to fun alternative transprtation pograms
133 4. Provide better transt linkages between PCC & UA (Downtown Campus) bus priority access on campus streets. Rethink circulation patterns Increase Park and Ride useage (Additional Marketing) ad campaign to increase awareness of alt. modes available Increase the marketing of existing and future TDM programs to increse awareness freshman packets should contain only alternative transportation mode increase marketing of alternatives to parents 10. ofincoming students Provide incoming students with user friendly 11. information (via video, etc.) on how to ride the bus. 12. Create auto free zone dedicated bus lanes or HOV lanes Look for mixed use uniersity-oriented housing 14. development opportunities along RTA corridors like Grant, Broadway, 22nd Incentify private sector housing to provide 15. alternat odes of transprt with flexible schedules 16. increase subsidy for vanpools Reduce pedestrian fatalities and nearfatalities by strictly enforcing speed limits, stop signs, other signals and signs. Improve local bicycle lanes to promote 18. cycling provide shower/clean up areas for 19. bikers/walkers Identify a high-density pedestrian zone 20. around the University with signage or colored pavement. Improve pedestrian safety by installing 21. additional HAWK crossings near the University. Improve access to campus by pedestians and 22. cyclists with overpasses, bike paths, sidewalks Improve lighting and sidewalk connections to 23. promote walking Increase the number of express SuTran 24. routes into the campus and add later evening service Build park and ride at locations that Cat Tran 25. can use at 5 to 7 mile radius from campus
134 26. Provide a student ride matching service transit priority lanes on surrounding 27. roadways Rapid bus transit system for major arterials 28. n/s and e/w more shuttles around neighborhoods make current transporttion sexierto proote 30. ridership ie all new buses create a bike sharing program Extend the modern streetcar line into the 32. neighbrhoods to provide a fixed rail line to the campus more grade-separated facilities: ped and bike underpassess, transit underpasses, 33. underground parking access, pedestrian bridges Work with off campus housing (student 34. apartment complexes)to provide bus passes, or shuttle sevices to and from campus better bus schedue hours to create 35. convenience Move CatTran into SunTran so that transit 36. can go where it needs not based on cost or artifical boundries Provide on-campus vehicle alternatives for 37. those alternative mode users (zip car) to eliminate need for car during the day direct transit from larger populated 38. areas..express routes Increase incentives for carpooling Expand CatTran service into neighborhoods 40. surrounding campus New neighborhood transit circulator system 41. within 5-mile radius of campus circulating directly onto campus. UA transit shuttle within 5 miles of campus 42. along existing SunTran routes Provide additionally subsidized or free transit 43. pass Universal transit pass deployment (all 44. students get a pass with payment of tuition and fees) More SunTran express routes/service to UA 45. with remote park-n-ride lots Faculty/staff bicycle purchase subsidy Increase Alternative Mode Use Criteria: Ease of Implementation Vote Method: SlidingScale

135 Increase Alternative Mode Use Criteria: Ease of Implementation Vote Distribution # Ballot Items Avg Total STD Votes 1. Increase peripheral parking with transit shuttle Vanpool program for students and/or staff Mandate new building projects that will 3. increase demand to pay a transportation fee to fun alternative transprtation pograms
136 4. Provide better transt linkages between PCC & UA (Downtown Campus) bus priority access on campus streets. Rethink circulation patterns Increase Park and Ride useage (Additional Marketing) ad campaign to increase awareness of alt. modes available Increase the marketing of existing and future TDM programs to increse awareness freshman packets should contain only alternative transportation mode increase marketing of alternatives to parents 10. ofincoming students Provide incoming students with user friendly 11. information (via video, etc.) on how to ride the bus. 12. Create auto free zone dedicated bus lanes or HOV lanes Look for mixed use uniersity-oriented housing 14. development opportunities along RTA corridors like Grant, Broadway, 22nd Incentify private sector housing to provide 15. alternat odes of transprt with flexible schedules 16.increase subsidy for vanpools Reduce pedestrian fatalities and nearfatalities by strictly enforcing speed limits, 17. stop signs, other signals and signs Improve local bicycle lanes to promote cycling provide shower/clean up areas for 19. bikers/walkers Identify a high-density pedestrian zone 20. around the University with signage or colored pavement. Improve pedestrian safety by installing 21. additional HAWK crossings near the University. Improve access to campus by pedestians and 22. cyclists with overpasses, bike paths, sidewalks Improve lighting and sidewalk connections to 23. promote walking Increase the number of express SuTran 24. routes into the campus and add later evening service Build park and ride at locations that Cat Tran 25. can use at 5 to 7 mile radius from campus
137 26. Provide a student ride matching service transit priority lanes on surrounding roadways Rapid bus transit system for major arterials 28. n/s and e/w more shuttles around neighborhoods make current transporttion sexierto proote 30. ridership ie all new buses create a bike sharing program Extend the modern streetcar line into the 32. neighbrhoods to provide a fixed rail line to the campus more grade-separated facilities: ped and bike underpassess, transit underpasses, 33. underground parking access, pedestrian bridges Work with off campus housing (student 34. apartment complexes)to provide bus passes, or shuttle sevices to and from campus better bus schedue hours to create 35. convenience Move CatTran into SunTran so that transit 36. can go where it needs not based on cost or artifical boundries Provide on-campus vehicle alternatives for 37. those alternative mode users (zip car) to eliminate need for car during the day direct transit from larger populated 38. areas..express routes Increase incentives for carpooling Expand CatTran service into neighborhoods 40. surrounding campus New neighborhood transit circulator system 41. within 5-mile radius of campus circulating directly onto campus. UA transit shuttle within 5 miles of campus 42. along existing SunTran routes Provide additionally subsidized or free transit 43. pass Universal transit pass deployment (all 44. students get a pass with payment of tuition and fees). More SunTran express routes/service to UA 45. with remote park-n-ride lots Faculty/staff bicycle purchase subsidy Increase Alternative Mode Use Ballot Items with Comments 1. Increase peripheral parking with transit shuttle collaboration between City and UA could make this a success 2. Vanpool program for students and/or staff.
138 3. Mandate new building projects that will increase demand to pay a transportation fee to fun alternative transprtation pograms 3.1. Sound illegal 3.2. make it an impact fee for outside of area 3.3. Unclear what this means may not reduce car traffic 3.5. Campus fee for campus buildings to fund the cost of providing TDM programs 4. Provide better transt linkages between PCC & UA (Downtown Campus) would be compatible with AJAC pogram and also promote trip reduction 5. bus priority access on campus streets. Re-think circulation patterns 5.1. assumes this means giving buses priority 5.2. Good idea on bus priority 6. Increase Park and Ride useage (Additional Marketing) 6.1. Yes, but first we need to provide better transit service. Some buses are over capacity 6.2. Buses are smetimes a hard sell otside the U area 7. ad campaign to increase awareness of alt. modes available 7.1. Ad campaign require onging funding. Each new cohort of students must be educated All education is a good idea making alternate modes easier/more desirable to use is a better investment of resources than trying to sell something that really isn't desirable or convenient 7.4. Advertising requires on on-going campaign to reinfore message-effective, but costly 8. Increase the marketing of existing and future TDM programs to increse awareness 8.1. might require UA and COT cooperation/coordination 9. freshman packets should contain only alternative transportation mode 10. increase marketing of alternatives to parents ofincoming students parents are often the decision makers regarding having a car or not Agreed, but students tend to provide the parents with their "needs"more detailed information is needed to the parents. 11. Provide incoming students with user friendly information (via video, etc.) on how to ride the bus. 12. Create auto free zone Around the entire campus or just incertain areas? Nt sure how this would improve regional traffic congesion Would detract othe from visiting the campus which wiould hurt commerce and efors to make university more accessible to th community Great idea, but needs to be coupled with other solutions (Park and Ride lots, buses. etc) The Campus already has several auto free zones This would determine how serious we really are Only works if we have a better lan for region 13. dedicated bus lanes or HOV lanes usually means wider roads...which comes w/ many negatives 14. Look for mixed use uniersity-oriented housing development opportunities along RTA corridors like Grant, Broadway, 22nd This requires rezoning -- a bitter legal and political fight This will require good education on the issues. One the public is accepting of the strategy, it can have great sucess Much of the property along these corridors is underutilized per current zoning This could help preserve the neighborhoods near the corridors by discouraging "minidorms"
139 14.5. This is an option PROMOTED by the minidorm developers. 15. Incentify private sector housing to provide alternat odes of transprt with flexible schedules we continue to make it easierto build outside the core and impct fees are structured so that it is just as easy to bild in ita Ranch as in the central corridor The moreindividuals that live close to the campus, the higher the likelyhood they will use a TDM to access the campus. 16. increase subsidy for vanpools 17. Reduce pedestrian fatalities and near-fatalities by strictly enforcing speed limits, stop signs, other signals and signs Should include strict enforcement of bicycle and pedestrian law also 18. Improve local bicycle lanes to promote cycling 19. provide shower/clean up areas for bikers/walkers 20. Identify a high-density pedestrian zone around the University with signage or colored pavement Notsure what the benefit would be This would alert motorists to slow down and watch for pedestrians I would enhance the ped experience which would be a benefit if more housing was built around the campus. 21. Improve pedestrian safety by installing additional HAWK crossings near the University. 22. Improve access to campus by pedestians and cyclists with overpasses, bike paths, sidewalks Removing pedestrian traffic from major intersections with bridges and tunnels will improve traffic flow and improve safety 23. Improve lighting and sidewalk connections to promote walking The current process for obtaining sidewalks and streetligts is awful. Neighborhoods are pitted against each other to compete for a totally inadequate pot of funds. We need sidewalks and sreetlights thoughout the core urban area. This should be a no-brainer! This would also improve the safety 24. Increase the number of express SuTran routes into the campus and add later evening service Would the Uiversity subsidize them? The increased fees from addtional rider should help pay for the service New express routes are generally beneficial because they appeal to the choice commuter, but can be costly. 25. Build park and ride at locations that Cat Tran can use at 5 to 7 mile radius from campus could combine with SunTran park and rides A bus pass provided to all employees and students wouldallow them to use the existing SunTran Park and Ride faciliies 26. Provide a student ride matching service match this with marketing and incentives for carpooling 27. transit priority lanes on surrounding roadways means wider roads which are harder for peds to cross and more prone to cars speeding Reduce the number of lanes instead of widening the roads using existing lanes is more ped friendly but creates more congestin 28. Rapid bus transit system for major arterials n/s and e/w can be accomplished with more modern vehicles and priority sgnalization. Frequency of service is already good. 29. more shuttles around neighborhoods
140 30. make current transporttion sexierto proote ridership ie all new buses This would be effective and cheap 31. create a bike sharing program Unless they can take the bike home will only reduce congestion for trips within campus In existing systems elsewhere, yes, they can tke the bike home. However, I don't see this working in our city, where bicycles are routinely stolen and sold for drug money while more expensive, bikes can be fitted with GPS/tracking in order to track usage and prevent theft (or at least allow for recovery) Electronic tracking could help 32. Extend the modern streetcar line into the neighbrhoods to provide a fixed rail line to the campus 33. more grade-separated facilities: ped and bike underpassess, transit underpasses, underground parking access, pedestrian bridges Expensive but look at the success of the current underpasses. No accidents and no delays. 34. Work with off campus housing (student apartment complexes)to provide bus passes, or shuttle sevices to and from campus Isn't this already being done? Perhaps the programculd be expanded at low cost. 35. better bus schedue hours to create convenience 36. Move CatTran into SunTran so that transit can go where it needs not based on cost or artifical boundries Would move cost to City away from U of A Would the UA not still have to pay to have SunTran operate buses on the campus? Needs to be shred cost but exta coordination (along with MSC) would add routes and schedules without additional cost The current SunTran buses could not operate the intra-campus routes. Smaller vehicles would be needed On a cost per hour of service, Cat Tran has a lower cost. No union Better coord. & Planning needed but Cat Tran can provide service more economical. Cat Tran could use some Regional help wth bus or operational fuds 37. Provide on-campus vehicle alternatives for those alternative mode users (zip car) to eliminate need for car during the day insurance sometimes requires age limits for drivers 38. direct transit from larger populated areas..express routes 39. Increase incentives for carpooling 40. Expand CatTran service into neighborhoods surrounding campus Poor cost/benefit tradeoff. The closer and chaaper routes would be less useful, as residents already use alternate modes. 41. New neighborhood transit circulator system within 5-mile radius of campus circulating directly onto campus. 42. UA transit shuttle within 5 miles of campus along existing SunTran routes. 43. Provide additionally subsidized or free transit pass A bus pass is the mosdt effective means to reduce the number of single occupancy trips to a campus 44. Universal transit pass deployment (all students get a pass with payment of tuition and fees) The universal pass is the key to additional funding for transit improvements and increasing usage by students and faculty This is necessary in any option!

141 44.3. There are a variey of ways to fund a Univeral Access Pass and so tuition and fees should not be the only method suggested. 45. More SunTran express routes/service to UA with remote park-n-ride lots. 46. Faculty/staff bicycle purchase subsidy How do you enforce the use of the bike for commuting to campus? 6. Centralize UA Population 1. Centralize UA Population Totals Centralize UA Population Totals Criteria Cost Ease of Benefit Implementation Voting Method: SlidingScale SlidingScale SlidingScale # Ballot Items Average STD 1. A better K-12 public school system in central Tucson will encourage faculty & grad students with families to live closer in 2. Do not rezone historic districts (Federal or city)
142 near campus. This option shold be off the table, as it is streuously opposed by the residents and homewners in these neighborhoods. It is also problematic from many other perspectives (e.g. low-denisty housing plays a role in preserving mature vegetation that mitigates heat and pollution generated by autmobile traffic, high rental rates are corelated with increased crime). 3. create ease and incentives for builders to build in core an renovate existing buildings 4. Provide financial incentive for faculty to purchase housing downtown (and use streetcar to work) 5. Capitalize on streetcar by pursuing all possible opportunties for university-oriented (faculty & students) housing along streetcar route. 6. rezone areas closer to campus for higher densities and mixed uses 7. provide more and better quality housing for UA employees in central Tucson 8. Build more on-campus student housing Build more private student housing within one mile of campus Increase the number of UA employees living 10. within one mile of campus. Increase the number of 11. UMC employees within one mile of campus. 12. A policy that freshmen
143 must live on campus. Provide a financial incentive for students to 13. live on-campus (e.g., tuition discount). Voting Details Criteria Statistic: Mean. Votes Cast: 13, Abstained: 0 2. Centralize UA Population Criteria: Cost Vote Method: SlidingScale Centralize UA Population Criteria: Cost Vote Distribution # Ballot Items Avg Total STD Votes 1. A better K-12 public school system in central Tucson will encourage faculty & grad students with families to live closer in Do not rezone historic districts (Federal or city) near campus. This option shold be off the table, as it is streuously opposed by the residents and homewners in these 2. neighborhoods. It is also problematic from many other perspectives (e.g. low-denisty housing plays a role in preserving mature vegetation that mitigates heat and pollution generated by autmobile traffic, high rental rates are corelated with increased crime)
144 3. create ease and incentives for builders to build in core an renovate existing buildings Provide financial incentive for faculty to purchase housing downtown (and use streetcar to work) 5. Capitalize on streetcar by pursuing all possible opportunties for university-oriented (faculty & students) housing along streetcar route. 6. rezone areas closer to campus for higher densities and mixed uses provide more and better quality housing for UA employees in central Tucson Build more on-campus student housing Build more private student housing within one mile of campus Increase the number of UA employees living 10. within one mile of campus Increase the number of UMC employees 11. within one mile of campus A policy that freshmen must live on campus Provide a financial incentive for students to 13. live on-campus (e.g., tuition discount) Centralize UA Population Criteria: Benefit Vote Method: SlidingScale Centralize UA Population Criteria: Benefit
145 Vote Distribution # Ballot Items Avg Total STD Votes 1. A better K-12 public school system in central Tucson will encourage faculty & grad students with families to live closer in Do not rezone historic districts (Federal or city) near campus. This option shold be off the table, as it is streuously opposed by the residents and homewners in these 2. neighborhoods. It is also problematic from many other perspectives (e.g. low-denisty housing plays a role in preserving mature vegetation that mitigates heat and pollution generated by autmobile traffic, high rental rates are corelated with increased crime). 3. create ease and incentives for builders to build in core an renovate existing buildings Provide financial incentive for faculty to purchase housing downtown (and use streetcar to work) 5. Capitalize on streetcar by pursuing all possible opportunties for university-oriented (faculty & students) housing along streetcar route. 6. rezone areas closer to campus for higher densities and mixed uses provide more and better quality housing for UA employees in central Tucson Build more on-campus student housing Build more private student housing within one mile of campus Increase the number of UA employees living 10. within one mile of campus Increase the number of UMC employees 11. within one mile of campus A policy that freshmen must live on campus Provide a financial incentive for students to 13. live on-campus (e.g., tuition discount) Centralize UA Population Criteria: Ease of Implementation Vote Method: SlidingScale

146 Centralize UA Population Criteria: Ease of Implementation Vote Distribution # Ballot Items Avg Total STD Votes 1. A better K-12 public school system in central Tucson will encourage faculty & grad students with families to live closer in Do not rezone historic districts (Federal or city) near campus. This option shold be off the table, as it is streuously opposed by the residents and homewners in these 2. neighborhoods. It is also problematic from many other perspectives (e.g. low-denisty housing plays a role in preserving mature vegetation that mitigates heat and pollution generated by autmobile traffic, high rental rates are corelated with increased crime). 3. create ease and incentives for builders to build in core an renovate existing buildings Provide financial incentive for faculty to purchase housing downtown (and use streetcar to work) 5. Capitalize on streetcar by pursuing all possible opportunties for university-oriented (faculty & students) housing along streetcar route. 6. rezone areas closer to campus for higher
147 densities and mixed uses 7. provide more and better quality housing for UA employees in central Tucson Build more on-campus student housing Build more private student housing within one mile of campus Increase the number of UA employees living 10. within one mile of campus Increase the number of UMC employees 11. within one mile of campus A policy that freshmen must live on campus Provide a financial incentive for students to 13. live on-campus (e.g., tuition discount) Centralize UA Population Ballot Items with Comments 1. A better K-12 public school system in central Tucson will encourage faculty & grad students with families to live closer in 1.1. May not help because some people do not want to live in the city, but farther out. 2. Do not rezone historic districts (Federal or city) near campus. This option shold be off the table, as it is streuously opposed by the residents and homewners in these neighborhoods. It is also problematic from many other perspectives (e.g. low-denisty housing plays a role in preserving mature vegetation that mitigates heat and pollution generated by autmobile traffic, high rental rates are corelated with increased crime) Currently there i an area directly wet of campus (east of Eclid) tat has several redevelopment opportunities for higher densities that the private sector would take on. Could also reduce impact to neighborhoods to west. 3. create ease and incentives for builders to build in core an renovate existing buildings 3.1. This option must be pursued in a thoughtful manner, or it will facilitate the bulldozing of historic neighbrhoods, which is aready under way Currently easier to create sprawl and tear down existig building than to renovate. Thoughtful includes making sure that balance existsso that neighborhoods ere livable and pedestrian friendly, ieshoppig nd commerce nearby. 4. Provide financial incentive for faculty to purchase housing downtown (and use streetcar to work) 5. Capitalize on streetcar by pursuing all possible opportunties for university-oriented (faculty & students) housing along streetcar route. 6. rezone areas closer to campus for higher densities and mixed uses 6.1. This is a nonstarter. Mayor and Council already voted this down. They will continue to do so, if they want to stay in office Areadirectly west of campus (east of Euclid) and on Park have opportunity sites The areas do not have to be directly adjacent to campus, but anywhere within2 miles will dramatically increase the TDM usage for those living there Many areas near streetar route have potential (west of 4th Ave & downtown) 7. provide more and better quality housing for UA employees in central Tucson 8. Build more on-campus student housing. 9. Build more private student housing within one mile of campus Again, this option presumes that historic neighborhoods will be (and should be) bulldozed to make way for apartment buildings. Anyone pursuing this option had better be prepared for a major legal/politcal battle You could move beyond the neighborhoods directly adjacent to campus. The apartment complexes on Mountain are a prime expample. 10. Increase the number of UA employees living within one mile of campus.

148 10.1. How? Resonably priced housing and more activity 11. Increase the number of UMC employees within one mile of campus probably not realistic 12. A policy that freshmen must live on campus Cost is based on if there is currently enoug housing for this to take place Would this require additional housing or is there an adequate supply already more is needed. Currently there areonly about 7,000 beds on campus with 800 more to be under cnstruction starting this fall 13. Provide a financial incentive for students to live on-campus (e.g., tuition discount) need to build more housing first On campus housing full There is a benefit in terms of academic success for freshman to live on campus, but not all students want or can afford to live on campus. 7. Spread Travel Demand 1. Spread Travel Demand Totals Spread Travel Demand Totals Criteria Cost Benefit Ease of Implementation Voting Method: SlidingScale SlidingScale SlidingScale # Ballot Items Average STD Use of satellite campuses 1. to disperse travel to other areas. Spread classes out more, 2. night classes and Sarurday. Hold core classes at highschools for freshman 3. to limit their trips to campus Shift employee work 4. schedule (e.g., 9:00 AM to 6:00 PM). 5. Reduce the number of

149 classes starting between 8:00 and 9:00 AM. Start more classes at 6. 6:30 PM or later Conduct classes on 7. weekends Voting Details Criteria Statistic: Mean. Votes Cast: 13, Abstained: 0 2. Spread Travel Demand Criteria: Cost Vote Method: SlidingScale Spread Travel Demand Criteria: Cost Vote Distribution # Ballot Items Avg Total STD Votes Use of satellite campuses to disperse travel to 1. other areas Spread classes out more, night classes and 2. Sarurday Hold core classes at highschools for freshman 3. to limit their trips to campus Shift employee work schedule (e.g., 9:00 AM 4. to 6:00 PM) Reduce the number of classes starting 5. between 8:00 and 9:00 AM Start more classes at 6:30 PM or later Conduct classes on weekends Spread Travel Demand Criteria: Benefit Vote Method: SlidingScale
150 Spread Travel Demand Criteria: Benefit Vote Distribution # Ballot Items Avg Total STD Votes Use of satellite campuses to disperse travel to 1. other areas Spread classes out more, night classes and 2. Sarurday Hold core classes at highschools for freshman 3. to limit their trips to campus Shift employee work schedule (e.g., 9:00 AM 4. to 6:00 PM) Reduce the number of classes starting 5. between 8:00 and 9:00 AM Start more classes at 6:30 PM or later Conduct classes on weekends Spread Travel Demand Criteria: Ease of Implementation Vote Method: SlidingScale Spread Travel Demand Criteria: Ease of Implementation Vote
151 Distribution # Ballot Items Avg Total STD Votes Use of satellite campuses to disperse travel to 1. other areas Spread classes out more, night classes and 2. Sarurday Hold core classes at highschools for freshman 3. to limit their trips to campus Shift employee work schedule (e.g., 9:00 AM 4. to 6:00 PM) Reduce the number of classes starting 5. between 8:00 and 9:00 AM Start more classes at 6:30 PM or later Conduct classes on weekends Spread Travel Demand Ballot Items with Comments 1. Use of satellite campuses to disperse travel to other areas This would require a shift in thinking. UA thinks of satellite campuses as located far outside the city (e.g. in Sierra Vista) Cost of building the new infrastructure wouild be high 1.3. couldn'tg satellite campus also be a local schools?? 1.4. Local schools are already a capacity during the das College life is about campus experience. 2. Spread classes out more, night classes and Sarurday. 3. Hold core classes at highschools for freshman to limit their trips to campus 3.1. High school facilities already utlized. College students don't want to be at a high school 3.2. makes no sense.we say freshmen shouldn' have cars...then sugesg they drive to a high school 3.3. This option would reduce the campus experience for freshman 3.4. How about using PCC campuses? 3.5. Thee is already classes at PCC that count twards UA credit. They are not just for freshman, but anyone Could ause loss of rntion of freshmen 4. Shift employee work schedule (e.g., 9:00 AM to 6:00 PM) Facilities management costs must be considered in evaluating any proposal of this type this is dependant on job duties 4.3. Could create longer days fo students and not reduce trips. 5. Reduce the number of classes starting between 8:00 and 9:00 AM Ma jsut have longer days, not reduce trips 5.2. Thi would enhace pedetrian safety, by sfting pedestrian traffic to a time of day when vehicular traffc is less. However, UA is on a four-day class schedule as a costsaving measure theentire campus is not on a 4day schedule 6. Start more classes at 6:30 PM or later Could encourage multiple daily commutes to campus 6.2. or not derease trips--jst longer days on ampus 6.3. Could increase cost in utilities-lighting & heating/cooling 6.4. The number of evening classs is already increasing. Difficult when students need to work to help pay the increasing cst of education.

152 6.5. Would make the University more accessible to folks who already work full-time. This is in line with the mssion of a land-grant University. 7. Conduct classes on weekends May icrease overhead due to eletricity 7.2. I'm sure faculty will love the idea 7.3. need to get faculty to teach these classes This also would not mean a student is not drivingdurng the week, but taking additional class on the weekend. 8. Decrease UA Trips 1. Decrease UA Trips Totals Decrease UA Trips Totals Criteria Cost Benefit Ease of Implementation Voting Method: SlidingScale SlidingScale SlidingScale # Ballot Items Average STD 1. Limit enrollment Limit the number of UA 2. employees More internet/web 3. based classes More telecommuting for 4. staff Compressed work week 5. for employees Compressed class week Voting Details Criteria Statistic: Mean. Votes Cast: 13, Abstained: 0 2. Decrease UA Trips Criteria: Cost Vote Method: SlidingScale
153 Decrease UA Trips Criteria: Cost Vote Distribution # Ballot Items Avg Total STD Votes 1. Limit enrollment Limit the number of UA employees More internet/web based classes More telecommuting for staff Compressed work week for employees Compressed class week Decrease UA Trips Criteria: Benefit Vote Method: SlidingScale Decrease UA Trips Criteria: Benefit Vote Distribution # Ballot Items Avg Total STD Votes 1. Limit enrollment Limit the number of UA employees More internet/web based classes More telecommuting for staff Compressed work week for employees
154 6. Compressed class week Decrease UA Trips Criteria: Ease of Implementation Vote Method: SlidingScale Decrease UA Trips Criteria: Ease of Implementation Vote Distribution # Ballot Items Avg Total STD Votes 1. Limit enrollment Limit the number of UA employees More internet/web based classes More telecommuting for staff Compressed work week for employees Compressed class week Decrease UA Trips Ballot Items with Comments 1. Limit enrollment Not likely 1.2. Not sure how this would work? 1.3. The cost of attending wil limit the numbers some, but there is a large surge of high school students who need to go to college and UA must help support this Not good for UA economy, or education in general 1.5. President Likins had such a policy. President Shelton repudiated the policy immediately after arriving in Tucson. I don't see him changing his mind, especially as the University is bcomeing increasigly dependent on tuition s a funing source. 2. Limit the number of UA employees Employes are needed to support the mission of the university 2.2. we are developin more new programs which require most saff and faulty 2.3. makes class sizes larger 3. More internet/web based classes Don't have the quality of in-person classes 3.2. Idea is growing and NAU has been very successful. This is not for allclasses, but some could be taught in this manner 4. More telecommuting for staff many already do this 5. Compressed work week for employees many employees already do this
155 5.2. many are on a compressed work...often causes problems because not all emloyees are in the office 5.3. Would onl compound the traffic prblem on work days 5.4. With compressed work weeks the average shit is longer, so peak traffic may be reduced, it will just last longer Unless work week was staggered 6. Compressed class week Would create more congestion on class days 6.2. This is already in place. Most classes meet MW or TuTh only The benifit would depend on implimentation. You woul have too much congestion on the compressed days 9. Increase Roadway Capacity 1. Increase Roadway Capacity Totals Increase Roadway Capacity Totals Criteria Cost Benefit Ease of Implementation Voting Method: SlidingScale SlidingScale SlidingScale # Ballot Items Average STD Park Avene 6th street to Speedway needs 1. improvements for better traffic management create more right turn 2. lanes st Avenue improve to 6 3. lanes from Speedway to River Road 4. better traffic flow... more
156 or longer left arrows Widen Speedway Blvd. to 6 lanes from Euclid Ave. to 5. Stone Ave., and from Main St. to I-10. Add intersection turn lanes (e.g., dual left-turn lanes 6. on all approaches at Speedway/Euclid intersections). Improve traffic signal timing to increase 7. intersection capacity and traffic progression. Widen 6th St. to 6 lanes 8. from Campbell Ave. to Euclid Ave. Voting Details Criteria Statistic: Mean. Votes Cast: 12, Abstained: 0 2. Increase Roadway Capacity Criteria: Cost Vote Method: SlidingScale Increase Roadway Capacity Criteria: Cost Vote Distribution # Ballot Items Avg Total STD Votes Park Avene 6th street to Speedway needs 1. improvements for better traffic management create more right turn lanes st Avenue improve to 6 lanes from Speedway to River Road better traffic flow... more or longer left arrows Widen Speedway Blvd. to 6 lanes from Euclid 5. Ave. to Stone Ave., and from Main St. to I Add intersection turn lanes (e.g., dual left-turn

157 lanes on all approaches at Speedway/Euclid intersections). Improve traffic signal timing to increase 7. intersection capacity and traffic progression Widen 6th St. to 6 lanes from Campbell Ave. to Euclid Ave Increase Roadway Capacity Criteria: Benefit Vote Method: SlidingScale Increase Roadway Capacity Criteria: Benefit Vote Distribution # Ballot Items Avg Total STD Votes Park Avene 6th street to Speedway needs 1. improvements for better traffic management create more right turn lanes st Avenue improve to 6 lanes from Speedway to River Road better traffic flow... more or longer left arrows Widen Speedway Blvd. to 6 lanes from Euclid 5. Ave. to Stone Ave., and from Main St. to I Add intersection turn lanes (e.g., dual left-turn 6. lanes on all approaches at Speedway/Euclid intersections). Improve traffic signal timing to increase 7. intersection capacity and traffic progression Widen 6th St. to 6 lanes from Campbell Ave. to Euclid Ave Increase Roadway Capacity Criteria: Ease of Implementation Vote Method: SlidingScale
158 Increase Roadway Capacity Criteria: Ease of Implementation Vote Distribution # Ballot Items Avg Total STD Votes Park Avene 6th street to Speedway needs 1. improvements for better traffic management create more right turn lanes st Avenue improve to 6 lanes from Speedway to River Road better traffic flow... more or longer left arrows Widen Speedway Blvd. to 6 lanes from Euclid 5. Ave. to Stone Ave., and from Main St. to I Add intersection turn lanes (e.g., dual left-turn 6. lanes on all approaches at Speedway/Euclid intersections). Improve traffic signal timing to increase 7. intersection capacity and traffic progression Widen 6th St. to 6 lanes from Campbell Ave. to Euclid Ave Increase Roadway Capacity Ballot Items with Comments 1. Park Avene 6th street to Speedway needs improvements for better traffic management 1.1. Traffic is slow here, due to numeros pedestrian crossings. This is as it should be. Tucson needs to give up the fantasy that it's okay to drive 50 mph + in an area with heavy pedestrian traffi Better chaneling of pedetrians crossing the road would help 1.3. Improvements might mean crossing areas 2. create more right turn lanes 3. 1st Avenue improve to 6 lanes from Speedway to River Road 3.1. this is an RTA project 3.2. This and other road-widening projects simply shift the bottlenecks to different locations. 4. better traffic flow... more or longer left arrows 5. Widen Speedway Blvd. to 6 lanes from Euclid Ave. to Stone Ave., and from Main St. to I-10.


159 5.1. This and other road-widening projects simply move the bottlenecks to other locations. Also, this project is planned for approximately 2020, when gas will be costly. expensiveprice and aalability of 5.2. This will require eminent domain seizues, forbidden by Prop Add intersection turn lanes (e.g., dual left-turn lanes on all approaches at Speedway/Euclid intersections). 7. Improve traffic signal timing to increase intersection capacity and traffic progression Road widening projects simply move the bottlenecks elsewhere. 8. Widen 6th St. to 6 lanes from Campbell Ave. to Euclid Ave Previus planning study concluded to notwiden this rod Instead, how about making this stretch more pedestrian oriented with mixed use development that is in scale w/ the n'hood and adds university housing 8.3. The idea was to make the area within the campus more ed frendly 8.4. Add transit-only lanes which can also function as turn and bike lanes 10. Other 1. Other Totals Other Totals Criteria Cost Benefit Ease of Implementation Voting Method: SlidingScale SlidingScale SlidingScale # Ballot Items Average STD preferential 1. parking/reduced rates for fuel efficient vehicles Voting Details Criteria Statistic: Mean. Votes Cast: 13, Abstained: 0 2. Other Criteria: Cost Vote Method: SlidingScale

160 Other Criteria: Cost Vote Distribution # Ballot Items Avg Total STD Votes preferential parking/reduced rates for fuel efficient vehicles 3. Other Criteria: Benefit Vote Method: SlidingScale Other Criteria: Benefit Vote Distribution # Ballot Items Avg Total STD Votes preferential parking/reduced rates for fuel efficient vehicles 4. Other Criteria: Ease of Implementation Vote Method: SlidingScale Other Criteria: Ease of Implementation Vote Distribution # Ballot Items Avg Total STD Votes preferential parking/reduced rates for fuel efficient vehicles 5. Other Ballot Items with Comments 1. preferential parking/reduced rates for fuel efficient vehicles 1.1. Does not help the congestion problem, but does help air quality 1.2. good idea, but doesn't lower the number of cars on the road
161 1.3. Great idea, should not be ruled out because it doesn't directly reduce congestion. It reduces pollution, which is a major problematic component of congestion.
162
163 APPENDIX C OPEN HOUSE SIGN-IN SHEETS
164
165
166
167
168
169 APPENDIX D TRANSPORTATION IMPROVEMENT PROGRAM MAJOR AND MINOR PROJECT FUNDING APPLICATIONS
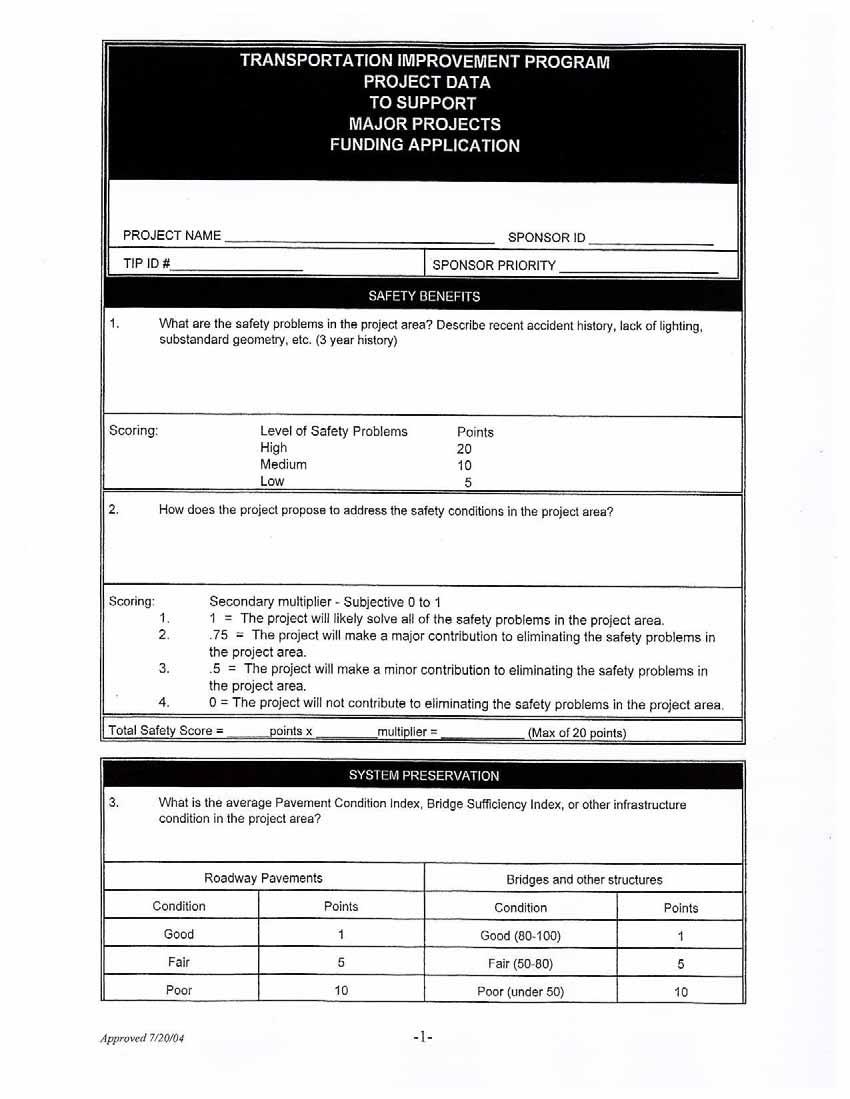
170
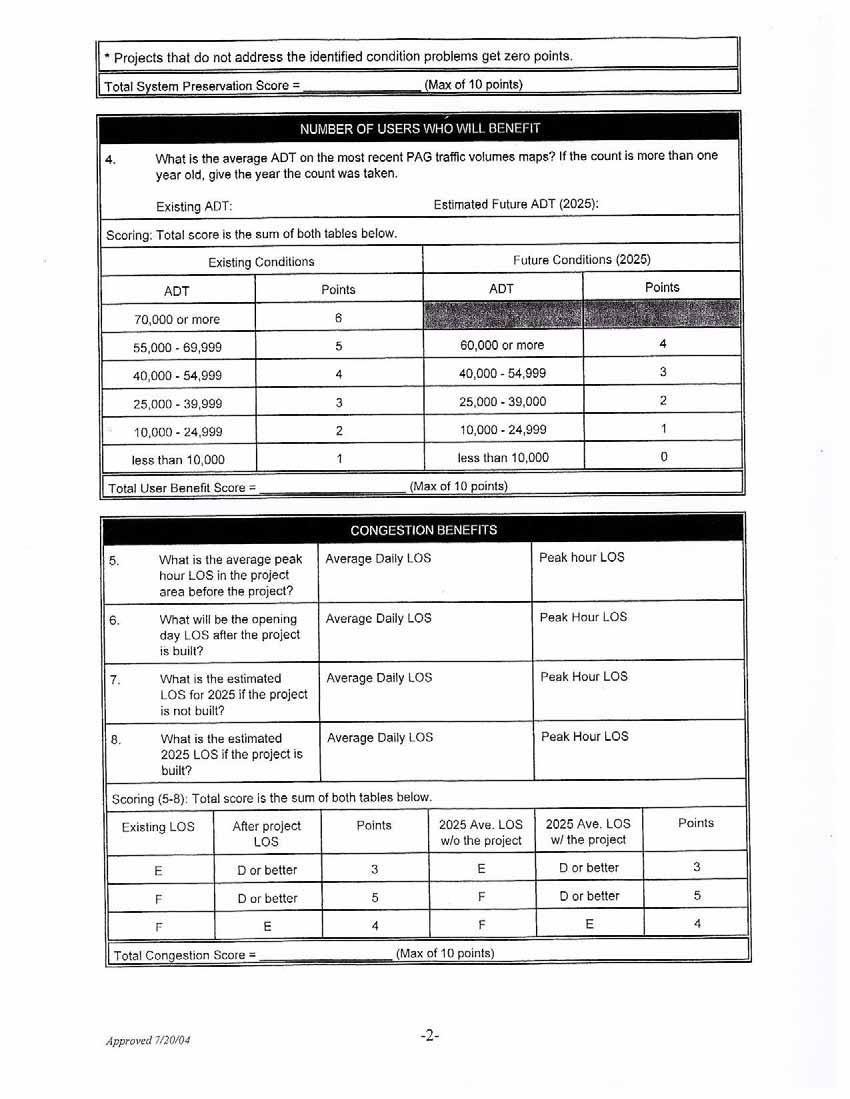
171
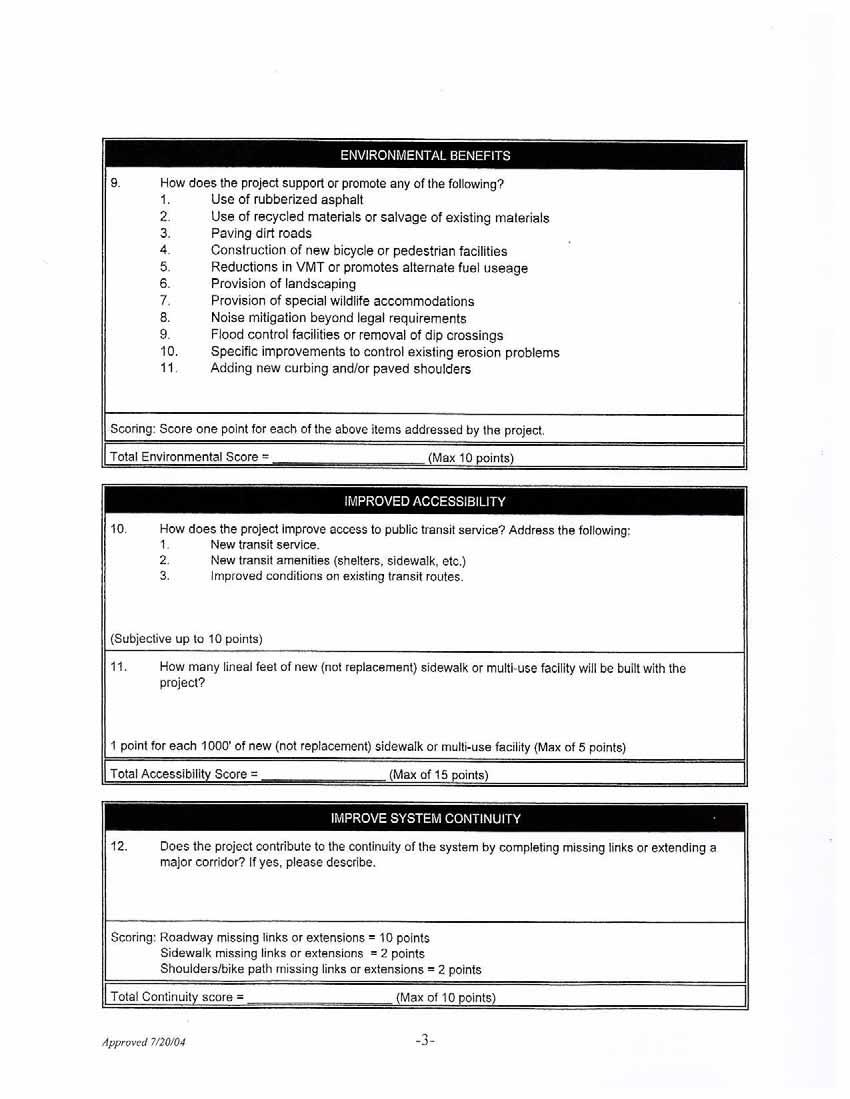
172
173
174
Solana Beach Comprehensive Active Transportation Strategy (CATS)
") Solana Beach Comprehensive Active Transportation Strategy (CATS) 3.0 Goals & Policies The Solana Beach CATS goals and objectives outlined below were largely drawn from the Solana Beach Circulation Element
Solana Beach Comprehensive Active Transportation Strategy (CATS) 3.0 Goals & Policies The Solana Beach CATS goals and objectives outlined below were largely drawn from the Solana Beach Circulation Element
CITY OF COCOA BEACH 2025 COMPREHENSIVE PLAN. Section VIII Mobility Element Goals, Objectives, and Policies
 CITY OF COCOA BEACH 2025 COMPREHENSIVE PLAN Section VIII Mobility Element Goals, Objectives, and Policies Adopted August 6, 2015 by Ordinance No. 1591 VIII MOBILITY ELEMENT Table of Contents Page Number
Employment 8,881 17,975 9,094. Households 18,990 31,936 12,946
 This section describes the future transportation environment of the UW Tacoma campus and surrounding area. A description of the future conditions on campus in terms of the street system, traffic and intersection
Roads and Vehicular Traffic Design Principles. Roads and Vehicular Traffic Recommendations
 CIRCULATION AND PARKING roads and vehicular traffic The Campus Master Plan updates the campus transportation network through a multi-modal approach that encourages walking and biking while improving vehicular
3.0 Future Conditions
 3.0 Future Conditions In order to be able to recommend appropriate improvements to the transportation system of the Town, it is important to first understand the nature and volume of traffic that is expected
June 3, Attention: David Hogan City of San Mateo 330 W. 2oth Avenue San Mateo, CA 94403
 June 3, 2015 Attention: David Hogan City of San Mateo 330 W. 2oth Avenue San Mateo, CA 94403 Regarding: PA # 15-030, Bridgepointe Shopping Center 2202 Bridgepointe Parkway, APN 035-466-10 Dear David: Enclosed
Purpose and Need. Chapter Introduction. 2.2 Project Purpose and Need Project Purpose Project Need
 Chapter 2 Purpose and Need 2.1 Introduction The El Camino Real Bus Rapid Transit (BRT) Project (Project) would make transit and other transportation improvements along a 17.6-mile segment of the El Camino
 MEMORANDUM - CITY OF PASADENA Department Of Transportation DATE: OCTOBER 21, 2008 TO: ENVIRONMENTAL ADVISORY COMMISSION FROM: ~ FRED C. DOCK, DIRECTOR OF TRANSPORTATION SUBJECT: UPDATE ON DEPT. OF TRANSPORTATION
APPENDIX 2 LAKESHORE ROAD TRANSPORTATION REVIEW STUDY EXECUTIVE SUMMARY
 APPENDIX 2 LAKESHORE ROAD TRANSPORTATION REVIEW STUDY EXECUTIVE SUMMARY Appendix 2 City of Mississauga Lakeshore Road FINAL REPORT Transportation Review Study December 2010 EXECUTIVE SUMMARY Study Purpose
San Jose Transportation Policy
 San Jose Transportation Policy Protected Intersections in LOS Policies to Support Smart Growth Presented by: Manuel Pineda City of San Jose Department of Transportation Bay Area Map San Francisco Oakland
Exhibit 1 PLANNING COMMISSION AGENDA ITEM
 Exhibit 1 PLANNING COMMISSION AGENDA ITEM Project Name: Grand Junction Circulation Plan Grand Junction Complete Streets Policy Applicant: City of Grand Junction Representative: David Thornton Address:
Corpus Christi Metropolitan Transportation Plan Fiscal Year Introduction:
 Introduction: The Safe, Accountable, Flexible, Efficient Transportation Equity Act: A Legacy for Users (SAFETEA-LU) has continued the efforts started through the Intermodal Surface Transportation Efficiency
Proposed. City of Grand Junction Complete Streets Policy. Exhibit 10
 Proposed City of Grand Junction Complete Streets Policy Exhibit 10 1 City of Grand Junction Complete Streets Policy Vision: The Complete Streets Vision is to develop a safe, efficient, and reliable travel
NM-POLICY 1: Improve service levels, participation, and options for non-motorized transportation modes throughout the County.
 Transportation PRINCE WILLIAM COUNTY 2008 COMPREHENSIVE PLAN NON-MOTORIZED PLAN CONTENTS Goals, Policies, and Action Strategies Table 4 (Bike Facility Classifications and Descriptions) Table 5 (Bike Facility
Chapter 7. Transportation. Transportation Road Network Plan Transit Cyclists Pedestrians Multi-Use and Equestrian Trails
 Chapter 7 Transportation Transportation Road Network Plan Transit Cyclists Pedestrians Multi-Use and Equestrian Trails 7.1 TRANSPORTATION BACKGROUND The District of Maple Ridge faces a number of unique
MCTC 2018 RTP SCS and Madera County RIFP Multi-Modal Project Eval Criteria GV13.xlsx
 MCTC 8 RTP SCS and Madera County RIFP Multi-Modal Project Eval Criteria GV.xlsx Madera County Transportation Commission Regional Transportation Plan / Sustainable Communities Strategy Multi-Modal Project
TRAFFIC IMPACT STUDY CRITERIA
 Chapter 6 - TRAFFIC IMPACT STUDY CRITERIA 6.1 GENERAL PROVISIONS 6.1.1. Purpose: The purpose of this document is to outline a standard format for preparing a traffic impact study in the City of Steamboat
Transportation Assessment
 Transportation Assessment Midtown Open House February 10, 2018 Overview Midtown in Focus Overview & Purpose of Today Transportation Assessment overview Summary of Transportation work to date Review & Analysis
Sixth Line Development - Transit Facilities Plan
 Memorandum Date: November 13, 2012 To: From: c.c. Subject: Rob Freeman (Freeman Planning) Kevin Phillips Sixth Line Development - Transit Facilities Plan 33016631 This memo was prepared to review the transit
Bicycle Master Plan Goals, Strategies, and Policies
 Bicycle Master Plan Goals, Strategies, and Policies Mobilizing 5 This chapter outlines the overarching goals, action statements, and action items Long Beach will take in order to achieve its vision of
Traffic Impact Memorandum. May 22, 2018
 BISHOP PROFESSIONAL DEVELOPMENT BUILDING Proposed Land-use Change & Parking Modification 3601 SW 31st Street Topeka, Kansas 66614 CFS Project No. 185077 Traffic Impact Memorandum May 22, 2018 Prepared
CITY OF BLOOMINGTON COMPLETE STREETS POLICY
 CITY OF BLOOMINGTON COMPLETE STREETS POLICY POLICY OBJECTIVE: The City of Bloomington will enhance safety, mobility, accessibility and convenience for transportation network users of all ages and abilities,
122 Avenue: 107 Street to Fort Road
 : 107 Street to Fort Road November 24, 2015 4:30 8:00 p.m. Meeting Purpose Summarize project work completed to date Share results of public input from Phase 1 Share the draft concept plan and proposed
Chapter 6 Transportation Plan
 Chapter 6 Transportation Plan Transportation Plan Introduction Chapter 6 Transportation Plan Transportation Plan Introduction This chapter describes the components of Arvada s transportation system, comprised
FROM: CITY MANAGER DEPARTMENT: PLANNING AND COMMUNITY ENVIRONMENT DATE: OCTOBER 4, 2004 CMR:432:04
 TO: HONORABLE CITY COUNCIL FROM: CITY MANAGER DEPARTMENT: PLANNING AND COMMUNITY ENVIRONMENT DATE: OCTOBER 4, 2004 CMR:432:04 SUBJECT: FINANCE COMMITTEE RECOMMENDATION TO ADOPT TRANSPORTATION STRATEGIC
University of Victoria Campus Cycling Plan Terms of Reference. 1.0 Project Description
 University of Victoria Campus Cycling Plan Terms of Reference 1.0 Project Description The Campus Cycling Plan, a first for the University, will provide a comprehensive and coordinated approach to support
West Village Mobility & Integration
 West Village Mobility & Integration PRESENTED TO TOPCA Town Hall November 9, 2017 [7189-21] Port Credit 2 West Village + Mobility AWalkable Community A CompleteCommunity A SustainableCommunity 3 Mobility
CONNECTING PEOPLE TO PLACES
 CONNECTING PEOPLE TO PLACES 82 EAST BENCH MASTER PLAN 07 Introduction The East Bench transportation system is a collection of slow moving, treelined residential streets and major arteries that are the
MOUNTAIN HOUSE SPECIFIC PLAN I 9.1 INTRODUCTION ASSUMPTIONS TRANSPORTATION FACILITIES TRANSPORTATION IMPROVEMENTS PHASING 9.
 CHAPTER NINE: TRANSPORTATION AND CIRCULATION 9.1 INTRODUCTION 9.1 9.2 ASSUMPTIONS 9.1 9.3 TRANSPORTATION FACILITIES 9.1 9.4 TRANSPORTATION IMPROVEMENTS PHASING 9.3 LIST OF FIGURES LIST OF TABLES Figure
APPENDIX A: Complete Streets Checklist DRAFT NOVEMBER 2016
 APPENDIX A: Complete Streets Checklist DRAFT NOVEMBER 2016 Complete Streets Checklist MetroPlan Orlando s Complete Streets Checklist is an internal planning tool for staff to further implementation of
University of Arizona Area Bicycle and Pedestrian Study
 University of Arizona Area Bicycle and Pedestrian Study Draft Study May 2012 PREPARED BY: Alta Planning + Design Kimley-Horn and Associates, Inc. PREPARED FOR: Pima Association of Governments The University
Basalt Creek Transportation Refinement Plan Recommendations
 Basalt Creek Transportation Refinement Plan Recommendations Introduction The Basalt Creek transportation planning effort analyzed future transportation conditions and evaluated alternative strategies for
Moving Cambridge. City of Cambridge Transportation Master Plan Public Consultation Centre. March 7, :00 8:00 PM.
 City of Cambridge Transportation Master Plan Public Consultation Centre March 7, 2018 5:00 8:00 PM Region of Waterloo City of Cambridge Transportation Master Plan Public Consultation Centre March 7, 2018
EXECUTIVE SUMMARY. Vision
 Vision Walking and bicycling in Salt Lake City will be safe, convenient, comfortable, and viable transportation options that connect people to places, foster recreational and economic development opportunities,
TRANSPORTATION & MOBILITY
 TRANSPORTATION & MOBILITY ROADWAY SYSTEM There are approximately 40 miles of roadways in Manitou Springs. For planning purposes, roadways are typically assigned a functional classification which defines
4. ENVIRONMENTAL IMPACT ANALYSIS 9. TRANSPORTATION AND TRAFFIC
 4. ENVIRONMENTAL IMPACT ANALYSIS 9. TRANSPORTATION AND TRAFFIC 4.9.1 INTRODUCTION The following section addresses the Proposed Project s impact on transportation and traffic based on the Traffic Study
EXECUTIVE SUMMARY OF CALEDON TRANSPORTATION NEEDS STUDY
 EXECUTIVE SUMMARY OF CALEDON TRANSPORTATION NEEDS STUDY The Caledon Transportation Needs Study has been undertaken as a joint project by the Town of Caledon and the Region of Peel to determine the existing
Hennepin County Pedestrian Plan Public Comment Report
 Hennepin County Pedestrian Plan Public Comment Report On May 31, 2013, the draft Hennepin County Pedestrian Plan was released for a 45-day public comment period ending July 15, 2013. The county received
SECTION 1 - TRAFFIC PLANNING
 SECTION 1 - TRAFFIC PLANNING 1.1 TRAFFIC OPERATIONS 1.1.1 Roadway Functional Classification The Multnomah County Comprehensive Framework Plan s Policy 34: Trafficways and the Functional Classification
Arlington Public Schools Thomas Jefferson Site Evaluation Transportation Networks. Thomas Jefferson Working Group Meeting #6 November 10, 2014
 Arlington Public Schools Thomas Jefferson Site Evaluation Transportation Networks Thomas Jefferson Working Group Meeting #6 November 10, 2014 2 3 INTRODUCTION 4 Goal of our work: Identify and assess multi-modal
Appendix C. NORTH METRO STATION AREA TRAFFIC IMPACT STATEMENT 88th Avenue Station
 Appendix C NORTH METRO STATION AREA TRAFFIC IMPACT STATEMENT 88th Avenue Station Prepared for: Regional Transportation Department and URS Corporation as part of the North Metro EIS David Evans and Associates,
Develop a Multi-Modal Transportation Strategy (Theme 6)
") DEVELOP A MULTI-MODAL TRANSPORTATION STRATEGY (THEME 6) WHY IS THIS THEME ADDRESSED? Develop a Multi-Modal Transportation Strategy (Theme 6) Statement of Ideal Reduce resident and visitor reliance on single
DEVELOP A MULTI-MODAL TRANSPORTATION STRATEGY (THEME 6) WHY IS THIS THEME ADDRESSED? Develop a Multi-Modal Transportation Strategy (Theme 6) Statement of Ideal Reduce resident and visitor reliance on single
Welcome! Public Open House on UBC s Transportation Plan
 1 Welcome! Public Open House on UBC s Transportation Plan Public open house hours: to When it comes to on-campus transportation, what do you think is working well and what are some opportunities for improvement?
2.0 Existing Conditions
 20 2.0 Existing Conditions 2.1 Land Use, Future Growth Patterns, Physical Barriers Geographic Overview Sutter County s land use pattern is characterized by extensive agricultural areas, significant natural
North Coast Corridor:
 North Coast Corridor: Connecting People, Transportation & Environment Legislative Hearing: 11.8.10 1 North Coast Corridor Region s Lifeline A Regional Strategy Mobility, Economy & Environment North Coast
ATTACHMENT 4 - TDM Checklist. TDM Checklist Overview
 ATTACHMENT 4 - TDM Checklist TDM Checklist Overview The proposed checklist rates developments on the degree to which they are TDM and transit supportive. Points are assigned based on the level of transit
ELEMENT 11 TRANSPORTATION ELEMENT
 ELEMENT 11 TRANSPORTATION ELEMENT TRANSIT, CIRCULATION, PARKING, PEDESTRIAN, & NON-VEHICULAR CIRCULATION Introduction The following narrative describes the concepts on which the transportation plan is
PRINCE GEORGE S PLAZA METRO AREA PEDESTRIAN PLAN
 PRINCE GEORGE S PLAZA METRO AREA PEDESTRIAN PLAN May 28, 2008 Agenda Welcome and introductions Project overview and issue identification Planning context and strengths Design challenges and initial recommendations
Tulsa Metropolitan Area LONG RANGE TRANSPORTATION PLAN
 Tulsa Metropolitan Area LONG RANGE TRANSPORTATION PLAN Indian Nations Council of Governments August 2005 CONTACTING INCOG In developing the Destination 2030 Long Range Transportation Plan, INCOG s Transportation
ADOT Statewide Bicycle and Pedestrian Program Summary of Phase IV Activities APPENDIX B PEDESTRIAN DEMAND INDEX
 ADOT Statewide Bicycle and Pedestrian Program Summary of Activities APPENDIX B PEDESTRIAN DEMAND INDEX May 24, 2009 Pedestrian Demand Index for State Highway Facilities Revised: May 29, 2007 Introduction
Regional Transportation Needs Within Southeastern Wisconsin
 Regional Transportation Needs Within Southeastern Wisconsin #118274 May 24, 2006 1 Introduction The Southeastern Wisconsin Regional Planning Commission (SEWRPC) is the official areawide planning agency
U NIVERSITY OF B RITISH C OLUMBIA. Fall 2010 Transportation Status Report
 U NIVERSITY OF B RITISH C OLUMBIA Fall 2010 Transportation Status Report 1 April 2011 U NIVERSITY OF B RITISH C OLUMBIA Fall 2010 Transportation Status Report Contents 1. INTRODUCTION... 1 1.1. Context...
Scottsdale Road/Rural Road Alternatives Analysis (AA) Study. Arizona ITE/IMSA Spring Conference March 7, 2012
 Study. Arizona ITE/IMSA Spring Conference March 7, 2012") Scottsdale Road/Rural Road Alternatives Analysis (AA) Study Arizona ITE/IMSA Spring Conference March 7, 2012 Study Location and Duration Primary Study Corridor (major focus of effort) Rural Road and Scottsdale
Scottsdale Road/Rural Road Alternatives Analysis (AA) Study Arizona ITE/IMSA Spring Conference March 7, 2012 Study Location and Duration Primary Study Corridor (major focus of effort) Rural Road and Scottsdale
WELCOME TO OPEN HOUSE # 1 June 14, 2017
 Langstaff Road Weston Road to Highway 7 Class Environmental Assessment Study WELCOME TO OPEN HOUSE # 1 June 14, 2017 Please sign in and join our mailing list Purpose of Open House #1 & Study Area York
January Project No
 January 13 2015 Project No. 5070.05 Neil Connelly, Director University of Victoria, Campus Planning and Sustainability PO Box 1700 STN CSC Victoria, BC V8P 5C2 Dear Neil: Re: UVic 2014 Traffic Final Report
Agenda. Overview PRINCE GEORGE S PLAZA METRO AREA PEDESTRIAN PLAN
 PRINCE GEORGE S PLAZA METRO AREA PEDESTRIAN PLAN May 28, 2008 Agenda Welcome and introductions Project overview and issue identification Planning context and strengths Design challenges and initial recommendations
Magnolia Place. Traffic Impact Analysis. Prepared for: City of San Mateo. Prepared by: Hexagon Transportation Consultants, Inc.
 Magnolia Place Traffic Impact Analysis Prepared for: City of San Mateo Prepared by: Hexagon Transportation Consultants, Inc. Updated January 4, 2010 Table of Contents 1. Introduction...1 2. Existing Conditions...6
In station areas, new pedestrian links can increase network connectivity and provide direct access to stations.
 The Last Mile Planning for Pedestrians Planning around stations will put pedestrians first. Making walking to stations safe and easy is important; walking will be a part of every rapid transit Accessible
TRANSPORTATION TRAINING TOPICS. April 6, 2010
 TRANSPORTATION TRAINING TOPICS April 6, 2010 Roles of Transportation Providers Context and Policy Makers Division of Transportation and Traffic Other City Operations Other Transportation Operators CMA
Transportation Corridor Studies: Summary of Recommendations
 Transportation Corridor Studies: Summary of Recommendations Route 4 Corridor Study: Route 10 Corridor Study: Route 44 Corridor Study: Route 175 Corridor Study: Route 5/15 Corridor Study: Rentschler Field
CPC Parking Lot Riverside Drive. Transportation Rationale
 CPC Parking Lot Transportation Rationale Prepared By: NOVATECH Suite 200, 240 Michael Cowpland Drive Ottawa, Ontario K2M 1P6 September 2015 Novatech File: 114093 Ref: R-2015-153 Table of Contents 1.0 INTRODUCTION...
INTERMODAL TRANSPORTATION PLAN
 INTRODUCTION INTERMODAL TRANSPORTATION PLAN Effective intermodal transportation implies a public policy for actively decreasing the demand for automobile trips and consequently reducing automobile related
6.0 PEDESTRIAN AND BICYCLE FACILITIES 6.1 INTRODUCTION 6.2 BICYCLE DEMAND AND SUITABILITY Bicycle Demand
 6.0 PEDESTRIAN AND BICYCLE FACILITIES 6.1 INTRODUCTION Bicycle and pedestrian travel along and in the vicinity of the corridor is part of the vision of Somerset and Hunterdon counties and the integrated
Transportation, Parking & Roads
 Transportation, Parking & Roads Design Carolina North as a walkable community Design the transportation system and development patterns (i.e., urban design elements such as density, building design, mix
4 MOBILITY PLAN. Mobility Plan Objectives. Mobility Context. 1. Integrate with Local and Regional Transit Improvements
 Harbor Mixed Use CHAPTER Transit Corridor 4: Mobility Plan 4 MOBILITY PLAN Mobility Plan Objectives The Harbor Corridor Plan seeks to expand and improve the ways that people move along and through the
Chapter 5 Future Transportation
 Chapter 5 Future Transportation The Future Land Use Plan identifies the desired land use designations. The land uses desired for Crozet depend, in large part, on the success of the transportation system,
ROADSOADS CONGESTION HAMPTON SYSTEMYSTEM MANAGEMENT. Part II Roadway Congestion Analysis Mitigation Strategies and Evaluation
 HAMPTON ROADSOADS CONGESTION MANAGEMENT SYSTEMYSTEM Part II Roadway Congestion Analysis Mitigation Strategies and Evaluation Presented by: Dwight Farmer, PE Deputy Executive Director, Transportation April
Transportation Master Plan Advisory Task Force
 Transportation Master Plan Advisory Task Force Network Alternatives & Phasing Strategy February 2016 BACKGROUND Table of Contents BACKGROUND Purpose & Introduction 2 Linking the TMP to Key Council Approved
See Figure 38, Existing Nonmotorized Connections.
 Nonmotorized Connections Existing Nonmotorized Connections Pedestrian, vehicle and bike traffic access and movements are confined primarily to Penny Drive on campus. Due to the steep slope along the length
ADA Transition Plan. City of Gainesville FY19-FY28. Date: November 5, Prepared by: City Of Gainesville Department of Mobility
 ADA Transition Plan FY19-FY28 Date: November 5, 2018 Prepared by: City Of Gainesville Department of Mobility 1.0 INTRODUCTION 1.1 BACKGROUND The federal statute known as the Americans with Disabilities
Appendix A-K Public Information Centre 2 Materials
 Appendix A-K Public Information Centre 2 Materials Our Rapid Transit Initiative Make an impact on the future of transit Join the discussion on Rapid Transit in London You re invited to a Public Information
EUCLID AVENUE PARKING STUDY CITY OF SYRACUSE, ONONDAGA COUNTY, NEW YORK
 EUCLID AVENUE PARKING STUDY CITY OF SYRACUSE, ONONDAGA COUNTY, NEW YORK CITY OF SYRACUSE DEPARTMENT OF PUBLIC WORKS 1200 CANAL STREET EXTENSION SYRACUSE, NEW YORK 13210 DRAFT REPORT DATE: November 13,
APPENDIX B. TDM Existing Conditions
 APPENDIX B TDM Existing Conditions SCARBOROUGH CENTRE TMP TRANSPORTATION DEMAND MANAGEMENT INTRODUCTION Scarborough Centre has grown into a mixed-use hub for population, transportation, and employment
Non-Motorized Transportation 7-1
 Non-Motorized Transportation 7-1 Transportation facilities no longer mean just accommodating a vehicle powered by a combustion engine. Pedestrian and non-motorized facilities are important modes of travel
A Selection Approach for BRT Parking Lots Nicolls Road Corridor Parking Study
 A Selection Approach for BRT Parking Lots Nicolls Road Corridor Parking Study Chirantan Kansara, P.E. Engineering Construction Design Planning 2018 ITE Northeastern District Annual Meeting Lake George,
CITY OF ALPHARETTA DOWNTOWN MASTER PLAN TRAFFIC EVALUATION
 CITY OF ALPHARETTA DOWNTOWN MASTER PLAN TRAFFIC EVALUATION June 2015 CITY OF ALPHARETTA DOWNTOWN MASTER PLAN TRAFFIC EVALUATION Introduction The Alpharetta Downtown Master Plan was developed in the fall
Clackamas County Comprehensive Plan
 ROADWAYS The County s road system permits the movement of goods and people between communities and regions, using any of a variety of modes of travel. Roads provide access to virtually all property. They
WALKNBIKE DRAFT PLAN NASHVILLE, TENNESSEE EXECUTIVE SUMMARY NASHVILLE, TENNESSEE
 NASHVILLE, TENNESSEE EXECUTIVE SUMMARY Executive Summary A world-class multi-modal transportation system is essential to a vibrant city and better quality of life. -Mayor Barry The WalknBike plan aims
TRAFFIC ACTION PLAN. North Central Neighborhood CITY OF SAN MATEO
 TRAFFIC ACTION PLAN North Central Neighborhood CITY OF SAN MATEO Draft February 2017 Table of Contents Introduction... 1 The Traffic Forum Process... 4 Neighborhood Traffic Issues... 6 Neighborhood Recommendations
RZC Appendix 8A Marymoor Subarea Street Requirements
 RZC Appendix 8A Marymoor Subarea Street Requirements For additional design details for Marymoor Subarea infrastructure, refer to the 2017 Marymoor Subarea Infrastructure Planning Report. STREET REQUIREMENTS
City of Gainesville Transportation/Roadway Needs PROJECT SUMMARY
 A1 Roadway Resurfacing $23,846,000 TYPE: Preservation of existing system Roadway resurfacing A2 Signal Replacement $6,000,000 TYPE: Preservation of existing system Replace traffic signals. B1 W 6th St
Chapter 14 PARLIER RELATIONSHIP TO CITY PLANS AND POLICIES. Recommendations to Improve Pedestrian Safety in the City of Parlier (2014)
") Chapter 14 PARLIER This chapter describes the current status and future plans for biking and walking in the City of Parlier. RELATIONSHIP TO CITY PLANS AND POLICIES The Parlier General Plan is the primary
Chapter 14 PARLIER This chapter describes the current status and future plans for biking and walking in the City of Parlier. RELATIONSHIP TO CITY PLANS AND POLICIES The Parlier General Plan is the primary
Bus Rapid Transit Plans
 Twin Cities Region Bus Rapid Transit Plans ULI Minnesota Workshop Connecting Bus Rapid Transit to the Community December 15, 2009 John Levin Director of Service Development Metro Transit Metropolitan Area
Preliminary Transportation Analysis
 Preliminary Transportation Analysis Goals of a Robust, Multimodal Transportation Network Safe Accessible/Connected Efficient Comfortable Context-Sensitive Motor Vehicle: Continue to analyze the data to
C C C
 C-012-001 Thank you for your support for the creation of new public space and nonmotorized access between downtown and the waterfront through the Overlook Walk, the East-West Connections, and the Promenade.
City of Wayzata Comprehensive Plan 2030 Transportation Chapter: Appendix A
 A1. Functional Classification Table A-1 illustrates the Metropolitan Council s detailed criteria established for the functional classification of roadways within the Twin Cities Metropolitan Area. Table
Prepared For: Shieldbay Developments Inc. c/o Matson, McConnell Ltd. 2430A Bloor Street West Toronto, Ontario M6S 1P9.
 Prepared For: Shieldbay Developments Inc. c/o Matson, McConnell Ltd. 2430A Bloor Street West Toronto, Ontario M6S 1P9 Prepared By: URS Canada Inc. 4 th Floor, 30 Leek Crescent Richmond Hill, Ontario L4B
EXECUTIVE SUMMARY... vii 1 STUDY OVERVIEW Study Scope Study Area Study Objectives
 Contents EXECUTIVE SUMMARY... vii 1 STUDY OVERVIEW... 1-1 1.1 Study Scope... 1-1 1.2 Study Area... 1-1 1.3 Study Objectives... 1-3 2 EXISTING CONDITIONS... 2-1 2.1 Existing Freeway Conditions... 2-4 2.1.1
Metropolitan Council Transportation Committee
 Nicollet-Central Transit Alternatives Metropolitan Council Transportation Committee August 2013 Project Purpose (approved by Policy Advisory Committee 10/25/2012) The purpose is to improve transit connectivity,
How To Encourage More Efficient Transportation in Brazilian Cities
 How To Encourage More Efficient Transportation in Brazilian Cities Todd Litman Victoria Transport Policy Institute Presented Seminar on Discouraging The Use Of Cars São Paulo, Brazil 3 September 2013 Creating
Highway 217 Corridor Study. Phase I Overview Report
 Highway 217 Corridor Study Phase I Overview Report November 3, 24 BACKGROUND AND OVERVIEW Study purpose The Highway 217 Corridor Study is developing multi-modal transportation solutions for traffic problems
Community Task Force July 25, 2017
 Community Task Force July 25, 2017 Welcome and Introductions Project Partners Regional Transportation District (RTD) Colorado Department of Transportation (CDOT) Denver Regional Council of Governments
5. RUNNINGWAY GUIDELINES
 5. RUNNINGWAY GUIDELINES These guidelines should be considered collectively when making runningway decisions. A runningway is the linear component of the transit system that forms the right-of-way reserved
North Shore Transportation Improvement Strategy
 North Shore Transportation Improvement Strategy Preliminary, Near-term Recommendation 2016 April Transportation Improvement Strategy (TIS) Comprehensive and Analytical A multi-modal transportation strategy
UBC Vancouver Transportation Status Report Fall 2014
 UBC Vancouver Transportation Status Report Fall 2014 July 2015 1. Introduction... 1 1.1. Context... 1 1.2. Transportation Monitoring Program... 2 1.3. Changes at UBC Affecting Travel Patterns... 4 1.4.
2025 Comprehensive Plan for the City of Temple Terrace Florida. Mobility Element. Adopted by City Council June 30, 2009
 2025 Comprehensive Plan for the City of Temple Terrace Florida Mobility Element Adopted by City Council June 30, 2009 Effective Date September 22, 2009 GOAL 2: To protect and promote the quality of life
GIS Based Non-Motorized Transportation Planning APA Ohio Statewide Planning Conference. GIS Assisted Non-Motorized Transportation Planning
 The Purpose of GIS Assisted Network GIS Assisted Non-Motorized Transportation 2011 APA Ohio Statewide Conference Friday, 10:45 AM to Noon Focus on near-term projects wwwgreenwaycollabcom The purpose of
City of Novi Non-Motorized Master Plan 2011 Executive Summary
 City of Novi Non-Motorized Master Plan 2011 Executive Summary Prepared by: February 28, 2011 Why Plan? Encouraging healthy, active lifestyles through pathway and sidewalk connectivity has been a focus
I-105 Corridor Sustainability Study (CSS)
") I-105 Corridor Sustainability Study (CSS) Metro Streets and Freeways Subcommittee March 21, 2019 Gary Hamrick Cambridge Systematics, Inc. I-105 CSS Project History & Background Funded by Caltrans Sustainable
I-105 Corridor Sustainability Study (CSS) Metro Streets and Freeways Subcommittee March 21, 2019 Gary Hamrick Cambridge Systematics, Inc. I-105 CSS Project History & Background Funded by Caltrans Sustainable
ACTIVE TRANSPORTATION
 ACTIVE TRANSPORTATION Mobility 2040 Supported Goals Improve the availability of transportation options for people and goods. Support travel efficiency measures and system enhancements targeted at congestion