MULTIMODAL LEVEL OF SERVICE REPORT
|
|
|
- Colleen Warner
- 6 years ago
- Views:
Transcription
1 METROPOLITAN TRANSPORTATION PLANNING ORGANIZATION (MTPO) FOR THE GAINESVILLE URBANIZED AREA YEAR 2010 ANNUAL AVERAGE DAILY TRAFFIC (AADT) MULTIMODAL LEVEL OF SERVICE REPORT GAINESVILLE METROPOLITAN AREA CONGESTION MANAGEMENT PROCESS Prepared by: North Central Florida Regional Planning Council 2009 NW 67 Place Gainesville, Florida The preparation of this report has been financed in part through grants from the Federal Highway Administration and Federal Transit Administration, U.S. Department of Transportation, under the State Planning and Research Program, Section 505 [or Metropolitan Planning Program, Section 104(f)] of Title 23, U.S. Code. The contents of this report do not necessarily reflect the official views or policy of the U.S. Department of Transportation. January 12, 2012
2
3 TABLE OF CONTENTS APPENDIX PAGE EXECUTIVE SUMMARY... ix INTRODUCTION... 1 Purpose... 1 Scope of Study... 3 A AUTOMOTIVE/HIGHWAY LEVEL OF SERVICE ANALYSES... A-1 Definitions... A-3 Data Collection Requirements... A-5 Data Analysis Requirements... A-5 Highway Level of Service Standards... A-6 State of Florida... A-6 Metropolitan Transportation Planning Organization... A-7 Alachua County and the City of Gainesville... A-7 Traffic Study Procedures... A-7 LOS Report Tier One Analyzed Roadway Facilities... A-7 LOS Report Tier Two Analyzed Roadway Facilities... A-8 Methodology... A-8 Determining Roadway Level of Service... A-8 Determining Roadway Maximum Service Volumes... A-10 Level of Service Analysis Techniques... A-11 Tier One Level of Service Analysis... A-11 Tier Two Level of Service Analysis... A-11 Maximum Service Volume Analysis Techniques... A-11 Tier One Maximum Service Volume Analysis... A-11 Tier Two Maximum Service Volume Analysis... A-11 iii
4 TABLE OF CONTENTS (Continued) APPENDIX PAGE A Variables Used to Perform LOS/MSV Analyses... A-12 Tier One LOS/MSV Analysis... A-12 Tier Two LOS/MSV Analysis... A-13 Results... A-17 B MINIMUM ACCEPTABLE HIGHWAY LEVEL OF SERVICE STANDARDS WITHIN THE GAINESVILLE METROPOLITAN AREA BOUNDARY... B-1 Florida State Highway System... B-3 Metropolitan Planning Organization... B-3 Alachua County... B-3 City of Gainesville... B-3 Florida State Highway System... BS-1 Metropolitan Planning Organization... BM-1 C BICYCLE, PEDESTRIAN AND TRANSIT LEVEL OF SERVICE ANALYSES... C-1 Definitions... C-3 Data Collection and Analysis Requirements... C-5 Bicycle Level of Service Analyses... C-5 Pedestrian Level of Service Analyses... C-5 Transit Level of Service Analyses... C-5 Traffic Study Procedures... C-5 LOS Report Tier One Analyzed Bicycle, Pedestrian and Transit Facilities... C-5 LOS Report Tier Two Analyzed Bicycle, Pedestrian and Transit Facilities... C-6 iv
5 TABLE OF CONTENTS (Continued) APPENDIX PAGE C Methodology... C-6 Determining Facility Level of Service... C-6 Level of Service Analysis Techniques... C-6 Tier One Level of Service Analysis... C-6 Bicycle Level of Service Analyses... C-6 Pedestrian Level of Service Analyses... C-6 Transit Level of Service Analyses... C-6 Tier Two Level of Service Analysis... C-6 Bicycle Level of Service Analyses... C-7 Pedestrian Level of Service Analyses... C-7 Transit Level of Service Analyses... C-7 Variables Used to Perform Bicycle, Pedestrian and Transit Level of Service Analyses... C-7 Tier One Level of Service Analyses... C-7 Bicycle Level of Service Analyses... C-7 Pedestrian Level of Service Analyses... C-7 Transit Level of Service Analyses... C-7 Tier Two Level of Service Analyses... C-7 ARTPLAN- Multimodal Facility Data (Screen One) Characteristics... C-7 Bicycle Level of Service Analyses... C-7 Pedestrian Level of Service Analyses... C-8 Transit Level of Service Analyses... C-8 ARTPLAN- Multimodal Segment Data (Screen Two) Characteristics... C-8 Bicycle Level of Service Analyses... C-8 Pedestrian Level of Service Analyses... C-8 Transit Level of Service Analyses... C-8 ARTPLAN- Pedestrian Subsegment Data (Screen Three) Characteristics... C-8 Results... C-9 v
6 TABLE OF CONTENTS (Continued) APPENDIX PAGE D GENERALIZED ANNUAL AVERAGE DAILY VOLUMES... D-1 Urbanized Areas... D-3 Areas Transitioning Into Urbanized Areas Or Areas Over 5,000 Not In Urbanized Areas... D-7 E ARTPLAN ANALYSES FOR DISTRESSED ARTERIALS... E-1 State Maintained Arterials... ES-1 Alachua County Arterials...EA-1 City of Gainesville Arterials...EG-1 F HIGHWAY CAPACITY MANUAL SOFTWARE ANALYSES FOR DISTRESSED ARTERIALS... F-1 State Maintained Arterials... FS-1 Alachua County Arterials... FA-1 City of Gainesville Arterials... FG-1 G ANNUAL AVERAGE DAILY TRAFFIC (AADT) COUNTS... G-1 State Maintained Arterials... GS-1 Alachua County Arterials... GA-1 City of Gainesville / University of Florida Arterials... GG-1 H SPECIAL CIRCUMSTANCE STUDY RESULTS... H-1 State Maintained Arterials... HS-1 Alachua County Arterials... HA-1 City of Gainesville Arterials... FG-1 vi
7 TABLE OF CONTENTS (Continued) LIST OF EXHIBITS EXHIBIT PAGE 1 Roadway Facilities Operating at an Unacceptable Highway Level of Service... x 2 Sensitive Intersection for ARTPLAN-analyzed Facilities... A-18 3 District 2 SIS and Emerging SIS Hubs, Corridors and Connectors... BS-11 LIST OF ILLUSTRATIONS ILLUSTRATION PAGE I Gainesville Metropolitan Area... 2 II FDOT District II Dense Urban Land Areas... B-4 III Alachua County Transportation Concurrency Exception Area... B-5 IV City of Gainesville Transportation Concurrency Exception Area... B-6 vii
8 [PAGE LEFT BLANK INTENTIONALLY] viii
9 EXECUTIVE SUMMARY The Multimodal Level of Service (LOS) Report, provides multimodal LOS. Automotive/highway (hereinafter highway), bicycle, pedestrian and transit modes of travel are analyzed for level of service. The latest available highway LOS estimate of all functionally classified collector and arterial roadways within the Gainesville Metropolitan Area (GMA) Boundary is provided in this report. In addition, bicycle, pedestrian and transit LOS estimates of all functionally classified collector and arterial roadways within the Gainesville Metropolitan Area (GMA) Boundary are provided in this report. Hereinafter, all references to highway LOS address LOS as described in the 2010 Highway Capacity Manual (HCM 2010). The LOS Report entails three components: roadway service volume tables; an LOS map atlas and a technical appendices document. The LOS Report employs a two-tiered LOS roadway facility analysis. Tier One analysis utilizes Florida Department of Transportation's (FDOT) Generalized Tables. FDOT Generalized Tables are contained in an FDOT document entitled 2009 Quality/Level of Service Handbook, including appended issue papers. Tier Two analysis is required for all "distressed" arterials. A "distressed" arterial is one where current highway traffic uses 65 percent or more of the maximum service volume (MSV) for the adopted LOS for that roadway in FDOT's Generalized Tables. Tier Two analysis, which utilizes FDOT s LOSPLAN software, is performed for all "distressed" arterials. Detailed analysis using FDOT FREEPLAN software is performed for all "distressed" limited-access arterials. These analyses are done to develop a more accurate LOS estimate than can be obtained using FDOT Generalized Tables. In 2008, the Technical Advisory Committee Level of Service Subcommittee suspended MTPO Staff-updated Tier Two analyses due to concerns that data used are outdated while the Traffic Management System is installed. Field studies are still reviewed by the LOS Subcommittee for inclusion in the LOS Report. ARTPLAN, HIGHPLAN or FREEPLAN, as appropriate, are also used to estimate the amount of service volume that the road actually has at a given LOS. ARTPLAN provides a more accurate estimate of an arterial's service volume than can be obtained using the FDOT Generalized Tables. Roadway facilities that are operating at an unacceptable LOS are identified in Exhibit 1. Note that the LOS analysis is for operational performance based on the HCM 2010 s LOS criteria. Although roadway facilities may be functioning at LOS F, development is permissible within Transportation Concurrency Exception Areas. Bicycle, pedestrian and transit LOS analyses also employ a two-tiered approach. Those facilities for which the highway LOS is analyzed using the FDOT Generalized Tables, are also analyzed for bicycle, pedestrian and transit LOS using the FDOT Generalized Tables. Those facilities for which the highway LOS is analyzed using FDOT LOSPLAN software, are also analyzed for bicycle, pedestrian and transit LOS using FDOT LOSPLAN software. Congestion Management Process (CMP) The LOS Report is updated at least annually. This monitoring system is a key component for prioritizing bicycle facility, pedestrian facility, roadway facility and transit projects,that address congestion management, in the Long Range Transportation Plan and Transportation Improvement Program. This report is intended to address the Safe, Accountable, Feasible, Efficient Transportation Equity Act- A Legacy for Users (SAFETEA-LU) congestion management process requirement. ix
10 EXHIBIT 1 ROADWAY FACILITIES OPERATING AT AN UNACCEPTABLE HIGHWAY LEVEL OF SERVICE (LOS) ROADWAY FACILITY FROM TO 2009 AADT 2009 LOS 2010 AADT 2010 LOS 2010 MSV SW 13 STREET [US 441] (S-3) NW 13 STREET [US 441]. (S-4) ARCHER ROAD UNIVERSITY AVENUE 34,500 F 35,000 F 28,200 UNIVERSITY AVENUE NW 29 ROAD 31,500 F 29,500 F 28,200 NEWBERRY ROAD [SR 26] (S-14) NW 122 STREET INTERSTATE 75 (West Ramp) 37,250 F 38,500 F 35,500 NEWBERRY ROAD [SR 26] (S-15) INTERSTATE 75 (West Ramp) NW 8 AVENUE 49,500 F 48,500 F 43,700 SW 2 AVENUE [SR 26A] (S-21) NW 34 STREET [SR 121] (S-25) ARCHER ROAD [SR 24] (S-47) ARCHER ROAD [SR 24] (S-55) NW 23 AVENUE (A-9) SW 20 AVENUE (A-16) NW 83 STREET (A-23) RADIO ROAD/MUSEUM DRIVE. (G-32) GALE LEMERAND DRIVE (G-39) NEWBERRY ROAD SW 34 STREET 15,200 E 15,000 E 12,495 UNIVERSITY AVENUE NW 16 AVENUE 18,750 F 18,200 F 15,960 GMA BOUNDARY SW 75 STREET 19,000 E 18,500 F 15,960 SW 34 STREET SW 16 AVENUE 51,250 F 52,250 E 50,300 NW 98 STREET NW 55 STREET 16,815 F 15,770 F 15,675 SW 62 BOULEVARD SW 34 STREET 21,524 F 21,524 F 15,675 NW 23 AVENUE NW 39 AVENUE 13,851 E 14,157 E 13,680 SW 34 STREET SW 13 STREET 13,621 F 13,621 F 11,260 MUSEUM DRIVE UNIVERSITY AVENUE 12,368 F 12,368 F 10,530 # Maximum service volume (MSV) for LOS D is not attainable (NA). Notes: Roadway facilities included in the 2009 AADT unacceptable LOS listing that are not included in the 2010 AADT listing are: A-15, SW 20th Avenue from SW 75th Street to SW 62nd Boulevard; and A-19, NW 39th Avenue from NW 112th Street to NW 98th Street. Unacceptable operating performance is based on the 2010 Highway Capacity Manual LOS A to F scale and not Florida Department of Transportation (FDOT) and/or Florida Department of Economic Opportunity-negotiated LOS standards. x
11 INTRODUCTION The Metropolitan Transportation Planning Organization (MTPO) for the Gainesville Urbanized Area s Annual Average Daily Traffic (AADT)/ Multimodal Level of Service (LOS) Report is composed of three components: an LOS map atlas; LOS tables of state-maintained, county-maintained and city-maintained roadways and a technical appendices document. All references to LOS within Appendix A address only highway LOS as described in the Highway Capacity Manual This report contains estimates of the LOS and maximum service volume (MSV) for arterials, collectors functioning as arterials, transitioning arterials and collectors, major nonstate roads and other nonstate roads within the Gainesville Metropolitan Area (GMA) Boundary. Illustration I shows the GMA as defined by Chapter (1)(c), Florida Statutes. LOS and MSV methodology utilizes a two-tiered approach. Tier One LOS/MSV Analysis uses the Florida Department of Transportation (FDOT) Generalized Tables contained in the latest edition of FDOT's Quality/Level of Service Handbook (Q/LOS Handbook) to determine roadway LOS and MSV. The 2009 Q/LOS Handbook, appended with issue papers, is currently the latest edition. Tier One LOS/MSV Analysis is acceptable for use in the GMA for all roadways with less than 65 percent of the FDOT Generalized Tables MSV for the adopted LOS. Tier Two LOS/MSV Analysis uses the FDOT analytical software which accompanies the 2009 Q/LOS Handbook to determine roadway LOS and MSV. FDOT s analytical software is used when more sophisticated analysis is necessary. These analytical tools have varying requirements for field-collected data. Tier Two LOS/MSV Analysis is required for use in the GMA for all roadways with 65 percent or more of the FDOT Generalized Tables MSV for the adopted LOS. The MTPO s Technical Advisory Committee (TAC) Subcommittee adopted a 65 percent threshold to designate a "distressed" arterial and thereby require the use of Tier Two LOS/MSV Analysis. FDOT s analytical software, such as ARTPLAN, is to be performed for all "distressed" arterials. A detailed analysis using FDOT s FREEPLAN software is to be performed for all "distressed" limited-access arterials. Note that the current LOS analysis is for operational performance based on criteria specified in the Highway Capacity Manual 2010 (HCM 2010). In addition, roadway facilities may be functioning at LOS F but may have available capacity based on Florida Department of Economic Opportunity (FDEO)-negotiated MSVs. This report also contains estimates of bicycle, pedestrian and transit LOS for arterials, collectors functioning as arterials, transitioning arterials and collectors, major nonstate roads and other nonstate roads within the Gainesville Metropolitan Area (GMA) Boundary. Bicycle, pedestrian and transit LOS methodology also utilizes a two-tiered approach. Those facilities for which the highway LOS is analyzed using the FDOT Generalized Tables, are also analyzed for bicycle, pedestrian and transit LOS using the FDOT Generalized Tables. Those facilities for which the highway LOS is analyzed using FDOT LOSPLAN software, are also analyzed for bicycle, pedestrian and transit LOS using FDOT LOSPLAN software. Appendix C includes the data and analysis descriptions for determining bicycle, pedestrian and transit LOS. In 2008, the Technical Advisory Committee Level of Service Subcommittee suspended MTPO Staff-updated Tier Two analyses due to concerns that data used are outdated while the Traffic Management System is installed. Field studies are still reviewed by the LOS Subcommittee for inclusion in the LOS Report. 1
12 US 41/27 CR 241 SW 122ND ST US 441 SW 75TH ST SR 121 US 441 Illustration 1 Gainesville Metropolitan Area Alachua County Roads Metropolitan Area 2020 Gainesville City Limits Census 2000 Urbanized Area Urban Cluster µ Miles SR 241 I-75 SR 24 CR 222 MILLHO PPER RD NW 39TH AVE NW 43RD ST NW 53RD AVE SR 26 Legend 2 Alachua County Boundary SR 26 E UNIVERSITY AVE CR 241 SR 20 SR 24 SR 331 US 301 I 75 Source: Future Land Use Map Alachua County, Florida dated July 15, 2003 W:\Kevin\Data\ArcGIS\MTPO\MIKE GMA 3.mxd 10/22/2010
13 PURPOSE The primary purpose of this report is to provide an estimate of roadway LOS possible for each state-maintained arterials, city and county collectors functioning as arterials, transitioning arterials or collectors, major nonstate roads and other nonstate roads within the GMA Boundary. All roadways are analyzed using FDOT's Generalized Tables. The purpose of providing bicycle, pedestrian and transit level of service, in addition to the automotive/ highway level of service, is to inform and educate the MTPO, Alachua County and City of Gainesville elected officials and staffs, as well as, the public at-large regarding the Gainesville Metropolitan Area s multimodal transportation system and to provide a mechanism to monitor the implementation of the Livable Community Reinvestment Plan. SCOPE OF STUDY The analysis of all FDOT-functionally classified roadways within the GMA Boundary which are classified higher than local roads are included in this report. Tables 1 through 3 show the data gathered and the analysis results for all roadways studied. LOS data is graphically illustrated in the MTPO s Level of Service Atlas for all arterials, collectors functioning as arterials and collectors. Roadways which, when analyzed using the FDOT Generalized Tables, use 65 percent or more of the MSV at the minimum acceptable LOS, are identified as "distressed." Prior to the publication 2009 Q/LOS Handbook, the 2002 Q/LOS Handbook, was amended by FDOT Issue Papers. These amendments, provided the ability to determine the level of service for bicycle, pedestrian and transit levels of service and also updated Generalized Tables and LOSPLAN software. In 2003, the Level of Service Technical Advisory Subcommittee directed MTPO staff to incorporate these modes into the MTPO LOS Report. Tables 4 through 6 show a multimodal (automotive/highway, bicycle, pedestrian and transit) LOS summary. 3
14 [PAGE LEFT BLANK INTENTIONALLY] 4
15 METROPOLITAN TRANSPORTATION PLANNING ORGANIZATION (MTPO) FOR THE GAINESVILLE URBANIZED AREA YEAR 2010 ANNUAL AVERAGE DAILY TRAFFIC/ MULTIMODAL LEVEL OF SERVICE REPORT AUTOMOTIVE / HIGHWAY BICYCLE PEDESTRIAN TRANSIT LEVEL OF SERVICE TECHNICAL APPENDIX Prepared by the North Central Florida Regional Planning Council 2009 NW 67 Place Gainesville, Florida January 12, 2012
16
17 APPENDIX A AUTOMOTIVE/HIGHWAY LEVEL OF SERVICE ANALYSES A-1
18 [PAGE LEFT BLANK INTENTIONALLY] A-2
19 DEFINITIONS ARTPLAN - FDOT ARTPLAN is an emulation of the HCM 2010 software for the LOS measurement for an arterial roadway facility. The use of ARTPLAN entails the mathematical operations among average annual daily traffic (AADT) volume and traffic, roadway and signalization variables. ARTPLAN analyzes traffic in the peak and offpeak direction. The peak period peak direction is assumed in this study to be critical. Therefore, all analyses relate to the peak period and peak direction only. Offpeak direction is not considered for the LOS Report. Local traffic characteristics are used which are specific to the particular road being analyzed. The ARTPLAN analysis methodology of the LOS Report is based on FDOT's Q/LOS Handbook, appended with issues papera, and criteria specified by the TAC Subcommittee. The ARTPLAN software calculates facility-specific level of service and corresponding service volume tables. FREEPLAN - FDOT FREEPLAN is an emulation of the HCM 2010 software for freeways. The FREEPLAN software calculates facility-specific level of service and corresponding service volume tables. HIGHPLAN - FDOT HIGHPLAN is an emulation of the HCM 2010 software for two-lane and multilane highways. The HIGHPLAN software calculates facility-specific level of service and corresponding service volume tables. Annual Average Daily Traffic (AADT) - AADT consists of FDOT annual and local government semiannual traffic counts as measured at approved count station locations. FDOT counts are yearly counts, as adjusted for axle and seasonal collection factors. Local counts are the actual counts, taken only in the spring and fall when the University of Florida and public schools are is conducting classes. To accommodate for possible inaccurate measurement due to road construction, special events, faulty equipment, etc., the methodology noted in the facility on Determining Roadway Facility Level of Service is used. In addition, the TAC Subcommittee has determined that the median traffic counts within the last three-year time span shall be used for the FIHS for analysis consistency with Alachua County and City of Gainesville-maintained roadways for Tier One LOS/MSV analysis. FDOT will continue to use the latest available single-year counts. AADT counts for distressed roadway facility analyses shall be the three-year median traffic count for the median traffic count station within the roadway facility. Distressed Roadways - Where a Tier One LOS/MSV analysis of a roadway facility using the FDOT Generalized Tables is measured at 65 percent or more of the MSV for the adopted LOS, the roadway facility is identified as "distressed." These "distressed" arterials are to be analyzed with more accurate analytical tools. FDOT Generalized Tables - For broad planning applications, FDOT developed Generalized Tables, which are contained in the 2009 Quality/Level of Service Handbook. The Generalized Tables, which provide generalized daily and peak hour LOS volumes for Florida's urbanized, transitioning and rural areas, are derived from the methodology in the HCM These tables, which reflect the emphasis on signalization characteristics, are based on actual Florida traffic, roadway and signalization data. In developing the FDOT Generalized Tables, a number of assumptions were made pertaining to roadway characteristics, signal design and traffic conditions. These assumptions are based on average conditions for the State of Florida. The Generalized Tables are accurate to the extent that the local conditions of the arterial which is being analyzed are consistent with the statewide assumptions made. The assumptions are provided as a part of the table. Level of Service (LOS) - The HCM 2010 defines LOS as "qualitative measures that characterize operational conditions within a traffic stream and their perception by motorists and passengers. The descriptions of individual levels of service characterize these conditions in terms of such factors as speed and travel time, freedom to maneuver, traffic interruptions, comfort and convenience." The LOS of an arterial facility is determined by the average travel speed (miles per hour) a motorist can reasonably attain through the facility. For freeways and multilane uninterrupted flow highways, the volume to capacity ratio determines capacity. For signalized intersections, seconds of stopped delay is the determining factor. Six LOS are defined for each type of facility ranging from A to F. A description of the traffic characteristics and driver expectations from Chapter 16 of the Highway Capacity Manual 2010 for Urban Streets LOS is as follows: A-3
20 LOS A - LOS B - LOS C - LOS D - LOS E - LOS F - describes primarily free-flow operation. Vehicles are completely unimpeded in their ability to maneuver within the traffic stream. Control delay at the boundary intersections is minimal. The travel speed exceeds 85% of the base free-flow speed. describes a reasonably unimpeded operation. The ability to maneuver within the traffic stream is only slightly restricted and control delay at the boundary intersections is not significant. The travel speed is between 67% and 85% of the base free-flow speed. describes stable operations. The ability to maneuver and change lanes in midsegment locations may be more restricted than at LOS B. Longer queues at the boundary intersections may contribute to lower than average travel speeds. The travel speed is between 50% and 67% of the base free-flow speed. indicates a less stable condition in which small increases in flow may cause substantial increases in delay and decreases in travel speed. This operation may be due to adverse signal progression, high volume, and inappropriate signal timing at the boundary intersections. The travel speed is between 40% and 50% of the base free-flow speed. is characterized by unstable operation and significant delay. Such operations may be due to some combination of adverse progression, high volume, extensive delays at critical intersections and inappropriate signal timing, and inappropriate signal timing at the boundary intersections. The travel speed is between 30% and 40% of the base free-flow speed. is characterized by flow at extremely low speed. Congestion is likely occurring at the boundary intersections, as indicated by high delay and extensive queuing. The travel speed is 30% or less of the base free-flow speed. Also, LOS F is assigned to the subject direction of travel if the trough movement at one or more boundary intersections has a volume-to-capacity ratio greater than 1.0. Maximum Service Volume (MSV) - MSV for a roadway facility is the average annual daily traffic volume or peak hour volume as indicated in the FDOT Q/LOS Handbook s Generalized Tables for Tier One MSV Analysis, as calculated by ARTPLAN or ART-TAB family analysis software Tier Two MSV Analysis, or as is negotiated between the local government and FDEO for the corresponding adopted LOS standard in a local government comprehensive plan. MSV, which is the roadway facility s adopted capacity, utilizes volume to capacity (v/c) ratio to measure capacity sufficiency. Peak Direction - The direction during the planning analysis hour with the most vehicles. It is best to determine which peak period is critical for the arterial and then use the direction which experiences the highest volumes. Determining the peak direction of a roadway facility is usually simple - it is the direction with the most traffic. Peak Hour - The 100 th highest demand volume hour of the year for a roadway facility. The peak hour is that hour of the day in which the most traffic volume is measured in the peak direction. Roadway Facility - A corridor within the Gainesville Metropolitan Area, as represented in the LOS Report, consisting of termini determined by the TAC Subcommittee using FDOT Q/LOS Handbook criteria. Roadway Segment - A component of a roadway facility, where segment breaks are in accordance with criteria specified in the Q/LOS Handbook. Segment breaks are typically signalize intersections, number of lanes changes and termini. A-4
21 DATA COLLECTION REQUIREMENTS All data shall be collected in accordance with the procedures in the latest available edition of the Q/LOS Handbook. Traffic study termini shall be consistent with the roadway facility termini established in the MTPO s LOS Report. The roadway facility(s) analyzed shall be identified in the traffic study. Data collection requirements include: 1. Traffic Counts - A three-day (72 hour) midweek traffic count at 15-minute intervals when the University of Florida and Alachua County schools are in session shall be collected. In order to account for through movement traffic, traffic count devices shall be placed at appropriate midblock locations away from entrances to activity centers such as shopping centers and schools, to the maximum extent possible. These traffic counts shall be adjusted for axle and seasonal traffic conditions for roadway facilities on the State Highway System and other roadway facilities, as specified by the TAC Subcommittee. 2. Turning Movements - At least two days of turning movements for all signalized intersections (and the roadway section s peak direction terminus) for the peak period/ direction shall be collected. For studies in which the peak period/direction is to be determined, turning movements shall be collected in both directions for a.m. and p.m. periods. Turning movements from exclusive lanes shall be indicated. At the outside throughlane, right turns on a redlight may be counted as a turning movement from exclusive lanes. 3. Adjusted Saturation Flow Rate - Use the default adjusted saturation flow rate that corresponds to the appropriate FDOT Generalized Table in the Q/LOS Handbook for the type of facility being analyzed. 4. Number of Lanes - Identify the number of peak direction through-movement lanes at signalized intersections and other roadway segment breaks within the roadway facility being analyzed. Also identify the number of off-peak direction through-movement lanes at signalized intersections and other roadway segment breaks within the roadway facility being analyzed. Use of partial lanes shall be consistent with the Q/LOS Handbook criteria. 5. Arterial Class - Use the arterial classification for signal density that corresponds to the appropriate FDOT Generalized Table in the Q/LOS Handbook. 6. Free Flow Speed - Use the roadway facility s predominant posted speed limit, i.e. the speed limit with the longest duration over the length of the roadway facility. 7. Arrival Type - Use the observed prevailing arrival types for both peak and off-peak direction for the peak hour for each roadway segment, based on professional judgment, using criteria specified in the 2010 Highway Capacity Manual for the roadway facility. 8. Type Signal System - Use the signal type from information collected from the City of Gainesville Public Works Department. 9. Distance Between Signals - Use the distances between traffic signals for all the roadway segments from the initial terminus to the peak direction terminus. DATA ANALYSIS REQUIREMENTS Roadway facility analysis shall be undertaken utilizing FDOT-approved analysis tools. These tools include, but are not limited to, FDOT s latest version of ARTPLAN, Highway Capacity Manual and Highway Capacity Software. In some cases, the use of FDOT FREEPLAN or HIGHPLAN software may be appropriate. Data analysis requirements include: 1. Roadway Facility AADT for ARTPLAN 2009 is defined as the AADT of the segment with the highest volume to capacity ratio (v/c) as calculated by ARTPLAN 2009; A-5
22 2. K-Factor ("K 100 " Factor or Planning Analysis Hour Factor); D-Factor (Directional Factor); Peak Hour Factor (PHF), which is to be estimated based on three-day bidirectional, 24-hour, 15-minute interval traffic counts for each roadway segment in accordance with criteria specified in the Q/LOS Handbook. 3. Segment AADT - Use the average traffic count from the three-day, 24-hour, 15-minute traffic counts that have been collected (latest traffic count available) which is nearest in the approach of a signalized intersection, terminus or other roadway segment break. 4. Segment Peak Hour Volume (PHV) - Use the median traffic count from the three-day, peak hour, 15- minute traffic counts that have been collected which is nearest in the approach of a signalized intersection, terminus or other roadway segment break. 5. Cycle Length at Signalized Intersections - Use the average cycle length for the peak hour, as calculated from the median of at least two days (Tuesday - Thursday) of field-collected data. Signal timing data from local traffic studies, which are maintained by the City of Gainesville Public Works Department, may be used with the permission of the appropriate government agencies. Those intersections, which are identified as running free, shall be analyzed using field-collected data. 6. Effective g /C at Signalized Intersections - Use the average effective green time (green + yellow + all red - lost time) for the peak hour, as calculated from the median of at least two days (Tuesday - Thursday) of field-collected data. Signal timing data from local traffic studies, which are maintained by the City of Gainesville Public Works Department, may be used with the permission of the appropriate government agencies. Those intersections, which are identified as running free, shall be analyzed using field-collected data. HIGHWAY LEVEL OF SERVICE STANDARDS STATE OF FLORIDA In March, 1992, the FDOT adopted by rule Statewide Minimum Level of Service Standards for the State Highway System. In 2007, these standards were modified to account for the Florida Strategic Intermodal System (SIS), and appended to the 2002 Q/LOS Handbook. Florida s Planning LOS Standards are included in Section 8 of the 2009 Q/LOS Handbook. The standards incorporate the growth management concepts of: 1. urban infill; 2. infrastructure concurrent with the impact of development; 3. alternative modes of transportation; 4. local flexibility in setting standards; 5. different roles the state's facilities provide; and 6. the direct correlation between urban size and acceptance of some highway congestion as a tradeoff for other urban amenities. Appendix B includes a table of the minimum acceptable LOS standards for roadways on the State Highway System. For most roadways, the MSV (i.e., service flow rate) will relate to the minimum acceptable LOS shown in this table. Special allowances were made for some roads due to agreements between local governing bodies and FDOT. In July 2009, Florida legislation (Senate Bill 360) provided for the designation of Dense Urban Land Areas (DULAs). In 2011, the Community Planning Act, modifications of Chapter 163 as described in HB 7207, was passed. This Act makes transportation concurrency optional. Alachua County and the City of Gainesville maintain transportation concurrency. Chapter (29) exempts Dense Urban Land Areas (DULAs) from the Development of Regional Impact (DRI) review program. The City of Gainesville is a DULA. Alachua County s Urban Services Area is a DULA. A-6
23 METROPOLITAN TRANSPORTATION PLANNING ORGANIZATION The MTPO's minimum acceptable LOS standards within the GMA Boundary are provided in Appendix B. These standards are consistent with the standards for state-maintained FIHS and SIS and state-maintained, countymaintained and city-maintained roads, as stated in the Alachua County Comprehensive Plan, as amended and the City of Gainesville Comprehensive Plan, as amended. The minimum acceptable LOS for each roadway is shown in Tables 1, 2 and 3. ALACHUA COUNTY AND CITY OF GAINESVILLE The minimum acceptable LOS standards for Alachua County are provided in Appendix B. The County standards are consistent with FDOT roadway LOS standards. Roads within the City must meet the City of Gainesville requirements which are also included in Appendix B. The City standards are consistent with FDOT roadway LOS standards and the Chapter 163, Florida Statutes. TRAFFIC STUDY PROCEDURES TIER ONE ANALYZED ROADWAY Facilities For development or other projects in which the planning review process requires a traffic study on roadway facilities identified in the LOS Report as being Tier One analyzed, the following procedures shall be implemented: 1. Determine project traffic demand for all appropriate adjacent facilities. 2. For each project-affected roadway facility, add project traffic demand (P T ) to the latest available existing traffic count data (E T ), as identified in the LOS Report or from field-collected data, plus any additional reserve trips allocated (R T ) by any local government to any project-affected facilities to determine the total allocated traffic (T T ). (P T ) + (E T ) + (R T ) = (T T ) 3 A. Determine whether the total allocated traffic is equal to or exceeds 65 percent of the each roadway facility s Generalized Tables MSV (MSV GT ). Any roadway facilities that meet this distressed threshold shall be Tier Two analyzed. Any roadway facilities that do not meet this distressed threshold can be Tier One analyzed or may be Tier Two analyzed. 3 B. For those roadway facilities in the LOS Report which are Tier One analyzed and the total allocated traffic is less than 65 percent of the each roadway facility s Generalized Tables MSV (MSV GT ), then implement the Tier One analysis procedures. If (T T ) <.65 MSV GT, then Tier One analyze If (T T ) > or =.65 MSV GT, then Tier Two analyze A-7
24 TIER TWO ANALYZED ROADWAY Facilities Perform Tier Two analysis to determine whether the project meets criteria for development or other projects in which the planning review process requires a traffic study on: 1. Roadway facilities identified in the LOS Report as being Tier Two analyzed; or 2. Any Tier One analyzed roadway facility where the total allocated traffic is equal to or exceeds 65 percent of the roadway facility s Generalized Tables MSV. METHODOLOGY DETERMINING ROADWAY LEVEL OF SERVICE I. Determination of Average Annual Daily Traffic (AADT) A. Step 1 - Traffic Count Station AADT 1. At established traffic count stations which are counted yearly, the AADT for the station will be, for all analysis purposes, the median volume of the current year's count and the two previous years counts. 2. At established traffic count stations which are counted semiannually, the AADT for the station will be, for all analysis purposes, the median volume of the semiannual count average for the current year's and the two previous years counts. 3. At established traffic count stations which traffic counts are collected in alternate years, the AADT for the station will be, for all analysis purposes, the average of the two most recent counts. 4. At established traffic count stations, where traffic counts are collected once every three years, the AADT for the station will be, for all analysis purposes, that count. 5. At traffic count stations, which have only been counted one year (such as a new or special study count station), the AADT for the station will be, for all analysis purposes, that count. 6. Traffic counts for functionally classified arterials, collectors functioning as arterials and collectors which were collected four years preceding the current year shall be considered stale data and may only be used with the consent of the TAC Subcommittee. 7. Traffic counts collected for roadway facilities on the State Highway System shall be factored for latest available seasonal and axle adjustments. These factor tables are available from the FDOT District 2 office. Local roads are not required to be factored for seasonal and axle adjustments. But the TAC Subcommittee may request that these factors be applied to certain roadways. B. Step 2 - Roadway Facility AADT 1. For Tier One Generalized Tables analysis purposes at established roadway facilities designated in the LOS Report, the AADT for the facility will be the median value of the count station median values as determined in Step 1., above. In 2008, the Technical Advisory Committee Level of Service Subcommittee modified the Tier One analysis to be the median of count station values within a Roadway Facility for the latest available traffic count. 2. For Tier Two ARTPLAN analysis purposes at established roadway facilities designated in the LOS Report, the AADT for the facility will be the sensitive intersection three-year median value as indicated by the ARTPLAN analysis of the facility using the SEGMENT AADT counts as determined below: A-8
25 a. At established roadway facilities, the SEGMENT AADT will be for ARTPLAN analysis purposes, the latest three-year median annual value for the nearest count station of the signalized intersection being analyzed for those segments with more than one AADT. b. At established roadway facilities, the SEGMENT AADT, for those facilities for which there are segments without traffic counts (not field studied), will be for ARTPLAN analysis purposes: i. for field-studied facilities, the calculated value that correspond to the LOS field study traffic count profile associated with the latest three-year median annual value for the nearest count stations; and ii. For nonfield-studied facilities: (a). the latest three-year median annual value for the nearest count station extrapolated to the adjacent segment without data; or (b). the latest three-year median annual value for the nearest count stations interpolated to the adjacent segment(s) without data. II. Tier One Evaluation of All Functionally Classified Roadways A. Tier One LOS evaluations and determination of roadway MSVs, at the minimum acceptable LOS, for all functionally classified roads within the GMA Boundary, are to be performed using the Generalized Tables contained in the FDOT publication, 2009 Q/LOS Handbook, as revised, or any subsequent updates. B. AADT counts (obtained using the method described in Section I) are to be compared with the service volumes at the minimum acceptable LOS to determine if the roadway facility is "distressed". The LOS and MSV at the adopted LOS as determined by the Generalized Tables is to be used for all roadway facilities which are not considered "distressed". However, once a roadway facility meets the distressed threshold, the roadway facility will be analyzed using ARTPLAN analysis until modification, such as additional lanes, to the roadway facility increases capacity. The continuation of ARTPLAN analysis is to sufficiently assess the roadway facility s performance since local government transportation demand management (TDM) and transportation system management (TSM) policies may have been activated to address congested traffic conditions. C. The number of signalized intersections per roadway facility is a factor used in FDOT Generalized Tables analyses. For the LOS Report, the number of signalized intersections is determined by averaging the number of intersections (both signalized and ones requiring the through movement to stop) in the peak directions, not counting the starting one, with the number of intersections, not counting the starting one, in the offpeak direction. III. Tier Two Evaluation of "Distressed" Roadways A detailed analysis of all "distressed" roadways will be performed using ARTPLAN (or the latest technique and/or program approved and recommended by the FDOT and TAC Subcommittee for obtaining a more accurate analysis). The results of the detailed analysis and the MSVs, at the adopted LOS derived from that analysis, will be used for the "distressed" roadways. A-9
26 IV. Options Involving Roadways Determined to be Operating at an Unacceptable Level of Service A. Roadways previously designated as "constrained" 1 and/or "backlogged" 2-1. Roadways previously designated as "backlogged" and/or "constrained", based on a generalized tables analysis, will be analyzed using the detailed technique. The results of the detailed analysis will be used for these roadways. a. If, because of the detailed analysis, it is determined that the roadway is operating at an acceptable LOS, the LOS and MSV at the adopted LOS derived from that analysis will be used. b. If it is confirmed, through the detailed analysis, that the roadway is operating at an unacceptable LOS, the "backlogged" and/or "constrained" designation will remain on the facility and any negotiated MSVs designated in the City or County's Comprehensive Plan will be used. B. When a roadway, which has not previously been designated as "constrained", is found to be operating at an unacceptable LOS (by the detailed analysis), the determination as to whether the road should be considered "constrained" will be made. When FDOT or local government identifies a roadway facility as "constrained", the local government should appropriately update its planning documents. C. Roadways operating at an unacceptable LOS may gain some additional capacity through negotiation between the local government and FDEO. Among the options for increasing capacity for development purposes include: a negotiated capacity degradation of up to ten percent of the MSV for the adopted LOS; designation of a transportation concurrency exception area (TCEA); and designation of a transportation concurrency management area (TCMA). DETERMINING ROADWAY MAXIMUM SERVICE VOLUMES Tier One MSV is determined by identifying the corresponding service volume in the FDOT Generalized Tables for the adopted LOS of the roadway facility. Tier Two MSV is determined by identifying the corresponding service volume as calculated in the FDOT ART- TAB related software program, or as calculated using FDOT ARTPLAN for the adopted LOS of the roadway facility or as calculated by an FDOT and TAC Subcommittee-approved analytical tool. In addition, for capacity evaluation purposes, the MSV of a roadway facility is the adopted value as negotiated by the local government and FDEO. 1 Constrained - means that it is not feasible to add through lanes to meet current or future traffic needs due to physical, environmental or policy constraints. 2 Backlogged - is an unconstrained facility which is operating at an LOS below the adopted minimum operating LOS standard and not programmed for construction in the first three years of FDOT's adopted work program or the first three years of the five year schedule of improvements in a local government's capital improvements element. A-10
27 LEVEL OF SERVICE ANALYSIS TECHNIQUES There are a number of methods for determining LOS. The simplest (and the least accurate) method is the use of the FDOT Generalized Tables. An intermediate level analysis can be performed using the LOSPLAN family software developed by the FDOT. One of the more complex (and more accurate) methods for determining LOS employs calculations derived using the Highway Capacity Manual 2010 or Highway Capacity Software (HCS). The HCM and HCS are acceptable analytical tools for determining LOS. All of these techniques are based on the Highway Capacity Manual Data collection shall be consistent with the criteria specified in the Q/LOS Handbook or criteria designated by FDOT District 2. TIER ONE LEVEL OF SERVICE ANALYSIS FDOT GENERALIZED TABLES To determine the LOS of a roadway facility, use the appropriate urban, transitioning, or rural area FDOT Generalized Table. Within the table, select the appropriate signal density classification and applicable assumption factors to the AADT or PHV being analyzed. TIER TWO LEVEL OF SERVICE ANALYSIS ARTPLAN FOR ESTIMATING LEVEL OF SERVICE For ARTPLAN analysis, localized data is entered for each segment and intersection to achieve a more accurate LOS estimate. Data specific to the road being analyzed should be used wherever possible. However, default values may be used for adjusted saturation flow rate. FREEPLAN/HIGHPLAN FOR ESTIMATING LEVEL OF SERVICE The FREEPLAN and HIGHPLAN programs are used for LOS analysis of arterial roadways that are not adequately represented in the Generalized Tables. These programs create a localized table showing service volumes for each LOS for freeways, limited-access arterials and 2-lane and multilane highways. MAXIMUM SERVICE VOLUME ANALYSIS TECHNIQUES TIER ONE MAXIMUM SERVICE VOLUME ANALYSIS FDOT GENERALIZED TABLES For Tier One MSV analysis, the MSV is the volume for the appropriate FDOT Generalized Table, signal density classification, and roadway facility characteristic assumptions that correspond to the adopted LOS of the roadway facility being analyzed. TIER TWO MAXIMUM SERVICE VOLUME ANALYSIS ARTPLAN FOR ESTIMATING MAXIMUM SERVICE VOLUME ARTPLAN calculates the service volume for all measurable levels of service of the roadway facility. The roadway facility s MSV is determined by identifying the corresponding service volume for the adopted LOS Standard. The Alachua County Urban Services Area and the City of Gainesville include transportation concurrency areas which provide development permitting criteria for additional vehicle trip demand above the adopted LOS Standard. A-11
28 FREEPLAN/HIGHPLAN FOR ESTIMATING MAXIMUM SERVICE VOLUME The FREEPLAN and HIGHPLAN programs can also be used to estimate the service volume at any LOS. The LOS volume in the calculated tables corresponding to the adopted LOS would be the MSV. VARIABLES USED TO PERFORM LOS/MSV ANALYSES TIER ONE LOS ANALYSIS Tier One analysis inputs shall be in conformance with criteria specified in the Q/LOS Handbook. Note that FDOT Generalized Tables service volumes counts that are applied to roadways not on the State Highway System carry a five percent service volume penalty. Roadway Facility Median Average Annual Daily Traffic (AADT) - Determine the median AADT by calculating the median traffic count of all of the count station locations within the roadway facility, in which each count station location s median traffic count consists of the median of the latest three consecutive year traffic counts. See sample below, where roadway facility S-24's median AADT is 44,000. S-24 SR 121 (W 34 ST FROM SR 24 (SW ARCHER RD) To SR 26 (W UNIVERSITY AVE) 44,000 COUNT LOCATION NUMBER AADT SOUTH OF SW 20 TH AVENUE ,000 43,500 42,000 43,500 NORTH OF SW 20 TH AVENUE ,000 51,500 50,500 50,500 NORTH OF RADIO ROAD ,500 46,000 44,500 44,500 SOUTH OF SR 26A 4009 INACTIVE SOUTH OF SR ,500 26,000 28,500 28,500 Class (Signal Density) - FDOT Generalized Tables identify arterial classification factors based on signal density (number of signals per mile). The number of signalized intersections is determined by averaging the number of intersections (signalized and ones requiring the through movement to stop) in the peak directions, not counting the starting one, with the number of intersections, not counting the starting one, in the off-peak direction. Area Type - Use the GMA transportation planning boundaries map (see Illustration I) or refer to the LOS Report s LOS Tables to determine whether the roadway facility being analyzed is urban, transitioning or rural, so that the appropriate Generalized Table-based service volumes are used for analysis. Number of Lanes - Determine the number of through lanes being analyzed to select the appropriate Generalized Table-based service volumes. Arterial/Non-State Roadway Adjustments- Divided/Undivided Facilities- Left Turn Lanes - Apply the left turn bay adjustment factor in the Generalized Table-based service volumes if left turn lanes are (not) present. Medians - Apply the median adjustment factor in the Generalized Table-based service volumes if medians are (not) present. A-12
29 One-Way Facilities - Apply the one-way facility adjustment factor in the Generalized Table-based service volumes if the roadway being analyzed is a one-way facility. Input Value Assumptions - When using the FDOT Generalized Tables, deviation from the input value assumptions for: traffic characteristics, including the planning analysis hour (K 100 ) factor, directional (D) factor, peak hour factor (PHF), and adjusted saturation flow rate; roadway characteristics; and signal characteristics is not permitted. If it is preferred to use local data variables rather than statewide default variables to produce Generalized Tables, then FREEPLAN/HIGHPLAN software shall be used. TIER TWO LOS ANALYSIS Tier Two ARTPLAN analysis inputs shall be in conformance with criteria specified in the Q/LOS Handbook. Tier Two FREEPLAN/HIGHPLAN software analyses shall use roadway facility specific inputs, as determined by FDOT District 2. Note that ARTPLAN is a more accurate Tier Two analysis tool. The appropriate development review agency shall indicate the acceptable analysis tool of those tools approved by FDOT and the TAC Subcommittee. ARTPLAN features three screens, two input (the first screen is facility-level data and the second screen is segmentlevel data) and one output (the third screen is service volume tables). In addition, ARTPLAN produces a printout of input data, calculated LOS and service volume tables. ARTPLAN - GENERAL FACILITY DATA (SCREEN ONE) CHARACTERISTICS DESCRIPTION OF ROADWAY FACILITY Road Name - Input the roadway facility name. Peak Direction - Select the peak hour service volume direction (eastbound or westbound; northbound or southbound) on the roadway facility which has the higher traffic count. Study Time Period - Select the K 100 traffic analysis period. The TAC Subcommittee would need to approve non- K 100 traffic analysis periods for inclusion in the LOS Report. FILE INFORMATION Analyst - Input name of person s name performing the analysis. Analysis Date - Input the traffic study date. Agency - Input the entity employing the traffic study analyst. District - Leave blank. This is a cell for identifying the FDOT district. User Notes - Input the roadway facility ARTPLAN filename and path (its LOS Report designation); the initial peak period/peak direction and the end peak period/peak direction termini. Also, input any relevant comments to the particular analysis. ROADWAY VARIABLES Area Type - Use the GMA transportation planning boundaries map (see Illustration I) or refer to the LOS Report s LOS Tables to determine whether the roadway facility being analyzed is urban, transitioning or rural, so that the appropriate Generalized Table-based service volumes are used for analysis. A-13
30 Class (Signal Density) - FDOT Generalized Tables identify arterial classification factors based on signal density (number of signals per mile). The number of signalized intersections is determined by averaging the number of intersections (signalized and unsignalized traffic-controlled for the through movement) in the peak directions, not counting the starting one, with the number of intersections, not counting the starting one, in the off-peak direction. Use the arterial classification for signal density that corresponds to the appropriate FDOT Generalized Table in the Q/LOS Handbook. Left Turnlanes - Check if the roadway facility has exclusive left and/or right turnlane facilities at signalized intersections. Number ( # ) of Throughlanes (Both Directions) - Input the number of peak direction and offpeak direction through-movement lanes at signalized intersections and other roadway segment breaks within the roadway facility being analyzed on page one and two of the ARTPLAN spreadsheet. Use of partial lanes shall be consistent with the Q/LOS Handbook criteria. Posted Speed - Input the roadway facility s predominant posted speed limit, i.e. the speed limit with the longest duration over the length of the roadway facility. ARTPLAN calculates the free flow speed. TRAFFIC VARIABLES To determine the roadway facility AADT, collect three days of 24-hour bidirectional counts (Tuesday through Thursday) by 15 minute increments. Roadway Facility AADT- Input the traffic count for the sensitive intersection, where the sensitive intersection is defined as that intersection which is the first to reach a volume:capacity (v/c) ratio of 1.0. Adjusted Saturation Flow Rate - Use the ARTPLAN-calculated adjusted saturation flow rate. This flow rate is the base saturation flow rate times the effects of many roadway and traffic variables in the Q/LOS Handbook. Base Saturation Flow Rate - The maximum steady flow rate, expressed in passenger cars per hour per lane, at which passenger cars can cross a point on interrupted flow roadways. ARTPLAN calculates a base saturation flow rate that corresponds to the appropriate FDOT Generalized Table in the Q/LOS Handbook for the type of facility being analyzed. A calculated saturation flow rate, if approved by FDOT District 2, may be used for the specific roadway facility. "D" Factor (Directional Factor) - The real "D" factor is inputted on the ARTPLAN software, if available. Otherwise, it is estimated based on three-day bidirectional, peak hour, 15-minute incremental traffic counts for each roadway segment in accordance with criteria specified in the Q/LOS Handbook. "K" Factor ("K 100 " Factor or Planning Analysis Hour Factor) - The real "K 100 " factor is inputted on the ARTPLAN spreadsheet, if available. Otherwise, it is estimated based on three-day bidirectional, 24-hour, 15-minute incremental traffic counts for each roadway segment in accordance with criteria specified in the Q/LOS Handbook. Peak Hour Factor (PHF) - Use Q/LOS Handbook methodology to calculate the PHF. PHF shall be based on threeday, 24-hour, bidirectional traffic counts at 15-minute intervals for each roadway segment. Percent (%) Heavy Vehicles - percentage of vehicles with more than four wheels touching the pavement during normal operation. For ARTPLAN analyses, use the default value for State Highway System arterials and nonstate facilities. A-14
31 Percent (%) of Turns From Exclusive Lanes - The median percent turn data is inputted for each roadway segment based on turning movement data collected for the roadway segments. Two days of peak hour, peak direction turning movement counts for each signalized intersection, including the last peak direction terminus (if not signalized) shall be collected to determine an estimated average percent of turns from exclusive lanes. TRAFFIC CONTROL VARIABLES Arrival Type - Input the median of the observed prevailing arrival types for both peak and off-peak direction for the peak hour for each roadway segment, based on professional judgement, using criteria specified in the Highway Capacity Manual 2010 for the roadway facility. Control Type - Input the traffic signal control type (actuated, semiactuated or pretimed) from information collected from the City of Gainesville Public Works Department. Cycle Length (C) - Input the observed traffic signal cycle length for the peak direction for the peak hour for sensitive intersection. Signals/Mile - Input the signal density (number of traffic signals per mile) for the roadway. Through g /C - Input the through movement g /C for the sensitive intersection, as calculated from the roadway segment data, using Q/LOS Handbook criteria. ARTPLAN SEGMENT DATA SCREEN PEAK DIRECTION INPUTS AADT - Input the median traffic count from the three-day, 24-hour, 15- minute traffic counts that have been collected (latest traffic count available) which is nearest in the approach of a signalized intersection, terminus or other segment break. This median traffic count shall be adjusted for axle and seasonal traffic conditions for roadway facilities on the State Highway System and other roadway facilities, as specified by the TAC Subcommittee. For nonfield-studied ARTPLAN analyses, the average of the three-year median traffic counts of adjacent segments is used for segments without traffic counts. For ARTPLAN analyses subsequent to the field study year, a value that maintains the proportion defined by the field-collected data is used for the traffic count, i.e. the roadway facility traffic profile will be maintained. Arrival Type - Input observed prevailing roadway segment arrival types for peak direction for the peak hour, based on professional judgement, using criteria specified in the Highway Capacity Manual Cross Street Names - Input the names of the roadway facility s cross streets beginning with the initial terminus (intersection, political boundary, etc) for the peak direction as intersection # 1 until all traffic-controlled intersections up to-and-including the end terminus (intersection, political boundary, etc) for the peak direction in the roadway facility are entered. Cycle Length at Traffic-Controlled Intersections - Input the average cycle length for the peak hour, as calculated from the median of at least two days (Tuesday - Thursday) of field-collected data. Signal timing data from local traffic studies, which are maintained by the City of Gainesville Public Works Department, may be used with the permission of the appropriate government agencies. Use the mode cycle length for the peak direction end terminus which is not signalized. Free-Flow Speed - The average speed of vehicles not under the influence of speed reduction conditions, generally assumed to be 5 mph over the posted speed limit. Use the default free-flow speed as automatically calculated by ARTPLAN. Use of Field-collected free flow speeds shall be coordinated with the TAC Subcommittee and FDOT District 2 staff. A-15
32 g /C at Traffic-Controlled Intersections - Input the average effective green time (green + yellow + all red - lost time) for the peak hour, as calculated from the median of at least two days (Tuesday - Thursday) of field-collected data. Signal timing data from local traffic studies, which are maintained by the City of Gainesville Public Works Department, may be used with the permission of the appropriate government agencies. Use 0.99 as the g /C for the peak direction end terminus which is not signalized. Length (Distance Between Signals) - Input the distances between traffic signals for all the roadway segments from the initial terminus to the peak direction terminus. Note that this data may be inputted as feet or miles data. Number ( # ) of Directional Lanes - Input the number of peak direction through-movement lanes at signalized intersections and other roadway segment breaks within the roadway segment being analyzed. Use of partial lanes shall be consistent with the Q/LOS Handbook criteria. Peak Hour Volume (PHV) - Input the median traffic count from the three-day, peak hour, 15- minute traffic counts that have been collected (latest traffic count available) which is nearest in the approach of a signalized intersection, terminus or other segment break. This median traffic count shall be adjusted for axle and seasonal traffic conditions for roadway facilities on the State Highway System and other roadway facilities, as specified by the TAC Subcommittee. Percent (%) of Turns From Exclusive Lanes - Input percent turn data for each roadway segment. Percent turns is determined from at least two days of peak hour, peak direction turning movement counts for each signalized intersection, including the last peak direction terminus (if not signalized) shall be collected to determine an estimated average percent of turns from exclusive lanes. ARTPLAN FACILITY AND SEGMENT LEVEL OF SERVICE (LOS) OUTPUT SCREEN FACILITY OUTPUTS Arterial Length - The length of the roadway facility is displayed. Auto LOS - The calculated roadway facility LOS for automobiles is displayed. Auto Speed - The calculated roadway facility average vehicle speed is displayed. Segments - The segment termini names are displayed. SEGMENT OUTPUTS Control Delay - The calculated roadway segment control delay is displayed. Intersection Approach LOS - The calculated roadway segment intersection approach LOS is displayed. Segment LOS - The calculated roadway segment LOS is displayed. Speed (mph) - The calculated roadway segment speed is displayed. Through Movement Flow Rate - The calculated roadway segment through movement flow rate is displayed. v/c (Volume:Capacity Ratio) - The calculated roadway segment v/c ratio is displayed. ARTPLAN FACILITY SERVICE VOLUME SCREEN Maximum Service Volumes - MSV tables for hourly volume in the peak direction, hourly volume for both directions and annual average daily traffic are displayed. A-16
33 RESULTS Automotive/Highway LOS data for each roadway facility are provided for State-maintained, Alachua Countymaintained and City of Gainesville-maintained roads within the GMA boundary. Tables 1 through 3 provide median AADT counts and FDOT Generalized Tables, ARTPLAN, HIGHPLAN or FREEPLAN LOS data for these roads, MSVs, laneage, signal density, median and/or left turn adjustments and adopted LOS standards for these roads. Table 1 provides the summary for the State-maintained arterials, Table 2 provides the summary for the Alachua County-maintained roads and Table 3 provides the summary for the City of Gainesville-maintained roads. The roads are labeled S (State), A (Alachua County) or G (City of Gainesville) and an assigned arterial number. For example, S-4 is the designation of U.S. 441 from State Road 26 (University Avenue) to NW 29 th Road. Roadway facilities which are part of the FIHS, MTPO-designated multimodal corridors or are within a local government comprehensive plan-designated transportation concurrency managed area are identified in the LOS tables. In addition, Tables 4 through 6 provide a multimodal level of service summary for automotive/highway, bicycle, pedestrian and transit modes. Table 4 provides the summary for the State-maintained arterials, Table 5 provides the summary for the Alachua County-maintained roads and Table 6 provides the summary for the City of Gainesvillemaintained roads. Exhibit 2, in Appendix A, identifies the sensitive intersection for each ARTPLAN-analyzed facility. A sensitive intersection is the intersection for which its performance causes the facility to operate at an unacceptable LOS. Therefore, the maximum service volume (MSV) for the sensitive intersection is the MSV for the facility. Summary pages for special circumstance studies are provided in Appendix G. Special circumstance studies include calculated LOSs and MSVs for roadways which are subject to preconstruction planning studies for capacity enhancement and roadways which have had their capacities increased within the last year. In 2008, the Technical Advisory Committee Level of Service Subcommittee suspended MTPO Staff-updated Tier Two analyses due to concerns that data used are outdated. Field studies are still reviewed by the LOS Subcommittee for inclusion in the LOS Report. A-17
34 EXHIBIT 2 SENSITIVE INTERSECTION FOR ARTPLAN-ANALYZED FACILITIES [RESERVED] MTPO Staff-Updated Tier Two Analyses Suspended in 2008 A-18
35 APPENDIX B MINIMUM ACCEPTABLE HIGHWAY LEVEL OF SERVICE STANDARDS WITHIN THE GAINESVILLE METROPOLITAN AREA BOUNDARY B-1
36 [PAGE LEFT BLANK INTENTIONALLY] B-2
37 MINIMUM ACCEPTABLE HIGHWAY LEVEL OF SERVICE (LOS) STANDARDS WITHIN THE GAINESVILLE METROPOLITAN AREA (GMA) BOUNDARY In accordance with the guidance of the 1985 Growth Management Act, as amended, all roadway facilities within the GMA have a designated LOS standard. In 2011, the Community Planning Act, modifications of Chapter 163 as described in HB 7207, was passed. This Act makes transportation concurrency optional. Alachua County and the City of Gainesville maintain transportation concurrency. Chapter (29) exempts Dense Urban Land Areas (DULAs) from the Development of Regional Impact (DRI) review program. As designated by the Florida Legislature s Office of Economic and Demographic Research, the City of Gainesville and the Alachua County Urban Services Area meet the DULA criteria of 1,000 persons per square mile. Illustration II shows the FDOT District II DULAs. The City of Gainesville also has a citywide Transportation Concurrency Exception Area (TCEA). The Alachua County Urban Services Area includes three TCEA districts. FLORIDA STATE HIGHWAY SYSTEM LOS standards adopted by FDOT, Rule 14-94, are included in this appendix. These standards apply to the roadway facilities within the GMA which are part of the Florida Intrastate Highway System (FIHS) and/or Strategic Intermodal System (SIS) and designated SIS Connector or have been Transportation Regional Incentive Program (TRIP)-funded. METROPOLITAN PLANNING ORGANIZATION LOS standards adopted by the Metropolitan Transportation Planning Organization (MTPO) for the Gainesville Urbanized Area are included in this appendix. These standards apply to the roadway facilities within the GMA. ALACHUA COUNTY LOS standards adopted by Alachua County are contained in the County s comprehensive plan. These standards apply to the roadway facilities within the GMA which are not contained within municipal corporate limits. Alachua County uses an areawide level of service. The Alachua County Comprehensive Plan is maintained by the Alachua County Department of Growth Management. Requests for the latest information on LOS standards should be directed to the Department of Growth Management. Roadway facility-specific LOS standards are included in the LOS Tables facility of this report. Illustration III shows the current boundaries for the County s TCEA districts. CITY OF GAINESVILLE LOS standards adopted by the City of Gainesville are contained in the City s comprehensive plan. These standards apply to the roadway facilities within the GMA which are contained within municipal corporate limits of the City. The City of Gainesville Comprehensive Plan is maintained by the City of Gainesville Department of Planning and Development Services. Requests for the latest information on LOS standards should be directed to the Department of Planning and Development Services. Roadway facility-specific LOS standards are included in the LOS Tables facility of this report. Illustration IV shows the current boundaries for the City s TCEA zones. B-3

38 Taylor Taylor PERRY GREENVILLE MADISON Madison Madison LEE Dixie Dixie BELL BRANFORD YANKEETOWN OTTER CREEK CHIEFLAND 19 TRENTON Gilchrist Gilchrist 75 WILLISTON 27A (1! LAWTEY (! 2 WALDO B-4 Map ID (! 213 S T CRESCENT CITY WELAKA 226 S T 227 ST.AUGUSTINEBEACH S T ST. AUGUSTINE 2007 Pop 122,671 5,804 9,109 13,961 1,601 22,253 7, ,450 11,911 11,470 13,912 6,031 HASTINGS St. St. Johns Johns POMONA PARK PALATKA City Gainesville Macclenny Orange Park Atlantic Beach Baldwin Jacksonville Jacksonville Beach Neptune Beach Fernandina Beach Palatka St. Augustine St. Augustine Beach INTERLACHEN JACKSONVILLE BEACH GREEN COVE SPRINGS Putnam Putnam ATLANTIC BEACH List of District2 Dense Urban Land Areas County2 Alachua Baker Clay Duval Duval Duval Duval Duval Nassau Putnam St. Johns St. Johns HAWTHORNE 20 (! S T 100 Duval Duval FERNANDINA BEACH 123 S T 53! ( (! 57 (! NEPTUNE BEACH 56 (! 55 ORANGE PARK PENNEY FARM Clay Clay 95 Nassau Nassau JACKSONVILLE CALLAHAN BALDWIN 54 (! 1 HILLIARD KEYSTONE HEIGHTS HAMPTON 301 STARKE Bradford Bradford MICANOPY GAINESVILLE Alachua Alachua LACROSSE ALACHUA NEWBERRY BRONSON Levy Levy LAKE BUTLER Union Union 10 MACCLENNY GLEN ST. MARY Baker Baker WORTHINGTON SPRINGS HIGH SPRINGS FORT WHITE 100 S T Columbia Columbia LAKE CITY WHITE SPRINGS Hamilton Hamilton FANNING SPRINGS CEDAR KEY CROSS CITY Lafayette Lafayette MAYO LIVE OAK 75 JASPER Suwannee Suwannee JENNINGS ILLUSTRATION II 5 Miles 0 10 Planned roads File: S:\ProjSpecial\TCEA\Project\FDOT_Districts\Dist2.mxd 10 BEBR 2007 Population Projections FGDL 2007 Municipal Boundaries Data Sources: NOTES 6 & 6+ lane roads Other State roads 2 lane roads 4 lane roads Existing Conditions for SIS Highways Counties with no DULAs DULA County Urban Service Boundaries Non-DULA Municipalities DULA Municipalities LEGEND DRAFT District2 Dense Urban Land Areas
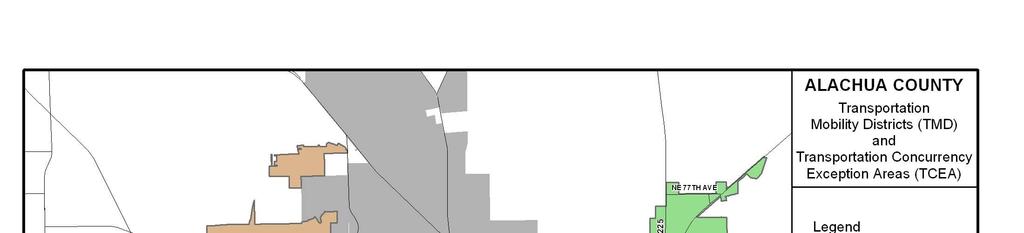
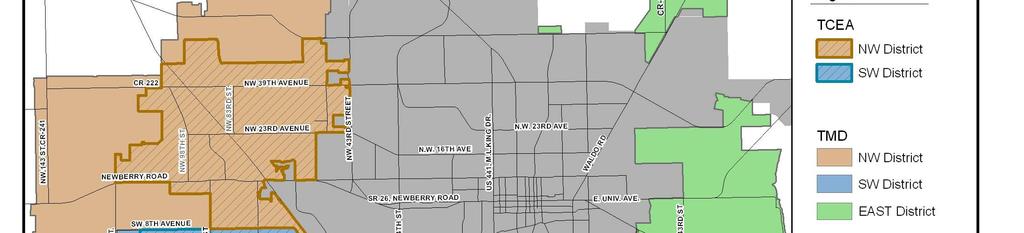
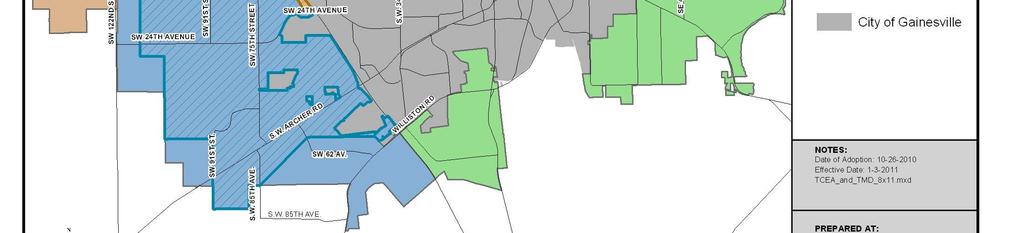
39 ILLUSTRATION III B-5

40 SR 26 SR S329B TCEA Transportation Concurrency Exception Area US 441 US 441 NW 43 St NW 34 NW 39 Ave NW 23 Ave NW 55 St NW 16 Blvd NW 34 St SR 121 SR 232 St SR 24 NW 53 Ave NE 39 Ave I-75 Tower Rd 24 Ave SW 75 St SW 62 I-75 Blvd SW NW 8 Ave 20 Ave NW 31 Ave SW 2 Ave 23 Blvd NW 16 Ave W University Ave Archer Rd SW US 441 NW 13 St NW 6 St 16 Ave Depot Ave North Main St Williston Rd NE 16 Ave NE 23 Ave NE 8 Ave E University Ave SE 4 St SE 11 St SE 15 St SE 27 St NE 15 St Waldo Rd NE 39 Ave SR 20 SE 43 St CR 237 SR 121 ILLUSTRATION IV CR 231 TCEA Zones A B C D E M Note: The TCEA does not apply to annexed parcels without City of Gainesville land use designations. I 0 8,000 Feet Created by City of Gainesville Planning Department, GIS Section. April 22, Pl SW 34 St SR 331 This map is for informational purposes only. Do not rely on this map for accuracy of dimensions, size or location. The City of Gainesville does not assume responsibility to update this information or for any error or omission on this map. For specific information, you are directed to contact the City of Gainesville, Florida. File: T:Projects/Planning/ TCEA/TCEA-Subzones.mxd. B-6
41 FLORIDA STATE HIGHWAY SYSTEM BS-1
42 [PAGE LEFT BLANK INTENTIONALLY] BS-2
43 8 FLORIDA S PLANNING LOS STANDARDS For planning purposes, FDOT has adopted statewide minimum LOS standards for roadway facilities in Rule , F.A.C. as shown in Table 8 1. In 2009 state legislation passed altering some of the requirements for local governments to establish LOS standards for state transportation facilities. Note, where FDOT s current Rule Chapter requirements conflict with state law, the provisions of law supersede. Table 8-1 Statewide Minimum LOS Standards SIS and FIHS facilities TRIP funded facilities and other State roads Limited Access Highway (Freeway) Controlled Access Highway Other Multilane Two-Lane Rural Areas B B 1 B C Transitioning Urbanized Areas, Urban Areas, or Communities C C C C Urbanized Areas under 500,000 C(D) C D D Urbanized Areas over 500,000 D(E) D D D Roadways parallel to exclusive transit facilities E E E E Inside TCMAs D(E) 2 E Inside TCEAs 2 and MMTDs Level of service standards inside of parentheses apply to general use lanes only when exclusive thru lanes exist. 1. For rural two-lane facilities, the standard is C. 2. Means the Department must be consulted as provided by Section (5), (7), or (15), Florida Statutes, regarding level of service standards set on SIS or TRIP facilities impacted by TCMAs, MMTDs, or TCEAs respectively. NOTE: Level of service letter designations are defined in the Department s latest Quality/Level of Service Handbook. Specific assumptions and restrictions that apply to these minimum LOS standards are: (a) The minimum LOS standards represent the lowest acceptable operating conditions in the peak hour. (b) Definitions and measurement criteria used for the minimum LOS standards can be found in the latest Transportation Research Board's Highway Capacity Manual. (c) When calculating or evaluating level of service pursuant to this rule, all calculations and evaluations shall be based on the methodology contained in the latest Transportation Research Board's Highway Capacity Manual, the Department's latest Quality/Level of Service Handbook, or a methodology determined by the Department to be of comparable reliability. Any methodology superseded by the Highway Capacity Manual, such as a methodology based on the 1997 Highway Capacity Manual or Circular 212, shall not be used. Minimum LOS Standards for SIS Connectors and TRIP Funded Facilities are: (a) Minimum LOS Standards for SIS Highways. 1. Limited access SIS highways shall adhere to the limited access FIHS LOS standards. 2. Controlled access SIS highways shall adhere to the controlled access FIHS LOS standards. 3. These standards shall apply regardless whether the facility is FIHS, SHS, or under other jurisdiction. (b) Minimum LOS Standards for SIS Connectors. The minimum LOS standard for SIS connectors shall be LOS D. BS-3
44 8.1 Applicability of Standards Applicable to FDOT planning The LOS standards were recently updated in April The rule is intended to promote public safety and general welfare, ensure the mobility of people and goods, and preserve the facilities on the State Highway System (SHS) SIS, and facilities funded by the TRIP. The standards are to be applied to FDOT s planning activities. Unless otherwise provided by law, the minimum LOS standards for the SIS, FIHS, and facilities funded by the TRIP will be used by FDOT in review of local government comprehensive plans, assessing impacts related to developments of regional impact (DRI), and assessing other developments affecting the SIS, FIHS, and roadways funded by the TRIP. Chapter , Laws of Florida, amended the requirements for local governments to establish and maintain LOS standards for transportation facilities in certain designated areas. Local governments must adopt and maintain the FDOT LOS standards for the Strategic Intermodal System (SIS) outside Transportation Concurrency Exception Areas (TCEAs), regardless of the type of funding used for the SIS or its designation as a Transportation Regional Incentive Program (TRIP) funded roadway. For all other FIHS and TRIP funded roadways that are not part of the SIS, local governments may establish their own standards for these transportation facilities. The new law also relieves local government s from the requirement to achieve and maintain level of service standards for transportation in TCEAs, s (3)(f), F.S. In TCEAs created by s (5)(b), F.S., local governments no longer have to consult with FDOT on impacts to the SIS and TRIP funded roadways. In TCEAs designated under s (5)(b)7., F.S., local governments must continue to consult with the state land planning agency and FDOT to assess impacts on adopted level of service standards established for regional transportation facilities identified in the Strategic Regional Policy Plan, including SIS and TRIP funded roadways, and provide a plan for mitigation of impacts to the SIS. The LOS standards designate the lowest quality operating conditions acceptable for the 100th highest volume hour of the year, from the present through the planning horizon, generally up to 20 years. The 100th highest hour approximates the typical weekday peak hour during the peak season in developed areas. Thus, it can be thought of as the typical drive during rush hour in an area s peak season. The LOS standards in this Handbook are based on the 100th highest hour for planning purposes. The 30th highest hour, or design hour, remains effective for design purposes. The standards require all LOS determinations be based on the latest edition of the Highway Capacity Manual (HCM) [TRB, 2000], this FDOT Q/LOS Handbook or a methodology determined by FDOT as having comparable reliability. There are only two FDOT supported highway capacity and LOS analysis tools for planning and preliminary engineering: FDOT s Generalized Service Volume Tables and FDOT s LOSPLAN software. These two tools form the core for all FDOT s highway capacity and LOS analyses and reviews in planning stages. BS-4
45 Area types Area boundary smoothing Future years Signalized intersection analyses The area and roadway types in the LOS standards match well with FDOT s Generalized Tables appearing at the end of this Handbook; however, subtleties exist on delineation of areas. The first part of Chapter 3.5 of this Handbook addresses area types. While the standards are applicable at the facility and section levels, there may be small lengths of roadways (e.g., 2 miles) between area types which from a logical and analytical perspective should be combined into one area type or another. This situation typically happens in transitioning areas, but may also occur elsewhere. FDOT District LOS Coordinators (Chapter 9) should be consulted for applicable boundaries within their districts. For development reviews, FDOT s LOS standards and area types remain effective throughout the project's planning horizon. For example, in FDOT s review of a proposed multi-phase development the same standards and area types would be used regardless of the amount of development anticipated over time. The only time the applicable standards may change is when the development order conditions provide for a reevaluation of transportation impacts for subsequent phases of development. The change in LOS standards may result from an official change in designation (e.g., Census update, rule change, variance). The logical extension of applying the LOS standards to point analyses is to apply the applicable standards to the thru movement of the roadway. For example, for a site impact analysis if the LOS standard for an arterial is D, then the thru movement at the intersection should also be D. However, while sound in concept, it is usually possible to acheive a desired LOS for an intersection approach if the other approaches are ignored. Therefore, if an operational analysis of a signalized intersection is part of a planning study, the operational analysis should be conducted with HCS for the entire intersection with appropriate traffic volumes and other inputs for each approach. No intersection approach should fall below its established LOS standard. If there is no LOS standard, the approach should not have a volume to capacity ratio in excess of 1.0 for the full hour. The segment and the relevant intersection approaches must operate at acceptable levels of service. Other techniques exist for analyzing signalized intersections in planning studies, so District LOS Coordinators (Chapter 9) should be consulted for specific techniques and acceptable values in their districts. If a detailed point analysis is performed, the applicant must demonstrate ample left turn storage. Any actual turning movement counts can only be used to determine the percentage of the approach turning left, not the actual number of turning vehicles as this number can be constrained and not representative of a demand volume. BS-5
46 SIS connectors FDOT s LOS standard for SIS connectors is D. From a highway system structure these connectors cover a full range of roadway types varying from points (intersection movements), individual subsegments (ramps), segments, sections, and facilities, and frequently involve more than one roadway. FDOT does not routinely monitor or report LOS for SIS connectors unless they conform to appropriate facility or section length criteria for a roadway. In these cases LOSPLAN is an appropriate measurement tool. To evaluate the LOS of a SIS connector at a point level, the Highway Capacity Software (HCS) is the recommended tool. If a signalized intersection of a SIS connector is being evaluated, the LOS D standard applies to the applicable movement, with the recommendation that all other movements are adequately addressed for the operation of the intersection. 8.2 Concepts of Underlying Standards The standards include the following major concepts: the different level of importance of the Florida Intrastate Highway System and other state roads; the different roles (i.e., mobility versus access) provided by state facilities (i.e., Florida Intrastate Highway System versus other state roads); the direct correlation between urban size and acceptance of some highway congestion as a tradeoff for other urban amenities; encouraging growth in existing developed areas; and recognition of the interaction between highways and exclusive transit systems serving commuters. BS-6
47 CHAPTER STATEWIDE MINIMUM LEVEL OF SERVICE STANDARDS Purpose Definitions Statewide Minimum Level of Service Standards Purpose. (1) The purpose of this rule chapter is to establish statewide minimum level of service standards to be used in the planning and operation of the State Highway System (SHS), roadway facilities on the Strategic Intermodal System (SIS), the Florida Intrastate Highway System (FIHS), and roadway facilities funded in accordance with Section , F.S. which creates the Transportation Regional Incentive Program (TRIP). This rule chapter is intended to promote public safety and general welfare, ensure the mobility of people and goods, and preserve the facilities on the SHS, SIS, and facilities funded by the TRIP. The minimum level of service standards for the SIS, FIHS, and facilities funded by the TRIP will be used by the Department in the review of local government comprehensive plans, assessing impacts related to developments of regional impact, and assessing other developments affecting the SIS, FIHS, and roadways funded by the TRIP. The minimum level of service standards for the SIS, FIHS, and roadways funded by the TRIP will be used by local governments for complying with applicable provisions of Section , F.S. (2) This rule chapter does not supersede or negate the provisions of Chapter 9J-5, F.A.C., pertaining to the preparation and adoption of local comprehensive plans or plan amendments by local governments. Specific Authority (10), (2) FS. Law Implemented (10), (4), , (10)(a), (12), (19), (2), , FS. History New , Amended Definitions. As used in this rule chapter, the following definitions apply: (1) Communities means incorporated places outside urban or urbanized areas, or unincorporated developed areas having a population of 500 or more identified by local governments in their local government comprehensive plans and located outside of urban or urbanized areas. (2) Controlled Access Facilities means non-limited access arterial facilities where access connections, median openings, and traffic signals are highly regulated. (3) Exclusive Through Lanes means roadway lanes exclusively designated for intrastate travel, which are physically separated from general use lanes, and to which access is highly regulated. These lanes may be used for high occupancy vehicles and express buses during peak hours if the level of service standards can be maintained. (4) Florida Intrastate Highway System (FIHS) means the highway system established pursuant to Section , F.S., which comprises a statewide network of limited and controlled access facilities. The primary function of the system is for high speed and high volume traffic movements within the state. (5) General Use Lanes means roadway lanes not exclusively designated for long distance high speed travel. In urbanized areas general use lanes include high occupancy vehicle lanes not physically separated from other travel lanes. (6) Level of Service (LOS) for highways means a quantitative stratification of the quality of service to a typical traveler on a facility into six letter grade levels with A describing the highest quality and F describing the lowest quality. The indicated LOS standards designate lowest acceptable operating conditions for the 100th highest volume hour of the year in the predominant traffic flow direction. The 100th highest volume hour represents the typical peak hour during the peak season. Definitions and measurement criteria used for minimum LOS standards are based on the Transportation Research Board Highway Capacity Manual All LOS evaluations are to be based on the Transportation Research Board Highway Capacity Manual 2000, the Department s 2002 Quality/Level of Service Handbook, or a methodology determined by the Department to be of comparable reliability. The Transportation Research Board Highway Capacity Manual 2000 and the Department s 2002 Quality/Level of Service Handbook are hereby incorporated by reference and made a part of these rules. The National Transportation Research Board s Highway Capacity Manual 2000, is available from the Transportation Research Board, National Research Council, Washington, D.C. The Department s 2002 Quality/Level of Service Handbook may be found at: systems/sm/los/los_sw2.htm. BS-7
48 (7) Limited Access Facilities means multilane divided highways having a minimum of two lanes for exclusive use of traffic in each direction and full control of ingress and egress; this includes freeways and all fully controlled access roadways. (8) Other State Roads means roads on the SHS which are not part of the FIHS. (9) Peak Hour means the 100th highest volume hour of the year in the predominant traffic flow direction from the present through a 20-year planning horizon. (10) Multimodal Transportation Districts (MMTDs) means areas in which secondary priority is given to vehicle mobility and primary priority is given to assuring a safe, comfortable and attractive pedestrian environment with convenient interconnection to transit. Local government comprehensive plans may establish multimodal LOS standards within MMTDs pursuant to Section (15), F.S. (11) Regionally Significant Roadways means as established pursuant to Section , F.S. (12) Roadways Parallel to Exclusive Transit Facilities means roads that generally run parallel to and within one-half mile of exclusive transit facilities, which are physically separated rail or roadway lanes reserved for multipassenger use by rail cars or buses serving large volumes of home/work trips during peak travel hours. Exclusive transit facilities do not include downtown peoplemovers, or high occupancy vehicle lanes unless physically separated from other travel lanes. (13) Rural Areas means areas not included in an urbanized area, a transitioning urbanized area, an urban area, or a community. (14) Strategic Intermodal System (SIS) means as established pursuant to Sections , F.S. (15) SIS Connectors means designated roadways that connect SIS hubs to SIS highways. These may be either on or off the SHS. (16) SIS Hubs means ports and terminals that move goods or people between Florida regions or between Florida and other markets in the United States and the rest of the world. These include commercial service airports, deepwater seaports, space ports, interregional rail and bus terminals, and freight rail terminals. (17) Transitioning Urbanized Areas means the areas outside urbanized areas, but within the MPO Metropolitan Planning Area Boundaries, that are expected to be included within the urbanized areas within the next 20 years based primarily on the U.S. Bureau of Census urbanized criteria. (18) Transportation Concurrency Exception Area (TCEA) means an area which is so designated by a local government pursuant to Section , F.S. (19) Transportation Concurrency Management Area (TCMA) means a geographically compact area with an existing network of roads where multiple, viable alternative travel paths or modes are available for common trips. A TCMA may be designated in local government comprehensive plans in accordance with Section , F.S. (20) Transportation Regional Incentive Program (TRIP) means as established pursuant to Section , F.S. (21) Urban Areas means places with a population of at least 5,000 which are not included in urbanized areas based on the most recent U.S. Census. The applicable boundary encompasses the urban area as well as the surrounding geographical area as determined by the Federal Highway Administration (FHWA), the Department, and local government. The boundaries are commonly called FHWA Urban Area Boundaries and include areas expected to have medium density development before the next decennial census. (22) Urbanized Areas means the urbanized areas designated by the U.S. Bureau of Census as well as the surrounding geographical areas, as determined by the FHWA, the Department, and the Metropolitan Planning Organization, and are commonly called FHWA Urbanized Area Boundaries. The over or under 500,000 classifications distinguish urbanized area populations based on the most recent U.S. Census. Specific Authority (10), (2) FS. Law Implemented (10), (4), , (10)(a), (12), (19), (2), , FS. History New , Amended Statewide Minimum Level of Service Standards. (1) The Statewide Minimum LOS Standards are as follows: BS-8
49 STATEWIDE MINIMUM LEVEL OF SERVICE STANDARDS FOR THE STATE HIGHWAY SYSTEM, ROADWAYS ON THE STRATEGIC INTERMODAL SYSTEM (SIS), ROADWAYS ON THE FLORIDA INTRASTATE HIGHWAY SYSTEM (FIHS) AND ROADWAY FACILITIES FUNDED IN ACCORDANCE WITH SECTION , FLORIDA STATUTES, THE TRANSPORTATION REGIONAL INCENTIVE PROGRAM (TRIP) SIS AND FIHS FACILITIES Limited Access Highway4 (Freeway) Controlled Access Highway4 TRIP FUNDED FACILITIES AND OTHER STATE ROADS3 Other Multilane4 Two-Lane4 Rural Areas B B1 B C Transitioning Urbanized Areas, Urban Areas, or Communities Urbanized Areas Under 500,000 Urbanized Areas Over 500,000 Roadways Parallel to Exclusive Transit Facilities C C C C C(D) C D D D(E) D D D E E E E Inside TCMAs D(E)2 E Inside TCEAs2 and MMTDs Level of service standards inside of parentheses apply to general use lanes only when exclusive through lanes exist. 1. For rural two-lane facilities, the standard is C. 2. Means the Department must be consulted as provided by Section (5), (7), or (15), Florida Statutes, regarding level of service standards set on SIS or TRIP facilities impacted by TCMAs, MMTDs, or TCEAs respectively. 3. Means the level of service standards for non TRIP facilities may be set by local governments in accordance with Rule 9J , F.A.C. 4. It is recognized that certain roadways (i.e., constrained roadways) will not be expanded by the addition of through lanes for physical, environmental, or policy reasons. In such instances, a variance to the level of service may be sought pursuant to Section , Florida Statutes. NOTE: Level of service letter designations are defined in the Department s 2002 Quality/Level of Service Handbook. (2) Specific assumptions and restrictions that apply to these minimum LOS standards are: (a) The minimum LOS standards represent the lowest acceptable operating conditions in the peak hour. (b) Definitions and measurement criteria used for the minimum LOS standards can be found in the Transportation Research Board s Highway Capacity Manual Special Report (c) When calculating or evaluating level of service pursuant to this rule, all calculations and evaluations shall be based on the methodology contained in Transportation Research Board s Highway Capacity Manual Special Report 2000, the Department s 2002 Quality/Level of Service Handbook, or a methodology determined by the Department to be of comparable reliability. Any methodology superseded by the Highway Capacity Manual 2000, such as a methodology based on the 1997 Highway Capacity Manual or Circular 212, shall not be used. (3) Minimum LOS Standards for SIS Connectors and TRIP Funded Facilities are: (a) Minimum LOS Standards for SIS Highways. 1. Limited access SIS highways shall adhere to the limited access FIHS LOS standards. 2. Controlled access SIS highways shall adhere to the controlled access FIHS LOS standards. 3. These standards shall apply regardless whether the facility is FIHS, SHS, or under other jurisdiction. (b) Minimum LOS Standards for SIS Connectors. The minimum LOS standard for SIS connectors shall be LOS D. (c) Minimum LOS Standards for Regionally Significant Roadways Funded by the TRIP. 1. Regionally significant roadways utilizing TRIP funding shall adhere to the Other State Roads Standards in Chapter 14-94, F.A.C. BS-9
50 2. These LOS standards apply to the TRIP funded portions of the roadway facilities extending to their logical termini for LOS analysis. Specific Authority (10), (2) FS. Law Implemented (10), (4), , (10)(a), (12), (19), (2), , FS. History New , Amended BS-10

51 FLORIDA STRATEGIC INTERMODAL SYSTEM (SIS) GAINESVILLE METROPOLITAN AREA Source: FDOT Strategic Intermodal System website- BS-11
52 [PAGE LEFT BLANK INTENTIONALLY] BS-12
53 METROPOLITAN PLANNING ORGANIZATION BM-1
54 [PAGE LEFT BLANK INTENTIONALLY] BM-2
55 METROPOLITAN TRANSPORTATION PLANNING ORGANIZATION LEVEL OF SERVICE STANDARDS BM-3
56 [PAGE LEFT BLANK INTENTIONALLY] BM-4
57 METROPOLITAN TRANSPORTATION PLANNING ORGANIZATION FOR THE GAINESVILLE URBANIZED AREA MINIMAL ACCEPTABLE HIGHWAY LEVEL OF SERVICE STANDARDS TYPE OF FACILITY STANDARD 1, 2, 3 URBANIZED TRANSITIONING 4 INTRASTATE OTHER STATE ROADS NONSTATE ROADS LIMITED ACCESS HIGHWAY C C CONTROLLED ACCESS C C OTHER MULTILANE D C TWO-LANE D D CITY-MAINTAINED FACILITIES E E COUNTY-MAINTAINED FACILITIES D D 1 Metropolitan Transportation Planning Organization Minimum Level of Service Standards for Highways were approved May 18, Except as specifically provided by FDOT and/or FDEO-negotiated MSVs, as incorporated in adopted local government comprehensive plans. 3 Except as specifically provided within any designated Dense Urban Land Area (DULA) and/or Transportation Concurrency Exception Area (TCEA). 4 There is one City-maintained transitioning roadway facility identified in this LOS Report. As the City annexes areas containing transitioning roadway facilities, highway LOS standards specified in the City s Comprehensive Plan Transportation Element shall apply. BM-5
58 [PAGE LEFT BLANK INTENTIONALLY] BM-6
59 APPENDIX C BICYCLE, PEDESTRIAN AND TRANSIT LEVEL OF SERVICE ANALYSES C-1
60 [PAGE LEFT BLANK INTENTIONALLY] C-2
61 DEFINITIONS Bicycle LOS- Bicycle LOS is defined in terms of the bicycle rider s perception of comfort and safety relative to automotive traffic in the roadway corridor. Bicycle LOS = a 1 ln(vol 15 /L n ) + a 2 SP t ( HV) 2 + a 3 (1/PR 5 )2 + a 4 (W e ) 2 + C where: Vol 15 = (ADT x D x Kd) / (4 x PHF) Volume of directional traffic in 15 minute time period where: ADT = Average Daily Traffic on the segment or link D = Directional Factor K d = Peak to Daily Factor PHF = Peak Hour Factor L n = Total number of directional lanes SP t = ln(sp p - 20) where: SP p = Posted Speed limit (a surrogate for average running speed) HV = percentage of heavy vehicles (as defined in the 1994 Highway Capacity Manual) PR 5 = FHWA s five point pavement surface condition rating W e = Average effective width of outside throughlane: where: W e = W v - (10 ft x % OSPA) and W l = 0 W e = W v + W l (1-2 x % OSPA) and W l > 0 & W ps = 0 W e = W v + W l - 2(10 x % OSPA) and W l > 0 & W ps = 0 & a bikelanes exists where: W t = total width of outside lane and shoulder pavement OSPA = percentage of segment with occupied onstreet parking W l = width of paving between the outside lane stripe & the edge of the pavement W ps = width of pavement striped for onstreet parking W v = effective width as a function of traffic volume and W v = W t if ADT > 4,000 vehicles/day W v = W t ( ADT) if ADT > 4,000 vehicles/day and if the street/road is undivided and unstriped A 1 = A 2 = A 3 = A 4 = C = (A 1 - A 4 are coefficients established by multivariate regression analysis) C-3
62 BICYCLE LEVEL OF SERVICE CATEGORIES LEVEL OF SERVICE BLOS SCORE A </= 1.5 B > 1.5 and </= 2.5 C > 2.5 and </= 3.5 D > 3.5 and </= 4.5 E > 4.5 and </= 5.5 F > 5.5 Source: Alachua Countywide Bicycle Master Plan, 2001 Pedestrian LOS- Pedestrian LOS is defined in terms of the bicycle rider s perception of comfort and safety relative to automotive traffic in the roadway corridor. Ped LOS = ln(w ol + W l +f p x %OSP + f b x W b + f sw x W s ) ln(vol 15 /L) SPD where: W ol = Width of outside lane W l = Width of shoulder or bikelane (feet) f p = Onstreet parking effect coefficient (=0.20) %OSP = percent of segment with onstreet parking f b = Buffer area baffier coefficient (=5.37 for trees spaced 20 feet on center) W b = Buffer width (distance between edge of pavement and sidewalk, feet) f sw = Sidewalk presence coefficient = 6-0.3W s W s = Width of sidewalk (feet) Vol 15 = Average traffic during a fifteen (15) minute period L = Total number of (through)lanes (for road or street) SPD = Average running speed of motor vehicle traffic (mi/hr) PEDESTRIAN LEVEL OF SERVICE CATEGORIES LEVEL OF SERVICE PLOS SCORE A </= 1.5 B > 1.5 and </= 2.5 C > 2.5 and </= 3.5 D > 3.5 and </= 4.5 E > 4.5 and </= 5.5 F > 5.5 Source: Modeling the Roadside Walking Environment: A Pedestrian Level of Service, TRB Paper No , 2001 The FDOT Generalized Tables and LOSPLAN software incorporate these LOS calculations into their respective LOS determinations. C-4
63 DATA COLLECTION AND ANALYSIS REQUIREMENTS All data shall be collected in accordance with the procedures in the latest available edition of the Q/LOS Handbook. Multimodal traffic study termini shall be consistent with the roadway facility termini established in the MTPO s LOS Report. The roadway facility(s) analyzed shall be identified in the traffic study. Roadway facility analysis shall be undertaken utilizing FDOT-approved analysis tools. These tools include, but are not limited to, FDOT s latest version of ARTPLAN, Highway Capacity Manual and Highway Capacity Software. Data collection and analysis requirements are identified below. BICYCLE LEVEL OF SERVICE ANALYSES Generalized Tables data collection requirements for determining the bicycle level of service of the roadway facilities within the Gainesville Metropolitan Area consist of field collection of designated instreet bicycle lanes, paved shoulders and adjacent offstreet bicycle/pedestrian trails. Roadway facilities with wide curblanes are not considered to have bicycle facilities. PEDESTRIAN LEVEL OF SERVICE ANALYSES Generalized Tables data collection requirements for determining the pedestrian level of service of the roadway facilities within the Gainesville Metropolitan Area consist of field collection of sidewalks and adjacent offstreet bicycle/pedestrian trails. TRANSIT LEVEL OF SERVICE ANALYSES Generalized Tables data collection requirements for determining the transit level of service of the roadway facilities within the Gainesville Metropolitan Area consist of field collection of sidewalks, adjacent offstreet bicycle/ pedestrian trails and bus frequency within the corridor. In addition, barriers to transit access are to be identified. TRAFFIC STUDY PROCEDURES Typically, if the determination of automotive/highway level of service for roadway facilities within the Gainesville Metropolitan Area is measured using the FDOT Generalized Tables, then bicycle, pedestrian and transit levels of service are also measured using the FDOT Generalized Tables; and if the determination of automotive/highway level of service for roadway facilities within the Gainesville Metropolitan Area is measured using the FDOT LOSPLAN software (ARTPLAN, HIGHPLAN or FREEPLAN), then bicycle, pedestrian and transit levels of service are also measured using FDOT LOSPLAN software (ARTPLAN, HIGHPLAN or FREEPLAN). For special circumstances, the Level of Service Technical Advisory will determine whether a roadway facility that is analyzed for automotive/highway level of service using the FDOT Generalized Tables is to be analyzed using FDOT LOSPLAN software (ARTPLAN, HIGHPLAN or FREEPLAN) to determine the corresponding bicycle, pedestrian and transit level of service. LOS REPORT TIER ONE ANALYZED BICYCLE, PEDESTRIAN AND TRANSIT FACILITIES Bicycle, pedestrian and transit level of service is determined by using the appropriate urban, transitioning, or rural area FDOT Generalized Table that is used for determining the automotive/highway level of service. Data requirements include the necessary field measurements and collection of information to utilize the FDOT Generalized Tables. C-5
64 LOS REPORT TIER TWO ANALYZED BICYCLE, PEDESTRIAN AND TRANSIT FACILITIES Bicycle, pedestrian and transit facility data collection shall be consistent with the criteria specified in the Q/LOS Handbook or criteria designated by FDOT District 2. Data requirements include the necessary field measurements and collection of information to utilize the FDOT LOSPLAN software. METHODOLOGY DETERMINING FACILITY LEVEL OF SERVICE The roadway facility s bicycle and pedestrian level of service is determined by the availability of bicycle facilities (bicycle lanes, paved shoulders and offstreet bicycle/pedestrian trails) and pedestrian facilities (sidewalks and offstreet bicycle/pedestrian trails) within the corridor. The roadway facility s transit level of service is determined by the availability of bus service and frequency within the corridor. LEVEL OF SERVICE ANALYSIS TECHNIQUES Tools for measuring bicycle, pedestrian and transit LOS have been developed. These include those developed by Sprinkle Consulting, Inc. and FDOT. FDOT has applied these analysis techniques into its Q/LOS Handbook. The simplest (and the least accurate) method is the use of the FDOT Generalized Tables. An intermediate level analysis can be performed using the LOSPLAN family software developed by the FDOT. All of these techniques are based on the Highway Capacity Manual Data collection shall be consistent with the criteria specified in the Q/LOS Handbook or criteria designated by FDOT District 2. TIER ONE LEVEL OF SERVICE ANALYSIS BICYCLE LEVEL OF SERVICE ANALYSES The Bicycle Mode Generalized Table evaluates level of service by measuring the percent coverage of bicycle lanes or paved shoulder in reference to automotive traffic volume per lane. PEDESTRIAN LEVEL OF SERVICE ANALYSES The Pedestrian Mode Generalized Table evaluates level of service by measuring the percent coverage of sidewalk coverage in reference to automotive traffic volume per lane. TRANSIT LEVEL OF SERVICE ANALYSES The Transit Mode Generalized Table evaluates level of service by measuring peak hour, peak direction bus frequency for the roadway facility dependent of the amount of sidewalk coverage along the facility. TIER TWO LEVEL OF SERVICE ANALYSIS For ARTPLAN analysis, localized data is entered for each segment to achieve a more accurate LOS estimate. Field data specific to the corridor being analyzed should be used. C-6
65 BICYCLE LEVEL OF SERVICE ANALYSES The Bicycle Mode ARTPLAN evaluates level of service at the facility and segment levels by pavement condition and the presence of wide outside curblane, paved shoulders and/or bicycle lanes in reference to automotive traffic volume per lane. PEDESTRIAN LEVEL OF SERVICE ANALYSES The Pedestrian Mode ARTPLAN evaluates level of service at the facility and segment levels by the presence, including percent coverage, of sidewalk facilities, amount of sidewalk/roadway separation and presence of sidewalk/roadway protective barrier in reference to automotive traffic volume per lane. Up to three subsegments per segment of this input data may be applied to this program. TRANSIT LEVEL OF SERVICE ANALYSES The Transit Mode ARTPLAN evaluates level of service at the facility and segment levels by the presence of obstacles to bus, span of service and peak hour, peak direction bus frequency for the roadway facility in reference to the amount of sidewalk coverage along the facility. VARIABLES USED TO PERFORM BICYCLE, PEDESTRIAN AND TRANSIT LOS ANALYSES TIER ONE LEVEL OF SERVICE ANALYSIS BICYCLE LEVEL OF SERVICE ANALYSES Percentage of paved shoulder/bicycle lane coverage per peak direction roadway lane traffic volume. PEDESTRIAN LEVEL OF SERVICE ANALYSES Percentage of sidewalk coverage per peak direction roadway lane traffic volume. TRANSIT LEVEL OF SERVICE ANALYSES Percentage of sidewalk coverage by amount of bus frequency at peak hour, peak direction. TIER TWO LEVEL OF SERVICE ANALYSIS ARTPLAN - MULTIMODAL FACILITY DATA (SCREEN ONE) CHARACTERISTICS BICYCLE LEVEL OF SERVICE ANALYSES Pave Shoulder/Bicycle Lane Present- Check box if there is a bicycle lane, pave shoulder within the roadway corridor Outside Lane Width- indicate whether the outside lane width is narrow, typical or wide; or enter the specific width Pavement Condition- indicate whether the pavement condition is desirable, typical or undesirable. C-7
66 PEDESTRIAN LEVEL OF SERVICE ANALYSES Sidewalk- indicate whether a sidewalk is present Sidewalk/Roadway Separation- indicate whether the sidewalk/roadway separation is adjacent, typical or wide. Sidewalk/Roadway Protective Barrier- indicate whether there is sidewalk/roadway protective barrier present. TRANSIT LEVEL OF SERVICE ANALYSES Bus Frequency (Buses per Hour)- indicate how may times buses pass through the corridor in the peak direction during the peak hour. Bus Span of Service (Hour per Day)- indicate how many hours of bus service per day for the corridor. Obstacle to Bus Stop- indicate that there is an obstacle to accessing the bus stop. ARTPLAN - MULTIMODAL SEGMENT DATA (SCREEN TWO) CHARACTERISTICS BICYCLE LEVEL OF SERVICE ANALYSES Pave Shoulder/Bicycle Lane Present- Check box if there is a bicycle lane, pave shoulder within the roadway corridor Outside Lane Width- indicate whether the outside lane width is narrow, typical or wide; or enter the specific width Pavement Condition- indicate whether the pavement condition is desirable, typical or undesirable. PEDESTRIAN LEVEL OF SERVICE ANALYSES Sidewalk- indicate whether a sidewalk is present Sidewalk/Roadway Separation- indicate whether the sidewalk/roadway separation is adjacent, typical or wide. Sidewalk/Roadway Protective Barrier- indicate whether there is sidewalk/roadway protective barrier present. TRANSIT LEVEL OF SERVICE ANALYSES Bus Frequency (Buses per Hour)- indicate how may times buses pass through the corridor in the peak direction during the peak hour. Bus Span of Service (Hour per Day)- indicate how many hours of bus service per day for the corridor. Obstacle to Bus Stop- indicate that there is an obstacle to accessing the bus stop. ARTPLAN - PEDESTRIAN SUBSEGMENT DATA (SCREEN THREE) CHARACTERISTICS PEDESTRIAN LEVEL OF SERVICE ANALYSES For evaluation of up to three subsegments of pedestrian facilities within the roadway corridor. Percentage (%) of Segment- indicate what percentage of the segment that the subsegment characteristics apply. C-8
67 Sidewalk- indicate whether a sidewalk is present Sidewalk/Roadway Separation- indicate whether the sidewalk/roadway separation is adjacent, typical or wide. Sidewalk/Roadway Protective Barrier- indicate whether there is sidewalk/roadway protective barrier present. RESULTS Tables 4 through 6 provide a multimodal level of service summary for automotive/highway, bicycle, pedestrian and transit modes. Table 4 provides the summary for the State-maintained arterials, Table 5 provides the summary for the Alachua County-maintained roads and Table 6 provides the summary for the City of Gainesville-maintained roads. In 2008, the Technical Advisory Committee Level of Service Subcommittee suspended MTPO Staff-updated Tier Two analyses due to concerns that data used are outdated. Field studies are still reviewed by the LOS Subcommittee for inclusion in the LOS Report. C-9
68 [PAGE LEFT BLANK INTENTIONALLY] C-10
69 APPENDIX D GENERALIZED ANNUAL AVERAGE DAILY VOLUMES D-1
70 [PAGE LEFT BLANK INTENTIONALLY] D-2
71 TABLE 1 Generalized Annual Average Daily Volumes for Florida s Urbanized Areas 1 10/4/10 STATE SIGNALIZED ARTERIALS Class I (>0.00 to 1.99 signalized intersections per mile) Lanes Median B C D E 2 Undivided 9,600 15,400 16,500 *** 4 Divided 29,300 35,500 36,700 *** 6 Divided 45,000 53,700 55,300 *** 8 Divided 60,800 71,800 73,800 *** Class II (2.00 to 4.50 signalized intersections per mile) Lanes Median B C D E 2 Undivided ** 10,500 15,200 16,200 4 Divided ** 25,000 33,200 35,100 6 Divided ** 39,000 50,300 53,100 8 Divided ** 53,100 67,300 70,900 Class III/IV (more than 4.5 signalized intersections per mile) Lanes Median B C D E 2 Undivided ** 5,100 11,900 14,900 4 Divided ** 12,600 28,200 31,900 6 Divided ** 19,700 43,700 48,200 8 Divided ** 27,000 59,500 64,700 Non-State Signalized Roadway Adjustments (Alter corresponding state volumes by the indicated percent.) Major City/County Roadways - 10% Other Signalized Roadways - 35% State & Non-State Signalized Roadway Adjustments (Alter corresponding state volumes by the indicated percent.) Divided/Undivided & Turn Lane Adjustments Exclusive Left Lanes Exclusive Right Lanes Adjustment Factors Lanes Median 2 Divided Yes No +5% 2 Undivided No No -20% Multi Undivided Yes No -5% Multi Undivided No No -25% Yes + 5% One-Way Facility Adjustment Multiply the corresponding two-directional volumes in this table by 0.6. FREEWAYS Lanes B C D E 4 43,500 59,800 73,600 79, ,300 90, , , , , , , , , , , , , , ,500 Freeway Adjustments Auxiliary Ramp Lanes Metering + 20, % UNINTERRUPTED FLOW HIGHWAYS Lanes Median B C D E 2 Undivided 7,800 15,600 22,200 27,900 4 Divided 34,300 49,600 64,300 72,800 6 Divided 51,500 74,400 96, ,400 Uninterrupted Flow Highway Adjustments Lanes Median Exclusive left lanes Adjustment factors 2 Divided Yes +5% Multi Undivided Yes -5% Multi Undivided No -25% BICYCLE MODE 2 (Multiply motorized vehicle volumes shown below by number of directional roadway lanes to determine two-way maximum service volumes.) Paved Shoulder/ Bicycle Lane Coverage B C D E 0-49% ** 3,200 12,100 >12, % 2,400 3,700 >3,700 *** % 6,300 >6,300 *** *** PEDESTRIAN MODE 2 (Multiply motorized vehicle volumes shown below by number of directional roadway lanes to determine two-way maximum service volumes.) Sidewalk Coverage B C D E 0-49% ** ** 5,000 14, % ** ** 11,300 18, % ** 11,400 18,800 >18,800 BUS MODE (Scheduled Fixed Route) 3 (Buses in peak hour in peak direction) Sidewalk Coverage B C D E 0-84% >5 >4 >3 > % >4 >3 >2 >1 1 Values shown are presented as two-way annual average daily volumes for levels of service and are for the automobile/truck modes unless specifically stated. Although presented as daily volumes, they actually represent peak hour direction conditions with applicable K and D factors applied. This table does not constitute a standard and should be used only for general planning applications. The computer models from which this table is derived should be used for more specific planning applications. The table and deriving computer models should not be used for corridor or intersection design, where more refined techniques exist. Calculations are based on planning applications of the Highway Capacity Manual, Bicycle LOS Model, Pedestrian LOS Model and Transit Capacity and Quality of Service Manual, respectively for the automobile/truck, bicycle, pedestrian and bus modes. 2 Level of service for the bicycle and pedestrian modes in this table is based on number of motorized vehicles, not number of bicyclists or pedestrians using the facility. 3 Buses per hour shown are only for the peak hour in the single direction of the higher traffic flow. ** Cannot be achieved using table input value defaults. *** Not applicable for that level of service letter grade. For the automobile mode, volumes greater than level of service D become F because intersection capacities have been reached. For the bicycle mode, the level of service letter grade (including F) is not achievable because there is no maximum vehicle volume threshold using table input value defaults. Source: Florida Department of Transportation Systems Planning Office 605 Suwannee Street, MS 19 Tallahassee, FL D FDOT QUALITY/LEVEL OF SERVICE HANDBOOK
72 TABLE 1 Generalized Annual Average Daily Volumes for Florida s Urbanized Areas (continued) Uninterrupted Flow Facilities INPUT VALUE ASSUMPTIONS 9/4/09 Interrupted Flow Facilities State Arterials Class II Bicycle Pedestrian Bus Class III Class II Class I Highways Freeways l l l l l l l l l l l n l 80 [n] r l n r n r n r r r y y n y n y n y n y n y n y n n, 50%,y t t y n n t ROADWAY CHARACTERISTICS Area type (l,o) l Number of through lanes 4-12 Posted speed (mph) 65 Free flow speed (mph) 70 Aux, meter, or accel/decel >1500 (n,y) n Median (n, nr, r) Terrain (l,r) l % no passing zone Exclusive left turn lanes /[impact](n, y) Exclusive right turn lanes (n, y) Paved shoulder/bicycle lane (n, y) Outside lane width Pavement condition Sidewalk (n, y) Sidewalk/roadway separation (a, t, w) Sidewalk protective barrier (n, y) Obstacle to bus stop (n, y) Facility length (mi) 4 Number of segments 4 n, 50%,y t n n,y n 2 TRAFFIC CHARACTERISTICS Planning analysis hour factor (K) Directional distribution factor (D) Peak hour factor (PHF) Base saturation flow rate (pcphpl) Heavy vehicle percent Local adjustment factor % left turns % right turns Bus span of service CONTROL CHARACTERISTICS Number of signals Arrival type (1-6) Signal type (a, s, p) Cycle length (C) Effective green ratio (g/c) Freeways Level of 2 3 a a s s s LEVEL OF SERVICE THRESHOLDS State & Non-State Signalized Arterials Highway Segments Two-Lane Multilane Class I Class II 10 4 s s s Bicycle Pedestrian Bus Class III Service Density %ffs Density ats ats ats Score Score Buses per hr. B C D E >0.833 >0.750 >0.667 > > 34 mph > 27 mph > 21 mph > 16 mph > 28 mph > 22 mph > 17 mph > 13 mph > 24 mph > 18 mph > 14 mph > 10 mph % ffs = Percent free flow speed ats = Average travel speed D-4
73 TABLE 7 Generalized Peak Hour Directional Volumes for Florida s Urbanized Areas 1 10/4/10 STATE SIGNALIZED ARTERIALS Class I (>0.00 to 1.99 signalized intersections per mile) Lanes Median B C D E 1 Undivided *** 2 Divided 1,560 1,890 1,960 *** 3 Divided 2,400 2,860 2,940 *** 4 Divided 3,240 3,830 3,940 *** Class II (2.00 to 4.50 signalized intersections per mile) Lanes Median B C D E 1 Undivided ** Divided ** 1,330 1,770 1,870 3 Divided ** 2,080 2,680 2,830 4 Divided ** 2,830 3,590 3,780 Class III/IV (more than 4.50 signalized intersections per mile) Lanes Median B C D E 1 Undivided ** Divided ** 670 1,500 1,700 3 Divided ** 1,050 2,330 2,570 4 Divided ** 1,440 3,170 3,450 Non-State Signalized Roadway Adjustments (Alter corresponding state volumes by the indicated percent.) Major City/County Roadways - 10% Other Signalized Roadways - 35% State & Non-State Signalized Roadway Adjustments (Alter corresponding state volumes by the indicated percent.) Divided/Undivided & Turn Lane Adjustments Exclusive Left Lanes Exclusive Right Lanes Adjustment Factors Lanes Median 2 Divided Yes No +5% 2 Undivided No No -20% Multi Undivided Yes No -5% Multi Undivided No No -25% Yes + 5% One-Way Facility Adjustment Multiply the corresponding volumes in this table by FREEWAYS Lanes B C D E 2 2,200 3,020 3,720 4, ,300 4,580 5,580 6, ,400 6,080 7,420 8, ,500 7,680 9,320 10, ,560 10,220 12,080 12,780 Freeway Adjustments Auxiliary Ramp Lanes Metering + 1, % UNINTERRUPTED FLOW HIGHWAYS Lanes Median B C D E 1 Undivided ,140 1,440 2 Divided 1,770 2,560 3,320 3,760 3 Divided 2,660 3,840 4,980 5,650 Uninterrupted Flow Highway Adjustments Lanes Median Exclusive left lanes Adjustment factors 2 Divided Yes +5% Multi Undivided Yes -5% Multi Undivided No -25% BICYCLE MODE 2 (Multiply motorized vehicle volumes shown below by number of directional roadway lanes to determine two-way maximum service volumes.) Paved Shoulder/ Bicycle Lane Coverage B C D E 0-49% ** > % >200 *** % 340 >340 *** *** PEDESTRIAN MODE 2 (Multiply motorized vehicle volumes shown below by number of directional roadway lanes to determine two-way maximum service volumes.) Sidewalk Coverage B C D E 0-49% ** ** % ** % ** >1000 BUS MODE (Scheduled Fixed Route) 3 (Buses in peak hour in peak direction) Sidewalk Coverage B C D E 0-84% >5 >4 >3 > % >4 >3 >2 >1 1 Values shown are presented as hourly directional volumes for levels of service and are for the automobile/truck modes unless specifically stated. To convert to annual average daily traffic volumes, these volumes must be divided by appropriate D and K factors. This table does not constitute a standard and should be used only for general planning applications. The computer models from which this table is derived should be used for more specific planning applications. The table and deriving computer models should not be used for corridor or intersection design, where more refined techniques exist. Calculations are based on planning applications of the Highway Capacity Manual, Bicycle LOS Model, Pedestrian LOS Model and Transit Capacity and Quality of Service Manual, respectively for the automobile/truck, bicycle, pedestrian and bus modes. 2 Level of service for the bicycle and pedestrian modes in this table is based on number of motorized vehicles, not number of bicyclists or pedestrians using the facility. 3 Buses per hour shown are only for the peak hour in the single direction of the higher traffic flow. ** Cannot be achieved using table input value defaults. *** Not applicable for that level of service letter grade. For the automobile mode, volumes greater than level of service D become F because intersection capacities have been reached. For the bicycle mode, the level of service letter grade (including F) is not achievable because there is no maximum vehicle volume threshold using table input value defaults. Source: Florida Department of Transportation Systems Planning Office 605 Suwannee Street, MS 19 Tallahassee, FL D-5
74 TABLE 7 Generalized Peak (continued) Hour Directional Volumes for Florida s Urbanized Areas Uninterrupted Flow Facilities INPUT VALUE ASSUMPTIONS 9/4/09 Interrupted Flow Facilities State Arterials Class II Bicycle Pedestrian Bus Class III Class II Class I Highways Freeways l l l l l l l l l l l n l 80 [n] r l n r n r n r r r y y n y n y n y n y n y n y n n, 50%,y t t y n n t ROADWAY CHARACTERISTICS Area type (l,o) Number of through lanes Posted speed (mph) Free flow speed (mph) Aux, meter, or accel/decel >1500 (n,y) Median (n, nr, r) Terrain (l,r) % no passing zone Exclusive left turn lanes /[impact](n, y) Exclusive right turn lanes (n, y) Paved shoulder/bicycle lane (n, y) Outside lane width Pavement condition Sidewalk (n, y) Sidewalk/roadway separation (a, t, w) Sidewalk protective barrier (n, y) Obstacle to bus stop (n, y) Facility length (mi) Number of segments l n l n, 50%,y t n n,y n 2 TRAFFIC CHARACTERISTICS Planning analysis hour factor (K) Directional distribution factor (D) Peak hour factor (PHF) Base saturation flow rate (pcphpl) Heavy vehicle percent Local adjustment factor % left turns % right turns Bus span of service CONTROL CHARACTERISTICS Number of signals Arrival type (1-6) Signal type (a, s, p) Cycle length (C) Effective green ratio (g/c) Freeways Level of 2 3 a a s s s LEVEL OF SERVICE THRESHOLDS State & Non-State Signalized Arterials Highway Segments Two-Lane Multilane Class I Class II 10 4 s s s Bicycle Pedestrian Bus Class III Service Density %ffs Density ats ats ats Score Score Buses per hr. B C D E >0.833 >0.750 >0.667 > > 34 mph > 27 mph > 21 mph > 16 mph > 28 mph > 22 mph > 17 mph > 13 mph > 24 mph > 18 mph > 14 mph > 10 mph % ffs = Percent free flow speed ats = Average travel speed D-6
75 TABLE 2 Generalized Annual Average Daily Volumes for Florida s Areas Transitioning into Urbanized Areas OR Areas Over 5,000 Not In Urbanized Areas 1 10/4/10 STATE SIGNALIZED ARTERIALS Class I (>0.00 to 1.99 signalized intersections per mile) Lanes Median B C D E 2 Undivided 8,900 14,100 15,200 *** 4 Divided 26,900 32,100 33,800 *** 6 Divided 41,500 48,600 51,000 *** Class II (2.00 to 4.50 signalized intersections per mile) Lanes Median B C D E 2 Undivided ** 9,400 13,700 14,700 4 Divided ** 22,700 30,000 31,700 6 Divided ** 35,700 45,400 47,800 Class III (more than 4.5 signalized intersections per mile) Lanes Median B C D E 2 Undivided ** 4,700 10,700 13,400 4 Divided ** 11,500 25,500 28,900 6 Divided ** 18,000 39,800 43,900 Non-State Signalized Roadway Adjustments (Alter corresponding state volumes by the indicated percent.) Major City/County Roadways - 10% Other Signalized Roadways - 35% State & Non-State Signalized Roadway Adjustments (Alter corresponding volume by the indicated percent.) Divided/Undivided & Turn Lane Adjustments Exclusive Left Lanes Exclusive Right Lanes Adjustment Factors Lanes Median 2 Divided Yes No +5% 2 Undivided No No -20% Multi Undivided Yes No -5% Multi Undivided No No -25% Yes + 5% One-Way Facility Adjustment Multiply the corresponding two-directional volumes in this table by 0.6. FREEWAYS Lanes B C D E 4 42,600 57,600 68,700 73, ,900 86, , , , , , , , , , ,800 Freeway Adjustments Auxiliary Ramp Lanes Metering + 20,000 +5% UNINTERRUPTED FLOW HIGHWAYS Lanes Median B C D E 2 Undivided 8,000 15,100 21,100 26,800 4 Divided 31,400 45,400 58,800 66,600 6 Divided 47,200 68,100 88, ,000 Uninterrupted Flow Highway Adjustments Lanes Median Exclusive left lanes Adjustment factors 2 Divided Yes +5% Multi Undivided Yes -5% Multi Undivided No -25% BICYCLE MODE 2 (Multiply motorized vehicle volumes shown below by number of directional roadway lanes to determine two-way maximum service volumes. Paved Shoulder/ Bicycle Lane Coverage B C D E 0-49% ** 2,800 7,300 >7, % 2,200 3,400 13,100 >13, % 4,100 >4,100 *** *** PEDESTRIAN MODE 2 (Multiply motorized vehicle volumes shown below by number of directional roadway lanes to determine two-way maximum service volumes.) Sidewalk Coverage B C D E 0-49% ** ** 5,000 14, % ** ** 11,300 18, % ** 11,400 18,800 >18,800 1 Values shown are presented as two-way annual average daily volumes for levels of service and are for the automobile/truck modes unless specifically stated. Although presented as daily volumes, they actually represent peak hour direction conditions with applicable K and D factors applied. This table does not constitute a standard and should be used only for general planning applications. The computer models from which this table is derived should be used for more specific planning applications. The table and deriving computer models should not be used for corridor or intersection design, where more refined techniques exist. Calculations are based on planning applications of the Highway Capacity Manual, Bicycle LOS Model, Pedestrian LOS Model and Transit Capacity and Quality of Service Manual, respectively for the automobile/truck, bicycle, pedestrian and bus modes. 2 Level of service for the bicycle and pedestrian modes in this table is based on number of motorized vehicles, not number of bicyclists or pedestrians using the facility. ** Cannot be achieved using table input value defaults. *** Not applicable for that level of service letter grade. For the automobile mode, volumes greater than level of service D become F because intersection capacities have been reached. For the bicycle mode, the level of service letter grade (including F) is not achievable because there is no maximum vehicle volume threshold using table input value defaults. Source: Florida Department of Transportation Systems Planning Office 605 Suwannee Street, MS 19 Tallahassee, FL D-7
76 Generalized Annual Average Daily Volumes for Florida s Areas Transitioning Into Urbanized Areas OR Areas over 5,000 Not in Urbanized Areas TABLE 2 (continued) Uninterrupted Flow Facilities INPUT VALUE ASSUMPTIONS n r n r n r r r y y n y n y n y n y n y n y n n,50%,y t t y n n t n,50%,y t n a a s s s s s s Number of Signals Arrival type (1-6) Signal type (a, s, p) Cycle length (C) Effective green ratio (g/c) Level of n r l 8 4 CONTROL CHARACTERISTICS Freeways Pedestrian Planning analysis hour factor (K) Directional distribution factor (D) Peak hour factor (PHF) Base capacity (pcphpl) Heavy vehicle percent Local adjustment factor % left turns % right turns Class II Bicycle TRAFFIC CHARACTERISTICS Class III l n n l 60 [n] Class II n Class I Number of through lanes Posted speed (mph) Free flow speed (mph) Aux, meter, or accel/decel >1500 (n,y) Median (n, nr, r) Terrain (l, r) % no passing zone Exclusive left turn lanes/[impact] (n, y) Exclusive right turn lanes (n, y) Paved shoulder/bicycle lane (n, y) Outside lane width Pavement condition Sidewalk (n, y) Sidewalk/roadway separation (a, t, w) Sidewalk protective barrier (n, y) Facility length (m) Number of segments Interrupted Flow Facilities State Arterials Highways Freeways ROADWAY CHARACATERISTICS 9/4/09 LEVEL OF SERVICE THRESHOLDS State & Non-State Two-Way Arterials Highway Segments Two-Lane Multilane Class I Class II 3.0 Bicycle Pedestrian Class III Service Density %ffs Density ats ats ats Score Score B C D E >0.833 >0.750 >0.667 > > 34 mph > 27 mph > 21 mph > 16 mph > 28 mph > 22 mph > 17 mph > 13 mph > 24 mph > 18 mph > 14 mph > 10 mph % ffs = Percent free flow speed ats = Average travel speed D-8
77 TABLE 8 Generalized Peak Hour Directional Volumes for Florida s Areas Transitioning into Urbanized Areas OR Areas Over 5,000 Not In Urbanized Areas 1 10/4/10 STATE SIGNALIZED ARTERIALS Class I (>0.00 to 1.99 signalized intersections per mile) Lanes Median B C D E 1 Undivided *** 2 Divided 1,430 1,710 1,800 *** 3 Divided 2,210 2,590 2,720 *** Class II (2.00 to 4.50 signalized intersections per mile) Lanes Median B C D E 1 Undivided ** Divided ** 1,210 1,600 1,690 3 Divided ** 1,900 2,420 2,550 Class III (more than 4.50 signalized intersections per mile) Lanes Median B C D E 1 Undivided ** Divided ** 610 1,360 1,540 3 Divided ** 960 2,120 2,340 Non-State Signalized Roadway Adjustments (Alter corresponding state volumes by the indicated percent.) Major City/County Roadways - 10% Other Signalized Roadways - 35% State & Non-State Signalized Roadway Adjustments (Alter corresponding volume by the indicated percent.) Divided/Undivided & Turn Lane Adjustments Exclusive Left Lanes Exclusive Right Lanes Adjustment Factors Lanes Median 2 Divided Yes No +5% 2 Undivided No No -20% Multi Undivided Yes No -5% Multi Undivided No No -25% Yes + 5% One-Way Facility Adjustment Multiply the corresponding volumes in this table by FREEWAYS Lanes B C D E 2 2,200 2,980 3,560 3, ,300 4,480 5,340 5, ,400 5,980 7,120 7, ,500 7,520 8,920 9,960 Freeway Adjustments Auxiliary Ramp Lanes Metering + 1,000 +5% UNINTERRUPTED FLOW HIGHWAYS Lanes Median B C D E 1 Undivided ,120 1,420 2 Divided 1,670 2,420 3,130 3,550 3 Divided 2,510 3,630 4,700 5,330 Uninterrupted Flow Highway Adjustments Lanes Median Exclusive left lanes Adjustment factors 2 Divided Yes +5% Multi Undivided Yes -5% Multi Undivided No -25% BICYCLE MODE 2 (Multiply motorized vehicle volumes shown below by number of directional roadway lanes to determine two-way maximum service volumes.) Paved Shoulder/ Bicycle Lane Coverage B C D E 0-49% ** > % > % 220 >220 ** ** PEDESTRIAN MODE 2 (Multiply motorized vehicle volumes shown below by number of directional roadway lanes to determine two-way maximum service volumes.) Sidewalk Coverage B C D E 0-49% ** ** % ** ** 600 1, % ** 610 1,000 >1,000 1 Values shown are presented as hourly directional volumes for levels of service and are for the automobile/truck modes unless specifically stated. To convert to annual average daily traffic volumes, these volumes must be divided by appropriate D and K factors. This table does not constitute a standard and should be used only for general planning applications. The computer models from which this table is derived should be used for more specific planning applications. The table and deriving computer models should not be used for corridor or intersection design, where more refined techniques exist. Calculations are based on planning applications of the Highway Capacity Manual, Bicycle LOS Model, Pedestrian LOS Model and Transit Capacity and Quality of Service Manual, respectively for the automobile/truck, bicycle, pedestrian and bus modes. 2 Level of service for the bicycle and pedestrian modes in this table is based on number of motorized vehicles, not number of bicyclists or pedestrians using the facility. 3 Buses per hour shown are only for the peak hour in the single direction of the higher traffic flow. ** Cannot be achieved using table input value defaults. *** Not applicable for that level of service letter grade. For the automobile mode, volumes greater than level of service D become F because intersection capacities have been reached. For the bicycle mode, the level of service letter grade (including F) is not achievable because there is no maximum vehicle volume threshold using table input value defaults. Source: Florida Department of Transportation Systems Planning Office 605 Suwannee Street, MS 19 Tallahassee, FL D-9
78 Generalized Peak Hour Directional Volumes for Florida s Areas Transitioning Into Urbanized Areas OR Areas over 5,000 Not in Urbanized Areas TABLE 8 (continued) Uninterrupted Flow Facilities INPUT VALUE ASSUMPTIONS n r n r n r r r y y n y n y n y n y n y n y n n,50%,y t t y n n t a a s s s s s s Number of Signals Arrival type (1-6) Signal type (a, s, p) Cycle length (C) Effective green ratio (g/c) Level of n r l n,50%,y t n 2 CONTROL CHARACTERISTICS Freeways Pedestrian Planning analysis hour factor (K) Directional distribution factor (D) Peak hour factor (PHF) Base capacity (pcphpl) Heavy vehicle percent Local adjustment factor % left turns % right turns Class II Bicycle TRAFFIC CHARACTERISTICS Class III l n n l 60 [n] Class II n Class I Number of through lanes Posted speed (mph) Free flow speed (mph) Aux, meter, or accel/decel >1500 (n,y) Median (n, nr, r) Terrain (l, r) % no passing zone Exclusive left turn lanes/[impact] (n, y) Exclusive right turn lanes (n, y) Paved shoulder/bicycle lane (n, y) Outside lane width Pavement condition Sidewalk (n, y) Sidewalk/roadway separation (a, t, w) Sidewalk protective barrier (n, y) Facility length (m) Number of segments Interrupted Flow Facilities State Arterials Highways Freeways ROADWAY CHARACATERISTICS 9/4/09 LEVEL OF SERVICE THRESHOLDS State & Non-State Two-Way Arterials Highway Segments Two-Lane Multilane Class I Class II Bicycle Pedestrian Class III Service Density %ffs Density ats ats ats Score Score B C D E >0.833 >0.750 >0.667 > > 34 mph > 27 mph > 21 mph > 16 mph > 28 mph > 22 mph > 17 mph > 13 mph > 24 mph > 18 mph > 14 mph > 10 mph % ffs = Percent free flow speed ats = Average travel speed D-10
79 APPENDIX E ARTPLAN ANALYSES FOR DISTRESSED ARTERIALS E-1
80 [PAGE LEFT BLANK INTENTIONALLY] E-2
81 STATE MAINTAINED ARTERIALS [RESERVED] MTPO Staff-Updated Tier Two Analyses Suspended in 2008 ES-1
82 [PAGE LEFT BLANK INTENTIONALLY] ES-2
83 ALACHUA COUNTY ARTERIALS [RESERVED] MTPO Staff-Updated Tier Two Analyses Suspended in 2008 EA-1
84 [PAGE LEFT BLANK INTENTIONALLY] EA-2
85 CITY OF GAINESVILLE ARTERIALS [RESERVED] MTPO Staff-Updated Tier Two Analyses Suspended in 2008 EG-1
86 [PAGE LEFT BLANK INTENTIONALLY] EG-2
87 APPENDIX F HIGHWAY CAPACITY MANUAL SOFTWARE ANALYSES FOR DISTRESSED ARTERIALS F-1
88 [PAGE LEFT BLANK INTENTIONALLY] F-2
89 STATE MAINTAINED ARTERIALS [RESERVED] MTPO Staff-Updated Tier Two Analyses Suspended in 2008 FS-1
90 [PAGE LEFT BLANK INTENTIONALLY] FS-2
91 ALACHUA COUNTY ARTERIALS [RESERVED] MTPO Staff-Updated Tier Two Analyses Suspended in 2008 FA-1
92 [PAGE LEFT BLANK INTENTIONALLY] FA-2
93 CITY OF GAINESVILLE ARTERIALS [RESERVED] MTPO Staff-Updated Tier Two Analyses Suspended in 2008 FG-1
94 [PAGE LEFT BLANK INTENTIONALLY] FG-2
95 APPENDIX G AVERAGE ANNUAL DAILY TRAFFIC (AADT) COUNTS G-1
96 [PAGE LEFT BLANK INTENTIONALLY] G-2
97 STATE MAINTAINED ARTERIALS GS-1
98 [PAGE LEFT BLANK INTENTIONALLY] GS-2
99 YEARLY TRAFFIC COUNTS - STATE ROADS S-1 US 441 FROM PAYNE'S PRAIRIE TO SR ,250 SOUTH OF ROCKY PT. RD ,800 11,800 SOUTH OF SR ,700 12,700 S-2 US 441 FROM SR 331 TO SR 24 18,800 SOUTH OF BIVENS ARM ,500 17,500 SOUTH OF SW 16TH AVE ,000 23,000 SOUTH OF SR ,800 18,800 S-3 US 441 FROM SR 24 TO SR 26 35,000 SOUTH OF SW 8TH AVE ,000 35,000 NORTH OF SW 2ND AVE S-4 US 441 FROM SR 26 TO NW 29TH RD 29,500 NORTH OF UNIVERSITY AVE ,500 27,500 SOUTH OF 8TH AVENUE ,000 28,000 SOUTH OF 16TH AVENUE ,500 29,500 NORTH OF NW 16TH AVE 2065* 29,092 29,092 SOUTH OF NW 23RD AVE ,500 30,500 NORTH OF NW 23RD AVE ,500 29,500 NORTH OF NW 23RD AVE 2066* 30,106 30,106 S-5 US 441 FROM NW 29TH RD TO NW 23RD ST 24,000 SOUTH OF 39TH AVE ,000 26,000 SOUTH OF NW 6TH ST ,400 16,400 NORTH OF NW 6TH ST ,500 25,500 SOUTH OF SR ,500 22,500 S-6 SR 20 (NW 6TH ST) FROM NW 8TH AVE TO SR ,900 NORTH OF NW 8TH AVE ,700 15,700 SOUTH OF NW 16TH AVE ,600 15,600 NORTH OF NW 16TH AVE ,900 14,900 NORTH OF NW 16TH AVE 2003* INACTIVE SOUTH OF NW 23RD AVE 6099 INACTIVE NORTH OF NW 23RD AVE ,600 12,600 SOUTH OF SR ,200 10,200 S-7 SR 20 (NW 6TH ST) FROM SR 222 TO US 441 8,900 SOUTH OF US ,900 8,900 GS-3
100 S-8 SR 20 FROM SR 331/SR24 TO SE 43RD ST 14,000 EAST OF SR 331/SR ,000 27,000 SOUTH OF SR * INACTIVE WEST OF SE 15TH ST ,500 13,500 EAST OF SE 15TH ST ,600 13,600 WEST OF SE 27TH ST ,500 16,500 EAST OF SE 27TH ST ,000 14,000 S-9 SR 24 FROM SW 75TH ST (TOWER RD) TO I-75 26,250 EAST OF SW 75TH ST 6053 INACTIVE EAST OF SW 63RD BLVD ,000 25,000 WEST OF I ,500 27,500 S-10 SR 24 FROM I-75 TO SW 34TH ST 48,510 EAST OF I ,500 46,500 WEST OF SR 121 STUDY 48,510 " 48,510 WEST OF SR ,500 49,500 S-11 SR 24 FROM SW 16TH AVE TO US ,000 EAST OF SW 16TH AVENUE STUDY 37,510 " 37,510 EAST OF SW 16TH AVENUE ,500 37,500 EAST OF GALE LEMERAND DRIVE STUDY 31,970 " 31,970 EAST OF GALE LEMERAND DRIVE ,000 30,000 EAST OF CENTER DRIVE STUDY 29,300 " 29,300 EAST OF NEWELL DRIVE STUDY 28,350 " 28,350 WEST OF US ,500 24,500 S-12 SR 24 (WALDO ROAD) SR 26 TO SR ,877 NORTH OF SR ,500 24,500 SOUTH OF NE 16TH AVE ,500 26,500 SOUTH OF NE 23RD AVE ,253 25,253 SOUTH OF NE 23RD AVE 6117 INACTIVE NORTH OF NE 23RD AVE ,500 21,500 S-13 SR 24 (WALDO ROAD) SR 222 TO NE 77TH AVE 15,400 NORTH OF SR ,000 16,000 NORTH OF NE 53RD AVE ,800 14,800 S-14 SR 26 FROM NW 122ND ST TO INTERSTATE-75 [WEST RAMP] 38,500 WEST OF NW 75TH ST ,500 28,500 EAST OF NW 75TH ST ,500 48,500 GS-4
101 S-15 SR 26 FROM INTERSTATE-75 [WEST RAMP] TO NW 8TH AVE 48,500 EAST OF NW 69TH ST ,500 48,500 EAST OF HOSPITAL ,500 47,500 EAST OF NW 62ND ST ,000 52,000 S-16 SR 26 FROM NW 8TH AV TO SR 121 (NW 34TH ST) 31,500 WEST OF NW 43RD ST ,000 28,000 WEST OF NW 39TH RD ,000 35,000 EAST OF NW 39TH RD ,500 35,500 WEST OF SR ,500 23,500 S-17 SR 26 FROM SR121 TO GALE LEMERAND DR 23,000 EAST OF SR ,000 23,000 WEST OF NW 22ND ST ,000 23,000 S-18 SR26 FROM GALE LEMERAND DR TO US 441 (W 13TH ST) 28,500 EAST OF GALE LEMERAND DR 6027 INACTIVE WEST OF 13TH ST ,500 28,500 S-19 SR 26 FROM US 441 TO TO SR 24 (WALDO RD) 21,500 WEST OF W 12TH ST ,000 27,000 WEST OF W 6TH ST ,000 24,000 WEST OF W 3RD ST ,000 22,000 EAST OF E MAIN ST ,000 21,000 WEST OF E 3RD ST 6032 INACTIVE EAST OF E 9TH ST ,500 18,500 WEST OF SR 331/SR ,900 19,900 S-20 SR 26 FROM SR 20 (HAWTHORNE RD) TO CR329B (LAKESHORE DR) 8,600 WEST OF E 15TH ST 1004 INACTIVE WEST OF E 15TH ST ,500 8,500 EAST OF E 15TH ST ,000 10,000 EAST OF E 25TH ST ,600 8,600 S-21 SR 26A FROM SR 26 (NEWBERRY RD) TO SR 121 (W 34TH ST) 15,000 WEST OF W 38TH ST ,000 15,000 GS-5
102 S-22 SR 26A FROM SR 121 (W 34TH ST) TO SR 26 (W UNIVERSITY AV) 12,850 EAST OF SR ,600 14,600 EAST OF SW 23RD ST ,100 11,100 SOUTH OF SR * - INACTIVE S-23 SR 121 (W 34TH ST) FROM SR 331 (WILLISTON RD) TO SR 24 (SW ARCHER RD) 25,522 NORTH OF SR ,900 18,900 SOUTH OF SR ,144 32,144 S-24 SR 121 (W 34TH ST) FROM SR 24 (SW ARCHER RD) TO SR 26 (W UNIVERSITY AV) 40,750 SOUTH OF SW 20TH AV ,000 41,000 NORTH OF SW 20TH AV ,000 44,000 NORTH OF RADIO RD ,500 40,500 SOUTH OF SR 26A 4009 INACTIVE SOUTH OF SR ,500 23,500 S-25 SR 121 (W 34TH ST) FROM SR 26 TO NW 16TH AV 18,200 NORTH OF SR ,400 20,400 SOUTH OF NW 16TH AV ,000 16,000 S-26 SR 121 (W 34TH ST) FROM NW 16TH AV TO SR 222 (NW 39TH AV) 14,750 NORTH OF NW 16TH AV ,000 15,000 NORTH OF NW 16TH AV 2012* INACTIVE SOUTH OF NW 31ST BD ,500 14,500 S-27 SR 121 FROM SR 222 (NW 39TH AVE) TO NW 53RD AVE 14,800 NORTH OF SR ,800 14,800 NORTH OF NW 45TH AV 6140 INACTIVE NORTH OF NW 45TH AV 2002 INACTIVE S-28 SR 121 FROM US 441 TO CR 231 9,935 NORTH OF US ,500 13,500 NORTH OF US INACTIVE NORTH OF US ,369 6,369 S-29 SR 222 (N 39TH AV) FROM NW 98TH ST TO NW 83RD ST 20,793 EAST OF NW 98TH ST new 12,085 12,085 WEST OF NW 91ST ST ,500 29,500 GS-6
103 S-30 SR 222 (N 39TH AV) FROM US 441 (NW 13TH ST) TO SR 24 (WALDO RD) 16,400 EAST OF US ,800 19,800 EAST OF NW 6TH ST ,500 21,500 EAST OF CR 329 (N MAIN ST) ,400 16,400 EAST OF CR 329 (N MAIN ST) 3014* INACTIVE WEST OF NE 15TH ST ,000 16,000 WEST OF SR ,200 14,200 S-31 SR 222 (N 39TH AV) FRON SR 24 (WALDO RD) TO AIRPORT ENTRANCE 13,500 EAST OF SR ,500 13,500 S-32 SR 222 (N 39TH AV) FROM AIRPORT ENTRANCE TO GMA BOUNDARY 9,900 EAST OF SR ,500 13,500 WEST OF SR ,300 6,300 WEST OF SR INACTIVE S-33 SR 226 (S 16TH AV) FROM SR 24 (SW ARCHER RD) TO US 441 (SW 13TH ST) 20,100 EAST OF SR ,300 20,300 EAST OF SR 24 STUDY 19,900 " 19,900 EAST OF SHEALY DRIVE STUDY 19,720 " 19,720 EAST OF VA HOSPITAL DRIVE STUDY 19,260 " 19,260 WEST OF US 441 STUDY 20,440 " 20,440 WEST OF US ,800 20,800 S-34 SR 226 (S 16TH AV) FROM US 441 (SW 13TH ST) TO SR 329 (S MAIN ST) 17,300 EAST OF US ,500 18, INACTIVE WEST OF SR ,100 16,100 S-35 SR 226 (S 16TH AV) FROM SR 329 (S MAIN ST) TO SR 331 (WILLISTON RD) 8, INACTIVE EAST OF SR ,200 8,200 S-36 SR 120A (N 23RD AV) FROM US 441 (N 13TH ST) TO SR 24 (WALDO RD) 12,900 EAST OF US ,800 13,800 EAST OF NW 6TH AV ,400 13,400 WEST OF NE 7TH ST ,900 12,900 WEST OF NE 15TH ST 3023 INACTIVE WEST OF NE 15TH ST ,300 10,300 EAST OF NE 15TH ST ,800 7,800 GS-7
104 S-37 SR 329 (MAIN ST) FROM SR 26 (UNIVERSITY AV) TO N 8TH AV 15,050 NORTH OF SR 26 (UNIVERSITY AV) ,500 12,500 SOUTH OF N 8TH AV ,600 17,600 S-38 SR 331/SR 121 FROM I-75 TO US 441 (SW 13TH ST) 25,250 EAST OF SR 121 (SW 34TH ST) ,500 25,500 WEST OF US ,000 25,000 S-39 SR 331 (WILLISTON RD) FROM US 441 (SW 13TH ST) TO SR 26 (UNIVERSITY AV) 19,200 EAST OF US ,200 18,200 SOUTH OF S 16TH AV ,800 14,800 WEST OF SE 4TH ST ,500 22,500 SOUTH OF SE 4TH AV s5503 INACTIVE NORTH OF SE 4TH AV ,800 19,800 SOUTH OF SR ,200 19,200 S-40 SR 20 (NW 8TH AV) FROM NW 6TH ST TO N MAIN ST 16,500 EAST OF NW 6TH ST ,500 16,500 WEST OF N MAIN ST 6019 INACTIVE S-41 I-75 FROM SR331/SR121 (WILLISTON RD) TO SR 24 (SW ARCHER RD) 62,000 NORTH OF SR331/SR ,000 62,000 S-42 I-75 FROM SR 24 (SW ARCHER RD) TO SR 26 (NEWBERRY RD) 71,500 SOUTH OF SR ,500 71,500 S-43 I-75 FROM SR 26 (NEWBERRY RD) TO SR 222 (NW 39TH AV) 66,500 NORTH OF SR ,500 66,500 S-44 SR 121 FROM SW 85TH AV TO I-75 8,300 NORTH OF CR 22A ,300 8,300 S-45 SR 26 (NEWBERRY RD) FROM NW 154TH ST TO NW 122ND ST 16,650 WEST OF NW 143RD ST ,100 13,100 EAST OF NW 143RD ST ,200 20,200 GS-8
105 S-46 SR 26 (NE 55TH BLVD) FROM CR 329B TO CITY LIMIT 4,900 NORTH OF CR 329B ,900 4,900 S-47 SR 24 (SW ARCHER RD) FROM SW 91ST ST TO SW 75TH ST (TOWER RD) 18,500 WEST OF SW 75TH ST ,500 18,500 S-48 SR 20 (HAWTHORNE RD) FROM SE 43RD ST TO CR 329B (LAKESHORE DR) 11,600 EAST OF SE 27TH ST ,000 14,000 EAST OF CR 329B ,200 9,200 S-49 SR 20 (HAWTHORNE RD) FROM CR 329B (LAKESHORE DR) TO CR ,200 EAST OF CR 329B ,200 9,200 S-50 US 441 FROM NW 23RD ST TO GAINESVILLE METROPOLITAN AREA BOUNDARY 17,700 NORTH OF NW 23RD ST ,700 17,700 S-51 I-75 FROM GAINESVILLE METROPOLITAN AREA BOUNDARY TO WILLISTON RD 61,367 SOUTH OF WILLISTON RD ,367 61,367 S-52 I-75 FROM NW 39TH AVE TO GAINESVILLE METROPOLITAN AREA BOUNDARY 54,000 NORTH OF NW 39TH AVE ,000 54,000 S-53 SR 222 (N 39TH AV) FROM NW 51ST ST TO US 441 (W 13TH ST) 26,500 WEST OF NW 43RD ST ,000 34,000 EAST OF NW 43RD ST ,500 31,500 EAST OF SR ,500 26,500 EAST OF SR * INACTIVE EAST OF NW 24TH BD ,000 25,000 WEST OF NW 13TH ST ,000 25,000 S-54 SR 121 FROM CR 232 (NW 53RD AVE) TO US 441 9,400 SOUTH OF US ,400 9,400 SOUTH OF US INACTIVE GS-9
106 S-55 SR 24 FROM SR 121 (SW 34TH ST) TO SR 226 (SW 16TH AV) 52,250 EAST OF SR 121 STUDY - " - EAST OF SR ,000 48,000 WEST OF SR ,500 56,500 S-56 SR 222 (N 39TH AV) FROM NW 83RD ST TO NW 51ST ST 28,500 EAST OF NW 83RD ST ,500 28,500 EAST OF NW 83RD ST 7018 INACTIVE t\mike\los\los11\s2010gt.xlsx * LOCAL GOVERNMENT COUNT ON STATE-MAINTAINED ROAD WITH FACTORED COUNTS ^ THESE TRAFFIC COUNTS ARE AVERAGED TO DETERMINE COUNT " STUDY TRAFFIC COUNT ADJUSTED EXTRAPOLATION GS-10
107 ALACHUA COUNTY ARTERIALS GA-1
108 [PAGE LEFT BLANK INTENTIONALLY] GA-2
109 YEARLY TRAFFIC COUNTS - COUNTY ROADS A-1 NW 53RD AV (CR 232) FROM NW 52ND TR TO NW 13TH ST (US 441) 12,037 AC-010 WEST OF NW 43RD ST ,995 10,995 WEST OF NW 34TH ST (SR 121) ,546 15,546 EAST OF NW 34TH ST (SR 121) ,230 12,230 WEST OF US ,844 < 11,844 A-2 NW 53RD (CR 232) FROM NW 13TH ST (US 441) TO WALDO RD (SR 24) 12,558 AC-005 WEST OF N MAIN ST (CR 329) ,946 12,946 WEST OF NE 15TH ST ,558 12,558 WEST OF WALDO RD (SR 24) ,963 10,963 A-3 NW 43RD ST FROM NEWBERRY RD (SR 26) TO NW 53RD AV (SR 232) 27,131 AC-025 NORTH OF SR ,485 13,485 NORTH OF NW 8TH AV 6066 INACTIVE NORTH OF NW 8TH AV ,316 27,316 NORTH OF NW 8TH AV ,131 27,131 SOUTH OF NW 23RD AV ,625 26,625 NORTH OF NW 23RD AV 6065 INACTIVE NORTH OF NW 23RD AV 2060 INACTIVE NORTH OF NW 23RD AV 2005 INACTIVE SOUTH OF NW 39TH AV ,056 30,056 NORTH OF NW 39TH AV 6064 INACTIVE NORTH OF NW 39TH AV ,533 29,533 NORTH OF NW 39TH AV ,360 23,360 A-6 NW 43RD ST FROM NW 53RD AV (SR 232) TO US ,802 AC-030 NORTH OF NW 53RD AVE ,110 16,110 NORTH OF NW 53RD AVE - 14,702 14,702 NORTH OF SAN FELASCO PARK RD - 4,775 < 4,775 SOUTH OF NW 93RD AV - - INACTIVE NORTH OF NW 93RD AV - - INACTIVE SOUTH OF US ,902 6,902 A-9 NW 23RD AV FROM NW 98TH ST TO NW 55TH ST 15,770 AC-040 EAST OF NW 98TH ST ,476 7,476 WEST OF INTERSTATE 75 16,138 16,138 EAST OF NW 83RD STREET 15,897 15,897 WEST OF NW 55TH ST ,643 15,643 A-10 NW 23RD AV FROM NW 55TH ST TO NW 43RD ST 20,821 AC-035 EAST OF NW 51ST ST 2008 INACTIVE WEST OF NW 43RD ST ,821 20,821 GA-3
110 A-11 NW 16TH AV FROM NW 43RD ST TO NW 13TH ST (US 441) 20,451 EAST OF NW 43RD ST ,209 21,209 EAST OF NW 38TH ST ,693 19,693 WEST 0F NW 22ND ST ,749 < 13,749 EAST 0F NW 22ND ST 2089 INACTIVE EAST OF NW 18TH TR ,842 < 22,842 A-12 NW 16TH AV FROM NW 13TH ST (US 441) TO SR 24 (WALDO RD) 12,127 EAST OF NW 13TH ST 2088 INACTIVE EAST OF NW 10TH ST ,876 < 11,876 EAST OF NW 6TH ST ,378 < 12,378 WEST OF N MAIN ST 2087 INACTIVE EAST OF NE 2ND ST ,694 12,694 WEST OF NE 12TH ST ,669 9,669 WEST OF WALDO RD 3030 INACTIVE A-13 SW 75TH ST FROM SR 24 (SW ARCHER RD) TO SW 8TH AV 14,055 AC-090 NORTH OF SR 24 (ARCHER RD) ,055 14,055 SOUTH OF SW 24TH AV ,548 13,548 NORTH OF SW 24TH AV ,258 15,258 A-14 W 75TH ST FROM SW 8TH AV TO SR 26 (NEWBERRY RD) 22,973 AC-085 SOUTH OF SR 26 (NEWBERRY RD) ,418 18,418 NORTH OF W. UNIVERSITY AV 22,973 22,973 SOUTH OF W. UNIVERSITY AV 24,859 24,859 A-15 SW 20TH AV FROM SW 75TH ST TO SW 62ND BD 14,856 AC-060 EAST OF SW 75TH ST ,856 14,856 A-16 SW 20TH AV FROM SW 62ND BD TO SW 34 ST (SR 121) 21,524 AC-055 EAST OF SW 62ND BD ,487 < 25,487 WEST OF SW 34TH ST ,560 < 17,560 A-17 N MAIN ST (CR 329) FROM N 8TH AV TO N 23RD AV 13,646 NORTH OF N 8TH AV ,958 < 12,958 NORTH OF N 10TH AV ,694 < 16,694 NORTH OF N 16TH AV ,646 < 13,646 SOUTH OF N 23RD ST 6103 INACTIVE GA-4
111 A-18 N MAIN ST (CR 329) FROM N 23RD AV TO N 39TH AV (SR 222) 15,265 NORTH OF N 23RD AV ,584 17,584 NORTH OF N 23RD AV 6102 INACTIVE SOUTH OF N 31ST AV 1005 INACTIVE SOUTH OF N 39TH AV 6101 INACTIVE SOUTH OF N 31ST ST ,946 12,946 A-19 NW 39TH AV (SR 222) FROM NW 110TH ST TO NW 98TH STREET 11,389 AC-095 WEST OF INTERSTATE ,389 11,389 EAST OF NW 98TH ST - INACTIVE A-20 SW 24TH AV FROM SW 91ST ST TO SW 75TH ST 11,122 AC-065 WEST OF SW 75TH ST ,122 11,122 A-21 NW 51ST ST FROM NW 23RD AV TO NW 39TH AV (SR 222) 8,896 AC-120 SOUTH OF NW 39TH AV ,032 10,032 NORTH OF 23RD AV ,760 < 7,760 A-22 NW 98TH ST FROM SR 26 (NEWBERRY RD) TO SR 222 (NW 39TH AV) 10,289 AC-110 NORTH OF SR ,589 11,589 SOUTH OF SR ,988 8,988 A-23 NW 83RD ST FROM NW 23RD AV TO NW 39TH AV (SR 222) 14,157 AC-130 NORTH OF NW 23RD AV ,660 14,660 SOUTH OF NW 39TH AV ,654 13,654 A-24 W 91ST ST FROM SW 24TH AV TO NEWBERRY RD (SR 26) 7,708 AC-165 SOUTH OF NEWBERRY RD ,808 7,808 NORTH OF SW 24TH AV ,608 7,608 A-25 NW 39TH RD FROM NEWBERRY RD (SR 26) TO NW 8TH AV - NORTH OF SR INACTIVE A-26 SW 8TH AV FROM SW 91ST ST TO SW 75TH ST 4,679 AC-140 WEST OF SW 75TH ST ,679 4,679 GA-5
112 A-28 ROCKY POINT RD FROM WILLISTON RD (SR 331) TO SW 13TH ST (US 441) 3,220 AC-275 SOUTH OF WILLISTON RD (SR 331) ,220 3,220 WEST OF SW 13TH ST 6131 INACTIVE A-29 KINCAID LOOP FROM HAWTHORNE RD (SR 20) TO HAWTHORNE RD (SR 20) 3,926 AC-280 SOUTH OF HAWTHORNE RD ,926 < 3,926 NORTH OF SE 7TH AV 5027 INACTIVE NORTH OF SE 7TH AV ,457 < 4,457 SOUTH OF SE 7TH AV ,046 < 7,046 NORTH OF SE 22ND AV 5021 INACTIVE SOUTH OF SE 22ND AV ,681 < 3,681 SOUTH OF SE 22ND AV 6126 INACTIVE NORTH OF SE 22ND AV 6127 INACTIVE SOUTH OF HAWTHORNE RD ,771 2,771 A-30 SW 40TH BD/SW 42ND ST/SW 43RD ST FROM SW ARCHER RD TO SW 20TH AV 11,451 AC-400 COUNT LOCATION NUMBER 2008 AADT NORTH OF ARCHER RD STUDY 8,178 8,178 SOUTH OF SW 33PL ,602 7,602 NORTH OF SW 33RD PL N+S 15,160 15,160 SOUTH OF SW 20TH AV N+S 14,723 14,723 A-31 MONTEOCHA RD (NE 38TH ST) FROM NE 53RD AV TO TO NE 77TH AV 2,826 AC-285 NORTH OF 53RD AV 6113 INACTIVE NORTH OF 53RD AV ,826 2,826 A-32 NW 143RD ST (CR 241) FROM NEWBERRY RD (SR 26) TO GMA BOUNDARY 10,408 AC-240 NORTH OF NEWBERRY RD N+S 10,003 10,003 SOUTH OF MILLHOPPER RD N+S 10,813 < 10,813 A-33 SW 24TH AV FROM SW 122ND ST TO SW 91ST ST 6,497 AC-070 EAST OF SW 122ND ST ,755 4,755 WEST OF SW 91ST ST ,239 8,239 A-34 NW 53RD AV (MILLHOPPER RD) FROM GMA BOUNDARY TO NW 52ND TERR. 5,861 AC-015 EAST OF I ,987 2,987 EAST OF 52ND AVE ,735 8,735 A-35 W 122ND ST FROM GMA BOUNDARY TO NEWBERRY RD (SR 26) 6,931 AC-210 SOUTH OF SW 24TH AV ,406 4,406 NORTH OF SW 24TH AV ,931 6,931 SOUTH OF NEWBERRY RD ,020 8,020 GA-6
113 A-36 SW 8TH AV FROM SW 122ND ST TO SW 91ST ST 1,998 AC-145 EAST OF SW 122ND ST ,998 1,998 A-37 NW 39TH AV FROM W 143RD ST (CR 241) TO NW 110TH ST 9,549 AC-100 WEST OF I-75-9,549 9,549 A-38 SE 43RD ST FROM HAWTHORNE RD (SR 20) TO E UNIVERSITY AV (SR 26) 3,285 AC-290 NORTH OF HAWTHORNE RD ,311 3,311 SOUTH OF UNIVERSITY AV ,258 3,258 A-39 SW 91ST ST FROM SW ARCHER RD (SR 24) TO SW 24TH AV 6,366 AC-170 NORTH OF ARCHER RD ,825 5,825 NORTH OF SW 46TH BLVD ,366 6,366 NORTH OF SW 44TH BLVD ,487 6,487 NORTH OF SCHOOL HOUSE ROAD ,798 7,798 NORTH OF SW 31ST AVENUE ,906 5,906 A-40 SW 46TH BD FROM SW 91ST ST TO SW 75TH ST 5,257 AC-180 WEST OF SW 75TH ST ,257 5,257 A-41 SW 62ND AV/SW 63RD BD FROM WILLISTON RD (SR 121) TO ARCHER RD (SR 24) 5,080 AC-200 SOUTH OF ARCHER RD ,080 5,080 A-42 CR 329B (LAKESHORE DR) FROM HAWTHORNE RD (SR 20) TO SR AC-295 NORTH OF SR EAST OF SR A-43 NE 77TH AV FROM NE 38TH ST (MONTEOCHA RD) TO SR 24 (WALDO RD) 645 AC-300 EAST OF NE 38TH ST A-44 SW 75TH ST FROM GMA BOUNDARY TO ARCHER RD (SR 24) 3,123 AC-095 SOUTH OF ARCHER RD ,123 3,123 GA-7
114 A-45 FORT CLARKE BLVD FROM SR 26/NEWBERRY RD TO NW 23RD AV 13,614 AC-160 NORTH OF SR ,411 13,411 SOUTH OF NW 23RD AV ,816 13,816 A-46 NW 32ND AV FROM GMA BOUNDARY TO CR 241/NW 143RD ST 2,242 AC-050 WEST OF CR 241-2,242 2,242 A-47 CR 329 (MAIN ST) FROM SR 331 (WILLISTON RD) TO UNIVERSITY AV (SR 26) 12,200 SOUTH OF S 16TH AV ,100 < 7,100 SOUTH OF DEPOT AV ,200 < 12,200 NORTH OF S 4TH AV ,900 < 13,900 SOUTH OF UNIVERSITY AV 6106 INACTIVE > 2005 TRAFFIC COUNT t\mike\los\los11\k2010gt.xlsx ~ 2006 TRAFFIC COUNT * 2007 TRAFFIC COUNT < 2009 TRAFFIC COUNT ^ median average for this location ` estimate from 2001 directional split due to broken tube # count may be affected by construction GA-8
115 CITY OF GAINESVILLE / UNIVERSITY OF FLORIDA ARTERIALS GG-1
116 [PAGE LEFT BLANK INTENTIONALLY] GG-2
117 YEARLY TRAFFIC COUNTS - CITY / UNIVERSITY OF FLORIDA ROADS G-1 NW 55TH ST FROM NEWBERRY RD (SR 26) TO NW 23RD AV 8,341 NORTH OF NEWBERRY RD ,797 ^ 9,797 NORTH OF NEWBERRY RD 2079 INACTIVE SOUTH OF NW 23RD AV ,885 < 6,885 G-2 NW 8 AV FROM NEWBERRY RD (SR 26) TO NW 22ND ST 16,412 WEST OF NW 43RD ST ,398 ^ 23,398 EAST OF NW 43RD ST 6017 INACTIVE WEST OF NW34TH ST ,412 < 16,412 EAST OF NW 34TH ST ,273 16,273 G-3 NW 8TH AV FROM NW 22ND ST TO NW 6TH ST 14,101 EAST OF NW 22ND ST ,637 > 14,637 WEST OF NW 6TH ST ,564 < 13,564 G-4 SW 62ND BD FROM SW 20 AV TO NEWBERRY RD (SR 26) 21,542 NORTH OF SW 20TH AV ,481 21,481 NORTH OF SW 20TH AV INACTIVE SOUTH OF NEWBERRY RD INACTIVE SOUTH OF NEWBERRY RD ,603 21,603 G-5 NW 22ND ST FROM W UNIVERSITY AV (SR 26) TO NW 16TH AV 6,849 NORTH OF W UNIVERSITY AV ,388 ` 6,388 NORTH OF NW 5TH AV ,849 ` 6,849 SOUTH OF NW 16TH AV ,246 ~ 7,246 G-6 NE 8TH AV FROM N MAIN ST TO WALDO RD (SR 24) 10,498 WEST OF NE 7TH ST ,469 ^ 11,469 EAST OF NE 9TH ST ,526 ^ 9,526 G-7 S 2ND AV FROM SW 13TH ST (US 441) TO SE 7TH ST 5,563 WEST OF SW 10TH ST 4026 INACTIVE EAST OF SW 10TH ST ,608 ^ 5,608 WEST OF SW 3RD ST ,916 < 5,916 EAST OF SW 2ND ST INACTIVE EAST OF S MAIN ST ,517 ~ 5,517 WEST OF SE 7TH ST ,819 < 1,819 G-8 SW 6TH ST FROM SW 16TH AV TO SW 4TH AV 5,982 SOUTH OF DEPOT AV ,889 ^ 5,889 NORTH OF DEPOT AV ,074 ^ 6,074 GG-3
118 G-9 W 6TH ST FROM SW 4TH AV TO NW 8TH AV 8,197 SOUTH OF W UNIVERSITY AV ,452 ^ 7,452 NORTH OF W UNIVERSITY AV ,942 ^ 8,942 SOUTH OF NW 8TH AV 2082 INACTIVE G-10 E 9TH ST FROM SE 2ND AV TO NE 31ST AV 4,457 SOUTH OF E UNIVERSITY AV ,138 < 2,138 NORTH OF NE 5TH AV ,086 ^ 6,086 SOUTH OF NE 16TH AV ,213 ^ 6,213 NORTH OF NE 16TH AV ,457 4,457 NORTH OF NE 23RD AV ,406 2,406 G-11 NW 38TH ST FROM NW 8TH AV TO NW 16TH AV 1,848 NORTH OF NW 8TH AV ,848 ^ 1,848 G-12 NW 24TH BD FROM NW 39TH AV (SR 222) TO NW 53RD AV (SR 232) 3,101 NORTH OF NW 39TH AV ,660 3,660 SOUTH OF NW 53RD AV ,541 2,541 G-13 N MAIN ST FROM N 39TH AV (SR 222) TO N 53RD AV (SR 232) 4,962 NORTH OF N 39TH AV ,962 4,962 NORTH OF N 39TH AV 7048 INACTIVE G-14 NE 15TH ST FROM E UNIVERSITY AV (SR 26) TO NE 8TH AV 4,967 NORTH OF E UNIVERSITY AV ,967 ^ 4,967 G-15 NE 15TH ST FROM NE 16TH AV TO NE 39TH AV (SR 222) 4,902 NORTH OF NE 16TH AV ,043 4,043 SOUTH OF NE 31ST AV INACTIVE NORTH OF NE 31ST AV ,761 ~ 5,761 G-16 NE 25TH ST FROM E UNIVERSITY AV (SR 26) TO NE 8TH AV 4,900 SOUTH OF NE 8TH AV ,900 4,900 G-17 SE 4TH ST FROM WILLISTON RD (SR 331) TO DEPOT AVE. 3,165 NORTH OF WILLISTON RD ,171 < 2,171 SOUTH OF DEPOT AV ,159 ~ 4,159 GG-4
119 G-18 SE 4TH ST/ SE 22ND AV FROM WILLISTON RD (SR 331) TO SE 15TH ST 3,213 SOUTH OF WILLISTON RD ,213 < 3,213 SOUTH OF WILLISTON RD 6125 INACTIVE G-19 NE 8TH AV FROM WALDO RD (SR 24) TO NE 25TH ST 6,426 EAST OF NE 18TH ST ,426 6,426 G-20 S 4TH AV FROM SW 13TH ST (US 441) TO SE 15TH ST 4,014 WEST OF SW 10TH ST 4027 INACTIVE WEST OF SW 6TH ST ,029 ^ 4,029 EAST OF SW 6TH ST ,128 < 5,128 WEST OF S MAIN ST ,998 ^ 3,998 EAST OF SE 3RD ST ,938 < 1,938 EAST OF SE 9TH ST ,744 < 2,744 EAST OF WILLISTON RD ,321 < 4,321 G-21 SW 9TH RD/DEPOT AVE/SE 7TH AV FROM SW 13TH ST TO SE 15TH ST 4,495 EAST OF SW 13TH ST ,495 < 4,495 EAST OF SW 13TH ST ,080 < 3,080 EAST OF SW 6TH ST ,237 ~ 5,237 EAST OF S MAIN ST ,173 ~ 7,173 WEST OF WILLISTON RD ,251 < 2,251 EAST OF WILLISTON RD 5025 INACTIVE WEST OF SE 15TH ST ,972 < 1,972 G-22 SE 2ND AV FROM SE 7TH ST TO WILLISTON RD 3,174 EAST OF SE 9TH ST ,454 < 1,454 G-23 NE 31ST AV FROM N MAIN ST TO WALDO RD (SR 24) 2,129 EAST OF N MAIN ST ,783 ^ 1,783 EAST OF NE 15TH ST ,475 ~ 2,475 G-24 NW 17TH ST FROM W UNIVERSITY AV (SR 26) TO NW 8TH AV 4,031 NORTH OF W UNIVERSITY AV ,874 < 4,874 NORTH OF NW 5TH AV ,188 < 3,188 G-25 W 12TH ST FROM SW 4TH AV TO NW 8TH AV 4,421 NORTH OF SW 2ND AV ,682 ^ 5,682 NORTH OF W UNIVERSITY AV (SR 26) ,159 < 3,159 GG-5
120 G-26 W 10TH ST FROM SW 4TH AV TO NW 8TH AV 3,593 NORTH OF SW 2ND AV ,178 < 5,178 SOUTH OF NW 3RD AV ,008 < 2,008 SOUTH OF NW 8TH AV 2085 INACTIVE G-27 SW 16TH ST FROM SW 16TH AV TO SW ARCHER RD (SR 24) 4,625 NORTH OF SW 16TH AV ,625 4,625 G-28 NW 5TH AV FROM NW 22ND ST TO NW 13TH ST (US 441) 1,963 EAST OF NW 22ND ST INACTIVE WEST OF NW 17TH ST ,963 < 1,963 EAST OF NW 17TH ST 2083 INACTIVE EAST OF NW 13TH ST 2081 INACTIVE G-29 W 3RD ST FROM SW 4TH AV TO NW 8TH AV 490 NORTH OF SW 4ND AV 4023 INACTIVE NORTH OF SW 2ND AV INACTIVE NORTH OF NW 3RD AV * 490 G-30 W 2ND ST FROM SW 4TH AV TO NW 8TH AV 676 NORTH OF W UNIVERSITY AV ^ 676 G-31 GALE LEMERAND DR FROM SW ARCHER RD (SR 24) TO MUSEUM RD 13,614 NORTH OF ARCHER RD UF [4058] 15,982 u 15,982 NORTH OF MOWRY RD UF 11,246 u 11,246 G-32 RADIO RD/MUSEUM RD FROM SW 34TH ST (SR 121) TO SW 13TH ST (US 441) 13,621 EAST OF SW 34TH ST ,118 < 7,118 WEST OF VILLAGE DR UF 12,175 u 12,175 WEST OF NORTH-SOUTH DR UF 10,814 u 10,814 EAST OF NORTH-SOUTH DR UF 15,067 u 15,067 EAST OF CENTER DR UF 17,745 u 17,745 WEST OF SW 13TH ST ,170 ^ 16,170 G-33 E 1ST ST FROM SE 2ND PL TO NE 8TH AV 3,120 NORTH OF NE 3RD AV ,120 * 3,120 GG-6
121 G-34 E 3RD ST FROM SE DEPOT AV TO NE 2ND AV 3,699 SOUTH OF SW 4TH AV ,699 < 3,699 SOUTH OF UNIVERSITY AV ,218 ^ 4,218 NORTH OF UNIVERSITY AV ,008 ^ 2,008 G-35 HULL/MOWRY RD FROM SW 34TH ST TO CENTER DR. 8,793 EAST OF SW 34TH ST ,249 > 11,249 WEST OF SW 23RD DR UF 6,336 u 6,336 G-36 GLEN SPRINGS RD/NW 31ST AVE. FROM NW 34TH ST TO NW 16TH TR 6,144 EAST OF NW 34TH ST 7010/2122 4,241 * 4,241 EAST OF NW 34TH ST 2000 INACTIVE WEST OF NW 23RD BD 2080 INACTIVE WEST OF NW 23RD BD 6010 INACTIVE WEST OF NW 16TH TR 7007/2120 8,046 * 8,046 G-37 SW 23RD TR FROM WILLISTON RD (SR 331) TO ARCHER RD (SR 24) 8,431 NORTH OF WILLISTON RD (SR 331) 7041/4063 6,632 > 6,632 SOUTH OF ARCHER RD (SR 24) 7040/ ,230 > 10,230 G-38 NW 23RD BD FROM NW 16TH TR TO NW 13TH ST (US 441) 10,316 EAST OF NW 16TH TR ,316 ^ 10,316 WEST OF NW 13TH ST 6011 INACTIVE G-39 GALE LEMERAND DR FROM MUSEUM RD TO W UNIVERSITY AV (SR 26) 12,368 SOUTH OF W UNIVERSITY AV UF [4043] 10,816 u 12,116 NORTH OF MUSEUM DR UF 12,619 u 12,619 ` Year 2005 count ~ Year 2006 count * Year 2007 count ^ Year 2008 count < Year 2009 count > Year 2011 count u University of Florida Campus Master Plan update 2009 traffic count C Count affected by construction activity H Educational institution not in session F Fall semester count GG-7
122 [PAGE LEFT BLANK INTENTIONALLY] GG-8
123 APPENDIX H SPECIAL CIRCUMSTANCE STUDY RESULTS H-1
124 [PAGE LEFT BLANK INTENTIONALLY] H-2
125 SPECIAL CIRCUMSTANCE STUDY RESULTS Studies of state-maintained, Alachua County-maintained and City of Gainesville-maintained roadway facilities which do not exclusively incorporate typical methodologies described in this Level of Service (LOS) Report are included in this appendix. In particular, those studies which are done at the request of the Technical Subcommittee of the Metropolitan Transportation Planning Organization entail calculations of LOSs and maximum service volumes (MSVs) based on the latest single-year or post-constructions two-year annual average daily traffic counts for roadways which are subject to preconstruction planning studies for capacity enhancement and roadways which have had their capacities increased within the last year. H-3
126 [PAGE LEFT BLANK INTENTIONALLY] H-4
127 STATE MAINTAINED ARTERIALS [RESERVED] MTPO Staff-Updated Tier Two Analyses Suspended in 2008 HS-1
128 [PAGE LEFT BLANK INTENTIONALLY] HS-2
129 ALACHUA COUNTY ARTERIALS [RESERVED] MTPO Staff-Updated Tier Two Analyses Suspended in 2008 HA-1
130 [PAGE LEFT BLANK INTENTIONALLY] HA-2
131 CITY OF GAINESVILLE ARTERIALS [RESERVED] MTPO Staff-Updated Tier Two Analyses Suspended in 2008 HG-1
132 [PAGE LEFT BLANK INTENTIONALLY] HG-2
133 METROPOLITAN TRANSPORTATION PLANNING ORGANIZATION (MTPO) FOR THE GAINESVILLE URBANIZED AREA YEAR 2010 ANNUAL AVERAGE DAILY TRAFFIC MULTIMODAL LEVEL OF SERVICE REPORT LEVEL OF SERVICE ATLAS GAINESVILLE METROPOLITAN AREA CONGESTION MANAGEMENT PROCESS Prepared by: North Central Florida Regional Planning Council 2009 NW 67 th Place Gainesville, Florida January 12, 2012
134
135 TABLE OF CONTENTS ILLUSTRATION PAGE EXECUTIVE SUMMARY... vii INTRODUCTION...1 PURPOSE...1 I GAINESVILLE METROPOLITAN AREA...3 II GAINESVILLE METROPOLITAN AREA LEVEL OF SERVICE...5 II-S GAINESVILLE METROPOLITAN AREA LEVEL OF SERVICE- STATE-MAINTAINED ROADS...7 II-A GAINESVILLE METROPOLITAN AREA LEVEL OF SERVICE- COUNTY-MAINTAINED ROADS...9 II-G GAINESVILLE METROPOLITAN AREA LEVEL OF SERVICE- CITY/UF-MAINTAINED ROADS...11 III GAINESVILLE METROPOLITAN AREA ROADWAYS OPERATING AT AN UNACCEPTABLE LEVEL OF SERVICE...13 IV GAINESVILLE METROPOLITAN AREA ROADWAY FACILITY TRANSIT LEVEL OF SERVICE...15 iii
136 [PAGE LEFT BLANK INTENTIONALLY] iv
137 EXECUTIVE SUMMARY The Multimodal Level of Service (LOS) Report, provides multimodal LOS. Automotive/highway (hereinafter highway), bicycle, pedestrian and transit modes of travel are analyzed for level of service. The latest available highway LOS estimate of all functionally classified collector and arterial roadways within the Gainesville Metropolitan Area (GMA) Boundary is provided in this report. In addition, bicycle, pedestrian and transit LOS estimates of all functionally classified collector and arterial roadways within the Gainesville Metropolitan Area (GMA) Boundary are provided in this report. Hereinafter, all references to highway LOS address LOS as described in the Highway Capacity Manual 2010 (HCM 2010). The LOS Report entails three components: roadway service volume tables; an LOS map atlas and a technical appendices document. The LOS Report employs a two-tiered LOS roadway facility analysis. Tier One analysis utilizes Florida Department of Transportation's (FDOT) Generalized Tables. FDOT Generalized Tables are contained in an FDOT document entitled 2009 Quality/Level of Service Handbook. Tier Two analysis is required for all "distressed" arterials. A "distressed" arterial is one where current highway traffic uses 65 percent or more of the maximum service volume (MSV) for the adopted LOS for that roadway in FDOT's Generalized Tables. Tier Two analysis, which utilizes FDOT s LOSPLAN software, is performed for all "distressed" arterials. Detailed analysis using FDOT FREEPLAN software is performed for all "distressed" limited-access arterials. These analyses are done to develop a more accurate LOS estimate than can be obtained using FDOT Generalized Tables. In 2008, the Technical Advisory Committee Level of Service Subcommittee suspended MTPO Staff-updated Tier Two analyses due to concerns that data used are outdated while the Traffic Management System is installed. Field studies are still reviewed by the LOS Subcommittee for inclusion in the LOS Report. ARTPLAN, HIGHPLAN or FREEPLAN, as appropriate, are also used to estimate the amount of service volume that the road actually has at a given LOS. ARTPLAN provides a more accurate estimate of an arterial's service volume than can be obtained using the FDOT Generalized Tables. Roadway facilities which are ARTPLAN 2009-analyzed using field-collected data are shown in Italics in the LOS Tables of the LOS Report. Roadway facilities that are operating at an unacceptable LOS are identified in Exhibit 1. Note that the LOS analysis is for operational performance based on the HCM 2010 s LOS criteria. Although roadway facilities may be functioning at LOS F, development is permissible within Transportation Concurrency Exception Areas. Bicycle, pedestrian and transit LOS analyses also employ a two-tiered approach. Those facilities for which the highway LOS is analyzed using the FDOT Generalized Tables, are also analyzed for bicycle, pedestrian and transit LOS using the FDOT Generalized Tables. Those facilities for which the highway LOS is analyzed using FDOT LOSPLAN software, are also analyzed for bicycle, pedestrian and transit LOS using FDOT LOSPLAN software. Congestion Management Process (CMP) The LOS Report is updated at least annually. This monitoring system is a key component for prioritizing bicycle facility, pedestrian facility, roadway facility and transit projects, that address congestion management, in the Long Range Transportation Plan and Transportation Improvement Program. This report is intended to address the Safe, Accountable, Feasible, Efficient Transportation Equity Act- A Legacy for Users (SAFETEA-LU) congestion management process requirement. v
138 EXHIBIT 1 ROADWAY FACILITIES OPERATING AT AN UNACCEPTABLE HIGHWAY LEVEL OF SERVICE (LOS) ROADWAY FACILITY FROM TO 2009 AADT 2009 LOS 2010 AADT 2010 LOS 2010 MSV SW 13 STREET [US 441] (S-3) NW 13 STREET [US 441]. (S-4) ARCHER ROAD UNIVERSITY AVENUE 34,500 F 35,000 F 28,200 UNIVERSITY AVENUE NW 29 ROAD 31,500 F 29,500 F 28,200 NEWBERRY ROAD [SR 26] (S-14) NW 122 STREET INTERSTATE 75 (West Ramp) 37,250 F 38,500 F 35,500 NEWBERRY ROAD [SR 26] (S-15) INTERSTATE 75 (West Ramp) NW 8 AVENUE 49,500 F 48,500 F 43,700 SW 2 AVENUE [SR 26A] (S-21) NW 34 STREET [SR 121] (S-25) ARCHER ROAD [SR 24] (S-47) ARCHER ROAD [SR 24] (S-55) NW 23 AVENUE (A-9) SW 20 AVENUE (A-16) NW 83 STREET (A-23) RADIO ROAD/MUSEUM DRIVE. (G-32) GALE LEMERAND DRIVE (G-39) NEWBERRY ROAD SW 34 STREET 15,200 E 15,000 E 12,495 UNIVERSITY AVENUE NW 16 AVENUE 18,750 F 18,200 F 15,960 GMA BOUNDARY SW 75 STREET 19,000 E 18,500 F 15,960 SW 34 STREET SW 16 AVENUE 51,250 F 52,250 E 50,300 NW 98 STREET NW 55 STREET 16,815 F 15,770 F 15,675 SW 62 BOULEVARD SW 34 STREET 21,524 F 21,524 F 15,675 NW 23 AVENUE NW 39 AVENUE 13,851 E 14,157 E 13,680 SW 34 STREET SW 13 STREET 13,621 F 13,621 F 11,260 MUSEUM DRIVE UNIVERSITY AVENUE 12,368 F 12,368 F 10,530 # Maximum service volume (MSV) for LOS D is not attainable (NA). Notes: Roadway facilities included in the 2009 AADT unacceptable LOS listing that are not included in the 2010 AADT listing are: A-15, SW 20th Avenue from SW 75th Street to SW 62nd Boulevard; and A-19, NW 39th Avenue from NW 112th Street to NW 98th Street. Unacceptable operating performance is based on the 2010 Highway Capacity Manual LOS A to F scale and not Florida Department of Transportation (FDOT) and/or Florida Department of Economic Opportunity-negotiated LOS standards. vi
139 INTRODUCTION The Metropolitan Transportation Planning Organization (MTPO) for the Gainesville Urbanized Area s Annual Average Daily Traffic (AADT)/ Multimodal Level of Service (LOS) Report is composed of three components: an LOS map atlas; LOS tables of state-maintained, county-maintained and city-maintained roadways and a technical appendices document. All references to LOS within Appendix A address only highway LOS as described in the Highway Capacity Manual This report contains estimates of the LOS and maximum service volume (MSV) for arterials, collectors functioning as arterials, transitioning arterials and collectors, major nonstate roads and other nonstate roads within the Gainesville Metropolitan Area (GMA) Boundary. Illustration I shows the GMA as defined by Chapter (1)(c), Florida Statutes. LOS and MSV analysis methodology utilizes the Florida Department of Transportation (FDOT) Generalized Tables contained in FDOT's 2009 Quality/Level of Service Handbook (2009 Q/LOS Handbook). Tables 1 through 3 provide detailed data on each functionally classified road. Table 1 provides roadway LOS data for state-maintained roads. Table 2 provides roadway LOS data for Alachua County-maintained roads. Table 3 provides roadway LOS data for City of Gainesville-maintained roads. The LOS data for the GMA is also graphically illustrated in the MTPO s Level of Service Atlas. This report also contains estimates of bicycle, pedestrian and transit LOS for arterials, collectors functioning as arterials, transitioning arterials and collectors, major nonstate roads and other nonstate roads within the GMA Boundary. Tables 4 through 6 provide the multimodal LOS on each functionally classified road. Table 4 provides multimodal LOS data for state-maintained roads. Table 5 provides multimodal LOS data for Alachua Countymaintained roads. Table 6 provides multimodal LOS data for City of Gainesville-maintained roads. Tables 7 through 9 provide the ARTPLAN bicycle, pedestrian and transit LOS analysis criteria results for each functionally classified road. Table 7 provides ARTPLAN bicycle, pedestrian and transit LOS analysis criteria results for statemaintained roads. Table 8 provides ARTPLAN bicycle, pedestrian and transit LOS analysis criteria results for Alachua County-maintained roads. Table 9 provides ARTPLAN bicycle, pedestrian and transit LOS analysis criteria results for City of Gainesville-maintained roads. PURPOSE The primary purpose of this study is to provide the most accurate estimate of multimodal LOS possible for each state maintained arterials, city and county collectors functioning as arterials, transitioning arterials or collectors, major nonstate roads and other nonstate roads within the GMA Boundary. This greater degree of accuracy will become increasingly important when issues dealing with concurrency and growth management arise. The degree of accuracy is accomplished by a hierarchical approach to the analysis. All roadways are analyzed using FDOT's Generalized Tables. Where it has been determined that a roadway has a service volume approaching or exceeding 65 percent the Generalized Tables-specified service volume, a secondary degree of analysis using FDOT analytical computer software is used to analyze the roadway service volume. This analysis provides a more accurate estimate of roadway LOS for concurrency management purposes because they assess local traffic characteristics. In 2008, the Technical Advisory Committee Level of Service Subcommittee suspended MTPO Staff-updated Tier Two analyses due to concerns that data used are outdated while the Traffic Management System is installed. Field studies are still reviewed by the LOS Subcommittee for inclusion in the LOS Report. 1
140 [PAGE LEFT BLANK INTENTIONALLY] 2

141 US 41/27 CR 241 SW 122ND ST US 441 SW 75TH ST SR 121 US 441 Illustration 1 Gainesville Metropolitan Area Alachua County Alachua County Boundary Roads Metropolitan Area 2020 Gainesville City Limits Census 2000 Urbanized Area Urban Cluster µ Miles SR 241 I-75 SR 24 CR 222 MILLHO PPER RD NW 39TH AVE NW 43RD ST NW 53RD AVE SR 26 Legend SR 26 E UNIVERSITY AVE CR 241 SR 20 SR 24 SR 331 US 301 I 75 Source: Future Land Use Map Alachua County, Florida dated July 15, 2003 W:\Kevin\Data\ArcGIS\MTPO\MIKE GMA 3.mxd 1/7/2011 3
142 [PAGE LEFT BLANK INTENTIONALLY] 4
143 NW 55th Street NW 51st Street NW 34th Street SR 121 US 441 / NW 13th Street SE 15th Street ILLUSTRATION II GAINESVILLE METROPOLITAN AREA LEVEL OF SERVICE SE 27th Street SE 35th Street I-75 US 441 Note: Official TCEA boundaries are identified in the City of Gainesville Comprehensive Plan and the Alachua County Comprehensive Plan. Milhopper Road CR 232 NW 53rd Avenue SR 222 NW 39th Avenue NE 39th Avenue SR 24 SR 24 / Waldo Road 5 CR 241 N September, 2011 NW 98th Street SW 91st Street Ft. Clark Blvd NW 83rd Street SW 8th Avenue SW 24th Avenue NW 23rd Avenue SW 75th Street SR 26 W Newberry Road SW 62nd Boulevard NW 43rd Street NW 38th Street SR 26 SW 20th Avenue Glen Springs Road NW 16th Avenue NW 8th Avenue W University Ave SR 26A Radio Road Hull Road SW 27th Street Museum Road Stadium Road SW 23rd Terrace NW 5th Avenue North/South Drive Center Drive US 441 SW 13th Street NW 6th Street NW 23rd Avenue Avenue SW 2nd SW 4th Avenue SW Depot Avenue SW 16th Avenue S Main Street NE 9th Street SE Williston Road NE 31st Avenue NE 15th Street NE 8th Avenue SR 26 SR 26 / E University Avenue SR 20 SR 20 / Hawthorne Road SW 43rd Street T\mike\los\los11\maplos11.cdr NORTH SCALE IN MILES Prepared by the North Central Florida Regional Planning Council for the Metropolitan Transportation Planning Organization mtpo Haile Boulevard SW 91st Street Archer Road SR 24 SR 121 SW 34th Street I-75 LEGEND Gainesville Metropolitan Area Boundary FDOT Tables FDOT Software LOS A, B or C LOS D LOS E LOS F Transportation Concurrency Exception Area (TCEA) City TCEA County TCEA
144 [PAGE LEFT BLANK INTENTIONALLY] 6
145 NW 55th Street NW 51st Street NW 34th Street SR 121 US 441 / NW 13th Street ILLUSTRATION II - S STATE-MAINTAINED ROADWAYS GAINESVILLE METROPOLITAN AREA LEVEL OF SERVICE SE 15th Street SE 27th Street SE 35th Street S-50 I-75 US 441 CR 241 N T\mike\los\los11\maplos11.cdr NORTH SCALE IN MILES Prepared by the North Central Florida Regional Planning Council for the Metropolitan Transportation Planning Organization mtpo Haile NW 98th Street Boulevard SW 91st Street SW 34th Street SW 91st Street Milhopper Road Ft. Clark Blvd NW 83rd Street SW 8th Avenue SW 24th Avenue SR 222 NW 39th Avenue NW 23rd Avenue SW 75th Street SR 26 W Newberry Road Archer Road NW 53rd Avenue SW 62nd Boulevard SR 24 CR 232 NW 43rd Street NW 38th Street SR 26 SW 20th Avenue SR 121 Glen Springs Road NW 16th Avenue NW 8th Avenue W University Ave SR 26A Radio Road I-75 Hull Road SW 27th Street Museum Road Stadium Road SW 23rd Terrace NW 5th Avenue North/South Drive Center Drive US 441 SW 13th Street S-1 NW 6th Street NW 23rd Avenue Avenue SW 2nd SW 4th Avenue SW Depot Avenue SW 16th Avenue S Main Street S-37 SE Williston Road NE 39th Avenue NE 31st Avenue NE 9th Street S-6 S-5 S-28 7 S-45 September, 2011 S-52 S-43 S-29 S-14 S-47 S-15 S-56 S-42 S-9 S-16 S-53 S-21 S-41 S-23 S-24 S-25 S-26 S-10 S-44 S-27 S-17 S-22 S-54 S-55 S-51 S-33 S-38 S-18 S-11 S-7 S-2 S-3 S-4 S-34 S-40 S-35 S-19 NE 15th Street NE 8th Avenue S-39 S-30 S-36 SR 24 SR 24 / Waldo Road S-31 S-8 S-12 S-13 S-20 SR 26 SR 26 / E University Avenue SR 20 SR 20 / Hawthorne Road SW 43rd Street S-48 LEGEND Gainesville Metropolitan Area Boundary FDOT Tables FDOT Software LOS A, B or C LOS D LOS E LOS F Transportation Concurrency Exception Area (TCEA) S-49 S-32 S-46
146 [PAGE LEFT BLANK INTENTIONALLY] 8
147 NW 55th Street NW 51st Street NW 34th Street SR 121 US 441 / NW 13th Street ILLUSTRATION II - A COUNTY-MAINTAINED ROADWAYS GAINESVILLE METROPOLITAN AREA LEVEL OF SERVICE SE 15th Street SE 27th Street SE 35th Street I-75 9 CR 241 N A-32 A-46 September, 2011 T\mike\los\los11\maplos11.cdr NORTH SCALE IN MILES Prepared by the North Central Florida Regional Planning Council for the Metropolitan Transportation Planning Organization mtpo A-37 A-35 A-36 A-19 A-22 Haile NW 98th Street Boulevard A-45 SW 91st Street SW 34th Street SW 91st Street Milhopper Road A-34 Ft. Clark Blvd NW 83rd Street SW 8th Avenue A-26 SW 24th Avenue SR 222 NW 39th Avenue NW 23rd Avenue SW 75th Street SR 26 W Newberry Road Archer Road NW 53rd Avenue SW 62nd Boulevard SR 24 CR 232 NW 43rd Street NW 38th Street SR 26 SW 20th Avenue SR 121 US 441 Glen Springs Road NW 16th Avenue NW 8th Avenue W University Ave SR 26A Radio Road I-75 Hull Road SW 27th Street Museum Road Stadium Road SW 23rd Terrace NW 5th Avenue North/South Drive Center Drive US 441 SW 13th Street NW 6th Street NW 23rd Avenue Avenue SW 2nd SW 4th Avenue SW Depot Avenue SW 16th Avenue S Main Street SE Williston Road NE 39th Avenue NE 31st Avenue NE 9th Street A-23 A-33 A-20 A-40 A-21 A-9 A-10 A-44 A-39 A-13 A-24 A-15 A-41 A-30 A-3 A-6 A-16 A-11 A-28 A-12 NE 15th Street NE 8th Avenue A-29 SR 24 SR 24 / Waldo Road SR 26 SR 26 / E University Avenue A-38 A-14 A-1 A-47 A-17 A-18 A-2 SR 20 A-31 SR 20 / Hawthorne Road A-43 SW 43rd Street LEGEND Gainesville Metropolitan Area Boundary FDOT Tables FDOT Software LOS A, B or C LOS D LOS E LOS F Transportation Concurrency Exception Area (TCEA) A-42
148 [PAGE LEFT BLANK INTENTIONALLY] 10
149 NW 55th Street NW 51st Street NW 34th Street SR 121 US 441 / NW 13th Street ILLUSTRATION II - G CITY/UF-MAINTAINED ROADWAYS GAINESVILLE METROPOLITAN AREA LEVEL OF SERVICE SE 15th Street SE 27th Street SE 35th Street I-75 US 441 Milhopper Road CR 232 NW 53rd Avenue 11 CR 241 N September, 2011 NW 98th Street SW 91st Street Ft. Clark Blvd NW 83rd Street SW 8th Avenue SW 24th Avenue SR 222 NW 39th Avenue NW 23rd Avenue SW 75th Street SR 26 W Newberry Road G-1 SW 62nd Boulevard G-4 NW 43rd Street G-11 NW 38th Street G-2 SR 26 SW 20th Avenue Glen Springs Road NW 16th Avenue NW 8th Avenue W University Ave SR 26A Radio Road Hull Road SW 27th Street Museum Road SW 23rd Terrace NW 5th Avenue North/South Drive Center Drive SW 13th Street NW 6th Street NW 23rd Avenue Avenue SW 2nd SW 4th Avenue SW Depot Avenue SW 16th Avenue S Main Street SE Williston Road NE 39th Avenue NE 31st Avenue NE 9th Street G-12 G-36 G-35 G-32 G-37 G-5 G-3 G-38 G-24 G-28 G-7 Stadium Road G-39 G-31 G-27 US 441 G-9 G-8 G-34 G-25 G-26 G-29 G-30 G-33 G-13 G-17 NE 15th Street G-15 G-10 G-6 NE 8th Avenue G-18 G-22 G-21 G-14 G-23 G-19 G-20 G-16 SR 24 SR 24 / Waldo Road SR 26 SR 26 / E University Avenue SR 20 SR 20 / Hawthorne Road SW 43rd Street T\mike\los\los11\maplos11.cdr NORTH SCALE IN MILES Prepared by the North Central Florida Regional Planning Council for the Metropolitan Transportation Planning Organization mtpo Haile Boulevard SW 91st Street Archer Road SR 24 SR 121 SW 34th Street I-75 LEGEND Gainesville Metropolitan Area Boundary FDOT Tables FDOT Software LOS A, B or C LOS D LOS E LOS F Transportation Concurrency Exception Area (TCEA)
150 [PAGE LEFT BLANK INTENTIONALLY] 12
151 NW 55th Street NW 51st Street NW 34th Street SR 121 US 441 / NW 13th Street SE 15th Street ILLUSTRATION III SE 27th Street SE 35th Street GAINESVILLE METROPOLITAN AREA ROADWAYS OPERATING AT AN UNACCEPTABLE LEVEL OF SERVICE I-75 US 441 Milhopper Road CR 232 NW 53rd Avenue SR 222 NW 39th Avenue NE 39th Avenue SR 24 SR 24 / Waldo Road 13 CR 241 N September, 2011 NW 98th Street SW 91st Street A-23 Ft. Clark Blvd NW 83rd Street SW 8th Avenue SW 24th Avenue NW 23rd Avenue SW 75th Street A-9 SR 26 W Newberry Road S-14 S-15 SW 62nd Boulevard NW 43rd Street NW 38th Street SR 26 S-21 SW 20th Avenue S-25 A-16 Glen Springs Road NW 16th Avenue NW 8th Avenue W University Ave SR 26A Radio Road S-55 Hull Road SW 27th Street Museum Road G-32 Stadium Road G-39 SW 23rd Terrace NW 5th Avenue North/South Drive Center Drive S-3 S-4 US 441 SW 13th Street NW 6th Street NW 23rd Avenue Avenue SW 2nd SW 4th Avenue SW Depot Avenue SW 16th Avenue S Main Street NE 9th Street SE Williston Road NE 31st Avenue NE 15th Street NE 8th Avenue SR 26 SR 26 / E University Avenue SR 20 SR 20 / Hawthorne Road SW 43rd Street T\mike\los\los11\maplos11.cdr NORTH SCALE IN MILES Prepared by the North Central Florida Regional Planning Council for the Metropolitan Transportation Planning Organization mtpo Haile Boulevard SW 91st Street S-47 Archer Road SR 24 SR 121 SW 34th Street I-75 LEGEND Gainesville Metropolitan Area Boundary FDOT Tables FDOT Software LOS A, B or C LOS D LOS E LOS F
152 [PAGE LEFT BLANK INTENTIONALLY] 14
153 NW 55th Street NW 51st Street NW 34th Street SR 121 US 441 / NW 13th Street SE 15th Street ILLUSTRATION IV SE 27th Street SE 35th Street GAINESVILLE METROPOLITAN AREA ROADWAY FACILITY TRANSIT LEVEL OF SERVICE I-75 US 441 Note: Roadway facility transit service LOS is determined by ARTPLAN analysis and is not a measurement of transit route LOS. Milhopper Road CR 232 NW 53rd Avenue SR 222 NW 39th Avenue NE 39th Avenue SR 24 SR 24 / Waldo Road 15 CR 241 N September, 2011 NW 98th Street SW 91st Street Ft. Clark Blvd NW 83rd Street SW 8th Avenue SW 24th Avenue NW 23rd Avenue SW 75th Street SR 26 W Newberry Road SW 62nd Boulevard NW 43rd Street NW 38th Street SR 26 SW 20th Avenue Glen Springs Road NE 31st Avenue NW 23rd Avenue NW 16th Avenue NW 8th Avenue W University Ave SR 26A Radio Road Hull Road SW 16th Avenue SW 27th Street Museum Road SW 2nd Stadium Road SW 4th Avenue SW 23rd Terrace NW 5th Avenue North/South Drive Center Drive US 441 SW Depot Avenue SW 13th Street NW 6th Street Avenue S Main Street NE 9th Street SE Williston Road NE 15th Street NE 8th Avenue SR 26 SR 26 / E University Avenue SR 20 SR 20 / Hawthorne Road SW 43rd Street T\mike\los\los11\maplos11.cdr NORTH SCALE IN MILES Prepared by the North Central Florida Regional Planning Council for the Metropolitan Transportation Planning Organization mtpo Haile Boulevard SW 91st Street Archer Road SR 24 SR 121 SW 34th Street I-75 LEGEND Gainesville Metropolitan Area Boundary LOS A, B or C LOS D LOS E LOS F Facility Outside Transit Service Area
154 (PAGE LEFT BLANK INTENTIONALLY) 16
155 TABLE 4 MULTIMODAL LEVEL OF SERVICE SUMMARY FOR STATE ROADS WITHIN THE GAINESVILLE METROPOLITAN AREA BOUNDARY Updated 06/08/11 ASSIGNED FROM SOUTH TO NORTH ROADWAY OR WEST OR EAST LEVEL OF SERVICE NUMBER ROADWAY TERMINI TERMINI AUTOMOBILE BICYCLE PEDESTRIAN TRANSIT URBANIZED ROADWAYS S-2 US 441/W 13th St. SR 331/Williston Rd. SR 24/Archer Rd. B C C A S-3 US 441/W 13th St. SR 24/Archer Rd. SR 26/University Ave. F D B B S-4 US 441/W 13th St. SR 26/University Ave. NW 29th Rd. F D D D S-5 US 441/W 13th St. NW 29th Rd. N.W. 23rd St. B C D E S-6 SR 20/NW 6th St. NW 8th Ave. SR 222/N 39th Ave. C D C D S-7 SR 20/NW 6th St. SR 222/N 39th Ave. US 441/W. 13th St. B D C F S-8 SR 20/Hawthorne Rd. SR 24/Waldo Rd. SE 43rd St. C B C F S-9 SR 24/Archer Rd. SW 75th St/Tower Rd. Interstate 75 B C D E S-10 SR 24/Archer Rd. Interstate 75 SR 121/SW 34th St. D D D A S-11 SR 24/Archer Rd. SR 226/SW 16th Ave. US 441/W 13th St. D E D A S-12 SR 24/Waldo Rd. SR 26/University Ave. SR 222/E 39th Ave. B E D F S-14 SR 26/Newberry Rd. NW 122nd St. Interstate-75 [east ramp] F D D F S-15 SR 26/Newberry Rd. Interstate-75 [east ramp] NW 8th Ave. F E D D S-16 SR 26/Newberry Rd. NW 8th Ave. SR 121/W 34th St. D D D D S-17 SR 26/University Ave. SR 121/W 34th St. Gale Lemerand Dr. D C D C S-18 SR 26/University Ave. Gale Lemerand Dr. US 441/W 13th St. D D D B S-19 SR 26/University Ave. US 441/W 13th St. SR 24/Waldo Rd. D D D D S-20 SR 26/University Ave. SR 20/Hawthorne Rd. CR 329B/Lakeshore Dr. B D C E S-21 SR 26A/SW 2nd Ave. SR 26/Newberry Rd. SR 121/W 34th St. E D C B S-22 SR 26A/SW 2nd Ave. SR 121/SW 34th St. SR 26/University Ave. D D C A S-23 SR 121/W 34th St. SR 331/Williston Rd. SR 24/Archer Rd. C C D A S-24 SR 121/W 34th St. SR 24/Archer Rd. SR 26/University Ave. D C E A S-25 SR 121/W 34th St. SR 26/University Ave. NW 16th Ave. F D C F S-26 SR 121/W 34th St. NW 16th Ave. SR 222/W 39th Ave. C C C F S-27 SR 121/W 34th St. SR 222/NW 39th Ave. NW 53rd Ave. C C D E S-29 SR 222/N 39th Ave. NW 98th St. NW 83rd St. C C D F S-30 SR 222/N 39th Ave. US 441/NW 13th St. SR 24/Waldo Rd. B C C D S-31 SR 222/N 39th Ave. SR 24/Waldo Rd. End of 4-lane section B C C F S-32 SR 222/N 39th Ave. End of 4-lane section GMA Boundary C C D F S-33 SR 226/S 16th Ave SR 24/Archer Rd. US 441/W 13th St. C D C A S-34 SR 226/S 16th Ave US 441/W 13th St. SR 329/Main St. C D C A S-35 SR 226/S 16th Ave SR 329/Main St. SR 331/Williston Rd. B B D C S-36 SR 120A/N 23rd Ave. US 441/W 13th St. SR 24/Waldo Rd. C D C E S-37 SR 329/Main St. University Ave. N. 8th Ave. D C D D S-38 SR 331/SR 121 Interstate 75 (south) US 441/SW 13th St. B C D B S-39 SR 331/Williston Rd. US 441/SW 13th St. SR 26/University Ave. B C D F S-40 SR 20/NW 8th Ave. NW 6th St. N Main St. C C C F S-41 Interstate 75 SR 331/SR 121 SR 24/Archer Rd. B N/A N/A N/A S-42 Interstate 75 SR 24/Archer Rd. SR 26/Newberry Rd. C N/A N/A N/A S-43 Interstate 75 SR 26/Newberry Rd. SR 222/NW 39th Ave. C N/A N/A N/A S-46 SR 26/University Ave. CR 329B GMA Boundary B B D F S-50 US 441 NW 23rd St. GMA Boundary B C E F S-52 Interstate 75 SR 222/NW 39th Ave. GMA Boundary B N/A N/A N/A S-53 SR 222/N 39th Ave. NW 51st St. US 441/NW 13th St. B C D E S-54 SR 121/W 34th St. NW 53rd Ave. US 441/W 13th St. B B D D S-55 SR 24/Archer Rd. SR 121/SW 34th St. SR 226/SW 16th Ave. E E E A S-56 SR 222/N 39th Ave. NW 83rd St. NW 51st St. B C E E TRANSITIONING ROADWAYS S-1 US 441/W 13th St. Payne's Prairie SR 331/Williston Rd. B C D A S-13 SR 24/Waldo Rd. SR 222/E 39th Ave. CR 255A/NE 77th Ave. B C D F S-28 SR 121/W 34th St. US 441/W 13th St. N.W. 77th Ave. C C D F S-44 SR 121 S.W. 85th Ave. Interstate 75 (south) B B C F S-45 SR 26/Newberry Rd. S.W. 154th St. NW 122nd St. B C D F S-47 SR 24/Archer Rd. GMA Boundary SW 75th St/Tower Rd. F C D F S-48 SR 20/Hawthorne Rd. SE 43rd St. CR 329B/Lakeshore Dr. B C C F S-49 SR 20/Hawthorne Rd. CR 329B GMA Boundary B B D F S-51 Interstate 75 GMA Boundary SR 331/SR 121 B N/A N/A N/A SOURCE: NORTH CENTRAL FLORIDA REGIONAL PLANNING COUNCIL t\mike\los\los11\multimodal\10smmlos.xls Note: This table is not intended to be used for concurrency management purposes, since bike, pedestrian or transit LOS Standards do not exist. It is for information only. Roadway facilities in shaded rows are also ART-PLAN, HIGHPLAN or FREEPLAN analyzed. Roadway facilities in italics have full field study inputs N/A Not Applicable
156
157 TABLE 5 MULTIMODAL LEVEL OF SERVICE SUMMARY FOR ALACHUA COUNTY ROADS WITHIN THE GAINESVILLE METROPOLITAN AREA BOUNDARY Updated 09/11 ASSIGNED FROM SOUTH TO NORTH ROADWAY OR WEST OR EAST LEVEL OF SERVICE NUMBER ROADWAY TERMINI TERMINI AUTOMOBILE BICYCLE PEDESTRIAN TRANSIT URBANIZED ARTERIAL ROADWAYS A-1 NW 53rd Ave. NW 52nd Terr. US 441/W 13th St. C C E E A-3 NW 43rd St. SR 26/Newberry Rd. NW 53rd Ave. D C D F A-6 NW 43rd St. NW 53rd Ave. US 441 C C E D A-9 NW 23rd Ave. NW 98th St. NW 55th St. F D E E A-10 NW 23rd Ave. NW 55th St. NW 43rd St. C D C D A-11 NW 16th Ave. NW 43rd St. US 441/W 13th St. B D D D A-12 N 16th Ave. US 441/W. 13th St. SR 24/Waldo Road D C D F A-13 SW 75th St/Tower Rd. SR 25/Archer Road SW 8th Ave. C E D D A-14 NW 75th St/Tower Rd. SW 8th Ave. SR 26/Newberry Rd. C D D D A-15 SW 20th Ave. SW 75th St/Tower Rd SW 62nd Blvd. D C E D A-16 SW 20th Ave. SW 62nd Blvd. SR 121/W 34th St. F C E A A-17 N Main St. NW 8th Ave. NW 23rd Ave. C C C F A-18 N Main St. NW 23rd Ave. SR 222/N 39th Ave. B C C F A-19 NW 39th Ave. NW 110th St. NW 98th St. D B D F A-47 S Main St. Williston Rd. University Ave. C C C E URBANIZED MAJOR COUNTY ROADWAYS A-20 SW 24th Ave SW 91st St. SW 75th St./Tower Rd. C E C F A-21 NW 51st St. NW 23rd Ave. SR 222/NW 39th Ave. C C C F A-22 NW 98th St. SR 26/Newberry Rd. CR 222/NW 39th Ave. C D E F A-23 NW 83rd St. NW 23rd Ave. SR 222/NW 39th Ave. E E D E A-24 W 91st St. SW 24th Ave. SR 26/Newberry Rd. B D C F A-26 SW 8th Ave. SW 91st St. SW 75th St./Tower Rd. B A D F A-29 Kincaid Loop SR 20/Hawthorne Rd. SR 20/Hawthorne Rd. B D D E A-30 SW 40 Bd/SW 42/43 St SR 24/Archer Rd. SW 20th Ave. D E E E A-33 SW 24th Ave SW 122nd St./Parker Rd. SW 91st St. B D C F A-36 SW 8th Ave. SW 122nd St./Parker Rd. SW 91st St. B B D F A-45 Ft. Clarke Blvd. SR 26/Newberry Rd. NW 23rd Avenue C E D C URBANIZED OTHER SIGNALIZED ROADWAYS A-40 SW 46th Blvd. SW 104th Tr. Tower Road B D D F A-44 SW 75th St. GMA Boundary SR 24/Archer Road B D D F TRANSITIONING ARTERIAL ROADWAYS A-2 N 53rd Ave. US 441/W 13th St. SR 24/Waldo Rd. C C E F A-32 W 143rd St./CR 241 SR 26/Newberry Road GMA Boundary C C E F A-37 NW 39th Ave. CR 241 NW 110th Tr. C C E F TRANSITIONING MAJOR COUNTY ROADWAYS A-28 Rocky Pt. Rd. SR 331/Williston Rd. US 441/SW 13th St. B B D F A-34 NW 53rd Ave. Interstate 75 NW 52nd Terr. B B E F A-35 SW 122nd St./Parker Rd. GMA Boundary SR 26/Newberry Rd. B C D F A-38 SE 43rd St. SR 20/Hawthorne Rd. SR 26/E. University Ave. B C C D A-39 SW 91st St. Archer Road SW 44th Ave. B D D F TRANSITIONING OTHER SIGNALIZED ROADWAYS A-31 Monteocha Road NE 53rd Ave. NE 77th Ave. B B D F A-41 SW 62nd Ave./SW 63rd Blvd. SR 121 SR 24/Archer Road B D D F A-42 CR 329B/Lakeshore Dr. SR 20/Hawthorne Rd. SR 26/E. University Ave. B B D F A-43 NE 77th Ave./CR 225A NE 38th St. SR 24 / Waldo Rd. B A D F A-46 NW 32nd Ave. GMA Boundary CR 241/NW 143rd St. C C C F SOURCE: NORTH CENTRAL FLORIDA REGIONAL PLANNING COUNCIL Note: This table is not intended to be used for concurrency management purposes, since bike, pedestrian or transit LOS Standards do not exist. It is for information only. Roadway facilities in shaded rows are also ART-PLAN, HIGHPLAN or FREEPLAN analyzed. T\MIKE\los\los11\multimodal\10kmmlos.xls Roadway facilities in italics have full field study inputs
158
159 TABLE 6 MULTIMODAL LEVEL OF SERVICE SUMMARY FOR CITY OF GAINESVILLE / UNIVERSITY OF FLORIDA ROADS WITHIN THE GAINESVILLE METROPOLITAN AREA BOUNDARY Updated 09/11 ASSIGNED FROM SOUTH TO NORTH ROADWAY OR WEST OR EAST LEVEL OF SERVICE NUMBER ROADWAY TERMINI TERMINI AUTOMOBILE BICYCLE PEDESTRIAN TRANSIT URBANIZED ARTERIAL ROADWAYS G-1 NW 55th St. SR 26/Newberry Rd. NW 23rd Ave. C C C C G-2 N 8th Ave. SR 26/Newberry Rd. W 22nd St. B D D F G-3 N 8th Ave. NW 22nd St. NW 6th St. D E D F G-4 SW 62nd Blvd. SR 26/Newberry Rd. SW 20th Ave. B E F B G-36 NW 31st Ave/Glen Springs R SR 121/W 34th St. NW 16th Terr. B D C C G-38 NW 23rd Blvd. NW 16th Terr. US 441/W 13th St. C C B B URBANIZED MAJOR CITY ROADWAYS G-5 NW 22nd St SR 26/University Ave. NW 16th Ave. B D C F G-6 N 8th Ave. N Main St. SR 24/Waldo Rd. D D D D G-7 S 2nd Ave. US 441/W 13th St. SE 7th St. D B C B G-9 W 6th St. SW 4th Ave. NW 8th Ave. D D C E G-37 SW 23rd Terr. SR 331/Williston Rd. SR 24/Archer Rd. B C C A URBANIZED OTHER SIGNALIZED ROADWAYS G-8 W 6th St. SW 16th Ave. SW 4th Ave. C D C F G-10 NE 9th St. SE 2nd Ave. NE 31st Ave. C B C F G-11 NW 38th St. NW 8th Ave. NW 16th Ave C A C F G-12 NW 24th Blvd. SR 222/NW 39th Ave. NW 53rd Ave. B D C F G-14 NE 15th St. SR 26/E University Ave. NE 8th Ave. C D C F G-15 NE 15th St. NE 16th Ave. SR 222/NE 39th Ave. B D C D G-16 NE 25th St. SR 26/E University Ave. NE 8th Ave. C D C C G-17 SE 4th St. SR 331/Williston Rd. Depot Ave. C D C E G-18 SE 4th St.-SE 22nd Ave. SR 331/Williston Rd. SE 15th St. B D C B G-19 N 8th Ave SR 24/Waldo Road NE 25th St. C D C C G-20 S 4th Ave. US 441/SW 13th St. SE 15th St. C D C D G-21 SW 9th Rd.-Depot Ave.-SE 7US 441/SW 13th St. SE 15th St. C D C D G-22 S 2nd Ave. SE 7th St. SR 331/Williston Rd. C A B F G-23 NE 31st Ave. N Main St. SR 24/Waldo Road C C C F G-24 NW 17th St. SR 26/W University Ave. NW 8th Ave. C B C F G-25 W 12th St. SW 4th Ave. NW 8th Ave. D C C F G-26 W 10th St. SW 4th Ave. NW 8th Ave. D C C F G-27 SW 16th St. SW 16th Ave. SR 24/Archer Rd. C B C A G-28 NW 5th Ave. NW 22nd St. US 441/NW 13th St. C C C F G-29 W. 3rd St. SW 4th Ave. NW 8th Ave. C B B F G-30 W. 2nd St. SW 4th Ave. NW 8th Ave. C B B F G-31 Gale Lemerand Dr. SR 24/Archer Rd. Museum Rd. C B C A G-32 Radio Rd.-Museum Rd. SR 121/S 34th St. US 441/S 13th St. F C D A G-33 E 1st St. SE 2nd Pl. NE 8th Ave. C C C F G-34 E 3rd St. SE Depot Ave. NE 2nd Ave. D D C A G-35 Hull Rd.-Mowry Rd SW 34th St. Center Dr. E C C A G-39 Gale Lemerand Dr. Museum Rd. SR 26/W University Ave. F C D A TRANSITIONING OTHER SIGNALIZED ROADWAYS G-13 N Main St. SR 222/NW 39th Ave. NW 53rd Ave. B C D F SOURCE: NORTH CENTRAL FLORIDA REGIONAL PLANNING COUNCIL t\mike\los\los11\multimodal\10cmmlos.xlsx Note: This table is not intended to be used for concurrency management purposes, since bike, pedestrian or transit LOS Standards do not exist. It is for information only. Roadway facilities in shaded rows are also ART-PLAN, HIGHPLAN or FREEPLAN analyzed. Roadway facilities in italics have full field study inputs
160
161 METROPOLITAN TRANSPORTATION PLANNING ORGANIZATION (MTPO) FOR THE GAINESVILLE URBANIZED AREA YEAR 2010 ANNUAL AVERAGE DAILY TRAFFIC MULTIMODAL LEVEL OF SERVICE REPORT LEVEL OF SERVICE TABLES GAINESVILLE METROPOLITAN AREA CONGESTION MANAGEMENT PROCESS January 12, 2012 Prepared by: North Central Florida Regional Planning Council 2009 NW 67 Place Gainesville, Florida T:\Mike\los\los11\LOSTBLCV.docx
162 T:\Mike\los\los11\LOSTBLCV.docx [Page left Blank Intentionally]
163 TABLE 1 HIGHWAY LEVEL OF SERVICE DATA FOR STATE ROADS WITHIN THE GAINESVILLE METROPOLITAN AREA BOUNDARY Page 1 of 2 FDOT Generalized Tables analysis 06/11 ASSIGNED FROM SOUTH TO NORTH NUMBER FDOT SIGNAL OR ADOPTED F PERCENT AVAILABLE H ROADWAY OR WEST OR EAST OF ROADWAY DENSITY / LEFT TURN LOS MAXIMUM SERVICE VOLUME OF SERVICE LEVEL OF SERVICE A B C D E G NUMBER ROADWAY TERMINI TERMINI SPECIAL NOTE LANES CLASS LENGTH (MILES) ADJUSTMENT STD TABLE CALCULATED NEGOTIATED CAPACITY VOLUME AADT TABLE CALCULATED I URBANIZED ROADWAYS S-2 US 441/W 13th St. SR 331/Williston Rd. SR 24/Archer Rd. Multimodal Corridor 4-D I Arterial 1.60 / 1.9 NO D 36,700 - TCEA 51% 17,900 18,800 B - S-3 US 441/W 13th St. SR 24/Archer Rd. SR 26/University Ave. Multimodal Corridor 4-D III Arterial 8.56 /0.7 NO D 28,200 - TCEA 124% (6,800) 35,000 F - S-4 US 441/W 13th St. SR 26/University Ave. NW 29th Rd. Multimodal Corridor 4-D III Arterial 4.82 / 1.9 NO D 28,200 - TCEA 105% (1,300) 29,500 F - S-5 US 441/W 13th St. NW 29th Rd. N.W. 23rd St. Multimodal Corridor 4-D I Arterial 1.46 / 2.7 NO D 36,700 - TCEA 65% 12,700 24,000 B - S-6 SR 20/NW 6th St. N.W. 8th Ave. SR 222/N 39th Ave. - 4-U II Arterial 2.0 / 2.0-5% D 31,540 - TCEA 47% 16,640 14,900 C - S-7 SR 20/NW 6th St. SR 222/N 39th Ave. US 441/W. 13th St. - 4-U I Arterial 1.07 / 0.9-5% D 34,865 - TCEA 26% 25,965 8,900 B - S-8 SR 20/Hawthorne Rd. SR 24/Waldo Rd. SE 43rd St. SIS / FIHS / Multimodal Corridor 4-D II Arterial 2.28 / 2.6 NO C 25,000 - TCEA (part) 56% 11,000 14,000 C - S-9 SR 24/Archer Rd. SW 75th St/Tower Rd. Interstate 75 Multimodal Corridor 4-D I Arterial 1.26 / 2.4 NO D 36,700 - TCEA 72% 10,450 26,250 B - S-10 SR 24/Archer Rd. Interstate 75 SR 121/SW 34th St. Multimodal Corridor 6-D II Arterial 3.75 / 1.2 NO D 50,300 - TCEA 96% 1,790 48,510 D - S-11 SR 24/Archer Rd. SR 226/SW 16th Ave. US 441/W 13th St. Multimodal Corridor 4-D II Arterial 4.03 / 1.1 NO D 33,200 - TCEA 90% 3,200 30,000 D - S-12 SR 24/Waldo Rd. SR 26/University Ave. SR 222/E 39th Ave. SIS Connector [part] / 4-D I Arterial 1.48 / 2.6 NO D 36,700 - TCEA 68% 11,823 24,877 B - Multimodal Corridor S-14 SR 26/Newberry Rd. NW 122nd St. Interstate-75 [west ramp] SIS / FIHS / Multimodal Corridor 4-D I Arterial 1.90 / 3.2 NO C 35,500 - TCEA (part) 108% (3,000) 38,500 F - S-15 SR 26/Newberry Rd. Interstate-75 [west ramp]nw 8th Ave. Multimodal Corridor / Constrained 6-D III Arterial 6.87 / 1.2 NO D 43,700 - TCEA 111% (4,800) 48,500 F - S-16 SR 26/Newberry Rd. NW 8th Ave. SR 121/W 34th St. Multimodal Corridor 4-D II Arterial 4.59 / 1.7 NO D 33,200 - TCEA 95% 1,700 31,500 D - S-17 SR 26/University Ave. SR 121/W 34th St. Gale Lemerand Dr. Multimodal Corridor / Constrained 3-U II Arterial 3.67 / 1.4.5*4LnPDF+.5*2LnOPDF D 24,200 - TCEA 95% 1,200 23,000 D - S-18 SR 26/University Ave. Gale Lemerand Dr. US 441/W 13th St. Multimodal Corridor 4-D III Arterial 6.34 / 0.6 NO D 28,200 - TCEA 101% (300) 28,500 D - S-19 SR 26/University Ave. US 441/W 13th St. SR 24/Waldo Rd. Multimodal Corridor 4-D III Arterial 7.72 / 1.7 NO D 28,200 - TCEA 76% 6,700 21,500 D - S-20 SR 26/University Ave. SR 20/Hawthorne Rd. CR 329B/Lakeshore Dr. Multimodal Corridor 4-D I Arterial 0.71 / 2.8 NO D 36,700 - TCEA (part) 23% 28,100 8,600 B - S-21 SR 26A/SW 2nd Ave. SR 26/Newberry Rd. SR 121/W 34th St. Multimodal Corridor 2-D III Arterial 6.37 / % D 12,495 - TCEA 120% (2,505) 15,000 E - S-22 SR 26A/SW 2nd Ave. SR 121/SW 34th St. SR 26/University Ave. Multimodal Corridor 2-U I Arterial 0.76 / % D 13,200 - TCEA 97% ,850 D - S-23 SR 121/W 34th St. SR 331/Williston Rd. SR 24/Archer Rd. Multimodal Corridor 6-D II Arterial 3.12 / 1.6 NO D 50,300 - TCEA 51% 24,778 25,522 C - S-24 SR 121/W 34th St. SR 24/Archer Rd. SR 26/University Ave. Multimodal Corridor 6-D II Arterial 4.04 / 1.7 NO D 50,300 - TCEA (part) 81% 9,550 40,750 D - S-25 SR 121/W 34th St. SR 26/University Ave. NW 16th Ave. Multimodal Corridor 2-D II Arterial 2.0 / % D 15,960 - TCEA 114% (2,240) 18,200 F - S-26 SR 121/W 34th St. NW 16th Ave. SR 222/W 39th Ave. Multimodal Corridor 2-U I Arterial 1.33 / 1.5 NO D 16,500 - TCEA 89% 1,750 14,750 C - S-27 SR 121/W 34th St. SR 222/NW 39th Ave. NW 53rd Ave. Multimodal Corridor 2-U I Arterial 0.78 /2.2 NO D 16,500 - TCEA 90% 1,700 14,800 C - S-29 SR 222/N 39th Ave. NW 98th St. NW 83rd St. SIS Connector 4-D II Arterial 3.71 / 1.4 NO D 33,200 - TCEA 63% 12,407 20,793 C - S-30 SR 222/N 39th Ave. US 441/NW 13th St. SR 24/Waldo Rd. SIS Connector 4-D I Arterial 1.64 / 3.0 NO D 36,700 - TCEA 45% 20,300 16,400 B - S-31 SR 222/N 39th Ave. SR 24/Waldo Rd. End of 4-lane section SIS Connector 4-D I Arterial 1.16 / 0.9 NO D 36,700 - TCEA 37% 23,200 13,500 B - S-32 SR 222/N 39th Ave. End of 4-lane section GMA Boundary - 2-U Unsignalized 0.0 / 2.5 NO D 22,200 - TCEA (part) 45% 12,300 9,900 C - S-33 SR 226/S 16th Ave SR 24/Archer Rd. US 441/W 13th St. - 4-D II Arterial 4.36 / 0.9 NO D 33,200 - TCEA 61% 13,100 20,100 C - S-34 SR 226/S 16th Ave US 441/W 13th St. SR 329/Main St. - 4-D II Arterial 2.77 / 0.7 NO D 33,200 - TCEA 52% 15,900 17,300 C - S-35 SR 226/S 16th Ave SR 329/Main St. SR 331/Williston Rd. - 2-U I Arterial 1.81 / 0.6 NO D 16,500 - TCEA 50% 8,300 8,200 B - S-36 SR 120A/N 23rd Ave. US 441/W 13th St. SR 24/Waldo Rd. SIS Connector [part] 4-U II Arterial 2.36 / % D 24,900 - TCEA 52% 12,000 12,900 C - Roadway facilities in shaded rows are also ART-PLAN, HIGHPLAN or FREEPLAN analyzed. Roadway facilities in italics have full field study inputs
164 TABLE 1 - Continued HIGHWAY LEVEL OF SERVICE DATA FOR STATE ROADS WITHIN THE GAINESVILLE METROPOLITAN AREA BOUNDARY Page 2 of 2 FDOT Generalized Tables analysis 06/11 ASSIGNED FROM SOUTH TO NORTH NUMBER FDOT SIGNAL OR ADOPTED F PERCENT AVAILABLE H ROADWAY OR WEST OR EAST OF ROADWAY DENSITY / LEFT TURN LOS MAXIMUM SERVICE VOLUME OF SERVICE LEVEL OF SERVICE A B C D E G NUMBER ROADWAY TERMINI TERMINI SPECIAL NOTE LANES CLASS LENGTH (MILES) ADJUSTMENT STD TABLE CALCULATED NEGOTIATED CAPACITY VOLUME AADT TABLE CALCULATED I URBANIZED ROADWAYS S-37 SR 329/Main St. University Ave. N. 8th Ave. - 2-D II Arterial 4.0 /0.5 +5% D 15,960 - TCEA 94% ,050 D - S-38 SR 331/SR 121 Interstate 75 (south) US 441/SW 13th St. SIS / FIHS 4-D I Arterial 1.79 / 2.2 NO C 35,500 - TCEA (part) 71% 10,250 25,250 B - S-39 SR 331/Williston Rd. US 441/SW 13th St. SR 26/University Ave. SIS / FIHS 4-D I Arterial 1.76 / 3.4 NO C 35,500 - TCEA 54% 16,300 19,200 B - S-40 SR 20/NW 8th Ave. NW 6th St. N Main St. - 4-D II Arterial 2.83 / 0.4 NO D 33,200 - TCEA 50% 16,700 16,500 C - S-41 Interstate 75 SR 331/SR 121 SR 24/Archer Rd. SIS / FIHS 6-D Freeway 0.0 / 1.3 N/A C 90, % 28,500 62,000 B - S-42 Interstate 75 SR 24/Archer Rd. SR 26/Newberry Rd. SIS / FIHS 6-D Freeway 0.0 / 3.5 N/A C 90, % 19,000 71,500 C - S-43 Interstate 75 SR 26/Newberry Rd. SR 222/NW 39th Ave. SIS / FIHS 6-D Freeway 0.0 / 2.6 N/A C 90, % 24,000 66,500 C - S-46 SR 26/University Ave. CR 329B GMA Boundary Multimodal Corridor 2-U I Arterial 0.29 / 3.4 NO D 16,500 - TCEA (part) 30% 11,600 4,900 B - S-50 US 441 NW 23rd St. GMA Boundary Multimodal Corridor 4-D I Arterial 0.16 / 6.1 NO D 36,700 - TCEA (part) 48% 19,000 17,700 B - S-52 Interstate 75 SR 222/NW 39th Ave. GMA Boundary SIS / FIHS 6-D Freeway 0.0 / 1.2 N/A C 90, % 36,500 54,000 B - S-53 SR 222/N 39th Ave. NW 51st St. US 441/NW 13th St. SIS Connector 4-D I Arterial 1.71 /3.5 NO D 36,700 - TCEA 72% 10,200 26,500 B - S-54 SR 121/W 34th St. NW 53rd Ave. US 441/W 13th St. Multimodal Corridor 2-U I Arterial 1.12 / 0.9 NO D 16,500 - TCEA 57% 7,100 9,400 B - S-55 SR 24/Archer Rd. SR 121/SW 34th St. SR 226/SW 16th Ave. Multimodal Corridor 6-D II Arterial 2.35 / 1.3 NO D 50, % (1,950) 52,250 E - S-56 SR 222/N 39th Ave. NW 83rd St. NW 51st St. SIS Connector 4-D I Arterial 0.50 / 1.9 NO D 36,700 - TCEA 78% 8,200 28,500 B - J TRANSITIONING ROADWAYS S-1 US 441/W 13th St. Payne's Prairie SR 331/Williston Rd. Multimodal Corridor 4-D I Arterial 0.46 / 2.2 NO D 33, % 21,550 12,250 B - S-13 SR 24/Waldo Rd. SR 222/E 39th Ave. CR 255A/NE 77th Ave. Multimodal Corridor 4-D I Arterial 0.44 / 4.5 NO D 33,800 - TCEA (part) 46% 18,400 15,400 B - S-28 SR 121/W 34th St. US 441/W 13th St. CR 231 Multimodal Corridor 2-U I Arterial 0.71 / 1.4 NO D 15,200 - TCEA (part) 65% 5,265 9,935 C - S-44 SR 121 S.W. 85th Ave. Interstate 75 (south) Multimodal Corridor 2-U I Arterial 0.39 / 2.5 NO D 15, % 6,900 8,300 B - S-45 SR 26/Newberry Rd. S.W. 154th St. NW 122nd St. SIS / FIHS 4-D I Arterial 0.55 / 1.8 NO C 32, % 15,450 16,650 B - S-47 SR 24/Archer Rd. GMA Boundary SW 75th St/Tower Rd. Multimodal Corridor 2-D I Arterial 1.19 / % D 15,960 - TCEA 116% (2,540) 18,500 F - S-48 SR 20/Hawthorne Rd. SE 43rd St. CR 329B/Lakeshore Dr. SIS / FIHS / Multimodal Corridor 4-D I Arterial 0.98 / 1.0 NO C 32, % 20,500 11,600 B - S-49 SR 20/Hawthorne Rd. CR 329B GMA Boundary SIS / FIHS / Multimodal Corridor 4-D Unsignalized 0.0 / 1.3 NO C 45, % 36,200 9,200 B - S-51 Interstate 75 GMA Boundary SR 331/SR 121 SIS / FIHS 6-D Freeway 0.0 / 1.3 N/A C 86, % 25,233 61,367 B - SOURCE: NORTH CENTRAL FLORIDA REGIONAL PLANNING COUNCIL t\mike\los\los11\10sdatan.xlsx Roadway facilities in shaded rows are also ART-PLAN, HIGHPLAN or FREEPLAN analyzed. Freeway [<2mi] Freeway facility witn Interchange spacing less than 2 miles apart Freeway [>=2mi] Freeway facility witn Interchange spacing equal to or greater than 2 miles apart Roadway facilities in italics have full field study inputs
165 TABLE 2 HIGHWAY LEVEL OF SERVICE DATA FOR ALACHUA COUNTY ROADS WITHIN THE GAINESVILLE METROPOLITAN AREA BOUNDARY Page 1 of 2 FDOT Generalized Tables analysis 9/11 ASSIGNED FROM SOUTH TO NORTH NUMBER FDOT SIGNAL OR ADOPTED F PERCENT AVAILABLE H ROADWAY OR WEST OR EAST OF ROADWAY DENSITY / LEFT TURN LOS MAXIMUM SERVICE VOLUME OF SERVICE LEVEL OF SERVICE A B C D E G NUMBER ROADWAY TERMINI TERMINI SPECIAL NOTE LANES CLASS LENGTH (MILES) ADJUSTMENT STD TABLE CALCULATED NEGOTIATED CAPACITY VOLUME AADT TABLE CALCULATED I URBANIZED ROADWAYS A-1 / AC-010 NW 53rd Ave. NW 52nd Terr. US 441/W 13th St. - 2-U I Arterial 1.22 / D 15,675 - TCEA 77% 3,638 12,037 C - A-3 / AC-025 NW 43rd St. SR 26/Newberry Rd. NW 53rd Ave. - 4-D II Arterial 2.13 / D 31,540 - TCEA (part) 86% 4,409 27,131 D - A-6 / AC-030 NW 43rd St. NW 53rd Ave. US U I Arterial 0.2 / D 15,675 - TCEA (part) 69% 4,873 10,802 C - A-9 / AC-040 NW 23rd Ave. NW 98th St. NW 55th St. - 2-U I Arterial 1.0 / D 15,675 - TCEA 101% (95) 15,770 F - A-10 / AC-035 NW 23rd Ave. NW 55th St. NW 43rd St. - 4-D II Arterial 2.65 / D 31,540 - TCEA 66% 10,719 20,821 C - A-11 NW 16th Ave. NW 43rd St. US 441/W 13th St. - 4-D I Arterial 1.6 / D 34,865 - TCEA 59% 14,414 20,451 B - A-12 N 16th Ave. US 441/W. 13th St. SR 24/Waldo Road - 2-U II Arterial 2.22 / % D 15,160 - TCEA 80% 3,033 12,127 D - A-13 / AC-090 SW 75th St/Tower Rd. SR 24/Archer Road SW 8th Ave. - 2-U I Arterial 0.94 / D 15,675 - TCEA 90% 1,620 14,055 C - A-14 / AC-085 NW 75th St/Tower Rd. SW 8th Ave. SR 26/Newberry Rd. - 4-D II Arterial 3.00 / D 31,540 - TCEA 73% 8,567 22,973 C - A-15 / AC-060 SW 20th Ave. SW 75th St/Tower Rd SW 62nd Blvd. Multimodal Corridor 2-U I Arterial 0.57 / D 15,675 - TCEA 95% ,856 D - A-16 / AC-055 SW 20th Ave. SW 62nd Blvd. SR 121/W 34th St. Multimodal Corridor 2-U I Arterial 1.21 / D 15,675 - TCEA 137% (5,849) 21,524 F - A-17 N Main St. NW 8th Ave. NW 23rd Ave. - 4-U II Arterial 2.84 / % D 23,655 - TCEA 58% 10,009 13,646 C - A-18 N Main St. NW 23rd Ave. SR 222/N 39th Ave. - 4-D I Arterial 1.0 / D 34,865 - TCEA 44% 19,600 15,265 B - A-19 / AC-095 NW 39th Ave. NW 112th St. NW 98th St. - 2-U II Arterial 2.52 / % D 11,550 - TCEA 99% ,389 D - A-47 S Main St. Williston Rd. University Ave. - 4-D II Arterial 2.43 /2.5 - D 31,540 - TCEA 39% 19,340 12,200 C - A-20 / AC-065 SW 24th Ave SW 91st St. SW 75th St./Tower Rd. - 2-U I Major County Roadway 1.0 / D 14, % 3,728 11,122 C - A-21 / AC-120 NW 51st St. NW 23rd Ave. SR 222/NW 39th Ave. - 2-U II Major County Roadway 3.00 / D 13,680 - TCEA 65% 4,784 8,896 C - A-22 / AC-110 NW 98th St. SR 26/Newberry Rd. CR 222/NW 39th Ave. - 2-U I Major County Roadway 0.96 / D 14,850 - TCEA 69% 4,561 10,289 C - A-23 / AC-130 NW 83rd St. NW 23rd Ave. SR 222/NW 39th Ave. - 2-U II Major County Roadway 3.0 / D 13,680 - TCEA 103% (477) 14,157 E - A-24 / AC-165 W 91st St. SW 24th Ave. SR 26/Newberry Rd. - 2-U I Major County Roadway 0.50 / D 14,850 - TCEA 52% 7,142 7,708 B - A-26 / AC-140 SW 8th Ave. SW 91st St. SW 75th St./Tower Rd. - 2-U I Major County Roadway 1.0 / D 14,850 - TCEA 32% 10,171 4,679 B - A-29 / AC-280 Kincaid Loop SR 20/Hawthorne Rd. SR 20/Hawthorne Rd. - 2-U I Major County Roadway 0.38 / D 14,850 - TCEA (part) 26% 10,924 3,926 B - A-30 / AC-400 SW 40th Blvd./ SR 24/Archer Rd. SW 20th Ave. - 2-D II Major County Roadway 2.23 / % D 14,365 - TCEA 80% 2,914 11,451 D - SW 42nd/43rd St. A-33 SW 24th Ave SW 122nd St./Parker Rd. SW 91st St. - 2-U I Major County Roadway 0.50 / D 14,850 - TCEA (part) 44% 8,353 6,497 B - A-36 SW 8th Ave. SW 122nd St./Parker Rd. SW 91st St. - 2-U I Major County Roadway 0.50 / D 14,850 - TCEA (part) 13% 12,852 1,998 B - A-45 / AC-160 Ft. Clarke Blvd. SR 26/Newberry Rd. NW 23rd Avenue - 2-U I Major County Roadway 1.84 / D 14,850 - TCEA 92% 1,236 13,614 C - A-40 / AC-180 SW 46th Blvd. SW 104th Tr. Tower Road - 2-D I Other Signalized Roadway 0.43 / % D 11,260 - TCEA 47% 6,003 5,257 B - A-44 / AC-095 SW 75th St. GMA Boundary SR 24/Archer Road - 2-U I Other Signalized Roadway 1.33 / D 10,725 - TCEA 29% 7,602 3,123 B - Roadway sections in shaded rows are also ARTPLAN or HIGHPLAN analyzed. Roadway sections in italic text are full field study analyses.
166 TABLE 2 - Continued HIGHWAY LEVEL OF SERVICE DATA FOR ALACHUA COUNTY ROADS WITHIN THE GAINESVILLE METROPOLITAN AREA BOUNDARY Page 2 of 2 FDOT Generalized Tables analysis 9/11 ASSIGNED FROM SOUTH TO NORTH NUMBER FDOT SIGNAL OR ADOPTED F PERCENT AVAILABLE H ROADWAY OR WEST OR EAST OF ROADWAY DENSITY / LEFT TURN LOS MAXIMUM SERVICE VOLUME OF SERVICE LEVEL OF SERVICE A B C D E G NUMBER ROADWAY TERMINI TERMINI SPECIAL NOTE LANES CLASS LENGTH (MILES) ADJUSTMENT STD TABLE CALCULATED NEGOTIATED CAPACITY VOLUME AADT TABLE CALCULATED J TRANSITIONING ROADWAYS A-2 / AC-005 N 53rd Ave. US 441/W 13th St. SR 24/Waldo Rd. - 2-U I Arterial 0.50 / D 14,440 - TCEA (part) 87% 1,882 12,558 C - A-32 / AC-240 W 143rd St./CR 241 SR 26/Newberry Road GMA Boundary - 2-U I Arterial 0.38 / D 14, % 4,032 10,408 C - A-37 / AC-100 NW 39th Ave. CR 241 NW 112th St. - 2-U I Arterial 0.45 / D 14, % 4,891 9,549 C - A-28 / AC-275 Rocky Pt. Rd. SR 331/Williston Rd. US 441/SW 13th St. - 2-U I Major County Roadway 0.44 / D 13, % 10,460 3,220 B - A-34 / AC-105 NW 53rd Ave. Interstate 75 NW 52nd Terr. - 2-U I Major County Roadway 0.23 / D 13,680 - TCEA (part) 43% 7,819 5,861 B - A-35 / AC-210 SW 122nd St./Parker Rd. GMA Boundary SR 26/Newberry Rd. - 2-U I Major County Roadway 0.33 / D 13, % 6,749 6,931 B - A-38 / AC-290 SE 43rd St. SR 20/Hawthorne Rd. SR 26/E. University Ave. - 2-U I Major County Roadway 0.88 / D 13, % 10,395 3,285 B - A-39 / AC-270 SW 91st St. Archer Road SW 24th Ave. - 2-D I Major County Roadway 0.66 / % D 14,365 - TCEA 44% 7,999 6,366 B - A-31 / AC-285 Monteocha Road NE 53rd Ave. NE 77th Ave. - 3-U I Other Signalized Roadway 0.56 / D 14, % 11,864 2,826 B - A-41 / AC-200 SW 62nd Ave./ SR 121 SR 24/Archer Road - 2-U I Other Signalized Roadway 0.50 / D 9,880 - TCEA (part) 51% 4,800 5,080 B - SW 63rd Blvd. A-42 / AC-295 CR 329B/Lakeshore Dr. SR 20/Hawthorne Rd. SR 26/E. University Ave. - 2-U I Other Signalized Roadway 0.26 / D 9, % 9, B - A-43 / AC-300 NE 77th Ave./CR 225A NE 38th St. SR 24 / Waldo Rd. - 2-U I Other Signalized Roadway 0.84 / D 9, % 9, B - A-46 / AC-050 NW 32nd Ave. GMA Boundary CR 241/NW 143rd St. - 2-U II Other Signalized Roadway 3.78 / D 8, % 6,663 2,242 C - SOURCE: North Central Florida Regional Planning Council t\mike\los\los10\09kdatan.xlsx ARTERIAL - Analyzed Using State-Road Service Volumes Minus 5 percent MAJOR - Analysed as a Major City/County Roadway OTHER - Analysed as an Other City/County Roadway Roadway sections in shaded rows are also ARTPLAN or HIGHPLAN analyzed. Roadway sections in italic text are full field study analyses. NOTE: Roadway Sections A-39 and A-40 retain Transitioning Area LOS standards, but are analyzed by Urbanized Area Generalized Tables.
167 TABLE 3 HIGHWAY LEVEL OF SERVICE DATA FOR CITY OF GAINESVILLE / UNIVERSITY OF FLORIDA ROADS WITHIN THE GAINESVILLE METROPOLITAN AREA BOUNDARY Page 1 of 2 FDOT Generalized Tables analysis 06/11 ASSIGNED FROM SOUTH TO NORTH NUMBER FDOT SIGNAL OR ADOPTED F PERCENT AVAILABLE H ROADWAY OR WEST OR EAST SPECIAL OF ROADWAY DENSITY / LEFT TURN LOS MAXIMUM SERVICE VOLUME OF SERVICE LEVEL OF SERVICE A B C D E G NUMBER ROADWAY TERMINI TERMINI NOTE LANES CLASS LENGTH (MILES) ADJUSTMENT STD TABLE CALCULATED NEGOTIATED CAPACITY VOLUME AADT TABLE CALCULATED I URBANIZED ROADWAYS G-1 NW 55th St. SR 26/Newberry Rd. NW 23rd Ave. - 2-U I Arterial 1.0 / % E 12,540 - TCEA 67% 4,109 8,431 C - G-2 NW 8th Ave. SR 26/Newberry Rd. NW 22nd St. - 4-U I Arterial 1.43 / 2.8-5% E 33,120 - TCEA 50% 16,708 16,412 B - G-3 NW 8th Ave. NW 22nd St. NW 6th St. 2-U II Arterial 2.19 / % E 16,160 = TCEA 87% 2,059 14,101 D - G-4 SW 62nd Blvd. SW 20th Ave. SR 26/Newberry Rd. - 2-U / 4-U I Arterial 1.18 / E 33,120 - TCEA 65% 11,578 21,542 B - G-36 NW 31st Ave/Glen Springs Rd. SR 121/NW 34th St. NW 16th Terr. - 2-U I Arterial 0.45 / E 15,675 - TCEA 39% 9,531 6,144 B - G-38 NW 23rd Blvd. NW 16th Terr. US 441/NW 13th St. - 2-D II Arterial 4.07 / % E 16,160 - TCEA 64% 5,844 10,316 C - G-5 NW 22nd St SR 26/University Ave. NW 16th Ave. - 2-U I Major City Roadway 2.0 / E 14,850 - TCEA 46% 8,001 6,849 B - G-6 NE 8th Ave. N Main St. SR 24/Waldo Rd. - 2-U II Major City Roadway 3.6* / E 14,580 - TCEA 72% 4,082 10,498 D - G-7 S 2nd Ave. US 441/SW 13th St. SE 7th St. - 2-D III Major City Roadway 9.29* / % E 14,080 - TCEA 40% 8,517 5,563 D - G-9 W 6th St. SW 4th Ave. NW 8th Ave. - 2-U II Major City Roadway 4.03 / % E 11,665 - TCEA 70% 3,468 8,197 D - G-37 SW 23rd Terr. SR 331/Williston Rd. SR 24/Archer Rd. - 2-U I Major City Roadway 0.69 / % E 15,595 - TCEA 54% 7,164 8,431 B - G-8 W 6th St. SW 16th Ave. SW 4th Ave. - 4-D II Other Signalized Roadway 2.50 / E 22,815 - TCEA 26% 16,833 5,982 C - G-10 E 9th St. SE 2nd Ave. NE 31st Ave. - 2-U II Other Signalized Roadway 2.31 / E 10,530 - TCEA 42% 6,073 4,457 C - G-11 NW 38th St. NW 8th Ave. NW 16th Ave - 2-U II Other Signalized Roadway 4.03 / E 10,530 - TCEA 18% 8,682 1,848 C - G-12 NW 24th Blvd. SR 222/NW 39th Ave. NW 53rd Ave. - 2-U I Other Signalized Roadway 1.84 / % E 8,580 - TCEA 36% 5,479 3,101 B - G-14 NE 15th St. SR 26/E University Ave. NE 8th Ave. - 2-U II Other Signalized Roadway 2.0 / % E 8,425 - TCEA 59% 3,458 4,967 C - G-15 NE 15th St. NE 16th Ave. SR 222/NE 39th Ave. - 2-U I Other Signalized Roadway 0.66 / E 10,725 - TCEA 46% 5,823 4,902 B - G-16 NE 25th St. SR 26/E University Ave. NE 8th Ave. - 2-U II Other Signalized Roadway 2.0 / % E 8,425 - TCEA 58% 3,525 4,900 C - G-17 SE 4th St. SR 331/Williston Rd. Depot Ave. - 2-U II Other Signalized Roadway 2.81 / % E 8,425 - TCEA 38% 5,260 3,165 C - G-18 SE 4th St.-SE 22nd Ave. SR 331/Williston Rd. SE 15th St. - 2-U I Other Signalized Roadway 1.21 / % E 8,580 - TCEA 37% 5,367 3,213 B - G-19 N 8th Ave SR 24/Waldo Road NE 25th St. - 2-U I Other Signalized Roadway 1.17 / E 10,725 - TCEA 60% 4,299 6,426 C - G-20 S 4th Ave. US 441/SW 13th St. SE 15th St. - 2-D II Other Signalized Roadway 3.94 / % E 11,055 - TCEA 36% 7,041 4,014 C - G-21 SW 9th Rd.-Depot Ave.-SE 7th Ave. US 441/SW 13th St. SE 15th St. - 2-U II Other Signalized Roadway 2.41 / E 10,530 - TCEA 43% 6,035 4,495 C - G-22 S 2nd Ave. SE 7th St. SR 331/Williston Rd. 2-D III Other Signalized Roadway 5.0 / % E 10,170 - TCEA 31% 6,996 3,174 C - G-23 NE 31st Ave. N Main St. SR 24/Waldo Road - 2-U II Other Signalized Roadway 3.61 / % E 8,425 - TCEA 25% 6,296 2,129 C - G-24 NW 17th St. SR 26/W University Ave. NW 8th Ave. - 2-U II Other Signalized Roadway 3.94 / % E 8,425 - TCEA 48% 4,394 4,031 C - G-25 W 12th St. SW 4th Ave. NW 8th Ave. - 2-U III Other Signalized Roadway 7.95 / % E 7,750 - TCEA 57% 3,329 4,421 D - G-26 W 10th St. SW 4th Ave. NW 8th Ave. - 2-U III Other Signalized Roadway 5.28 / E 9,685 - TCEA 37% 6,092 3,593 D - G-27 SW 16th St. SW 16th Ave. SR 24/Archer Rd. - 2-U II Other Signalized Roadway 4.07 / % E 11,055 - TCEA 42% 6,430 4,625 C - G-28 NW 5th Ave. NW 22nd St. US 441/NW 13th St. - 2-U III Other Signalized Roadway 5.76 / % E 7,750 - TCEA 25% 5,787 1,963 C - G-29 W. 3rd St. SW 4th Ave. NW 8th Ave. - 2-U 1-Way II Other Signalized Roadway 2.60 / % E 6,320 - TCEA 8% 5, C - G-30 W. 2nd St. SW 4th Ave. NW 8th Ave. - 2-U 1-Way II Other Signalized Roadway 3.75 /0.8-40% E 6,320 - TCEA 11% 5, C - G-31 Gale Lemerand Dr. SR 24/Archer Rd. Museum Rd. Univ. of Fla. 4-U II Other Signalized Roadway 3.58 / 0.6-5% E 21,675 - TCEA 63% 8,061 13,614 C - G-32 Radio Rd.-Museum Rd. SR 121/S 34th St. US 441/S 13th St. Univ. of Fla. 2-D I Other Signalized Roadway 1.93 / % E 11,260 - TCEA 121% (2,361) 13,621 F - G-33 E 1st St. SE 2nd Pl. NE 8th Ave. - 2-U III Other Signalized Roadway 6.52 / E 9,685 - TCEA 32% 6,565 3,120 C - G-34 E 3rd St. SE Depot Ave. NE 2nd Ave. - 2-U III Other Signalized Roadway / E 9,685 - TCEA 38% 5,986 3,699 D - G-35 Hull Rd.-Mowry Rd SW 34th St. Center Dr. Univ. of Fla. 2-U I Other Signalized Roadway 0.62 / E 10,725 - TCEA 82% 1,932 8,793 E - G-39 Gale Lemerand Dr. Museum Rd. SR 26/W University Ave. Univ. of Fla. 2-U II Other Signalized Roadway 3.84 / E 10,530 - TCEA 117% (1,838) 12,368 F - t\mike\los11\10cdatan.xls
168 TABLE 3 - Continued HIGHWAY LEVEL OF SERVICE DATA FOR CITY OF GAINESVILLE / UNIVERSITY OF FLORIDA ROADS WITHIN THE GAINESVILLE METROPOLITAN AREA BOUNDARY Page 2 of 2 FDOT Generalized Tables analysis 06/11 ASSIGNED FROM SOUTH TO NORTH NUMBER FDOT SIGNAL OR ADOPTED F PERCENT AVAILABLE H ROADWAY OR WEST OR EAST SPECIAL OF ROADWAY DENSITY / LEFT TURN LOS MAXIMUM SERVICE VOLUME OF SERVICE LEVEL OF SERVICE A B C D E G NUMBER ROADWAY TERMINI TERMINI NOTE LANES CLASS LENGTH (MILES) ADJUSTMENT STD TABLE CALCULATED NEGOTIATED CAPACITY VOLUME AADT TABLE CALCULATED I TRANSITIONING ROADWAYS G-13 N Main St. SR 222/NW 39th Ave. NW 53rd Ave. - 2-D I Other Signalized Roadway 1.0 / % E 10,375 - TCEA 48% 5,413 4,962 B - Roadway sections in shaded rows are also ART-PLAN analyzed. *Segment contains one or more traffic signals that have been converted to roundabouts/flashers. Roadway facilities in italics have full field study inputs t\mike\los11\10cdatan.xls
169 NOTES FOR TABLES 1, 2 & 3 HIGHWAY LEVEL OF SERVICE DATA ON STATE ROADS, COUNTY ROADS AND CITY OF GAINESVILLE ROADS WITHIN THE GAINESVILLE METROPOLITAN AREA (GMA) BOUNDARY TABLE NOTE 1,2,3 A - Constrained means that it is not feasible to add through lanes to meet current or future traffic needs due to physical, environmental or policy constraints. 1,2 SIS - Roadway facility is part of the Florida Strategic Intermodal System or an SIS Connector. These facilities are subject to the Florida Department of Transportation's (FDOT's) adopted Level of Service standards in accordance with Rule FIHS - Roadway facility is part of the Florida Intrastate Highway System. 1,2 Multimodal Corridor is a roadway within the GMA which has been identified in the Gainesville Multimodal Corridor and Park and Ride Study for multimodal use. 1,2,3 B - Number of lanes is the number of lanes continuing through a signalized intersection. 1,2,3 C - FDOT Roadway Class identifies the corridor analysis category in the revised FDOT Generalized Tables (October 4, 2010) of the 2009 Quality/Level of Service Handbook (Q/LOS Handbook). 1,2,3 D - Adjustments relate to the use of FDOT's Generalized Tables of the Q/LOS Handbook. 1,2,3 E - Minimum acceptable highway level of service (LOS) standards established by the entity responsible for maintaining the facility. 1,2,3 LOS M represents a degraded maximum service volume (MSV) permitted by FDOT. 1,2,3 F - Maximum service volumes for the minimum acceptable highway LOS are established by three different methods. NOTE: Refer to "Guidelines to Determining Level of Service and the Maximum Service Volumes for Roadways Within the Gainesville Metropolitan Area Boundary" in the LOS Report Technical Appendix. 1,2,3 Tables - these FDOT Generalized Tables of the Q/LOS Handbook volumes are based on statewide averages and may not reflect local conditions. These tables are used as a preliminary estimate and are considered sufficiently accurate for arterials where the average annual daily traffic (AADT) counts do not exceed 65% of the FDOT Generalized Tables service volume. 2 Roadway Facility S-17 is analyzed as a three-lane roadway in which the FDOT Generalized Tables service volumes for two- and four-lane roadways were averaged to estimate three-lane service volumes. 1,2,3 Calculated - ARTPLAN, FREEPLAN and/ or HIGHPLAN are FDOT computer programs which provide a more accurate MSV by allowing the use of local data in the analyses. These programs are used to estimate the service volume on arterials when the AADT counts exceed 65 percent of the FDOT Generalized Tables MSV. [MTPO staff updates of ARTPLAN files were suspended by the LOS Subcommittee in 2008] 1,2,3 Negotiated - service volumes set by agreements with the FDOT and/or Department of Community Affairs in areas which are established as special transportation areas, such as Transportation Concurrency Exception Areas (TCEAs), or on facilities which are designated as constrained. These service volumes are documented by the City of Gainesville and Alachua County Comprehensive Plans. The TCEA roadway facilities established by the City of Gainesville Comprehensive Plan Transportation Mobility Element are identified in these LOS Tables. T:\Mike\los\los11\TBLNOT10.docx
170 NOTES FOR TABLES 1, 2 & 3 (Continued) LEVEL OF SERVICE DATA ON STATE ROADS, COUNTY ROADS AND CITY OF GAINESVILLE ROADS WITHIN THE GAINESVILLE METROPOLITAN AREA (GMA) BOUNDARY TABLE NOTE 1,2,3 G - AADT - For roadway facilities that are Tier One-analyzed, the median of the three most recent annual traffic counts at each count station, then the median volume of the traffic count station median volumes is defined as the roadway facility AADT. For roadway facilities that are Tier Two-analyzed, such as ARTPLAN, the median of the three most recent annual traffic counts for each SEGMENT AADTs (traffic count nearest the traffic signal for the approach analyzed) are used in the calculation of the facility AADT. For ARTPLAN 2009 analyses, the traffic volume at the "sensitive" (usually the highest volume to capacity (v/c) ratio) SEGMENT is reported as the roadway facility AADT. In instances when a field study is conducted, then that single-year seasonal factor and axle factor-adjusted volume is reported as the roadway facility AADT. In cases where the ratchet method for MSV calculation generates an available service volume greater than that calculated by ARTPLAN 2009, then AADT=MSV-ASV. [In 2008, the LOS Subcommittee decided to use the latest year count rather than the three year median count and suspended MTPO staff Tier Two analyses during the installation of the Traffic Management System project.] 1 For Florida State Highway System roadways, the volumes are taken from the 2010 FDOT Traffic information CD-ROM. 2 For Alachua County roadways, the latest [year 2010] unfactored counts taken when the University of Florida, Santa Fe Community College and public schools are in session are used to determine current traffic. 3 For City of Gainesville roadways, the latest [year 2008, 2009 or 2010] unfactored counts taken when the University of Florida, Santa Fe Community College and public schools are in session are used to determine current traffic. 2,3 City and County arterials were analyzed using the State analysis groups with a five percent (5%) reduction in the service volume as described in the Q/LOS Handbook. 1,2,3 H - Tables - FDOT Generalized Tables analyses for urban and transitioning areas. 1,2,3 ARTPLAN - software used to estimate arterial highway level of service which replicates the calculations shown in the Highway Capacity Manual Highway LOS of arterials which have median AADT counts which exceed 65 percent of the FDOT Generalized Tables MSV at the minimum acceptable highway LOS were analyzed using ARTPLAN. 1 FREEPLAN, software used to estimate limited-access (freeway) highway level of service, was used to analyze limited-access highways which exceed 65% of the FDOT Generalized Tables MSV at the minimum acceptable highway LOS. 1 HIGHPLAN, software used to estimate urban 2-lane highway level of service, was used to analyze urban 2-lane highways which exceed 65% of the FDOT Generalized Tables MSV at the minimum acceptable highway LOS. 1,2,3 I - Urbanized Areas are the 2000 urbanized areas designated by the U.S. Bureau of Census as well as the surrounding geographical areas as agreed upon by the Florida Department of Transportation, the Metropolitan Transportation Planning Organization and the Federal Highway Administration. 1,2 J - Transitioning Areas are the areas outside urbanized areas that are planned to be included within the urbanized areas within the next 20 years based primarily on the U.S. Bureau of Census urbanized criteria of a population density of at least 1,000 people per square mile. T:\Mike\los\los11\TBLNOT10.docx
171 TABLE 4 MULTIMODAL LEVEL OF SERVICE SUMMARY FOR STATE ROADS WITHIN THE GAINESVILLE METROPOLITAN AREA BOUNDARY Updated 06/08/11 ASSIGNED FROM SOUTH TO NORTH ROADWAY OR WEST OR EAST LEVEL OF SERVICE NUMBER ROADWAY TERMINI TERMINI AUTOMOBILE BICYCLE PEDESTRIAN TRANSIT URBANIZED ROADWAYS S-2 US 441/W 13th St. SR 331/Williston Rd. SR 24/Archer Rd. B C C A S-3 US 441/W 13th St. SR 24/Archer Rd. SR 26/University Ave. F D B B S-4 US 441/W 13th St. SR 26/University Ave. NW 29th Rd. F D D D S-5 US 441/W 13th St. NW 29th Rd. N.W. 23rd St. B C D E S-6 SR 20/NW 6th St. NW 8th Ave. SR 222/N 39th Ave. C D C D S-7 SR 20/NW 6th St. SR 222/N 39th Ave. US 441/W. 13th St. B D C F S-8 SR 20/Hawthorne Rd. SR 24/Waldo Rd. SE 43rd St. C B C F S-9 SR 24/Archer Rd. SW 75th St/Tower Rd. Interstate 75 B C D E S-10 SR 24/Archer Rd. Interstate 75 SR 121/SW 34th St. D D D A S-11 SR 24/Archer Rd. SR 226/SW 16th Ave. US 441/W 13th St. D E D A S-12 SR 24/Waldo Rd. SR 26/University Ave. SR 222/E 39th Ave. B E D F S-14 SR 26/Newberry Rd. NW 122nd St. Interstate-75 [east ramp] F D D F S-15 SR 26/Newberry Rd. Interstate-75 [east ramp] NW 8th Ave. F E D D S-16 SR 26/Newberry Rd. NW 8th Ave. SR 121/W 34th St. D D D D S-17 SR 26/University Ave. SR 121/W 34th St. Gale Lemerand Dr. D C D C S-18 SR 26/University Ave. Gale Lemerand Dr. US 441/W 13th St. D D D B S-19 SR 26/University Ave. US 441/W 13th St. SR 24/Waldo Rd. D D D D S-20 SR 26/University Ave. SR 20/Hawthorne Rd. CR 329B/Lakeshore Dr. B D C E S-21 SR 26A/SW 2nd Ave. SR 26/Newberry Rd. SR 121/W 34th St. E D C B S-22 SR 26A/SW 2nd Ave. SR 121/SW 34th St. SR 26/University Ave. D D C A S-23 SR 121/W 34th St. SR 331/Williston Rd. SR 24/Archer Rd. C C D A S-24 SR 121/W 34th St. SR 24/Archer Rd. SR 26/University Ave. D C E A S-25 SR 121/W 34th St. SR 26/University Ave. NW 16th Ave. F D C F S-26 SR 121/W 34th St. NW 16th Ave. SR 222/W 39th Ave. C C C F S-27 SR 121/W 34th St. SR 222/NW 39th Ave. NW 53rd Ave. C C D E S-29 SR 222/N 39th Ave. NW 98th St. NW 83rd St. C C D F S-30 SR 222/N 39th Ave. US 441/NW 13th St. SR 24/Waldo Rd. B C C D S-31 SR 222/N 39th Ave. SR 24/Waldo Rd. End of 4-lane section B C C F S-32 SR 222/N 39th Ave. End of 4-lane section GMA Boundary C C D F S-33 SR 226/S 16th Ave SR 24/Archer Rd. US 441/W 13th St. C D C A S-34 SR 226/S 16th Ave US 441/W 13th St. SR 329/Main St. C D C A S-35 SR 226/S 16th Ave SR 329/Main St. SR 331/Williston Rd. B B D C S-36 SR 120A/N 23rd Ave. US 441/W 13th St. SR 24/Waldo Rd. C D C E S-37 SR 329/Main St. University Ave. N. 8th Ave. D C D D S-38 SR 331/SR 121 Interstate 75 (south) US 441/SW 13th St. B C D B S-39 SR 331/Williston Rd. US 441/SW 13th St. SR 26/University Ave. B C D F S-40 SR 20/NW 8th Ave. NW 6th St. N Main St. C C C F S-41 Interstate 75 SR 331/SR 121 SR 24/Archer Rd. B N/A N/A N/A S-42 Interstate 75 SR 24/Archer Rd. SR 26/Newberry Rd. C N/A N/A N/A S-43 Interstate 75 SR 26/Newberry Rd. SR 222/NW 39th Ave. C N/A N/A N/A S-46 SR 26/University Ave. CR 329B GMA Boundary B B D F S-50 US 441 NW 23rd St. GMA Boundary B C E F S-52 Interstate 75 SR 222/NW 39th Ave. GMA Boundary B N/A N/A N/A S-53 SR 222/N 39th Ave. NW 51st St. US 441/NW 13th St. B C D E S-54 SR 121/W 34th St. NW 53rd Ave. US 441/W 13th St. B B D D S-55 SR 24/Archer Rd. SR 121/SW 34th St. SR 226/SW 16th Ave. E E E A S-56 SR 222/N 39th Ave. NW 83rd St. NW 51st St. B C E E TRANSITIONING ROADWAYS S-1 US 441/W 13th St. Payne's Prairie SR 331/Williston Rd. B C D A S-13 SR 24/Waldo Rd. SR 222/E 39th Ave. CR 255A/NE 77th Ave. B C D F S-28 SR 121/W 34th St. US 441/W 13th St. N.W. 77th Ave. C C D F S-44 SR 121 S.W. 85th Ave. Interstate 75 (south) B B C F S-45 SR 26/Newberry Rd. S.W. 154th St. NW 122nd St. B C D F S-47 SR 24/Archer Rd. GMA Boundary SW 75th St/Tower Rd. F C D F S-48 SR 20/Hawthorne Rd. SE 43rd St. CR 329B/Lakeshore Dr. B C C F S-49 SR 20/Hawthorne Rd. CR 329B GMA Boundary B B D F S-51 Interstate 75 GMA Boundary SR 331/SR 121 B N/A N/A N/A SOURCE: NORTH CENTRAL FLORIDA REGIONAL PLANNING COUNCIL t\mike\los\los11\multimodal\10smmlos.xls Note: This table is not intended to be used for concurrency management purposes, since bike, pedestrian or transit LOS Standards do not exist. It is for information only. Roadway facilities in shaded rows are also ART-PLAN, HIGHPLAN or FREEPLAN analyzed. Roadway facilities in italics have full field study inputs N/A Not Applicable
172
173 TABLE 5 MULTIMODAL LEVEL OF SERVICE SUMMARY FOR ALACHUA COUNTY ROADS WITHIN THE GAINESVILLE METROPOLITAN AREA BOUNDARY Updated 09/11 ASSIGNED FROM SOUTH TO NORTH ROADWAY OR WEST OR EAST LEVEL OF SERVICE NUMBER ROADWAY TERMINI TERMINI AUTOMOBILE BICYCLE PEDESTRIAN TRANSIT URBANIZED ARTERIAL ROADWAYS A-1 NW 53rd Ave. NW 52nd Terr. US 441/W 13th St. C C E E A-3 NW 43rd St. SR 26/Newberry Rd. NW 53rd Ave. D C D F A-6 NW 43rd St. NW 53rd Ave. US 441 C C E D A-9 NW 23rd Ave. NW 98th St. NW 55th St. F D E E A-10 NW 23rd Ave. NW 55th St. NW 43rd St. C D C D A-11 NW 16th Ave. NW 43rd St. US 441/W 13th St. B D D D A-12 N 16th Ave. US 441/W. 13th St. SR 24/Waldo Road D C D F A-13 SW 75th St/Tower Rd. SR 25/Archer Road SW 8th Ave. C E D D A-14 NW 75th St/Tower Rd. SW 8th Ave. SR 26/Newberry Rd. C D D D A-15 SW 20th Ave. SW 75th St/Tower Rd SW 62nd Blvd. D C E D A-16 SW 20th Ave. SW 62nd Blvd. SR 121/W 34th St. F C E A A-17 N Main St. NW 8th Ave. NW 23rd Ave. C C C F A-18 N Main St. NW 23rd Ave. SR 222/N 39th Ave. B C C F A-19 NW 39th Ave. NW 110th St. NW 98th St. D B D F A-47 S Main St. Williston Rd. University Ave. C C C E URBANIZED MAJOR COUNTY ROADWAYS A-20 SW 24th Ave SW 91st St. SW 75th St./Tower Rd. C E C F A-21 NW 51st St. NW 23rd Ave. SR 222/NW 39th Ave. C C C F A-22 NW 98th St. SR 26/Newberry Rd. CR 222/NW 39th Ave. C D E F A-23 NW 83rd St. NW 23rd Ave. SR 222/NW 39th Ave. E E D E A-24 W 91st St. SW 24th Ave. SR 26/Newberry Rd. B D C F A-26 SW 8th Ave. SW 91st St. SW 75th St./Tower Rd. B A D F A-29 Kincaid Loop SR 20/Hawthorne Rd. SR 20/Hawthorne Rd. B D D E A-30 SW 40 Bd/SW 42/43 St SR 24/Archer Rd. SW 20th Ave. D E E E A-33 SW 24th Ave SW 122nd St./Parker Rd. SW 91st St. B D C F A-36 SW 8th Ave. SW 122nd St./Parker Rd. SW 91st St. B B D F A-45 Ft. Clarke Blvd. SR 26/Newberry Rd. NW 23rd Avenue C E D C URBANIZED OTHER SIGNALIZED ROADWAYS A-40 SW 46th Blvd. SW 104th Tr. Tower Road B D D F A-44 SW 75th St. GMA Boundary SR 24/Archer Road B D D F TRANSITIONING ARTERIAL ROADWAYS A-2 N 53rd Ave. US 441/W 13th St. SR 24/Waldo Rd. C C E F A-32 W 143rd St./CR 241 SR 26/Newberry Road GMA Boundary C C E F A-37 NW 39th Ave. CR 241 NW 110th Tr. C C E F TRANSITIONING MAJOR COUNTY ROADWAYS A-28 Rocky Pt. Rd. SR 331/Williston Rd. US 441/SW 13th St. B B D F A-34 NW 53rd Ave. Interstate 75 NW 52nd Terr. B B E F A-35 SW 122nd St./Parker Rd. GMA Boundary SR 26/Newberry Rd. B C D F A-38 SE 43rd St. SR 20/Hawthorne Rd. SR 26/E. University Ave. B C C D A-39 SW 91st St. Archer Road SW 44th Ave. B D D F TRANSITIONING OTHER SIGNALIZED ROADWAYS A-31 Monteocha Road NE 53rd Ave. NE 77th Ave. B B D F A-41 SW 62nd Ave./SW 63rd Blvd. SR 121 SR 24/Archer Road B D D F A-42 CR 329B/Lakeshore Dr. SR 20/Hawthorne Rd. SR 26/E. University Ave. B B D F A-43 NE 77th Ave./CR 225A NE 38th St. SR 24 / Waldo Rd. B A D F A-46 NW 32nd Ave. GMA Boundary CR 241/NW 143rd St. C C C F SOURCE: NORTH CENTRAL FLORIDA REGIONAL PLANNING COUNCIL Note: This table is not intended to be used for concurrency management purposes, since bike, pedestrian or transit LOS Standards do not exist. It is for information only. Roadway facilities in shaded rows are also ART-PLAN, HIGHPLAN or FREEPLAN analyzed. T\MIKE\los\los11\multimodal\10kmmlos.xls Roadway facilities in italics have full field study inputs
174
175 TABLE 6 MULTIMODAL LEVEL OF SERVICE SUMMARY FOR CITY OF GAINESVILLE / UNIVERSITY OF FLORIDA ROADS WITHIN THE GAINESVILLE METROPOLITAN AREA BOUNDARY Updated 09/11 ASSIGNED FROM SOUTH TO NORTH ROADWAY OR WEST OR EAST LEVEL OF SERVICE NUMBER ROADWAY TERMINI TERMINI AUTOMOBILE BICYCLE PEDESTRIAN TRANSIT URBANIZED ARTERIAL ROADWAYS G-1 NW 55th St. SR 26/Newberry Rd. NW 23rd Ave. C C C C G-2 N 8th Ave. SR 26/Newberry Rd. W 22nd St. B D D F G-3 N 8th Ave. NW 22nd St. NW 6th St. D E D F G-4 SW 62nd Blvd. SR 26/Newberry Rd. SW 20th Ave. B E F B G-36 NW 31st Ave/Glen Springs R SR 121/W 34th St. NW 16th Terr. B D C C G-38 NW 23rd Blvd. NW 16th Terr. US 441/W 13th St. C C B B URBANIZED MAJOR CITY ROADWAYS G-5 NW 22nd St SR 26/University Ave. NW 16th Ave. B D C F G-6 N 8th Ave. N Main St. SR 24/Waldo Rd. D D D D G-7 S 2nd Ave. US 441/W 13th St. SE 7th St. D B C B G-9 W 6th St. SW 4th Ave. NW 8th Ave. D D C E G-37 SW 23rd Terr. SR 331/Williston Rd. SR 24/Archer Rd. B C C A URBANIZED OTHER SIGNALIZED ROADWAYS G-8 W 6th St. SW 16th Ave. SW 4th Ave. C D C F G-10 NE 9th St. SE 2nd Ave. NE 31st Ave. C B C F G-11 NW 38th St. NW 8th Ave. NW 16th Ave C A C F G-12 NW 24th Blvd. SR 222/NW 39th Ave. NW 53rd Ave. B D C F G-14 NE 15th St. SR 26/E University Ave. NE 8th Ave. C D C F G-15 NE 15th St. NE 16th Ave. SR 222/NE 39th Ave. B D C D G-16 NE 25th St. SR 26/E University Ave. NE 8th Ave. C D C C G-17 SE 4th St. SR 331/Williston Rd. Depot Ave. C D C E G-18 SE 4th St.-SE 22nd Ave. SR 331/Williston Rd. SE 15th St. B D C B G-19 N 8th Ave SR 24/Waldo Road NE 25th St. C D C C G-20 S 4th Ave. US 441/SW 13th St. SE 15th St. C D C D G-21 SW 9th Rd.-Depot Ave.-SE 7US 441/SW 13th St. SE 15th St. C D C D G-22 S 2nd Ave. SE 7th St. SR 331/Williston Rd. C A B F G-23 NE 31st Ave. N Main St. SR 24/Waldo Road C C C F G-24 NW 17th St. SR 26/W University Ave. NW 8th Ave. C B C F G-25 W 12th St. SW 4th Ave. NW 8th Ave. D C C F G-26 W 10th St. SW 4th Ave. NW 8th Ave. D C C F G-27 SW 16th St. SW 16th Ave. SR 24/Archer Rd. C B C A G-28 NW 5th Ave. NW 22nd St. US 441/NW 13th St. C C C F G-29 W. 3rd St. SW 4th Ave. NW 8th Ave. C B B F G-30 W. 2nd St. SW 4th Ave. NW 8th Ave. C B B F G-31 Gale Lemerand Dr. SR 24/Archer Rd. Museum Rd. C B C A G-32 Radio Rd.-Museum Rd. SR 121/S 34th St. US 441/S 13th St. F C D A G-33 E 1st St. SE 2nd Pl. NE 8th Ave. C C C F G-34 E 3rd St. SE Depot Ave. NE 2nd Ave. D D C A G-35 Hull Rd.-Mowry Rd SW 34th St. Center Dr. E C C A G-39 Gale Lemerand Dr. Museum Rd. SR 26/W University Ave. F C D A TRANSITIONING OTHER SIGNALIZED ROADWAYS G-13 N Main St. SR 222/NW 39th Ave. NW 53rd Ave. B C D F SOURCE: NORTH CENTRAL FLORIDA REGIONAL PLANNING COUNCIL t\mike\los\los11\multimodal\10cmmlos.xlsx Note: This table is not intended to be used for concurrency management purposes, since bike, pedestrian or transit LOS Standards do not exist. It is for information only. Roadway facilities in shaded rows are also ART-PLAN, HIGHPLAN or FREEPLAN analyzed. Roadway facilities in italics have full field study inputs
176
177 METROPOLITAN TRANSPORTATION PLANNING ORGANIZATION (MTPO) FOR THE GAINESVILLE URBANIZED AREA YEAR 2010 ANNUAL AVERAGE DAILY TRAFFIC MULTIMODAL LEVEL OF SERVICE REPORT BICYCLE, PEDESTRIAN & TRANSIT LEVEL OF SERVICE TABLES GAINESVILLE METROPOLITAN AREA CONGESTION MANAGEMENT PROCESS January 12, 2012 T:\Mike\los\los11\multimodal\MMLOSTBLCV.docx Prepared by: North Central Florida Regional Planning Council 2009 NW 67 Place Gainesville, Florida 32653
178 T:\Mike\los\los11\multimodal\MMLOSTBLCV.docx [Page left Blank Intentionally]
179 TABLE 7 BICYCLE, PEDESTRIAN & TRANSIT LEVEL OF SERVICE DATA FOR STATE ROADS WITHIN THE GAINESVILLE METROPOLITAN AREA BOUNDARY Page 1 of 2 FDOT Generalized Tables analysis 06/11 ASSIGNED FROM SOUTH TO NORTH BICYCLE FACILITY FACTORS PEDESTRIAN FACTORS TRANSIT FACTORS ROADWAY OR WEST OR EAST OUTSIDE PAVEMENT BIKELANE / SIDEWALK ROADWAY OBSTACLE FREQUENCY* SERVICE ROADWAY LEVEL OF SERVICE SPAN* NUMBER ROADWAY TERMINI TERMINI LANE WIDTH CONDITION PAVED SHOULDER [PERCENT] SEPARATION BARRIER TO BUS STOP [PER HOUR] [HOURS] AADT BICYCLE PEDESTRIAN TRANSIT URBANIZED ROADWAYS S-2 US 441/W 13th St. SR 331/Williston Rd. SR 24/Archer Rd. Typical Typical Yes 100 Typical No No ,800 C C A S-3 US 441/W 13th St. SR 24/Archer Rd. SR 26/University Ave. Wide Typical No 100 Typical No No ,000 D B B S-4 US 441/W 13th St. SR 26/University Ave. NW 29th Rd. Wide Typical No 100 Typical No No ,500 D D D S-5 US 441/W 13th St. NW 29th Rd. N.W. 23rd St. Typical Typical Yes 60 Typical No No ,000 C D E S-6 SR 20/NW 6th St. N.W. 8th Ave. SR 222/N 39th Ave. Typical Typical No 100 Typical No No ,900 D C D S-7 SR 20/NW 6th St. SR 222/N 39th Ave. US 441/W. 13th St. Typical Typical No 100 Typical No No ,900 D C F S-8 SR 20/Hawthorne Rd. SR 24/Waldo Rd. SE 43rd St. Typical Typical Yes 100 Typical No No ,000 B C F S-9 SR 24/Archer Rd. SW 75th St/Tower Rd. Interstate 75 Typical Typical Yes 100 Typical No No ,250 C D E S-10 SR 24/Archer Rd. Interstate 75 SR 121/SW 34th St. Wide Typical No 100 Typical No No ,510 D D A S-11 SR 24/Archer Rd. SR 226/SW 16th Ave. US 441/W 13th St. Typical Typical Yes 100 Typical No No ,000 E D A S-12 SR 24/Waldo Rd. SR 26/University Ave. SR 222/E 39th Ave. Typical Typical Yes 100 Typical No No ,877 E D F S-14 SR 26/Newberry Rd. NW 122nd St. Interstate-75 [west ramp] Typical Typical Yes 100 Typical No No ,500 D D F S-15 SR 26/Newberry Rd. Interstate-75 [west ramp]nw 8th Ave. Typical Typical Yes 100 Typical No No ,500 E D D S-16 SR 26/Newberry Rd. NW 8th Ave. SR 121/W 34th St. Typical Typical Yes 100 Typical No No ,500 D D D S-17 SR 26/University Ave. SR 121/W 34th St. Gale Lemerand Dr. Typical Typical Yes 100 Typical No No ,000 C D C S-18 SR 26/University Ave. Gale Lemerand Dr. US 441/W 13th St. Typical Typical Yes 100 Typical No No ,500 D D B S-19 SR 26/University Ave. US 441/W 13th St. SR 24/Waldo Rd. Typical Typical Yes 100 Typical No No ,500 D D D S-20 SR 26/University Ave. SR 20/Hawthorne Rd. CR 329B/Lakeshore Dr. Wide Typical No 100 Typical No No ,600 D C E S-21 SR 26A/SW 2nd Ave. SR 26/Newberry Rd. SR 121/W 34th St. Typical Typical Yes 100 Typical No No ,000 D C B S-22 SR 26A/SW 2nd Ave. SR 121/SW 34th St. SR 26/University Ave. Typical Typical Yes 100 Typical No No ,850 D C A S-23 SR 121/W 34th St. SR 331/Williston Rd. SR 24/Archer Rd. Typical Typical Yes 100 Typical No No ,522 C D A S-24 SR 121/W 34th St. SR 24/Archer Rd. SR 26/University Ave. Typical Typical Yes 100 Typical No No ,750 C E A S-25 SR 121/W 34th St. SR 26/University Ave. NW 16th Ave. Wide Typical No 100 Typical No OTSA OTSA OTSA 18,200 D C OTSA S-26 SR 121/W 34th St. NW 16th Ave. SR 222/W 39th Ave. Typical Typical Yes 100 Typical No OTSA OTSA OTSA 14,750 C C OTSA S-27 SR 121/W 34th St. SR 222/NW 39th Ave. NW 53rd Ave. Typical Typical Yes 100 Typical No No ,800 C D E S-29 SR 222/N 39th Ave. NW 98th St. NW 83rd St. Typical Typical Yes 100 Typical No OTSA OTSA OTSA 20,793 C D OTSA S-30 SR 222/N 39th Ave. US 441/NW 13th St. SR 24/Waldo Rd. Typical Typical Yes 100 Typical No No ,400 C C D S-31 SR 222/N 39th Ave. SR 24/Waldo Rd. End of 4-lane section Typical Typical Yes 100 Typical No No ,500 C C F S-32 SR 222/N 39th Ave. End of 4-lane section GMA Boundary Typical Typical Yes No - - OTSA OTSA OTSA 9,900 C D OTSA S-33 SR 226/S 16th Ave SR 24/Archer Rd. US 441/W 13th St. Typical Typical No 100 Typical No No ,100 D C A S-34 SR 226/S 16th Ave US 441/W 13th St. SR 329/Main St. Typical Typical No 100 Typical No No ,300 D C A S-35 SR 226/S 16th Ave SR 329/Main St. SR 331/Williston Rd. Typical Typical Yes No - - No ,200 B D C S-36 SR 120A/N 23rd Ave. US 441/W 13th St. SR 24/Waldo Rd. Typical Typical No 100 Typical No No ,900 D C E
180 TABLE 7 - Continued BICYCLE, PEDESTRIAN & TRANSIT LEVEL OF SERVICE DATA FOR STATE ROADS WITHIN THE GAINESVILLE METROPOLITAN AREA BOUNDARY Page 2 of 2 FDOT Generalized Tables analysis 06/11 ASSIGNED FROM SOUTH TO NORTH BICYCLE FACILITY FACTORS PEDESTRIAN FACTORS TRANSIT FACTORS ROADWAY OR WEST OR EAST OUTSIDE PAVEMENT BIKELANE / SIDEWALK ROADWAY OBSTACLE FREQUENCY* SERVICE ROADWAY LEVEL OF SERVICE SPAN* NUMBER ROADWAY TERMINI TERMINI LANE WIDTH CONDITION PAVED SHOULDER [PERCENT] SEPARATION BARRIER TO BUS STOP [PER HOUR] [HOURS] AADT BICYCLE PEDESTRIAN TRANSIT URBANIZED ROADWAYS S-37 SR 329/Main St. University Ave. N. 8th Ave. Typical Typical Yes 100 Typical No No ,050 C D D S-38 SR 331/SR 121 Interstate 75 (south) US 441/SW 13th St. Typical Typical Yes 100 Typical No No ,250 C D B S-39 SR 331/Williston Rd. US 441/SW 13th St. SR 26/University Ave. Typical Typical Yes 100 Typical No No ,200 C D F S-40 SR 20/NW 8th Ave. NW 6th St. N Main St. Typical Typical Yes 100 Typical No No ,500 C C F S-41 Interstate 75 SR 331/SR 121 SR 24/Archer Rd. N/A N/A N/A N/A N/A N/A N/A N/A N/A 62,000 N/A N/A N/A S-42 Interstate 75 SR 24/Archer Rd. SR 26/Newberry Rd. N/A N/A N/A N/A N/A N/A N/A N/A N/A 71,500 N/A N/A N/A S-43 Interstate 75 SR 26/Newberry Rd. SR 222/NW 39th Ave. N/A N/A N/A N/A N/A N/A N/A N/A N/A 66,500 N/A N/A N/A S-46 SR 26/University Ave. CR 329B GMA Boundary Typical Typical Yes No - - OTSA OTSA OTSA 4,900 B D OTSA S-50 US 441 NW 23rd St. GMA Boundary Typical Typical Yes No - - OTSA OTSA OTSA 17,700 C E OTSA S-52 Interstate 75 SR 222/NW 39th Ave. GMA Boundary N/A N/A N/A N/A N/A N/A N/A N/A N/A 54,000 N/A N/A N/A S-53 SR 222/N 39th Ave. NW 51st St. US 441/NW 13th St. Typical Typical Yes 100 Typical No No ,500 C D E S-54 SR 121/W 34th St. NW 53rd Ave. US 441/W 13th St. Typical Typical Yes 100 Typical No No ,400 B D D S-55 SR 24/Archer Rd. SR 121/SW 34th St. SR 226/SW 16th Ave. Wide Typical No 100 Typical No No ,250 E E A S-56 SR 222/N 39th Ave. NW 83rd St. NW 51st St. Typical Typical No 100 Typical No No ,500 C E E TRANSITIONING ROADWAYS S-1 US 441/W 13th St. Payne's Prairie SR 331/Williston Rd. Typical Typical Yes No Typical No No ,250 C D A S-13 SR 24/Waldo Rd. SR 222/E 39th Ave. CR 255A/NE 77th Ave. Typical Typical Yes 30 Typical No No ,400 C D F S-28 SR 121/W 34th St. US 441/W 13th St. CR 231 Typical Typical Yes No - - OTSA OTSA OTSA 9,935 C D OTSA S-44 SR 121 S.W. 85th Ave. Interstate 75 (south) Typical Typical Yes 100 Typical No OTSA OTSA OTSA 8,300 B C OTSA S-45 SR 26/Newberry Rd. S.W. 154th St. NW 122nd St. Typical Typical Yes 100 Typical No OTSA OTSA OTSA 16,650 C D OTSA S-47 SR 24/Archer Rd. GMA Boundary SW 75th St/Tower Rd. Typical Typical Yes 90 Typical No OTSA OTSA OTSA 18,500 C D OTSA S-48 SR 20/Hawthorne Rd. SE 43rd St. CR 329B/Lakeshore Dr. Typical Typical Yes 100 Typical No OTSA OTSA OTSA 11,600 C C OTSA S-49 SR 20/Hawthorne Rd. CR 329B GMA Boundary Typical Typical Yes No - - OTSA OTSA OTSA 9,200 B D OTSA S-51 Interstate 75 GMA Boundary SR 331/SR 121 N/A N/A N/A N/A N/A N/A N/A N/A N/A 61,367 N/A N/A N/A SOURCE: NORTH CENTRAL FLORIDA REGIONAL PLANNING COUNCIL t\mike\los\los11\10sdatamm.xlsx N/A- Not Applicable OTSA- Outside Transit Service Area * Data for highest segment identified BICYCLE FACILITY FACTOR OPTIONS PEDESTRIAN FACTOR OPTIONS TRANSIT FACTOR OPTIONS OUTSIDE PAVEMENT BIKELANE / SIDEWALK ROADWAY OBSTACLE FREQUENCY SERVICE LANE WIDTH CONDITION PAVED SHOULDER [PERCENT] SEPARATION BARRIER TO BUS STOP [PER HOUR] SPAN Narrow Desirable Yes/No Percent Adjacent Yes/No Yes/No Headways per hour Hours per day Typical Typical Development Typical [peak period] Wide Undesirable Code Wide Custom - - Conformity -
181 TABLE 8 BICYCE, PEDESTRIAN & TRANSIT LEVEL OF SERVICE DATA FOR ALACHUA COUNTY ROADS WITHIN THE GAINESVILLE METROPOLITAN AREA BOUNDARY Page 1 of 2 FDOT Generalized Tables analysis 9/11 ASSIGNED FROM SOUTH TO NORTH BICYCLE FACILITY FACTORS PEDESTRIAN FACTORS TRANSIT FACTORS ROADWAY OR WEST OR EAST OUTSIDE PAVEMENT BIKELANE / SIDEWALK ROADWAY OBSTACLE FREQUENCY* SERVICE ROADWAY LEVEL OF SERVICE SPAN* NUMBER ROADWAY TERMINI TERMINI LANE WIDTH CONDITION PAVED SHOULDER [PERCENT] SEPARATION BARRIER TO BUS STOP [PER HOUR] [HOURS] AADT BICYCLE PEDESTRIAN TRANSIT A-1 / AC-010 NW 53rd Ave. NW 52nd Terr. US 441/W 13th St. I URBANIZED ROADWAYS Typical Typical Yes 75 Typical No No ,037 C E E A-3 / AC-025 NW 43rd St. SR 26/Newberry Rd. NW 53rd Ave. Typical Typical Yes 100 Typical No No ,131 C D E A-6 / AC-030 NW 43rd St. NW 53rd Ave. US 441 Typical Typical Yes 100 Typical No OTSA OTSA OTSA 10,802 C E OTSA A-9 / AC-040 NW 23rd Ave. NW 98th St. NW 55th St. Typical Typical Yes 100 Wide No No ,770 D E E A-10 / AC-035 NW 23rd Ave. NW 55th St. NW 43rd St. Typical Typical Yes 100 Typical No No ,821 D C D A-11 NW 16th Ave. NW 43rd St. US 441/W 13th St. Typical Typical Yes 100 Typical No No ,451 D D D A-12 N 16th Ave. US 441/W. 13th St. SR 24/Waldo Road Typical Typical Yes 100 Typical No No ,127 C D F A-13 / AC-090 SW 75th St/Tower Rd. SR 24/Archer Road SW 8th Ave. Typical Typical Yes 100 Typical No No ,055 E D D A-14 / AC-085 NW 75th St/Tower Rd. SW 8th Ave. SR 26/Newberry Rd. Typical Typical No 100 Typical No No ,973 D D D A-15 / AC-060 SW 20th Ave. SW 75th St/Tower Rd SW 62nd Blvd. Typical Typical Yes 100 Typical No No ,856 C E D A-16 / AC-055 SW 20th Ave. SW 62nd Blvd. SR 121/W 34th St. Typical Typical Yes 100 Typical No No ,524 C E A A-17 N Main St. NW 8th Ave. NW 23rd Ave. Typical Typical Yes 100 Typical No No ,646 C C F A-18 N Main St. NW 23rd Ave. SR 222/N 39th Ave. Typical Typical Yes 100 Typical No OTSA OTSA OTSA 15,265 C C OTSA A-19 / AC-095 NW 39th Ave. NW 112th St. NW 98th St. Typical Typical Yes 100 Typical No OTSA OTSA OTSA 11,389 B D OTSA A-47 S Main St. Williston Rd. University Ave. Typical Typical No 100 Typical No No ,200 C C E A-20 / AC-065 SW 24th Ave SW 91st St. SW 75th St./Tower Rd. Typical Typical No 100 Typical No No ,122 E C F A-21 / AC-120 NW 51st St. NW 23rd Ave. SR 222/NW 39th Ave. Typical Typical Yes 100 Typical D OTSA OTSA OTSA 8,896 C C OTSA A-22 / AC-110 NW 98th St. SR 26/Newberry Rd. CR 222/NW 39th Ave. Typical Typical No 100 Typical No OTSA OTSA OTSA 10,289 D E OTSA A-23 / AC-130 NW 83rd St. NW 23rd Ave. SR 222/NW 39th Ave. Typical Typical No 100 Typical No No ,157 E D E A-24 / AC-165 W 91st St. SW 24th Ave. SR 26/Newberry Rd. Typical Typical No 100 Typical No OTSA OTSA OTSA 7,708 D C OTSA A-26 / AC-140 SW 8th Ave. SW 91st St. SW 75th St./Tower Rd. Typical Typical Yes 100 Typical No OTSA OTSA OTSA 4,679 A D OTSA A-29 / AC-280 Kincaid Loop SR 20/Hawthorne Rd. SR 20/Hawthorne Rd. Typical Typical No 100 Typical No No ,926 D D E A-30 / AC-400 SW 40th Blvd./ SR 24/Archer Rd. SW 20th Ave. Typical Typical No 100 Typical No No ,451 E E E SW 42nd/43rd St. A-33 SW 24th Ave SW 122nd St./Parker Rd. SW 91st St. Typical Typical No 100 Typical No OTSA OTSA OTSA 6,497 D C OTSA A-36 SW 8th Ave. SW 122nd St./Parker Rd. SW 91st St. Typical Typical No 0 Typical No OTSA OTSA OTSA 1,998 B D OTSA A-45 / AC-160 Ft. Clarke Blvd. SR 26/Newberry Rd. NW 23rd Avenue Typical Typical No 100 Typical No No ,614 E D C A-40 / AC-180 SW 46th Blvd. SW 104th Tr. Tower Road Typical Typical No 100 Typical No OTSA OTSA OTSA 5,257 D D OTSA A-44 / AC-095 SW 75th St. GMA Boundary SR 24/Archer Road Typical Typical No 100 Typical No OTSA OTSA OTSA 3,123 D D OTSA Roadway sections in shaded rows are also ARTPLAN or HIGHPLAN analyzed. Roadway sections in italic text are full field study analyses.
182 TABLE 8 - Continued BICYCE, PEDESTRIAN & TRANSIT LEVEL OF SERVICE DATA FOR ALACHUA COUNTY ROADS WITHIN THE GAINESVILLE METROPOLITAN AREA BOUNDARY Page 2 of 2 FDOT Generalized Tables analysis 9/11 ASSIGNED FROM SOUTH TO NORTH BICYCLE FACILITY FACTORS PEDESTRIAN FACTORS TRANSIT FACTORS ROADWAY OR WEST OR EAST OUTSIDE PAVEMENT BIKELANE / SIDEWALK ROADWAY OBSTACLE FREQUENCY* SERVICE ROADWAY LEVEL OF SERVICE SPAN* NUMBER ROADWAY TERMINI TERMINI LANE WIDTH CONDITION PAVED SHOULDER [PERCENT] SEPARATION BARRIER TO BUS STOP [PER HOUR] [HOURS] AADT BICYCLE PEDESTRIAN TRANSIT J TRANSITIONING ROADWAYS A-2 / AC-005 N 53rd Ave. US 441/W 13th St. SR 24/Waldo Rd. Typical Typical Yes 0 Typical No No ,558 C E F A-32 / AC-240 W 143rd St./CR 241 SR 26/Newberry Road GMA Boundary Typical Typical Yes 0 Typical No OTSA OTSA OTSA 10,408 C E OTSA A-37 / AC-100 NW 39th Ave. CR 241 NW 112th St. Typical Typical Yes 100 Typical No OTSA OTSA OTSA 9,549 C E OTSA A-28 / AC-275 Rocky Pt. Rd. SR 331/Williston Rd. US 441/SW 13th St. Typical Typical Yes 100 Typical No OTSA OTSA OTSA 3,220 B D OTSA A-34 / AC-105 NW 53rd Ave. Interstate 75 NW 52nd Terr. Typical Typical Yes 100 Typical No OTSA OTSA OTSA 5,861 B E OTSA A-35 / AC-210 SW 122nd St./Parker Rd. GMA Boundary SR 26/Newberry Rd. Typical Typical Yes 100 Typical No OTSA OTSA OTSA 6,931 C D OTSA A-38 / AC-290 SE 43rd St. SR 20/Hawthorne Rd. SR 26/E. University Ave. Typical Typical No 100 Typical No No ,285 C C D A-39 / AC-270 SW 91st St. Archer Road SW 24th Ave. Typical Typical Yes 100 Typical No No ,366 D D OTSA A-31 / AC-285 Monteocha Road NE 53rd Ave. NE 77th Ave. Typical Typical Yes 0 Typical No OTSA OTSA OTSA 2,826 B D OTSA A-41 / AC-200 SW 62nd Ave./ SR 121 SR 24/Archer Road Typical Typical No 0 Typical No OTSA OTSA OTSA 5,080 D D OTSA SW 63rd Blvd. A-42 / AC-295 CR 329B/Lakeshore Dr. SR 20/Hawthorne Rd. SR 26/E. University Ave. Typical Typical No 0 Typical No OTSA OTSA OTSA 441 B D OTSA A-43 / AC-300 NE 77th Ave./CR 225A NE 38th St. SR 24 / Waldo Rd. Typical Typical No 0 Typical No OTSA OTSA OTSA 645 A D OTSA A-46 / AC-050 NW 32nd Ave. GMA Boundary CR 241/NW 143rd St. Typical Typical No 0 Typical No OTSA OTSA OTSA 2,242 C C OTSA SOURCE: North Central Florida Regional Planning Council t\mike\los\los11\10kdatamm.xlsx N/A- Not Applicable OTSA- Outside Transit Service Area * Data for highest segment identified BICYCLE FACILITY FACTOR OPTIONS PEDESTRIAN FACTOR OPTIONS TRANSIT FACTOR OPTIONS OUTSIDE PAVEMENT BIKELANE / SIDEWALK ROADWAY OBSTACLE FREQUENCY SERVICE LANE WIDTH CONDITION PAVED SHOULDER [PERCENT] SEPARATION BARRIER TO BUS STOP [PER HOUR] SPAN Narrow Desirable Yes/No Percent Adjacent Yes/No Yes/No Headways per hour Hours per day Typical Typical Development Typical [peak period] Wide Undesirable Code Wide Custom - - Conformity -
183 TABLE 9 BICYCLE, PEDESTRIAN & TRANSIT LEVEL OF SERVICE DATA FOR CITY OF GAINESVILLE / UNIVERSITY OF FLORIDA ROADS WITHIN THE GAINESVILLE METROPOLITAN AREA BOUNDARY Page 1 of 2 FDOT Generalized Tables analysis 06/11 ASSIGNED FROM SOUTH TO NORTH BICYCLE FACILITY FACTORS PEDESTRIAN FACTORS TRANSIT FACTORS ROADWAY OR WEST OR EAST OUTSIDE PAVEMENT BIKELANE / SIDEWALK ROADWAY OBSTACLE FREQUENCY* SERVICE ROADWAY LEVEL OF SERVICE SPAN* NUMBER ROADWAY TERMINI TERMINI LANE WIDTH CONDITION PAVED SHOULDER [PERCENT] SEPARATION BARRIER TO BUS STOP [PER HOUR] [HOURS] AADT BICYCLE PEDESTRIAN TRANSIT URBANIZED ROADWAYS G-1 NW 55th St. SR 26/Newberry Rd. NW 23rd Ave. Typical Typical Yes 100 Typical No No ,431 C C C G-2 NW 8th Ave. SR 26/Newberry Rd. NW 22nd St. Typical Typical No 100 Typical No OTSA OTSA OTSA 16,412 D D OTSA G-3 NW 8th Ave. NW 22nd St. NW 6th St. Typical Typical No 100 Wide No OTSA OTSA OTSA 14,101 E D OTSA G-4 SW 62nd Blvd. SW 20th Ave. SR 26/Newberry Rd. Typical Typical No 100 Wide No No ,542 E F B G-36 NW 31st Ave/Glen Springs Rd. SR 121/NW 34th St. NW 16th Terr. Typical Typical No 100 Typical No No ,144 D C C G-38 NW 23rd Blvd. NW 16th Terr. US 441/NW 13th St. Typical Typical Yes 100 Typical No No ,316 C B B G-5 NW 22nd St SR 26/University Ave. NW 16th Ave. Typical Typical No 100 Typical No OTSA OTSA OTSA 6,849 D C OTSA G-6 NE 8th Ave. N Main St. SR 24/Waldo Rd. Typical Typical No 100 Typical No No ,498 D D D G-7 S 2nd Ave. US 441/SW 13th St. SE 7th St. Typical Typical Yes 100 Typical No No ,563 B C B G-9 W 6th St. SW 4th Ave. NW 8th Ave. Typical Typical No 100 Typical No No ,197 D C E G-37 SW 23rd Terr. SR 331/Williston Rd. SR 24/Archer Rd. Typical Typical Yes 100 Typical No No ,431 C C A G-8 W 6th St. SW 16th Ave. SW 4th Ave. Typical Typical No 100 Typical No OTSA OTSA OTSA 5,982 D C OTSA G-10 E 9th St. SE 2nd Ave. NE 31st Ave. Typical Typical Yes 100 Typical No No ,457 B C F G-11 NW 38th St. NW 8th Ave. NW 16th Ave Typical Typical Yes 100 Typical No OTSA OTSA OTSA 1,848 A C OTSA G-12 NW 24th Blvd. SR 222/NW 39th Ave. NW 53rd Ave. Typical Typical No 100 Typical No OTSA OTSA OTSA 3,101 D C OTSA G-14 NE 15th St. SR 26/E University Ave. NE 8th Ave. Wide Typical No 100 Typical No OTSA OTSA OTSA 4,967 D C OTSA G-15 NE 15th St. NE 16th Ave. SR 222/NE 39th Ave. Wide Typical No 100 Typical No No ,902 D C D G-16 NE 25th St. SR 26/E University Ave. NE 8th Ave. Typical Typical No 100 Typical No No ,900 D C C G-17 SE 4th St. SR 331/Williston Rd. Depot Ave. Typical Typical No 100 Typical No No ,165 D C E G-18 SE 4th St.-SE 22nd Ave. SR 331/Williston Rd. SE 15th St. Typical Typical No 100 Typical No No ,213 D C B G-19 N 8th Ave SR 24/Waldo Road NE 25th St. Wide Typical No 100 Typical No No ,426 D C C G-20 S 4th Ave. US 441/SW 13th St. SE 15th St. Typical Typical No 100 Typical No No ,014 D C D G-21 SW 9th Rd.-Depot Ave.-SE 7th Ave. US 441/SW 13th St. SE 15th St. Typical Typical No 100 Typical No No ,495 D C D G-22 S 2nd Ave. SE 7th St. SR 331/Williston Rd. Typical Typical Yes 100 Typical No No ,174 A B F G-23 NE 31st Ave. N Main St. SR 24/Waldo Road Typical Typical No 100 Typical No OTSA OTSA OTSA 2,129 C C OTSA G-24 NW 17th St. SR 26/W University Ave. NW 8th Ave. Typical Typical Yes 100 Typical No OTSA OTSA OTSA 4,031 B C OTSA G-25 W 12th St. SW 4th Ave. NW 8th Ave. Typical Typical Yes 100 Typical No No ,421 C C F G-26 W 10th St. SW 4th Ave. NW 8th Ave. Typical Typical No 100 Typical No OTSA OTSA OTSA 3,593 C C OTSA G-27 SW 16th St. SW 16th Ave. SR 24/Archer Rd. Typical Typical Yes 100 Typical No No ,625 B C A G-28 NW 5th Ave. NW 22nd St. US 441/NW 13th St. Typical Typical No 100 Typical No OTSA OTSA OTSA 1,963 C C OTSA G-29 W. 3rd St. SW 4th Ave. NW 8th Ave. Typical Typical No 100 Typical No OTSA OTSA OTSA 490 B B OTSA G-30 W. 2nd St. SW 4th Ave. NW 8th Ave. Typical Typical No 100 Typical No OTSA OTSA OTSA 676 B B OTSA G-31 Gale Lemerand Dr. SR 24/Archer Rd. Museum Rd. Typical Typical Yes 100 Typical No No ,614 B C A G-32 Radio Rd.-Museum Rd. SR 121/S 34th St. US 441/S 13th St. Typical Typical Yes 100 Typical No No ,621 C D A G-33 E 1st St. SE 2nd Pl. NE 8th Ave. Wide Typical No 100 Typical No OTSA OTSA OTSA 3,120 C C OTSA G-34 E 3rd St. SE Depot Ave. NE 2nd Ave. Typical Typical No 100 Typical No No ,699 D C A G-35 Hull Rd.-Mowry Rd SW 34th St. Center Dr. Typical Typical Yes 100 Typical No No ,793 C C A G-39 Gale Lemerand Dr. Museum Rd. SR 26/W University Ave. Typical Typical Yes 100 Typical No No ,368 C D A t\mike\los11\10cdatamm.xls
184 TABLE 9 - Continued BICYCLE, PEDESTRIAN & TRANSIT LEVEL OF SERVICE DATA FOR CITY OF GAINESVILLE / UNIVERSITY OF FLORIDA ROADS WITHIN THE GAINESVILLE METROPOLITAN AREA BOUNDARY Page 2 of 2 FDOT Generalized Tables analysis 06/11 ASSIGNED FROM SOUTH TO NORTH BICYCLE FACILITY FACTORS PEDESTRIAN FACTORS TRANSIT FACTORS ROADWAY OR WEST OR EAST OUTSIDE PAVEMENT BIKELANE / SIDEWALK ROADWAY OBSTACLE FREQUENCY* SERVICE ROADWAY LEVEL OF SERVICE SPAN* NUMBER ROADWAY TERMINI TERMINI LANE WIDTH CONDITION PAVED SHOULDER [PERCENT] SEPARATION BARRIER TO BUS STOP [PER HOUR] [HOURS] AADT BICYCLE PEDESTRIAN TRANSIT TRANSITIONING ROADWAYS G-13 N Main St. SR 222/NW 39th Ave. NW 53rd Ave. Wide Typical No 50 Typical No OTSA OTSA OTSA 4,962 C D OTSA SOURCE: North Central Florida Regional Planning Council t\mike\los11\10cdatamm.xls N/A- Not Applicable OTSA- Outside Transit Service Area * Data for highest segment identified BICYCLE FACILITY FACTOR OPTIONS PEDESTRIAN FACTOR OPTIONS TRANSIT FACTOR OPTIONS OUTSIDE PAVEMENT BIKELANE / SIDEWALK ROADWAY OBSTACLE FREQUENCY SERVICE LANE WIDTH CONDITION PAVED SHOULDER [PERCENT] SEPARATION BARRIER TO BUS STOP [PER HOUR] SPAN Narrow Desirable Yes/No Percent Adjacent Yes/No Yes/No Headways per hour Hours per day Typical Typical Development Typical [peak period] Wide Undesirable Code Wide Custom - - Conformity -

185 *Primary Responsibility **Secondary Responsibility Scott R. Koons, AICP Executive Director Marlie J. Sanderson, AICP Director of Transportation Planning Lynn Franson-Godfrey, AICP Senior Planner *Michael Escalante, AICP Senior Planner Suwan Shen Planning Intern
MULTIMODAL LEVEL OF SERVICE REPORT
 METROPOLITAN TRANSPORTATION PLANNING ORGANIZATION (MTPO) FOR THE GAINESVILLE URBANIZED AREA ANNUAL AVERAGE DAILY TRAFFIC (AADT) MULTIMODAL LEVEL OF SERVICE REPORT GAINESVILLE METROPOLITAN AREA CONGESTION
Mobility Plan Status Report 2012 Average Annual Daily Traffic
 Mobility Plan Status Report 2012 Average Annual Daily Traffic Gainesville Metropolitan Area Congestion Management Process January 22, 2014 Metropolitan Transportation Planning Organization for the Gainesville
FINAL DESIGN TRAFFIC TECHNICAL MEMORANDUM
 FINAL DESIGN TRAFFIC TECHNICAL MEMORANDUM July 2014 FINAL (SR 43) Project Development and Environment Study From State Road 60 (Adamo Drive) to I-4 (SR 400) Hillsborough County, Florida Work Program Item
Chapter 4 Traffic Analysis
 Chapter 4 Traffic Analysis PURPOSE The traffic analysis component of the K-68 Corridor Management Plan incorporates information on the existing transportation network, such as traffic volumes and intersection
Traffic Impact Study. Westlake Elementary School Westlake, Ohio. TMS Engineers, Inc. June 5, 2017
 TMS Engineers, Inc. Traffic Impact Study Westlake Elementary School Westlake, Ohio June 5, 2017 Prepared for: Westlake City Schools - Board of Education 27200 Hilliard Boulevard Westlake, OH 44145 TRAFFIC
City of Gainesville Transportation/Roadway Needs PROJECT SUMMARY
 A1 Roadway Resurfacing $23,846,000 TYPE: Preservation of existing system Roadway resurfacing A2 Signal Replacement $6,000,000 TYPE: Preservation of existing system Replace traffic signals. B1 W 6th St
3.9 - Transportation and Traffic
 Transportation and Traffic 3.9 - Transportation and Traffic This section describes the potential transportation and traffic effects of project implementation on the project site and its surrounding area.
Transportation Policy Manual
 March 4, 2013 EXHIBIT 2 Metropolitan Transportation Planning Organization for the Gainesville Urbanized Area A Comprehensive Guide to Adopted Metropolitan Transportation Planning Organization for the
Complete Street Analysis of a Road Diet: Orange Grove Boulevard, Pasadena, CA
 Complete Street Analysis of a Road Diet: Orange Grove Boulevard, Pasadena, CA Aaron Elias, Bill Cisco Abstract As part of evaluating the feasibility of a road diet on Orange Grove Boulevard in Pasadena,
Planning Committee STAFF REPORT March 7, 2018 Page 2 of 4 The following MTSOs are being used across the five subregions: Intersection Level of Service
 Planning Committee STAFF REPORT Meeting Date: March 7, 2018 Subject Summary of Issues Recommendations Financial Implications Options Attachments Changes from Committee Review Draft 2017 Multimodal Transportation
TRAFFIC IMPACT ANALYSIS
 TRAFFIC IMPACT ANALYSIS FOR THE CHAMPAIGN UNIT#4 SCHOOL DISTRICT PROPOSED HIGH SCHOOL (SPALDING PARK SITE) IN THE CITY OF CHAMPAIGN Final Report Champaign Urbana Urbanized Area Transportation Study 6/24/2014
Waterford Lakes Small Area Study
 Waterford Lakes Small Area Study Existing Traffic Conditions PREPARED FOR: ORANGE COUNTY PUBLIC WORKS DEPARTMENT TRAFFIC ENGINEERING DIVISION ORLANDO, FLORIDA PREPARED WITH: INWOOD CONSULTING ENGINEERS
List of Attachments. Location Map... Site Plan... City of Lake Elsinore Circulation Element... City of Lake Elsinore Roadway Cross-Sections...
 List of Attachments Exhibits Location Map... Site Plan... City of Lake Elsinore Circulation Element... City of Lake Elsinore Roadway Cross-Sections... Existing Lane Geometry and Traffic Controls... Existing
Clackamas County Comprehensive Plan
 ROADWAYS The County s road system permits the movement of goods and people between communities and regions, using any of a variety of modes of travel. Roads provide access to virtually all property. They
Highway 111 Corridor Study
 Highway 111 Corridor Study June, 2009 LINCOLN CO. HWY 111 CORRIDOR STUDY Draft Study Tea, South Dakota Prepared for City of Tea Sioux Falls Metropolitan Planning Organization Prepared by HDR Engineering,
A Comprehensive HCM 2010 Urban Streets Analysis Using HCS 2010 US 31W in Elizabethtown, KY
 A Comprehensive HCM 2010 Urban Streets Analysis Using HCS 2010 US 31W in Elizabethtown, KY Ashley McLain, PE, PTOE Abstract The HCS 2010 Streets module was used to analyze a segment of the US 31W corridor
TRAFFIC STUDY GUIDELINES Clarksville Street Department
 TRAFFIC STUDY GUIDELINES Clarksville Street Department 9/1/2009 Introduction Traffic studies are used to help the city determine potential impacts to the operation of the surrounding roadway network. Two
THIS PAGE LEFT BLANK INTENTIONALLY
 GA SR 25 Spur at Canal Road Transportation Impact Analysis PREPARED FOR GLYNN COUNTY, GEORGIA 1725 Reynolds Street, Suite 300 Brunswick, Georgia 31520 PREPARED BY 217 Arrowhead Boulevard Suite 26 Jonesboro,
Walmart (Store # ) 60 th Street North and Marion Road Sioux Falls, South Dakota
 60 th Street North and Marion Road Sioux Falls, South Dakota") Walmart (Store #4865-00) 60 th Street North and Marion Road Sioux Falls, South Dakota Prepared for: Wal-Mart Stores, Inc. Bentonville, Arkansas Prepared by: Kimley-Horn and Associates, Inc. ã2013 Kimley-Horn
Walmart (Store #4865-00) 60 th Street North and Marion Road Sioux Falls, South Dakota Prepared for: Wal-Mart Stores, Inc. Bentonville, Arkansas Prepared by: Kimley-Horn and Associates, Inc. ã2013 Kimley-Horn
NO BUILD TRAFFIC OPERATIONS
 3. 23 NO BUILD TRAFFIC OPERATIONS This section addresses the operations of the transportation system and details how it would be expected to function under year 23 No Build conditions with the projected
METHODOLOGY. Signalized Intersection Average Control Delay (sec/veh)
") Chapter 5 Traffic Analysis 5.1 SUMMARY US /West 6 th Street assumes a unique role in the Lawrence Douglas County transportation system. This principal arterial street currently conveys commuter traffic
Chapter 5 Traffic Analysis 5.1 SUMMARY US /West 6 th Street assumes a unique role in the Lawrence Douglas County transportation system. This principal arterial street currently conveys commuter traffic
ADOT Statewide Bicycle and Pedestrian Program Summary of Phase IV Activities APPENDIX B PEDESTRIAN DEMAND INDEX
 ADOT Statewide Bicycle and Pedestrian Program Summary of Activities APPENDIX B PEDESTRIAN DEMAND INDEX May 24, 2009 Pedestrian Demand Index for State Highway Facilities Revised: May 29, 2007 Introduction
DUNBOW ROAD FUNCTIONAL PLANNING
 DUNBOW ROAD FUNCTIONAL PLANNING Final Report August 3, 216 #31, 316 5th Avenue NE Calgary, AB T2A 6K4 Phone: 43.273.91 Fax: 43.273.344 wattconsultinggroup.com Dunbow Road Functional Planning Final Report
URBAN STREET CONCEPTS
 CHAPTER 10 URBAN STREET CONCEPTS CONTENTS I. INTRODUCTION... 10-1 II. URBAN STREETS...10-1 Flow Characteristics... 10-3 Free-Flow Speed...10-3 Running Speed... 10-3 Travel Speed... 10-4 Time-Space Trajectory...10-4
5.0 Roadway System Plan
 Southwest Boise Transportation Study Page 16 5.0 Roadway System Plan The Roadway System Plan outlines roadway improvements in the Initial Study Area. It forecasts future deficiencies on the arterial system,
3 ROADWAYS 3.1 CMS ROADWAY NETWORK 3.2 TRAVEL-TIME-BASED PERFORMANCE MEASURES Roadway Travel Time Measures
 ROADWAYS Approximately 6 million trips are made in the Boston metropolitan region every day. The vast majority of these trips (80 to percent, depending on trip type) involve the use of the roadway network
TRANSPORTATION ANALYSIS REPORT US Route 6 Huron, Erie County, Ohio
 TRANSPORTATION ANALYSIS REPORT US Route 6 Huron, Erie County, Ohio December 12, 2012 Prepared for: The City of Huron 417 Main Huron, OH 44839 Providing Practical Experience Technical Excellence and Client
City of Homewood Transportation Plan
 City of Homewood Transportation Plan Prepared for: City of Homewood, Alabama Prepared by: Skipper Consulting, Inc. May 2007 TABLE OF CONTENTS INTRODUCTION... 1 BACKGROUND INFORMATION... 1 EXISTING TRANSPORTATION
4. ENVIRONMENTAL IMPACT ANALYSIS 9. TRANSPORTATION AND TRAFFIC
 4. ENVIRONMENTAL IMPACT ANALYSIS 9. TRANSPORTATION AND TRAFFIC 4.9.1 INTRODUCTION The following section addresses the Proposed Project s impact on transportation and traffic based on the Traffic Study
Subject: Solberg Avenue / I-229 Grade Separation: Traffic Analysis
 MEMORANDUM Transportation Bill Troe, AICP Jason Carbee, AICP 12120 Shamrock Plaza Suite 300 Omaha, NE 68154 (402) 334-8181 (402) 334-1984 (Fax) To: Project File Date: Subject: Solberg Avenue / I-229 Grade
TABLE OF CONTENTS TABLE OF CONTENTS... I APPENDICES... III LIST OF EXHIBITS... V LIST OF TABLES... VII LIST OF ABBREVIATED TERMS...
 TABLE OF CONTENTS TABLE OF CONTENTS... I APPENDICES... III LIST OF EXHIBITS... V LIST OF TABLES... VII LIST OF ABBREVIATED TERMS... IX 1 INTRODUCTION... 1 1.1 Project Overview... 1 1.2 Analysis Scenarios...
7.0 FREEWAYS CONGESTION HOT SPOT PROBLEM & IMPROVEMENT PROJECT ANALYSIS & DEFINITION
 7.0 FREEWAYS CONGESTION HOT SPOT PROBLEM & IMPROVEMENT PROJECT ANALYSIS & DEFINITION 7.1 INTRODUCTION & METHODOLOGY FEASIBILITY REPORT Congestion hot spot problem locations have been assessed using the
Appendix B: Forecasting and Traffic Operations Analysis Framework Document
 Existing Conditions Report - Appendix Appendix B: Forecasting and Traffic Operations Analysis Framework Document This document defines the methodology and assumptions that will be used in the traffic forecasting
Technical Memorandum TRAFFIC IMPACT STUDY. RIDLEY ROAD CONVENIENCE STORE Southampton County, VA. Prepared for: Mr. David Williams.
 Technical Memorandum TRFFIC IMPCT STUDY RIDLEY ROD CONVENIENCE STORE Southampton County, V Prepared for: Mr. David Williams By: Charles Smith, P.E., PTOE EPR Charlottesville, V July 2014 1 TBLE OF CONTENTS
List of Exhibits...ii
 One Brickell Traffic Study TABLE OF CONTENTS List of Exhibits...ii EXECUTIVE SUMMARY...1 1. INTRODUCTION...2 1.1 Study Area...2 1.2 Study Objective...5 2. EXISTING TRAFFIC CONDITIONS...6 2.1 Data Collection...6
TRAFFIC IMPACT STUDY CRITERIA
 Chapter 6 - TRAFFIC IMPACT STUDY CRITERIA 6.1 GENERAL PROVISIONS 6.1.1. Purpose: The purpose of this document is to outline a standard format for preparing a traffic impact study in the City of Steamboat
Project Development & Environment (PD&E) Study. November 17, SR 90 (SW 8th Street and SW 7th Street) SW 8 th Street/SW 7 th Street PD&E Study 1
 Study. November 17, SR 90 (SW 8th Street and SW 7th Street) SW 8 th Street/SW 7 th Street PD&E Study 1") Financial Management Number: 432639-6-22-01 Federal Aid Project Number: 0202-054-P Efficient Transportation Decision Making Number: 14230 Project Development & Environment (PD&E) Study SR 90 (SW 8th Street
Financial Management Number: 432639-6-22-01 Federal Aid Project Number: 0202-054-P Efficient Transportation Decision Making Number: 14230 Project Development & Environment (PD&E) Study SR 90 (SW 8th Street
FORM A PASCO COUNTY ACCESS CONNECTION PERMIT APPLICATION
 FORM 901.3.A PASCO COUNTY ACCESS CONNECTION PERMIT APPLICATION The following information is required from all applicants directly or indirectly accessing any collector or arterial road or as otherwise
Chapter Capacity and LOS Analysis of a Signalized I/S Overview Methodology Scope Limitation
 Chapter 37 Capacity and LOS Analysis of a Signalized I/S 37.1 Overview The Highway Capacity Manual defines the capacity as the maximum howdy rate at which persons or vehicle can be reasonably expected
City of Wayzata Comprehensive Plan 2030 Transportation Chapter: Appendix A
 A1. Functional Classification Table A-1 illustrates the Metropolitan Council s detailed criteria established for the functional classification of roadways within the Twin Cities Metropolitan Area. Table
I-95 Northbound at US 1 (Exit 126) Design and Study Final Report
 Design and Study Final Report") I-95 Northbound at US 1 (Exit 126) Design and Study Final Report July 2018 Prepared by: Prepared for: TABLE OF CONTENTS 1 Introduction... 1 Study Area Limits... 1 Purpose and Need of the Study... 1 Safety
I-95 Northbound at US 1 (Exit 126) Design and Study Final Report July 2018 Prepared by: Prepared for: TABLE OF CONTENTS 1 Introduction... 1 Study Area Limits... 1 Purpose and Need of the Study... 1 Safety
Corpus Christi Metropolitan Transportation Plan Fiscal Year Introduction:
 Introduction: The Safe, Accountable, Flexible, Efficient Transportation Equity Act: A Legacy for Users (SAFETEA-LU) has continued the efforts started through the Intermodal Surface Transportation Efficiency
Highway 49, Highway 351 and Highway 91 Improvements Feasibility Study Craighead County
 Highway 49, Highway 351 and Highway 91 Improvements Feasibility Study Craighead County Executive Summary March 2015 Highway 49, Highway 351 and Highway 91 Improvements Feasibility Study Craighead County
Design Traffic Technical Memorandum
 State Road 7 Extension PD&E Study Design Traffic Technical Memorandum Palm Beach County, FL October 2010 State Road 7 Extension PD&E Study Design Traffic Technical Memorandum Palm Beach County, FL Prepared
Traffic Impact Study WestBranch Residential Development Davidson, NC March 2016
 Traffic Impact Study WestBranch Residential Development Davidson, NC March 216 TRAFFIC IMPACT STUDY FOR THE WestBranch Residential Development LOCATED IN DAVIDSON, NC Prepared For: Lennar Carolinas, LLC
The current document is revised based on the comments received on:
 General Overview 1 Introduction Over the last several years, the Waterford Lakes area has experienced increased congestion due to a substantial increase in residential and commercial development. The current
Chapter 16: Traffic and Parking A. INTRODUCTION
 Chapter 6: Traffic and Parking A. ITRODUCTIO This chapter examines the potential traffic and parking impacts of the proposed Fresh Kills Park roads. The analysis of transit and pedestrians is presented
APPENDIX G: INTERSECTION NEEDS AT OKEECHOBEE BOULEVARD
 APPENDIX G: INTERSECTION NEEDS AT OKEECHOBEE BOULEVARD INTERSECTION NEEDS AT SR 7 and OKEECHOBEE BOULEVARD SR 7 Extension Project Development and Environment (PD&E) Study From Okeechobee Boulevard (SR
Exhibit 1 PLANNING COMMISSION AGENDA ITEM
 Exhibit 1 PLANNING COMMISSION AGENDA ITEM Project Name: Grand Junction Circulation Plan Grand Junction Complete Streets Policy Applicant: City of Grand Junction Representative: David Thornton Address:
4.11 TRANSPORTATION 4.11 TRANSPORTATION Environmental Setting Intersection, Roadway, and Freeway Evaluation Methodology
 4.11 TRANSPORTATION This section describes the road transportation system in the vicinity of the proposed Project and the potential impacts to this system from the proposed Project. The analysis in this
A Traffic Operations Method for Assessing Automobile and Bicycle Shared Roadways
 A Traffic Operations Method for Assessing Automobile and Bicycle Shared Roadways A Thesis Proposal By James A. Robertson Submitted to the Office of Graduate Studies Texas A&M University in partial fulfillment
Multimodal Arterial Level of Service
 Multimodal Arterial Level of Service DOUGLAS S. MCLEOD Florida Department of Transportation, USA ABSTRACT The concept of quality of service from a user perspective of a transportation facility or service
5.3 TRAFFIC, CIRCULATION AND PARKING
 5.3 TRAFFIC, CIRCULATION AND PARKING This section is based upon the Downtown Lancaster Specific Plan Traffic Impact Analysis (April 2, 2008) and the Downtown Lancaster Specific Plan Parking Analysis (May
MEMORANDUM. To: 1.0 PURPOSE
 MEMORANDUM To: Scott Holland, Elements Architecture From: Brian Grover, Dudek Date: July 16, 2014 1.0 PURPOSE In response to the November 4, 2013 request (RE: Incomplete Application Southern California
Chapter 6: Transportation
 Chapter 6: Transportation I. INTRODUCTION The purpose of the Transportation Plan element of the Comprehensive Plan is to provide guidance to the City of North Mankato, as well as existing and future landowners
Table of Contents FIGURES TABLES APPENDICES. Traffic Impact Study Hudson Street Parking Garage MC Project No.: A Table of Contents
 Traffic Impact Study Hudson Street Parking Garage MC Project No.: 151714A Table of Contents Table of Contents I. INTRODUCTION... 2 II. EXISTING CONDITIONS... 5 III. 215 EXISTING TRAFFIC CONDITIONS... 6
4.0 TRAFFIC IMPACT STUDIES
 SECTION 4 4.0 TRAFFIC IMPACT STUDIES 4.1 TRAFFIC IMPACT STUDY REQUIREMENTS The City has established Traffic Impact Study (TIS) requirements for the purpose of ensuring that both the quantitative and qualitative
Transportation Impact Study for Abington Terrace
 Transportation Impact Study for Abington Terrace Abington Township, Montgomery County, PA Sandy A. Koza, P.E., PTOE PA PE License Number PE059911 Prepared by McMahon Associates, Inc. 425 Commerce Drive,
HIGHWAY CAPACITY MANUAL
 HISTORY OF THE HIGHWAY CAPACITY MANUAL TexITE - Houston Chapter November 10, 2010 Michael Y. Ereti City of Houston Department of Public Works & Engineering THE NEW GUY (Michael Ereti) Consultant (10 years)
PRELIMINARY DRAFT WADDLE ROAD / I-99 INTERCHANGE PROJECT ALTERNATIVE ANALYSIS FINAL TRAFFIC SUMMARY REPORT
 PRELIMINARY DRAFT WADDLE ROAD / I-99 INTERCHANGE PROJECT ALTERNATIVE ANALYSIS FINAL TRAFFIC SUMMARY REPORT Prepared by: In Association with: November 2013 EXECUTIVE SUMMARY Patton Township, in partnership
TABLE TRAFFIC ANALYSIS SCENARIOS
 4.11 TRANSPORTATION The potential traffic impacts of the proposed project are evaluated in the Buena Park Beach/Orangethorpe Mixed Use Project Traffic Analysis (Traffic Analysis) by Austin-Foust Associates
REVIEW OF LOCAL TRAFFIC FLOW / LONG RANGE PLANNING SOLUTIONS STUDY
 ITEM Town of Atherton TRANSPORTATION COMMITTEE STAFF REPORT TO: FROM: MEMBERS OF THE COMMITTEE ROBERT OVADIA, PUBLIC WORKS DIRECTOR DATE: FEBRUARY 12, 2019 SUBJECT: REVIEW OF LOCAL TRAFFIC FLOW / LONG
ENHANCED PARKWAY STUDY: PHASE 2 CONTINUOUS FLOW INTERSECTIONS. Final Report
 Preparedby: ENHANCED PARKWAY STUDY: PHASE 2 CONTINUOUS FLOW INTERSECTIONS Final Report Prepared for Maricopa County Department of Transportation Prepared by TABLE OF CONTENTS Page EXECUTIVE SUMMARY ES-1
Recommended Roadway Plan Section 2 - Land Development and Roadway Access
 Recommended Roadway Plan Section 2 - Land Development and Roadway Access SECTION 2 Land Development and Roadway Access 2.1 Land Use and Access Management The Federal Highway Administration (FHWA) defines
Waterford Lakes Small Area Study
 Over the last several years, the Waterford Lakes area has experienced increased congestion due to a substantial increase in residential and commercial development. The current Existing and Future Conditions
Classification Criteria
 SCHEDULE D TO RECOMMENDED OFFICIAL PLAN AMENDMENT NO. 40 SCHEDULE C-4 Road Criteria Criteria Traffic Service Objective Land Service/Access Typical Daily Traffic Volume Flow characteristics Travel Speed
DRAFT TRAFFIC STUDY BOULDER AVENUE BRIDGE REPLACEMENT CITY OF HIGHLAND SAN BERNARDINO COUNTY, CALIFORNIA
 DRAFT CITY OF HIGHLAND SAN BERNARDINO COUNTY, CALIFORNIA August 8, 2006 DRAFT CITY OF HIGHLAND SAN BERNARDINO COUNTY, CALIFORNIA Prepared for: City of Highland 27215 Baseline Highland, California 92346
Project Report. South Kirkwood Road Traffic Study. Meadows Place, TX October 9, 2015
 Meadows Place, TX October 9, 2015 Contents 1 Introduction... 1 2 Data Collection... 1 3 Existing Roadway Network... 2 4 Traffic Volume Development... 2 5 Warrant Analysis... 3 6 Traffic Control Alternative
Glenn Avenue Corridor Traffic Operational Evaluation
 Glenn Avenue Corridor Traffic Operational Evaluation PREPARED FOR: THE CITY OF AUBURN PREPARED BY: DECEMBER 2007 Glenn Avenue Corridor Study--Auburn, Alabama TABLE OF CONTENTS Introduction... 1 Background
Traffic Impact Analysis Walton Acres at Riverwood Athletic Club Clayton, NC
 Traffic Impact Analysis Walton Acres at Riverwood Athletic Club Clayton, NC 1. TABLE OF CONTENTS INTRODUCTION...1 1.1. Site Location and Study Area...1 1.2. Proposed Land Use and Site Access...2 1.3.
Moving Towards Complete Streets MMLOS Applications
 Moving Towards Complete Streets MMLOS Applications Transportation Education Series May 18 th, 2012 It s not just for cars! Presentation Overview The Complete Streets Movement What is Multi-Modal Level
CITY OF COCOA BEACH 2025 COMPREHENSIVE PLAN. Section VIII Mobility Element Goals, Objectives, and Policies
 CITY OF COCOA BEACH 2025 COMPREHENSIVE PLAN Section VIII Mobility Element Goals, Objectives, and Policies Adopted August 6, 2015 by Ordinance No. 1591 VIII MOBILITY ELEMENT Table of Contents Page Number
Multimodal Level of Service in King County
 Multimodal Level of Service in King County A Guide to Incorporating Alternative Modes of Transportation into Local Jurisdictions Roadway Performance Measurements Made possible by funding from the Department
INDUSTRIAL BUILDING 3009 HAWTHORNE ROAD CITY OF OTTAWA TRANSPORTATION OVERVIEW REVISED. Prepared for: Canada Inc.
 INDUSTRIAL BUILDING 3009 HAWTHORNE ROAD CITY OF OTTAWA TRANSPORTATION OVERVIEW REVISED Prepared for: 7849648 Canada Inc. Octiober 1, 2015 114-598 Overview_2.doc D. J. Halpenny & Associates Ltd. Consulting
BLOSSOM AT PICKENS SIGNALIZED INTERSECTION IMPROVEMENT STUDY
 BLOSSOM AT PICKENS SIGNALIZED INTERSECTION IMPROVEMENT STUDY Class Project Report for ECIV 542 Traffic Engineering Submitted by Omor Sharif Muchun Song Narges Kaveshgar Quyen Pham Chih-Yao Lin Submission
Assessing Level of Service for Highways in a New Metropolitan City
 Assessing Level of Service for Highways in a New Metropolitan City Ganesh Pawar Civil Engineering Department G. H. Raisoni College of Engineering Nagpur, India,4416 Dr. Bhalachandra Khode Civil Engineering
CITY OF SASKATOON COUNCIL POLICY
 ORIGIN/AUTHORITY Clause 1, Report No. 1-1980 and Clause 4, Report No. 22-1990 of the Works and Utilities Committee; Clause 6, Report No. 17-2004 of the Planning and Operations Committee; and Clause D5,
2025 Comprehensive Plan for the City of Temple Terrace Florida. Mobility Element. Adopted by City Council June 30, 2009
 2025 Comprehensive Plan for the City of Temple Terrace Florida Mobility Element Adopted by City Council June 30, 2009 Effective Date September 22, 2009 GOAL 2: To protect and promote the quality of life
V. ENVIRONMENTAL IMPACT ANALYSIS K. TRANSPORTATION AND CIRCULATION
 V. ENVIRONMENTAL IMPACT ANALYSIS K. TRANSPORTATION AND CIRCULATION ENVIRONMENTAL SETTING The following section is based on the Draft Traffic Circulation Study for the Malibu La Paz Project (Traffic Study),
Multimodal Analysis in the 2010 Highway Capacity Manual
 Multimodal Analysis in the 2010 Highway Capacity Manual It s not just cars anymore! Jamie Parks, AICP HCAT Conference May 9-10, 2011 Multimodal LOS in the 2010 HCM History and background Overview of methods
DEPARTMENT OF ENVIRONMENTAL SERVICES. North Harrison Street (Lee Highway to Little Falls Road) Comparative Analysis. Prepared for:
 Comparative Analysis. Prepared for:") DEPARTMENT OF ENVIRONMENTAL SERVICES North Harrison Street (Lee Highway to Little Falls Road) Comparative Analysis Prepared for: Arlington County Department of Environmental Services 2100 Clarendon Boulevard,
DEPARTMENT OF ENVIRONMENTAL SERVICES North Harrison Street (Lee Highway to Little Falls Road) Comparative Analysis Prepared for: Arlington County Department of Environmental Services 2100 Clarendon Boulevard,
Simulating Street-Running LRT Terminus Station Options in Dense Urban Environments Shaumik Pal, Rajat Parashar and Michael Meyer
 Simulating Street-Running LRT Terminus Station Options in Dense Urban Environments Shaumik Pal, Rajat Parashar and Michael Meyer Abstract The Exposition Corridor transit project is a light rail project
SELECTED ROADWAY CAPACITY ANALYSIS
 CHAPTERFOUR SELECTED ROADWAY CAPACITY ANALYSIS 4.1 SELECTED ROADWAY CAPACITY ANALYSIS Introduction Capacity analysis was performed on six selected roadways within the Dearborn County study area using the
Lyons Avenue/Dockweiler Road Extension Project Draft Environmental Impact Report. Appendix I Traffic Impact Study
 Lyons Avenue/Dockweiler Road Extension Project Draft Environmental Impact Report Appendix I Traffic Impact Study Street 0 80-1947 500.4501 RITA ld Court 0 91355-1096 400.7401 LA n Avenue 0 590-3745 300-9301
Access Management Regulations and Standards
 Access Management Regulations and Standards January 2014 Efficient highway operation Reasonable property access Concept of Access Management The way to manage access to land development while preserving
TRAFFIC IMPACT STUDY COMPREHENSIVE UPDATE TOWN OF THOMPSON S STATION, TENNESSEE PREPARED FOR: THE TOWN OF THOMPSON S STATION
 TRAFFIC IMPACT STUDY COMPREHENSIVE UPDATE TOWN OF THOMPSON S STATION, TENNESSEE PREPARED FOR: THE TOWN OF THOMPSON S STATION Transportation Consultants, LLC 1101 17 TH AVENUE SOUTH NASHVILLE, TN 37212
Traffic Circulation Study for Neighborhood Southwest of Mockingbird Lane and Airline Road, Highland Park, Texas
 ARIZONA TEXAS NEW MEXICO OKLAHOMA February 13, 2015 Mr. Meran Dadgostar P.E., R.S. Town of Highland Park 4700 Drexel Dr. Highland Park, Texas 75205 Re: Traffic Circulation Study for Neighborhood Southwest
Basalt Creek Transportation Refinement Plan Recommendations
 Basalt Creek Transportation Refinement Plan Recommendations Introduction The Basalt Creek transportation planning effort analyzed future transportation conditions and evaluated alternative strategies for
RESOLUTION NO ?? A RESOLUTION OF THE CITY OF NEPTUNE BEACH ADOPTING A COMPLETE STREETS POLICY
 RESOLUTION NO. 2018-?? A RESOLUTION OF THE CITY OF NEPTUNE BEACH ADOPTING A COMPLETE STREETS POLICY WHEREAS, safe, convenient, and accessible transportation for all users is a priority of the City of Neptune
CHAPTER 4 TRANSPORTATION IMPACT STUDY TABLE OF CONTENTS
 CHAPTER 4 TRANSPORTATION IMPACT STUDY TABLE OF CONTENTS Section Title Page 4.1 Introduction... 4-1 4.1.1 General... 4-1 4.1.2 Applicant Responsibility... 4-1 4.1.3 Capacity and Safety Issues... 4-1 A.
appendix b BLOS: Bicycle Level of Service B.1 Background B.2 Bicycle Level of Service Model Winston-Salem Urban Area
 appendix b BLOS: B.1 Background Winston-Salem Urban Area Bicycle Level of Service Level of Service (LOS) is a framework that transportation professionals use to describe existing conditions (or suitability)
SECTION 1 - TRAFFIC PLANNING
 SECTION 1 - TRAFFIC PLANNING 1.1 TRAFFIC OPERATIONS 1.1.1 Roadway Functional Classification The Multnomah County Comprehensive Framework Plan s Policy 34: Trafficways and the Functional Classification
CAPACITY, LEVEL OF SERVICE, FUNDAMENTALS OF HIGHWAY CAPACITY ANALYSIS
 CAPACITY, LEVEL OF SERVICE, FUNDAMENTALS OF HIGHWAY CAPACITY ANALYSIS 1. GENERAL Transportation facilities can be classified into two categories of flow: uninterrupted and interrupted. Uninterrupted-flow
2014 STATE OF THE SYSTEM REPORT
 2014 STATE OF THE SYSTEM REPORT March 2016 This page intentionally left blank System Performance Monitoring This page intentionally left blank System Performance Monitoring State of the System Performance
Roadway Classification Review
 District of North Vancouver 355 West Queens Road North Vancouver British Columbia V7N 4N5 Roadway Classification Review District of North Vancouver January 2013 District of North Vancouver Roadway Classification
Preliminary Transportation Analysis
 Preliminary Transportation Analysis Goals of a Robust, Multimodal Transportation Network Safe Accessible/Connected Efficient Comfortable Context-Sensitive Motor Vehicle: Continue to analyze the data to
REPORT CONCURRENCE. City Manager. The General Manager concurs with the recommendation of this report.
 COUNCIL REPORT Report No. ENG 08-018 Executive Committee Date: May 0, 018 File No: 5400-1 To: From: Subject: Mayor and Council Purvez Irani, Senior Transportation Engineer Bluejay Street Road Improvements
Executive Summary June 2015
 Executive Summary June 2015 Highway 112 Corridor Study Benton and Washington Counties Executive Summary June 2015 Prepared by Transportation Planning and Policy Division Arkansas State Highway and Transportation
Washington DC Section of ITE Project Briefing
 Washington DC Section of ITE Project Briefing November 5, 2015 Renée Hamilton, VDOT, Deputy District Administrator I-66 Outside the Beltway Improvement Area Project Location Virginia 2 Purpose and Need
Traffic Impact Analysis Chatham County Grocery Chatham County, NC
 Chatham County Grocery Chatham County, NC TABLE OF CONTENTS 1. INTRODUCTION... 1 1.1. Location and Study Area... 1 1.2. Proposed Land Use and Access... 2 1.3. Adjacent Land Uses... 2 1.4. Existing ways...