Joseph Weiss and Luke Rygh Chicagoland Bicycle Federation Geo 242 November 15, 2007
|
|
|
- Sharyl Dawson
- 6 years ago
- Views:
Transcription
1 Joseph Weiss and Luke Rygh Chicagoland Bicycle Federation Geo 242 November 15,
2 2 Project Summary We are working with the Chicagoland Bicycle Federation to analyze the crash sites in the city of Chicago of the year We chose to work with the CBF because we feel that bicycle safety is an issue that is not promoted enough. In this project we focused on the number of crash sites that there were in 2005, hopefully determining if more/different traffic policies are needed to be implemented in the city of Chicago. There were 962 bicycle related crashes in Chicago in the year 2005, which we feel is a number that should be closer to zero. We feel that the information of bicycle related crashes should be readily available to the public, for it will promote a more sustainable form of transportation. In our project, we focused on the spatial information of the crash sites. We focused on where the crash sites were located in terms of zipcodes, streets, while looking at whether or not they were street-intersection related. In order to create a product that could be used to show the public that bicycling is safer than one would think, we needed to identify the hot-spots or trouble areas in the city in regards to bicycle traffic. We wanted to locate the hot spots by segment of road, to show visually where on particular streets accidents occurred most in We ended up creating several different thematic maps to show the trouble-areas of the city for bicyclists. First, we created a map that shows the overall number of bicyclerelated crashes located in each zip code of Chicago. We felt that this would best portray the size and complexity of the phenomena located in particular areas of the city. We then created a map that shows the number of bicycle accidents that occurred at street intersections. This will show the reader that there are a surprising amount of nonintersection related crashes. Lastly we located where the crash sites were pertaining to the streets in Chicago. Instead of focusing on a street in its entirety, we looked at streets in segments, therefore examining the number of crashes there were per street segment. We broke this map into three different maps: North Chicago, Central Chicago, and South Chicago. By doing this, we are able to portray the severity of the hot-spot per road segment in each of those sample areas. Splitting the information into three distinct zones enabled us to zoom closer to the characteristics that the map portrays. We feel that our findings are beneficial to the city of Chicago, for it shows what segments of roads that are trouble areas. Dividing the information into street segments will enable the city to focus on particular areas of streets when deciding on traffic controls and bicycle safety implementations. Also, by creating maps that show the zipcodes that experience the highest number of bicycle crashes makes it easier for the city to identify the districts that should focus on bicycle safety promotion.
3 3 Table of Contents Introduction 1 Needs Assessment 1-3 System Requirements 3-5 Data Acquisition 5-6 Data Analysis 6-9 Results 9 Summary/Conclusion/Recommendations 10 Appendices: Appendix A 11 Appendix B 11 Appendix C 12-17
4 4 Introduction: We have chosen to work with the Chicagoland Bicycle Federation for this project. We will be working with director Mike Erickson for this project whom works for the CBF. The goal of this project is to identify the hot-spots or troubled areas of the city in regard to bicycle accidents. We feel that this is an important project because many residents of Chicago feel that bicycling in the streets of the city is very dangerous. It is obvious that when cycling one must take precautions, but we also want to show that bicycling in the city may not be as dangerous as one may think. Producing maps that show where the accident hot-spots are located, we will be able to portray to the reader where danger zones are and therefore educate them into taking different routes during commutes. We completed the project in 5 steps, which will we look at next. First we asses our project. We complete a literature review of the issue of bicycle safety, and determine what we need to look at while concentrating on safety promotion. In this section we will decide what the need-to-know questions are and how we are planning on solving them. Second, we look at the systems required in completing this project. We focus on the data that we need to do and the relationships between data entities and attributes. We created an entity relationship model that shows how our data relates to one another, and some of the processes needed to be completed in portraying our information. Third, we focused on our data acquisition. In this section of the report we look at the sources of the data that we are going to use in our final project. This covers where we received our data from, and the steps we went through in acquiring that data. Fourth, we went through a data analysis. We examine how we are going to process our data in producing our information products. We break down our analysis into three sections, showing the steps to produce information products for: Crashes per zipcode, per street segment, and which is intersection related. Needs Assessment: Background: We have met with member, Mike Erickson, of the Chicagoland Bicycle Federation recently to talk about improving bicycle awareness to promote bicycle usage. One of the issues that we discussed was bicycle safety, and how many opt to rely on public transportation or automobile for their daily commutes because their impression of how unsafe bicycling is in urban environments. The mission of the Chicagoland Bicycle Federation (CBF) is to improve the bicycling environment and thereby the quality of life in the region (BikeTraffic.org). The CBF is trying to educate and inform citizens of
5 Chicago the important aspects of energy-efficient transportation methods, which improves the quality of life in several areas. One of the problems that Mike Erickson has encountered while working at CBF was that many people are still turned off to the idea of bicycle transportation as a safe and reliable means of mobility. Mike, as well as ourselves, feel that people do not think about using bicycles as a mode of transportation because of how unsafe they feel the method is. One of our group s goals in this project is to create and document crash and accident data to portray to its viewers where the problematic locations are referring to traffic. This would educate potential bicyclists into preferring this method of transport, for it will identify the areas that impose the highest level of threat for accidents. Our understanding of educating people to realize how practical bicycling can be is that it will not only provide a means of alternative transportation, but will simultaneously identify problem intersection and areas where safety assistance is and may be needed. An article posted by Michael Neuman (2004) talked about how cities such as Madison, Wisconsin are promoting bicycle usage to better sustain the environmental quality of life. Neuman states that the reduction of automobile usage will aid in many different areas such as: air pollution and quality, traffic density and congestion, conservation of resources, and reduce the rapid development of sprawl. If more people chose to use bicycle as a means of transport the need for an automobile will diminish and people would choose to live closer to where they work, eat, and play. David Tomlinson wrote in his essay, The Bicycle and Urban Sustainability (2003), about how bicycling in American cities has proven to be ordeal, whereas the in Europe it is the most popular form of transportation. Tomlinson feels that planning for urban sustainability cannot be to find a means to the end, but to rather focus on the negative and unsustainable practices that our nation is so involved in, such as automobile usage. To think of urban sustainability as a direction the government needs to take is an easier approach to gaining bicycle popularity in places where it posses none. Tomlinson states that he will argue that the methods used in some cities to promote alternatives to automobile transportation have made those cities more socially, environmentally, and economically sustainable, and that these strategies should be adapted and applied in cities such as Toronto (pp. 4). The city of Chicago has proposed a Bike Plan 2015 (2006) which builds upon the Bike Plan 2000 that is already in effect. Part of the plan consists of expanding the accessibility of the city by bicycle through different forms of infrastructure. The plan follows our beliefs that we need to locate the hot-spots of traffic and bicycle accidents to help in the aid of safety issues concerning bicycling. By 2015 the city hopes to produce a much friendlier and safer environment for not only bicyclists and pedestrians, but also automobiles. They hope to do this by: increasing the amount of miles of bicycle-only lanes, as well as shared lanes, increase the miles of shared lane and road markings regarding bicycles, and lastly to establish bike boulevards and raised bike lanes to facilitate safety in road sharing. The US is starting to realize how important of a role bicycles have in, not only cities, but for national sustainability. Increased usage of bicycles will decrease usage of automobiles. Increased usage of bicycles will help environmental, social, and economical problems in cities. As Tomlinson talked about in his essay, we must not search for ultimate solutions to sustainability problems, but we must focus on 5
6 6 unsustainable issues and figure out how to correct them. Our group feels that bicycles may be a solution to many unsustainable practices. Goal: The goal of our group working with the Chicagoland Bicycle Federation is to help people in the city of Chicago remain safe, whether they are riding their bicycles or vehicles. Many people do not feel safe riding their bikes on the streets and the CBF is hoping to change their opinions by showing them how safe they can be while transporting bike. We also want to help devise solutions to the problems that are present, such as why are there more crashes in this area compared to that area. Objectives: The CBF wants to know if there is spatial relevance of all of the crash sites within the city of Chicago. The CBF wants to see if there are specific locations that should be identified as hot-spots or areas that need attention. By doing this they will be able to determine if the city needs to take action in certain areas of the city for improving the safety of automobiles, bicyclists, and pedestrians. -CBF needs to know the frequency of vehicle/pedestrian/bicycle accident sites per street. -They also need to know if there is a correlation between the severity of accidents and the speed limit posted in each incident. -The CBF needs to know if there is a difference between the amounts of accidents there are during peak and off-peak hours of the work day. Information Products: -We will make a thematic map using graduated colors to show the frequency of vehicle/pedestrian/bicycle accidents per street. -We will make a scatter graph showing the relationship between the severity of the accident and the speed limit posted in each study area. -We will produce two different graphs showing the disparities of similarities between the frequency of accidents during peak and off-peak hours. System Requirements: Introduction: Our overall goal with working with the Chicagoland Bicycle Federation (CBF) is to try and find the inconsistencies and frequent occurrences of bicycling accidents throughout Cook County. We have concluded in Part 1 that one of the major reasons that people find bicycling extremely dangerous in the city is because of lack of information and knowledge that is provided to the public. We have identified some need-to-know questions that have guided us in constructing a strategy to help portray easy-to-read information to the public concerning the dangers of bicycling and perhaps where the danger-zones are spatially located in Cook County. Now we need to identify some of the contributing factors to the bicycle and pedestrian accidents, and determine if a pattern exists. In order to do so, we need to organize the data that we have, and figure out how we are to manipulate and link certain data characteristics to one another, thus enabling us to form a strategy as to how we will visually represent the crash data.
7 7 Data Requirements: Entities Need-to-Know Questions Hot Spots by Road Hot Spots by Zipcode Cause of Accident Street x Accident x x x Traffic Control x x Zipcode x Attributes: Street - # of lanes Direction of Travel Road condition Surface Condition (eg. Wet, Dry) Time/Day Accident Time/Day Weather Longitude/Latitude Severity Intersection Relation Work Zone Relation Visibility Traffic Control Type of Devise (eg. Traffic light, Stop Sign) Devise Function Intersection Related Visibility Relationship: We will relate our entity classes with the following: Accident Street - Many-to-One - Relation: Where on (Where on Street are there Accidents) Accident Traffic Control - One-to-One - Relation: Occurred where (Occurred where Traffic Control Exists) Street Traffic Control - One-to-Many - Relation: Controlled by (Street controlled by Traffic Control) Spatial Object Type: Street Line Accident Point Traffic Control Point
8 8 Entity Relationship Model: Software Matrix: Functions Need-to-Know Questions Hot Spots by Road Hot Spots by Zipcode Cause of Accident Attribute Query x x x and search Thematic Mapping x x Direct Import x x x Spatial Overlay x x Aspect Analysis x Institutional Requirements: To complete this project we will be using data that has been supplied by Mike Erickson of the CBF, as well as the StreetMap05 data that is available on the X:Drive in GIS Lab at DePaul University. The data we have received from the CBF is highly organized crash data consisting of 68 organizational characteristics. The data is comprised of 2005 crash/accident reports that were provided by the State of Illinois to the CBF. Though we are sure that not all accidents have been reported to officials, we feel that the data we do possess is a large sample size, enabling us to make accurate depictions and to analyze the existence of bicycle accidents in Cook County.
9 9 Data Acquisition: Introduction Through our discussions with Mike Erickson, and after discussing the Chicago Bicycle Federation s needs, it was decided what information we would need and what we were going to accomplish through the use of GIS. From these discussions, we found that looking at the street information of the accidents, along with certain details of each accident, relevant and usable maps showing the situation of each accident and where it is located will be the most useful maps. The maps will show hot spots by road and hot spots by zip code. This portion of the project is describing the type of data we have, where the data came from, and how useful it will all be. While we did not have much influence in the information collected or what to do with the information, the process is still important. Data Dictionary Street Data File Name: ChiStreets Description: Data representing location and relationship of all roads in Illinois that will be narrowed to show only Chicago in the final project. Spatial Type: Line Source of Data: The data was gathered from the file StreetMap05 located on the X: Drive in the GIS lab at DePaul University. Accident Data File Name: Accidents Description: Data collected describing the details of each reported pedestrian accident on the road. Data includes the date, time, and longitude/latitude of accident site, severity, intersection relation, work zone relation, visibility, weather and injury. Spatial Type: Point Source of Data: Individual data was collected by the Chicago Bicycle Federation and inputted into the computer by the CBF. The information was then ed for the project s production. Mike Erickson is the Director of the CBF. (xxx)xxx-xxxx. Data Source Steps The first step was to meet with Mr. Erickson downtown at the CBF office. From there, we discussed what our requirements and how they worked with what the CBF needed. After the meeting, he ed us the information they had collected. The street data was already on the X: Drive in the GIS lab at DePaul University, used for other projects. Fitness for Use The data collected is just right because the CBF only gave us the data they had collected that they wanted us to use. While much of the data is mixed up, it is our duty to organize it all in a way that can be easily viewed and understood. In order to do this, we will create choropleth maps that will sort out any confusion in the data. The limitation to using the data given to us is that it leaves very little room for our own creativity and basically sets out exactly what we need to do.
10 10 Data Acquisition Constraints Due to some miscommunication with Mike Erickson about what our time and duty constraints were, all data acquisition was up to the CBF to collect. In turn, we were stuck with what we had been given the path to creating maps was set out for us and we had to follow it. If we had our choice, we could have done more surveying, attempting to decide what roads could use bicycle lanes, interviewing bikers and local residents of hot spots and deciding what areas could use the most improvement. Data Analysis: Introduction: In stage 4 of our project, we are going to look at how we will analyze our data, which focuses on our need-to-know questions. Recently, Mike Erickson of the CBF asked us to also include the information of traffic signals to determine if the accidents were intersection related. He wants us to see if there is a correspondence between the accident site and traffic regulations. If we are able to distinguish a cause to the accident(s) we can then further implement a strategy to asses this problem. For example, an accident may have been caused by the biker him/herself for they may have ignored a traffic signal. Instances such as these are important to recognize because it shows that some accidents are not caused by wreckless driving or lack of infrastructure (traffic signals, speed limit, and road markings). In all we will have to incorporate many different criteria to our accident hot-spot analysis. Once we have located the accident sites, we will organize the severity by street and by zip code. By analyzing the frequency of crashes per street, we will be able to determine and/or hypothesize if the cause of the accident was infrastructure related or wreckless driving. By analyzing the frequency of crashes per zip code, we will be able to determine if there are certain districts within Chicago that provide little support to bicycle safety (perhaps by not fixing faulty road surfaces and/or properly marking bicycle lanes). We will also single out cases where the accident was intersection related and/or traffic signal related. It is easy to generalize about how accidents were caused. But there are many instances where the cyclist was the catalyst of the accident. Perhaps the cyclist was traveling the wrong direction on a one-way street or failed to obey a traffic signal. Determining the cause of the accident is highly important because infrastructure implementation can only bring forth a fraction of safety. We want to focus on the cases where the accident caused was a result of infrastructure, proving that certain roads and districts (zip codes) are failing to improve the safety conditions for bicyclists. Analysis Plan: First we will determine the amount and location of each accident in relation to the road throughout the city of Chicago. By doing so we will input our crash data by latitudinal and longitudinal location and overlaying this data over the streets layer in the X:\StreetMap06\usa\census for city boundary data. This will give us the spatial location of the crash sites per street. This will probably result in a dot-density or proportional symbol map emphasizing its severity. We will have to create two different maps, one showing the location of crash sites throughout Chicago, and another more-
11 11 detailed map of the Loop area. We need to create individual maps for the Loop because of the large frequency of crash sites located there. Next we will use the same crash data and overlay it with a Chicago zip code layer. Doing this we will be able to create a choropleth map showing the severity/frequency of accidents per city district. Lastly we will have to manually interpret whether or not the accident was intersection related or not. We will be able to select the cases where it was/was not due to how our crash data is organized. We need to first overlay the crash sites data with the streets layer. We will then be able to identify the number of accidents that occurred on each street through means of attribute query. We are not sure as to how we will portray our findings onto a map, but we feel it will either be a proportional symbol map showing the severity of accident sites, are we will do an aggregate color map, differing the color of the street segments depending on the number of accidents located there.
12 12 We will first import a layer containing the City of Chicago organized by zip codes. Next we will perform an attribute query to identify the number of accidents that are located in each zip code, enabling us to decipher which areas of the city are most problematic for bicyclists. For the portrayal of this information, we will choose to use a color choropleth map, where the darker zip code districts will be where more accidents occur. For this segment of our project we are going to perform an attribute query to select the accidents that were intersection located. We will then use another attribute query to see if the accidents at the intersection were caused due to a malfunction of infrastructure (traffic light, stop sign, etc.) We will then calculate the frequency of intersection related accidents compared to those non-intersection related. To display the frequency of
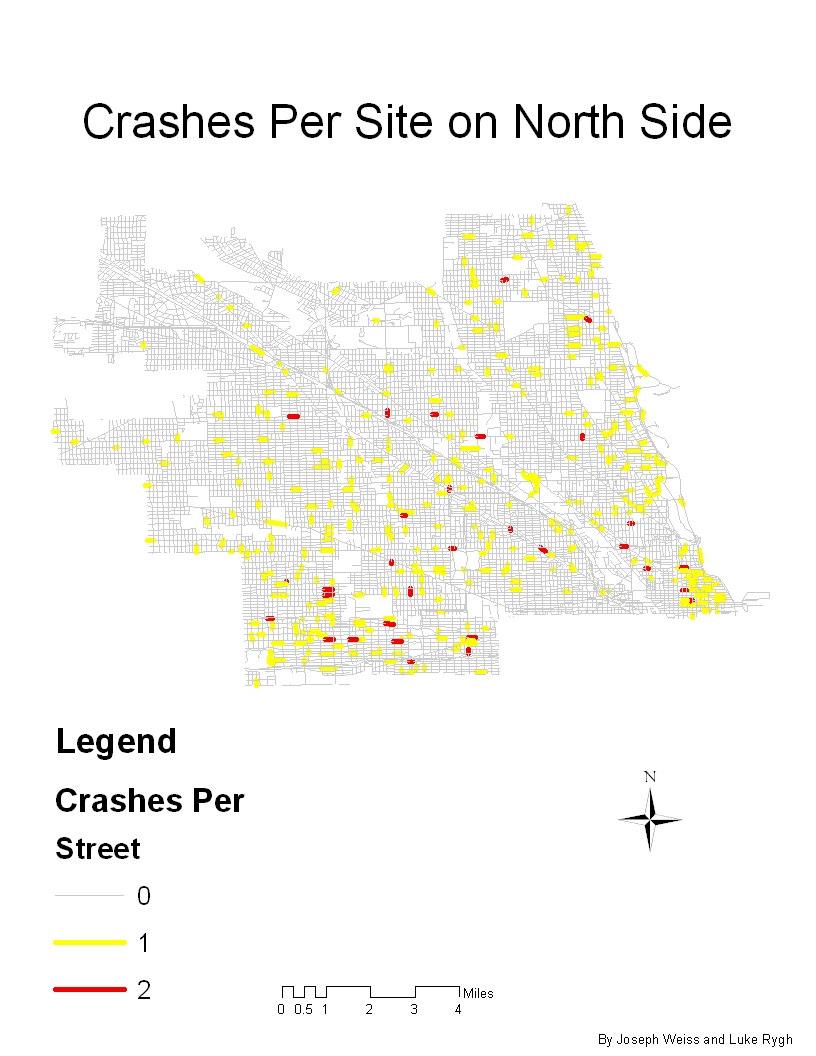
13 13 intersection related accidents, we will use a color categorical scheme, where intersection related crashes will be of different color than those non-intersection related. We will also produce a frequency distribution graph showing the percentage of all crashes that were intersection related. One issue we are going to face is the large abundance of accidents that are located within the loop district. We are going to have to cerate different maps that show the same three (accidents per road, accidents per zip code, and frequency of intersection related accidents) entities for the loop district, as well as the entire city of Chicago. Results: As a result, we were successful in creating thematic maps that explain our phenomena. Figure A (See Appendix C) is a choropleth map that shows the total number of accidents that are located in each zip code of Chicago. This map shows what areas of the city need to address their bicycle safety issue. We were able to complete this map by spatially joining our XY Crash data with a zipcode layer of the city of Chicago. Once we joined the two layers, the resulting layer contained the number of crashes that occurred in each zipcode. Figure B shows the intersection-related crashes with the non-intersectionrelated crashes in Chicago. The intersection-related crashes we symbolize in red, and the non-intersection-related crashes are symbolized in green. We were able to complete this map by simply overlaying our XY crash data over the same city of Chicago by zipcode. We performed an attribute query where we located the crashes that occurred in intersection and those that did not. We feel that this map successfully shows that many of the accidents that occurred in 2005 were not intersection-related, which most would assume is the case. Figure C is a thematic map that shows the number of bicycle crashes that occurred on each street segment in Chicago. We were able to complete this map by clipping the road layer from X:streetmap05/streets layer. Once we clipped, we had all of the local and major roads that are present in Chicago. We then spatially joined our XY crash data to the streets layer to show how many accidents occurred per street segment and the quantity. We felt that this map was a little to overwhelming for it encompasses a large area. We then decided to break down the same image as Figure C into three images: Figures D-F. Figures D-F have the same information as Figure C, but we broke Chicago into three sections: North, Central and South. By dividing figure C into three maps, we were able to zoom in closer to the city, and better portray the crash location information. We have found that there are many areas and street segments that are trouble areas for bicyclists. There were many instances where there were more than one crash that occurred in the same location as another accident. By identifying these crash locations and trouble areas, we are now able to point out to policy makers where problems are arising, therefore promoting bicycle safety to addressed in those areas.
14 14 Summary/Conclusion/Recommendation: Though we were under a time constraint, we feel that we produced an above par information product. Depending on how the city decides to approach bicycle safety and infrastructure, we provided maps that show the city by zipcode, and the city by street segment. By creating a map that shows the number of crashes that occurred in 2005 per zipcode, the city can then focus on an entire community when implementing new bicycle policies and policies for traffic safety. By creating a map that breaks down the crashes by street segment, the city is able to locate the trouble intersections and segments of streets. As we said before, we feel that there are many trouble areas in the city. There are many zipcodes that experienced over 40 crashes in There are also many street segments that experienced two of more crashes in We feel that something needs to be done to reduce these crash cases, and to imply traffic safety more aggressively. Taking the information that we have produced, we would recommend that the cause of the accident be looked at more thoroughly. We did not have enough time to go back and look at the times of the accidents and the weather conditions during the accidents. By taking the crash data that we have created, one could go back and see if it was because of road conditions, whether or not there are bike lanes marked, and time of day the accident occurred. By doing this, the city would be able to narrow down the true causes of bicycle accidents, and prove if the accident was causes by wreckless bicycling not driving. Now that we have determined the locations of the bike crashes and the troubled areas of the city, we would recommend that one would then focus on the cause of accident to determine the policy or process one should take to address the problems.
15 15 Appendix: Appendix A: Mike Erickson - Chicagoland Bicycle Federation Bicycle and Pedestrian Planner 9 West Hubbard St. Chicago, IL mikeerickson@biketraffic.org (312) ext. 292 Joseph Weiss DePaul University Geography Student Jweiss7@students.depaul.edu (908) Luke Rygh DePaul University Geography Student Lrygh12@yahoo.com (630) Appendix B: Works Cited City of Chicago. Bike Plan < Neuman, Michael T. Rebates for Driving Less: a Nonstructural Alternative to Expanding the Capacity of Highways. August < Tomlinson, David. The Bicycle and Urban Sustainability. January York University. <


16 16 Appendix C: Fig. A


17 Fig. B 17
18 Fig. C 18
19 Fig. D 19
20 Fig. E 20
21 Fig. F 21
304B Gordon- TTU Lubbock, TX April 6 th, 2011 Mr. Tyler Patton Office of the President 4952 Matador Avenue Lubbock, TX Dear Tyler Patton:
 304B Gordon- TTU Lubbock, TX 79406 April 6 th, 2011 Mr. Tyler Patton Office of the President 4952 Matador Avenue Lubbock, TX 79413 Dear Tyler Patton: Congratulations on your election as President of SGA!
Developing a Bike/Pedestrian Plan Using ArcInfo and Public Participation Rob Shumowsky, Madison County Council of Governments
 Developing a Bike/Pedestrian Plan Using ArcInfo and Public Participation Rob Shumowsky, Madison County Council of Governments Abstract: The Madison County Council of Governments is creating a bike/pedestrian
J Street and Folsom Boulevard Lane Conversion Project (T ) Before and After Traffic Evaluation
 Before and After Traffic Evaluation") J Street and Folsom Boulevard Lane Conversion Project (T15125400) Before and After Traffic Evaluation Prepared by Transportation Division June 2014 Executive Summary On February 12, 2013, the City of Sacramento
J Street and Folsom Boulevard Lane Conversion Project (T15125400) Before and After Traffic Evaluation Prepared by Transportation Division June 2014 Executive Summary On February 12, 2013, the City of Sacramento
TABLE OF CONTENTS. Executive Summary
 Executive Summary Background... ES-1 Pedestrian Network... ES-2 Bikeway Network... ES-2 Collision History... ES-2 Public Input... ES-4 Conclusions and Recommendations... ES-4 1. Introduction and Setting
PEDESTRIAN COLLISIONS IN LOS ANGELES 1994 through 2000
 PEDESTRIAN COLLISIONS IN LOS ANGELES 1994 through 2000 City of Los Angeles Department of Transportation Gloria Jeff, General Manager March, 2006 This document printed with grant funds from the California
The Walkability Indicator. The Walkability Indicator: A Case Study of the City of Boulder, CO. College of Architecture and Planning
 1 : A Case Study of the City of Boulder, CO College of Architecture and Planning University of Colorado Author Note: Daryoosh Ardalan, Urban Regional Planning, College of Architecture and Planning, University
CITY OF HAMILTON PLANNING AND ECONOMIC DEVELOPMENT DEPARTMENT Transportation Planning and Parking Division
 CITY OF HAMILTON PLANNING AND ECONOMIC DEVELOPMENT DEPARTMENT Transportation Planning and Parking Division TO: Chair and Members Public Works Committee COMMITTEE DATE: June 18, 2018 SUBJECT/REPORT NO:
Bikes, Bikers and Infrastructure:
 Bikes, Bikers and Infrastructure: Solving Congestion Problems by Getting People Rolling (on Two Wheels) By Zachary Carlstrom and Alex Vasquez Table of Contents Page # Introduction..............................................................
Complete Street Analysis of a Road Diet: Orange Grove Boulevard, Pasadena, CA
 Complete Street Analysis of a Road Diet: Orange Grove Boulevard, Pasadena, CA Aaron Elias, Bill Cisco Abstract As part of evaluating the feasibility of a road diet on Orange Grove Boulevard in Pasadena,
NASHUA REGIONAL PLANNING COMMISSION REGIONAL BICYCLE AND PEDESTRIAN PLAN
 NASHUA REGIONAL PLANNING COMMISSION REGIONAL BICYCLE AND PEDESTRIAN PLAN June, 2005 Prepared by the Nashua Regional Planning Commission 2005 NRPC Regional Bicycle and Pedestrian Plan- JUNE 2005 ACKNOWLEDGEMENTS
Appendix E: Bike Crash Analysis ( )
") Appendix E: Bike Crash Analysis (2009-2012) Davis Bicycle Crashes Analysis 2009-2012 December 2013 Ride Walk Davis Active Transportation Program City of Davis December 2013 Prepared by: Jimmy Fong Active
Appendix E: Bike Crash Analysis (2009-2012) Davis Bicycle Crashes Analysis 2009-2012 December 2013 Ride Walk Davis Active Transportation Program City of Davis December 2013 Prepared by: Jimmy Fong Active
Planning the Mississippi River Trail in Iowa Using Geographic Information Systems
 Planning the Mississippi River Trail in Iowa Using Geographic Information Systems Jamie L. Luedtke and David J. Plazak Center for Transportation Research and Education Iowa State University 2901 South
Vision Zero High Injury Network Methodology
 Vision Zero High Injury Network Methodology DATA SETS USED: 1. Reportable crashes in Philadelphia from 2012-2016, available as open data through PennDOT 2. Street Centerline geographic layer, maintained
8. Collisions INTRODUCTION
 8. Collisions INTRODUCTION While traffic collisions can affect anyone, they have a disproportionate impact on bicyclists, who along with pedestrians are the most vulnerable users of the transportation
BETHEL ROAD AND SEDGWICK ROAD CORRIDOR STUDY
 DRAFT PLAN City Council Meeting August 14, 2017 STUDY AREA Sedgwick Corridor State Route 160, principal arterial with Class 3 access management designation, commuter and freight route, connection to SR
METROPOLITAN TRANSPORTATION PLAN OUTREACH: INTERACTIVE MAP SUMMARY REPORT- 10/03/14
 METROPOLITAN TRANSPORTATION PLAN OUTREACH: INTERACTIVE MAP SUMMARY REPORT- 10/03/14 INTRODUCTION This document summarizes the results of the online interactive mapping exercise implemented by MIG for the
DEPARTMENT OF ENVIRONMENTAL SERVICES. North Harrison Street (Lee Highway to Little Falls Road) Comparative Analysis. Prepared for:
 Comparative Analysis. Prepared for:") DEPARTMENT OF ENVIRONMENTAL SERVICES North Harrison Street (Lee Highway to Little Falls Road) Comparative Analysis Prepared for: Arlington County Department of Environmental Services 2100 Clarendon Boulevard,
DEPARTMENT OF ENVIRONMENTAL SERVICES North Harrison Street (Lee Highway to Little Falls Road) Comparative Analysis Prepared for: Arlington County Department of Environmental Services 2100 Clarendon Boulevard,
TRAFFIC IMPACT ANALYSIS
 TRAFFIC IMPACT ANALYSIS FOR THE CHAMPAIGN UNIT#4 SCHOOL DISTRICT PROPOSED HIGH SCHOOL (SPALDING PARK SITE) IN THE CITY OF CHAMPAIGN Final Report Champaign Urbana Urbanized Area Transportation Study 6/24/2014
Rogue Valley Metropolitan Planning Organization. Transportation Safety Planning Project. Final Report
 Rogue Valley Metropolitan Planning Organization Transportation Safety Planning Project Final Report April 23, 2004 Table of Contents Introduction 2 Scope of Work Activities... 2 Activity #1...2 Activity
Residential Traffic Calming Program Guide. Town of Ashland, Virginia
 Residential Traffic Calming Program Guide Town of Ashland, Virginia August 1, 2006 TABLE OF CONTENTS A. INTRODUCTION... 1 B. GOALS... 1 C. CRITERIA... 1 D. IDENTIFYING NEIGHBORHOOD TRAFFIC CONCERNS...
Centennial Neighbourhoods Transportation Management Plan Summary of Phase 1 Consultation. Overview of Issues
 1 Centennial Neighbourhoods Transportation Management Plan Summary of Phase 1 Consultation The Centennial Neighbourhoods Transportation Management Plan (CNTMP) is being undertaken to support the Secondary
APPENDIX A. GIS ANALYSIS FOR THE MRT
 APPENDIX A. GIS ANALYSIS FOR THE MRT The Iowa Mississippi River Trail plan was created through a data-driven analysis using geographic information systems. GIS integrates map images with relevant data,
ADOT Statewide Bicycle and Pedestrian Program Summary of Phase IV Activities APPENDIX B PEDESTRIAN DEMAND INDEX
 ADOT Statewide Bicycle and Pedestrian Program Summary of Activities APPENDIX B PEDESTRIAN DEMAND INDEX May 24, 2009 Pedestrian Demand Index for State Highway Facilities Revised: May 29, 2007 Introduction
Exhibit 1 PLANNING COMMISSION AGENDA ITEM
 Exhibit 1 PLANNING COMMISSION AGENDA ITEM Project Name: Grand Junction Circulation Plan Grand Junction Complete Streets Policy Applicant: City of Grand Junction Representative: David Thornton Address:
Sherwood Drive Traffic Circle
 Strathcona County Sherwood Drive Traffic Circle Online Survey Results April 7, 215 I. Executive Summary The Sherwood Drive Traffic Circle Survey was administered in March 215. In total, 2,263 residents
Baseline Survey of New Zealanders' Attitudes and Behaviours towards Cycling in Urban Settings
 Baseline Survey of New Zealanders' Attitudes and Behaviours towards Cycling in Urban Settings Highlights 67% of urban New Zealanders, 18 years of age or more own or have access to a bicycle that is in
5. Pedestrian System. Accomplishments Over the Past Five Years
 5. Pedestrian System Accomplishments Over the Past Five Years The Alamo Area Metropolitan Planning Organization (MPO) and its partner agencies recognize the importance of improving pedestrian mobility.
Washington Metropolitan Area Transit Authority Board Action/Information Summary. MEAD Number:
 Washington Metropolitan Area Transit Authority Board Action/Information Summary Action Information MEAD Number: 100962 Resolution: Yes No TITLE: Bicycle and Pedestrian Access Improvements Study PURPOSE:
2014/2015 BIKE ROUTE PLAN 83 AVENUE PROTECTED BIKE LANE
 About the Project 2014/2015 BIKE ROUTE PLAN The City of Edmonton is planning a major bike route on the south side of Edmonton. This bike route is one part of a plan to provide citizens with transportation
TRANSPORTATION NEEDS ASSESSMENT
 TRANSPORTATION NEEDS ASSESSMENT A travel demand analysis was carried out to determine the operational issues and the potential benefit that adding traffic capacity would have on the road network. All the
FEDERAL HIGHWAY ADMINISTRATION APPLICATION
 FEDERAL HIGHWAY ADMINISTRATION APPLICATION REQUEST FOR PERMISSION TO EXPERIMENT WITH A BICYCLE BOX INTERSECTION TREATMENT Submitted by: City of Columbus Department of Public Service Date: June 26, 2009
Analyzing Gainesville s Bicycle Infrastructure
 Mateo Van Thienen 1 DCP 2002: Intro to GIS II Final Project Paper Abstract: Analyzing Gainesville s Bicycle Infrastructure The main purpose of this project is to determine which areas within Gainesville
Bicycle - Motor Vehicle Collisions on Controlled Access Highways in Arizona
 Bicycle - Motor Vehicle Collisions on Controlled Access Highways in Arizona Analysis from January 1, 1991 to June 30, 2002 Richard C. Moeur, PE Traffic Design Manager, Northern Region Michelle N. Bina
Literature Review: Final
 Jonathan Sigel Section A December 19 th, 2016 Literature Review: Final Function and Purpose of a Roundabout: Roundabouts are a location in which multiple roads are joined together in a circle, with an
The Ohio State University Bike Map
 The Ohio State University Campus as a Living Laboratory The Ohio State University Bike Map Emily Royer, Evan Brack, Paige Kobe ENR 2367 OSU School of Environment and Natural Resources December 4, 2013
At each type of conflict location, the risk is affected by certain parameters:
 TN001 April 2016 The separated cycleway options tool (SCOT) was developed to partially address some of the gaps identified in Stage 1 of the Cycling Network Guidance project relating to separated cycleways.
Moving Cambridge. City of Cambridge Transportation Master Plan Public Consultation Centre. March 7, :00 8:00 PM.
 City of Cambridge Transportation Master Plan Public Consultation Centre March 7, 2018 5:00 8:00 PM Region of Waterloo City of Cambridge Transportation Master Plan Public Consultation Centre March 7, 2018
Bikeway action plan. Bicycle Friendly Community Workshop March 5, 2007 Rochester, MN
 Bikeway action plan Summary The was held on March 5, 2007 at the Rochester Mayo Civic Center. The workshop was hosted by Rochester-Olmsted County Planning Department in collaboration with the League of
EUCLID AVENUE PARKING STUDY CITY OF SYRACUSE, ONONDAGA COUNTY, NEW YORK
 EUCLID AVENUE PARKING STUDY CITY OF SYRACUSE, ONONDAGA COUNTY, NEW YORK CITY OF SYRACUSE DEPARTMENT OF PUBLIC WORKS 1200 CANAL STREET EXTENSION SYRACUSE, NEW YORK 13210 DRAFT REPORT DATE: November 13,
CITY OF COCOA BEACH 2025 COMPREHENSIVE PLAN. Section VIII Mobility Element Goals, Objectives, and Policies
 CITY OF COCOA BEACH 2025 COMPREHENSIVE PLAN Section VIII Mobility Element Goals, Objectives, and Policies Adopted August 6, 2015 by Ordinance No. 1591 VIII MOBILITY ELEMENT Table of Contents Page Number
City of Elizabeth City Neighborhood Traffic Calming Policy and Guidelines
 City of Elizabeth City Neighborhood Traffic Calming Policy and Guidelines I. Purpose: The City of Elizabeth City is committed to ensure the overall safety and livability of residential neighborhoods. One
FLORIDA STRATEGIC HIGHWAY SAFETY PLAN
 FLORIDA STRATEGIC HIGHWAY SAFETY PLAN 1 FLORIDA STRATEGIC HIGHWAY SAFETY PLAN Presenter: Joe Santos State Safety Engineer FDOT State Safety Office 2 Presentation 3/28/2017 3 FLORIDA STRATEGIC HIGHWAY SAFETY
EAST VILLAGE SHOPPERS STUDY A SNAPSHOT OF TRAVEL AND SPENDING PATTERNS OF RESIDENTS AND VISITORS IN THE EAST VILLAGE
 EAST VILLAGE SHOPPERS STUDY A SNAPSHOT OF TRAVEL AND SPENDING PATTERNS OF RESIDENTS AND VISITORS IN THE EAST VILLAGE CONTENTS 2 4 5 6 7 16 17 19 SUMMARY INTRODUCTION BACKGROUND METHODOLOGY RESULTS CONCLUSION
Owl Canyon Corridor Project Overview and Summary
 Owl Canyon Corridor Project Overview and Summary December 22, 2008 The Owl Canyon corridor (generally the connection between the I-25 / Larimer County Road 70 interchange and the US 287 / Larimer County
A Traffic Operations Method for Assessing Automobile and Bicycle Shared Roadways
 A Traffic Operations Method for Assessing Automobile and Bicycle Shared Roadways A Thesis Proposal By James A. Robertson Submitted to the Office of Graduate Studies Texas A&M University in partial fulfillment
City of Novi Non-Motorized Master Plan 2011 Executive Summary
 City of Novi Non-Motorized Master Plan 2011 Executive Summary Prepared by: February 28, 2011 Why Plan? Encouraging healthy, active lifestyles through pathway and sidewalk connectivity has been a focus
FHWA Resources for Pedestrian and Bicycle Professionals
 FHWA Resources for Pedestrian and Bicycle Professionals Charlie Zegeer, UNC Highway Safety Research Center/PBIC Libby Thomas, UNC Highway Safety Research Center Dan Nabors, Vanasse Hangen Brustlin (VHB)
Regional Transportation Needs Within Southeastern Wisconsin
 Regional Transportation Needs Within Southeastern Wisconsin #118274 May 24, 2006 1 Introduction The Southeastern Wisconsin Regional Planning Commission (SEWRPC) is the official areawide planning agency
The specific activities consisted of:
 Mount Olive Development Corporation (MODCO) Speak Up Broward Program for Empowering People Dates of program: May 2014 August 2014 Communities Served: 33311, 33313, and 33301 Zip Code Areas Target Audience:
PURPOSE AND NEED SUMMARY 54% Corridor Need 1. Corridor Need 2. Corridor Need 3. Corridor Need 4. Corridor Need 5
 SUMMARY PURPOSE AND NEED Chapel Hill Transit ridership has increased Buses operate every 4 minutes and have standing room only Exceeding seated capacity by 12% Corridor Need 1 by more than 20 percent between
The City of Newark Pedestrian and Bicycle Safety
 The City of Newark Pedestrian and Bicycle Safety Action Plan process involved significant community outreach efforts, including four Stakeholder/Steering Committee meetings and three Public Information
Cycling Master Plan Community Engagement Session WELCOME
 Cycling Master Plan Community Engagement Session WELCOME WHY COMMUNITIES PLAN Considering Short Term and Long Term Needs City of Lethbridge is committed to planning - to determine short term goals along
1999 On-Board Sacramento Regional Transit District Survey
 SACOG-00-009 1999 On-Board Sacramento Regional Transit District Survey June 2000 Sacramento Area Council of Governments 1999 On-Board Sacramento Regional Transit District Survey June 2000 Table of Contents
Stakeholder Communication and Public Involvement Plan
 Stakeholder Communication and Public Involvement Plan Arkansas Statewide Bicycle and Pedestrian Transportation Plan Plan purpose: The Arkansas State Bicycle and Pedestrian Plan will establish a framework
AS91430: Cycleways Waiopehu College Year 13 Geography Matt Reeves
 AS91430: Cycleways Waiopehu College Year 13 Geography Matt Reeves December 2017 AS91430: Cycleways Cycling is an activity that a large proportion of our national population decides to enjoy and participate
Film Guide for Educators. Designing for Safety
 Film Guide for Educators Designing for Safety Designing For Safety Key Concepts Speeding While Driving Speeding is the number one cause of injuries and deaths from driving. The main reasons are because
Mayor s Pedestrian Advisory Council. Wednesday, February 15
 Mayor s Pedestrian Advisory Council Wednesday, February 15 Annual Pedestrian Fatalities 2005-2016 Year-End Pedestrian Fatalities, 2016 (CPD): 44 Year-End Pedestrian Fatalities, 2015 (CPD): 46 Year-End
Active Transportation Facility Glossary
 Active Transportation Facility Glossary This document defines different active transportation facilities and suggests appropriate corridor types. Click on a facility type to jump to its definition. Bike
Combined impacts of configurational and compositional properties of street network on vehicular flow
 Combined impacts of configurational and compositional properties of street network on vehicular flow Yu Zhuang Tongji University, Shanghai, China arch-urban@163.com Xiaoyu Song Tongji University, Shanghai,
CONNECTING PEOPLE TO PLACES
 CONNECTING PEOPLE TO PLACES 82 EAST BENCH MASTER PLAN 07 Introduction The East Bench transportation system is a collection of slow moving, treelined residential streets and major arteries that are the
Determining bicycle infrastructure preferences A case study of Dublin
 *Manuscript Click here to view linked References 1 Determining bicycle infrastructure preferences A case study of Dublin Brian Caulfield 1, Elaine Brick 2, Orla Thérèse McCarthy 1 1 Department of Civil,
An Assessment of Potential Greenhouse Gas Emissions Reductions from Proposed On Street Bikeways
 An Assessment of Potential Greenhouse Gas Emissions Reductions from Proposed On Street Bikeways Through the Sustainable Bethlehem Initiative, the Town of Bethlehem has identified both the improvement of
Active Travel and Exposure to Air Pollution: Implications for Transportation and Land Use Planning
 Active Travel and Exposure to Air Pollution: Implications for Transportation and Land Use Planning Steve Hankey School of Public and International Affairs, Virginia Tech, 140 Otey Street, Blacksburg, VA
Can PRT overcome the conflicts between public transport and cycling?
 Can PRT overcome the conflicts between public transport and cycling? J. Meggs, F. Rupi, J. Schweizer Università di Bologna - DICAM Abstract Personal Rapid Transit (PRT) offers exceptional service characteristics,
SH3 Waitara to Bell Block
 SH3 Waitara to Bell Block NZ Transport Agency August 2017 Community feedback report Copyright information This publication is copyright NZ Transport Agency. Material in it may be reproduced for personal
CITY OF ALPHARETTA DOWNTOWN MASTER PLAN TRAFFIC EVALUATION
 CITY OF ALPHARETTA DOWNTOWN MASTER PLAN TRAFFIC EVALUATION June 2015 CITY OF ALPHARETTA DOWNTOWN MASTER PLAN TRAFFIC EVALUATION Introduction The Alpharetta Downtown Master Plan was developed in the fall
Bicycle Parking Analysis: California State University, Fullerton
 Bicycle Parking Analysis: California State University, Fullerton Fall 2006 Bicycle Parking Analysis: California State University, Fullerton Fall 2006 Report Author: John Carroll Department of Geography,
Access Management Regulations and Standards for Minor Arterials, Collectors, Local Streets
 Access Management Regulations and Standards for Minor Arterials, Collectors, Local Streets September 2009 Paul Grasewicz Access Management Administrator Concept of Access Management The way to manage access
Prediction model of cyclist s accident probability in the City of Malang
 MATEC Web of Conferences 8, 04003 (208) ISTSDC 207 https://doi.org/0.05/matecconf/208804003 Prediction model of cyclist s accident probability in the City of Malang Imma Widyawati Agustin,*, Muhammad Zainul
Calculation of Trail Usage from Counter Data
 1. Introduction 1 Calculation of Trail Usage from Counter Data 1/17/17 Stephen Martin, Ph.D. Automatic counters are used on trails to measure how many people are using the trail. A fundamental question
Downtown Tampa Parking User Survey
 Downtown Tampa Parking User Survey 2017 Introduction This Downtown Tampa Parking User Survey was commissioned by the Tampa Downtown Partnership and carried out by Plan Hillsborough. The survey was overseen
EXECUTIVE SUMMARY. Vision
 Vision Walking and bicycling in Salt Lake City will be safe, convenient, comfortable, and viable transportation options that connect people to places, foster recreational and economic development opportunities,
METHODOLOGY. Signalized Intersection Average Control Delay (sec/veh)
") Chapter 5 Traffic Analysis 5.1 SUMMARY US /West 6 th Street assumes a unique role in the Lawrence Douglas County transportation system. This principal arterial street currently conveys commuter traffic
Chapter 5 Traffic Analysis 5.1 SUMMARY US /West 6 th Street assumes a unique role in the Lawrence Douglas County transportation system. This principal arterial street currently conveys commuter traffic
South King County High-Capacity Transit Corridor Study
 HIGH-CAPACITY TRANSIT CORRIDOR STUDY South King County Corridor South King County High-Capacity Transit Corridor Study Corridor Report August 2014 South King County High Capacity Transit Corridor Report
Prioritizing Schools for Safe Routes to School Infrastructure Projects
 Prioritizing Schools for Safe Routes to School Infrastructure Projects Determining the most effective use of limited infrastructure funds is a challenging task. It is especially demanding for local transportation
Improve the livability of our streets by
 Pedestrian and Traffic Calming Policy March 2018 2 of 6 Neighborhood Traffic Calming Policy The City of Aspen continually strives to protect multimodal function while maintaining a high standard of safety.
Chapter 5. Complete Streets and Walkable Communities.
 Chapter 5. Complete Streets and Walkable Communities. 5.1 Description of Complete Streets. Cities throughout the world, and specifically the United States, are coming to embrace a new transportation and
Bringing together community and health. Physical Activity and Nutrition Unit Office of Statewide Health Improvement Initiatives
 Bringing together community and health. Physical Activity and Nutrition Unit Office of Statewide Health Improvement Initiatives Physical Activity and Nutrition Unit Office of Statewide Health Improvement
January Project No
 January 13 2015 Project No. 5070.05 Neil Connelly, Director University of Victoria, Campus Planning and Sustainability PO Box 1700 STN CSC Victoria, BC V8P 5C2 Dear Neil: Re: UVic 2014 Traffic Final Report
Analyzing Traffic Engineering Problems in Small Cities D onald S. Berry
 Analyzing Traffic Engineering Problems in Small Cities D onald S. Berry Director, Traffic and Transportation Division National Safety Council Chicago, Illinois According to the Public Roads Administration,
City of Homewood Transportation Plan
 City of Homewood Transportation Plan Prepared for: City of Homewood, Alabama Prepared by: Skipper Consulting, Inc. May 2007 TABLE OF CONTENTS INTRODUCTION... 1 BACKGROUND INFORMATION... 1 EXISTING TRANSPORTATION
City of Memphis On-Street Parking Modification Guidelines
 City of Memphis Effective Date: December 1, 2013 Bicycle/Pedestrian Program 125 N. Main Street Memphis, TN 38103 (901) 576-6710 www.bikepedmemphis.com City of Memphis Executive Summary It is current practice
RM 620 FEASIBILITY STUDY
 RM 620 FEASIBILITY STUDY Sections 5 & 6 December 7, 2015 STUDY PROCESS Study Purpose and Goals The RM 620 Feasibility Study was launched by the Texas Department of Transportation (TxDOT) to analyze transportation
Application for diminishing or avoiding the unwanted. effects of traffic congestion
 Application for diminishing or avoiding the unwanted effects of traffic congestion Explanation of process Traffic congestions occur mainly through lack of consideration for the driver from the traffic
Pocatello Regional Transit Master Transit Plan Draft Recommendations
 Pocatello Regional Transit Master Transit Plan Draft Recommendations Presentation Outline 1. 2. 3. 4. What is the Master Transit Plan? An overview of the study Where Are We Today? Key take-aways from existing
Will the New Low Emission Zone Reduce the Amount of Motor Vehicles in London?
 Will the New Low Emission Zone Reduce the Amount of Motor Vehicles in London? Philip Osborne I. INTRODUCTION An initiative of the 2016 London Mayor s election campaign was to improve engagement with Londoners
Children s risks on their way to school: the example of Tallinn
 Ravage of the Planet III 529 Children s risks on their way to school: the example of Tallinn T. Rõivas 1, D. Antov 2, T. Oja 1, K. Abel 1 & E. Sepp 1 1 Faculty of Science and Technology, University of
Scope of Services BICYCLE/PEDESTRIAN PLAN FOR THE INDIAN RIVER COUNTY MPO
 I. INTRODUCTION Scope of Services BICYCLE/PEDESTRIAN PLAN FOR THE INDIAN RIVER COUNTY MPO The Indian River County Metropolitan Planning Organization (MPO) Bicycle and Pedestrian Plan was completed in 1997.
PEDESTRIAN/BICYCLE CRASH STUDY
 PEDESTRIAN/BICYCLE CRASH STUDY This report summarizes an analysis of pedestrian and bicycle crashes that has been conducted by the CRCOG staff. In 2004, CRCOG completed a study of pedestrian crash data
DOI /HORIZONS.B P23 UDC : (497.11) PEDESTRIAN CROSSING BEHAVIOUR AT UNSIGNALIZED CROSSINGS 1
 PEDESTRIAN CROSSING BEHAVIOUR AT UNSIGNALIZED CROSSINGS 1") DOI 10.20544/HORIZONS.B.03.1.16.P23 UDC 656.142.054:159.922(497.11) PEDESTRIAN CROSSING BEHAVIOUR AT UNSIGNALIZED CROSSINGS 1 JelenaMitrovićSimić 1, Valentina Basarić, VukBogdanović Department of Traffic
DOI 10.20544/HORIZONS.B.03.1.16.P23 UDC 656.142.054:159.922(497.11) PEDESTRIAN CROSSING BEHAVIOUR AT UNSIGNALIZED CROSSINGS 1 JelenaMitrovićSimić 1, Valentina Basarić, VukBogdanović Department of Traffic
Develop a Multi-Modal Transportation Strategy (Theme 6)
") DEVELOP A MULTI-MODAL TRANSPORTATION STRATEGY (THEME 6) WHY IS THIS THEME ADDRESSED? Develop a Multi-Modal Transportation Strategy (Theme 6) Statement of Ideal Reduce resident and visitor reliance on single
DEVELOP A MULTI-MODAL TRANSPORTATION STRATEGY (THEME 6) WHY IS THIS THEME ADDRESSED? Develop a Multi-Modal Transportation Strategy (Theme 6) Statement of Ideal Reduce resident and visitor reliance on single
Cycle journeys on the Anderston-Argyle Street footbridge: a descriptive analysis. Karen McPherson. Glasgow Centre for Population Health
 Cycle journeys on the Anderston-Argyle Street footbridge: a descriptive analysis Karen McPherson Glasgow Centre for Population Health March 2017 Key points: There were 116,334 cycle journeys made using
Balancing Operation & Safety for Motorized and Non-Motorized Traffic
 Balancing Operation & Safety for Motorized and Non-Motorized Traffic Brian Willham, PE, PTOE Iowa Director - MOVITE June 30, 2014 Learning Objectives: When & Why should we measure the performance of complete
PEDESTRIAN ACTION PLAN
 ATTACHMENT 2 CITY OF SANTA MONICA PEDESTRIAN ACTION PLAN CITY OF SANTA MONICA PEDESTRIAN ACTION PLAN This page intentionally left blank EXECUTIVE SUMMARY CHAPTER 1 EXECUTIVE SUMMARY Setting the Stage
General Plan Circulation Element Update Scoping Meeting April 16, 2014 Santa Ana Senior Center, 424 W. 3rd Street, Santa Ana, CA 92701
 General Plan Circulation Element Update Scoping Meeting April 16, 2014 Santa Ana Senior Center, 424 W. 3rd Street, Santa Ana, CA 92701 Meeting Agenda 1. Purpose of Scoping Meeting 2. Project Overview 3.
NM-POLICY 1: Improve service levels, participation, and options for non-motorized transportation modes throughout the County.
 Transportation PRINCE WILLIAM COUNTY 2008 COMPREHENSIVE PLAN NON-MOTORIZED PLAN CONTENTS Goals, Policies, and Action Strategies Table 4 (Bike Facility Classifications and Descriptions) Table 5 (Bike Facility
Walking and Cycling Action Plan Summary. A Catalyst for Change The Regional Transport Strategy for the west of Scotland
 Walking and Cycling Action Plan Summary A Catalyst for Change The Regional Transport Strategy for the west of Scotland 2007-2021 Strathclyde Partnership for Transport Contents Purpose...2 Issues, Constraints
2010 Pedestrian and Bicyclist Special Districts Study Update
 2010 Pedestrian and Bicyclist Special Districts Study Update Pedestrian and Bicyclist Special Districts Program Overview H-GAC s Special Districts Program aims to provide strategic investments in pedestrian
Bike Rack Occupancy on the University of North Texas Campus
 Bike Rack Occupancy on the University of North Texas Campus Chloe B. Thomas Faculty Mentor: Dr. Nagaoka, Department of Geography, College of Arts and Sciences The presence of bike parking facilities has
Chicago Pedestrian and Bicycle Safety Initiative Final Report
 1 Chicago Pedestrian and Bicycle Safety Initiative Final Report Chicago Department of Transportation www.chicagocompletestreets.org 312.744.8147 Executive Summary Since 2001, the Chicago Department of