COUNTYWIDE EXPRESSLANES STRATEGIC PLAN FINAL REPORT
|
|
|
- Lily Malone
- 6 years ago
- Views:
Transcription


1 March 1, 2017 COUNTYWIDE EXPRESSLANES STRATEGIC PLAN FINAL REPORT Approved by Metro Board of Directors on January 26, 2017 Prepared for: Prepared by: One Gateway Plaza Los Angeles, CA South Flower St, Suite 800 Los Angeles, CA 90071
2 Revision History: Description Date Version Draft Final Express Lanes Strategic Plan to Metro Board 1/18/ Final Express Strategic Plan with technical and formatting refinements 3/1/17 1.1
3 Metro Countywide ExpressLanes Strategic Plan (Final) TABLE OF CONTENTS EXECUTIVE SUMMARY BACKGROUND INTRODUCTION AND OVERVIEW PRELIMINARY EXPRESSLANES NETWORK SCREENING AND PHASING RECOMMENDATIONS Methodology Corridor Screening Analysis Initial Financial Feasibility Phasing Recommendations Preliminary Preferred ExpressLanes Network and Phasing Recommendations RESOURCE PLAN Capital Costs Potental Funding Sources Local Funding State Funding Federal Funding Private Funding Sources FUNDING PRIORITIZATION VEHICLE OCCUPANCY INNOVATIVE TECHNOLOGY OPERATIONAL IMPROVEMENTS Introperability Connected and Autonomous Vehicles New Mobility and Mobile Device Applications Enforcement Technologies CONCLUSION AND NEXT STEPS APPENDICES provided under separate cover i
4 LIST OF FIGURES Figure 1: Los Angeles County Strategic Buildout Express Lanes Network...4 Figure 2: Hours per Capita in Congestion....8 Figure 3: U.S. Managed Lanes in Operation or Under Construction...10 Figure 4: Metro I-110 and I-10 ExpressLanes Figure 5: Fastrak Transponder Accounts by Zip Code, December Figure 6: Existing, In Construction, and Planned HOV Lanes in Los Angeles County Figure 7: Strategic Plan Development Process Figure 8: Composite Mobility and Financial Screening Results Figure 9: Tier 1 Express Lanes 10-Year Plan ( ) Figure 10: Tier 2 Express Lanes 15-Year Plan ( ) Figure 11: Tier 3 Express Lanes 25-Year Plan ( ) Figure 12: Los Angeles County Strategic Buildout Express Lanes Network...31 Figure 13: Photo of Existing I-110/I-105 HOV/HOT Direct Connectors Figure 14: 2035 Forecast Breaches for Level of Service, HOV-2+ Toll Free Figure 15: Forecast Breaches For Level Of Service, HOV-3+ Tolled Figure 16: 6C Switchable Transponder (top) and Sticker Tag (bottom) from WSDOT...48 Figure 17: GeoToll Mobile Device Interfaces Figure 18: VPDS Camera and Equipment LIST OF TABLES Table 1: Express Lane Projects Funded through Measure M....5 Table 2: Metro I-110 and I-10 ExpressLanes Performance Overview Table 3: Metro Express Lanes Program 5-10 Year Implementation Phasing Plan (Tier 1)...26 Table 4: Metro Express Lanes Program 15-Year Implementation Phasing Plan (Tier 2) Table 5: Metro Express Lanes Program 25-Year Implementation Phasing Plan (Tier 3) Table 6: Measure M Funding for ExpressLanes Projects...34 Table 7: Measure M Funding for ExpressLanes Projects (Funding Availibility) ii
5 LIST OF ABBREVIATIONS Metro Countywide ExpressLanes Strategic Plan (Final) AB Assembly Bill ATCMTD Advanced Transportation and Congestion Management Technologies Deployment ATM Active Traffic Management Caltrans California Department of Transportation CAVs Clean Air Vehicles CEQA California Environmental Quality Act CHP California Highway Patrol CMAQ Congestion Mitigation and Air Quality CRD Congestion Reduction Demonstration CTC California Transportation Commission CTOC California Toll Operators Committee DSRC Dedicated Short Range Communications FAST Fixing America s Surface Transportation Act FASTLANE Fostering Advancements in Shipping and Transportation for the Long-term Achievement of National Efficiencies FHWA Federal Highway Administration GPLs General Purpose Lanes HOT High Occupancy Toll HOV High Occupancy Vehicle HSIP Highway Safety Improvement Program IBank California Infrastructure and Economic Development Bank IBTTA International Bridge, Tunnel and Turnpike Authority ITS Intelligent Transportation Systems GARVEE Grant Anticipation Revenue Vehicles LOS Level of Service LPR License Plate Recognition LRTP Long Range Transportation Plan MAP-21 Moving Ahead for Progress in the 21st Century Act Metro Los Angeles County Metropolitan Transportation Authority MPO Metropolitan Planning Organization MUTCD Manual on Uniform Traffic Control Devices NAAQS National Ambient Air Quality Standards NEPA National Environmental Policy Act NIOP National Interoperability OCTA Orange County Transportation Authority O&M Operations and Maintenance PA/ED Project Approval/Environmental Document PSR/PDS Project Study Report/Project Development Support PPP or P3 Public Private Partnership RAS Rapid Alert System RapidTOM Rapid Toll Optimization Model RCTC Riverside County Transportation Commission RFID Radio Frequency Identification ROM Rough Order of Magnitude RTP Regional Transportation Plan SB Senate Bill SCAG Southern California Association of Governments SCS Sustainable Communities Strategy SOVs Single Occupant Vehicles SRTP Short Range Transportation Plan STBG Surface Transportation Block Grant STIP State Transportation Improvement Program TIFIA Transportation Infrastructure Finance and Innovation (Act) TCA Transportation Corridor Agencies TSM Transportation System Management VPDS Vehicle Passenger Detection Systems VMT Vehicle Miles Traveled WSDOT Washington State Department of Transportation iii
6 1
7 EXECUTIVE SUMMARY Metro Countywide ExpressLanes Strategic Plan (Final) This Countywide ExpressLanes Strategic Plan builds on the success of the I-110 and I-10 Congestion Reduction Demonstration pilot program (also known as ExpressLanes) by establishing a vision for Metro to deliver a system of express lanes for Los Angeles County using a network approach to maximize regional benefits. A countywide ExpressLanes network will create a more reliable, faster travel option that makes better use of existing vehicle capacity in carpool lanes - also known as high occupancy vehicle (HOV) lanes. The plan also aims to address the degradation in HOV lane performance already experienced on many freeway corridors in the county, and provide express lanes users with a seamless customer experience. The Strategic Plan identifies the most promising express lane corridors and potential funding sources needed to implement the plan. The Metro Countywide ExpressLanes Strategic Plan was prepared as an extension of Southern California Association of Governments (SCAG) Express Travel Choices Phase II Study - Regional Express/HOT Lanes Implementation Plan and Concept of Operations. The Metro Strategic Plan utilized the analysis methodology used in the SCAG study to estimate the potential mobility benefits and revenue generated by express lane projects. This approach ensured that the Metro Countywide ExpressLanes Strategic Plan is consistent with the SCAG regional study and minimized duplication of effort. The Strategic Plan is intended to be updated periodically to reflect changes in project costs, revenues, economic conditions, and project priorities that will undoubtedly occur over the next 30+ years. The primary objectives of Metro s Countywide ExpressLanes Strategic Plan are to: Identify and recommend potential corridors that can benefit from HOV to high occupancy toll (HOT) or express lane conversion; Develop a resource plan for existing and future express lane corridors; Respond to degraded HOV facilities across Los Angeles County as well as transportation needs which have outpaced traditional revenue sources; Provide recommendations regarding tiers of projects, phasing, planning-level costs and Level 1 traffic and revenue forecasts, and a timetable for implementation; Provide a high-level assessment of vehicle occupancy requirements on existing and planned HOV/express lane facilities. The Countywide ExpressLanes Strategic Plan screened all planned, in construction, and existing carpool lanes in Los Angeles to assess the potential benefits and costs of conversion to ExpressLanes operation. The individual corridors included in the Strategic Plan were evaluated using a two-phased screening process assessing their mobility benefits and financial feasibility. The screening process utilized the SCAG Regional Travel Demand model and EcoNorthwest s Rapid Toll Optimization Model (RapidTOM) to quantify the mobility benefits of potential ExpressLanes based on available capacity in the HOT lanes, congestion in the general purpose lanes (GPLs), and the value of time savings by using the HOT lanes. This analysis also provided a general indication of the financial feasibility of an express lane. 2
8 The corridors were ranked according to their mobility and financial feasibility score and then qualitative factors were applied including connectivity with other express lane corridors, transit benefits, funding availability, and the potential ability to accommodate two express lanes in each direction. Project segments in Tier 1 had the highest combined mobility and financial screening scores and tended to exhibit the most robust forecasts of traffic and revenue. Segments in Tiers 2 and 3 exhibited comparatively lower screening results and, as such, tended to have less robust traffic and revenue performance. Recognizing that the implementation of a Countywide ExpressLanes network would require substantial investment and time to plan and construct, it was assumed that the individual segments comprising the network would be implemented in tiers approximately ten-years apart as follows: Tier 1 near-term (within 5-10 years) Tier 2 mid-term (within 15 years) Tier 3 longer-term (within 25 years) Following the identification of the three project tiers, a preliminary, high-level ExpressLanes Resource Plan was prepared to estimate the cost of the strategic plan projects and identify existing and potential funding sources. The analysis led to the recommendation to develop a 621 lane-mile express lane network, mostly comprised of single lane facilities but dual lane facilities are preferred where right-of-way allows. The proposed express lane network is shown in Figure 1 and is made up of the existing I-110 and I-10 ExpressLanes and the Tier 1, 2, and 3 projects. Some of the proposed ExpressLanes projects are funded through Measure M (Table 1). For projects without identified funding, staff will attempt to secure other sources of funding including bonds, Transportation Infrastructure Financing and Innovation Act (TIFIA) loans, grants, and net toll revenue loans from other ExpressLanes within the County if permitted. In order to move forward with a system of express lanes in Los Angeles County, Metro will submit Tier 1 projects as a network to the California Transportation Commission (CTC) to request tolling authority, allowed under Assembly Bill 194, for those corridors; begin planning studies for Tier 1 projects to analyze the mobility benefits, cost, and right-of-way requirements of single and dual ExpressLanes, prepare refined traffic and revenue studies, develop concept of operations reports, and prepare a comprehensive financial plan. In addition, Metro will conduct a detailed analysis to identify locations and configurations of HOV/HOT direct connectors. 3
 Executive Summary")
9 Figure 1: Los Angeles County Strategic Buildout Express Lanes Network Metro Countywide ExpressLanes Strategic Plan (Final) Executive Summary 4
10 Table 1: Express Lane Projects Funded through Measure M Tier 1 Measure M Funding 2015$ I-10 between I-605 & LA/SB county line None identified* I-105 between I-405 and I-605 $175,000,000 I-110 ExpressLane extension south to I-405/I-110 interchange I-405/I-110 Int. HOV Connect Ramps and Interchange Improvements $51,500,000 $250,000,000 I-405 between US-101 & I-10 $260,000,000 I-405 between I-10 and LA/OC county line None identified* I-605 between I-10 & LA/OC county line None identified* I-605/SR-60 Interchange HOV Direct Connectors $130,000,000 Tier 2 Measure M Funding 2015$ I-5 between I-605 & LA/OC county line None identified* I-5 between SR-170 & SR-134 None identified* SR-57 between SR-60 & LA/OC county line SR-91 between I-110 and LA/OC county line SR-134 between I-210 & SR-170 None identified* None identified* None identified* I-405 between US-101 and I-5 None identified* Tier 3 Measure M Funding 2015$ I-5 between SR-170 and Parker Road None identified* SR-14 between Avenue P8 & I-5 SR-60 between I-605 & LA/SB county line SR-118 between I-5 & LA/Ventura county line SR-170 between I-5 & SR-134 None identified* None identified* None identified* None identified* * May be eligible for Measure M Highway Funds 5
11 Metro Countywide ExpressLanes Strategic Plan (Final) THIS PAGE HAS BEEN INTENTIONALLY LEFT BLANK. Executive Summary 6
12 7

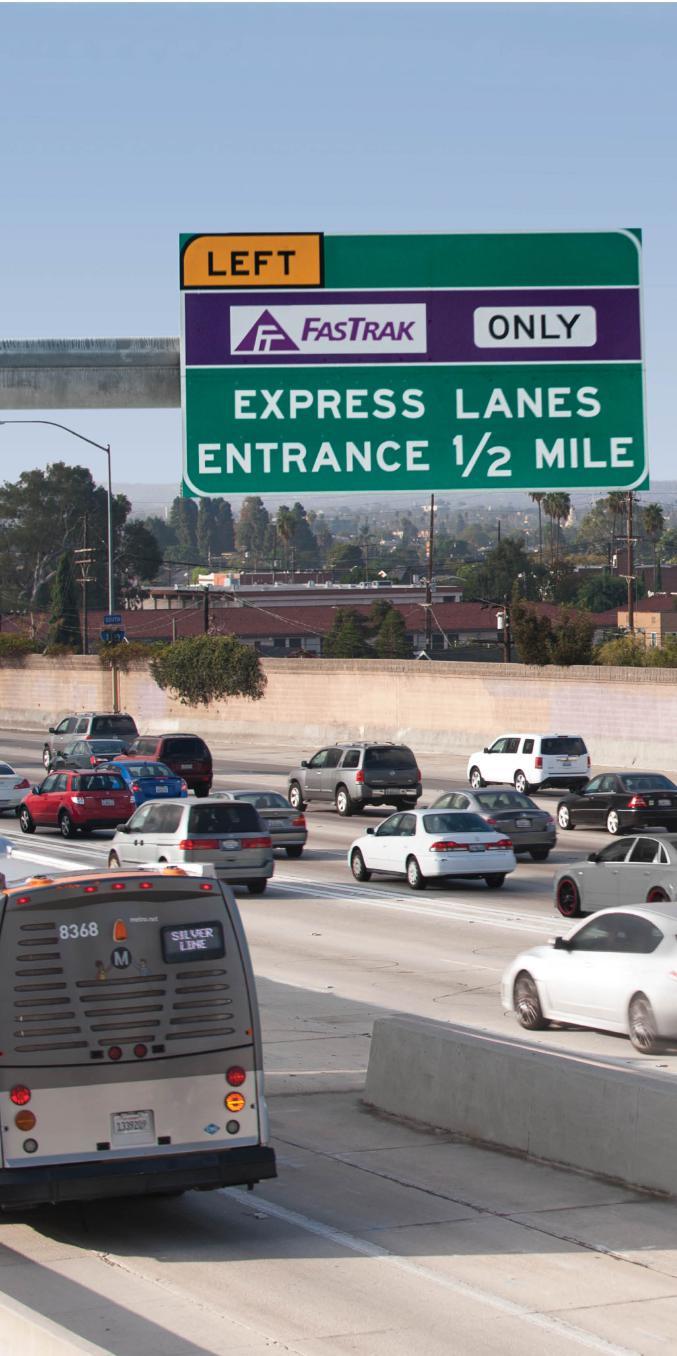
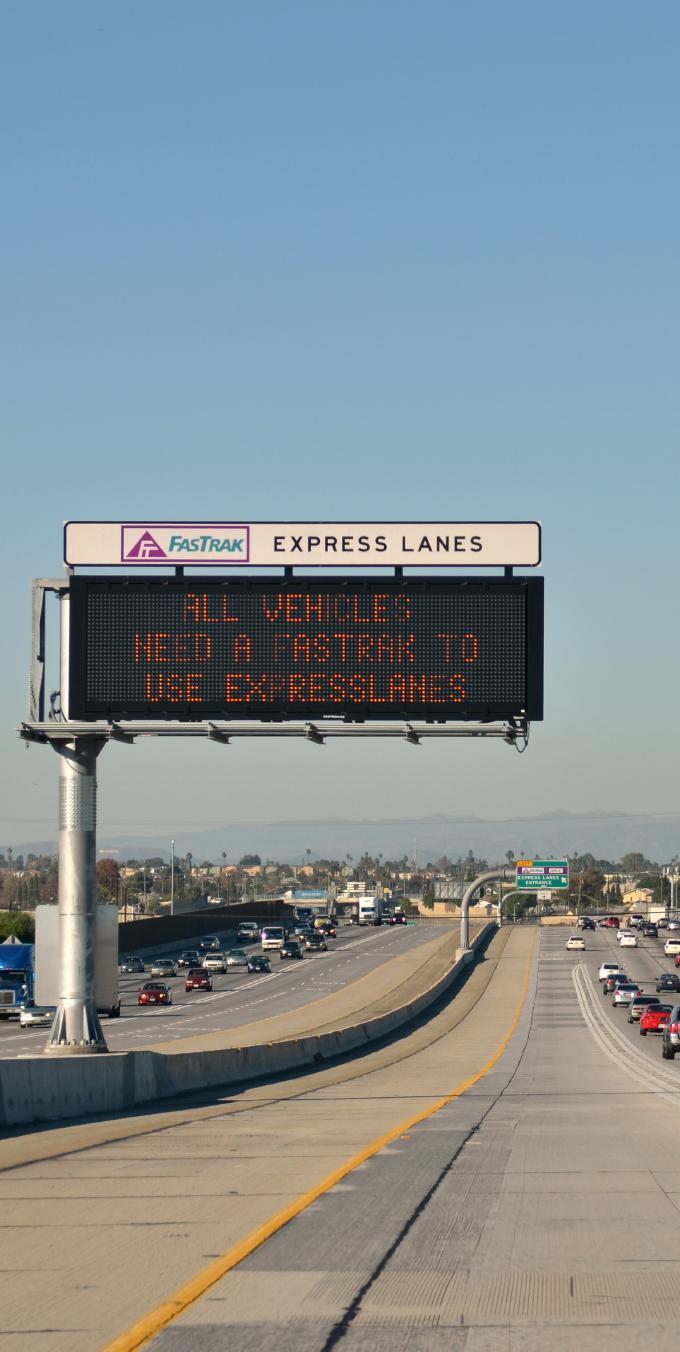
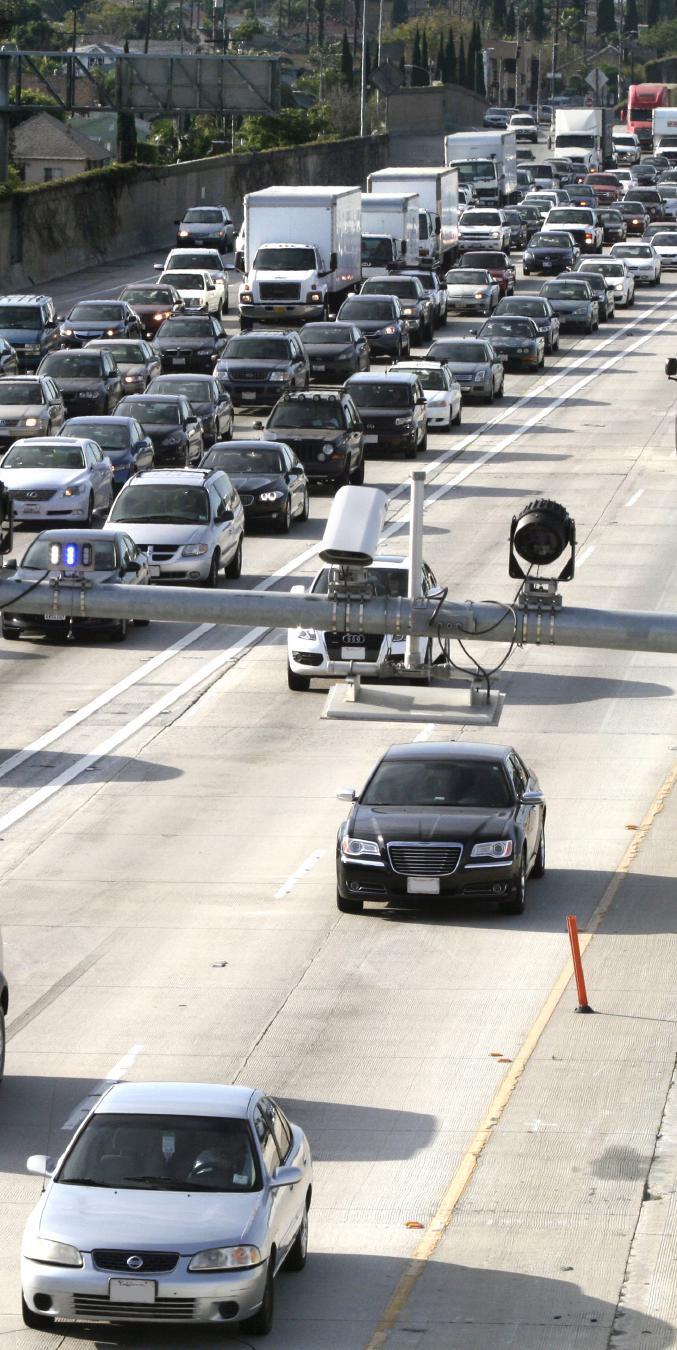
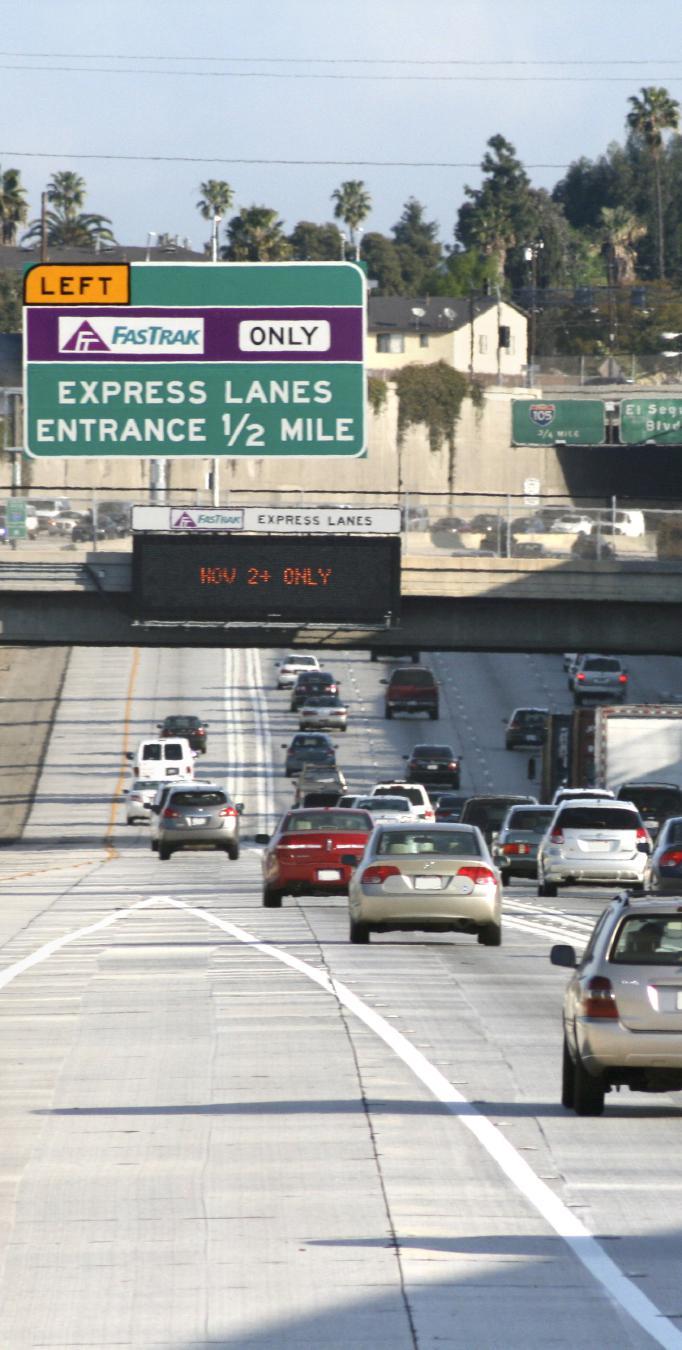
13 Metro Countywide ExpressLanes Strategic Plan (Final) 1 BACKGROUND Los Angeles area freeways have consistently ranked among the worst in the nation for traffic congestion, which has resulted in travel delay, productivity losses, wasted fuel and air pollution. According to SCAG, in Los Angeles County alone, vehicles travel about 205 million miles each weekday, with a projected growth to 223 million by And according to Inrix, Angelenos spend the most hours per capita in congestion compared to other U.S. cities (Figure 2). However, due to limited freeway rights-of-way, insufficient funding, and environmental concerns, opportunities to add freeway capacity are very limited. If left unaddressed, the growing congestion of the freeway system will threaten the economic and environmental sustainability of the region. Figure 2: Hours per Capita in Congestion The Metro Countywide ExpressLanes Strategic Plan establishes a vision for a system of express lanes throughout Los Angeles County. A system of express lanes would provide travelers with a seamless network of transportation option in congested freeway corridors. Express lanes are priced to ensure vehicles travel at least 45 miles per hour (as required by law), so reliability and time savings are maintained. Joining a growing number of major metropolitan regions grappling with similar congestion issues, the Los Angeles County Metropolitan Transportation Authority (Metro), in collaboration with the Federal Highway Administration (FHWA) and the California Department of Transportation (Caltrans), launched a pilot congestion pricing strategy through its Congestion Reduction Demonstration (CRD) pilot program, now known as the Metro ExpressLanes. The ExpressLanes program in Los Angeles County began in 2008 when the federal government awarded Metro, in partnership with Caltrans, a $210.5 million grant to develop an express lanes pilot program in Los Angeles County on the I-110 (Harbor Freeway) and the I-10 (San Bernardino Freeway) in 2012 and 2013, respectively. The Metro ExpressLanes pilot program was one of six sites across the nation funded by the U.S. Department of Transportation (USDOT) through its Urban Partnership Agreement (UPA) and CRD program to demonstrate congestion pricing and other supporting strategies. Specifically, the Metro I-110 and I-10 project converted the existing carpool lanes to express lanes, sometimes referred to as HOT lanes - where carpoolers, vanpoolers and eligible clean air vehicles were permitted to use the lanes at no charge with a valid FasTrak Flex switchable transponder, while single occupant vehicles (SOVs) were given the option to pay a variable toll to use the lanes and avoid congestion. On the I-110 ExpressLanes, the HOV policy is currently HOV-2+, which 8

14 requires two or more occupants to travel toll free. On the I-10, the HOV policy is HOV- 3+ during peak periods (5-9 am and 4-7 pm Monday-Friday) and HOV-2+ at all other times. The I-110/I-10 ExpressLanes are dynamically priced based on real-time traffic demand in the facility, with prices increasing or decreasing based on the current usage of the express lanes. By using variable pricing to manage travel demand, traffic flow in the express lanes is continuously managed to maintain speed and flow, providing a more reliable option to the heavily congested general purpose lanes (GPLs). The implementation of the ExpressLanes pilot program on I-110 and I-10 has resulted in a number of benefits. For example, the project has provided congestion reduction benefits not only to single occupant vehicles traveling on the express lanes but also for carpoolers and bus riders using the express lanes and GPLs. Due to the success of the ExpressLanes pilot program, California State Senate Bill (SB) 1298 was signed into law in September 2014 granting Metro the authority to conduct, administer, and operate the I-110/I-10 ExpressLanes program indefinitely as well as the ability to issue bonds to finance the program. Furthermore, the Metro Board of Directors approved a motion in November 2014 to identify and recommend potential corridors that would benefit from additional HOV lane conversions to express lanes (see Appendix A). In response, staff has prepared this Strategic Plan to provide the framework for implementation of future express lanes in Los Angeles County. An express lanes network will create a more reliable, faster travel option that makes better use of existing vehicle capacity in carpool lanes, as well as provide for a seamless customer experience. Other metropolitan areas that have developed similar strategic plans or master plans for a network of express lanes include the San Francisco Bay Area, CA; Orange County, CA; Atlanta, GA; and Southeast Florida. Figure 3 depicts express lane or HOT lane projects currently in operation and in construction around the nation. The primary focus of this Strategic Plan is on the conversion of existing and planned HOV lanes to express lanes. As a result, new construction and freeways without existing or planned HOV lanes were not considered, except for a proposal to extend the existing I-110 ExpressLanes south to I-405. This document is intended to provide policy direction on the next set of corridors that are viable for conversion to express lanes and the financial resources available to fund these projects. Additional project-level planning and financial analysis is required for individual corridors to be implemented. 9


15 Figure 3: U.S. Managed Lanes in Operation or Under Construction Metro Countywide ExpressLanes Strategic Plan (Final) Background 10
16 11

17 2 INTRODUCTION AND OVERVIEW Metro Countywide ExpressLanes Strategic Plan (Final) For more than two decades, Los Angeles County has relied on HOV lane investments as the main form of highway system expansion with this strategy addressing growing congestion, maximizing the value of limited transportation funding, and helping to meet air quality improvement goals. Currently, Los Angeles County is home to one of the most robust and extensive HOV lane networks in the country, and the system is continuing to grow. In total, Los Angeles County has 466 lane-miles of HOV lanes and an additional 160 lane miles under construction, in design or planned. The Caltrans 2015 Managed Lane Annual Report documents that approximately 378,000 vehicles carrying 805,000 people use HOV facilities in Los Angeles County on weekdays. During peak periods, individual HOV lanes accommodate approximately 1,400 vehicles and carry 3,000 people per hour. For example, on the I-405 southbound at Skirball Center Drive during the AM peak each general purpose lane is carrying 1,328 vehicles and 1,437 people per hour while the HOV lane is carrying 1,649 vehicles and 3,678 people per hour. However, the HOV system has been a victim of its own success, due to high demand and legislation that allows designated Clean Air Vehicles (CAVs) to use the HOV lanes without meeting the minimum vehicle occupancy requirement. Many HOV facilities throughout the county are just as congested as the regular GPLs. According to the Caltrans 2014 HOV Lane Degradation Determination Report, most HOV facilities in Los Angeles County are degraded and do not meet the established federal performance standard. An HOV The proven benefits of Express Lanes include: New travel option Improved travel time reliability Greater vehicle and person throughput Increased transit, vanpools, and carpools within the corridor Decreased fuel consumption Improved air quality New revenue generation source Potential for reinvestment in corridor lane is considered degraded if average traffic speeds during the morning or evening weekday peak commute period fall below 45 miles per hour for more than 10 percent of the time over a consecutive 180-day period. In other words, average traffic speeds in a given HOV lane cannot drop below 45 mph more than two weekdays each month in a six month period. According to a 2008 RAND Corporation Study - Moving Los Angeles, one of the more effective short-term policy options for improving traffic congestion in L.A. County is to develop a network of HOT lanes on freeways throughout the county and apply any net revenue to the subsidization of express bus service in the HOT lanes. A countywide network of express lanes offers an opportunity to address the challenges of increasing congestion in both the HOV and GPLs. This has been demonstrated on the I-10 and I-110 where express lanes have proven to be a successful strategy for optimizing vehicle throughput through the application of vehicle occupancy and eligibility restrictions, variable pricing, and access control. By doing so, express lanes can generate travel time savings, more reliable trip times, and reduced congestion without adversely impacting traffic flow in the adjacent GPLs, thereby improving overall 12
.")
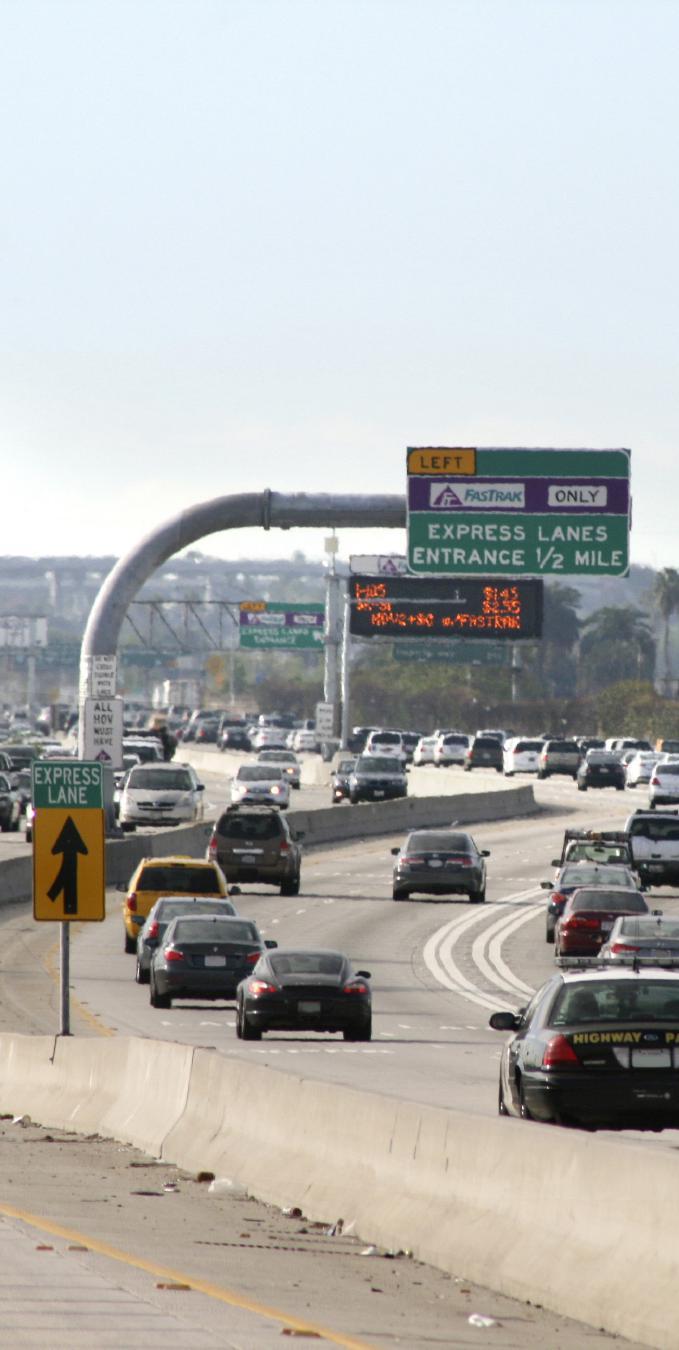
18 corridor performance. Furthermore, revenue generated through the express lanes is used to fund increased transit services and other transportation improvements within the corridor. The existing express lanes in Los Angeles County are located on the I-110 between Adams Boulevard and 182nd Street and on the I-10 between Alameda Street and the I-605 (San Gabriel Freeway). Figure 4 shows the location of the existing I-110 and I-10 ExpressLanes. The goals of the express lanes are to: Provide a safe, reliable, predictable commute for express lanes users Reinforce Metro s ongoing efforts to increase vehicle occupancy rates and transit ridership Optimize vehicle throughput through dynamic pricing Generate sufficient revenue to sustain the financial viability of the express lanes The tolls for vehicles traveling on the express lanes are adjusted in real-time based on the level of traffic congestion in the corridor, referred to as a variable toll or demandbased pricing. The toll rate adjusts dynamically as often as every five minutes based on supply/demand to ensure optimal traffic flow in the express lanes. Figure 4: Metro I-110 and I-10 ExpressLanes As traffic in the express lanes increases, the toll rate also increases to reduce the number of vehicles entering the lane. Conversely, toll rates are reduced when traffic levels in the lane decrease to incentivize more vehicles to use the available capacity in the lane. With the exception of certain types of vehicles including transit vehicles, 13
19 Metro Countywide ExpressLanes Strategic Plan (Final) emergency vehicles responding to incidents, CAVs, motorcycles, and carpools/ vanpools, all vehicles are required to pay a variable toll. On the I-110 ExpressLanes, the current HOV policy is HOV-2+, which requires two or more occupants for toll free travel. On the I-10, the HOV policy is HOV-3+ during peak periods (5-9 am and 4-7 pm Monday-Friday) and HOV-2+ at all other times. Tolls range from a minimum $0.10 per mile (off-peak) to a maximum $1.70 per mile (effective January 9, 2017) depending on congestion levels. The maximum toll rate may be increased by $0.10 per mile per quarter should traffic conditions in the corridor warrant it (see Appendix B). If travel speeds in the express lanes fall below 45 mph, the lanes revert to HOV only access, with non-hov vehicles no longer able to buy into the lanes. In doing so, travel time reliability for express lanes users and transit riders is preserved. However, to maximize the effectiveness of the express lanes, enforcement is a critical element to ensure that users are adhering to the requirements and rules of the express lanes to minimize the number of violators and thereby providing more capacity for paying users and carpools. By incentivizing the use of the available capacity in the express lanes, the I-110 and I-10 ExpressLanes have proven to be effective in increasing travel speeds and reducing travel times without adversely impacting traffic flow in the GPLs, thereby improving overall corridor performance. Table 2 summarizes the performance of the express lanes. Table 2: Metro I-110 and I-10 ExpressLanes Performance Overview I-110/I-10 Congestion Reduction Demonstration Pilot Program While many HOV facilities in Los Angeles County are experiencing degraded conditions, the I-110 and I-10 ExpressLanes have proven to be effective in managing congestion, increasing travel speeds, reducing travel times and generating revenue. Since the start of the program: 633,500 transponders have been issued (November 2016) 96,629,790 total vehicle trips Average AM peak travel time savings of 6 minutes on I-110 and I-10 Express bus ridership on the I-110 and I-10 corridors has increased more than 42 percent and on-time performance has improved 12,200 Low Income Assistance Plan accounts (November 20116) 85 percent of ExpressLanes users agree that the ExpressLanes are faster and enable them to get to their destinations more quickly (based on September 2016 survey) $20 million in net toll revenue granted in 2014 and another $28 million granted in 2016 Approximately 53% of all trips on the ExpressLanes are carpools or vanpools The Metro ExpressLanes project continues to successfully ease freeway congestion by providing enhanced travel options on the I-110 and I-10 freeways. On the I-110, demand for the ExpressLanes often exceeds capacity during peak periods, at which point paying single-occupant vehicles are not allowed to use the facility. As a result, the Metro Board approved a revised toll policy in January 2016 wherein tolls can be raised $0.10 per mile per quarter should traffic conditions warrant it (see Appendix B). Introduction and Overview 14
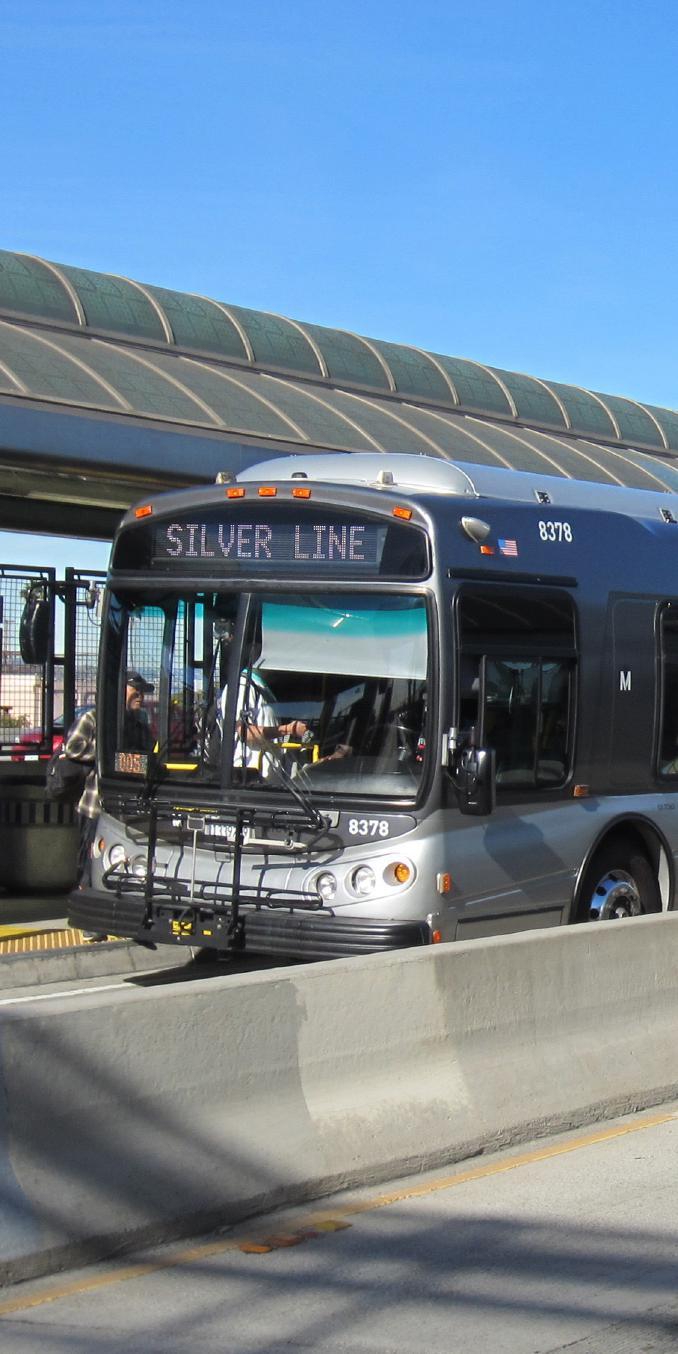
20 In addition to the mobility benefits generated by the I-110 and I-10 ExpressLanes, toll revenues are being reinvested in the corridors for the benefit of all users. In fact, one of the main goals of the express lanes is to increase transit ridership. Therefore, $6.9 million in toll revenue is provided annually to help fund the Metro Silver Line as well as Torrance, Gardena, and Foothill Transit services operating on the express lanes. This has helped increase ridership on the Silver Line by 50% from 10,600 average weekday boardings in 2012 to 15,400 in In addition, in 2014 almost $20 million was granted to a variety of highway, roadway, transit system, and active transportation/ system connectivity projects through a competitive grant program known as the Net Toll Revenue Reinvestment Grant program. In 2016, Metro granted an additional $28 million through the program. A recent survey by Metro of regular express lanes users indicated that 75% would support adding express lanes to other roadways. Building on the success of the I-110 and I-10 ExpressLanes, an expansion of the ExpressLanes program has the potential to help address three of the most pressing transportation challenges facing Los Angeles County: reliable mobility, environmental sustainability, and financial viability. The rationale for building additional express lanes includes: Continuing challenges posed by traffic congestion and a desire to improve travel conditions using system management strategies The emphasis on travel time reliability and customer choice Degraded traffic performance with significant portions of HOV facilities in Los Angeles County including large segments of the I-405, I-105, I-10, I-605, and SR-91 corridors not meeting the federal HOV performance standard Limited rights-of-way for freeway expansion/widening The ongoing designation of the South Coast Air Basin, which includes Los Angeles County, as a federally designated air quality non-attainment area Declining availability and reliability of traditional revenue sources to fully pay for new highway facilities From a user perspective, Metro continues to see growth in the number of accounts opened and transponders issued. Currently, over 650,000 transponders have been issued and another 10,000-12,000 new transponders are issued on average every month. The increased penetration of FasTrak Flex transponders throughout Los Angeles County indicates that there is increasing awareness and acceptance of Metro ExpressLanes among the general public (Figure 5). 15

21 Figure 5: Fastrak Transponder Accounts by Zip Code, December 2016 Metro Countywide ExpressLanes Strategic Plan (Final) State legislation has also been passed recently in support of express lanes. This began with California State Senate Bill 1298, which was signed into law in September 2014 and granted Metro the authority to conduct, administer, and operate the ExpressLanes program indefinitely as well to issue bonds to finance the program. In addition, Assembly Bill (AB) 194 (Frazier) was signed by the Governor in October 2015 removing the limitation on the number of HOT lane facilities that could be approved in the State and authorizing transportation agencies such as Metro to seek California Transportation Commission s (CTC) concurrence to develop and operate additional HOT lanes. Furthermore, the passage of AB 194 gives the Metro Board authority to implement a network of express lanes. The success of the ExpressLanes pilot program, public acceptance, and support of customers to add express lanes to other freeways coupled with recent state legislation and Metro Board direction to develop this Countywide ExpressLanes Strategic Plan, should help spur the expansion of the express lanes in Los Angeles County. The next chapters provide the framework and methodology by which potential express lanes were analyzed and prioritized for implementation. Introduction and Overview 16
22 17
23 3 PRELIMINARY EXPRESSLANES NETWORK SCREENING AND PHASING RECOMMENDATIONS Metro Countywide ExpressLanes Strategic Plan (Final) This ExpressLanes Strategic Plan builds on the success of the I-110 and I-10 Congestion Reduction Demonstration pilot program by establishing a vision for Metro to deliver a system of express lanes for Los Angeles County. This vision will provide transportation benefits at the regional level in addition to the benefits achieved on a corridor-by-corridor basis. A countywide express lanes network will create a more reliable, faster travel option that makes better use of existing vehicle capacity in carpool lanes. This Strategic Plan identifies the most promising express lane corridors and proposes a phased implementation plan over a 25+ year period. The Metro Countywide ExpressLanes Strategic Plan was prepared as an extension of the Southern California Association of Governments (SCAG) Express Travel Choices Phase II Study - Regional Express/HOT Lanes Implementation Plan and Concept of Operations. The Metro Strategic Plan is consistent with the analysis methodology used in the SCAG study to estimate the potential mobility benefits and revenue generated by express lanes projects. This approach ensured consistency between the Metro ExpressLanes Strategic Plan and the SCAG regional study. The primary objectives of the ExpressLanes Strategic Plan include the following: Identify and recommend potential corridors that can benefit from express lanes conversion; Develop a Resource Plan for existing and future express lanes corridors; Respond to degraded HOV facilities across Los Angeles as well as transportation needs which have outpaced traditional revenue sources; Provide/outline recommendations to include the tiers of projects, phasing, planning-level costs and revenue forecasts, and a timetable for implementation; Provide a high-level assessment of vehicle occupancy requirements on existing and planned HOV/Express Lanes facilities. The Strategic Plan assessed the conversion of current HOV facilities to express lane operations, as well as the potential for conversion of those HOV facilities that are planned or under construction. These facilities were identified by reviewing the following documents: Metro 2009 Long Range Transportation Plan (LRTP) Highways Recommended Plan Metro 2014 Short Range Transportation Plan (SRTP) Highways Recommended Plan 2015 Federal Transportation Improvement Program (FTIP) SCAG Financially Constrained Regional Transportation Plan/Sustainable Communities Strategy (RTP/SCS) Caltrans District Managed Lane Annual Report A map showing existing, in construction, and planned HOV lanes is shown in Figure 6. 18

24 Figure 6: Existing, In Construction, and Planned HOV Lanes in Los Angeles County The conversion of GPLs to express lanes operation was not considered due to limitations in the current federal law that prohibits such conversions in part due to the region s air quality non-attainment status and the expected impacts to traffic. Furthermore, the analysis assumed a minimum travel speed of 45 miles per hour in the express lanes for 90 percent of all trips, and that vehicles with three or more occupants (HOV 3+) will be allowed non-tolled use of the express lanes. The evaluation utilized planning-level(level1)traffic and revenue forecasts together with conceptual cost estimates to screen Los Angeles County freeway corridors according to specific mobility and financial criteria described in the next section. The screening analysis led to a phased implementation plan for projects over a 25+ year period, broken into Tier 1 - near term (within 5-10 years), Tier 2 - midterm (within 15 years), and Tier 3 - long-term (within 25 years). The project phasing recommendations are based on estimates of toll revenue, construction costs, and operations and maintenance costs for each of the various corridor segments. In addition, the Strategic Plan includes policy level recommendations, including a high-level assessment of vehicle occupancy requirements on existing and planned HOV/express lane facilities. Furthermore, relevant federal, state and local statues, and policies are listed in Appendix C. 19

25 3.1 METHODOLOGY Metro Countywide ExpressLanes Strategic Plan (Final) The Strategic Plan analysis included corridor screening as well as the preparation of revenue and cost estimates (see Figure 7). The corridor screening analysis estimates the potential mobility benefits of providing express lanes in each corridor, together with a high-level, initial financial feasibility assessment. Figure 7: Strategic Plan Development Process The corridor analysis utilized both the SCAG Regional Travel Demand Model and RapidTOM (Toll Optimization Model) to analyze freeway corridors in the county. The corridor screening analysis assumed the minimum speed requirement of 45 miles per hour in the express lanes, and that HOV-3+ carpools would be allowed free use of the express lanes. A HOV-2+ toll free scenario was modeled, but determined that there would be insufficient capacity in the HOV lanes on a majority of freeway corridors to effectively operate express lanes. However, it should be noted that any decisions related to conversion of HOV-2+ to HOV-3+ will be made by the Metro Board and Caltrans in conjunction with local stakeholder input. Furthermore, where appropriate as part of the detailed planning studies for each corridor, an assessment of the feasibility of dual Express Lanes should be undertaken. Chapter 5 of the Strategic Plan provides a more detailed discussion on recommended vehicle occupancy policies. The first step in the corridor screening analysis was to use the SCAG model to forecast traffic volumes for both 2020 and 2035 on freeway corridors in the county. For purposes of this analysis, the existing and planned HOV lane network was broken into 102 segments. RapidTOM then utilized SCAG model outputs to determine an optimal toll rate and express lane volume based on available capacity in the express lanes and difference in potential customer s values of time. If the toll rate was below a customer s value of time, then it is assumed that the customer will pay to use the express lanes. As the number of potential customer s using the express lanes increases, the toll rate also continues to increase until the minimum level of service threshold is reached (Level of Service D), at which point there is no excess capacity Preliminary ExpressLanes Network Screening and Phasing Recommendations 20
26 available in the express lanes to be sold and no further revenue can be generated. In essence, the RapidTOM model redistributes SCAG model output for a given freeway corridor based on various tolling scenarios and available lane capacity to derive optimal toll rates and express lane volumes. Based on output from the SCAG regional model and RapidTOM, three mobility criteria were used to evaluate the corridors: 1. Value of travel time savings, which is calculated by multiplying the value of time per customer vehicle by the time savings achieved by the vehicle; 2. Express lane person throughput, which is calculated by multiplying the average vehicle occupancy by the number of vehicles traveling in the corridor on the converted express lane; 3. Average peak period vehicle speeds in the GPLs. For each of the three criteria, the candidate corridors were ranked into five quintiles, with 5 being the top 20%, 4 being the second 20%, 3 being the third 20%, and so forth. 3.2 CORRIDOR SCREENING ANALYSIS The second component in the screening involved an initial financial feasibility calculation. This calculation estimated net revenue for various express lane corridors and the capital cost of converting the corridor from HOV to express lane operation. Net revenues are calculated using actual costs incurred for the operation and maintenance of the I-110 and I-10 ExpressLanes. Construction capital costs were estimated at a rough order of magnitude level. The resulting revenue/cost ratio provided a general indication of the positive or negative revenue benefit of HOV to express lane conversion. For purposes of screening, the Strategic Plan assumed that the conversion to express lanes can be accomplished using non-standard lane configurations, as was approved for the I-110 and I-10 ExpressLanes. However, design exceptions must still be approved by Caltrans on a case-by-case basis during project development. As with the mobility screening analysis, the corridors were also ranked by their financial feasibility scores and then divided into quintiles, with each segment receiving a score of 1 (lowest) to 5 (highest). The final step in the screening analysis involved averaging the mobility and financial feasibility screening results to create a single overall composite screening score. The express lane analysis segments were then ranked based on their composite screening score and then broken into quintiles. The results of the composite screening are shown in Figure 8. The methodology and results of the corridor screening and initial financial feasibility analysis are summarized in greater detail in Appendix F. 21
, five time periods")
27 Figure 8: Composite Mobility and Financial Screening Results Metro Countywide ExpressLanes Strategic Plan (Final) 3.3 INITIAL FINANCIAL FEASIBILITY The RapidTOM model provided weekday traffic and revenue for each express lane project segment by direction for two forecast years (2020 and 2035), five time periods (morning peak, midday, afternoon peak, evening, night), under two pricing objectives (revenue maximization and cost minimization), and for two exemption cases (HOV-2+ and HOV-3+). The revenue maximization scenario assumes that toll rates will vary dynamically to maximize toll revenues, which also minimizes delay in the express lanes only. Conversely, the cost minimization scenario assumes that toll rates will vary dynamically at typically lower overall levels to minimize the total costs of travel delay experienced across all lanes in the corridor. By utilizing somewhat lower toll rates, the latter scenario results in higher utilization of the express lanes, which helps to maximize congestion relief in the GPL while potentially slightly increasing travel times in the express lanes when compared to the revenue maximization scenario. As noted previously, the combined mobility and financial screening averaged the outputs by route segment for the two pricing objectives. The segments passing the screening were then grouped into pairs representing both directions of travel. Preliminary ExpressLanes Network Screening and Phasing Recommendations 22
28 Tests of the HOV-2+ exemption case, including the aforementioned evaluation under the mobility screening criteria, indicated that all-day HOV-2+ operations are not feasible financially nor operationally. In general, when HOV-2+ trips are exempt from tolls, the express lanes demand forecasts are sufficiently high so as to provide little, if any, capacity to sell to SOVs during peak periods, especially when trying to maintain speed and reliability objectives. Moreover, the projected low levels of toll paying customers would preclude the ability to effectively manage demand in the express lanes using variable pricing due to the relatively limited number of paying customers, and would generate insufficient revenues to cover toll and facility operating costs. Since the HOV-2+ exemption would be neither operationally nor financially sustainable, a hybrid exemption case was analyzed in addition to the HOV-3+ exemption. Similar to the current I-10 ExpressLane operations, the hybrid exemption combines time of day model results to simulate the following: HOV-3+ vehicles exempt during the 4-hour morning (5 am - 9 am) and 3-hour afternoon weekday peak periods (4 pm-7 pm); and HOV-2+ vehicles exempt during the remaining 17 mid-day, evening, and night hours of the weekday, as well as all day on weekends. This hybrid exemption case offers several advantages. During peak periods, offering the toll exemption only to HOV-3+ vehicles ensures that toll-free demand will not exceed the capacity of the lanes, thereby enabling the toll rate to effectively meter lane use by SOV and HOV-2 paying drivers to optimize lane performance. During off-peak times when demand is lower, offering the toll exemption to HOV-2+ vehicles improves the utilization of the express lanes. To maximize the effectiveness of the express lanes, ongoing enforcement will be necessary regardless of the toll exemption or pricing scenario to minimize the number of violators which in turn will provide more capacity for paying users and carpools. 3.4 PHASING RECOMMENDATIONS The purpose of the screening process was to identify a subset of the corridors within Los Angeles County with existing or planned HOV facilities that would demonstrate the highest mobility and financial feasibility performance when converted to express lanes operation. After the corridors were ranked, the candidate express lane segments were evaluated for a set of qualitative factors that could not be modeled using RapidTOM in order to derive the final phasing recommendations. These criteria included: Connectivity with other existing and potential express lane corridors; Transit benefits; Funding availability; and, Ability to provide two express lanes in each direction. 23
29 Metro Countywide ExpressLanes Strategic Plan (Final) Recognizing that the implementation of the express lanes network will require substantial financial resources as well as time to plan, design, and construct, it was assumed that the network would be implemented in three phases over a period of approximately 25+ years. As a starting point for considering the phasing of a future express lanes network in Los Angeles County, it was assumed that the individual segments would be implemented in tiers nominally ten-years apart as follows: Tier 1 near-term (within 5-10 years) Tier 2 mid-term (within 15 years) Tier 3 longer-term (within 25 years) For purposes of planning-level analysis, each corridor segment is comprised of smaller zones between major interchanges. The specific project segment(s) will require more detailed analysis to determine logical termini. These rational end points or project termini should undergo thorough vetting as part of the environmental review process. Whenever possible given existing right-of-way constraints, Metro intends to implement dual lane facilities to provide two express lanes in each direction. Dual lane facilities provide more capacity and also give users the ability to pass slower vehicles, whereas with single lane express lanes speeds can be constrained by slower moving vehicles. Additional information on the implications of providing dual lane express lane facilities is provided in Chapter 5 of this report. 3.5 PRELIMINARY PREFERRED EXPRESSLANES NETWORK AND PHASING RECOMMENDATIONS Tier 1: The first, or near-term, tier of express lanes conversions include projects with high mobility and financial feasibility scores, available funding, connectivity with the currently existing Metro ExpressLanes, and/or the ability to implement dual express lanes in each direction. Figure 9 shows the first tier of express lane conversions to be included in Metro s preferred express lanes baseline network. The Tier 1 projects are recommended for implementation in the timeframe and involve conversion of existing HOV lanes to express lanes in five freeway corridors. They include I-10 (between I-605 and the San Bernardino County line), the entire length of I-105 (between I-405 and I-605); I-405 (between US 101 and the Orange County line); I-605 (between I-10 and the Orange County line); and I-110 (from 182nd Street to I-405). These corridors vary from 2.2 to 77.6 lane miles and have anticipated costs in the $37 to $95 million range for non-standard lane construction, and between $73 and $305 million for full-standard costs. In addition, the financial feasibility of an extension of the current I-110 ExpressLanes from SR-91 south to I-405 and the addition of a new I-110/I-405 HOV/HOT direct connector was analyzed. It should be noted that these two projects would require new construction rather than a conversion of an existing HOV lane. Additional information on Tier 1 projects is provided in Table 3. Preliminary ExpressLanes Network Screening and Phasing Recommendations 24

30 25 Figure 9: Tier 1 Express Lanes 10-Year Plan ( )
31 Metro Countywide ExpressLanes Strategic Plan (Final) Table 3: Metro Express Lanes Program 5-10 Year Implementation Phasing Plan (Tier 1) Corridor From To Existing Network Lane Miles Scope Non- Standard Cost Full-Standard Cost I-10 Alameda St. I In operation N/A N/A I-110 Harbor Gateway Transit Center Tier 1 Baseline Network Adams Blvd In operation N/A N/A I-10 I-605 LA/SB CL 34.2 Convert existing and future HOV to single HOT in each direction I-105 I-405 I Convert existing HOV to single HOT in each direction* I nd Street I Add new HOT lanes by extending existing single HOT lanes in each direction south to I-405; construct new HOV/HOT Direct Connector at I-110/I-405 I-405 US 101 LA/OC CL 77.6 Convert existing HOV to single HOT in each direction** I-605 I-10 LA/OC CL 41.2 Convert existing HOV to single HOT in each direction I-605/SR-60 Interchange HOV Direct Connectors 0.1 Construct HOV direct connectors at I-605/SR-60 interchange $43M $196.8M $37.4M N/A $73.2M $280.4M + $250M (Connector) $94.5M $305M $50.3M $249.6M N/A $490.6 Tier 1 Total $225.2M $1,845.6M Source: Conceptual-Level Cost Estimate Report, SCAG Express Travel Choices Phase II Study - Regional Express Lane Network, April 8, 2015 *Metro expects that dual express lanes can be implemented on the I-105 (I-405 to I-605); final configuration to be determined through the Project Approval/Environmental Document (PA/ED). Caltrans I-105 PSR-PDS estimated cost for dual-lanes is $125M to $200M. ** Metro expects that dual Express Lanes can be implemented on the I-405 (US 101 to I-10); final configuration to be determined through the Project Approval/Environmental Document (PA/ED). Prior Sepulveda Pass Corridor Systems Planning Study Supplemental Traffic and Revenue Study estimated cost for dual-lanes at $188M. Preliminary ExpressLanes Network Screening and Phasing Recommendations 26

32 Tier 2: The second, or mid-term tier of express lane conversions includes corridors with moderate mobility and financial feasibility scores. As shown in Figure 10, the Tier 2 express lane projects from Metro s preferred express lanes baseline network are located on a total of seven freeway corridors varying from 9.6 to 56.2 lane miles. They include the I-5 (between I-605 and the Orange County line); I-5 (between SR-134 and SR-170), SR-57 (between SR-60 and the Orange County line); SR-91 (between I-110 and the Orange County line); SR-134 (between SR-170 and I-210); I-210 (between SR-134 and the San Bernardino County line); and I-405 (between US 101 and I-5). Additional information on the Tier 2 corridors is provided in Table 4. Figure 10: Tier 2 Express Lanes 15-Year Plan ( ) 27
33 Table 4: Metro Express Lanes Program 15-Year Implementation Phasing Plan (Tier 2) Corridor From To Tier 2 Baseline Network Lane Miles Metro Countywide ExpressLanes Strategic Plan (Final) Scope I-5 I-605 LA/OC CL 12.9 Convert future HOV to single HOT in each direction I-5 SR-170 SR Convert future HOV to single HOT in each direction SR-57 LA/OC CL SR Convert existing HOV to single HOT in each direction SR-91 I-110 LA/OC CL 29.0 Convert existing HOV to single HOT in each direction SR-134 SR-170 I Convert existing HOV to single HOT in each direction I-210 SR-134 LA/SB CL 56.2 Convert existing HOV to single HOT in each direction I-405 I-5 US Convert existing HOV to single HOT in each direction Non- Standard Cost $15.4M $23.8M Full- Standard Cost $40.5M $52.9M $12.1M $44M $34.8M $475M $33.6M $68.7M $22.4M $1,205M $2,251.4M $73.9M Tier 2 Total $210.8M $4,142.7M Source: Conceptual-Level Cost Estimate Report, SCAG Region Value Pricing Project Regional Express Lane Network, April 8, 2015 Preliminary ExpressLanes Network Screening and Phasing Recommendations 28

34 Tier 3: The third, or longer-term tier of express lanes conversions includes projects with lower mobility and financial feasibility scores that still passed the screening evaluation. The Tier 3 express lane projects are shown in Figure 11. These projects range from 13.3 to 36.2 lane miles and are anticipated to be built in the post 2032 timeframe and include conversions of existing or planned HOV lanes to express lanes operation in three freeway corridors: I-5 (between SR-170 and SR-14); SR-60 (between I-605 and the San Bernardino County line); and SR-170 (from I-5 to SR-134). In addition to these proposed express lane conversions, the study considered the financial feasibility of three additional projects: the I-5 (between SR-14 and Parker Road); SR-14 (between I-5 and Avenue P8); and SR-118 (between I-5 and the Ventura County line). These additional express lane projects are not expected to provide strong revenue potential but would provide important opportunities for network connectivity. All of these projects were subsequently added to Tier 3 as part of an Expanded Network. Additional information on the Tier 3 corridors is provided in Table 5 Figure 11: Tier 3 Express Lanes 25-Year Plan ( ) 29
35 Table 5: Metro Express Lanes Program 25-Year Implementation Phasing Plan (Tier 3) Corridor From To Tier 3 Baseline Network Lane Miles Metro Countywide ExpressLanes Strategic Plan (Final) Scope I-5 SR-14 SR Convert existing HOV to single HOT in each direction SR-60 I-605 LA/SB CL 36.2 Convert existing HOV to single HOT in each direction SR-170 SR-134 I Convert existing HOV to single HOT in each direction Tier 3 Expanded Network I-5 SR-14 Parker Rd Convert future HOV to single HOT in each direction SR-14 I-5 Avenue P Convert existing HOV to single HOT in each direction SR-118 LA/VEN CL I Convert existing HOV to single HOT in each direction plus I-110/I-405 direct connectors Non- Standard Cost $17.7M $48.3M Full- Standard Cost $80.8M $217.3M $17M $57.7M $95.3M $37.3M $26.8M $370.7M $336.5M $92.6M Tier 3 Total $242.4M $1,155.6M Sources: Conceptual-Level Cost Estimate Report, SCAG Region Value Pricing Project Regional Express Lane Network, April 8, 2015 Preliminary ExpressLanes Network Screening and Phasing Recommendations 30

36 Full-Network of ExpressLanes: The entire Los Angeles County ExpressLanes Network is shown in Figure 12. The complete strategic buildout network of 621 lane miles of express lanes includes the existing I-110 and I-10 ExpressLanes, together with the Tier 1, Tier 2, and Tier 3 projects listed previously. It is also worth noting that SR-60 in Los Angeles County is part of SCAG s proposed Zero Emission East-West Freight Corridor, in which truck-only toll lanes are planned. Figure 12: Los Angeles County Strategic Buildout Express Lanes Network HOV Direct Connectors: The Full-Network, as illustrated above, also proposes the implementation of direct connectors between express lanes on crossing freeway corridors. Express lanes direct connectors are proposed to be implemented to accommodate various directional movements at the following locations: I-105 to/from I-605, I-110 to/from I-405, I-605 to/from SR-60, I-605 to/from I-10, and SR-60 to/from SR-57. The I-110/I-405 and I-605/SR-60 direct connectors are currently funded as part of Measure M. While direct connectors can represent relatively high cost investments, they can provide substantial travel time savings and safety benefits where high volume movements are observed to transition from one express lane to another. This is because the provision of the direct connector can eliminate the need for a vehicle traveling in the express lane to exit the express lane and weave across multiple GPLs to exit to the crossing freeway before weaving across multiple GPLs to enter the express lanes again, similar to the existing HOV/HOT direct connectors at the I-110 and I-105 Freeways (Figure 13). The impact of the traffic weaving between the express lanes and 31

37 Metro Countywide ExpressLanes Strategic Plan (Final) the general-purpose freeway connectors can be significant in terms of the disruption to through traffic, especially where the general-purpose volumes are also very high. As stated in Chapter 12 of the 2010 Highway Capacity Manual (HCM), traffic in a weaving segment is subject to lane-changing turbulence in excess of that normally present on basic freeway segments. This additional turbulence presents operational problems and design requirements. These effects of weaving can be amplified where high volumes of traffic is seeking to transition between crossing express lanes due to the need for weaving across all freeway lanes to exit from one freeway to the next. The effect of weaving at the transition between crossing HOV lanes is considered to be a contributing factor in high accident hot spots previously observed in Los Angeles County. As part of the Metro HOV Performance Program completed in 2002, a qualitative assessment of accident hot spots demonstrated a correlation between many of the locations with the highest rate of crashes, and the location of HOV lane access points (or the termini of HOV lanes). Of particular note was the SR-91 WB approach to the I-605 exit ramps where the highest rate of crashes was observed with the weaving associated with the transition from the SR-91 WB HOV lanes to the I-605 HOV lanes being considered Figure 13: Photo of Existing I-110/I-105 HOV/HOT Direct Connectors a contributing factor. Going forward, Metro will be conducting a detailed analysis of HOV direct connectors to determine the necessary movements, right-of-way requirements, and develop planning level cost estimates. Preliminary ExpressLanes Network Screening and Phasing Recommendations 32
38 33
39 4 RESOURCE PLAN Metro Countywide ExpressLanes Strategic Plan (Final) The Resource Plan identifies available and potential funding sources for the three tiers of express lanes projects described in the previous section. The capital costs identified are high level, rough order of magnitude (ROM) estimates. With the exception of the Tier 1 projects listed in Table 7, no funding has been identified for the remainder of the projects listed in Table CAPITAL COSTS The capital costs for the three tiers of projects represent the amounts required for converting existing HOV lanes to express lane operation. The exception to this is the extension of I-110 between SR-91 and I-405 which would involve new construction. For segments where a non-standard design conversion cost estimate was prepared in addition to a Caltrans standard design conversion, the lower cost non-standard estimate was used, consistent with the I-10 and I-110 ExpressLanes conversions where non-standard features were incorporated. However, it is important to note that Caltrans approval of design exceptions and fact sheets for non-standard lane configurations would need to occur on a project-by-project basis. A two-year construction duration was assumed for all the segments. Furthermore, with the exception of the I-110/I-405 and I-605/SR-60 HOV direct connector projects, the costs for new HOV/HOT direct connectors identified in the Strategic Buildout Network are not included. Table 6 outlines the high level preliminary costs for standard and nonstandard features. As illustrated, the differential between standard and non-standard costs is significant. Table 6: Measure M Funding for ExpressLanes Projects Tier 1* Tier 2 Tier 3 I-10 between I-605 & LA/SB CL I-5 between I-605 & LA/OC CL I-5 between SR-170 and Parker Road I-105 between I-405 and I-605 I-5 between SR-170 & SR-134 SR-14 between Avenue P8 & I-5 I-110 ExpressLane extension south to I-405/I-110 interchange I-405/I-110 Int. HOV Connect Ramps and Interchange Improvements I-405 between US-101 & LA/ OC CL SR-57 between SR-60 & LA/OC CL SR-91 between I-110 and LA/ OC CL SR-134 between I-210 & SR-170 I-605 between I-10 & LA/OC CL I-405 between US-101 and I-5 I-605/SR-60 Interchange HOV Direct Connectors SR-60 between I-605 & LA/SB CL SR-118 between I-5 & LA/VC Line SR-170 between I-5 & SR-134 Non-Standard Costs: $1,246.2M Non-Standard Costs: $210.8M Non-Standard Costs: $242.4M Standard Costs: $1,845.6M Standard Costs: $4,142.7M Standard Costs: $1,686M *Tier 1 Non-Standard and Standard cost total includes new construction of the I-605/SR-60 HOV direct connectors estimated to cost $490.6M as well as the I-110 ExpressLanes Extension and I-405/I-110 HOV direct connector ramps, estimated to cost $280.4M and $250M, respectively. 34
40 4.2 POTENTAL FUNDING SOURCES There are several potential funding sources for constructing the express lanes projects, including local, state, federal, and private LOCAL FUNDING i. Measure M On November 8, 2016 Los Angeles County voters passed Measure M, a ½ cent sales tax for transportation projects. Measure M provides $866.5 million in funding (2015 dollars) for several express lanes projects as listed in Table 7. For those projects not specifically identified in Measure M, Metro would need concurrence from the subregion and the Metro Board for implementation of express lanes. Table 7: Measure M Funding for ExpressLanes Projects (Funding Availibility) Project Measure M Funding Funding Availability I-405 from I-10 to US-101 $260,000, I-105 ExpressLanes from I-405 to I-605 $175,000, I-405/I-110 Int. HOV Connect Ramps and Interchange Improvements $250,000, I-605/SR-60 Interchange HOV Direct Connectors $130,000, I-110 ExpressLane extension south to I-405/I-110 interchange Remaining Projects in Tier 1, Tier2 and Tier 3 $51,500, Eligible for Measure M Hwy Program TBD ii. Measure R Sales Tax A ½ cent sales tax on retail sales in Los Angeles County, approved by voters in Eligible uses include construction of a specific list of highway capital projects or programs of projects. For those projects not specifically identified in Measure R, Metro would need concurrence from the subregion and the Metro Board for implementation of express lanes. iii. Proposition C 25% A ½ cent tax on retail sales in Los Angeles County, approved by voters in Eligible uses include expenditures related to Traffic Systems Management (TSM) and Congestion Management Programs. For those projects not specifically identified in Proposition C, Metro would need concurrence from the Metro Board for implementation of express lanes. iv. Net Toll Revenue Loans The ability of express lanes to generate toll revenes provides the possibility for Metro to utilize net toll revenue loans from other express lanes projects to fund construction of new express lanes. However, any decisions related to net toll revenue funds will require Metro Board direction. 35
41 Metro Countywide ExpressLanes Strategic Plan (Final) STATE FUNDING Potential state funding sources include: i. State Transportation Improvement Program (STIP) A five-year state-regional program, adopted every two (even) years, of new capital improvement projects on and off the State Highway System that increase the capacity of the transportation system. The STIP consists of two broad programs the regional program funded from 75% of new STIP funding and the interregional program funded from 25% of new STIP funding. The California Transportation Commission (CTC) must approve each County s STIP in its entirety. CTC allocation is required by the end of the fiscal year that the project is listed in the STIP. ii. California Infrastructure and Economic Development Bank (IBank) As of January 2016, IBank has financed nearly $37 billion in infrastructure and economic development projects. IBank has broad statutory authority to issue taxexempt and taxable revenue bonds, provide loans to state and local governments for public infrastructure and economic expansion projects, and loan guarantees to help small businesses. iii. HOV Violation Fund Revenue generated from fines collected for occupancy violations in the Los Angeles County carpool lanes and for crossing the HOV lane buffer. Metro receives 1/3 of the first $100 if the violation occurs within an incorporated city in Los Angeles County and 1/2 if the violation occurs within an unincorporated area of the County. Metro programs these funds for the Freeway Service Patrol Program in which Metro contracts for tow trucks to patrol the freeways to respond to traffic incidents and improve traffic flow FEDERAL FUNDING Potential federal funding sources include: i. Transportation Investment Generating Economic Recovery (TIGER) grant program Since 2009, the TIGER grant program has provided a combined $5.1 billion to 421 projects. The purpose of the TIGER grant program is to support innovative projects, including multi-modal and multi-jurisdictional projects, which are more difficult to fund through traditional federal programs. ii. Fostering Advancements in Shipping and Transportation for the Long-term Achievement of National Efficiencies (FASTLANE) grant program FASTLANE authorized $4.5 billion in grants from FY 2016 through FY 2020 for projects that improve safety and hold the greatest promise to eliminate freight bottlenecks and improve critical freight movements. USDOT awarded $759 million to 18 projects in the initial FY 2016 FASTLANE round. Up to $850 million in FASTLANE funds is available in the current FY 2017 FASTLANE round. iii. Transportation Infrastructure Finance and Innovation Act (TIFIA) Loan program TIFIA provides credit assistance for highway and transit capital projects eligible for federal aid. Major requirements include a capital cost of at least $50 million (or 33.3 Resource Plan 36
42 percent of a state s annual apportionment of federal-aid funds, whichever is less) or $15 million in the case of intelligent transportation system (ITS) projects. TIFIA credit assistance is limited to a maximum of 33 percent of the total eligible project costs. iv. Advanced Transportation and Congestion Management Technologies Deployment (ATCMTD) ACTMTD authorized $60 million each fiscal year from FY 2016 to FY Eligible projects involve advanced transportation management technologies, infrastructure maintenance, monitoring, and condition assessment, transportation system performance data collection, analysis, and dissemination systems, advanced safety systems, technologies associated with autonomous vehicles, electronic pricing and payment systems, and advanced mobility and access technologies. v. Surface Transportation Block Grant (STBG) Program STBG program funds are apportioned to states in the form of contract authority, subject to the overall federal-aid obligation limitation. Each state s STBG apportionment is calculated based on a percentage specified in law. Certain setasides are required by law from a state s STBG apportionment, including funding for Transportation Alternatives, 2% for State Planning and Research, and funding for bridges not on federal-aid highways (off-system bridges). vi. Congestion Mitigation and Air Quality (CMAQ) Improvement Program CMAQ formula funding is apportioned to states for projects that contribute to the attainment or maintenance of the National Ambient Air Quality Standards (NAAQS), with a high level of effectiveness in reducing air pollution. Vehicle-to-infrastructure communications equipment and electric vehicle and natural gas vehicle infrastructure are eligible projects under the Fixing America s Surface Transportation (FAST) Act s CMAQ program. vii. National Highway Freight Program The National Highway Freight program provides $6.3 billion in formula funds over five years for states to invest in freight projects on the National Highway Freight Network. This program provides greatest potential for truck tolling projects. viii. Highway Safety Improvement Program (HSIP) HSIP provides formula funding apportioned as a lump sum for each State, which is then divided among apportioned programs and safety projects that are consistent with the State s strategic highway safety plan. HSIP funding is utilized to correct or improve a hazardous road location or feature, or to address a highway safety problem. Eligible projects include installation of vehicle-to-infrastructure communication equipment, and roadway improvements that provide separation between pedestrians and motor vehicles, including medians and pedestrian crossing islands. ix. Intelligent Transportation Systems (ITS) Program The ITS program is currently focused on significantly reducing crashes through advanced safety systems based on interoperable wireless communications among surface transportation vehicles of all types, traffic signals, other infrastructure systems, pedestrians, wireless devices, and automated vehicle systems. The federal share under the ITS program is 80%. 37
43 x. Grant Anticipation Revenue Vehicles (GARVEEs) Metro Countywide ExpressLanes Strategic Plan (Final) As of March 2016, 25 States and 3 territories have issued over $19.1 billion in GARVEE bonds which are paid with future federal highway formula funds. GARVEE financing generates up-front capital for major highway projects at generally tax-exempt rates and enables a state to construct a project earlier than if using traditional pay-as-you go grant resources PRIVATE FUNDING SOURCES Potential private funding sources include: i. Public-Private Partnerships (PPP or P3) P3 addresses limited funding resources for infrastructure or development projects in the public sector by allowing private sector financal participation thereby allowing the allocation of public funds for other local priorities. An example of a concession P3 could be an express lanes project wherein the government agency that owns the facility contracts with the private sector to grant it the right to finance, design, build and/or operate the highway, along with the right to collect a toll (user charge) from the users of the express lanes to repay their initial investment and/or to cover ongoing operations and maintenance costs. Various contractual arrangements, such as Design-Build-Operate-and-Maintain, Design-Build-Finance, and Design-Build-Finance-Operate-and-Maintain, are P3 arrangements reflecting the different combinations of allocation of risk and the role of the project proponent. ii. Revenue Bonds A Revenue bond is another potential source of funds for constructing future express lanes projects. Revenue bonds may be issued directly by Metro and secured by repayment from future toll revenues or other sources. Resource Plan 38

44 39
45 5 FUNDING PRIORITIZATION Metro Countywide ExpressLanes Strategic Plan (Final) Currently available funding is not sufficient to construct all projects included in Tiers 1, 2, and 3. It is possible that Metro may be able to fill this funding shortfall or reduce the need for borrowing by securing federal and/or state funding, as was done for the I-110 and I-10 ExpressLanes. Metro will seek all opportunities to secure funding though traditional and innovative sources. However, in the absence of outside sources, the only source of revenue that could be used to cover the funding shortfall would be loans backed by the toll revenue from the existing and future express lanes. Currently toll revenue from the existing I-110 and I-10 ExpressLanes is used to pay for the following items: 1. Operations and maintenance This includes account maintenance, fees, violation processing, marketing and public relations, customer service call center, ExpressLanes traffic management, Caltrans maintenance, dedicated CHP enforcement, Freeway Service Patrol incident management, Metro staff costs, and transponders. 2. Transit subsidies Toll revenues are allocated to the Metro Silver Line, Foothill Transit, Gardena Transit, and Torrance Transit to subsidize added transit services that operate in the I-110 and I-10 corridors. 3. Low income Assistance Plan - The Metro ExpressLanes Low-Income Assistance Plan (formerly called the Equity Plan) provides a discount to qualifying LA County residents who sign up for a Metro ExpressLanes account. Low-Income Assistance Plan account holders receive a $25 discount when they sign up, and also have their $1 monthly maintenance fee waived. To qualify for the program, the Metro ExpressLanes customer must live in LA County and have an income that is no greater than twice the federal poverty level ($40,180 for a family of 3). 4. Carpool Loyalty Program - The Carpool Loyalty Program automatically enters carpoolers that have been observed using the Metro ExpressLanes into a monthly drawing for a chance to win gift card rewards. Each month, 40 winners are selected 10 HOV-2 winners and 10 HOV-3+ winners in each corridor. 5. Transit Rewards Program This program allows Metro ExpressLanes customers to earn toll credits by making transit trips in the ExpressLane corridors. Using their registered Transit Access Pass (TAP) card, transit riders earn a $5 toll credit for every 32 one-way trips taken during peak hours on transit lines along the I-110 Harbor Transitway or I-10 El Monte Busway. 6. Metro s Board has established the Net Toll Revenue Re-Investment Grant Program to provide funding for projects improving mobility within the I-110 and I-10 corridors. The I-10 and I-110 ExpressLanes currently generate net toll revenues in excess of the cost items identified above, so in July 2014, the Board approved $20.7 million in Net Toll Grants to 22 projects enhancing active transportation/system connectivity, transit service, and the highway system within the ExpressLanes corridors. In 2016, the Metro Board approved a second round of Net Toll Grants that distributed $28 million for additional improvements in the two corridors. 40
46 41 While there is currently surplus net revenue available for reinvestment in the I-110 and I-10 corridors through Net Toll Grants, if the Metro Board were to approve construction of new express lane facilities supported by these net revenues, then surplus funds for the grant program would likely be reduced, possibly to the point where in some years surplus funds would no longer be available. Although no funding decisions have been made at this time, it is important to recognize this possibility as Metro considers developing a countywide express lanes network.
47 Metro Countywide ExpressLanes Strategic Plan (Final) THIS PAGE HAS BEEN INTENTIONALLY LEFT BLANK. Funding Prioritization 42
48 43
49 6 VEHICLE OCCUPANCY Metro Countywide ExpressLanes Strategic Plan (Final) Section 166 of Title 23 of the U.S. Code requires that HOV and express lanes on Interstate highways operate at an average travel speeds of 45 miles per hour during peak travel periods. Performance of HOV facilities is considered to be degraded if it falls below the 45 mph threshold more than 10 percent of the time during peak periods over a consecutive 180-day period. If an HOV or express lane facility is considered degraded, then the state must either limit or discontinue the use of the lane by exempted vehicles or take other actions that will bring the operational performance up to the federal standard within 180 days after being identified as degraded, or risk losing funding from US DOT. In December 2015 Caltrans submitted a 2014 California High-Occupancy Vehicle Lane Degradation Determination Report to FHWA to document the performance of HOV facilities in the state, as required by federal regulation. According to the Degradation Report, 310 miles of HOV lanes in Los Angeles County out of a total 514 lane miles are degraded. Preliminary traffic and revenue forecasts for the year 2035 prepared for the SCAG Express Travel Choices Phase II Study indicate that degradation levels will deteriorate further if the current HOV-2+ occupancy rate (Figure 14) continues to be used on HOV facilities in Los Angeles County. Nearly all HOV corridors in Los Angeles County will be degraded during the p.m. peak if the HOV-2+ occupancy requirement remains in place. During the p.m. peak, HOV segments shaded in yellow would be degraded between 10 and 49 percent of the time, those shown in orange would be degraded between 50 and 74 percent of the time, and those in red would be degraded over 75 percent of the time. These levels of degradation far exceed the Federal limit of only 10 percent of peak periods with speeds below 45 mph and demonstrate that conditions on Los Angeles County s HOV network would be untenable at the current HOV- 2+ occupancy rate. Moreover, conversions to express lane operation would not be possible, as there would be no excess capacity available to sell to paying non-hov motorists. The provision of additional express lane capacity could be expected to mitigate the overutilization of the existing lanes in many of the locations identified in the Caltrans Degradation Report. However, the cost of providing additional express lane capacity can be significant, especially in corridors where design exceptions have already been utilized to accomplish the construction of the existing HOV lanes in highly urbanized areas with constrained right-of-way availability, like many in Los Angeles County. Although the costs of providing additional express lanes capacity can be significant, the potential for revenue generation from the express lanes is also increased significantly when comparing single-lane express lanes to dual-lane express lanes. The provision of a second express lane in most cases effectively provides a full lane of capacity that can be priced as part of the express lanes management strategy, regardless of the level of HOV participation in the corridor. Evidence from express lanes facilities across the country indicates that the level of revenues generated by dual-lane express lane facilities is, on average, about ten-times the level of revenue observed on single lane express lane facilities contributing to the ability to offset the cost of implementation in specific locations. In lieu of providing additional lane capacity, increasing the HOV occupancy requirement can help to mitigate the overutilization of existing HOV lanes. As shown in Figure 15, if HOV occupancy requirements are increased to HOV-3+, and adequate 44

50 enforcement is provided to ensure compliance, traffic degradation on nearly all HOV facilities in Los Angeles County will be eliminated during the p.m. peak period. With the exception of a two-mile segment of the I-5 HOV lanes between SR 14 and I-405 that could be degraded between 10 and 49 percent of the time, all other HOV facilities in Los Angeles County would operate in excess of 45 miles per hour during the p.m. peak, and the vast majority of the HOV network (those segments shown in dark green) would operate in excess of 45 mph over 95 percent of the time. Figure 14: 2035 Forecast Breaches for Level of Service, HOV-2+ Toll Free 45

51 Figure 15: Forecast Breaches For Level Of Service, HOV-3+ Tolled Metro Countywide ExpressLanes Strategic Plan (Final) Given that the increase in HOV occupancy requirements from HOV-2+ to HOV-3+ would divert all HOV-2 motorists to the GPLs, the HOV lanes would have excess capacity available to accommodate paying non-hov vehicles, and the use of variable pricing would provide greater ability to manage the demand for the lanes. In order to take advantage of that available capacity and to reduce the number of vehicles diverted to the GPLs, it is recommended that express lane operations be introduced concurrently with the increase in the HOV occupancy requirement. In addition, consideration should be given to providing a reduced toll for HOV-2 motorists during the peak period as an incentive to continue carpooling. As with the current occupancy policy on the I-10 ExpressLanes, it is also recommended that the increase in occupancy rates from HOV-2+ to HOV-3+ be limited to peak periods only. This is consistent with best practices as revealed in national research that has found that differential HOV access by time of day is more acceptable to the public than implementing the HOV-3+ occupancy requirement 24 hours per day. As travel demand continues to grow in Los Angeles County, Metro and Caltrans should continue to monitor conditions on the express lanes during shoulder and off-peak periods to ensure that traffic conditions do not become degraded at the HOV-2+ occupancy rate. Vehicle Occupancy 46
52 47

53 Metro Countywide ExpressLanes Strategic Plan (Final) 7 INNOVATIVE TECHNOLOGY OPERATIONAL IMPROVEMENTS This section highlights several emerging technologies and developments that have the potential to change the way that express lanes are developed and operated. 7.1 INTROPERABILITY There are state and national efforts to modify tolling protocols to achieve broader interoperability as described below. The California Toll Operators Committee (CTOC), the entity that maintains toll interoperability throughout the state, has developed a plan to transition from the current tolling protocol (known as Title-21) to the ISO (known as 6C) protocol. The 6C protocol offers significantly lower transponder costs and is an established standard in the toll industry. All other states in the west with the exception of California already use the 6C protocol for tolling, including Washington, Utah and Colorado. 6C transponders come in a variety of forms including a transportable hard case form that allows for occupancy declaration and a non-removable sticker form (see examples from Washington in Figure 16). The CTOC transition plan envisions a gradual process to replace Title 21 with 6C, including a period of time during which both protocols will be in effect. Nearly all California toll facilities are equipped with multi-protocol readers that are capable of reading 6C and Title 21 transponders. After the administrative rulemaking process to modify the existing Title 21 regulations is complete, it is estimated to take up to 18 months before California toll agencies would all be able to process 6C transactions. Figure 16: 6C Switchable Transponder (top) and Sticker Tag (bottom) from WSDOT On a national level, the International Bridge, Tunnel and Turnpike Authority (IBTTA) is leading the effort to achieve toll interoperability so that customers can establish a single account that would be recognized on all toll facilities in the country. The initiative, referred to as National Interoperability (NIOP), envisions the eventual adoption of a national tolling protocol and the establishment of central hubs that would permit the exchange of information to allow a transaction recorded at any toll facility to be matched to a customer s home account. There are many institutional challenges associated with establishing interoperability given the many legacy toll programs that currently exist throughout the country. Although MAP-21 established an October 2016 deadline for achieving national toll interoperability, there is no established timeframe for the achievement of a national interoperable tolling standard. 48

54 7.2 CONNECTED AND AUTONOMOUS VEHICLES Connected and autonomous vehicles have the potential to revolutionize the way transportation facilities operate. The implications of these technologies on express lanes is speculative at this early stage of deployment but are worth considering for future planning purposes. Connected vehicle technology relies on dedicated short-range radio communications (DSRC) to share data among vehicles and with roadside infrastructure. This sharing of data allows vehicles and infrastructure to receive and act on information about nearby vehicles. As examples, drivers can be alerted of the risk of a rear-end collision when vehicles ahead are stopped, or traffic signal controllers can optimize signal timing based on shared data. Within the context of express lanes, connected vehicle applications could potentially be used to communicate between vehicles and toll systems to verify vehicle occupancy, communicate toll rates and other express lane operational characteristics to vehicles, and could even be used as an alternative to transponder based tolling. Additionally, there are likely to be operational benefits associated with increased roadway capacity and decreased congestion as the penetration of connected vehicles increases over time. Autonomous vehicles are capable of sensing their environment and taking over some or all of the driving functions from a human driver. Many are predicting that the rollout of autonomous vehicles will fundamentally change the way our transportation system operates. Like connected vehicles, autonomous vehicles have the potential to get more capacity out of our existing infrastructure. A world where the majority of autonomous vehicles are shared could lead to decreased congestion, but some skeptics fear that autonomous vehicles will give people the freedom to move even farther from urban centers and create more congestion since the time normally spent driving could be replaced with other tasks. Both scenarios could lead to thinking differently about the future of how express lanes operate. 49
, carsharing (e.")
55 Metro Countywide ExpressLanes Strategic Plan (Final) 7.3 NEW MOBILITY AND MOBILE DEVICE APPLICATIONS Private technology and transportation companies are introducing new mobility services at a rapid pace. Examples include ridehailing (e.g., Uber, Lyft), carsharing (e.g., Zipcar, Car2Go), ridesharing (e.g., Carma, Scoop), real-time navigation (e.g., Google Maps, Waze) and driverless vehicles (e.g., Ford, Google, Tesla, Volvo). The proliferation of these services seems to be outpacing the ability to anticipate their impacts. However, there are opportunities to develop synergies between these new mobility services and the operation of express lanes. In Austin, TX, a federally funded pilot program offered toll rebates to users who carpooled on select toll facilities using the Carma Carpooling service. The Carma Carpooling demonstration project in Austin successfully demonstrated the use of an application to provide information about the number of people in a vehicle as the basis for providing toll discounts. This concept could be expanded to incentivize, verify, and apply toll discounts to qualifying vehicles on express lane facilities. Figure 17: GeoToll Mobile Device Interfaces Mobile device applications are increasingly of interest for providing the ability to collect toll payments, including declaring eligible carpools. Currently, much of the discussion regarding mobile devices centers on account management, transponder replacement and occupancy declaration, with each representing Source credit: GeoToll increasingly viable options for considering during the deployment of new express lanes tolling systems. Several companies have developed mobile applications to replace a toll tag in the vehicle. One example (Figure 17), GeoToll, has integrated 6C tag protocols into the Android phone platform allowing the phone itself to act as the transponder. The company has conducted a demonstration for the Washington State Department of Transportation (WSDOT) and has shown that their application can be used within the deployed tolling infrastructure with a comparable level of accuracy to existing RFID tags. While all of these technologies have the ability to impact express lanes operations, it should be noted that all are still limited by our ability to enforce the actual occupants in the vehicle. Innovative Technology Operational Improvements 50

 to provide a visual cue for targeted enforcement.")
56 7.4 ENFORCEMENT TECHNOLOGIES There are a number of new technologies that are in different phases of development and deployment to aid in the enforcement of express lanes. Traditionally, express lanes have relied primarily on visual enforcement by highway patrol officers. To aid in manual enforcement of tolling and occupancy requirements, some express lanes are equipped with beacons that illuminate depending on the setting of a driver s transponder (or lack of a transponder) to provide a visual cue for targeted enforcement. There are several technologies that have been researched and deployed that have the potential to eliminate or significantly reduce the amount of manual enforcement that is required. License plate recognition (LPR) cameras are in use on toll facilities around the country, including the Metro ExpressLanes, to capture and process the license plates of vehicles for toll collection and violation purposes. In Houston, a technology was developed to identify and alert officers of the presence of prohibited vehicles using LPR. The Houston Rapid Alert System (RAS) generates real-time alerts, including an image of the vehicle, vehicle location and amount of money owed in toll violations and fees, which are sent to officers laptop computers in their patrol vehicles. Figure 18: VPDS Camera and Equipment Vehicle Passenger Detection Systems (VPDS) have been under development for a number of years, although to date no effective systems have been fully deployed. Current systems being tested show considerable promise to support enforcement efforts by allowing enforcement personnel to target specific vehicles suspected of occupancy violations. These systems utilize cameras to capture images through the front windshield and through the rear passenger window (Figure 18). Once images are captured, image analysis using facial recognition software is performed to determine how many occupants are in the vehicle. The results from recent testing of VPDS on the I-110 ExpressLane have shown that the system can maintain above a 95% capture rate of vehicles using the facility. Utilizing manual review of the remaining 5% of the images can put the capture rate at close to 100%. 51
57 Metro Countywide ExpressLanes Strategic Plan (Final) THIS PAGE HAS BEEN INTENTIONALLY LEFT BLANK. Innovative Technology Operational Improvements 52

58 53
59 8 CONCLUSION AND NEXT STEPS Metro Countywide ExpressLanes Strategic Plan (Final) Los Angeles County freeways have consistently ranked among the worst in the nation for traffic congestion. Express lanes have proven to be an effective strategy for managing freeway congestion both in Southern California and in other parts of the country. This Strategic Plan establishes a vision for Metro to deliver a system of express lanes that builds on the success of the I-110 and I-10 ExpressLanes pilot program to create a more reliable, faster travel option that makes better use of existing vehicle capacity in the carpool lanes and affords greater flexibility for motorists and transit riders. The Strategic Plan is intended to be updated periodically to reflect changes in project costs, revenues, economic conditions, project priorities and technology innovations that will undoubtedly occur over the next 25+ years. An analysis methodology consisting of quantitative mobility and financial criteria as well as four qualitative refinement criteria was used to identify a network of over 621 lane miles of express lanes. These express lanes were then prioritized into Tiers 1, 2, and 3. The first, or near-term tier of express lanes conversions include projects with high mobility and financial feasibility scores, available funding, connectivity with the currently existing express lanes, and/or the ability to implement dual express lanes in each direction. The second, or midterm tier of express lane conversions includes corridors with moderate mobility and financial feasibility scores. The third, or longer-term tier of express lanes conversions includes projects with lower mobility and financial feasibility scores that do not offer strong revenue potential but would provide important opportunities for connectivity. Metro intends to pursue express lanes projects generally consistent with the three tiers of projects described in this plan and will focus first on the Tier 1 projects. Metro s 621-mile network will be built in phases, with individual projects completed in the next five to twenty-five years or beyond. In addition to the express lanes, HOV direct connectors are also needed to encourage use of the express lanes by improving mobility and safety through reduced weaving and merging. Some of the projects in the ExpressLanes strategic plan are funded through Measure M, though most are not. For those projects not funded through Measure M, Metro will attempt to secure other sources of revenue that could include other local funds, revenue bonds, TIFIA loans, grants, P3, and net toll revenue loans from other express lanes. It should be noted that if the Metro Board were to approve construction of a new express lane facility supported by loans of net toll revenues, then surplus funds for the Net Toll Grant program could potentially be reduced, possibly to the point where in some years no surplus funds would available to grant. Although no funding decisions have been made at this time, it is important to recognize this possibility as Metro considers developing a county-wide express lanes network. To implement the Countywide Express Lanes Strategic Plan, for the Tier 1 projects, it is recommended that Metro conduct further planning studies, including an analysis of potential HOV/HOT direct connectors, develop a comprehensive financial plan and secure CTC authority to toll. These studies would provide detailed cost estimates, design configurations and revenue potential for each of these express lane facilities. Policies should also be considered for the inclusion of express lanes as an alternative in the planning process for all highway projects and the increase of occupancy requirements from HOV-2 to HOV-3+ during peak hours. With the proposed express lanes projects in Los Angeles County, the existing SR-91 and planned I-405 express lanes in Orange County, planned express lanes along the I-10 and I-15 in San Bernardino County, and SR-91 extension and I-15 in Riverside County, southern California is on its way to developing a regional express lane network that would extend across the four counties. 54
60 55 THIS PAGE HAS BEEN INTENTIONALLY LEFT BLANK.

61 For more information on Metro ExpressLanes program, visit:
Managed Lanes in California:
 Managed Lanes in California: Where We ve Been Where We re Going Joe Rouse Managed Lanes Manager California Department of Transportation Managed Lanes Defined Lanes that are proactively managed in response
405 Express Lanes General Information & Frequently Asked Questions
 The questions and answers below provide current information on the project to improve Interstate 405 (I-405) in Orange County from State Route 73 to Interstate 605. Why are improvements needed on I-405?
Washington DC Section of ITE Project Briefing
 Washington DC Section of ITE Project Briefing November 5, 2015 Renée Hamilton, VDOT, Deputy District Administrator I-66 Outside the Beltway Improvement Area Project Location Virginia 2 Purpose and Need
395 Express Lanes Extension
 395 Express Lanes Extension January 2016 Building a network of Express Lanes Project overview Add capacity on I-395 with addition of a third HOV lane and active traffic management Generate guaranteed transit
Los Angeles Congestion Reduction Demonstration (LA CRD) ExpressLanes Program National Evaluation:
 ExpressLanes Program National Evaluation:") Los Angeles Congestion Reduction Demonstration (LA CRD) ExpressLanes Program National Evaluation: Technical Memorandum on Congestion, Tolling, Transit, and Equity Results www.its.dot.gov/index.htm Final
Los Angeles Congestion Reduction Demonstration (LA CRD) ExpressLanes Program National Evaluation: Technical Memorandum on Congestion, Tolling, Transit, and Equity Results www.its.dot.gov/index.htm Final
I-105 ExpressLanes Project
 I-105 ExpressLanes Project Public Scoping Meetings March 2018 Introduction to Scoping This process is your opportunity to give us your thoughts on: The purpose and need for the proposed improvements The
ALTERNATIVES ANALYSIS EXECUTIVE SUMMARY
 West Valley Connector Corridor ALTERNATIVES ANALYSIS EXECUTIVE SUMMARY FINAL September 2014 Ontario International Airport Ontario Mills Rancho Cucamonga Metrolink Station Kaiser Permanente PARSONS EXECUTIVE
I-105 Corridor Sustainability Study (CSS)
") I-105 Corridor Sustainability Study (CSS) Metro Streets and Freeways Subcommittee March 21, 2019 Gary Hamrick Cambridge Systematics, Inc. I-105 CSS Project History & Background Funded by Caltrans Sustainable
I-105 Corridor Sustainability Study (CSS) Metro Streets and Freeways Subcommittee March 21, 2019 Gary Hamrick Cambridge Systematics, Inc. I-105 CSS Project History & Background Funded by Caltrans Sustainable
IMPACTS TO TRANSIT FROM LOS ANGELES CONGESTION REDUCTION DEMONSTRATION. Word Count: 3,386 (body) + 2,000 (8 tables) + 1,500 (6 figures) = 6,886 words
 + 2,000 (8 tables) + 1,500 (6 figures) = 6,886 words") IMPACTS TO TRANSIT FROM LOS ANGELES CONGESTION REDUCTION DEMONSTRATION TRB PAPER -0 Brian Pessaro, AICP Senior Research Associate Center for Urban Transportation Research (CUTR) University of South Florida
IMPACTS TO TRANSIT FROM LOS ANGELES CONGESTION REDUCTION DEMONSTRATION TRB PAPER -0 Brian Pessaro, AICP Senior Research Associate Center for Urban Transportation Research (CUTR) University of South Florida
EXECUTIVE SUMMARY... vii 1 STUDY OVERVIEW Study Scope Study Area Study Objectives
 Contents EXECUTIVE SUMMARY... vii 1 STUDY OVERVIEW... 1-1 1.1 Study Scope... 1-1 1.2 Study Area... 1-1 1.3 Study Objectives... 1-3 2 EXISTING CONDITIONS... 2-1 2.1 Existing Freeway Conditions... 2-4 2.1.1
July 10, :00-11:30 a.m.
 July 10, 2012 10:00-11:30 a.m. 1. Welcome and Self Introductions 2. Briefing on 10 & 110 Metro ExpressLanes Stephanie Wiggins, Executive Officer, ExpressLanes Demo Project, Metro Metro ExpressLanes is
Operational Comparison of Transit Signal Priority Strategies
 Operational Comparison of Transit Signal Priority Strategies Revision Submitted on: November, 0 Author: Adriana Rodriguez, E.I Assistant Engineer Parsons Brinckerhoff 0 South Orange Avenue, Suite 00 Orlando,
MnPASS System Today and the Future
 MnPASS System Today and the Future April 2010 By Nick Thompson Minnesota Department of Transportation Topics Minnesota s Current and Future MnPASS High Occupancy Toll Systems Overview of the MnPASS System
4. ENVIRONMENTAL IMPACT ANALYSIS 9. TRANSPORTATION AND TRAFFIC
 4. ENVIRONMENTAL IMPACT ANALYSIS 9. TRANSPORTATION AND TRAFFIC 4.9.1 INTRODUCTION The following section addresses the Proposed Project s impact on transportation and traffic based on the Traffic Study
Managed Lanes: A Popular and Effective Urban Solution. Ed Regan Presented by Susan Buse
 Managed Lanes: A Popular and Effective Urban Solution Ed Regan Presented by Susan Buse Overview of Managed Lanes First ML: SR 91 Orange County, CA 1996 Today About 23 Operating Projects in 9 States Basic
South King County High-Capacity Transit Corridor Study
 HIGH-CAPACITY TRANSIT CORRIDOR STUDY South King County Corridor South King County High-Capacity Transit Corridor Study Corridor Report August 2014 South King County High Capacity Transit Corridor Report
Preliminary Transportation Analysis
 Preliminary Transportation Analysis Goals of a Robust, Multimodal Transportation Network Safe Accessible/Connected Efficient Comfortable Context-Sensitive Motor Vehicle: Continue to analyze the data to
The I-680 Southbound Express Lane
 The I-680 Southbound Express Lane ALAMEDA County Transportation Commission FY2014-15 Annual Report SUNOL SMART CARPOOL LANE JOINT POWERS AUTHORITY Table of Contents Message from the Chair...3 I-680 Southbound
August 12, The Honorable Edmund G. Brown Jr. Governor, State of California State Capitol Sacramento, CA Dear Governor Brown:
 August 12, 2014 The Honorable Edmund G. Brown Jr. Governor, State of California State Capitol Sacramento, CA 95814 Dear Governor Brown: The (VTA) supports AB 1720 (Bloom) and respectfully requests that
INTRODUCTION. The focus of this study is to reduce congestion and improve mobility for all modes of transportation. Figure ES-1 Study Corridor Map
 INTRODUCTION The I-280 Corridor Study is a highway planning study led by Santa Clara VTA, in partnership with the City of Cupertino and in coordination with other stakeholders in the study area. The study
Priced Managed Lanes in America. October 2013
 Priced Managed Lanes in America October 2013 1 Priced Managed Lanes What are they? Where are they? Why do them? When to do them? Common issues Lessons learned What are Priced Managed Lanes? The subset
Transportation Master Plan Advisory Task Force
 Transportation Master Plan Advisory Task Force Network Alternatives & Phasing Strategy February 2016 BACKGROUND Table of Contents BACKGROUND Purpose & Introduction 2 Linking the TMP to Key Council Approved
DRAFT. The HOV/HOT Alternative: Working Paper #3
 Portland Area Mainline Needs Assessment DRAFT The HOV/HOT Alternative: Working Paper #3 The feasibility of an HOV/HOT lane on the Maine Turnpike HNTB Corporation Original: April 2018 Revised: June 2018
The I-85 Express Lanes Project NASCIO Recognition Award Nomination
 The I-85 Express Lanes Project 2012 NASCIO Recognition Award Nomination Submitting Agency: State Road and Tollway Authority Nomination Category: Information Communications Technology Contact: Malika Reed
Managed Lanes. Steve Schilke, P.E. Major Projects Unit Head District 1. Illinois Traffic Engineering and Safety Conference October 2016
 Managed Lanes Steve Schilke, P.E. Major Projects Unit Head District 1 Illinois Traffic Engineering and Safety Conference October 2016 Agenda Managed Lanes Projects I-55 (Stevenson Expressway) Express Toll
Tolling Study. July 23, 2009
 Eastside Corridor Tolling Study Interagency Working Group July 23, 2009 1 Welcome Craig Stone Director of WSDOT Toll Division 2 Agenda Introductions/Roles & Responsibilities Meeting Goals Express Toll
Congestion Reducing Activities. Toby Carr GDOT Director of Planning April 10, 2014
 Congestion Reducing Activities Toby Carr GDOT Director of Planning April 10, 2014 GDOT Performance Dashboard Congestion Congestion Relief Strategies 511 HEROS RTOP Highway Emergency Response Operators
An Easier Commute. Learn how to use I-77 Express to save you time.
 An Easier Commute Learn how to use I-77 Express to save you time PUBLIC-PRIVATE PARTNERSHIP I-77 Express is the first-ever toll lane public-private partnership with NCDOT I-77 Mobility Partners is financing,
Purpose and Need. Chapter Introduction. 2.2 Project Purpose and Need Project Purpose Project Need
 Chapter 2 Purpose and Need 2.1 Introduction The El Camino Real Bus Rapid Transit (BRT) Project (Project) would make transit and other transportation improvements along a 17.6-mile segment of the El Camino
Planning Committee STAFF REPORT March 7, 2018 Page 2 of 4 The following MTSOs are being used across the five subregions: Intersection Level of Service
 Planning Committee STAFF REPORT Meeting Date: March 7, 2018 Subject Summary of Issues Recommendations Financial Implications Options Attachments Changes from Committee Review Draft 2017 Multimodal Transportation
PRELIMINARY DRAFT FIRST AMENDMENT TO VISION 2050: A REGIONAL LAND USE AND TRANSPORTATION PLAN FOR SOUTHEASTERN WISCONSIN
 PRELIMINARY DRAFT FIRST AMENDMENT TO VISION 2050: A REGIONAL LAND USE AND TRANSPORTATION PLAN FOR SOUTHEASTERN WISCONSIN ESTABLISHING TARGETS FOR FEDERAL PERFORMANCE MEASURES: HIGHWAY SAFETY SOUTHEASTERN
APPENDIX S REVISED PAGES OF THE SUPPLEMENTAL TRAFFIC IMPACT ANALYSIS
 APPENDIX S REVISED PAGES OF THE SUPPLEMENTAL TRAFFIC IMPACT ANALYSIS The capacity of the toll plaza was estimated based on data from numerous studies as well as traffic counts conducted at the toll plaza
November 14, Dulles To DC Loop Public-Private Partnership Proposal. Executive Summary
 November 14, 2005 Dulles To DC Loop Public-Private Partnership Proposal Executive Summary Virginia Mobility Associates LLC, a newly established single purpose entity, proposes to privately finance the
101 Corridor Managed Lanes
 101 Corridor Managed Lanes TA BOD Meeting May 5, 2016 Agenda Item 11a Presentation Outline 101 Corridor Profile System Deficiencies Background Managed Lanes Proposed Purpose and Need Alternatives Under
A Federal Perspective on Congestion Pricing. Wayne Berman Federal Highway Administration July 8, 2010
 A Federal Perspective on Congestion Pricing Wayne Berman Federal Highway Administration July 8, 2010 Overview Background on Congestion Pricing Benefits and Experiences of Pricing Case Study Miami I-95
WHAT IFS: Over the course of
 WHAT IFS: Over the course of the 422plus Project certain questions have arisen multiple times at meetings, briefings and on-line at the website. Most of these questions start with WHAT IF. WHAT IF vehicle
Capital Beltway HOT Lanes - Frequently Asked Questions
 Capital Beltway HOT Lanes - Frequently Asked Questions December 20, 2007 1. What is the cost of the project? The fixed-price design-build cost is approximately $1.4 billion. 2. Why have the project costs
TRANSIT & NON-MOTORIZED PLAN DRAFT FINAL REPORT Butte County Association of Governments
 1 INTRODUCTION Maintaining a high quality of life is the essence of this plan for transit and non-motorized transportation in Butte County. Curbing greenhouse gas emissions (GHG) by reducing congestion,
ROUTES 55 / 42 / 676 BUS RAPID TRANSIT LOCALLY PREFERRED ALTERNATIVE
 ROUTES 55 / 42 / 676 BUS RAPID TRANSIT LOCALLY PREFERRED ALTERNATIVE April, 2012 1 INTRODUCTION The need for transit service improvements in the Routes 42/55/676 corridor was identified during the Southern
Memorandum. Fund Allocation Fund Programming Policy/Legislation Plan/Study Capital Project Oversight/Delivery Budget/Finance Contract/Agreement Other:
 Memorandum Date: November 20, 2017 To: Transportation Authority Board From: Eric Cordoba Deputy Director Capital Projects Subject: 12/5/17 Board Meeting: San Francisco Freeway Corridor Management Study
Managed Lanes: A National Perspective Managed Lane Strategies
 Managed Lanes: A National Perspective Managed Lane Strategies Use the following control strategies to manage a lane(s) to provide a reliable transportation option: Eligibility/occupancy Access control
Toll Rate Public Hearing
 Toll Rate Public Hearing I-77 Express Toll Rate Hearing September 13, 2018 AGENDA AND HOUSEKEEPING Speaker Signup Bathrooms/Exits Facebook Live Introductions Thanks and Recognition 6:30-6:35 6:35-6:55
LOOP 360 IMPROVEMENT STUDY
 LOOP 360 IMPROVEMENT STUDY Overview and Preliminary Analysis August 2015 1 STUDY PROCESS 2 Study Background Loop 360 serves a wide range of users, including residents, businesses, bicyclists, and commuters
Contemporary Approaches in Congestion Pricing:
 Contemporary Approaches in Congestion Pricing: Lessons Learned from the National Evaluation of Congestion Pricing Strategies at Six Sites August 2015 FHWA-JPO-2015-217 Office of the Assistant Secretary
Proposed. City of Grand Junction Complete Streets Policy. Exhibit 10
 Proposed City of Grand Junction Complete Streets Policy Exhibit 10 1 City of Grand Junction Complete Streets Policy Vision: The Complete Streets Vision is to develop a safe, efficient, and reliable travel
Transit Operations in the I-95 Express Lanes
 Transit Operations in the I-95 Express Lanes TRB 15 th International Conference on Managed Lanes Miami, Florida Presented by Diane Quigley FDOT Transit Planning Administrator May 5, 2016 FDOT Governance
North Coast Corridor:
 North Coast Corridor: Connecting People, Transportation & Environment Legislative Hearing: 11.8.10 1 North Coast Corridor Region s Lifeline A Regional Strategy Mobility, Economy & Environment North Coast
Highway 17 Transportation Improvement Study
 Final Report Highway 17 Transportation Improvement Study prepared for Santa Cruz County Regional Transportation Commission (SCCRTC) prepared by Planning and Engineering, Inc. 1155 North First Street, Suite
Highway 217 Corridor Study. Phase I Overview Report
 Highway 217 Corridor Study Phase I Overview Report November 3, 24 BACKGROUND AND OVERVIEW Study purpose The Highway 217 Corridor Study is developing multi-modal transportation solutions for traffic problems
I-66 Corridor Improvements Route 15 to I-495. November 2014
 I-66 Corridor Improvements Route 15 to I-495 November 2014 I-66 Corridor: Haymarket to the Beltway = Park and Ride Lots 2 Purpose and Need Improve multimodal mobility along the I-66 corridor by providing
What are Managed Lanes?
 Express Lanes What are Managed Lanes? Highway facilities or a set of lanes where operational strategies are proactively implemented and managed in response to changing conditions. http://ops.fhwa.dot.gov/freewaymgmt/managedlanesvideo/index.htm
Highway 111 Corridor Study
 Highway 111 Corridor Study June, 2009 LINCOLN CO. HWY 111 CORRIDOR STUDY Draft Study Tea, South Dakota Prepared for City of Tea Sioux Falls Metropolitan Planning Organization Prepared by HDR Engineering,
The Future of All Electronic Tolling Brian Patno Raytheon ITS Texas October 26, 2012
 The Future of All Electronic Tolling Brian Patno Raytheon ITS Texas October 26, 2012 Copyright 2012 Raytheon Company. All rights reserved. Customer Success Is Our Mission is a registered trademark of Raytheon
Overview of 64 Express Lanes. Secretary of Transportation Aubrey Layne April 12, 2017
 Overview of 64 Express Lanes Secretary of Transportation Aubrey Layne April 12, 2017 2 More Choices for Motorists Coming December 2017 Purpose and Use Our purpose is two-fold: Reduce congestion by making
METHODOLOGY. Signalized Intersection Average Control Delay (sec/veh)
") Chapter 5 Traffic Analysis 5.1 SUMMARY US /West 6 th Street assumes a unique role in the Lawrence Douglas County transportation system. This principal arterial street currently conveys commuter traffic
Chapter 5 Traffic Analysis 5.1 SUMMARY US /West 6 th Street assumes a unique role in the Lawrence Douglas County transportation system. This principal arterial street currently conveys commuter traffic
Managed Lanes Fundamentals and Opportunities. September 12, 2013
 Managed Lanes Fundamentals and Opportunities September 12, 2013 What are managed lanes? What are managed lanes? Specialized lanes rather than general purpose Synonym for high occupancy toll (HOT) lanes
5.0 Roadway System Plan
 Southwest Boise Transportation Study Page 16 5.0 Roadway System Plan The Roadway System Plan outlines roadway improvements in the Initial Study Area. It forecasts future deficiencies on the arterial system,
Transform 66 Project February 4, 2016 Partnering Conference Michigan Department of Transportation American Council of Engineering Companies
 Transform 66 Project February 4, 2016 Partnering Conference Michigan Department of Transportation American Council of Engineering Companies Susan Shaw, PE, CCM, DBIA Megaprojects Director Northern Virginia
DULLES AREA TRANSPORTATION ASSOCIATION (DATA) February 18, Susan Shaw, P.E., VDOT, Megaprojects Director
 February 18, Susan Shaw, P.E., VDOT, Megaprojects Director") DULLES AREA TRANSPORTATION ASSOCIATION (DATA) February 18, 2015 Susan Shaw, P.E., VDOT, Megaprojects Director I-66 Corridor Conditions Steady population growth Employment growth in activity centers Congestion
DULLES AREA TRANSPORTATION ASSOCIATION (DATA) February 18, 2015 Susan Shaw, P.E., VDOT, Megaprojects Director I-66 Corridor Conditions Steady population growth Employment growth in activity centers Congestion
I-15 Comprehensive Corridor Study. Final Report
 I-15 Comprehensive Corridor Study Final Report Southern California Association of Governments (SCAG) San Bernardino Associated Governments (SANBAG) Prepared by: California Department of Transportation
Improving Mobility Without Building More Lanes
 Improving Mobility Without Building More Lanes By Mike Salisbury and Will Toor July 2017 Copyright 2017 by Southwest Energy Efficiency Project. All rights reserved. Photo: Courtesy of the Denver Post Anyone
Appendix 1 Transit Network Analysis
 Appendix 1 Transit Network Analysis APPENDIX 1 TRANSIT NETWORK ANALYSIS The purpose of this appendix is to provide an update on the transit network analysis as it pertains to: i. SmartTrack ii. Scarborough
APPENDIX G: INTERSECTION NEEDS AT OKEECHOBEE BOULEVARD
 APPENDIX G: INTERSECTION NEEDS AT OKEECHOBEE BOULEVARD INTERSECTION NEEDS AT SR 7 and OKEECHOBEE BOULEVARD SR 7 Extension Project Development and Environment (PD&E) Study From Okeechobee Boulevard (SR
Arterial Transitway Corridors Study. Ave
 Arterial Transitway Corridors Study Ave January 2012 Arterial Transitway Corridors Study Overview Corridor Features and Demographics 11 study corridors, 95 route miles 86,000 daily rides and half of existing
Magnolia Place. Traffic Impact Analysis. Prepared for: City of San Mateo. Prepared by: Hexagon Transportation Consultants, Inc.
 Magnolia Place Traffic Impact Analysis Prepared for: City of San Mateo Prepared by: Hexagon Transportation Consultants, Inc. Updated January 4, 2010 Table of Contents 1. Introduction...1 2. Existing Conditions...6
WELCOME TO OPEN HOUSE # 1 June 14, 2017
 Langstaff Road Weston Road to Highway 7 Class Environmental Assessment Study WELCOME TO OPEN HOUSE # 1 June 14, 2017 Please sign in and join our mailing list Purpose of Open House #1 & Study Area York
7.0 FREEWAYS CONGESTION HOT SPOT PROBLEM & IMPROVEMENT PROJECT ANALYSIS & DEFINITION
 7.0 FREEWAYS CONGESTION HOT SPOT PROBLEM & IMPROVEMENT PROJECT ANALYSIS & DEFINITION 7.1 INTRODUCTION & METHODOLOGY FEASIBILITY REPORT Congestion hot spot problem locations have been assessed using the
TABLE OF CONTENTS FEASIBILITY REPORT
 TABLE OF CONTENTS 1.0 Executive Summary... 1 2.0 Introduction... 6 2.1 BACKGROUND... 6 2.2 PURPOSE OF STUDY... 7 2.3 STUDY AREA... 8 2.4 STUDY PROCESS / STAKEHOLDER INVOLVEMENT... 8 3.0 Summary of Freeways
CITY OF COCOA BEACH 2025 COMPREHENSIVE PLAN. Section VIII Mobility Element Goals, Objectives, and Policies
 CITY OF COCOA BEACH 2025 COMPREHENSIVE PLAN Section VIII Mobility Element Goals, Objectives, and Policies Adopted August 6, 2015 by Ordinance No. 1591 VIII MOBILITY ELEMENT Table of Contents Page Number
Arlington County 10-Year Transit Development Plan & Premium Transit Network Briefing. May 2016
 Arlington County 10-Year Transit Development Plan & Premium Transit Network Briefing May 2016 Overview 10-Year Transit Development Plan Premium Transit Network Columbia Pike service concept Premium amenities
Regional Transportation Needs Within Southeastern Wisconsin
 Regional Transportation Needs Within Southeastern Wisconsin #118274 May 24, 2006 1 Introduction The Southeastern Wisconsin Regional Planning Commission (SEWRPC) is the official areawide planning agency
CITY OF ALPHARETTA DOWNTOWN MASTER PLAN TRAFFIC EVALUATION
 CITY OF ALPHARETTA DOWNTOWN MASTER PLAN TRAFFIC EVALUATION June 2015 CITY OF ALPHARETTA DOWNTOWN MASTER PLAN TRAFFIC EVALUATION Introduction The Alpharetta Downtown Master Plan was developed in the fall
PERFORMANCE ANALYSIS of The Draft 2015 CLRP
 Item 9 PERFORMANCE ANALYSIS of The Draft CLRP Presentation to the Transportation Planning Board September 16, CLRP Performance Analysis 1 What is the Long-Range Transportation Plan (CLRP)? The CLRP identifies
1.221J/11.527J/ESD.201J TRANSPORTATION SYSTEMS FALL 2003 FINAL EXAMINATION. 1. Open-book and open-notes, calculators are fine -- no laptops.
 1.221J/11.527J/ESD.201J TRANSPORTATION SYSTEMS FALL 2003 FINAL EXAMINATION Instructions: PROFESSOR JOSEPH M. SUSSMAN (LECTURER) 1. Open-book and open-notes, calculators are fine -- no laptops. 2. The exam
Public Hearing Tarrant County. October 11 th, 2012
 Public Hearing Tarrant County October 11 th, 2012 Public Hearing Agenda Welcome and Project Overview Ms. Maribel P. Chavez, P.E. District Engineer Texas Department of Transportation Fort Worth District
Corridor Advisory Group and Task Force Meeting #10. July 27, 2011
 Corridor Advisory Group and Task Force Meeting #10 July 27, 2011 1 Agenda Recap CAG/TF #9 Public Meeting #2 Summary Single Mode Alternatives Evaluation Results Next Steps 2 3 CAG/TF #9 Recap CAG /TF #9
Basalt Creek Transportation Refinement Plan Recommendations
 Basalt Creek Transportation Refinement Plan Recommendations Introduction The Basalt Creek transportation planning effort analyzed future transportation conditions and evaluated alternative strategies for
High Occupancy Toll Lanes Potential for Implementation in the Atlanta Region
 High Occupancy Toll Lanes Potential for Implementation in the Atlanta Region Atlanta HOT Lanes Study Final Report Prepared by: Parsons, Brinckerhoff, Quade & Douglas, Inc. A Member of the Parsons Brinckerhoff
MoPac South: Impact on Cesar Chavez Street and the Downtown Network
 MoPac South: Impact on Cesar Chavez Street and the Downtown Network Prepared by: The University of Texas at Austin Center for Transportation Research Prepared for: Central Texas Regional Mobility Authority
Performance Criteria for 2035 Long Range Transportation Plan
 Minimizing Impacts on Natural, Historic, Cultural or Archeological Resources 2035 LRTP Weighting Factor: 7% Objective 1.1: Use appropriate planning and design criteria to protect and enhance the built
Santa Clara I-280 CORRIDOR STUDY
 Santa Clara I-280 CORRIDOR STUDY OCTOBER 2017 PREPARED BY: 1.1 Background The I-280 Corridor Study within Santa Clara County is a high-level highway planning study led by the Santa Clara VTA, in partnership
TABLE TRAFFIC ANALYSIS SCENARIOS
 4.11 TRANSPORTATION The potential traffic impacts of the proposed project are evaluated in the Buena Park Beach/Orangethorpe Mixed Use Project Traffic Analysis (Traffic Analysis) by Austin-Foust Associates
3 ROADWAYS 3.1 CMS ROADWAY NETWORK 3.2 TRAVEL-TIME-BASED PERFORMANCE MEASURES Roadway Travel Time Measures
 ROADWAYS Approximately 6 million trips are made in the Boston metropolitan region every day. The vast majority of these trips (80 to percent, depending on trip type) involve the use of the roadway network
I-395 Express Lanes Northern Extension Project Crystal City Civic Association September 21, 2016
 I-395 Express Lanes Northern Extension Project Crystal City Civic Association September 21, 2016 Mike Snare, PE, Project Manager Virginia Department of Transportation GEC Michelle Holland, Megaprojects
I-635 LBJ EAST PROJECT
 635 I-635 LBJ EAST PROJECT Transportation and Trinity River Project Committee 9 June 2014 TxDOT Dallas District Dallas County, Texas CSJ: 2374-01-137, 2374-02-053 Agenda I-635 LBJ East Project Overview
Appendix B: Forecasting and Traffic Operations Analysis Framework Document
 Existing Conditions Report - Appendix Appendix B: Forecasting and Traffic Operations Analysis Framework Document This document defines the methodology and assumptions that will be used in the traffic forecasting
Scottsdale Road/Rural Road Alternatives Analysis (AA) Study. Arizona ITE/IMSA Spring Conference March 7, 2012
 Study. Arizona ITE/IMSA Spring Conference March 7, 2012") Scottsdale Road/Rural Road Alternatives Analysis (AA) Study Arizona ITE/IMSA Spring Conference March 7, 2012 Study Location and Duration Primary Study Corridor (major focus of effort) Rural Road and Scottsdale
Scottsdale Road/Rural Road Alternatives Analysis (AA) Study Arizona ITE/IMSA Spring Conference March 7, 2012 Study Location and Duration Primary Study Corridor (major focus of effort) Rural Road and Scottsdale
Appendix A-2: Screen 1 Alternatives Report
 Appendix A-2: Screen 1 Alternatives Report SCREEN 1 ALTERNATIVES REPORT Western & Ashland Corridors Bus Rapid Transit (BRT) Project Prepared for Chicago Transit Authority 567 West Lake Street Chicago,
CENTRAL AND EAST CORRIDORS
 HIGH-CAPACITY TRANSIT STUDY CENTRAL AND EAST CORRIDORS SEPTEMBER 2014 CORRIDOR REPORT: I-405 BUS RAPID TRANSIT HIGH-CAPACITY TRANSIT CORRIDOR STUDY I-405 Bus Rapid Transit Corridor Sound Transit Central/East
Berkeley Strategic Transportation Plan A-76
 Berkeley Strategic Transportation Plan A-76 Appendices 1. A Team Effort 2. Where We ve Been A-11 Berkeley Strategic Transportation Plan Alameda County Transportation Plan Alameda County will be served
Project Report. South Kirkwood Road Traffic Study. Meadows Place, TX October 9, 2015
 Meadows Place, TX October 9, 2015 Contents 1 Introduction... 1 2 Data Collection... 1 3 Existing Roadway Network... 2 4 Traffic Volume Development... 2 5 Warrant Analysis... 3 6 Traffic Control Alternative
Rochester Area Bike Sharing Program Study
 roc bike share Rochester Area Bike Sharing Program Study Executive Summary ~ January 2015 JANUARY 2015 8484 Georgia Avenue, Suite 800 Silver Spring, MD 20910 3495 Winton Pl., Bldg E, Suite 110 Rochester,
Sketch Level Assessment. of Traffic Issues. for the Fluor Daniel I-495 HOT Lane Proposal. Ronald F. Kirby
 Sketch Level Assessment of Traffic Issues for the Fluor Daniel I-495 HOT Lane Proposal Ronald F. Kirby Director of Transportation Planning National Capital Region Transportation Planning Board (TPB) Metropolitan
Program Update. Relationship: RP, RTIP, Budget, POF. Board of Directors Item 16 February 22, Board of Directors Item 16 Feb 22,
 Program Update Board of Directors Item 16 February 22, 2019 Relationship: RP, RTIP, Budget, POF 2019 2020 2025 2030 2035 2040 2045 2050 Contains ten-year capital program budget 2 Board of Directors Item
Silicon Valley Express Lanes Program. Implementation Assessment and Plan. November 21, 2008
 Silicon Valley Express Lanes Program Implementation Assessment and Plan November 21, 2008 Table of Contents 1. Executive Summary... 5 1.1. What is an Express Lane?... 5 1.2. Why Implement an Express Lane
MCTC 2018 RTP SCS and Madera County RIFP Multi-Modal Project Eval Criteria GV13.xlsx
 MCTC 8 RTP SCS and Madera County RIFP Multi-Modal Project Eval Criteria GV.xlsx Madera County Transportation Commission Regional Transportation Plan / Sustainable Communities Strategy Multi-Modal Project
4 Level of Service Results: HOV and Express Lanes
 4 Level of Service Results: HOV and Express Lanes Considering the importance of managed lanes (such as HOV and express lanes) in improving the overall performance of a corridor, Alameda CTC started monitoring
GIVING GEORGIANS A CHOICE TO KEEP MOVING
 GIVING GEORGIANS A CHOICE TO KEEP MOVING I-85 Express Lanes Annual Performance Report FISCAL YEAR 2014 (JULY 1, 2013 JUNE 30, 2014) EEP OVING VISION AND MISSION Enhancing mobility in Georgia by providing
Interim Transit Ridership Forecast Results Technical Memorandum
 Interim Transit Ridership 401 South Jackson Street Seattle, WA 98104-2826 September 2012 Table of Contents 1 INTRODUCTION... 1-1 1.1 Project Background... 1-1 2 RIDERSHIP FORECASTS... 2-1 2.1 System Ridership
Clackamas County Comprehensive Plan
 ROADWAYS The County s road system permits the movement of goods and people between communities and regions, using any of a variety of modes of travel. Roads provide access to virtually all property. They