PAGE San Francisco State of Cycling Report
|
|
|
- Felix Cameron
- 6 years ago
- Views:
Transcription

1 PAGE San Francisco State of Cycling Report Cover image: Photo of bicyclists and a light rail vehicle on the Third Street corridor Image: SFMTA logo

2 PAGE 2. Edwin M. Lee Mayor City and County of San Francisco Board of Supervisors John Avalos District 11 David Campos District 9 David Chiu District 3 Carmen Chu District 4 Malia Cohen District 10 Sean Elsbernd District 7 Mark Farrell District 2 Jane Kim District 6 Eric Mar District 1 Christina Olague District 5 Scott Wiener District 8 Image: Mom and child on bikes with dad holding coffee on Fulton Street with City Hall in the background
3 PAGE 3. San Francisco Municipal Transportation Agency The San Francisco Municipal Transportation Agency (SFMTA) is responsible for the planning, implementation, regulation, maintenance and operation of the multimodal transportation system in the City and County of San Francisco. The city s transportation system includes public transit, paratransit, streets, bicycle and pedestrian facilities, parking, signals, traffic controls, and taxi services. Board of Directors Tom Nolan Chairman Jerry Lee Vice-Chairman Leona Bridges Cheryl Brinkman Malcolm Heinicke Joél Ramos Cristina Rubke Director of Transportation Edward Reiskin SFMTA Sustainable Streets Staff Peter Brown, State of Cycling Project Manager Matt Lasky, Co-Author Bond Yee Timothy Papandreou Darton Ito Anne Fritzler Bridget Smith Seleta Reynolds Craig Raphael Survey Consultant Corey, Canapary & Galanis This report is made possible by the San Francisco County Transportation Authority through a grant of Proposition K Local Transportation Sales Tax Funds.

4 PAGE 4. Image: San Francisco County Transportation Authority Logo
5 PAGE 5. Executive Summary The City and County of San Francisco is a national leader in bicycle ridership, innovative cycling infrastructure, greenhouse gas reductions and active living. Cities around the world are investing in sustainable transportation systems and have realized the critical role that bicycling plays in promoting mobility, creating healthy lifestyles, reducing traffic congestion, saving money and generating economic activity. Bicycling gets people where they need to go efficiently and is arguably the most fun way to move about any city. San Francisco has a high number of trips taken via public transit (20%) and walking (17%). However, bicycling (3.5%) has the potential to significantly grow the sustainable transport mode share. The San Francisco Municipal Transportation Agency (SFMTA) has adopted strong goals through its Strategic Plan to decrease automobile trips and envisions bicycling trips rising two to three fold in the near term. The state of cycling today shows significant progress in making San Francisco a better city. This report on bicycling demonstrates where the city is and where it s headed. The SFMTA s 2012 State of Cycling Report benchmarks bicycle volumes, bicycle safety and opinions about bicycle riding in San Francisco. As demonstrated in the 2011 Bicycle Count Report, volumes have continued to steadily increase from about 2.1% of all trips in 2005 to 3.5% of all trips in 2011, approaching 75,000 bike trips per day in the city. The counts also reveal a steady annual rise in observed cyclists on most all of the city s main routes. The bicycle safety data and public opinion surveys conducted in 2011 demonstrate an overall improvement for bicycling. The SFMTA attributes this to the growing popularity of bike travel nationwide, continued public outreach, bicycle education and expansion of key infrastructure projects within the bicycle network. Other factors contributing to these changes could be economic, such as employment rates and changes in gas, parking and toll prices.
6 PAGE 6. In Box: Key findings in San Francisco s 2012 State of Cycling Report Bicycle Volumes The US Census Bureau s American Community Survey (ACS) shows a 66% increase in bicycle commuters from 2002 (2.1% of work trips) to 2010 (3.5% of work trips), putting San Francisco third in the nation behind Portland, Oregon (6%) and Seattle, Washington (3.5%) in ridership among major US cities. Annual bicycle counts have more than doubled between 2006 (4,862 riders) and 2011 (10,139) at sampled locations. Two statistically significant random surveys of San Francisco residents during 2011 show that about 3.5% of all trips in the city are taken by bicycle, demonstrating that the ACS, local surveys and bike counts all corroborate one another to show steady increases in cycling. Local surveys and traffic modeling estimates show about 75,000 bike trips each day out of over two million total trips by all modes. San Francisco has a relatively high share of residents who bicycle at least occasionally 34% take at least one trip per year on their bike, and 17% take at least one trip per week by bicycle. However, two-thirds of San Franciscans (66%) never use a bicycle at all. Bicycle Safety The ratio of bicycle trips to bicycle collisions remains constant. Unsafe bicycle riding behaviors (sidewalk bicycle riding and wrong-way bicycle riding) remain infrequent overall and take place on roadways that are deficient in proper facilities.
 is the work trip. Infrequent riders (<3 times a week) are more apt to bike for recreational purposes.")
7 PAGE 7. Public Opinions about Bicycling San Francisco residents bicycle to exercise, improve the environment and to enjoy the outdoors. The most common trip purpose for frequent riders (3+ times a week) is the work trip. Infrequent riders (<3 times a week) are more apt to bike for recreational purposes. Many people do not ride because they are uncomfortable riding with cars. People believe that existing bikeways in the city are well-marked and are easy to access. Residents feel most comfortable bicycling on bikeways physically separated from cars and in standard, striped bicycle lanes (Class II facilities) Bicycling Behavior Behavior Percentage Legal Riding 94% Sidewalk Riding 2% Wrong-Way Riding 1% Wrong-Way Sidewalk Riding 3%

8 PAGE 8. Like the 2008 State of Cycling report, the 2012 report provides guidance on bicycling improvement programs and infrastructure investments. The SFMTA is continuing to improve the bicycle network with limited resources, focusing on bicycle safety and continuing outreach to residents. However, there are areas for improvement to better accommodate people riding bicycles and to increase bicycle trips, especially by infrequent users and non-cyclists. One such program is early education through school programs. Others involve creating new and innovative cycling facilities, traffic calming, cycle-track network development, secure bike parking and a set of public policies designed to make cycling faster, cheaper, and safer than alternatives. Call-out quote: The bicycle is the most civilized conveyance known to man. Other forms of transport grow daily more nightmarish. Only the bicycle remains pure in heart. -Iris Murdoch, The Red and the Green

9 PAGE 9. Image: Bicyclist in Chinatown with Cable Car in the background

10 PAGE 10. Table of Contents Section Page Executive Summary 5 Introduction Purpose, National Leader, Growing Mode Share, Innovative Facilities, &Bike Score 11 Bicycle Volumes 26 Manual Counts & American Community Survey Bicycle Safety Trends 38 Historial Collisions & Unsafe Behaviors 2011 Bicycle Surveys 44 Phone Survey, Intercept Survey & Who is Riding in San Francisco? Improvements for the Future 65 Bicycle Programs & Infrastructure Conclusion 74 Image: Stencil of a bike sharrow on pavement Call-out quote: When I see an adult on a bicycle, I do not despair for the future of the human race. H.G. Wells
11 PAGE 11. Introduction Over the past decade, the number of people bicycling in San Francisco has increased substantially. The SFMTA 2011 Bicycle Count Report, released in December of 2011, contains a comprehensive look at volumes and ridership changes since 2006, including count methodology, locations, manual and automatic tallies. Annual bicycle counts have shown steady increases of bicyclists since 2006, totalling 71% more ridership over the five year span. During 2010 s Bike to Work Day, over 600 bicycles were counted compared to 330 automobiles on Market Street between 8 and 9 a.m. The Bike to Work Day count taken at Van Ness Avenue and Market Street in 2012 showed a total of 1,031 bicycles, compared to 362 automobiles. This is an increase of 54 percent over a similar count by the SFMTA just one month prior. Bicycle use has increased on roadways where the city has installed bicycle lanes including Valencia Street, Polk Street and Fell Street. 1 This data corresponds to that of the American Community Survey, which reported an overall increase in bicycle commuters in San Francisco from 2.1% 2005 to 3.5% in The SFMTA recognizes and supports the increased popularity of bicycling and the associated economic, environmental, health and transportation benefits. At the same time, the agency is committed to growing the bicycling mode share while increasing safety and decreasing road user conflicts as more people begin to bicycle more frequently. This 2012 State of Cycling Report provides a snapshot of bicycling in San Francisco since the first State of Cycling Report in Some of the results are comparable across the two reports, providing an analysis of progress the SFMTA has made since This report also addresses ways that the SFMTA can increase safe bicycling in the future. 1 See evaluation reports for these three streets on the San Francisco Municipal Transportation Agency s website:
12 PAGE 12. State of Cycling Purpose This second State of Cycling Report gives a benchmark for bicycling in San Francisco. It provides an analysis of bicycling from information gathered via bicycle counts and surveys conducted between 2008 and 2011, as well as historical bicycle collision data. Comparing changes in data, it responds to the following questions: What trends in bicycle safety can be identified? How often do people bicycle? Who is bicycling and who is not? What motivates people to bicycle? What differences exist between people who bicycle and people who do not? What barriers prevent people from bicycling? How satisfied are bicyclists with bicycle infrastructure? How safe and comfortable do people feel when bicycling? How well do bicyclists and motorists share the road? How effective are the SFMTA s bicycle outreach programs? The 2008 State of Cycling Report was San Francisco s first bicycle benchmarking report. It included results from the SFMTA s annual bicycle counts and a citywide survey effort, providing recommendations and plans for future San Francisco bicycling reports. The 2012 State of Cycling Report establishes a new benchmark while providing an opportunity for comparison with results compiled from the 2008 report. It includes updated count information, bicycle collision trends and results from a new opinion survey. The 2012 State of Cycling Report also assembles information from the SFMTA s 2011 bicycle count and collision reports as well as the results from the opinion survey. The survey was conducted in 2011 and includes the opinions of bicyclists and non-bicyclists regarding bicycling in San Francisco.

13 PAGE 13. Image: Cover of 2008 San Francisco State of Cycling Report. Shows two cyclists with Golden Gate Bridge in Background and SFMTA logo.

14 PAGE 14. National Leader in Bicycling San Francisco supports bicycling through infrastructure development and maintenance, public safety, education, encouragement, and enforcement programs. San Francisco is one of ten Gold Level Bicycle Friendly Communities in the U.S., as designated by the League of American Bicyclists. The League of American Bicyclists defines a Bicycle Friendly Community as a place that welcomes bicyclists by providing safe accommodation for bicycling and encouraging people to use a bicycle for transportation and recreation. Additionally, the Alliance for Biking & Walking gave high marks to San Francisco in the Bicycling and Walking in the United States 2010 Benchmarking Report. 2 San Francisco ranks in the top third among 51 cities in bicycle and pedestrian safety, funding, staffing, policies and advocacy capacity. For the percent categories of bicycling to work and bicycling safety, San Francisco ranks third among the 51 cities. 3 Finally, in comparison to the 51 other cities, San Francisco ranked second in combined miles of bicycle lanes, multi-use paths and signed bicycle routes per square mile. Call-out quote: For instance, the bicycle is the most efficient machine ever created: Converting calories into gas, a bicycle gets the equivalent of three thousand miles per gallon. -Bill Strickland, The Quotable Cyclist 2 Available online, on 12/21/ Ranking based on 2007 American Community Survey and Fatality Analysis Reporting System data.
15 PAGE 15. Transit First Policy The City and County of San Francisco recognizes bicycling as a more affordable and sustainable travel choice than the automobile and establishes this in the City Charter Transit First policy (Section 8A.115). The Transit First policy includes a series of principles that relate to bicycling and promote it as a primary mode of transportation. The principles relevant to bicycling are: Public transit, including taxis and vanpools, is an economically and environmentally sound alternative to transportation by individual automobiles. Within San Francisco, travel by public transit, by bicycle and on foot must be an attractive alternative to travel by private automobile. Decisions regarding the use of limited street and sidewalk space shall encourage the use of public rights of way by pedestrians, bicyclists and public transit, and shall strive to reduce traffic and improve public health and safety. Bicycling shall be promoted by encouraging safe streets for riding, convenient access to transit, bicycle lanes and secure bicycle parking. The City Charter states that the Department of Parking and Traffic - DPT (in 1999 DPT was incorporated into SFMTA and is now named Sustainable Streets Division) manages the department so that it: Facilitates the design and operation of city streets to enhance alternative forms of transit, such as pedestrian, bicycle and pooled or group transit (including taxis); Proposes and implements street and traffic changes that give the highest priority to impacts on public transit, pedestrians, commercial delivery vehicles and bicycles; and Develops a safe, interconnected bicycle circulation network
16 PAGE 16. Growing the Bicycle Mode Share In October 2010, the San Francisco Board of Supervisors unanimously adopted a resolution with the goal of achieving a 20% bicycle mode share by Concurrently, the SFMTA s 2013 Strategic Plan identified a mode share goal of no more than 50% of all trips by automobile. One of the outcomes of the Strategic Plan, is a series of modal strategy documents which seek to improve conditions for people who walk and bicycle in San Francisco. The current trends in transportation require a rethinking of city priorities and investments if the city is to be successful in creating more active transportation options. Decreasing transportation funding, rising fuel and transportation costs, and concerns about quality of life provide a clear challenge for San Francisco. Recognizing these trends, investing in bicycling presents an opportunity to rethink the city s transportation investments. Within the overall goal of growing bicycle mode share, there are two goals within the city that shape the recommendations of the 2012 Bike Strategy and help to contextualize the 2012 State of Cycling Report. The SFMTA s fiscal year Strategic Plan sets a goal of 50 percent of all trips for non-private auto (transit, walking, bicycling, taxi) by 2018 (an 11 percent shift away from the private auto-mode). Based on trends and funding available, up to half of this goal could be assigned to the bicycle mode resulting in a 9% mode share by This would put San Francisco s bicycle ridership higher than any major U.S. city. In 2010, the San Francisco Board of Supervisors set a goal of growing bicycle mode share in San Francisco to 20% of all trips by 2020 (a 16.5 percent growth in bicycle trips and a commensurate shift away from private auto and transit trips today).

17 PAGE 17. Innovative Bike Facilities Bicycle Parking and Bikeways Since the release of the 2008 State of Cycling Report, the SFMTA has implemented numerous bicycle projects from San Francisco s 2009 Bicycle Plan including bikeways and bicycle parking citywide. Table 1 presents the increase in facilities since In total, the SFMTA has installed approximately 1,200 additional racks on sidewalks and in bicycle corrals (with more on the way). The citywide bicycle network has also expanded to include over 65 miles of lanes and 64 miles of sharrows, and it continues to grow. Planning continues for the Oak and Fell Street bikeways and the recent opening of the John F. Kennedy Drive bikeway is another example of a new innovative bike facility put in by SFMTA in cooperation with the Recreation and Parks Department. Image: Bicycles parked at a bike rack
18 PAGE 18. Table 1: Increase in Fatalities since the 2008 State of Cycling Report Facilities Facility Type Before 2008 Since Total (%change since 2008) Racks 1,400 1,191 2,591 (81%) Bicycle Corrals (n/a) Parking Lockers 52 - (n/a) Lanes (45%) Shared Use Bikeways Path (miles) 41 - (n/a) Sharrows (178%) * Number of bicycle parking racks. Each rack/locker creates at least two bicycle parking spaces. **There are 3-8 parking racks in each corral. ***Total of 240 parking spaces available.

19 PAGE 19. Image: Cyclists on the new cycle track on John F. Kennedy Drive in Golden Gate Park. Image caption: A buffered bicycle lane is an exclusive bicycle facility within a roadway that provides a special or physical buffer from motor vehicle traffic. This buffered lane on John F. Kennedy Drive in Golden Gate Park opened in the spring of 2012.
20 PAGE 20. Pilot Projects In addition to bicycle parking, bicycle lane and sharrow projects, the SFMTA has implemented numerous innovative pilot bicycle treatments in the last four years. These treatments are the SFMTA s effort to pilot installations of bikeway facilities and technologies. Current innovations in the bikeway network include green bicycle boxes, green bicycle lanes and a bicycle green wave, described in further detail below. Green bicycle boxes have been installed at Oak and Scott streets and five have been installed on Market Street. These facilities reduce turning conflicts between bicyclists and motor vehicles at signalized intersections by providing a space for people using bicycles to queue in front of vehicles during the red signal phase. The picture to the right shows recently installed green sharrows along the Wiggle at Steiner and Waller Streets. Sharrows are on-street markings placed in the travel lane that indicate to motorists and riders that the lane is shared with people on bicycles, and that both may use the full lane. Green bicycle lanes have been installed on Market Street and Fell Street, and the SFMTA is currently seeking additional opportunities for installation at other locations. In addition to the green paint, on Market Street, flexible delineators divide the roadway, separating the vehicle and bicycle lanes. The SFMTA has also installed a dashed green bicycle lane at the intersection of Fell and Divisadero Streets. This is a conflict point between motorists and bicyclists, and the green bicycle lanes enhance safety for roadways users by alerting all travelers to use caution while proceeding. The SFMTA implemented a bicycle Green Wave on Valencia Street, allowing bicyclists to travel through green signals at 10 timed traffic lights. Along the green wave, signals are timed so bicyclists and motorists traveling at 13 miles per hour encounter green lights as they progress north or south on Valencia Street between 16th and 25th streets. Plans are also being considered for a protected bikeways on Polk Street, a commonly used north-south connector parallel to Van Ness Avenue.


21 PAGE 21. Image caption: A photo simulation of a protected bikeway at Polk and Sacramento, an idea which emerged from the Think Bike Dutch workshop. Image: A photo simulation of a protected bikeway at Polk and Sacramento, with a transit vehicle in the background and pedestrians crossing the sidewalk in the foreground, and a protected bikeway at right Call-out box: Green Bicycle Boxes: On-street markings at signalized intersections that provide space to queue and advance in front of vehicle traffic with the use of an advanced stop bar. Image: Two bicyclists wait at a bicycle box


22 PAGE 22. Sharrows/Painted Sharrows: On-street markings placed in the travel lane to indicate to motorists and riders that the lane is shared with people on bicycles, and that both may use the full lane. Image: Green sharrows painted along the Wiggle Cycle Track: An exclusive bicycle facility within the roadway that is physically separated from motor vehicle traffic through the use of bollards, car parking, barriers, or boulevards, and may have one-way or two-way operations. Image: Cyclists on a cycle track on Market Street


23 PAGE 23. Road Diet: When the number of vehicle lanes or effective width of a road is reduced in order to achieve systemic improvements, turning movements and bicycle lanes, often related to safety. Image: A road diet with a wide turning lane In addition to the pilot projects now occurring in San Francisco, the SFMTA is planning future innovative projects. These include separated cycle tracks, contra-flow protected bicycle lanes and the implementation of a 50-station bicycle sharing pilot program in cooperation with several other Bay Area jurisdictions and transit operators. Image: A bike sharing station in Washington DC
: Embarcadero,")

24 PAGE 24. Image: Map of Bicycle Sharing Pilot Service Area in Downtown San Francisco. Boundaries (starting from north end of area and moving counerclockwise): Embarcadero, Broadway, Columbus, Powell, Geary, Hyde, Market, Hayes, Polk, 11 th, Howard, 7 th, King, Embarcadero. Image: A woman with a bike next to a bike share station in Montreal, Canada.

25 PAGE 25. Bike Score (walkscore.com) Bike Score measures whether a location is good for biking on a scale from San Francisco scored 70, tied for the second highest score in the nation with Portland, OR and only a few points behind Minneapolis, MN. Bike Score is based on bike infrastructure (lanes and trails), hills, destinations and road connectivity, and the number of bike commuters. A detailed methodology is available on their website. San Francisco scored best in the destinations category, as seen in the map to the left. 1. Minneapolis, MN: Portland, OR: San Francisco, CA: Boston, MA: Madison, WI: 67 Image: A Bike Score map of San Francisco showing the most bikeable areas of the city (in green), less bikeable areas in yellow and the least bikeable areas in red. The city receives a total score of 70, or very bikeable. Generally, the eastern half of the city is considered friendly for bicycles. Twin Peaks, the Outer Sunset, the Presidio and Hunters Point are among the least bicycle-friendly neighborhoods. Icons on the bottom of the map indicate bike lanes, hills, destinations, number of bike commuters and total bike score, each of which can be displayed individually. Call-out quote: Melancholy is incompatible with bicycling. James E. Starrs
26 PAGE 26 Bicycle Volumes Manual Bicycle Counts In fall 2011, SFMTA released the Bicycle Count Report, which indicated a 71% increase in bicycling between 2006 and Drawing on regional manual bicycle counts from the Metropolitan Transportation Commission (MTC) as well as data from the city s automatic bicycle counters, the report showed an 8.5% growth rate in cycling between 2010 and 2011 (similar to SFMTA s observed growth rate of 7%). By providing data needed to inform bicycle efforts in the city and identify locations where additional infrastructure improvements are needed, the 2011 count report is a key part of the agency s commitment to grow bicycle ridership and enhance safety in the city. Call-out box: The rate of increase in bicycling between 2006 and 2011 was 71%. In an effort to improve accuracy and create a comparable data set, 2011 was a departure year from the methodology used since Changes were made in order to align with the bicycle counting standards set by the National Bicycle and Pedestrian Documentation Project (NBPDP). For instance, NBPDP counts are conducted in September when schools are back in session and summer vacations have ended. San Francisco can now compare count data with nationwide cities who also conduct bicycle counts during the same time frame. Per national bicycle count methodology, count shifts were expanded from 1.5 to 2 hours during the evening peak commute time (4:30-6:30 p.m.).


27 PAGE 27 Additionally, a dozen locations with little cycling activity over the past five years were not counted, and 18 new locations were added to capture before data for planned bicycle facilities and for popular routes such as the Golden Gate Bridge. Corridor and intersection counts capture bicycling movements in the city, and automated bicycle counters replaced manual counts at nine locations. These changes create a new baseline for future bicycle count efforts. Please refer to the 2011 report for further details. Call-out quote: Life is like riding a bicycle in order to keep your balance, you must keep moving. Albert Einstein Image: Kids and parents riding bicycles along the Embarcadero
. 2011 (Sep).")
28 PAGE 28 Figure 1: Total San Francisco Manual Bicycle Counts Trends Over the Past 6 Years Year Observed Cyclists 2006 (Aug.) 4, (Aug.) 5, (Aug.) 6, (Aug.) 7, (Aug). 7, (Aug) (Sep). 8,314 10,139 * These counts represent a sample of, not total daily ridership ** Approximately 18% of the 2011 increase (shown in red) is attributed to shifting the count from early August to late September (see Appendix C)

29 PAGE 29. Figure 2: Citywide Manual Bicycle Count and Automated Bicycle Count Locations
30 PAGE 30. Map caption: The City and County of San Francisco's arterials and Bicycle Network. The numbers listed in the 4:30-6:30pm column from the following table are placed at their corresponding count locations around the city. Main bicycle corridors of Market Street, Mission Street and the Wiggle are marked on the map as well. *Count Locations 4:30-6:30pm 5-6:30pm 11th and Howard (counted ) 11th and Market 1,396 1,173 (counted ) 14th and Folsom (new for 2011) 14th and Market/Church (new for 2011) 16th and Mission (new for 2011) 17th and Valencia 1, (counted ) 17th/Castro and Market (new for 2011) 19th and Holloway (new for 2011) 19th and Lincoln (new for 2011) 19th Ave and Sloat (new for 2011) 2nd and Folsom (new for 2011) 2nd and Market (new for 2011) 2nd and Townsend (counted ) 5th and Market - AM 750 (8-9am) (counted ) 5th and Market - MIDDAY (1-2pm) (counted ) 226 -
31 PAGE 31. Map caption: The City and County of San Francisco's arterials and Bicycle Network. The numbers listed in the 4:30-6:30pm column from the following table are placed at their corresponding count locations around the city. Main bicycle corridors of Market Street, Mission Street and the Wiggle are marked on the map as well. *Count Locations 4:30-6:30pm 5-6:30pm 5 th and Market PM 1, (counted ) 5th and Townsend (counted ) 7th and 16th (counted ) 7th and Kirkham (counted ) 7th and Lincoln (new for 2011) 8th and Townsend (counted ) 8th Ave and Clement (new for 2011) Broadway and Columbus (counted ) Broadway and Embarcadero (counted ) Cervantes and Marina (counted ) Cesar Chavez and Harrison (counted ) Embarcadero and Townsend (counted ) Fell and Scott (counted ) Golden Gate and Masonic (counted ) Golden Gate Bridge (new for 2011) Market and Valencia (new for 2011) 1,274 1,083

32 PAGE 32. American Community Survey Mode Share Results The American Community Survey (ACS) is an ongoing statistical survey by the U.S. Census Bureau that regularly gathers information previously contained only in the long form of the decennial census. One of the questions in the ACS asks participants about their transportation mode to work. The State of Cycling Report compares bicycle trips to work (mode share) data provided by the ACS since 2002 with current statistics. Since the ACS is a well-established survey that uses consistent methodology from year to year and there is not a widely accepted bicycle mode share predictor tool that encompasses all bicycle trip types, ACS data is used for San Francisco s annual bicycle mode share comparison. Using bicycle mode share for trips to work as an indicator for citywide bicycling is common practice among U.S. and international cities, including Copenhagen, New York, and Portland. Call-out box: Travel to work has grown from 2.1% in 2006 to 3.5% in 2011, a 66% increase in bicycling. Based on the results of the ACS, travel surveys and the counts performed by SFMTA, the overall travel to work mode split for bicycling in San Francisco has grown from 2.1% in 2006 to 3.5% in 2010, or a 66% increase. The State of California and the U.S. percentages of bicycle trips to work have also risen, but few cities have experienced such rapid increases in the last decade. Figure 4 shows the percent change in all modes to work in San Francisco between 2002 and It indicates bicycling has had the most consistent and largest increase over the eight-year period.

33 PAGE 33. Image: Cyclists on Market Street Figure 3: Intersections with the highest total cyclist volume during 90-minute evening count period, 2008 (blue), 2009 (red) and 2010 (green).
, 2009 (red) and 2010 (green).")
34 PAGE 34. Figure 3: Intersections with the highest total cyclist volume during 90-minute evening count period, 2008 (blue), 2009 (red) and 2010 (green). Intersection th & Market th & Market th & Valencia Page & Scott

35 PAGE 35. Figure 4: American Community Survey San Francisco Travel to Work Percent Change since 2002
36 PAGE 36. Figure 4: American Community Survey San Francisco Travel to Work Percent Change since 2002 Travel Mode 2002 ACS 2003 ACS 2004 ACS 2005 ACS 2006 ACS 2007 ACS 2008 ACS Drove Alone 0.00% -0.75% -4.01% -9.40% -4.65% -3.80% 1.41% Carpool 0.00% -8.69% -3.10% -7.72% % % 7.84% Public Transit 0.00% -4.95% -6.40% 3.83% -0.51% 14.25% 17.42% Walk 0.00% 2.49% -1.27% 15.40% 19.54% 26.78% 31.12% Bicycle 0.00% % % % 6.11% 24.82% 42.92% - Other 0.00% -1.61% 6.86% 10.05% 13.87% 13.76% 23.40% Population 2009 ACS 2010 ACS Drove Alone 1.56% -5.91% Carpool -5.12% 0.81% Public Transit 15.58% 24.27% Walk 42.48% 29.65% Bicycle 54.61% 81.92% Other 11.60% 19.23% Source: US Census American Community Survey
37 PAGE 37. Figure 5: San Francisco Commute Trips by Mode According to the ACS*, a steady increase in bicycling (75%) and transit (12%) mode split occurred since This increase is consistent with the observed growth in the SFMTA bicycle counts. Mode Public Transit 30.4% 31.8% 34.1% Walk 8.0% 10.3% 9.4% Bicycle 2.1% 3.0% 3.5%

38 PAGE 38. Bicycle Safety Trends Historical Bicycle Collisions An analysis of bicycle collisions provides a strong indication of roadway behaviors that negatively affect bicyclists safety 4. San Francisco uses this information to plan bicycle facility improvements and to identify violations that should be prioritized for increased education and enforcement. The SFMTA also works closely with the San Francisco Police Department to recommend traffic enforcement targeted at specific locations and for behaviors that are the leading causes of injury. Figure 6 presents the recent annually reported bicycle injury collisions and bicycle count volumes. It shows that reported bicycle collisions and bicycle riding have increased concurrently in San Francisco between 2002 and Despite an increase in bicycle collision totals, Figure 6 reflects an increase in ridership as well, thus the overall collision rate is remaining relatively constant. Figure 7 presents changes in bicycle injury collisions and bicycle commute mode share from the ACS between 2002 and These two percentages grew similarly between 2006 and 2011, or as the bicycle mode share grew, so did the bicycle injury collisions. Call-out quote: Many international cities have experienced that an increase in number of people riding bicycles on the road results in a decrease of bicycle collision rates. 4 Collision data available to the SFMTA is from the Statewide Integrated Traffic Records System (SWITRS), maintained by the California Highway Patrol (CHP). Collision information in this report excludes those occurring on San Francisco freeways or private property, but includes collisions on city streets that are classified as state highways (such as 19th Avenue and Van Ness Avenue).

39 PAGE 39. The increases in bicycle ridership between 2007 and 2009 occurred with no infrastructure improvements (due to the injunction). Implementation of additional bicycle facilities, public outreach, focused safety improvements at high-crash locations and an increased presence of bicyclists on the roads will likely assist in a desired trend of reduced bicycle collision rates. Many international cities have experienced that an increase in the number of people riding bicycles on the road results in a decrease of bicycle collision rates; this relationship is known as the safety in numbers effect. 5 San Francisco may very well experience the same phenomenon as it gains greater ridership. 5 Jacobsen, PL. Safety in numbers: more walkers and bicyclists, safer walking and bicycling, Injury Prevention 2003;9:
40 PAGE 40. Figure 6: Bicycle Injury Collisions, and Annual Bicycle Volumes, Year Bicycle Bicycle Injuries Counts Of the total bicycle injury collisions between 1998 and 2009 where fault was assigned, 44 percent of the time fault was assigned to a motorist, and 50 percent of the time fault was assigned to the bicyclist. In collisions where motorists were assigned fault, the top three reasons were for turning without signaling, opening a car door when it was unsafe to do so, and failing to yield to oncoming traffic when making a left turn. In collisions where bicyclists were assigned fault, the top three reasons were for traveling at an unsafe speed, failure to stop at a red light, and riding on the wrong side of the roadway. Unsafe Behaviors More detailed safety information is available from the SFMTA s 2011 Bicycle Count Report. During these counts, the SFMTA records the number of bicyclists riding on sidewalks and in the wrong direction where on-street bicycle facilities exist and where they may be lacking. These behaviors are counted because they may lead to collisions between bicyclists and motorists or pedestrians. Additionally, it helps identify where infrastructure improvements may be needed or where additional education efforts could affect bicycling behaviors. Between 2008 and 2011, the manual bicycle counts found a statistically significant decrease in sidewalk bicycle riding at nine locations. This indicates an overall improvement of safe bicycling behavior. This change could be related to education and outreach or an overall increase of on-street bikeway facilities on these or parallel streets.
41 PAGE 41. Results from the manual bicycle counts found a statistically significant decrease in people riding on the wrong side of the street at three locations and an increase at two locations (out of 15 locations) between 2008 and Educating bicyclists as to the proper side of the road on which to ride is a potential area of improvement. Figure 7: Percent Change in Bicycle Injury Collisions and Bicycle Mode Share Since Bicycle Injury Collisions ACS Bicycle Mode Share 0.00% 1.30% 2.93% 11.73% 11.73% 46.91% 52.44% 72.96% 0.00% 19.14% 17.35% 16.26% 6.11% 24.82% 42.92% 54.61%
42 PAGE 42. Figure 8: Bicycle Injury Collisions per 100,000 bicycling trips to work. Year Collisions
43 PAGE 43. Figure 9: 2011 Bicycling Behavior (pie chart) Behavior Percentage Legal Riding 94% Sidewalk Riding 2% Wrong-Way Riding 1% Wrong-Way Sidewalk Riding 3% Call-out quote: Get a bicycle. You will not regret it if you live. Mark Twain, Taming the Bicycle
44 PAGE Bicycle Surveys In 2011, the SFMTA undertook two surveys of San Francisco residents. Detailed summaries of the surveys can be found here at SFMTA s Bicycle Reports and Studies website. The primary goals included: Providing a picture of bicycling in San Francisco, including what percentage of residents bicycle, how often they bicycle and who they are; Gaining more in-depth information on bicyclists assessment of San Francisco s biking infrastructure and resources; Assessing what motivates San Francisco residents who use a bicycle, as well as what inhibits San Francisco residents from bicycling more often; and Determining bicycle mode share through collection of trip diaries to assess how many and how often trips are taken by bicycle in San Francisco. This section of the report provides a summary of the 2011 survey results. The study was carried out in two parts a telephone and an intercept survey that totaled 1,063 interviews combined. Phone Survey The telephone study was conducted among 424 San Francisco residents, randomized from a five-zone geographically representative sample, including landlines and cell phones. This portion of the study was primarily intended to: Provide overarching data, such as bicycling frequency among residents; Understand the proportion of non-cyclists, infrequent and frequent riders; and Gauge general public attitudes towards bicycling. Results were balanced geographically based on a respondent s home ZIP Code. The telephone survey was conducted in December 2010 and January 2011 in English, Spanish and Chinese.

45 PAGE 45. Intercept survey The intercept study was conducted among 639 bicyclists in San Francisco. By focusing solely on bicyclists, this aspect of the study allowed for analysis of opinions within the San Francisco bicycling community. Both frequent and occasional bicyclists were included in the intercept study. Eighteen locations were chosen that represented areas for different types of bicyclists. These included six high-volume bicycle locations; six locations described as destination locations (e.g., City College of San Francisco); and six as neighborhood locations (primarily local shopping and dining areas). Surveying was conducted during January and February 2011 in English, Spanish and Chinese. Image: Map of San Francisco with five survey zones superimposed over the city. Rough boundaries Zone 1: Northeast SF; Embracadero to Fillmore Street, Downtown, Civic Center, SOMA); Zone 2: Marina, Presidio, Sea Cliff, Lincoln Park; Zone 3: Richmond, Sunset, Golden Gate Park; Zone 4: Pacific Heights, Alamo Square, Castro, Noe Valley, Glen Park; Zone 5: Dogpatch, Bayview, Rincon Hill, Mission, Bernal Heights.

46 PAGE 46. Call-out quote: The bicycle is just as good company as most husbands and, when it gets old and shabby, a woman can dispose of it and get a new one without shocking the entire community. -Ann Strong Who is riding in San Francisco? In an effort to remain consistent with the 2008 State of Cycling Report, survey respondents were divided into two groups: Infrequent bicyclists: bicyclists reporting that they bicycle, on average, one or fewer times a week; Frequent bicyclists: bicyclists reporting that they bicycle about two or more times a week. Based on the phone and intercept surveys, there are two groups of typical bicyclists depending on their residence location. Keep in mind, however, 66% percent of people in San Francisco reported that they do not ever ride a bike. The typical bicyclist who lives on the western side (Zones 2 and 3 in Figure 6) of San Francisco is most likely to be an infrequent bicyclist who rides primarily for leisure/social purposes. He/She is more likely than other San Francisco bicyclists to earn more than $70,000 per year He/She is more likely to be older than other bicyclists If he/she does not own a bicycle, he/she is more likely to use a privately owned car

47 PAGE 47. The typical bicyclist who lives on the eastern side (Zones 1, 4, and 5 in Figure 10) of San Francisco is more likely to be a frequent bicyclist who rides regularly to work or school. He/She is more likely to earn less than $70,000 per year He/She is also more likely to be younger than infrequent bicyclists He/She probably does not have a car and if this person does not have a bicycle either, he/she is likely to take transit or use a carshare service Compared to 2008, there were slightly more reported frequent female bicyclists and slightly fewer reported infrequent female bicyclists in Figure 11 presents these results where there was only modest difference in gender of bicyclists. The percentages of frequent female and male (28% versus 66% respectively) are consistent with the manual bicycle count numbers previously reported (28% versus 72% respectively). The manual counts occur during the peak bicycling periods when frequent bicyclists tend to ride most often.
48 PAGE 48. Figure 11: Gender of Frequent and Infrequent bicyclists, 2008 and : Frequent Infrequent Male 72.0% 44.0% Female 23.0% 54.0% Transgender 0.2% 0.2% Declined 4.0% 2.0% 2011: Frequent Infrequent Male 66.1% 50.2% Female 27.7% 49.3% Transgender 0.5% 0.0% Declined 5.7% 0.5% Results: Survey Responses Frequency San Francisco has a relatively high share of residents who bicycle at least occasionally 34% take at least one trip per year on their bicycle, and 17% take at least one trip per week by bicycle. However, according to the telephone survey, two-thirds of San Franciscans (66%) never use a bicycle. In addition, approximately five percent of all residents say that bicycling is their primary way of getting around. Approximately 40% of San Francisco residents say they own or have access to a bicycle, including 14% of non-cyclists. This presents a large potential for new bicyclists, that, with either some encouragement or added bicycle facilites, may begin to use their bicycle more often. Based on the number of respondents who have access to bicycles, the city could increase bicycle trips with continued education, outreach and infrastructure investments.

49 PAGE 49. Trip Purpose by Type of Bicyclist In 2011, more people took exercise or recreational bicycling trips than in Recreational bicycle trips are the most common type of bicycle trip across U.S. bicycle surveys. 6 As Figure 12 shows, the percent of commute trips (work/business) are similar between the 2008 and Infrequent bicyclists are more likely to ride for exercise or recreation trips, whereas frequent bicyclists ride more often for work/business trips. Call-out box: San Francisco has a relatively high share of residents who bicycle ast least occasionally 34% take at least one trip per year on their bicycle, and 17% take at least one trip per week by bicycle. 6
50 PAGE 50. Figure 12: Trip Purpose, 2008 and Work/business 28% 23% Exercise or recreation 36% 57% Shopping/errands 25% 11% School 8% 12% Blank/Other 5% 1%

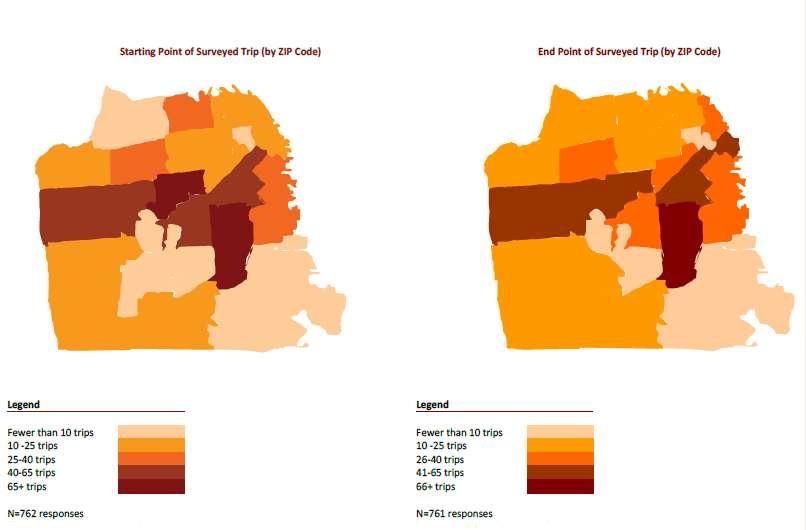
51 PAGE 51. Trip Length by Type of Bicyclist Frequent bicyclists take shorter trips than infrequent bicyclists. Trips by frequent riders average 37 minutes and people who ride one or fewer times per week average 51 minutes per trip. The 2011 survey asked participants the length of their most recent bicycle trip and as Figure 13 presents, infrequent and frequent bicyclists take different lengths of trips. This is likely related to the trip purpose since people who ride more regularly do so for commuting and errand running and their trips are shorter, whereas infrequent bicyclists are riding more for recreational purposes. Recreational trips are more commonly longer treks for exercise or leisure. Origin and Destination The intercept survey indicates that a large number of bicycle trips start and end downtown, in the Mission District, Haight-Ashbury and areas south of Market Street. These areas also have a high number of frequent bicyclists, concentrating bicycle traffic in the eastern part of the city. The following maps present the starting and ending points (by ZIP Code) of the surveyed trip for all bicyclists including those from the intercept and phone surveys. Darker colors on the map show the location of higher number of starting/ending points, while lighter colors show fewer starting/ending points. Note that every major residential ZIP Code in San Francisco (save for Treasure Island) had at least one starting/ending point. 7 Images: Smiling bicyclists with helmets (left); bike parking at a parklet on Valencia Street (right) 7 Approximately 5 percent of bicycle trips begin outside of San Francisco, while about 6 percent of bicycle trips end outside of San Francisco.
52 PAGE 52.
53 PAGE 53. Figure 13: Trip Lengths by Type of rider Infrequent Frequent < 30 minutes 39% 58% 30 to 60 minutes 39% 28% 61 to 90 minutes 4% 8% 91 to 120 minutes 11% 4% > 120 minutes 6% 2% Map: The map depicts starting and ending points of surveyed trips by zip code. The Mission District has the highest number of both starting and ending surveyed trips, with more than 65+ trips. Golden Gate Park and Downtown SF also have a high number of surveyed starting and ending trips
54 PAGE 54. Figure 13 (map): Starting and Ending Point of Surveyed Trips (by Zip Code) Zip Code Number Surveyed at Starting Point Number Surveyed at Ending Point Zip Code Number Surveyed at Starting point Number Surveyed at Ending Point #N/A #N/A #N/A #N/A #N/A #N/A #N/A #N/A #N/A #N/A #N/A #N/A #N/A #N/A #N/A #N/A #N/A #N/A #N/A #N/A #N/A #N/A #N/A #N/A #N/A #N/A #N/A #N/A #N/A #N/A #N/A #N/A #N/A #N/A #N/A
55 PAGE 55. Motivation to Ride In 2008 and 2011, respondents stated that they ride to exercise, to improve the environment and to enjoy the outdoors. However, in the 2011 survey, there was a large increase in the number of respondents stating exercise and enjoying the outdoors were motivators, and a large decrease in the percent of bicyclists riding because it is faster than alternative modes. Responses from the surveys are in Figure 14. In 2011, based on an open-ended question, the survey found that: To help people who don t ride to try bicycling, improve education, public policy and enforcement of driving regulations; To get people who ride to bike more often, improve infrastructure.

56 PAGE 56. Figure 14 Caption: In the 2011 survey, this question required a yes/no response for all motivators. The 2008 survey asked respondents to check all that apply. This could have influenced the greater number of responses in Figure 14: Motivation to Bicycle Exercise 51% 93% Environment/air quality 39% 59% Enjoy the outdoors 38% 87% Cheaper than driving/transit 35% 45% Faster than alternatives 70% 35% Identify as cycling community member 18% 26% Alone time/down time 15% 52% Other 15%

57 PAGE 57. Image: Child on bike wearing ONE LESS CAR shirt. Youth Bike Program banner in the background. YMCA and SF Bicycle Coalition logos are visible on the banner. Other children on bikes wearing helmets are in the foreground with a few adults standing around in the background.
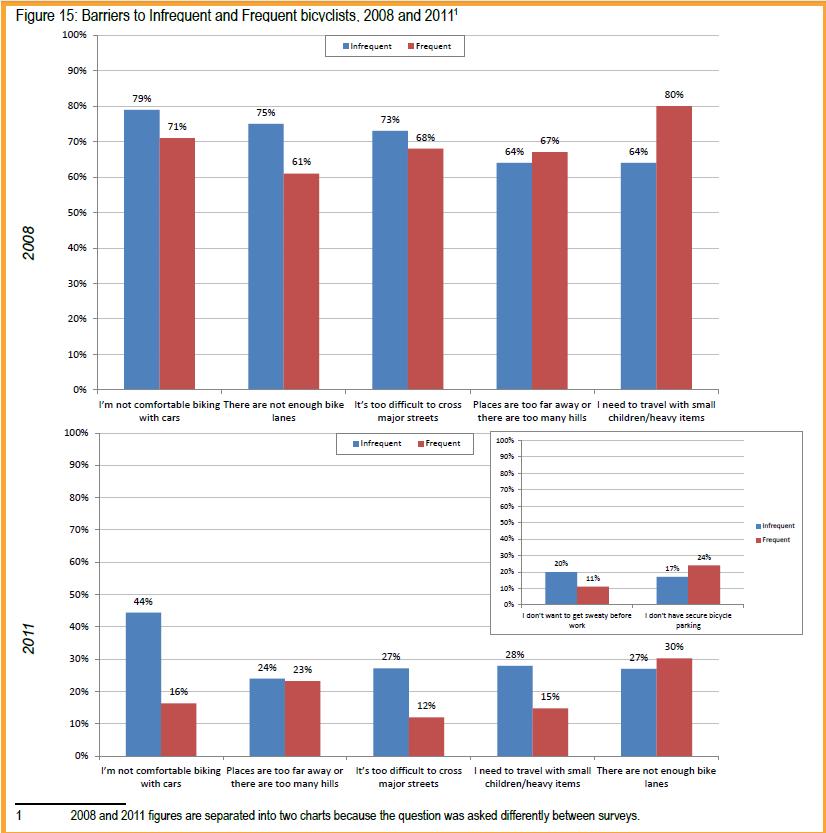
58 PAGE 58. Barriers to Bicycling Almost half of the people who don t ride said that it was because they are uncomfortable biking with cars. Figure 15 shows that infrequent bicyclists cited other barriers: destinations are too far away; they are traveling with children or heavy items; and they find it difficult to cross major streets without designated bicycle lanes. Frequent riders rated traveling with children or heavy items, lack of secure bicycle parking and not enough bicycle lanes as their top barriers. Based on an open-ended question, 20 percent of non-cyclists indicated the barriers they have to bicycling may be overcome with social, educational and resource-based efforts (e.g., finding people to bicycle with, finding affordable/discounted bicycles, learning the rules of the road and safer routes to travel, etc.). Barriers for both infrequent and frequent bicyclists decreased significantly between 2008 and This can likely be attributed to the lifting of the injunction and corresponding increase in bicycle facilities, which has improved both the real and perceived safety of the city s bicycle network. The charts below show significant drops in percentages for all questions between 2008 and 2011.
59 PAGE 59.
60 PAGE 60. Figure 15 caption: 2008 and 2011 figures are separated into two charts because the question was asked differently between surveys. Figure 15: Barriers to Infrequent and Frequent bicyclists, 2008 and 2011 Infrequent Bicyclists: I m not comfortable biking with cars 79% 44% There are not enough bike lanes 75% 24% It s too difficult to cross major streets 73% 27% Places are too far away or there are too many hills 64% 28% I need to travel with small children/heavy items 64% 27% I don t want to get sweaty before work I don t have secure bicycle parking - 20% - 17% Frequent Bicyclists: I m not comfortable biking with cars 71% 16% Places are too far away or there are too many hills 61% 23% It s too difficult to cross major streets 68% 12% I need to travel with small children/heavy items 67% 15% There are not enough bike lanes 80% 30% I don t want to get sweaty before work - 11% I don t have secure bicycle parking - 24%


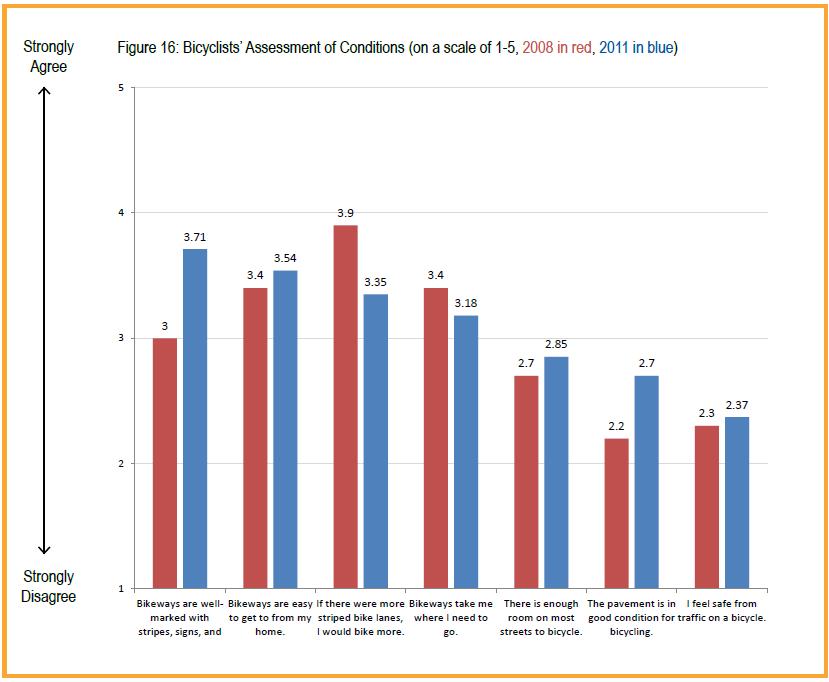
61 PAGE 61. Satisfaction with Bicycling Infrastructure Survey respondents agreed that bikeways are well marked and are easy to access from home and scored their satisfaction of bicycling infrastructure higher in 2011 than in As described in this report, the SFMTA has been expanding and improving the citywide bicycle network since the lifting of the Bicycle Plan injunction. As Figure 16 presents, comparing responses from the 2008 to the 2011 State of Cycling survey shows that bicyclists are noticing these improvements. Looking forward, respondents would like to see more room for bicycles on most streets, improvements in pavement conditions and ways to make them feel safer from traffic. This feedback plays well into SFMTA s complete streets and better streets plans. Call-out box: The SFMTA has been expanding and improving the citywide bicycle network since the lifting of the Bicycle Plan injunction. Image: Two cyclists in helmets and jackets smiling side-by-side on the street
62 PAGE 62.
63 PAGE 63. Figure 16: Bicyclists Assessment of Conditions (on a scale of 1 to 5) Bicycle Infrastructure Rating Rating Bikeways are well-marked with stripes, signs, and stencils Bikeways are easy to get to from my home If there were more striped bike lanes, I would bike more Bikeways take me where I need to go There is enough room on most streets to bicycle The pavement is in good condition for bicycling I feel safe from traffic on a bicycle Bikeway Preferences Regardless of bicycling frequency, 94 percent of survey respondents stated that they feel comfortable riding on bikeways that are physically separated from cars and 89 percent stated they feel comfortable riding in standard bicycle lanes. Generally, people prefer a designated space that does not conflict with vehicle traffic. These results support industry research and follow recent SFMTA efforts to install bikeways separated from traffic, including buffered bicycle lanes and striped bicycle lanes where feasible. Awareness of SFMTA Projects and Programs Between 2008 and 2011, there was an increase in the awareness of SFMTA projects and programs. Responses were similar across the two surveys but with more awareness of the outreach campaigns in That survey found a greater awareness by frequent bicyclists of all materials and outreach other than public campaigns, such as the walk your bike on the sidewalk poster campaign. More importantly, in 2011, infrequent bicyclists were more aware of the SFMTA s outreach, maps and website efforts than in the 2008 survey. The SFMTA and our partners like the San Francisco Bicycle Coalition perform considerable outreach in an effort to encourage more people to bicycle and to raise awareness of safe bicycling techniques. These efforts occur through various means including public campaigns, the SFMTA website and other social media efforts.


64 PAGE 64. Call-out quote: The bicycle is the perfect transducer to match man s metabolic energy to the impedance of locomotion. Equipped with this tool, man outstrips the efficiency of not only all machines but all other animals as well. Ivan Illich, Energy and Equity, 1974 Call-out box: Ninety four percent of survey respondents stated that they feel comfortable riding on bikeways that are physically separated from cars and 89 percent stated they feel comfortable riding in standard bicycle lanes. Image: A line of bicyclists riding in the new cycle track on JFK Drive in Golden Gate Park

65 PAGE 65. Figure 17 caption: Question not asked in the 2008 State of Cycling Figure 17: Bicyclists Comfort Riding on Different Bikeway Types Infrequent Frequent Bikeways Separate from Cars 94% 94% Bike Lanes 87% 89% Sharrows 35% 53% No Bikeway 17% 29%

66 PAGE 66. Figure 18: Respondents Awareness of SFMTA Bicycling Materials and Outreach 2008: Infrequent Frequent Public outreach campaigns 26% 43% City bike maps 20% 53% City bicycling website 12% 28% Cyclist safety training classes 9% 24% 2011: Infrequent Frequent Public outreach campaigns 43% 39% City bike maps 25% 57% City bicycling website 13% 30% Cyclist safety training classes 9% 35%
67 PAGE 67. Improvements for the Future The 2012 State of Cycling Report provides valuable guidance to the City of San Francisco on bicycling improvements for both programs and infrastructure. The SFMTA is increasing the size of the bicycle network, working to improve safety and continuing outreach to residents. As a result, more bicyclists are on San Francisco streets. However, there are areas of improvement that the city can address to better accommodate existing bicyclists and continue to work to increase bicycle trips, especially by infrequent users and non-cyclists. Bicycle Programs To increase bicycle ridership and meet the Board of Supervisors bicycle mode share goal of 20% by 2020, the SFMTA needs to continue its effort to educate and encourage people about safe riding practices, encourage motorists to share San Francisco streets, retrofit streets where possible to better accommodate cycling facilities and enforce potentially harmful behavior on the roadways. Specific program enhancements are described below. Continuing Bicycle Education The large percentages of non-cyclists reporting that they are not comfortable bicycling with cars (50 percent) and those that report that it is difficult crossing major streets (31 percent), indicate that these barriers may be overcome with social, educational and resource-based efforts. This suggests a need for continued bicycle education programs. The SFMTA funds bicycle safety classes for youth and adults. However, based on the low awareness of these classes as found in the survey (11 percent of bicyclists), the SFMTA should seek additional methods of advertising these classes and hold them in locations so new populations of non-cyclists and infrequent bicyclists are present. Bicycle education classes could be part of language classes at community and neighborhood centers. With funding from the SFMTA, the San Francisco Bicycle Coalition held a total of 123 classes between May 2009 through July 1, This was a significant community safety benefit for all users of the public right of way, educating over 3,000 people who ride bikes and drive cars on the streets of San Francisco.
68 PAGE 68. Classes have been held at over 50 locations across the city, in a diverse number of neighborhoods and every Supervisorial district; and have been offered in Spanish. In the fall of 2012, a Cantonese curriculum will be launched to complement the other classes. The classes are attended by people of all ages, races, and a majority of attendees were female. Classes were split between people who ride frequently (~35%) and those who have never ridden a bicycle (~30%). SFMTA Website Of the survey respondents, 23 percent are aware of the website for bicycling resources. As previously stated, SFMTA Livable Streets started a Facebook page in 2010 that may draw more attention to the bicycle program and Livable Streets website and materials. The SFMTA should continue updating the website and provide links via the agency Facebook page. Annual Bicycle Light Giveaway The SFMTA has successfully provided free bicycle lights to bicyclists for the last 3 years in the fall when daylight hours get shorter. In 2010, 1,200 lights were installed on San Francisco bicycles. Due to a disproportionate number of collisions occurring during winter months compared to other months, the free bicycle light installation program should continue into the future.

69 PAGE 69. Image caption: In fall 2010, the SFMTA installed 1,200 bicycle lights. Image: This is a flyer urging bicyclists to use bicycle lights. The flyer is sponsored by the SF Bicycle Coalition and SFMTA logos of both entities and web addresses appear. Image text: Don t get caught in the dark. Bicycle Lights are Required by Law. Be visible! White front headlight, Rear Red Light, Pedal and Spoke Side Reflectors.
70 PAGE 70. Target Populations As the 2011 State of Cycling Report points out, there are many San Francisco residents with bicycles that are not used, or are not used often. The City and County should provide programs and facilities aimed at making these residents comfortable using a bicycle. Based on the survey responses, these education and encouragement programs should be directed to specific groups in San Francisco. Generally, these are the populations underrepresented in the frequent and infrequent user groups compared to the general population. The survey found the following underrepresented populations: Women: 74 percent of women do not ride a bicycle compared to 60 percent of men. Ages 45 and older: 45 percent of those over 45 years of age say they never bicycle. Race/Ethnicity: 75 percent of Hispanic, 71 percent of Asian, and 83 percent of African- American populations do not bicycle compared to 61 percent of white respondents. The city should continue identifying safety and outreach programs targeted at these populations. Enforcement Coordination The SFMTA is working with the San Francisco Police Department (SFPD) on bicycle enforcement, since 17 percent of survey respondents stated that greater enforcement of vehicles violating traffic regulations could motivate them to bicycle more frequently. For example, the two agencies are working together on targeted enforcement of specific violations at specific locations to improve the behavior of bicyclists, pedestrians and motorists alike. These are determined based on historical collision trends. Additionally, the SFPD is actively enforcing motorists parking in bicycle lanes. Enforcement efforts should be publicized so both motorists and would-be bicyclists know they are occurring. These efforts could also help to decrease bicycle collisions.

71 PAGE 71. Image caption: The SFMTA has led enforcement outreach campaigns, including posters informing bicyclists to walk their bike on the sidewalk. Image: This is a flyer urging bicyclists to Walk Your Bike On The Sidewalk, which is displayed in bright, capital yellow letters. It shows a drawing of people walking down the street with a yellow bicyclist at center walking his bike. It also displays the logos of various partners including the SF Bike Coalition.
72 PAGE 72. Continue Bicycle Counts and Surveys In comparison to other jurisdictions, the SFMTA is a leader in bicycle data collection. The annual bicycle counts, collision analysis, Bike to Work Day counts and the implementation of citywide automated bicycle counters demonstrate the Agency s dedication to this effort. These data sources are useful for State of Cycling reports, citywide project development and targeted outreach and enforcement. The SFMTA should continue these efforts, especially as additional bikeway facilities are installed including before and after counts at specific project locations. These efforts demonstrate the benefits of bikeway projects including bicycle volumes, air quality and transportation mode shift. Bicycle Infrastructure In addition to programmatic improvements, the SFMTA needs to continue implementing bikeway projects in the Bicycle Plan and innovative strategies to improve the comfort of riding. All current and future cyclists can attest to the need to provide more bike lanes, paths, and protected ways to better connect the city and improve the overall quality of the bicycle experience. This is one of the primary ways public agencies can attract more people to ride more often. This could continue to increase bicycle ridership and in combination with programmatic efforts, improve bicycling safety. Stripe Bicycle Lanes Half of all survey respondents stated that they would bicycle more if there were more bicycle lanes while 54 percent of infrequent bicyclists and 60 percent of frequent bicyclists stated that there are not enough bicycle lanes. Additionally, 81 percent of survey respondents said they feel comfortable riding in bicycle lanes. The SFMTA should continue installing bicycle lanes on the citywide bicycle network. Where feasible, the lanes should be buffered from motorized vehicle lanes, providing separation of uses. Provide Separated Bikeways Regarding the striping of bicycle lanes, the SFMTA should install additional separated bikeways. Over 90 percent of survey respondents stated that they feel comfortable in bikeways separated from cars. The SFMTA should continue seeking opportunities to develop separated bikeways, buffered from moving motorized traffic by a curb, painted buffer, or in some cases, a parking lane.
73 PAGE 73. Implementation of Bicycle Parking The SFMTA has installed approximately 700 bicycle racks since The Capital Plan for the agency contains programs for both long term secure bike storage (corrals, bike lockers, rooms, transit stations, etc.) as well as short term program for racks in front of businesses and on the street, in parklets and at high demand locations. Of survey respondents, about 20 percent bicyclists stated that not having secure bicycle parking was a barrier to bicycling more frequently. The Board of Supervisors also recently adopted an ordinance allowing bikes inside commercial and work-place buildings if secure bike parking is not provided. The SFMTA has a long list of requests for corrals and sidewalk bicycle parking. The agency should continue filling these requests citywide and provide additional opportunities for secure bicycle parking and bicycle stations. Bay Area Regional Bike Share Program SFMTA is a key partner in the regional bicycle share pilot program led by the Bay Area Air Quality Management District (BAAQMD). The bike share program will deploy 1,000 bicycles regionally at up to 100 stations along the Peninsula transportation corridor. Partner cities include Palo Alto, San José, Mountain View and Redwood City. San Francisco will have the largest presence, with 500 bicycles and approximately 50 stations in the city during the initial phase of the project. The pilot service area will be centered in San Francisco s employment and transit-rich Downtown area between the Financial District, Market Street and the Transbay and Caltrain terminals. This area is notably flat, has the densest bikeway network coverage in San Francisco and enjoys the highest levels of bicycling. The program will help those who commute by transit from cities to the east and south and encounter difficulties bringing a bicycle on BART or Caltrain during the peak commute hours. Bike sharing will provide many benefits to San Francisco residents, workers, and visitors, such as increasing accessibility to local and regional transit services, providing an alternative transportation option for short trips, and serving as an alternative to congested transit lines. Other potential benefits include user cost savings, travel time savings, and improved public health.


74 PAGE 74. Call-out quote: The bicycle had, and still has, a humane, almost classical moderation in the kind of pleasure it offers. It is still the kind of machine that a Hellenistic Greek might have invented and ridden. It does no violence to our normal reactions: It does not pretend to free us from our normal environment. J.B. Jackson Image: A bike sharing station in Washington DC

75 PAGE 75. Image: Woman rides a bike share bike down a leafy street in Washington, DC.
76 PAGE 76. Conclusion The State of Cycling in San Francisco is strong. It can and should continue to get stronger. Most people who frequent the streets of San Francisco will note that the use of the bicycle for recreational and utilitarian trips is noticeably on the rise. Data collected by the SFMTA through manual and automated counts over the past six years undeniably confirms this fact. Regional and national surveys, such as the American Community Survey also arrive at the same conclusion. So now that San Francisco is experiencing the most significant growth in planning, ridership and infrastructure development for bicycling in its history, what comes next? The next decade will look different from the previous ones in how the city focuses its resources. Diminishing government funding levels will require substantial changes in how San Francisco funds and prioritizes space for mobility within public rights of way. For transportation, this means focusing on cost-effective projects and programs with the most positive return to the economy, public health and personal mobility. There is no longer a car versus transit versus bicycle debate; future investments in safety and infrastructure are about how the city s limited resources can move the most people with least cost (capital and operating) in the safest, most convenient way. San Franciscans are looking for better transportation choices and most do not want to rely on a car to meet all of their travel needs. The bicycle should play a growing role in mobility in the city and the SFMTA will do all it can to make it as common as walking, driving, and taking transit. Bicycling makes sense for a host of reasons, but many residents have reservations about making the switch to riding when it comes to traffic safety and convenience. Just as San Francisco s decision makers made choices decades ago to accommodate the automobile, now is the same decision point to accommodate bicycles albeit at a fraction of cost to the city, individuals and society. Finally, accomplishing this change cannot come from infrastructure alone. Easy bicycle access, safe storage, strong public policies, clever marketing, targeted education and complementary transportation pricing measures are critical to continue the rapid rise in bicycle mode share and the growth of San Francisco s active and sustainable transport modes.

77 PAGE 77. Image: Cyclist riding in a green bike lane with a mural in the background. The mural depicts the famous houses along Alamo Square on the right, and a bicyclist riding with the Golden Gate Bridge in the background on the left.

78 PAGE 78. Back cover: Image: Cyclists on Market Street with cars and the historic F line streetcar in the background. San Francisco Municipal Transportation Agency 1 South Van Ness Avenue, 7 th Floor San Francisco, CA
2012 San Francisco State of Cycling Report
 2012 San Francisco State of Cycling Report Page 1 SFMTA Municipal Transportation Agency Edwin M. Lee Mayor City and County of San Francisco Board of Supervisors John Avalos District 11 David Campos District
Chapter 2. Bellingham Bicycle Master Plan Chapter 2: Policies and Actions
 Chapter 2 Bellingham Bicycle Master Plan Chapter 2: Policies and Actions Chapter 2: Policies and Actions The Bicycle Master Plan provides a road map for making bicycling in Bellingham a viable transportation
PEDALING FORWARD. A Glance at the SFMTA s Bike Program for SFMTA.COM
 PEDALING FORWARD A Glance at the SFMTA s Bike Program for 2017-2021 SFMTA.COM INTRODUCTION About This Booklet More people from all walks of life see their bicycle as a more convenient way to get where
Protected Bike Lanes in San Francisco Mike Sallaberry SFMTA NACTO Workshop - Chicago IL
 Protected Bike Lanes in San Francisco Mike Sallaberry SFMTA 10 14 2011 NACTO Workshop - Chicago IL San Francisco 2 nd Highest Density in the U.S. 47 square miles Mild Climate Market Population ~810,000
CITY OF COCOA BEACH 2025 COMPREHENSIVE PLAN. Section VIII Mobility Element Goals, Objectives, and Policies
 CITY OF COCOA BEACH 2025 COMPREHENSIVE PLAN Section VIII Mobility Element Goals, Objectives, and Policies Adopted August 6, 2015 by Ordinance No. 1591 VIII MOBILITY ELEMENT Table of Contents Page Number
MTP BICYCLE ELEMENT UPDATE. November 2017
 MTP BICYCLE ELEMENT UPDATE November 2017 TIME FOR AN UPDATE Bicycle Element adopted in July 2008 Almost 10 years old Many planned facilities have been implemented 10 years more experience in planning,
CONNECTING PEOPLE TO PLACES
 CONNECTING PEOPLE TO PLACES 82 EAST BENCH MASTER PLAN 07 Introduction The East Bench transportation system is a collection of slow moving, treelined residential streets and major arteries that are the
Bikeway action plan. Bicycle Friendly Community Workshop March 5, 2007 Rochester, MN
 Bikeway action plan Summary The was held on March 5, 2007 at the Rochester Mayo Civic Center. The workshop was hosted by Rochester-Olmsted County Planning Department in collaboration with the League of
Bicycle Master Plan Goals, Strategies, and Policies
 Bicycle Master Plan Goals, Strategies, and Policies Mobilizing 5 This chapter outlines the overarching goals, action statements, and action items Long Beach will take in order to achieve its vision of
FINAL PLAN APPENDIX D CITY OF BERKELEY BIKE PLAN D-1
 CITY OF BERKELEY BIKE PLAN D-1 . Proposed Programs D.1. EDUCATION This appendix presents the recommended bicycle-related programs for the City of Berkeley. The recommendations are organized in four E s:
FEDERAL HIGHWAY ADMINISTRATION APPLICATION
 FEDERAL HIGHWAY ADMINISTRATION APPLICATION REQUEST FOR PERMISSION TO EXPERIMENT WITH A BICYCLE BOX INTERSECTION TREATMENT Submitted by: City of Columbus Department of Public Service Date: June 26, 2009
NM-POLICY 1: Improve service levels, participation, and options for non-motorized transportation modes throughout the County.
 Transportation PRINCE WILLIAM COUNTY 2008 COMPREHENSIVE PLAN NON-MOTORIZED PLAN CONTENTS Goals, Policies, and Action Strategies Table 4 (Bike Facility Classifications and Descriptions) Table 5 (Bike Facility
Welcome! San Jose Avenue Open House August 25, 2015
 Welcome! San Jose Avenue Open House August 25, 2015 Vision Zero The City and County of San Francisco adopted Vision Zero San Francisco Vision Zero High Injury Network as a policy in 2014, committing an
SAN FRANCISCO MUNICIPAL TRANSPORTATION AGENCY
 THIS PRINT COVERS CALENDAR ITEM NO. : 11 DIVISION: Sustainable Streets BRIEF DESCRIPTION: SAN FRANCISCO MUNICIPAL TRANSPORTATION AGENCY Approving traffic modifications on Twin Peaks Boulevard between Christmas
RESOLUTION NO ?? A RESOLUTION OF THE CITY OF NEPTUNE BEACH ADOPTING A COMPLETE STREETS POLICY
 RESOLUTION NO. 2018-?? A RESOLUTION OF THE CITY OF NEPTUNE BEACH ADOPTING A COMPLETE STREETS POLICY WHEREAS, safe, convenient, and accessible transportation for all users is a priority of the City of Neptune
SAN FRANCISCO MUNICIPAL TRANSPORTATION AGENCY
 THIS PRINT COVERS CALENDAR ITEM NO. : 10.2 DIVISION: Sustainable Streets BRIEF DESCRIPTION: SAN FRANCISCO MUNICIPAL TRANSPORTATION AGENCY Adopting Conceptual Proposal for Streetscape Improvements to Broadway,
Northbound San Jose Avenue & I-280 Off-Ramp Road Diet Pilot Project
 Project Overview Fed by a two-lane Interstate-280 (I-280) off-ramp, high vehicular volumes and speeds are longstanding issues along San Jose Avenue. Residents in the surrounding neighborhoods have expressed
EXECUTIVE SUMMARY. Vision
 Vision Walking and bicycling in Salt Lake City will be safe, convenient, comfortable, and viable transportation options that connect people to places, foster recreational and economic development opportunities,
Chapter 14 PARLIER RELATIONSHIP TO CITY PLANS AND POLICIES. Recommendations to Improve Pedestrian Safety in the City of Parlier (2014)
") Chapter 14 PARLIER This chapter describes the current status and future plans for biking and walking in the City of Parlier. RELATIONSHIP TO CITY PLANS AND POLICIES The Parlier General Plan is the primary
Chapter 14 PARLIER This chapter describes the current status and future plans for biking and walking in the City of Parlier. RELATIONSHIP TO CITY PLANS AND POLICIES The Parlier General Plan is the primary
Perryville TOD and Greenway Plan
 Perryville TOD and Greenway Plan Greenway Glossary Pathway: A bicycle and pedestrian path separated from motorized vehicular traffic by an open space, barrier or curb. Multi-use paths may be within the
Chapter 7. Transportation. Transportation Road Network Plan Transit Cyclists Pedestrians Multi-Use and Equestrian Trails
 Chapter 7 Transportation Transportation Road Network Plan Transit Cyclists Pedestrians Multi-Use and Equestrian Trails 7.1 TRANSPORTATION BACKGROUND The District of Maple Ridge faces a number of unique
PEDESTRIAN ACTION PLAN
 ATTACHMENT 2 CITY OF SANTA MONICA PEDESTRIAN ACTION PLAN CITY OF SANTA MONICA PEDESTRIAN ACTION PLAN This page intentionally left blank EXECUTIVE SUMMARY CHAPTER 1 EXECUTIVE SUMMARY Setting the Stage
Chapter PERFORMANCE MEASURES AND ACCOUNTABILITY. Introduction
 PERFORMANCE MEASURES AND ACCOUNTABILITY Introduction Performance measures are helpful in evaluating the progress being made toward achieving the goals and objectives of the Gateway Bicycle Plan. The Plan
San Francisco 2009 Collisions Report April 21, 2011
 San Francisco 29 Collisions Report April 21, 211 City and County of San Francisco San Francisco Municipal Transportation Agency 1 South Van Ness Avenue, 7 th Floor San Francisco CA 9413 CONTENTS About
Solana Beach Comprehensive Active Transportation Strategy (CATS)
") Solana Beach Comprehensive Active Transportation Strategy (CATS) 3.0 Goals & Policies The Solana Beach CATS goals and objectives outlined below were largely drawn from the Solana Beach Circulation Element
Solana Beach Comprehensive Active Transportation Strategy (CATS) 3.0 Goals & Policies The Solana Beach CATS goals and objectives outlined below were largely drawn from the Solana Beach Circulation Element
SAN FRANCISCO MUNICIPAL TRANSPORTATION AGENCY
 THIS PRINT COVERS CALENDAR ITEM NO.: 10.3 DIVISION: Sustainable Streets BRIEF DESCRIPTION: SAN FRANCISCO MUNICIPAL TRANSPORTATION AGENCY Approving various traffic and parking modifications on Bay Street
Living Streets Policy
 Living Streets Policy Introduction Living streets balance the needs of motorists, bicyclists, pedestrians and transit riders in ways that promote safety and convenience, enhance community identity, create
Upper Market Street Bike Lane Project
 Upper Market Street Bike Lane Project 17th Street to Octavia Boulevard 6 30 2010 SAN FRANCISCO, CALIFORNIA Agenda San Francisco & Sustainable Transportation Project Goals Outreach & Coordination Project
Berkeley Strategic Transportation Plan A-76
 Berkeley Strategic Transportation Plan A-76 Appendices 1. A Team Effort 2. Where We ve Been A-11 Berkeley Strategic Transportation Plan Alameda County Transportation Plan Alameda County will be served
Hennepin County Bicycle and Pedestrian Planning
 Hennepin County Bicycle and Pedestrian Planning 1 Value of bicycle and sidewalk systems Safety Livability Mobility Health Personal Finances Economic Sustainability Clean Air Recreation Parking and congestion
SAN FRANCISCO MUNICIPAL TRANSPORTATION AGENCY
 THIS PRINT COVERS CALENDAR ITEM NO. : 12 DIVISION: Sustainable Streets BRIEF DESCRIPTION: SAN FRANCISCO MUNICIPAL TRANSPORTATION AGENCY Approving various bicycle improvements and traffic modifications
2017 Annual Traffic Safety Report
 2017 Annual Traffic Safety Report City of Santa Cruz Public Works Department I. Introduction The purpose of the 2017 City of Santa Cruz Traffic Safety Report is to provide an overview of traffic safety
Rochester Downtown Bicycle Study 2009
 Rochester Downtown Bicycle Study 2009 Relationship of ROCOG Long Range Transportation Plan to Rochester Comprehensive Plan Regional Long Range Transportation Plan (LRTP) is prepared under the auspices
Purpose and Need. Chapter Introduction. 2.2 Project Purpose and Need Project Purpose Project Need
 Chapter 2 Purpose and Need 2.1 Introduction The El Camino Real Bus Rapid Transit (BRT) Project (Project) would make transit and other transportation improvements along a 17.6-mile segment of the El Camino
Intro Strategic Plan SFTP TDM Facilities Transit Bicycle Pedestrian Taxi BICYCLE UPDATE. Presented by Timothy Papandreou, Strategic Planning & Policy
 BICYCLE UPDATE Presented by Timothy Papandreou, Strategic Planning & Policy 114 Strategic Goals & Objectives Goal 1: Create a safer transportation experience for everyone Objective 1.3: Improve the safety
Corpus Christi Metropolitan Transportation Plan Fiscal Year Introduction:
 Introduction: The Safe, Accountable, Flexible, Efficient Transportation Equity Act: A Legacy for Users (SAFETEA-LU) has continued the efforts started through the Intermodal Surface Transportation Efficiency
Pedestrian Safety Workshop SAN FRANCISCO, CALIFORNIA
 Pedestrian Safety Workshop 02 15 2011 SAN FRANCISCO, CALIFORNIA 1 Agenda Walking in San Francisco Accomplishments and Current Pedestrian Activities Mayor s Pedestrian Safety Executive Directive Next Steps
Appendix C 3. Bicycle / Pedestrian Planning
 Appendix C 3. Bicycle / Pedestrian Planning BICYCLE/PEDESTRIAN PLANNING 2005 Master Plan GOAL: Provide for safe and convenient bicycle and pedestrian circulation throughout the City. Develop a city-wide
Bicycle Facilities Planning
 Bicycle Facilities Planning Overview Types of Cyclists Purpose for Riding Types of Facilities Bike Lanes Bicycle Boulevards Cycle Tracks Intersections Signals Signing and Marking Discussion Types of Bicyclists
Madison Urban Area and Dane County. Bicycle Transportation Plan Summary. September Introduction. Bicycle Plan Scope and Planning Process
 Bicycle Transportation Plan Summary Madison Urban Area and Dane County Introduction September 2000 Bicycling is an important mode of transportation in the Madison urban area and countywide that is available
Vision Zero San Jose. Moving toward zero traffic deaths and providing safe streets for all
 Vision Zero San Jose Moving toward zero traffic deaths and providing safe streets for all SPUR San Jose April 4, 2017 Source: Vision Zero Network Vision Zero Core Principles 1. Traffic deaths are preventable
Data Analysis February to March Identified safety needs from reported collisions and existing travel patterns.
 Welcome! Thank you for participating in today s Valencia Bikeway Improvements workshop. Data Analysis February to March Identified safety needs from reported collisions and existing travel patterns. Initial
Transportation Master Plan Advisory Task Force
 Transportation Master Plan Advisory Task Force Network Alternatives & Phasing Strategy February 2016 BACKGROUND Table of Contents BACKGROUND Purpose & Introduction 2 Linking the TMP to Key Council Approved
modes, the increased roadway capacity is the implied solution, which, in turn, has been shown to lead to more driving (induced demand).
.") EXECUTIVE SUMMARY A. Introduction The San Francisco Congestion Management Program (CMP) is a biennial program conducted in accordance with state law to monitor congestion and adopt plans for mitigating
EXECUTIVE SUMMARY A. Introduction The San Francisco Congestion Management Program (CMP) is a biennial program conducted in accordance with state law to monitor congestion and adopt plans for mitigating
CITY OF BLOOMINGTON COMPLETE STREETS POLICY
 CITY OF BLOOMINGTON COMPLETE STREETS POLICY POLICY OBJECTIVE: The City of Bloomington will enhance safety, mobility, accessibility and convenience for transportation network users of all ages and abilities,
BIKE PLAN CONTENTS GATEWAY
 CONTENTS Acknowledgments...vii Great Rivers Greenway District Board of Directors... vii Great Rivers Greenway District Staff... vii Project Consultants... vii Committees... viii Citizens Advisory Committee
SANTA CLARA COUNTYWIDE BICYCLE PLAN August 2008
 SANTA CLARA COUNTYWIDE BICYCLE PLAN August 2008 To assist VTA and Member Agencies in the planning, development and programming of bicycle improvements in Santa Clara County. Vision Statement To establish,
1999 On-Board Sacramento Regional Transit District Survey
 SACOG-00-009 1999 On-Board Sacramento Regional Transit District Survey June 2000 Sacramento Area Council of Governments 1999 On-Board Sacramento Regional Transit District Survey June 2000 Table of Contents
City of San Francisco 2009 Pedestrian Count Report. April 2010
 April 2010 TABLE OF CONTENTS Introduction... 3 Background... 3 Methodology:... 4 Results... 4 Recommendations... 6 Conclusion... 7 APPENDIX A: CENSUS DATA... 8 APPENDIX B: COUNT LOCATIONS... 8 APPENDIX
Speed Limits Study and Proposal. Public Input Session: 8/14/13
 Speed Limits Study and Proposal Public Input Session: 8/14/13 Why is Decatur a unique place for this project? First Community Transportation Plan in the nation with a Health Impact Assessment. Strong sense
AGENDA: November IO, 1998 REPORT BACK ON BICYCLE SAFETY PROGRAMS
 COUNTY OF SANTA CRUZ HEALTH SEWiCES AGENCY ADMINISTRATION HEALTH SERVICES AGENCY P.O. BOX 962, 1080 EMELINE AVENUE SANTA CRUZ, CA 95061 (408) 454-4066 FAX: (408) 454-4770 TDD: (408) 454-4123 October 21,
Active Transportation Facility Glossary
 Active Transportation Facility Glossary This document defines different active transportation facilities and suggests appropriate corridor types. Click on a facility type to jump to its definition. Bike
ACTIVE TRANSPORTATION
 ACTIVE TRANSPORTATION Mobility 2040 Supported Goals Improve the availability of transportation options for people and goods. Support travel efficiency measures and system enhancements targeted at congestion
2014 Bellingham Bicycle Master Plan
 2014 Bellingham Bicycle Master Plan Acknowledgements The City of Bellingham is honored by the commitment of the numerous community members and bicycling enthusiasts who participated in the development
Cabrillo College Transportation Study
 Cabrillo College Transportation Study Planning and Research Office Terrence Willett, Research Analyst, Principle Author Jing Luan, Director of Planning and Research Judy Cassada, Research Specialist Shirley
City of Novi Non-Motorized Master Plan 2011 Executive Summary
 City of Novi Non-Motorized Master Plan 2011 Executive Summary Prepared by: February 28, 2011 Why Plan? Encouraging healthy, active lifestyles through pathway and sidewalk connectivity has been a focus
City of San Francisco 2010 Bicycle Count Report
 City of San Francisco 2010 Bicycle Count Report November 2010 0 Table of Contents Page No. List of Tables & Figures 2 Report Highlights 3 Introduction 4 Methodology 6 Results 6 Recommendations 12 Conclusions
2011 Bicycle Count Report
 2011 Bicycle Count Report City of San Francisco December 2011 SFMTA Municipal Transportation Agency The San Francisco Municipal Transportation Agency (SFMTA) 2011 Bicycle Count Report is a collaborative
2. Context. Existing framework. The context. The challenge. Transport Strategy
 Transport Strategy Providing quality connections Contents 1. Introduction 2. Context 3. Long-term direction 4. Three-year priorities 5. Strategy tree Wellington City Council July 2006 1. Introduction Wellington
MEMORANDUM. City Constituents. Leilani Schwarcz, Vision Zero Surveillance Epidemiologist, SFDPH
 MEMORANDUM TO: FROM: CC: City Constituents Leilani Schwarcz, Vision Zero Surveillance Epidemiologist, SFDPH Megan Wier, Co-Chair, San Francisco Vision Zero Task Force, SFDPH Commander Ann Mannix, Traffic
TOWN OF PORTLAND, CONNECTICUT COMPLETE STREETS POLICY
 TOWN OF PORTLAND, CONNECTICUT COMPLETE STREETS POLICY I. VISION, GOALS & PRINCIPLES VISION To improve the streets of Portland making them safer and more accessible for all users including pedestrians,
Goal 3: Foster an environment of partnerships and collaboration to connect our communities and regions to one another.
 Non-Motorized Transportation Plan (NMTP) Draft Vision, Goal and,, Tri-County Regional Planning Commission (TCRPC) Purpose The purpose of the Tri-County Regional Planning Commission (TCRPC) Non-Motorized
ORDINANCE NO
 1 Sponsored by: Councilmembers Stan Flemming, Connie Ladenburg, and Rick Talbert 2 Requested by: Executive/Public Works and Utilities - Transportation Services 3 4 5 6 7 10 11 ORDINANCE NO. 2014-445 12
Project Goal and Description. Why Broadway? Broadway SFMTA.COM/BROADWAY. The goal of the Broadway Safety Improvement
 PROJECT OVERVIEW Project Goal and Description The goal of the Broadway Safety Improvement d St Van Ness Ave Project is to improve safety and comfort for all who Franklin St Hyde St Octavia St Gough St
Compiled by the SFMTA Livable Streets Subdivision Staff
 March 2012 SFMTA Livable Streets Report to the San Francisco Bicycle Advisory Committee (BAC) See www.sfgov.org/bac for more information. Compiled by the SFMTA Livable Streets Subdivision Staff A. BICYCLE
G AT E WAY PLAN. Community BRIEFING KIT GATEWAY BIKE
 G AT E WAY PLAN GATEWAY BIKE Community BRIEFING KIT PLAN August 2016 TABLE OF CONTENTS INTRODUCTION... 1 THE BENEFITS OF A BIKEABLE COMMUNITY... 2 ECONOMY...2 SAFETY...3 HEALTH...3 HOUSEHOLD SPENDING...3
Replace century-old sewer & water pipes Pedestrian-scale sidewalk lighting
 PROJECT OVERVIEW The Masonic Avenue Streetscape Project is an effort to improve safety for everyone travelling on Masonic Avenue between Geary Boulevard and Fell Street. This project will bring a variety
BICYCLE STRATEGY UPDATE
 SFMTA Municipal Transportation Agency Image: Bike locks in front of San Francisco main library BICYCLE STRATEGY UPDATE 2015 SAN FRANCISCO, CALIFORNIA Bicycle Strategy Overview Four Goals: 1. Improve safety
APPENDIX A. Outreach Summary
 APPENDIX A Outreach Summary COUNTYWIDE TRANSPORTATION PLAN Summary of Public Outreach and Engagement To gather an understanding of the transportation issues and priorities throughout the county, and inform
Outreach Approach RENEW SF served as the primary liaison with the North Beach community; the Chinatown. Executive Summary
 Executive Summary Executive Summary The Columbus Avenue Neighborhood Transportation Study s objective is to identify changes to transportation infrastructure and policies that could enhance the livability
Monterey Road Complete Streets
 Monterey Road Complete Streets Complete Street Objectives Improve livability and economic vitality Enhance pedestrian environment Accommodate bicyclists safely Reduce noise and air pollution Create attractive,
TRANSPORTATION TRAINING TOPICS. April 6, 2010
 TRANSPORTATION TRAINING TOPICS April 6, 2010 Roles of Transportation Providers Context and Policy Makers Division of Transportation and Traffic Other City Operations Other Transportation Operators CMA
2016 Capital Bikeshare Member Survey Report
 2016 Capital Bikeshare Member Survey Report Prepared by: LDA Consulting Washington, DC 20015 (202) 548-0205 February 24, 2017 EXECUTIVE SUMMARY Overview This report presents the results of the November
NASHUA REGIONAL PLANNING COMMISSION REGIONAL BICYCLE AND PEDESTRIAN PLAN
 NASHUA REGIONAL PLANNING COMMISSION REGIONAL BICYCLE AND PEDESTRIAN PLAN June, 2005 Prepared by the Nashua Regional Planning Commission 2005 NRPC Regional Bicycle and Pedestrian Plan- JUNE 2005 ACKNOWLEDGEMENTS
City of San Diego Vision Zero Draft Strategic Plan FY 2017
 City of San Diego Vision Zero Draft Strategic Plan FY 2017 Engineering Objective: To develop and implement a strategy that employs best planning, design and engineering practices. Background: Over the
TABLE OF CONTENTS. Executive Summary
 Executive Summary Background... ES-1 Pedestrian Network... ES-2 Bikeway Network... ES-2 Collision History... ES-2 Public Input... ES-4 Conclusions and Recommendations... ES-4 1. Introduction and Setting
Exhibit 1 PLANNING COMMISSION AGENDA ITEM
 Exhibit 1 PLANNING COMMISSION AGENDA ITEM Project Name: Grand Junction Circulation Plan Grand Junction Complete Streets Policy Applicant: City of Grand Junction Representative: David Thornton Address:
Citizens Advisory Committee March 26, 2014
 Memorandum 0..1 Citizens Advisory Committee March, 1 Citizens Advisory Committee Maria Lombardo Chief Deputy for Policy and Programming Elizabeth Sall Interim Deputy Director for Planning Vision Zero Committee
MONTGOMERY COUNTY PLANNING DEPARTMENT THE MARYLAND-NATIONAL CAPITAL PARK AND PLANNING COMMISSION
 MONTGOMERY COUNTY PLANNING DEPARTMENT THE MARYLAND-NATIONAL CAPITAL PARK AND PLANNING COMMISSION MCPB Item No. 4 Date: 09-10-15 Scope of Work for the Bicycle Master Plan David Anspacher, Planner/Coordinator,
SF Transportation Plan Update
 SF Transportation Plan Update CAC Meeting #11 Existing Conditions and Future Baseline Needs Revised, Part I www.sfcta.org/movesmartsf twitter.com/sanfranciscota www.facebook.com/movesmartsf January 30,
MEMORANDUM. Charlotte Fleetwood, Transportation Planner
 MEMORANDUM Date: Updated August 22, 2017 To: Organization: Charlotte Fleetwood, Transportation Planner Boston Transportation Department From: Jason DeGray, P.E., PTOE, Regional Director of Engineering
An Assessment of Potential Greenhouse Gas Emissions Reductions from Proposed On Street Bikeways
 An Assessment of Potential Greenhouse Gas Emissions Reductions from Proposed On Street Bikeways Through the Sustainable Bethlehem Initiative, the Town of Bethlehem has identified both the improvement of
modes, the increased roadway capacity is the implied solution, which, in turn, has been shown to lead to more driving (induced demand).
.") CONGESTION MANAGEMEN T PROGRAM DECEMBER, 201 7 EXECUTIVE SUMMARY A. Introduction Every two years, the San Francisco County Transportation Authority (SFCTA) prepares the San Francisco Congestion Management
CONGESTION MANAGEMEN T PROGRAM DECEMBER, 201 7 EXECUTIVE SUMMARY A. Introduction Every two years, the San Francisco County Transportation Authority (SFCTA) prepares the San Francisco Congestion Management
San Francisco Pedestrian Safety Capital Improvement Program: A Step Towards Vision Zero
 San Francisco Safety Capital Improvement Program: A Step Towards Vision Zero March 5, 2014 The First Steps In April 2013, Mayor Lee issued the Strategy which directed City departments to implement solutions
Data Analysis February to March Identified safety needs from reported collisions and existing travel patterns.
 Welcome! Thank you for participating in today s Valencia Bikeway Improvements workshop. Data Analysis February to March Identified safety needs from reported collisions and existing travel patterns. Initial
Active Transportation on the Rise
 Integrated Approaches to Shared-Use Paths Doug Sarkkinen, PE Windi Shapley, PE Mandi Roberts, AICP, PLA Why? Biking and walking are important active transportation options. Shared-use paths are critical
Briefing Paper #1. An Overview of Regional Demand and Mode Share
 2011 Metro Vancouver Regional Trip Diary Survey Briefing Paper #1 An Overview of Regional Demand and Mode Share Introduction The 2011 Metro Vancouver Regional Trip Diary Survey is the latest survey conducted
FOLSOM-HOWARD STREETSCAPE OVERVIEW
 FOLSOM-HOWARD STREETSCAPE OVERVIEW SoMa residents should have the same kinds of amenities that other neighborhoods have. The Folsom- Howard Streetscape Project will make SoMa more livable by making it
Modal Shift in the Boulder Valley 1990 to 2009
 Modal Shift in the Boulder Valley 1990 to 2009 May 2010 Prepared for the City of Boulder by National Research Center, Inc. 3005 30th Street Boulder, CO 80301 (303) 444-7863 www.n-r-c.com Table of Contents
EXECUTIVE SUMMARY: TRANSIT-ORIENTED DEVELOPMENT IN SMITHS FALLS, ONTARIO; A COMPARISON BETWEEN TWO SITES
 EECUTIVE SUMMARY: TRANSIT-ORIENTED DEVELOPMENT IN SMITHS FALLS, ONTARIO; A COMPARISON BETWEEN TWO SITES Topic and Purpose In 2007, the Mayor of Ottawa s Task Force on Transportation suggested adding a
WALK- AND bike-friendly TURLOCK
 WALK- AND bike-friendly TURLOCK Ideas to Encourage Walking and Biking Benefits to the COMMUNITY Get Connected People who walk and bike have many more opportunities for casual interactions with friends
Extending Parking Meter Hours SAN FRANCISCO, CALIFORNIA
 Extending Parking Meter Hours 10 13 2009 SAN FRANCISCO, CALIFORNIA Background Purpose of study To assess where and when extended parking meter hours make sense Why meter parking? Meters: Create parking
Moving Cambridge. City of Cambridge Transportation Master Plan Public Consultation Centre. March 7, :00 8:00 PM.
 City of Cambridge Transportation Master Plan Public Consultation Centre March 7, 2018 5:00 8:00 PM Region of Waterloo City of Cambridge Transportation Master Plan Public Consultation Centre March 7, 2018
Proposed. City of Grand Junction Complete Streets Policy. Exhibit 10
 Proposed City of Grand Junction Complete Streets Policy Exhibit 10 1 City of Grand Junction Complete Streets Policy Vision: The Complete Streets Vision is to develop a safe, efficient, and reliable travel
Toronto Complete Streets Guidelines
 88 90 5.1 Cycling Design Principles 92 5.2 Context-sensitive Cycling Facilities 96 5.3 Key Cycling Elements Cycling infrastructure provides choice in how people are able to move around the city. Cyclists
DRAFT MOVING FORWARD RHODE ISLAND BICYCLE MOBILITY PLAN 2018 PREPARED FOR PREPARED BY IN ASSOCIATION WITH
 RHODE ISLAND MOVING FORWARD BICYCLE MOBILITY PLAN 2018 PREPARED FOR PREPARED BY IN ASSOCIATION WITH T AF CHAPTER 1 D R INTRODUCTION CHAPTER 3 ARTICULATES VISION Bicycling is safe, fun and practical in
Thank you for this opportunity to discuss with you how we can work together to make our streets more complete.
 Thank you for this opportunity to discuss with you how we can work together to make our streets more complete. 1 2 3 Thank you for this opportunity to discuss with you how we can work together to make
MCTC 2018 RTP SCS and Madera County RIFP Multi-Modal Project Eval Criteria GV13.xlsx
 MCTC 8 RTP SCS and Madera County RIFP Multi-Modal Project Eval Criteria GV.xlsx Madera County Transportation Commission Regional Transportation Plan / Sustainable Communities Strategy Multi-Modal Project
5. Pedestrian System. Accomplishments Over the Past Five Years
 5. Pedestrian System Accomplishments Over the Past Five Years The Alamo Area Metropolitan Planning Organization (MPO) and its partner agencies recognize the importance of improving pedestrian mobility.
8. Collisions INTRODUCTION
 8. Collisions INTRODUCTION While traffic collisions can affect anyone, they have a disproportionate impact on bicyclists, who along with pedestrians are the most vulnerable users of the transportation