Investment in Active Transport Survey
|
|
|
- Patience Lang
- 6 years ago
- Views:
Transcription
1 Investment in Active Transport Survey
2 KEY FINDINGS 3 METHODOLOGY 7 CYCLING INFRASTRUCTURE 8 Riding a bike 9 Reasons for riding a bike 9 Mainly ride on 10 Comfortable riding on 10 Rating of cycling infrastructure 11 Sufficient infrastructure for cycling 11 Impact of insufficient infrastructure on behaviour 12 Improvements in cycling infrastructure 12 WALKING INFRASTRUCTURE 13 Frequency of walking in the past week 14 Reasons for walking 14 Rating of walking infrastructure 15 Sufficient infrastructure for walking 15 Impact of insufficient infrastructure on walking 16 Improving in walking infrastructure ACTIVE TRANSPORT TO SCHOOL 17 Travelling to and from school 18 Rating of infrastructure for travelling to and from school 18 Improvements in infrastructure for travelling to and from school 19 PUBLIC TRANSPORT INFRASTRUCTURE 20 Use of public transport 21 Reasons for not using public transport 21 Rating of infrastructure for public transport 22 Improvements in public transport infrastructure GOVERNMENT INVESTMENT IN INFRASTRUCTURE 24 Support for government funding 25 Reasons for supporting the expansion of government funding 25 Key areas for expanding government funding 26 Redirecting government funding from roads to cycling 26 Redirecting government funding from roads to walking 26 Government to fund walking/cycling infrastructure 27 2
3 KEY FINDINGS GOVERNMENT INVESTMENT IN INFRASTRUCTURE More than 70% of people would support the increase of Government funding to help fund infrastructure for cycling, walking and public transport. The support for the expansion of Government funding in cycling, walking and public transport infrastructure is similar across demographic factors, irrespective of gender, age, household income or distance of residence from the CBD. In fact, for those who have never cycled or used public transport, more than one in two would still support additional Government funding for cycling, walking and public transport infrastructure. The community feels it is important to increase funding on infrastructure making bike/walk paths safe for users, separating bike/walk paths and improving the accessibility and reliability of public transport. Close to one in three people believe there should be a reallocation of funds from roads to walking infrastructure, with one in four also holding the view that Government should shift funding from roads to cycling infrastructure. Overall, close to two in three people believe Government should fund walking and cycling infrastructure when there is an upgrade or construction of new urban road infrastructure. 71% of people support more funding for cycling, walking and public transport infrastructure. 62% of people believe Government should fund walking and cycling infrastructure when there is an upgrade or construction of road infrastructure. 3
4 KEY FINDINGS CYCLING BEHAVIOUR More than one in three people living in metropolitan cities across Australia aged 25 to 59 reported that they have ridden a bike in the past month. Men and those living within 15km from the CBD were more likely to have reported that they had ridden a bike within the past 12 months. For those who had ridden a bike within the past 12 months, the overwhelming majority had done so for recreational purposes, either for exercise or for fun. Only one in six people reported that they cycle for commuting purposes. The majority of people (76%) reported that they mainly ride on quiet roads, compared to only one in five who predominantly ride on busy roads. Men were twice as likely as women to have reported that they mainly ride on busy roads, with women significantly more likely to report feeling uncomfortable to ride on roads with no bike lanes. Only one in six people who have cycled in the past 12 months did so for commuting purposes to and from work, shops and public transport. Three in four people are not comfortable to cycle on roads where there are no separated bike lanes. CYCLING INFRASTRUCTURE Less than one in twelve people rated their local cycling infrastructure as excellent, with most likely to have the view that the state of the infrastructure is either adequate or poor. With few rating cycling infrastructure as excellent, it is of no surprise that more than two in five people reported that the lack of cycling infrastructure has prevented them from riding a bike for recreation, exercise or transport purposes. Women were more likely than men to report that the lack of infrastructure has resulted in them riding less often than what they would have liked. If cycling infrastructure was improved, more than one in two people reported that it would either encourage them to start cycling or it they would increase their current level of cycling. Improving any cycling infrastructure (i.e. separate lanes, connectivity or width of lanes) would boost the likelihood of people either starting to ride a bike or for those who currently ride, to cycle more frequently. 44% of people are prevented from cycling due to lack of infrastructure. More than one in two people would cycle more often if infrastructure was improved. 4
5 KEY FINDINGS WALKING BEHAVIOUR Less than one in four people living in metropolitan areas walked on average once a day for at least 10 minutes. In fact, close to one in three people walk only up to two times a week. The majority of people (71%) walk for exercise or recreation purposes, compared to only one in three who walk as a form of transport (i.e. to/from work or to/from public transport). In the past week, 32% of people walked for 10 minutes on two or fewer occasions. WALKING INFRASTRUCTURE Only one in ten people rated walking infrastructure in their local area as being excellent, with more than half rating the current state of walking infrastructure as adequate or poor. More than one in three people felt there was insufficient infrastructure in their local area to enable walking to/from work. Similarly, around one in four also felt that there was insufficient infrastructure in place to enable walking to/from public transport or to/from shops. Close to one in three people reported that the lack of walking infrastructure in their local area has prevented them from walking for recreation and/or transport purposes. If walking infrastructure was improved, more than three in five people reported that it would either encourage them to start walking or that they would increase their current level of walking. Close to one in three people do not walk for exercise or transport purposes due to lack of infrastructure. More than 60% would walk more if infrastructure was improved. 5
6 KEY FINDINGS ACTIVE TRANSPORT TO SCHOOL On most days, close to two in three children travel to/from school by car, with walking the next most common form of transport. Only one in twelve children ride to/from school on most days. For families living within 15km of the CBD, children were significantly more likely to ride or walk to school. However, for families living more than 15km from the CBD, children were more likely to travel to/from school by car. At least two in three parents rate current walking and cycling infrastructure to and from their child(ren) s school as being adequate at best. In fact, more than two in five parents believe there is inadequate bike lanes for their child(ren) to ride to and from school. Parents were also likely to report current resources were inadequate in relation to bike racks or secure bike parking. If cycling or walking infrastructure to/from school were to be improved, a significantly higher proportion of parents reported that they would allow their child(ren) to walk and/or ride to school. Safety and separation of bike/walk paths were the two biggest issues, that, if improved, would lead to parents being more likely to allow their child(ren) to ride and/or walk to school. 62% of kids mainly travel to and from school by car. Only 8% ride their bike. If infrastructure was improved, more than 50% of parents would allow their kids to ride or walk to school. PUBLIC TRANSPORT USAGE AND INFRASTRUCTURE One in five people living in metropolitan areas reported that they are regular users of public transport (at least five days a week). On the other hand, close to one in three reported that they infrequently use public transport (less than monthly), with an additional 18% reporting they have never used public transport. Cycling infrastructure to public transport was rated poorly, with close to one in three reporting inadequate bike storage facilities or bike racks, and one in four people also rating integrated bike paths to/from public transport as being inadequate. Improvements in infrastructure (walking and cycling) would encourage at least one in two people in metropolitan areas to be more active in their travel to/from public transport. Improving the separation of walk/bike lanes and infrastructure for the safety of users would lead to people walking/cycling to public transport. More than one in two people would cycle or walk to public transport if infrastructure was improved. 6
7 RESEARCH METHODOLOGY In May 2015, the National Heart Foundation of Australia and the Cycling Promotion Fund conducted an online survey with a sample of 1,006 Australians aged 25 to 59. To be eligible to participate in the survey, participants were required to live in any of the following metropolitan areas Sydney, Melbourne, Brisbane, Perth, Adelaide, Darwin, Canberra and Hobart. ACCURACY OF RESULTS This survey was based on a sample of Australian adults. As it is not a census, some level of error is inherent in the results. This error can be quantified statistically to give a margin of error - essentially, this means that, with 95% confidence, a given range contains the true result at a population level. The error margin was 3.09%, meaning that, with 95% confidence, a result, plus or minus the error margin (i.e. 50% ±3.09%), contains the true result at the population level. Gender Male 50% Female 50% Location Melbourne 33% Sydney 31% Brisbane 12% Adelaide 11% Perth 9% Canberra 2% Hobart 2% Darwin 1% Proximity to the city centre/cbd 0 to 5 km 10% 6 to 10km 19% 11 to 15 km 18% 16 to 20km 16% 20km or more 34% Unsure 3% Main activity Working full time 55% Working on a part-time or casual basis 19% Home duties 11% Looking for work 5% Retired 4% Doing study or training 3% Doing unpaid voluntary work 1% Something else 2% Prefer not to say 1% Total Household Income Below $25,000 7% Between $25,000 to $55,000 17% Between $55,001 to $85,000 21% Between $85,001 to $100,000 13% Over $100,000 29% Prefer not to say 14% 7
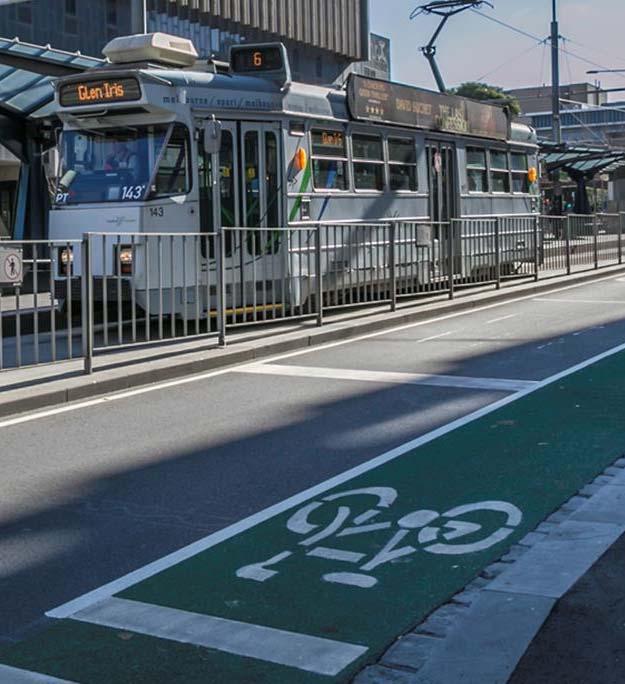
8 CYCLING INFRASTRUCTURE 8
9 RIDING A BIKE More than one in two people living in metropolitan areas across Australian aged 25 to 59 reported that they have ridden a bike in the past year. Those living within 15km from the CBD were 25% more likely to have reported that they had ridden a bike within the past 12 months. Men were also significantly more likely to have reported that they had ridden a bike in the past 12 months compared to women (60% cf. 42%, p<.01). In addition, those with a household income of more than $85,000 per annum were more likely to have ridden a bike compared to those with a household income of less than $55,000 per annum (58% cf. 40%, p=.01). One in three people living in metropolitan areas had ridden a bike within the past month. When did you last ride a bike? Within the last week 17% Within the last fortnight 8% Within the last month 9% Within the last three months 8% Within the last year 10% More than a year ago 40% Never 7% Unsure 2% REASON FOR RIDING A BIKE For those who had ridden a bike within the past 12 months, the overwhelming majority had done so for recreational purposes, either for exercise or for fun. Only one in six people had reported that they had cycled for commuting purposes. Men were more than twice as likely to have ridden a bike for commuting purposes compared to women (21% cf. 9%, p<.01), with those living within 10km from the CBD also more likely to have ridden a bike for commuting purposes than those living at least 20km from the CBD. Do you ride a bike for? Recreation (just for fun or exercise) 90% Local trips (e.g. to the shops, visit friends and family) 35% Commuting (cycling as a means of transport to work or public transport) 16% Other 1% 9
10 MAINLY RIDE ON For those who had ridden a bike within the past 12 months, more than three in four reported that they mainly ride on quiet roads, compared to only 21% reporting that they ride on busy roads. Men were twice as likely as women to have reported that they mainly ride on busy roads. When riding, do you mainly ride on? Quiet roads 76% Shared paths (pedestrians and bicycles) 61% Road bicycle lanes 35% Footpaths 28% Busy roads 21% Other 3% COMFORTABLE RIDING ON Only one in four (26%) of those who had cycled in the past 12 months reported that they felt either very comfortable or comfortable riding on a road where there are no bike lanes. As men were significantly more likely to have reported that they mainly ride on busy roads, it is of no surprisethatmenwereconsiderablymorelikelytofeelcomfortableridingonroadswithnobikelanes than women (32% cf. 17%, p=.01). In comparison, 77% of people reported that they feel comfortable cycling on the road only where there are separated bike lanes. How comfortable do you feel riding on roads in the following conditions? Very comfortable Comfortable Slightly uncomfortable Very uncomfortable Off road bike path 52% 35% 11% 3% On road with separated bike lanes 31% 46% 18% 5% On road with bike lanes 17% 44% 31% 8% On road with no bike lanes 9% 17% 31% 44% 10

11 RATING OF CYCLING INFRASTRUCTURE Few people rate their local infrastructure as being excellent, with most likely to hold the view that the state of the infrastructure was either adequate or poor. Fewer than one in four people reported that the width of bike lanes was either excellent or very good, with even fewer reporting that the current state of lighting along routes or connection between bike routes was excellent or very good. In fact, more than 40% of people felt their local infrastructure was poor for separation of bike lanes and parked vehicles. How would you rate cycling infrastructure in your local area (or where you ride)? Excellent Very good Adequate Poor Very poor Don't know Off road or separated bike paths 7% 19% 31% 19% 9% 14% Quality of surface 7% 20% 43% 13% 5% 12% Width of bike lanes 6% 17% 38% 17% 8% 13% Bike route signage 5% 15% 33% 21% 11% 15% Connectivity (or linking) between bike routes 5% 14% 34% 21% 8% 17% Separation between on-road bike lanes and parked 5% 11% 28% 27% 16% 15% Quantity of bike racks/secure bike parking 4% 11% 28% 25% 11% 20% Lighting along routes 4% 11% 33% 25% 11% 17% Availability of on-street parking rails 4% 10% 29% 25% 12% 20% SUFFICIENT INFRASTRUCTURE FOR CYCLING. Only one in three people feel that there is sufficient infrastructure in their local area to enable them to ride to and from work. Similarly, around one in two feel there is adequate infrastructure in place in their local area to ride to/from public transport or to/from shops. The perceived lack of infrastructure for riding to and from work, shops or public transport is a key driver for the low proportion of people who ride a bike for commuting purposes. Only one in three people believe there is sufficient infrastructure for riding to and from work. Is there sufficient infrastructure in your local area when riding a bike? Yes No For exercise/recreation 71% 29% To/from shops 55% 45% To/from public transport 49% 51% To/from work 37% 63% 11
12 IMPACT OF INSUFFICIENT INFRASTRUCTURE ON BEHAVIOUR More than two in five people reported that the lack of infrastructure has prevented them from riding their bike for recreation and/or transport purposes. Women were more likely than men (50% cf. 37%, p=.01) to report the lack of infrastructure has meant they ride less often then what they would like to do. The lack of infrastructure affects women more than men. Has this lack of sufficient infrastructure prevented you from riding a bike for transport or recreation? Yes 44% No 42% Unsure 14% IMPROVEMENTS IN CYCLING INFRASTRUCTURE If a number of cycling infrastructure aspects were to be improved, more than one in two people reported that it would either encourage them to start cycling, or increase their current level of cycling. Improving any aspects of cycling infrastructure would boost the likelihood of people either starting to ride a bike, or for those who currently ride, to cycle more often. Would improved cycling infrastructure encourage you to start or increase cycling for transport or recreation? Yes No Separation between on-road bike lanes and parked vehicles 66% 34% Connectivity (or linking) between bike routes 66% 34% Width of bike lanes 62% 38% Quality of surface 62% 38% Bike route signage 58% 43% Quantity of bike racks/secure bike parking 55% 45% Number of on street parking rails 48% 52% 12
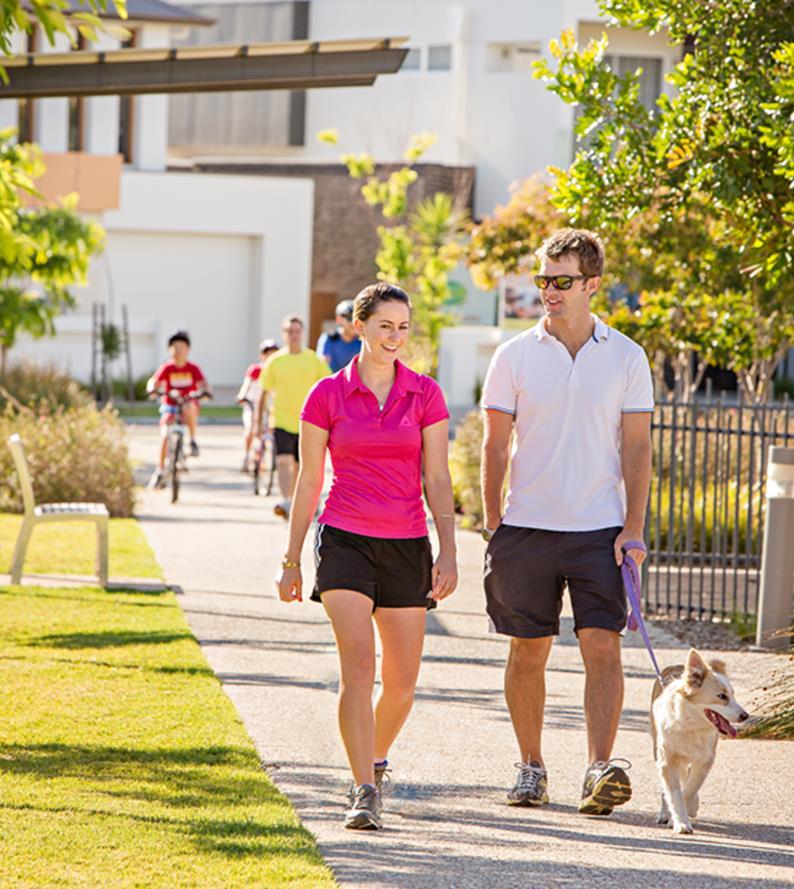
13 WALKING INFRASTRUCTURE 13
14 FREQUENCY OF WALKING IN THE PAST WEEK Fewer than one in four people living in metropolitan areas had walked at least seven times (for at least 10 minutes) within the past week. In fact, a higher proportion of people had walked on two or fewer occasions in the past week. In the last week, how many times have you walked continuously, for at least 10 minutes, for recreation, exercise or to get to or from places? None 13% 1 to 2 times 19% 3 to 4 times 21% 5 to 6 times 21% 7 to 8 times 10% 9 to 10 times 8% 11 to 15 times 3% More than 15 times 5% More than 30% had walked for at least 10 minutes on two or fewer occasions in the past week. REASON(S) FOR WALKING Just over one in three people reported that they had walked regularly for commuting purposes, that is, to and from work or public transport. In comparison, close to double regularly walk for recreation or exercise purposes. Whilst there was little differences in the proportion of people who walk to shops or for recreation purposes by age or their proximity to the CBD, there was a significant difference between those who walk for commuting purposes. Those who live within 10km of the CBD (46% cf. 30%, p<.01) or are in their 20 s or 30 s (41% cf. 32%, p=.01) were significantly more likely to report that they walk to/from public transport or to/from work than those in their 40 s or 50 s or those living further away from the CBD. Do you walk for? Recreation (just for fun or exercise) 71% Local trips (e.g. to the shops, visit friends and family) 56% Commuting (cycling as a means of transport to work or public transport) 36% Other 7% 14
15 RATING OF WALKING INFRASTRUCTURE IN LOCAL AREA Only one in ten (or fewer) rated various aspects of walking infrastructure in their local area as being excellent, with most likely to rate the current state of infrastructure as either being very good or adequate. Similar to cycling infrastructure, lighting along walking routes was judged as being poor, with signage another aspect that was more likely to be judged as being inadequate. SUFFICIENT INFRASTRUCTURE FOR WALKING More than one in three people felt there was insufficient infrastructure in their area to enable walking to and from work. Similarly, around one in four felt there was also insufficient infrastructure in place to enable walking to public transport or to shops. Those living more than 15km from the CBD were more likely to report that there was insufficient infrastructure in their area to enable them to walk to work (45% cf. 30%, p<.01). Thinking about the above aspects of walking infrastructure, do you think there is sufficient infrastructure in your local area when walking? Yes No For exercise/recreation 79% 21% To/from shops 78% 22% To/from public transport 75% 25% To/from work 63% 38% 15
16 IMPACT OF INSUFFICIENT INFRASTRUCTURE ON WALKING Close to one in three people reported that the lack of infrastructure has prevented them from walking for either recreation and/or transport purposes. Women were more likely than men to report that the lack of infrastructure has resulted in them walking less often than what they would have liked to (34% cf. 26%, p<.01), with those living within 15km of the CBD also more likely to report they walk less due to insufficient infrastructure (37% cf. 24%, p<.01). The lack of infrastructure affects women more than men. Has this lack of sufficient infrastructure prevented you from walking for transport or recreation? Yes 30% No 59% Unsure 11% IMPROVEMENTS IN WALKING INFRASTRUCTURE If walking infrastructure was improved, more than three in five people reported that it would either encourage them to start walking, or they would increase their current level of walking. With one in four people holding the view that lighting of walking routes was poor, it is of no surprise that improving lighting would encourage three in four people to walk more. If walking infrastructure were improved in your local area, would it encourage you to start or increase walking for transport or recreation? Yes No Street lighting or lighting along walking routes 73% 27% Footpaths 73% 27% Separate off-road walking paths 71% 29% Connectivity (or linking) between footpaths 69% 31% Free of obstructions such as vegetation and parked cars 69% 31% Pedestrian lights or zebra crossings 65% 36% Connectivity (or linking) with public transport services 64% 36% Pedestrian signage 60% 40% 16

17 ACTIVE TRANSPORT TO SCHOOL 17
18 TRAVELLING TO AND FROM SCHOOL Close to two in three children predominantly travel to and from school by car, with walking the next most common form of transport. Only one in twelve kids ride to and from school on most days. For families living within 15km of the CBD, children were significantly more likely to ride (40% cf. 25%, p=.01) or walk (12% cf. 5%, p=.01), to and from school. Conversely, for families living more than 15km from the CBD, children were more likely to travel to and from school by car (68% cf. 54%, p=.01). Only one in twelve kids ride to and from school. How does your child(ren) get to and from school? Family vehicle / car-pool 62% Walk 31% Public transport 19% Bike 8% Other 13% RATING OF INFRASTRUCTURE FOR TRAVELLING TO AND FROM SCHOOL At least two in three parents rate the current walking and/or cycling infrastructure for travelling to and from their child(ren) s school as being adequate at best. In fact, more than two in five parents believe there is inadequate bike lanes for children to ride to and from school. Parents were also likely to report resources were inadequate in relation to bike racks or secure bike parking. How would you rate walking and bicycle infrastructure travelling to and from your Excellent Very good Adequate Poor Very poor child(ren) s school (i.e. door to door)? Overall security and safety for cyclists 8% 18% 36% 31% 7% Safety of intersections and crossings 8% 21% 40% 25% 6% Separated off-road cycling or walking paths 8% 24% 35% 25% 8% Road surfaces 8% 28% 46% 16% 3% Bike racks/secure bike parking 7% 23% 38% 27% 6% Personal safety 7% 22% 46% 18% 7% Other children riding bikes or walking 7% 23% 45% 21% 5% Connectivity between footpaths 6% 22% 46% 21% 5% Lighting along the school route 6% 24% 45% 21% 4% Traffic speeds 6% 20% 48% 21% 6% Bike lanes 5% 20% 31% 32% 13% 18
19 IMPROVEMENTS IN THE INFRASTRUCTURE FOR TRAVELLING TO AND FROM SCHOOL If cycling and/or walking infrastructure for travelling to and from school was improved, a significantly high proportion of parents reported that they would allow their child(ren) to walk and/or ride to school. Safety and separation of bike/walk paths were the two biggest issues, that, if improved, would lead to parents being more likely to allow kids to ride or walk to and from school. If walking and bicycle infrastructure were improved, how likely would you be to allow your children to start or increase riding or walking to and from school? Very likely Likely Neither likely nor unlikely Unlikely Very unlikely Personal safety 23% 41% 26% 7% 4% Safety of intersections and crossings 21% 39% 28% 8% 4% Completely separated off-road cycling or walking paths 21% 42% 26% 7% 5% More security and safety for cyclists 20% 37% 29% 9% 5% Adult supervision 20% 39% 32% 6% 4% Other children riding bikes or walking 19% 36% 32% 8% 4% More bike lanes 15% 40% 31% 9% 5% Reduced traffic speeds 15% 37% 35% 9% 4% Road surfaces 15% 38% 34% 9% 5% Better connectivity / more direct routes 14% 39% 34% 9% 5% More bike racks / secure bike parking 14% 32% 38% 11% 5% Better lighting along routes 14% 39% 35% 9% 4% Wider lanes on the roads 13% 35% 34% 13% 6% 19

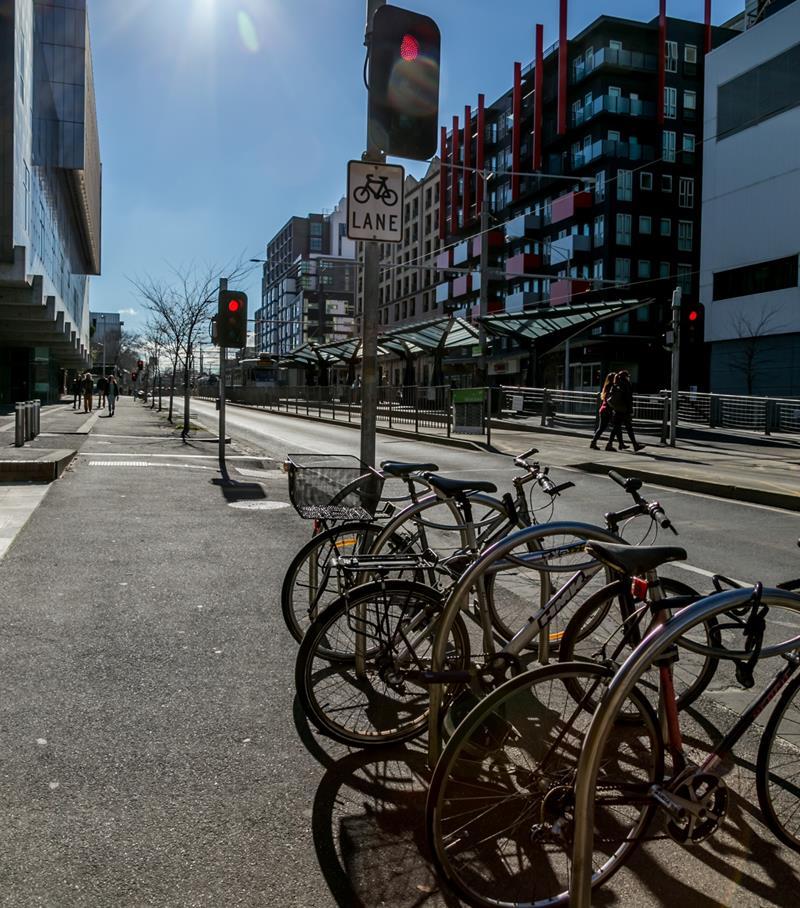
20 PUBLIC TRANSPORT INFRASTRUCTURE 20
21 USE OF PUBLIC TRANSPORT One in five people living in metropolitan areas aged 25 to 59 reported that they use public transport at least five days a week. Conversely, nearly one in three reported that they infrequently use public transport (less than monthly), with an additional 18% reporting they have never used public transport. Those living within 15km from the CBD were more likely to be frequent users of public transport, with two in three using public transport at least once a fortnight, compared to 40% of people living more than 15km from the CBD. Two in five people in cities use public transport at least once a week. How often do you use public transport? Every day 5% 5-6 days a week 15% 3-4 days a week 9% 1-2 days a week 11% Less than weekly 8% Less than fortnightly 5% Less than monthly 29% Never 18% REASON(S) FOR NOT USING PUBLIC TRANSPORT For the one in six people living in metropolitan areas who have never used pubic transport, personal preference and service issues were the primary reasons for not using public transport. What is the main reason you do not use public transport? I would rather drive 38% Unreliable/uncomfortable/lack of services 15% Don't need to 15% Dislike public transport 7% Feel unsafe 6% Too expensive 5% No direct line from work and home 5% Shorter travel time by car 5% Work requires me to use my car 3% Other 6% Unsure 1% 21
22 RATING OF PUBLIC TRANSPORT INFRASTRUCTURE In relation to public transport infrastructure, most likely to be rated poorly was bike storage facilities or bike racks. In addition, one in four people rated the integration of bike paths/lanes as being inadequate. Those living more than 15km from the CBD were more likely to rate the aspects listed below of public transport as poor compared to those living closer to the CBD, with most significant differences relating to the existence of integrated bike paths or footpaths with public transport hubs. The lack of bike storage facilities or bike racks was rated equally as poor by people irrespective of the distance of their residence from the CBD. How would you rate the following aspects of public transport in your area? Excellent Very good Adequate Poor Very poor Unsure Proximity to home 15% 31% 37% 8% 5% 5% Frequency of services 7% 23% 39% 15% 7% 8% Reliability of services 6% 25% 40% 14% 6% 9% Integrated footpaths within public transport hubs 6% 24% 41% 13% 5% 11% Lighting 6% 22% 43% 16% 5% 8% Shelter 5% 21% 39% 20% 8% 7% Integrated bike paths/lanes within public transport hubs 5% 17% 33% 19% 7% 18% Bike storage/racks 4% 13% 30% 22% 10% 21% 22
23 IMPROVEMENTS IN PUBLIC TRANSPORT INFRASTRUCTURE Improvements in infrastructure (walking and cycling) would encourage at least one in two people to be more active in travelling to and from public transport. Improving the separation of walk/bike lanes and the safety for users would lead to people being more active in their use of public transport. The likelihood of using more active forms of transport to and from public transport was consistent across demographic factors, including distance from CBD, gender, age and household income. Would improvements encourage you to start or increase your active travel (e.g. walk, cycle) to public transport? Ensure pedestrians and cycle paths/lanes are safe for all users Improve accessibility and reliability of public transport Strongly agree Agree Neither Disagree Strongly disagree 25% 39% 30% 4% 3% 24% 37% 33% 4% 2% Separate pedestrians and bicycles from traffic 22% 37% 33% 5% 3% Ensure pedestrians and cycle paths/lanes are properly maintained 20% 42% 32% 4% 3% Ensure walking and cycling path of travel is continuous (i.e. door to door) 18% 39% 35% 5% 3% Separate pedestrian and bicycle lanes 18% 36% 36% 7% 3% Provide mid trip facilities (lighting, signs, seating, shade, drink fountains) 16% 38% 37% 6% 3% Prioritise pedestrians and bicycles where appropriate (type and location of crossings, timing of 16% 37% 37% 7% 4% traffic) Integrate walking and riding networks with public transport hubs 15% 41% 35% 5% 3% Provide end of trip facilities (bicycle parking, change facilities) 15% 37% 38% 7% 3% 23

24 GOVERNMENT INVESTMENT IN INFRASTRUCTURE 24

25 SUPPORT FOR GOVERNMENT FUNDING More than 70% of people would support increasing Government funding to help fund infrastructure for cycling, walking and public transport. The support for the expansion of Government funding in cycling, walking and public transport infrastructure was similar across demographic factors, irrespective of gender, age, household income or distance of residence from the CBD. In fact, for those who have never cycled or used public transport, more than one in two would still support additional Government funding for cycling, walking and public transport infrastructure. 70% support more funding for cycling, walking and public transport infrastructure. Do you support expanding Government funding to help fund infrastructure for bike riding, walking and public transport? Yes 71% No 12% Unsure 17% REASONS FOR SUPPORTING THE EXPANSION OF GOVERNMENT FUNDING The key reason for supporting additional Government funding for walking, cycling or public transport infrastructure is to help encourage physical activity levels within the community. Why do you support the expansion of Government funding to help fund infrastructure for bike riding, walking, and public transport? Public health/encourage physical activity in the community 40% Congestion on roads/increasing population/improvement in infrastructure needed 38% Environmentally friendly/safer 30% Encourages people to use public transport/keep cars off the road 9% Economically benefits individuals and government in long term 5% Other 2% Unsure 6% 25
26 KEY AREAS FOR EXPANDING GOVERNMENT FUNDING The three areas of cycling, walking and public transport infrastructure that the community believes is important for increased funding are: the safety of pedestrians and cyclists, the separation of bike/walking paths, and the accessibility and reliability of public transport. The three areas are equally supported within the community, irrespective of age, gender, household income or current use of cycling, walking or public infrastructure. What do you believe are the three most important aspects of infrastructure for bike riding, walking and public transport that Government should expand their funding on? Ensure pedestrians and cycle paths/lanes are safe for all users 51% Improve accessibility and reliability of public transport 49% Separate pedestrians and bicycles from traffic 46% Ensure pedestrians and cycle paths/lanes are properly maintained 28% Ensure walking and cycling path of travel is continuous (i.e. door to door) 26% Separate pedestrian and bicycle lanes 25% Integrate walking and riding networks with public transport hubs 23% Prioritise pedestrians and bicycles where appropriate 17% Provide mid trip facilities (lighting, signs, seating, shade, drink fountains) 16% Provide end of trip facilities (bicycle parking, change facilities) 15% Other 2% REDIRECTING GOVERNMENT FUNDING FROM ROADS TO CYCLING One in four people believe the Government should reallocate funding from roads to cycling infrastructure. Those who live within 15km of the CBD were significantly more likely to support redirection of funding from roads to cycling (30% cf. 22%, p=.01). Frequent users of public transport or those who frequently ride were also more likely to support the redirection of funds away from roads and towards cycling infrastructure. Do you believe Government funding should be redirected from the roads to cycling infrastructure? Yes 26% No 45% Unsure 30% 26
27 REDIRECTING GOVERNMENT FUNDING FROM ROADS TO WALKING Close to one in three people believe there should be a reallocation of funds from roads to walking infrastructure. Those who live within 15km of the CBD were significantly more likely to support the redirection of funding from roads to walking infrastructure (39% cf. 25%, p<.01). Do you believe Government funding should be redirected from the roads to better walking infrastructure? Yes 31% No 41% Unsure 28% GOVERNMENT TO FUND WALKING/CYCLING INFRASTRUCTURE Close to two in three people believe Government should fund walking and cycling infrastructure when there is an upgrade or construction of urban road infrastructure. The support for the funding of walking and cycling infrastructure is similar amongst those who frequently cycle or walk compared to those who seldom cycle or walk, as well as other demographic factors (residential proximity to CBD, age, gender and household income). Should Government be forced to fund walking and cycling infrastructure when building or upgrading urban road infrastructure? Yes 62% No 18% Unsure 20% 27
Baseline Survey of New Zealanders' Attitudes and Behaviours towards Cycling in Urban Settings
 Baseline Survey of New Zealanders' Attitudes and Behaviours towards Cycling in Urban Settings Highlights 67% of urban New Zealanders, 18 years of age or more own or have access to a bicycle that is in
Measuring and growing active modes of transport in Auckland
 AUCKLAND CLIENT TRANSPORT SECTION HEADLINE1 AUCKLAND TRANSPORT JUNE 2017 Measuring and growing active modes of transport in Auckland WAVE 3 1 AUCKLAND TRANSPORT 2 The overall business objective is to:
2017 North Texas Regional Bicycle Opinion Survey
 2017 North Texas Regional Bicycle Opinion Survey Sustainable Development Program Kevin Kokes, AICP Public Meetings April, 2018 North Central Texas Council of Governments MPO for the Dallas-Fort Worth Region
U.S. Bicycling Participation Study
 U.S. Bicycling Participation Study Report of findings from the 2016 survey Conducted by Corona Insights Commissioned by PeopleForBikes Released July 2017 Table of Contents Background and Objectives 3 Research
APPENDIX D. BICYCLE AND PEDESTRIAN AWARENESS SURVEY (Completed by Zogby International)
") APPENDIX D BICYCLE AND PEDESTRIAN AWARENESS SURVEY (Completed by Zogby International) Residents Views On Bicycling, Walking, and Jogging In Onondaga County Submitted to: Danielle Zebley Syracuse Metropolitan
APPENDIX D BICYCLE AND PEDESTRIAN AWARENESS SURVEY (Completed by Zogby International) Residents Views On Bicycling, Walking, and Jogging In Onondaga County Submitted to: Danielle Zebley Syracuse Metropolitan
City of Perth Cycle Plan 2029
 Bicycling Western Australia s response City of Perth Cycle Plan 2029 2012-2021 More People Cycling More Often ABOUT BICYCLING WESTERN AUSTRALIA Bicycling Western Australia is a community based, not-for-profit
When composing the study, our primary source for content analysis was a study
 Denise Arriaga Ibarra Natalie Garcia Vincente Velasco Victor Estrada Jonathan Marin Ignacio Alcaraz Cal Poly Pomona Cyclist Population When composing the study, our primary source for content analysis
Categorizing Cyclists: What Do We Know? Insights from Portland, OR
 Categorizing Cyclists: What Do We Know? Insights from Portland, OR Jennifer Dill, Ph.D. Professor, Urban Studies & Planning Director, Oregon Transportation Research & Education Consortium (OTREC) Portland
Ormond & McKinnon Walks Response to Draft Glen Eira Community Plan
 Response to Draft Glen Eira Community Plan We would like to take this opportunity to thank Glen Eira City Council for the opportunity to comment on the Glen Eira Draft Community Plan. Below is an outline
PERSONALISED TRAVEL PLANNING IN MIDLETON, COUNTY CORK
 PERSONALISED TRAVEL PLANNING IN MIDLETON, COUNTY CORK Elaine Brick Principal Transport Planner AECOM Abstract Smarter Travel funding was awarded to the Chartered Institute of Highways and Transportation
Auckland Transport Cycling Research
 Auckland Transport Cycling Research 13-05-13 Reader Notes: This report is based on the 2013 Auckland Transport Cycling Survey conducted by Ipsos. Interviews were predominantly completed online. The results
Community & Transportation Preferences Survey
 Community & Transportation Preferences Survey Webinar: August 5, 2015 Hugh Morris, AICP, LEED Realtor.org Jennifer Dill, Ph.D. trec.pdx.edu 1 Introduction National Association of Realtors Over 1,000,000
Life Transitions and Travel Behaviour Study. Job changes and home moves disrupt established commuting patterns
 Life Transitions and Travel Behaviour Study Evidence Summary 2 Drivers of change to commuting mode Job changes and home moves disrupt established commuting patterns This leaflet summarises new analysis
Determining bicycle infrastructure preferences A case study of Dublin
 *Manuscript Click here to view linked References 1 Determining bicycle infrastructure preferences A case study of Dublin Brian Caulfield 1, Elaine Brick 2, Orla Thérèse McCarthy 1 1 Department of Civil,
National Cycling Participation Survey 2017
 Page 1 National Cycling Participation Survey 2017 Prepared by Cameron Munro Project Manager Tony Arnold Abstract The National Cycling Participation Survey (NCPS) is a standardised survey that has been
Sherwood Drive Traffic Circle
 Strathcona County Sherwood Drive Traffic Circle Online Survey Results April 7, 215 I. Executive Summary The Sherwood Drive Traffic Circle Survey was administered in March 215. In total, 2,263 residents
Route User Intercept Survey Report
 Route User Intercept Survey Report Hills Road, Cambridge Fieldwork: October 2016 Report published: December 2016 1 About Sustrans Sustrans makes smarter travel choices possible, desirable and inevitable.
Transportation Issues Poll for New York City
 2016-17 Transportation Issues Poll for New York City 82% support Vision Zero and reducing traffic deaths 72% on average, support more street space for children to play, protected bike lanes and other safety
TYPES OF CYCLING. Figure 1: Types of Cycling by Gender (Actual) Figure 2: Types of Cycling by Gender (%) 65% Chi-squared significance test results 65%
 Figure 2: Types of Cycling by Gender (%) 65% Chi-squared significance test results 65%") TYPES OF CYCLING 1,980 responses were received to this question (multiple answers were allowed), 727 female (41%) and 1,242 (71%) from male respondents. The most common responses for both genders were
TYPES OF CYCLING 1,980 responses were received to this question (multiple answers were allowed), 727 female (41%) and 1,242 (71%) from male respondents. The most common responses for both genders were
15% Survey on Smart Commuting. Factsheet: University of Twente. 435 out of invited employees. This is a response rate of
 Survey on Smart Commuting Factsheet: University of Twente Tiago Fioreze, University of Twente - 27 October 2016 435 out of 2.900 invited employees. This is a response rate of SURVEY ON SMART COMMUTING
WELLS WAY GREEN PARK ROAD
 FOBP Discussion Document February 2015 WELLS WAY GREEN PARK ROAD Wells Way looking from Albany Road through Burgess Park Introduction Burgess Park provides much needed and loved recreational space for
Community & Transportation Preferences Survey U.S. Metro Areas, 2015 July 23, 2015
 Community & Transportation Preferences Survey U.S. Metro Areas, 2015 July 23, 2015 Realtor.org trec.pdx.edu 1 Highlights: Generation gaps in everyday travel Only 71% of Millennials like driving (the lowest
Thursday 18 th January Cambridgeshire Travel Survey Presentation to the Greater Cambridge Partnership Joint Assembly
 Thursday 18 th January 2018 Cambridgeshire Travel Survey Presentation to the Greater Cambridge Partnership Joint Assembly Contents 1. Study Background 2. Methodology 3. Key Findings An opportunity for
Neighbourhood Walkability Checklist How walkable is your community?
 Template letter This template is a guide to writing to your local council. You can change it in any way you feel necessary. Don t forget to attach the checklist and any photographs, maps or sketches you
Extracting Maximum Benefit from Parking Policy - 10 Years Experience in Perth, Australia. By Emmerson Richardson Sinclair Knight Merz
 Extracting Maximum Benefit from Parking Policy - 10 Years Experience in Perth, Australia By Emmerson Richardson Sinclair Knight Merz Snapshot of Perth > Metropolitan Area Population 1.7 million > 3.5 million
WILMAPCO Public Opinion Survey Summary of Results
 Wilmington Area Planning Council WILMAPCO Public Opinion Survey Summary of Results Prepared by: 2955 Valmont Road, Suite 300 Boulder, Colorado 80301 t: 303-444-7863 f: 303-444-1145 www.n-r-c.com Table
2018 Transportation Survey October 17, Prepared by:
 Transportation Survey October 17, Prepared by: Overview Methodology Systemwide results Strengths/Weaknesses by mode Importance of possible improvements Conclusions Methodology 500 Chittenden County residents
Online Open House Survey Report. December 2016
 December 216 I. OVERVIEW & OUTREACH SUMMARY Introduction Washington County evaluated long-term transportation investments and strategies as part of the Transportation Futures Study. The purpose of the
1. What is an End of Trip Facility
 ANDREW MORSE Partner / Senior Traffic Engineer Parking and Traffic Consultants andrew.morse@parkingconsultants.com WHY WE NEED MORE END OF TRIP This paper and the accompanying presentation has been prepared
ABOUT THIS STUDY The Tenderloin-Little Saigon Community-Based Transportation Plan
 ABOUT THIS STUDY The Tenderloin-Little Saigon Community-Based Transportation Plan The Greater Tenderloin Community Study Milestones October Community based organizations (Tenderloin Housing Clinic and
Reduction of Speed Limit at Approaches to Railway Level Crossings in WA. Main Roads WA. Presenter - Brian Kidd
 Australasian College of Road Safety Conference A Safe System: Making it Happen! Melbourne 1-2 September 2011 Reduction of Speed Limit at Approaches to Railway Level Crossings in WA Radalj T 1, Kidd B 1
BIKEPLUS Public Bike Share Users Survey Results 2017
 BIKEPLUS Public Bike Share Users Survey Results 2017 September 2017 Public Bike Share Users Survey Results 2017 The second annual Bikeplus survey combines robust data, and expert opinion to provide a snapshot
Devonport City Cycling Network Strategy
 Devonport City Cycling Network Strategy 2010-2013 Devonport City Cycling Network Strategy Introduction In February 2010 a draft master plan for cycleways was presented to the community. The feedback received
CYCLING STRATEGY RESEARCH PUBLIC TELEPHONE SURVEY JANUARY HarGroup Management Consultants
 CYCLING STRATEGY RESEARCH PUBLIC TELEPHONE SURVEY JANUARY 2011 HarGroup Management Consultants CYCLING STRATEGY RESEARCH PUBLIC TELEPHONE SURVEY Submitted to The City of Calgary By HarGroup Management
Master Transportation Plan Bicycle Element Survey
 September 28, 2017 Master Transportation Plan Bicycle Element Survey PAGE 1 Who did we reach? 1206 55% 89% 62% Respondents. 245 intercepts. Have never attended an Arlington County public meeting Would
Stepping up a gear. Our vision for cycling in Cardiff
 Stepping up a gear Our vision for cycling in Cardiff Cardiff is growing fast in fact, over the last 10 years its population has grown quicker than any UK city outside London and this rate of expansion
Developing a Safer Cycling Strategy for the ACT ACRS Conference August 2012
 Developing a Safer Cycling Strategy for the ACT ACRS Conference 2012 Peter Strang Canberra Manager Sarah Court Transport Consultant 10 August 2012 Presentation Outline Background Data Analysis (Stage 1)
Rider Satisfaction Survey Phoenix Riders 2004
 Rider Satisfaction Survey Riders Prepared For: Valley Metro Spring 2720 E. Thomas Rd. Bldg. A, Arizona 85016-8296 602-707-0050 answers@westgroupresearch.com Valley Metro Rider Satisfaction Survey - Page
Active Travel Strategy Dumfries and Galloway
 Active Travel Strategy Dumfries and Galloway Our Active Travel Strategy The agreed Interventions for Dumfries and Galloway Council s Local Transport Strategy includes an action to Develop an Active Travel
21/02/2018. How Far is it Acceptable to Walk? Introduction. How Far is it Acceptable to Walk?
 21/2/218 Introduction Walking is an important mode of travel. How far people walk is factor in: Accessibility/ Sustainability. Allocating land in Local Plans. Determining planning applications. Previous
International Physical Activity Prevalence Study SELF-ADMINISTERED ENVIRONMENTAL MODULE
 International Physical Activity Prevalence Study SELF-ADMINISTERED ENVIRONMENTAL MODULE There is increasing interest in the contextual (environmental) barriers that prevent or limit the opportunity to
Copyright 2014 April 2-14, Interviews Rockefeller Millennials Survey 5802 Margin of Error: +/- 3.7%
 Copyright 2014 April 2-14, 2014 703 Interviews Rockefeller Millennials Survey 5802 Margin of Error: +/- 3.7% S1. Are you at least 18 years old? Yes... 100% No/Don't know/refused... - D101. What is your
Design Principle Active Transport
 Active Transport Definition Active transport includes non-motorised forms of transport involving physical activity, such as walking and cycling. It also includes public transport to meet longer distance
cyclingincities opinion survey ABOUT THE STUDY WHO DID WE ASK? WHAT DID WE DO?
 cyclingincities opinion survey ABOUT THE STUDY Using a bicycle for transportation is good for the environment, and it also offers personal health benefits. Cycling is also feasible, since more than 80%
The Many Problems with Bi-Directional Cycling Paths
 The Many Problems with Bi-Directional Cycling Paths Bi-directional (two-way) cycling paths can be an appropriate form of cycling infrastructure when placed along rail lines, canals and country roads. When
Seattle Department of Transportation. Web Panel Survey February 2018
 Seattle Department of Transportation Web Panel Survey February 2018 Methodology Web panel survey of residents age 18+ in Seattle, Washington Conducted February 13-24, 2018 A total of 601 interviews were
RE-CYCLING A CITY: EXAMINING THE GROWTH OF CYCLING IN DUBLIN
 Proceedings ITRN2013 5-6th September, Caulfield: Re-cycling a city: Examining the growth of cycling in Dublin RE-CYCLING A CITY: EXAMINING THE GROWTH OF CYCLING IN DUBLIN Brian Caulfield Abstract In the
AAMPO Regional Transportation Attitude Survey
 AAMPO Regional Transportation Attitude Survey Traditionally Underserved Populations helping organizations make better decisions since 1982 2018 Submitted to the AAMPO By: ETC Institute 725 W. Frontier
Traffic Safety Barriers to Walking and Bicycling Analysis of CA Add-On Responses to the 2009 NHTS
 Traffic Safety Barriers to Walking and Bicycling Analysis of CA Add-On Responses to the 2009 NHTS NHTS Users Conference June 2011 Robert Schneider, Swati Pande, & John Bigham, University of California
21.07 TRANSPORT CONNECTIVITY AND INFRASTRUCTURE
 21.07 TRANSPORT CONNECTIVITY AND INFRASTRUCTURE 21.07-1 Connectivity and Choice Transport connectivity and mode choice are critical to achieving productive, sustainable and socially just cities. Travel
Community perceptions of the sustainability of the fishing industry in Australia
 Community perceptions of the sustainability of the fishing industry in Australia October 2013 Prepared for: Peter Horvat Communications Manager Fisheries Research and Development Corporation Prepared by:
UWA Commuting Survey 2013
 UWA Commuting Survey 2013 September 2013 Project: UWA/10 UWA Commuting Survey 2013 September 2013 Client: University of Western Australia Project: UWA/10 Consultants: Donna Hill Petra Roberts Jennifer
1999 On-Board Sacramento Regional Transit District Survey
 SACOG-00-009 1999 On-Board Sacramento Regional Transit District Survey June 2000 Sacramento Area Council of Governments 1999 On-Board Sacramento Regional Transit District Survey June 2000 Table of Contents
Executive Summary. TUCSON TRANSIT ON BOARD ORIGIN AND DESTINATION SURVEY Conducted October City of Tucson Department of Transportation
 Executive Summary TUCSON TRANSIT ON BOARD ORIGIN AND DESTINATION SURVEY Conducted October 2004 Prepared for: City of Tucson Department of Transportation May 2005 TUCSON TRANSIT ON BOARD ORIGIN AND DESTINATION
CONNECTING PEOPLE TO PLACES
 CONNECTING PEOPLE TO PLACES 82 EAST BENCH MASTER PLAN 07 Introduction The East Bench transportation system is a collection of slow moving, treelined residential streets and major arteries that are the
2016 Capital Bikeshare Member Survey Report
 2016 Capital Bikeshare Member Survey Report Prepared by: LDA Consulting Washington, DC 20015 (202) 548-0205 February 24, 2017 EXECUTIVE SUMMARY Overview This report presents the results of the November
Research. 20mph survey. Drivers opinions of 20mph speed limits
 Research 20mph survey Drivers opinions of 20mph speed limits About the IAM The IAM (Institute of Advanced Motorists) is the UK s largest independent road safety charity, dedicated to improving standards
Downtown Tampa Parking User Survey
 Downtown Tampa Parking User Survey 2017 Introduction This Downtown Tampa Parking User Survey was commissioned by the Tampa Downtown Partnership and carried out by Plan Hillsborough. The survey was overseen
Skate Survey Prepared by the Skate Rules Review working group of the Derwent Valley Youth Future Action Team (D FAT) July 2006
 July 2006") Skate Survey Prepared by the Skate Rules Review working group of the Derwent Valley Youth Future Action Team (D FAT) July 2006 Contents Summary of Findings... 2 What are No-go Zones... 3 A Derwent Valley
Skate Survey Prepared by the Skate Rules Review working group of the Derwent Valley Youth Future Action Team (D FAT) July 2006 Contents Summary of Findings... 2 What are No-go Zones... 3 A Derwent Valley
El Paso County 2040 Major Transportation Corridors Plan
 El Paso County 2040 Major Transportation Corridors Plan Connect-our-County Online Transportation User Survey Preliminary Results June 24, 2010 Years of Residence 2. How many years have you LIVED HERE?
EAST VILLAGE SHOPPERS STUDY A SNAPSHOT OF TRAVEL AND SPENDING PATTERNS OF RESIDENTS AND VISITORS IN THE EAST VILLAGE
 EAST VILLAGE SHOPPERS STUDY A SNAPSHOT OF TRAVEL AND SPENDING PATTERNS OF RESIDENTS AND VISITORS IN THE EAST VILLAGE CONTENTS 2 4 5 6 7 16 17 19 SUMMARY INTRODUCTION BACKGROUND METHODOLOGY RESULTS CONCLUSION
2014 peterborough city and county. active. transportation. & health. indicators primer
 2014 city and county active transportation & health indicators primer executive summary Walking, cycling and transit are good for our personal health, our local economies, and the environment. Understanding
DKS & WASHINGTON COUNTY Washington County Transportation Survey
 PREPARED FOR: DKS & WASHINGTON COUNTY Washington County Transportation Survey April 2013 PREPARED BY: DHM RESEARCH (503) 220-0575 239 NW 13 th Ave., #205, Portland, OR 97209 www.dhmresearch.com 1 INTRODUCTION
HAMILTON BIKING PLAN OUR VISION: A BIKE FRIENDLY CITY
 HAMILTON BIKING PLAN 2015-2045 OUR VISION: A BIKE FRIENDLY CITY INTRODUCTION Biking as a travel option is experiencing a resurgence internationally and in New Zealand, growing as a familyfriendly and healthy
NORTH ADELAIDE LOCAL AREA TRAFFIC AND PARKING MANAGEMENT ENGAGEMENT OUTCOMES EXECUTIVE SUMMARY PREPARED FOR THE CITY OF ADELAIDE
 NORTH ADELAIDE LOCAL AREA TRAFFIC AND PARKING MANAGEMENT OUTCOMES EXECUTIVE SUMMARY PREPARED FOR THE CITY OF ADELAIDE 2 MAY 2017 NORTH ADELAIDE LATPM EXECUTIVE SUMMARY PAGE 1 OF 8 PROJECT BACKGROUND The
TriMet Attitude & Awareness Survey. November 2016
 TriMet Attitude & Awareness Survey November 2016 Methodology Telephone survey of 800 residents in TriMet service district Clackamas County N=183 Multnomah County N=369 Washington County N=248 Conducted
COLUMBUS AVENUE NEIGHBORHOOD TRANSPORTATION STUDY
 COLUMBUS AVENUE NEIGHBORHOOD TRANSPORTATION STUDY Pedestrian Survey Findings Survey Main Findings: Transit and walking are the main two modes used by both visitors and residents of the area, regardless
BICYCLE NETWORK CRASH REPORT
 BICYCLE NETWORK CRASH REPORT 2012-2016 Prepared July 2017 1. Executive Summary With more than 50,000 members, Bicycle Network is Australia s largest bike riding organisation. Through our advocacy, membership,
FACTS AND FIGURES: MAKING THE CASE FOR COMPLETE STREETS IN LEE COUNTY
 FACTS AND FIGURES: MAKING THE CASE FOR COMPLETE STREETS IN LEE COUNTY Safety: Close to 5,000 pedestrians and bicyclists die each year on U.S. roads, and more than 70,000 are injured. [Mean Streets, Surface
Development Type - Neighbourhood Planning and Design
 Introduction The design and layout of new neighbourhoods greatly influences the nature of the urban form. When a neighbourhood is well designed it: allocates land for a range of uses, eg shops, community
Ageing and Transport: Mobility Issues A case study for Adelaide
 Ageing and Transport: Mobility Issues A case study for Adelaide Sekhar V C Somenahalli and Michael A P Taylor School of Natural and Built Environments, University of South Australia, Adelaide, South Australia
Response Road Safety Strategy for New South Wales
 Response Road Safety Strategy for New South Wales 2012-2021 The Amy Gillett Foundation (AGF) welcomes the opportunity to contribute to the Road Safety Strategy for New South Wales 2012-2021 (the Strategy).
National Association of REALTORS National Smart Growth Frequencies
 September 520, 2017 3,000 Weighted Online Respondents National Association of REALTORS National Smart Growth Frequencies Q.2 The first question is about the quality of life in your community. How satisfied
Capital Bikeshare 2011 Member Survey Executive Summary
 Capital Bikeshare 2011 Member Survey Executive Summary Prepared by: LDA Consulting Washington, DC 20015 (202) 548-0205 June 14, 2012 EXECUTIVE SUMMARY Overview This report presents the results of the 2012
Cobb Community Transit
 Cobb Community Transit Ridership Survey January 2014 1 Methodology Paper survey of 315 CCT riders 165 on local routes (margin of sampling error: ± 7.6%) 150 on express routes (margin of sampling error:
1. Introduction T E C H N I C A L M E M O R A N D U M 2017 VANCOUVER PANEL SUMMER SURVEY - DRAFT
 T E C H N I C A L M E M O R A N D U M McElhanney Consulting Services Ltd. 00-780 Beatty Street, BC V6B M Tel: 604 683 85 www.mcelhanney.com 07 VANCOUVER PANEL SUMMER SURVEY - DRAFT DATE: September 5 th,
AS91430: Cycleways Waiopehu College Year 13 Geography Matt Reeves
 AS91430: Cycleways Waiopehu College Year 13 Geography Matt Reeves December 2017 AS91430: Cycleways Cycling is an activity that a large proportion of our national population decides to enjoy and participate
Communiqué ABC Meeting #41 Cairns 2-3 August 2012
 Communiqué ABC Meeting #41 Cairns 2-3 August 2012 Esplanade shared path, Cairns Queensland The Australian Bicycle Council met in Cairns on 2-3 August 2012. Cairns Cycling Update Hellius Visser, Director
2014 Bike to Work Day: Survey Report Denver Regional Council of Governments
 2014 Bike to Work Day: Survey Report Denver Regional Council of Governments Prepared By: Corona Insights CoronaInsights.com CONTENTS Introduction... 3 Summary of Findings... 4 Bike to Work Day Participation...
Chittenden County Regional Planning Commission Transportation Survey
 Chittenden County Regional Planning Commission Transportation Survey Report of Results November 8, 2012 Submitted by Resource Systems Group 180 Battery Street, Suite 350 Burlington, Vermont 05401 TEL 802.
This objective implies that all population groups should find walking appealing, and that it is made easier for them to walk more on a daily basis.
 Walking for life The Norwegian Walking Strategy Guro Berge Norwegian public Roads Administration "Walking for life" is the slogan for the National Walking Strategy that is now being formulated in Norway.
Low Level Cycle Signals with an early release Appendices
 Low Level Cycle Signals with an early release Appendices Track trial report This document contains the appendices to accompany the report from the second subtrial of a larger track trial investigating
This document is downloaded from DR-NTU, Nanyang Technological University Library, Singapore.
 This document is downloaded from DR-NTU, Nanyang Technological University Library, Singapore. Title Comparison study of cycling in Tampines new town Author(s) Ng, Teik Ting Citation Ng, T. T. (2014). Comparison
Driverless Vehicles Potential Influence on Bicyclist Facility Preferences
 Driverless Vehicles Potential Influence on Bicyclist Facility Preferences MICHAEL BLAU, MCRP, LCI O T E C O C T O B E R 2 6, 2 0 1 6 S E S S I O N # 8 2 - E V A L U AT I N G T H E P E R F O R M A N C E
Briefing Paper #1. An Overview of Regional Demand and Mode Share
 2011 Metro Vancouver Regional Trip Diary Survey Briefing Paper #1 An Overview of Regional Demand and Mode Share Introduction The 2011 Metro Vancouver Regional Trip Diary Survey is the latest survey conducted
Winnipeg Walk Bike Projects Downtown Tire Talk - Summary
 Winnipeg Walk Bike Projects Downtown Tire Talk - Summary Downtown Projected Bike Lane System Connecting The Forks to the Exchange District (Fort Street, Garry Street & The Forks to Assiniboine Connection)
2. Context. Existing framework. The context. The challenge. Transport Strategy
 Transport Strategy Providing quality connections Contents 1. Introduction 2. Context 3. Long-term direction 4. Three-year priorities 5. Strategy tree Wellington City Council July 2006 1. Introduction Wellington
92% COMMUTING IN THE METRO. Congested Roadways Mode Share. Roadway Congestion & Mode Share
 COMMUTING IN THE METRO Roadway Congestion & Mode Share The majority of major roadways in Greater Des Moines are without congestion and have underutilized capacity. This surplus capacity could be used for
Where do People Bicycle? The Role of Infrastructure in Determining Bicycle Behavior
 Portland State University PDXScholar Urban Studies and Planning Faculty Publications and Presentations Nohad A. Toulan School of Urban Studies and Planning 4-11-2008 Where do People Bicycle? The Role of
Amador County Pedestrian and Bicycle Plan Survey Results
 Survey Methodology Amador County Pedestrian and Bicycle Plan From September 23th to December 31st, 2016 a walking and biking survey was available for public input. It was advertised through the walkbikeamador.com
APPENDIX E Needs Assessment
 APPENDIX E Needs Assessment Active Transportation Needs Assessment Technical Background This appendix provides the technical background supporting the findings presented in Section 3 of the report. Developed
Reflections on our learning: active travel, transport and inequalities
 Reflections on our learning: active travel, transport and inequalities Jill Muirie Glasgow Centre for Population Health Active travel definition Active travel refers to walking, cycling or using some other
Topline Results Telephone Poll March 2013
 Topline Results Telephone Poll March 2013 Results are based on interviews with 1001 London residents aged 18+. Interviews were carried out by telephone between 7 th 12 th March 2013. A representative sample
Walking and Cycling Action Plan Summary. A Catalyst for Change The Regional Transport Strategy for the west of Scotland
 Walking and Cycling Action Plan Summary A Catalyst for Change The Regional Transport Strategy for the west of Scotland 2007-2021 Strathclyde Partnership for Transport Contents Purpose...2 Issues, Constraints
Frequently asked questions about how the Transport Walkability Index was calculated are answered below.
 Transport Walkability Index The Transport Walkability Index is a relative indicator of how well the built environment in different areas supports walking for transport. The index is frequently used in
Nanaimo Transportation Master Plan. Phase 1 Consultation Summary
 Nanaimo Transportation Master Plan Phase 1 Consultation Summary Transportation Advisory Committee Meeting Wednesday December 12, 2012 Agenda Study Update Phase 1 Consultation Process Phase 1 Consultation
Willingness to Pay for Bike Detection Safety Systems: a European study
 Institute for Transport Studies FACULTY OF ENVIRONMENT Willingness to Pay for Bike Detection Safety Systems: a European study 7 th September 2018 Jeremy Shires, Eva Heinen & Dan Johnson PREMISE - CYCLING
Eliminate on-street parking where it will allow for a dedicated bus only lane %
 Traffic Dashboard Priorities Survey Responses Introduction 1) Are you familiar with bus rapid transit (BRT)? a. No, BRT is new to me. 597 23.5% b. I ve heard of BRT, but I don t know much about it. 1,136
The Who and What: Bus Rapid Transit Riders and Systems in the U.S.
 The Who and What: Bus Rapid Transit Riders and Systems in the U.S. Cheryl Thole December 12, 2013 Webinar Center for Urban Transportation Research University of South Florida Pre presentation How familiar
How familiar are you with BRT?
 The Who and What: Bus Rapid Transit Riders and Systems in the U.S. Cheryl Thole December 12, 2013 Webinar Center for Urban Transportation Research University of South Florida Pre presentation How familiar