Traffic Analysis Report
|
|
|
- Austen Pearson
- 6 years ago
- Views:
Transcription

1 Intersections Reconnaissance Study Prepared for: Municipality of Anchorage Traffic Department And Hattenburg Dilley & Linnell, LLC 3335 Arctic Boulevard, Suite 100 Anchorage, Alaska By: Kinney Engineering 750 West Dimond Blvd., Suite 203 Anchorage, AK
2 Table of Contents Table of Contents...i Acronyms and Abbreviations...iv Introduction... 1 Study Background... 1 Study Area... 3 References... 4 Project Area Conditions... 5 Street Typical Sections... 5 Functional Classification... 5 Intersections... 5 C Street/ West Klatt Road/ Timberlane Drive Intersection... 5 C Street/ West Klatt Road Intersection... 7 Traffic Conditions... 9 Speeds... 9 Volumes Average Annual Daily Traffic (AADT) Turning Movements Hourly Approach Volumes Count Seasonal Adjustments South Anchorage Sports Park Adjustment Intersection Sight Distance Future Traffic Volumes AMATS Demand Model Future Intersection Design Turning Movement Volumes and 2017 Existing Conditions Capacity Analysis C Street/ West Klatt Road/ Timberlane Drive Signal C Street/ West Klatt Road Stop Control Crash Analysis Crash Rate Analysis Contributing Factors for C Street and West Klatt Road Intersection Crashes Countermeasures for C Street and West Klatt Road Intersection Crashes Relocate Intersection Prohibit High-Risk Movements Signalization Roundabouts Intersection Options Warrants and Guidelines Existing and Current Conditions Signalization Future Signal Warrants Modern Roundabout Screening Guidelines C Street and West Klatt Road Intersection Control Options Existing Stop Control for C Street and West Klatt Road i
3 Signalization Roundabout Screening Analysis C Street / West Klatt Road / Timberlane Drive Existing Signalization Two-Way Stop Control (Remove Signal) Roundabout Screening Analysis Alternatives Alternative 1: Remove Timberlane Drive Signal, Signalize C Street/ West Klatt Road Intersection Alternative 2: Remove Timberlane Drive Signal, Construct a Modern Roundabout at the C Street/ West Klatt Road Intersection Additional Work to Advance Reconnaissance Alternatives Attachment A- Link Counts Attachment B- Turning Movement Projections Attachment C- Crash Diagrams Appendix D - Crash Rate and Over-Representation Methods and Calculations Tables Table 1- Study Area Functional Classification... 5 Table 2- Speed Study Summary Table 3- AADT Summary Table 4- Intersection Sight Distance, C Street and West Klatt Road Table Peak Hour Operations, C Street/ West Klatt Road/ Timberlane Drive Signal Table Peak Hour Operations, C Street/ West Klatt Road/ Timberlane Drive Signal Table Peak Hour Operations, C Street/ West Klatt Road Stop Control Intersection Table 8- Intersection Crash Rates, 1996 to Table 9- C Street/ West Klatt Road/ Timberlane Drive Crash Type and Over-Represented Crashes Table 10- Roundabout Suitability Questions Table 11- C Street and West Klatt Road Intersection Signal Warrants Table 12- C Street and West Klatt Road Intersection Cal-Trans Future Signal Warrants.. 29 Table Peak Hour Operations, C Street/ West Klatt Road Signalization Option Table 14- Modern Roundabout Screening, C Street/ West Klatt Road Intersection Table 15- C Street/West Klatt Road/Timberlane Drive Intersection Signal Warrants Table 16- C Street/West Klatt Road/Timberlane Drive Intersection Cal-Trans Future Signal Warrants Table 17- Modern Roundabout Screening, C Street/ West Klatt Road/Timberlane Drive Intersection Table Alternative 1 Peak Hour Operations, C Street/ West Klatt Road/ South Anchorage Sports Park Access Signalized Intersection Table 19 - Typical Design Values for Modern Roundabout Geometric Elements ii
4 Figures Figure 1- Study Area... 3 Figure 2- C Street/West Klatt Road/Timberlane Drive Intersection Approach Lane Configurations... 6 Figure 3- Phasing and Timing for C Street/West Klatt Road/Timberlane Drive Intersection. 7 Figure 4- C Street/West Klatt Road Intersection Approach Lane Configurations... 8 Figure 5- Posted Speeds and Speed Study Locations... 9 Figure 6- Morning Peak Hour Turning Movements (December 2006) Figure 7- Evening Peak Hour Turning Movements (December 2006) Figure 8- LRTP 2015 AADT Figure 9- C Street and West Klatt Road, Crash Distribution by Hour of the Day Figure 10- C Street and West Klatt Road, Crash Distribution by Month of the Year Figure 11- C Street/West Klatt Road/ South Anchorage Sports Park Access Signalized Lane Configuration Figure 12- C Street /Klatt Road Modern Roundabout Concept Figure 13- Roundabout Geometric Elements iii
5 Acronyms and Abbreviations The following table presents acronyms and abbreviations that may be commonly used throughout this document. ADT, AADT Average Daily Traffic, Annual Average Daily Traffic AASHTO American Association of State Highway and Transportation Officials ADOT/ (&)PF, or DOT/(&)PF Alaska Department of Transportation and Public Facilities AMATS Anchorage Area Metropolitan Area Solutions ASD Anchorage School District AWSC All-way-stop-control (4-way stop signs) CTWLTL Continuous-two-way left turn lane DCM Design Criteria Manual DD, DDHV Direction al Distribution, DD Hourly Volume EB, EBLT Eastbound, eastbound left turn Hwy Highway ITE Institute of Transportation Engineers K % of AADT or ADT during peak hour LOS Level of Service (intersection performance grade) LT Left turn(s) MOA Municipality of Anchorage Mph Miles Per Hour MUTCD Manual of Uniform Traffic Control Devices NB, NBLT Northbound, northbound left turn OSHP MOA s Official Streets and Highways Plan Ped Pedestrian Pkwy Parkway PTR Permanent Traffic Recorder PUD Planned Unit Development RIO Right-in turns only RIRO Right-in, Right-out driveway Rd Road RT Right turn(s) SB, SBLT Southbound, southbound left turn Sec Second Sf Square feet St Street Th, Thru Through ITE ITE Trip Generation Manual Veh Vehicle WB, WBLT Westbound, westbound left turn iv
6 Introduction Study Background Hattenburg Dilley and Linnell (HDL) has been retained by the Municipality of Anchorage Traffic Department to evaluate the impacts of the C Street Extension on the C Street/Peninsula Circle, C Street/West Klatt Road and C Street/West Klatt Road/Timberlane Drive intersections; and prepare a reconnaissance study of feasible alternatives. This, prepared by Kinney Engineering in collaboration with HDL, primarily focuses on the higher traffic volume C Street/ West Klatt Road and West Klatt Road/Timberlane Drive intersections. Peninsula Circle is a low volume cul-desac which is evaluated under a separate cover for improved circulation and access. In November 2006, the C Street Extension between O Malley Road and Dimond Boulevard was opened to traffic. The C Street Extension is a 4-lane divided major arterial with and expressway-type controlled access so that no driveways or adjacent land has direct access and intersections are only at major street connections. There are pedestrian and bike walkways/pathways on both sides of the roadway. The northern terminus at Dimond Boulevard is signalized, and the southern terminus is the O Malley Road diamond interchange that features modern roundabouts at the ramp intersections. Street intersections between Dimond and O Malley will likely to be signalized in the future as warrants are satisfied. The C Street expressway and A-C couplet is the third north-south corridor to span Anchorage and provide continuous route connectivity between the downtown and mid town employment centers and south Anchorage. Also, it is the only corridor with continuous pedestrian and bicycle facilities between downtown and south Anchorage. The other two major corridors between downtown and south Anchorage; the Minnesota Drive/O Malley Kinney Engineering Page 1
7 Road corridor and the Seward Highway Corridor; are major arterials that transition into freeways. One of the consequences of the C Street Extension will be the increased traffic on the segment of C Street to the south of the O Malley Road. As such this report evaluates current and future operations and safety for the higher volume intersections at C Street/ West Klatt Road and C Street/West Klatt Road/Timberlane Drive. The design (analysis) year for this study is Kinney Engineering Page 2
 710 feet Timberlane Drive C St.")
8 Study Area Figure 1 presents the study area. C Street Extension Roundabout Ramps Peninsula Circle West Klatt Road C Street/West Klatt Road/Timberlane Drive Intersection South Anchorage Sports Park (access) 710 feet Timberlane Drive C St. 2,370 feet C Street C Street/West Klatt Road Intersection West Klatt Road Aerial Photograph Source: Google Earth Figure 1- Study Area Kinney Engineering Page 3
9 References The following references and guidelines were used in this analysis. Alaska Preconstruction Manual (PCM) by DOT&PF American Association of State Highway and Transportation Officials (AASHTO) A Policy on the Geometric Design of Highways and Streets, (GDHS) 2001 Central Region Annual Traffic Volume Report for the years between 1994 and 2004, published by DOT&PF Alaska Traffic Manual (ATM), State of Alaska DOT&PF. Manual on Uniform Traffic Control Devices (MUTCD), FHWA. Official Streets and Highways Plan, (OSHP) Municipality of Anchorage Community Planning and Development Transportation Planning Division, Design Criteria Manual (DCM) Municipality of Anchorage Project Management and Engineering, June 2005 Anchorage Annual Traffic Report (misc. years), Municipality of Anchorage, Traffic Department. Highway Safety Improvement Program Handbook (HSIPHB) published by the State of Alaska, Department of Transportation and Public Facilities with supplement rates provide by Central Region Traffic and Safety. NCHRP Report 162, Methods for Evaluating Highway Safety Improvements, Laughland, et. al. Municipality of Anchorage websites for Planning and Zoning, Traffic, and Transit. Highway Capacity Manual 2000 (HCM2000), TRB. Traffic Engineering Handbook, Fourth and Fifth editions, Institute of Transportation Engineers (ITE). NCHRP Report 457, Engineering Study Guide for Evaluating Intersection Improvements, TRB, Roundabouts An Informational Guide, June 2000, FHWA et. al. Highway Capacity Software 2000 (HCS), McTrans. Synchro and SimTraffic, Trafficware. Victor Road Design Study Report, Lounsbury and Associates, Manual of Traffic Signal Design, Second Edition, by James H. Kell and Iris J. Fullerton, Institute of Transportation Engineers Alaska Traffic Accidents, DOT&PF Statewide Planning RODEL 1 Interactive Roundabout Design Software and Manual, Rodel Software Ltd and Staffordshire County Council. Kinney Engineering Page 4
10 Project Area Conditions Street Typical Sections C Street is on a general north-south orientation and Klatt Road is on an east-west orientation. Timberlane Drive is the transition point between the two streets with C Street on east leg, and West Klatt Road on the west side of the intersection. The C Street and West Klatt Road corridor has a 4-lane divided urban section, with pedestrian and bicycle facilities on both sides. West Klatt Road to the east of C street is a two-lane road with shoulders, and a pathway on the south side of the road. Timberlane Drive is a two lane street with pedestrian and bicycle facilities. Functional Classification Table 1 summarizes the MOA Official Streets and Highways Plan functional classes for the study area. Street Location Functional Classification C Street Dimond Blvd. to O Malley Road Major Arterial, Class IIIA C Street O Malley Road to Timberlane Drive Minor Arterial, Class II W. Klatt Road C Street to Old Seward Highway Minor Arterial, Class II W. Klatt Road Southport Drive to Timberlane Drive Minor Arterial, Class II Timberlane Drive Klatt/C to Huffman Neighborhood Collector, Class IC Table 1- Study Area Functional Classification Intersections C Street/ West Klatt Road/ Timberlane Drive Intersection Figure 2 presents the lane configuration for the signalized C Street/West Klatt Road/Timberlane Drive intersection. The inset approach views indicate left-turn phasing. Kinney Engineering Page 5
.")


11 North and south approaches are split-phased, (all movements from one approach proceed, then all movements from the opposing approach proceed). East and west approaches have permissive left-turn phasing. 4-section SB Lane/Signal Control Sports Park WB Lane/Signal Control West Klatt Road C Street EB Lane/Signal Control Timberlane Drive 4-section NB Lane/Signal Control Aerial Photograph Source: Google Earth Figure 2- C Street/West Klatt Road/Timberlane Drive Intersection Approach Lane Configurations The lane configurations required that the north-south approaches be split-phased. The north and south approach signals are a four-section signal faces, with a green circle and green left-turn arrow displayed simultaneously. Kinney Engineering Page 6
12 The signal is fully actuated with 105 second cycle throughout the day. Figure 7 presents phasing and timing information for the intersection. Pedestrian crossings are allowed across the north, south, and west approaches, but are prohibited across the east approach. Figure 3- Phasing and Timing for C Street/West Klatt Road/Timberlane Drive Intersection C Street/ West Klatt Road Intersection Figure 4 presents lane configuration and intersection traffic control for the C Street/ West Klatt Road/ Timberlane Drive intersection. Kinney Engineering Page 7

13 C Street Northwest Leg (Southwest Bound Approach, or Driveway West Klatt Road Aerial Photograph Source: Google Earth Figure 4- C Street/West Klatt Road Intersection Approach Lane Configurations Kinney Engineering Page 8

14 Traffic Conditions Speeds Posted speeds and locations of December 2006 speed studies are presented in the following figure. KEY 45 mph 40 mph Date 35 mph 25 mph Speed Study Area Klatt EB & WB Posted Speed=40 mph C St. SB Posted Speed = 45 mph 12/10 C St. NB Posted Speed = 35 mph Timberlane Posted Speed= 25 mph 12/08 Klatt EB & WB Klatt EB Posted Speed=40 mph Posted Speed=40 mph Figure 5- Posted Speeds and Speed Study Locations Kinney Engineering Page 9
15 South to West Travel East to North Travel Direction Direction December 8, 2006 Speed Study (Kinney Engineering, Radar) Location of Study Proximity of Timberlane Drive Intersection (Tangent) Posted 45 MPH 40 MPH Mean 37.5 MPH 32.9 MPH Standard Deviation 3.0 MPH 2.4 MPH Median Speed 37.0 MPH 33.0 MPH Maximum Speed 45.0 MPH 39.0 MPH Minimum Speed 33.0 MPH 28.0 MPH 85 th Percentile Speed 40.0 MPH 34.0 MPH December 10, 2006 Speed Studies (Kinney Engineering, Radar) Location of Study Proximity of W. Klatt Road Intersection (Mid Curve) Posted 45 MPH 40 MPH 40 MPH 35 MPH Mean 33.3 MPH 29.0 MPH Standard Deviation 3.0 MPH 2.7 MPH Median Speed 33.0 MPH 28.0 MPH Maximum Speed 41.0 MPH 36.0 MPH Minimum Speed 27.0 MPH 26.0 MPH 85 th Percentile Speed 37.0 MPH 32.0 MPH Table 2- Speed Study Summary Since the speed studies were conducted during winter, the engineering analysis in this study uses the higher posted speed limits for the design speed, assuming that speeds are higher in the summer. As such, for the C Street-Klatt Road corridor, the southbound to westbound traffic flow design speed is 45 mph, and the eastbound to northbound speed is 40 mph. Kinney Engineering Page 10
16 Volumes Average Annual Daily Traffic (AADT) The following table presents 2005 AADT and the 10-year average AADT. Begin End Year AADT Average (1996 to 2005) C STREET SOUTH Minnesota Drive New Klatt Road 9,729 7,733 KLATT ROAD Johns Road C Street 8,706 6,110 C Street Timberline Drive 6,760 5,451 Timberline Drive Victor Road 5,477 4,050 TIMBERLANE DRIVE West Klatt Road Old Klatt Road 1,470 1,497 Table 3- AADT Summary Turning Movements Turning movement counts were conducted during peak commuting times (7:00 am to 9:00 am, 4:00 pm to 6:00 pm) during December The following figures depict morning and evening peak hours. Kinney Engineering Page 11
17 Note that intersections were counted on different days and the departure and approach volumes may not balance. Figure 6- Morning Peak Hour Turning Movements (December 2006) Kinney Engineering Page 12
 The peak hour factor for morning and evening commuting hours is about 0.91.")
18 Note that intersections were counted on different days and the departure and approach volumes may not balance. Figure 7- Evening Peak Hour Turning Movements (December 2006) The peak hour factor for morning and evening commuting hours is about About 2% of the traffic is trucks and buses. Kinney Engineering Page 13
19 Hourly Approach Volumes Hourly approach volume counts were conducted in December These provided additional information that was primarily used to evaluate intersection control warrants. The turning percentages shown above in Figures 6 and 7 were applied to the approach volume for the warrant analysis. Count Seasonal Adjustments Within proximity of the project area, the Department of Transportation and Public Facilities maintains permanent traffic recorders (PTR) on Minnesota Drive north of Dimond Boulevard, on Dimond Boulevard west of Arctic Boulevard, and on O Malley Road east of Seward Highway. Since the Dimond and Minnesota PTRs are likely to represent traffic patterns of this project area, the O Malley information was not used in this analysis. The PTR information indicates that December 2005 average daily traffic (ADT) counts are about 95% of the AADT for the respective locations. The design condition for Anchorage Roads is during the summer season for most major roads; and these PTRs show summer ADT to range from 103% to 110% AADT. If turning movement and approach counts follow ADT patterns, then an adjustment of 115% (100 x ( )) should be applied to the collected December data to convert to a summer design traffic condition. South Anchorage Sports Park Adjustment The December counts did not include the sports traffic. There are 3 unpaved parking areas within the park that accommodate about 350 vehicles (derived by dividing 145,000 square feet of parking area by 400 square feet of stall-aisle area per vehicle). During events that fully utilize parking, it may be expected the parking turnover would be about 2 hours, which would be about 175 vehicles entering and 175 vehicles leaving. However, the peak hour of the facility would not likely occur during the peak hour of the roadway system. For Kinney Engineering Page 14
20 purposes of this analysis, we assume that 175 would enter the main park entrance and 80 would exit during the evening peak hour. Intersection Sight Distance Intersection sight distance is not of significant concern for signals. However the C Street and Klatt Road intersection is a two-way stop sign control intersection and intersection sight distance affects the stopped driver s ability to select safe gaps to cross or turn onto the main road. Minimum intersection sight distance is stopping sight distance. Minimum stopping sight distance for 40 MPH (eastbound to northbound speed) is 305 feet; and for 45 MPH (southbound to westbound speed) is 360 feet. The following table summarizes required and available intersection sight distance. Kinney Engineering Page 15
21 Approach Under Stop Control Northwest Leg (parking area) Right Left Turn Through Turn AASHTO Case B1 AASHTO Case B3 Case B2 Sight Direction South North South North North Critical Gap seconds seconds seconds seconds seconds Approach Speed 40 MPH 45 MPH 40 MPH 45 MPH 45 MPH AASHTO Intersection Sight Distance 499 feet 495 feet 440 feet 429 feet 429 feet *Estimated Sight Distance 250 feet 350 feet 250 feet 350 feet 350 feet Sight Direction North South North South South Critical Gap seconds seconds seconds seconds seconds Southeast Leg Approach Speed 45 MPH 40 MPH 45 MPH 40 MPH 40 MPH (connection to Klatt Road) AASHTO Intersection Sight 561 feet 440 feet 495 feet 381 feet 381 feet Distance *Estimated Sight Distance 550 feet 400 feet 550 feet 400 feet 400 feet *Estimated intersection sight distance was determined by measurements on an aerial photo. This assumes winter conditions, where snow accumulates on medians and restricts horizontal sight lines. Table 4- Intersection Sight Distance, C Street and West Klatt Road Intersection sight distance may be less than AASHTO recommendations for this intersection in winter. In addition, the stopping sight distance may not be adequate in winter for the northwest leg. Future Traffic Volumes AMATS Demand Model The following figure depicts MOA Long Range Transportation Plan 2015 AADT for the study area. Also shown are the 2005 recorded AADT (shaded values). Kinney Engineering Page 16
22 9, Recorded AADT 6,760 8,706 5,475 1,470 Figure 8- LRTP 2015 AADT Future Intersection Design Turning Movement Volumes Figure 8 depicts the 10-year AADT volume growth. Overall, the growth rate for the study area is about 1% per year. The maximum growth rate (segment between intersections) is about 3.2% per year. Future design volumes are forecasted with the overall growth rate of 1% per year. The morning and evening peak hour conditions, summer operations (15% higher than December counts shown in Figures 6 and 7), are under Attachment B. Kinney Engineering Page 17
23 2007 and 2017 Existing Conditions Capacity Analysis C Street/ West Klatt Road/ Timberlane Drive Signal The following tables summarize operations for 2007 morning and evening peak hours and 2017 morning and evening peak hours during summer traffic for the existing facility conditions. These are based upon factored December 2006 counts to summer volume levels, and include assumed sports park traffic for the PM Peak. Existing phases, cycle times and splits were used for this analysis. Morning Operations Evening Operations Table Peak Hour Operations, C Street/ West Klatt Road/ Timberlane Drive Signal Morning Operations Evening Operations Table Peak Hour Operations, C Street/ West Klatt Road/ Timberlane Drive Signal Kinney Engineering Page 18
24 C Street/ West Klatt Road Stop Control The following table summarizes the 2007 morning and evening peak hour conditions under December evening (observed) and summer morning and evening design conditions (with sports park traffic). December Evening Operations (NB and SB are C Street Approaches) Delay, Queue Length, and Level of Service Approach NB SB Westbound Eastbound Movement Lane Config L L LT LTR v (vph) C(m) (vph) v/c % queue length Control Delay LOS A A F C Approach Delay Approach LOS F C Summer Morning Operations (NB and SB are C Street Approaches) Delay, Queue Length, and Level of Service Approach NB SB Westbound Eastbound Movement Lane Config L L LT LTR v (vph) C(m) (vph) v/c % queue length Control Delay LOS A A D B Approach Delay Approach LOS D B Summer Evening Operations (NB and SB are C Street Approaches) Delay, Queue Length, and Level of Service Approach NB SB Westbound Eastbound Movement Lane Config L L LT LTR v (vph) C(m) (vph) v/c % queue length Control Delay LOS A A F D Approach Delay Approach LOS F D Table Peak Hour Operations, C Street/ West Klatt Road Stop Control Intersection Kinney Engineering Page 19
25 It is clear from this table that the evening operations are very poor under the assumed conditions of sports area traffic combined with summer traffic levels. Even with the base December volumes presented in Figure 7, HCS2000 computes 7 to 8 minutes of average delay for the Klatt Road approach traffic. Field observations verify that the Klatt northwest bound leg left-turning traffic experience long delays. Although the observed operations confirm severe congestion and queue backup during the peak hour (northwest bound left-turning traffic queues blocking the free right-turn lane), it is not to the extremes that are computed with the HCM2000 model. It is likely that the actual critical gaps accepted by minor approach left-turning traffic are less than the HCM2000 default values, and that there is some level of cooperation between the C Street left-turning traffic and the Klatt left-turning traffic (decreasing rank impedance and consequently increasing capacity). Crash Analysis Crash Rate Analysis Ten years of crash data was obtained from the State of Alaska using their accident reporting system. From this data, intersection crash rates, crashes per million entering vehicles (MEV) were computed and compared to average rates for similar intersection and to the upper control limit (UCL), or critical rate, at the 95% confidence level (see Attachment D for rate methods). The following table summarizes the 10-year crash rates. Kinney Engineering Page 20
26 Intersection Intersection Crashes 1996 to 2005 Crashes / MEV State Averages (7-year 1999 to 2005) 95.00% Above Average? Above UCL? C Street and Klatt Road Yes No C Street/ West Klatt Road/ No No Timberlane Drive Table 8- Intersection Crash Rates, 1996 to 2005 The signalized C Street/ West Klatt Road/ Timberlane Drive intersection has performed well with respect to crash experience and requires no further analysis. The C Street and West Klatt Road intersection (stop control) has a rate that exceeds the average rate, but is below the UCL. However, one more crash at this location would result in a rate that exceeds the UCL, and therefore this location is reviewed further. Contributing Factors for C Street and West Klatt Road Intersection Crashes Attachment C contains the collision diagram for this intersection. Table 5 presents the crash types for the C Street and West Klatt Road intersection. Crash Type Number % MOA Population % Statistical Testing Results (See Attachment D for Methods) Head On Sideswipe 2 6% 2.56% Over-represented but not significant. Left Turn 1 3% 5.97% Over-represented but not significant. Left Turn Sideswipe 1 3% 2.44% Over-represented but not significant. Other 4 12% 11.08% Below average % Overtaking Sideswipe 2 6% 9.77% Below average % Rear End 4 12% 30.60% Below average % Right Angle 18 53% 18.36% Right Left Turn Sideswipe 2 6% 0.29% Right Angle crashes are overrepresented and highly significant. Right Left Turn Sideswipe crashes are over-represented and highly significant. Kinney Engineering Page 21
27 Table 9- C Street/ West Klatt Road/ Timberlane Drive Crash Type and Over- Represented Crashes The Right Angle and Right Left Turn Sideswipe collisions are significant for this intersection, resulting in the high crash rate. With regards to crash severity, there was one major injury (3%), 9 minor injuries (26%), and 24 property damage only crashes (71%). These percentages are similar to the overall MOA crash severity profile. The following figures depict the hourly and monthly distributions for intersection accidents :00 AM 1:00 AM 2:00 AM 3:00 AM 4:00 AM 5:00 AM 6:00 AM 7:00 AM 8:00 AM 9:00 AM 10:00 AM 11:00 AM 12:00 PM 1:00 PM 2:00 PM 3:00 PM 4:00 PM Number of Crashes 5:00 PM 6:00 PM 7:00 PM 8:00 PM 9:00 PM 10:00 PM 11:00 PM Beginning of Hour Figure 9- C Street and West Klatt Road, Crash Distribution by Hour of the Day Kinney Engineering Page 22
28 January February March April May June July August Crashes Per Month September October November December Month Figure 10- C Street and West Klatt Road, Crash Distribution by Month of the Year These figures show that the crashes are elevated during the peak commuting times (especially morning), and during the winter months. Winter may be a significant factor because 62% crashes were on snow and ice surfaces, snow accumulation may restrict intersection and stopping sight-distance within the horizontal curve. Countermeasures for C Street and West Klatt Road Intersection Crashes Relocate Intersection This would involve relocation of the intersection out of the horizontal curve to improve sight distance. However, this alternative is not feasible because of property impacts. Prohibit High-Risk Movements About 20 to 24 crashes would have been preventable with a fully or partially restrictive median that prohibits left turns from the stop controlled approaches. The Department of Kinney Engineering Page 23
29 Transportation and Public Facilities Highway Safety Improvement (HSIP) Handbook reports up to 90% crash reduction of crossing collisions. However, there would be significant traffic circulation changes, which would affect other intersections and may cause the crash issues to migrate with the volume. As such, this is likely to be unfeasible unless there is a substantial increase in crashes in the future. Signalization Signalization would reduce right angle and crossing crashes. The States HSIP Handbook indicates that signalization can reduce right angle crashes by about 60%. However, rear end crashes may increase (up to 25%). Roundabouts This HSIP Handbook reports that roundabouts may reduce up to 75% of all intersection crashes. Intersection Options Intersection control options are presented below for each intersection. Each intersection is evaluated for feasibility and operations as a two-way stop controlled intersection, a signalized intersection, and a modern roundabout. Four-way stop controlled intersections are not evaluated because the major road lanes (C Street West Klatt corridor) has more lanes than are commonly used for this type of control. Kinney Engineering Page 24
30 Warrants and Guidelines Existing and Current Conditions Signalization Signals should only be considered for intersections if one or more warrants established by the Manual of Uniform Traffic Control Devices (MUTCD) are satisfied. The warrants include: Warrant 1- Eight-Hour Volume (Conditions A, B, and 80% of A & B Combined) Warrant 2- Four-Hour Volume Warrant 3- Peak Hour Volume (only applicable to unique, high-generation facilities) Warrant 4- Minimum Pedestrian Volumes Warrant 5- School Crossings Warrant 6- Coordinated Signal System Warrant 7- Crash Experience (5 or more correctable crashes in a 12-month period, and volume criteria) Warrant 8- Roadway Network These warrants require current vehicle and pedestrian volumes, speeds, and crash history. The warrants are evaluated in accordance with MUTCD procedures for these inputs. Seventy percent of volume warrant values from the MUTCD were used because the speeds through the area are expected to be at 45 mph (posted for southbound to westbound direction, see Figure 5). Warrants 3, 4, 5 and 6 do not apply to the intersections of this project and were not evaluated. There are several disadvantages to signalization which should be considered. Cross-street delay is reduced, but the mainline traffic is penalized. As such, signals may increase overall system delay. While right angle and left turn collisions are reduced by signalization, rear end collisions may increase, especially on high-speed approaches that were formally free-flow conditions. Lastly, signals have an ongoing maintenance and operations burden. The MUTCD encourages engineers to seek less restrictive alternatives to signals, such as Kinney Engineering Page 25
31 roundabouts or 4-way stop sign control, even in locations where one or more warrants are satisfied. The MUTCD s warrant discussion encourages the engineer to exercise judgment on the amount of right-turn traffic that should be subtracted from the minor street traffic volume. NCHRP 457 provides a methodology to determine right turn volume adjustments for the warrant analysis. This methodology was used for this analysis. Future Signal Warrants The MUTCD warrant system described above only evaluates recent or current conditions. Cal-Trans has a methodology for future signal warrants based that is presented in the Institute of Transportation Engineers (ITE) Manual of Traffic Signal Design, Second Edition, by James H. Kell and Iris J. Fullerton. The method uses future estimated average daily traffic as the input variables and estimates whether the intersection with future estimated average daily traffic would meet the Manual of Uniform Traffic Control Devices signal Warrant 1, Condition A- Minimum Vehicular Volume; Condition B- Interruption of Continuous Traffic; and the combination of warrants allowed in MUTCD procedure. Modern Roundabout Screening Guidelines The MUTCD describes roundabouts as good alternatives to signals, offering good operational performances, as well as crash reduction. NCHRP 457 Table 2-12, provides a framework to determine if a roundabout would be suitable for a location. Kinney Engineering Page 26
32 Question 1) Will operation as an uncontrolled or two-way-stop-controlled intersection yield unacceptable delay? 2) Is the daily entering volume less than the maximum service volume for a roundabout? (Use Figure 2-3 of NCHRP 457) 3) Is the subject junction located outside of the coordinated signal network? 4) Is the ratio of major-road to minor-road volume less than 5? 5) Is the entering drivers view free of sight obstructions? 6) Will the subject junction infrequently be used by large or oversized trucks? 7) Will the subject junction infrequently be used by pedestrians and bicyclists? Table 10- Roundabout Suitability Questions As NCHRP 457 points out, the more frequently that these questions are answered with Yes, then the more likely that this intersection would work well as a roundabout. C Street and West Klatt Road Intersection Control Options Existing Stop Control for C Street and West Klatt Road As shown in Table 7, delays for minor street traffic are excessive and will become worse in the future during the peak hour. Therefore, this is not a feasible long-term control solution for this intersection. Signalization December counts were factored to summer traffic conditions. Because there is a free-right turn lane on the southeast leg (northwest bound approach) of Klatt, the right-turn volumes were not included in this warrant. The right-turn exclusion was also checked and verified with NCHRP 457 procedure. The Crash Experience Warrant requires that 5 crashes which would have been correctable by signalization occur within any 12-month duration. Between 1996 and 1998 there were about 2 years when this condition was met. However, recently only 3 correctable crashes have occurred within 12 consecutive months. Kinney Engineering Page 27
33 The following table summarizes applicable warrant analysis for this intersection. MUTCD Warrant Volume Criteria Condition 2nd Criteria Condition Results Warrant 1-8-Hour Vehicular Volume, Condition A- Minimum Vehicular Volume Warrant 1-8-Hour Vehicular Volume, Condition B- Interruption of Continuous Traffic Warrant 1-8-Hour Vehicular Volume, Combination of A & B Warrant 2-4-Hour Vehicular Volume Warrant 7- Crash Experience 8 hours 3 hours 8 hours 3 hours 8 hours 4 hours 4 hours 3 hours 8 hours 5 hours 5 Crashes 3 Crashes Warrant 1A Met? Warrant 1B Met? Warrant 1 Combination of A&B Met? Warrant 2 Met? Warrant 7 Met? Warrants 1 or 2 >1000 Warrant 8- Roadway No (very Warrant 8 Satisfied Entering 1,397 Veh/Hr Network close) Met? in 5 Vehicles Years? Table 11- C Street and West Klatt Road Intersection Signal Warrants No No No No No No The future signalization warrants using the Cal-Trans methods were applied to 2017 estimate AADT forecasted volumes (1% per year growth rate). The Cal-Trans 70% volume thresholds were used because of the 45 mph speeds, and right-turns were removed from the minor street approach. Kinney Engineering Page 28
34 The following table summarizes Cal-Trans Warrants for this intersection. Warrant 1 - Minimum Vehicular Warrant Forecast Major Road Threshold 6,720 10,126 Minor Road Threshold 1,680 2,061 Warrant 1 Satisfied? Yes Warrant 2- Interruption of Continuous Traffic Warrant Forecast Major Road Threshold 10,080 10,126 Minor Road Threshold 850 2,061 Warrant 2 Satisfied? Yes Warrant 3-Combination 80% W1 80% W2 Forecast Major Road Threshold 5,376 8,064 10,126 Minor Road Threshold 1, ,061 80% Levels of 1 & 2 Satisfied? Yes Table 12- C Street and West Klatt Road Intersection Cal-Trans Future Signal Warrants It appears that the intersection would not meet signal warrant now, but would satisfy warrants between 2012 and Signal operational performance for the 2017 design hour volumes (Attachment B) are summarized in Table 12. This analysis used the 105 second cycle time which is compatible with the Timberlane signal cycle. The analysis assumes a southbound permissive-protective left-turn phasing and that all other turns are permissive. The analysis uses the existing lane configuration for the intersection. The phasing and splits were optimized by Synchro. Kinney Engineering Page 29
35 Morning Operations Evening Operations Table Peak Hour Operations, C Street/ West Klatt Road Signalization Option One final consideration for signalization would be that this proposed signal location and the one at Timberlane do not have adequate separation (about 700 feet) for good intra-corridor operations. As such, if this one were to be installed, then the Timberlane signal may have to be removed. Roundabout Screening Analysis Modern roundabout guidelines from NCHRP 457 were applied to the intersection. NCHRP 457 Guideline Questions C Street/ West Klatt Road 1. Will operation as an uncontrolled or 2-way stop controlled intersection yield unacceptable delay? 2a. Is the daily entering volume less than the maximum daily service volume for a 1-lane approach roundabout? If not see next row. For 70% volume on mainline, 30% left-turn volume, and 1-lane approaches, maximum daily service volume is 19,900 vehicles (NCHRP 457 Fig. 2-3). 2b. Is the daily entering volume less than the maximum daily service N/A volume for a 2-lane approach roundabout? 3. Is the subject junction located outside of a coordinated signal Yes network? 4. Is the ratio of major-road-to-minor-road volume less than 5.0? Yes Ratio 2.5 : 1 5. Is the entering driver's view free of sight obstructions (i.e. due to Yes - LOS F Yes, Entering Volume is 15,000 ADT in 2017 (less than 19,900 maximum) grade, curvature, or vegetation)? Yes 6. Will the subject junction be infrequently used by large or over-sized trucks? Yes 7. Will the subject junction be infrequently used by pedestrians and bicyclists? No Table 14- Modern Roundabout Screening, C Street/ West Klatt Road Intersection Kinney Engineering Page 30
36 This intersection would be a good candidate for a 1-lane approach, single circulatory lane modern roundabout. If implemented, then the C Street/ West Klatt Road approach lanes would be reconfigured to transition from the 2 existing lanes to 1-lane approaches. C Street / West Klatt Road / Timberlane Drive Existing Signalization This intersection is re-evaluated to ascertain if warrants are continued to be satisfied. December counts were factored to summer traffic conditions. Because there is an exclusive right-turn lane on the north bound approach of Timberlane, the right-turn volumes were not included in this warrant. The right-turn exclusion was also checked and verified with NCHRP 457 procedure. The following table summarizes applicable warrant analysis for this intersection. MUTCD Warrant Criteria Condition Criteria Condition Results Warrant 1-8-Hour Vehicular Volume, Condition A- Minimum Vehicular Volume Warrant 1-8-Hour Vehicular Volume, Condition B- Interruption of Continuous Traffic 8 hours 0 hours 8 hours 0 hours Warrant 1A Met? Warrant 1B Met? No No Warrant 1-8-Hour Vehicular Volume, Combination of A & B 8 hours 0 hours Warrant 1 Combination of A&B Met? No Warrant 2-4-Hour Vehicular Volume Warrant 7- Crash Experience 4 hours 0 hours 8 hours 0 hours 5 Crashes 2 Crashes Warrant 2 Met? Warrant 7 Met? Warrants 1 or 2 >1000 Warrant 8- Roadway Warrant 8 Satisfied No Entering 780 No Network Met? in 5 Vehicles Years? Table 15- C Street/West Klatt Road/Timberlane Drive Intersection Signal Warrants No No Kinney Engineering Page 31
37 It does not appear that warrants are met at this location, unless the sports park in the summer generates enough traffic to satisfy the peak hour warrant (not normally used). However, if these volumes levels are met during summer events, there may not be consistency that would mandate a signal. The following table summarizes Cal-Trans Warrants for this intersection. Warrant 1 - Minimum Vehicular Warrant Forecast Major Road Threshold 6,720 9,479 Minor Road Threshold 1, Warrant 1 Satisfied? No Warrant 2- Interruption of Continuous Traffic Warrant Forecast Major Road Threshold 10,080 9,479 Minor Road Threshold Warrant 2 Satisfied? No Warrant 3-Combination 80% W1 80% W2 Forecast Major Road Threshold 5,376 8,064 9,479 Minor Road Threshold 1, % Levels of 1 & 2 Satisfied? No Table 16- C Street/West Klatt Road/Timberlane Drive Intersection Cal-Trans Future Signal Warrants It can be concluded that this intersection, if it were to be unsignalized instead of signalized, would not satisfy warrants for the next 10 years. Kinney Engineering Page 32
38 Two-Way Stop Control (Remove Signal) If the signal was removed and stop control signs put in place for the north and south legs, the morning operations for existing lanes and 2017 summer volumes (Attachment B) would be movements at LOS B or better, and average control delays of 11 seconds or less. The evening operations for 2017 summer volumes, existing geometrics, would have movements with LOS C or better except for the southbound left-turn movement, which operates at a LOS E and average control delay of 37 seconds. However, the southbound forecasted volume is light (less than 50 vehicles per hour) and only during sports park hours. As such, this intersection appears to be feasible as a two-way-stop-control intersection. This change in control does not consider the safety consequences. If the signal is removed, right-angle crashes may occur more frequently. Roundabout Screening Analysis Modern roundabout guidelines from NCHRP 457 were applied to the intersection. Kinney Engineering Page 33
39 NCHRP 457 Guideline Questions C Street/ West Klatt Road/Timberlane 1. Will operation as an uncontrolled or 2-way stop controlled No intersection yield unacceptable delay? 2a. Is the daily entering volume less than the maximum daily service volume for a 1-lane approach roundabout? If not see next row. For 89% volume on mainline, 22% left-turn volume, and 1-lane approaches, maximum daily service volume is 18,600 vehicles (NCHRP 457 Fig. 2-3). 2b. Is the daily entering volume less than the maximum daily service N/A volume for a 2-lane approach roundabout? 3. Is the subject junction located outside of a coordinated signal Yes network? 4. Is the ratio of major-road-to-minor-road volume less than 5.0? No Ratio 9 : 1 5. Is the entering driver's view free of sight obstructions (i.e. due to Yes, Entering Volume is 10,400 ADT in 2017 (less than 18,600 maximum) grade, curvature, or vegetation)? 6. Will the subject junction be infrequently used by large or over-sized Yes trucks? 7. Will the subject junction be infrequently used by pedestrians and No bicyclists? Table 17- Modern Roundabout Screening, C Street/ West Klatt Road/Timberlane Drive Intersection Yes This intersection may be a candidate for a 1-lane approach, single circulatory lane modern roundabout, since there are more yes, than no responses to the criteria. However, it is unlikely that the additional right-of-way and construction cost would be justified by operational improvement over a signal or unsignalized option. If implemented, then the C Street/ West Klatt Road approach lanes would be reconfigured to transition from the 2 existing lanes to 1-lane approaches. Kinney Engineering Page 34
40 Alternatives Alternative 1: Remove Timberlane Drive Signal, Signalize C Street/ West Klatt Road Intersection Under this alternative, the following actions would occur: The C Street/ West Klatt Road intersection has poor operational performance (minor left-turns) and is forecasted to meet signal warrants between 5 to 10 years from now. This alternative would install a fully actuated signal at this intersection. The southwest bound approach would have permissive-protective left-turn phasing, and all other movement would be permissive. The existing signal would be removed from the Timberlane Drive Intersection. The C Street/ West Klatt Road/Timberlane Drive intersection would be reconfigured to two-way-stop sign control. Additional options include: o The primary access road into to the sports park could be realigned opposite the West Klatt leg of the C Street/ West Klatt Road intersection. o If the access road is realigned, the C Street/ West Klatt Road/Timberlane Drive intersection could be reconfigured with medians to only allow left-in, right-in, right-out movements from the minor approaches. This would significantly reduce potential right-angle collisions after the signal is removed. This would not affect many vehicles from the southern neighborhoods (see Figures 6 and 7), and those wishing to travel westbound may do so by making an indirect left-turn; that is turn right out of Timberlane, then make u- turn at the new signal. If the access road isn t relocated, then the same leftin, right-in, right-out median configuration could be implemented, but would affects sports park traffic patterns. Kinney Engineering Page 35

41 The following figure illustrates conceptual intersection configuration for the proposed C Street/ West Klatt Road signalized intersection. With the realignment of the primary sports park access road, left-turn lanes should be added to the northwest and southeast legs as shown below South Anchorage Sports Park Access C Street C Street W. Klatt Road Figure 11- C Street/West Klatt Road/ South Anchorage Sports Park Access Signalized Lane Configuration The following table summarizes the signal operations, with the relocated sports park access and lane configurations shown above. Kinney Engineering Page 36
42 Morning Operations Evening Operations Table Alternative 1 Peak Hour Operations, C Street/ West Klatt Road/ South Anchorage Sports Park Access Signalized Intersection Operations for the proposed signal would be good. In addition, the relocation of the sports park access that currently is opposite of the Timberlane Drive approach improves the unsignalized operation in 2017 to LOS A for all movements. Under the unsignalized control, the problem movement of the existing approach is the southbound left-turn (LOS E) during the summer evening peak hour. Under this alternative that movement would be served by the signal. Alternative 2: Remove Timberlane Drive Signal, Construct a Modern Roundabout at the C Street/ West Klatt Road Intersection Under this alternative, actions are identical to those stated in Alternative 1, except a modern roundabout would be installed the C Street/ West Klatt Road intersection. Preliminary capacity analysis indicates that a combination roundabout would be required because of the southbound through and left-turn volumes. This would be refined during design, but the southbound approach would probably have to be two lanes, with two circulatory lanes through ½ of the roundabout, and the outer lane dropping at the south exit leg. A conceptual configuration is shown below. Without the dual southbound circulatory lanes, the LOS would be F; and with them, the LOS would be A. Kinney Engineering Page 37

43 South Anchorage Sports Park Access C Street C Street W. Klatt Road Figure 12- C Street /Klatt Road Modern Roundabout Concept Figure 13 with corresponding Table 19 presents some of the design elements for the roundabout. Kinney Engineering Page 38
44 Deflection Island (E+V)/2 Inscribed circle diameter Central island L L V E 2φ Figure 13- Roundabout Geometric Elements Kinney Engineering Page 39
45 Element Value Source, Comments Inscribed Circle Diameter Central Island Diameter Approach Width, V Entry Width, E L 115 to 140 feet single lane; 150 to 180 feet for dual lanes Computed base on ICD and CRW to include an outer mountable apron that accommodates occasional truck-trailer combinations larger than WB-50. Lane Width (assumed 12 feet for 1 lane, 24 for 2 lanes) 14 to 16 feet for single lane (14 assumed), 24 to 30 feet for dual lanes Minimum 16 feet (Rodel), 40 feet recommended minimum (FHWA) assumed for most cases FHWA range, adjusted for local experience. Larger diameters will enable WB-50 design vehicles to avoid tracking across apron. Inscribed Circle Diameter- 2 x Circulatory Road Width. FHWA, Rodel FHWA Ф 25 to 35 degrees Rodel Entry Radius, Single Lane >30 feet, <100 feet Rodel, FHWA Exit Radius, Single Lane Circulatory Road Width >50 feet (FHWA) 1 to 1.2 x E Rodel, FHWA Use 40 feet. (derived from FHWA s recommendation of an 80-foot flare taper in urban areas.) Rodel recommend that the exit radius be determined as transition from circulatory road width, through the deflection island, and to the departure width. Radius should be selected so that the taper is 15 or 20 to 1. FHWA and Rodel. FWHA Deflection Island Defined by tangential recommends a minimum of 5-foot (splitter island), Exit extensions to the Central pedestrian refuge be located at Width Island about 20 feet from the yield line. Table 19 - Typical Design Values for Modern Roundabout Geometric Elements Kinney Engineering Page 40
46 Additional Work to Advance Reconnaissance Alternatives This reconnaissance study has identified two alternatives to address current and future operational issues at the project area. The following additional work should be considered to advance one of these alternatives. Perform Spring or Summer Peak Hour Turning Movement Counts at Study Intersections- this reconnaissance study uses counts performed in December, which has less traffic than summer, and could not account for sports park traffic. Collect Approach Hose Counts. Observe Pedestrian and Bicycle Circulation. Collect Additional Speed Data. Refine Analysis and Alternatives Based Upon the Above Data Kinney Engineering Page 41
47 Attachment A- Link Counts Kinney Engineering Page 42
48 Attachment B- Turning Movement Projections 2007 Morning Peak Hour 2007 Evening Peak Hour Kinney Engineering Page 43
49 2017 Morning Peak Hour 2017 Evening Peak Hour Kinney Engineering Page 44
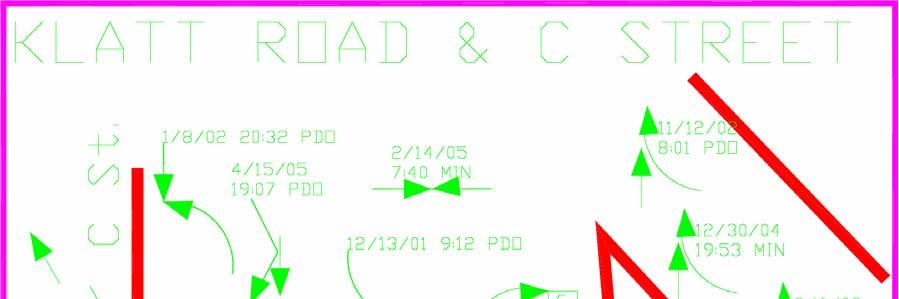
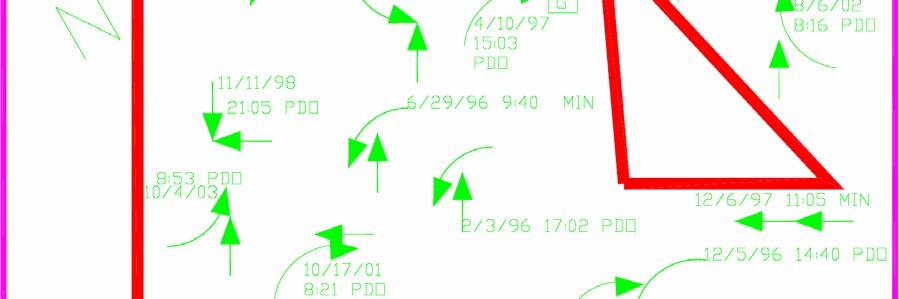
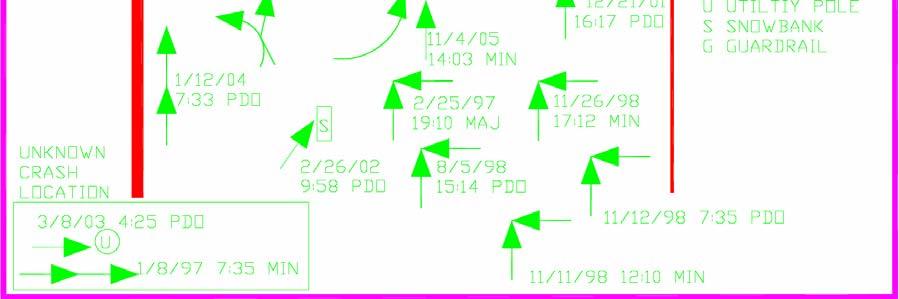
50 Attachment C- Crash Diagrams Kinney Engineering Page 45
Traffic Impact Analysis Walton Acres at Riverwood Athletic Club Clayton, NC
 Traffic Impact Analysis Walton Acres at Riverwood Athletic Club Clayton, NC 1. TABLE OF CONTENTS INTRODUCTION...1 1.1. Site Location and Study Area...1 1.2. Proposed Land Use and Site Access...2 1.3.
Traffic Impact Study WestBranch Residential Development Davidson, NC March 2016
 Traffic Impact Study WestBranch Residential Development Davidson, NC March 216 TRAFFIC IMPACT STUDY FOR THE WestBranch Residential Development LOCATED IN DAVIDSON, NC Prepared For: Lennar Carolinas, LLC
INDUSTRIAL BUILDING 3009 HAWTHORNE ROAD CITY OF OTTAWA TRANSPORTATION OVERVIEW REVISED. Prepared for: Canada Inc.
 INDUSTRIAL BUILDING 3009 HAWTHORNE ROAD CITY OF OTTAWA TRANSPORTATION OVERVIEW REVISED Prepared for: 7849648 Canada Inc. Octiober 1, 2015 114-598 Overview_2.doc D. J. Halpenny & Associates Ltd. Consulting
HILTON GARDEN INN HOTEL HOTEL EXPANSION 2400 ALERT ROAD, OTTAWA TRANSPORTATION BRIEF. Prepared for:
 HILTON GARDEN INN HOTEL HOTEL EXPANSION 2400 ALERT ROAD, OTTAWA TRANSPORTATION BRIEF Prepared for: Bona Building & Management Co. Ltd. Place Vanier, 333 North River Road Vanier, Ontario K1L 8B9 October
Existing Conditions. Date: April 16 th, Dan Holderness; Coralville City Engineer Scott Larson; Coralville Assistant City Engineer
 Date: April 16 th, 2015 To: From: Re: Dan Holderness; Coralville City Engineer Scott Larson; Coralville Assistant City Engineer Darian Nagle-Gamm, Traffic Engineering Planner Highway 6 (2 nd Street) /
METHODOLOGY. Signalized Intersection Average Control Delay (sec/veh)
") Chapter 5 Traffic Analysis 5.1 SUMMARY US /West 6 th Street assumes a unique role in the Lawrence Douglas County transportation system. This principal arterial street currently conveys commuter traffic
Chapter 5 Traffic Analysis 5.1 SUMMARY US /West 6 th Street assumes a unique role in the Lawrence Douglas County transportation system. This principal arterial street currently conveys commuter traffic
Traffic Impact Analysis Chatham County Grocery Chatham County, NC
 Chatham County Grocery Chatham County, NC TABLE OF CONTENTS 1. INTRODUCTION... 1 1.1. Location and Study Area... 1 1.2. Proposed Land Use and Access... 2 1.3. Adjacent Land Uses... 2 1.4. Existing ways...
TRANSPORTATION ANALYSIS REPORT US Route 6 Huron, Erie County, Ohio
 TRANSPORTATION ANALYSIS REPORT US Route 6 Huron, Erie County, Ohio December 12, 2012 Prepared for: The City of Huron 417 Main Huron, OH 44839 Providing Practical Experience Technical Excellence and Client
FINAL DESIGN TRAFFIC TECHNICAL MEMORANDUM
 FINAL DESIGN TRAFFIC TECHNICAL MEMORANDUM July 2014 FINAL (SR 43) Project Development and Environment Study From State Road 60 (Adamo Drive) to I-4 (SR 400) Hillsborough County, Florida Work Program Item
Figure 1: Vicinity Map of the Study Area
 ARIZONA TEXAS NEW MEXICO OKLAHOMA May 5, 2016 Mr. Anthony Beach, P.E. BSP Engineers 4800 Lakewood Drive, Suite 4 Waco, Texas 76710 Re: Intersection and Access Analysis along Business 190 in Copperas Cove
OFFICE/RETAIL DEVELOPMENT 1625 BANK STREET OTTAWA, ONTARIO TRANSPORTATION BRIEF. Prepared for: Canada Inc.
 OFFICE/RETAIL DEVELOPMENT 1625 BANK STREET OTTAWA, ONTARIO TRANSPORTATION BRIEF Prepared for: 9402209 Canada Inc. December 15, 2015 115-625 Report_2.doc D. J. Halpenny & Associates Ltd. Consulting Transportation
FAIRFIELD INN & SUITES HOTEL 135 THAD JOHNSON PRIVATE OTTAWA TRANSPORTATION BRIEF. Prepared for:
 FAIRFIELD INN & SUITES HOTEL 135 THAD JOHNSON PRIVATE OTTAWA TRANSPORTATION BRIEF Prepared for: Bona Building & Management Co. Ltd. Place Vanier, 333 North River Road Vanier, Ontario K1L 8B9 August 12,
Intersection Traffic Control Feasibility Study
 Intersection Traffic Control Feasibility Study CSAH 9 at CSAH 60 (185th Avenue) Prepared For: Dakota County Transportation Department Western Service Center 14955 Galaxie Avenue, 3rd Floor Apple Valley,
Glenn Avenue Corridor Traffic Operational Evaluation
 Glenn Avenue Corridor Traffic Operational Evaluation PREPARED FOR: THE CITY OF AUBURN PREPARED BY: DECEMBER 2007 Glenn Avenue Corridor Study--Auburn, Alabama TABLE OF CONTENTS Introduction... 1 Background
Route 28 (South Orleans Road)/Route 39 (Harwich Road)/Quanset Road Intersection
/Route 39 (Harwich Road)/Quanset Road Intersection") TRAFFIC FEASIBILITY STUDY Route 28 (South Orleans Road)/Route 39 (Harwich Road)/Quanset Road Intersection Orleans, Massachusetts Prepared for: Town of Orleans Prepared by: Fay, Spofford & Thorndike, LLC
TRAFFIC FEASIBILITY STUDY Route 28 (South Orleans Road)/Route 39 (Harwich Road)/Quanset Road Intersection Orleans, Massachusetts Prepared for: Town of Orleans Prepared by: Fay, Spofford & Thorndike, LLC
Capital Region Council of Governments
 March 23, 2018 Capital Region Council of Governments PROJECT CONCEPT REPORT Realignment of Swamp and Northfield Road s approaches to Route 44 (Boston Turnpike) Town of Coventry SUMMARY: The Town of Coventry
Traffic Impact Study Little Egypt Road Development Denver, North Carolina June 2017
 Traffic Impact Study Little Egypt Road Development Denver, North arolina June 2017 N. Little Egypt Road DQ\ QDQFLQJ VDOHV RU RWKHU SHUIRUPDQFH EDVHG FULWHULD Proposed Site Driveways Site Driveway 1 TRAFFI
THIS PAGE LEFT BLANK INTENTIONALLY
 GA SR 25 Spur at Canal Road Transportation Impact Analysis PREPARED FOR GLYNN COUNTY, GEORGIA 1725 Reynolds Street, Suite 300 Brunswick, Georgia 31520 PREPARED BY 217 Arrowhead Boulevard Suite 26 Jonesboro,
MEETING FACILITY 2901 GIBFORD DRIVE CITY OF OTTAWA TRANSPORTATION BRIEF. Prepared for: Holiday Inn Express 2881 Gibford Drive Ottawa, ON K1V 2L9
 MEETING FACILITY 2901 GIBFORD DRIVE CITY OF OTTAWA TRANSPORTATION BRIEF Prepared for: Holiday Inn Express 2881 Gibford Drive Ottawa, ON K1V 2L9 December 18, 2012 112-566 Brief_1.doc D. J. Halpenny & Associates
Evaluation of M-99 (Broad Street) Road Diet and Intersection Operational Investigation
 Road Diet and Intersection Operational Investigation") Evaluation of M-99 (Broad Street) Road Diet and Intersection Operational Investigation City of Hillsdale, Hillsdale County, Michigan June 16, 2016 Final Report Prepared for City of Hillsdale 97 North Broad
Evaluation of M-99 (Broad Street) Road Diet and Intersection Operational Investigation City of Hillsdale, Hillsdale County, Michigan June 16, 2016 Final Report Prepared for City of Hillsdale 97 North Broad
Traffic Analysis Report & Data. Appendix D
 & Data Appendix D Golden View Drive Intersection and Safety Upgrades Final Date: 6/8/2012 Prepared for: Municipality of Anchorage Public Works Department Project Management & Engineering Division And CRW
FORM A PASCO COUNTY ACCESS CONNECTION PERMIT APPLICATION
 FORM 901.3.A PASCO COUNTY ACCESS CONNECTION PERMIT APPLICATION The following information is required from all applicants directly or indirectly accessing any collector or arterial road or as otherwise
Walmart (Store # ) 60 th Street North and Marion Road Sioux Falls, South Dakota
 60 th Street North and Marion Road Sioux Falls, South Dakota") Walmart (Store #4865-00) 60 th Street North and Marion Road Sioux Falls, South Dakota Prepared for: Wal-Mart Stores, Inc. Bentonville, Arkansas Prepared by: Kimley-Horn and Associates, Inc. ã2013 Kimley-Horn
Walmart (Store #4865-00) 60 th Street North and Marion Road Sioux Falls, South Dakota Prepared for: Wal-Mart Stores, Inc. Bentonville, Arkansas Prepared by: Kimley-Horn and Associates, Inc. ã2013 Kimley-Horn
133 rd Street and 132 nd /Hemlock Street 132 nd Street and Foster Street MINI ROUNDABOUTS. Overland Park, Kansas
 133 rd Street and 132 nd /Hemlock Street 132 nd Street and Foster Street MINI ROUNDABOUTS Overland Park, Kansas September 1, 2017 TABLE OF CONTENTS 1. INTRODUCTION... 1 2. LITERATURE REVIEW... 1 3. CONCEPT
ALLEY 24 TRAFFIC STUDY
 ALLEY 24 TRAFFIC STUDY in City of Frostburg, Maryland January 2013 3566 Teays Valley Road Hurricane, WV Office: (304) 397-5508 www.denniscorporation.com Alley 24 Traffic Study January 2013 Frostburg, Maryland
INDUSTRIAL BUILDING 1660 COMSTOCK ROAD CITY OF OTTAWA TRANSPORTATION OVERVIEW. Prepared for:
 INDUSTRIAL BUILDING 1660 COMSTOCK ROAD CITY OF OTTAWA TRANSPORTATION OVERVIEW Prepared for: Simluc Contractors Limited 2550 Blackwell Street, Ottawa K1B 5R1 October 18, 2013 113-584 Overview_1.doc D. J.
7.0 FREEWAYS CONGESTION HOT SPOT PROBLEM & IMPROVEMENT PROJECT ANALYSIS & DEFINITION
 7.0 FREEWAYS CONGESTION HOT SPOT PROBLEM & IMPROVEMENT PROJECT ANALYSIS & DEFINITION 7.1 INTRODUCTION & METHODOLOGY FEASIBILITY REPORT Congestion hot spot problem locations have been assessed using the
MEMORANDUM. DATE March 1, 2012 TO Town of Milton Mark Abbott, Seth Asante, and Efi Pagitsas Boston Region MPO Staff
 MEMORANDUM DATE March 1, 212 TO Town of Milton FROM RE Mark Abbott, Seth Asante, and Efi Pagitsas Boston Region MPO Staff FFY 211 Safety and Operations Analyses at Selected Boston Region MPO Intersections:
Project Report. South Kirkwood Road Traffic Study. Meadows Place, TX October 9, 2015
 Meadows Place, TX October 9, 2015 Contents 1 Introduction... 1 2 Data Collection... 1 3 Existing Roadway Network... 2 4 Traffic Volume Development... 2 5 Warrant Analysis... 3 6 Traffic Control Alternative
Traffic Analysis and Design Report. NW Bethany Boulevard. NW Bronson Road to NW West Union Road. Washington County, Oregon
 Traffic Analysis and Design Report NW Bethany Boulevard NW Bronson Road to NW West Union Road Washington County, Oregon May 2011 Table of Contents Table of Contents Section 1 Executive Summary... 2 Section
Chapter 4 Traffic Analysis
 Chapter 4 Traffic Analysis PURPOSE The traffic analysis component of the K-68 Corridor Management Plan incorporates information on the existing transportation network, such as traffic volumes and intersection
HOLIDAY INN HOTEL 235 KING EDWARD AVENUE CITY OF OTTAWA TRANSPORTATION BRIEF. Prepared for:
 HOLIDAY INN HOTEL 235 KING EDWARD AVENUE CITY OF OTTAWA TRANSPORTATION BRIEF Prepared for: Momentum Planning & Communications 1165 Greenlawn Crescent Ottawa, ON K1L 6C2 June 29, 2015 115-618 Brief_1.doc
Traffic Circulation Study for Neighborhood Southwest of Mockingbird Lane and Airline Road, Highland Park, Texas
 ARIZONA TEXAS NEW MEXICO OKLAHOMA February 13, 2015 Mr. Meran Dadgostar P.E., R.S. Town of Highland Park 4700 Drexel Dr. Highland Park, Texas 75205 Re: Traffic Circulation Study for Neighborhood Southwest
APARTMENT BUILDING DEVELOPMENT 1161 HERON ROAD OTTAWA, ONTARIO TRANSPORTATION IMPACT STUDY. Prepared for:
 APARTMENT BUILDING DEVELOPMENT 1161 HERON ROAD OTTAWA, ONTARIO TRANSPORTATION IMPACT STUDY Prepared for: 1649362 Ontario Inc. c/o Manor Park Management 231 Brittany Drive, Suite D Ottawa ON K1K 0R8 July
1 2 I N T R O D U C T I O 6 G E N E R A L I N F O R M A T I O N. Across. 6. Knowledge communicated in a brief overview
 1 2 I N T R O D U C T I O N 3 4 5 6 G E N E R A L I N F O R M A T I O N 7 Across 6. Knowledge communicated in a brief overview ABBREVIATIONS & ACRONYMS AADT - ANNUAL AVERAGE DAILY TRAFFIC ADT - AVERAGE
Traffic Impact Study. Westlake Elementary School Westlake, Ohio. TMS Engineers, Inc. June 5, 2017
 TMS Engineers, Inc. Traffic Impact Study Westlake Elementary School Westlake, Ohio June 5, 2017 Prepared for: Westlake City Schools - Board of Education 27200 Hilliard Boulevard Westlake, OH 44145 TRAFFIC
Northwest Corridor Project Interchange Modification, Interchange Justification and System Analysis Report Reassessment (Phase I)
") Northwest Corridor Project Interchange Modification, Interchange Justification and System Analysis Report Reassessment (Phase I) Introduction The Georgia Department of Transportation (GDOT) prepared a
Northwest Corridor Project Interchange Modification, Interchange Justification and System Analysis Report Reassessment (Phase I) Introduction The Georgia Department of Transportation (GDOT) prepared a
PRELIMINARY DRAFT WADDLE ROAD / I-99 INTERCHANGE PROJECT ALTERNATIVE ANALYSIS FINAL TRAFFIC SUMMARY REPORT
 PRELIMINARY DRAFT WADDLE ROAD / I-99 INTERCHANGE PROJECT ALTERNATIVE ANALYSIS FINAL TRAFFIC SUMMARY REPORT Prepared by: In Association with: November 2013 EXECUTIVE SUMMARY Patton Township, in partnership
MEDICAL/OFFICE BUILDING 1637 BANK STREET OTTAWA, ONTARIO TRANSPORTATION OVERVIEW. Prepared for:
 MEDICAL/OFFICE BUILDING 1637 BANK STREET OTTAWA, ONTARIO TRANSPORTATION OVERVIEW Prepared for: 2434984 Ontario Inc. 13-5510 Canotek Road Ottawa, Ontario K1J 9J5 June 4, 2015 115-613 Report_2.doc D. J.
TRAFFIC IMPACT STUDY And A TRAFFIC SIGNAL WARRANT ANALYSIS FOR A SENIOR LIVING AND APARTMENT DEVELOPMENT
 TRAFFIC IMPACT STUDY And A TRAFFIC SIGNAL WARRANT ANALYSIS FOR A SENIOR LIVING AND APARTMENT DEVELOPMENT DEERFIELD TOWNSHIP, WARREN COUNTY, OHIO Nantucket Circle and Montgomery Road () Prepared for: ODLE
OTTAWA TRAIN YARDS PHASE 3 DEVELOPMENT CITY OF OTTAWA TRANSPORTATION IMPACT STUDY. Prepared for:
 OTTAWA TRAIN YARDS PHASE 3 DEVELOPMENT CITY OF OTTAWA TRANSPORTATION IMPACT STUDY Prepared for: The Ottawa Train Yards Inc. 223 Colonnade Road South, Suite 212 Nepean, Ontario K2E 7K3 January 17, 2012
TRAFFIC IMPACT STUDY COMPREHENSIVE UPDATE TOWN OF THOMPSON S STATION, TENNESSEE PREPARED FOR: THE TOWN OF THOMPSON S STATION
 TRAFFIC IMPACT STUDY COMPREHENSIVE UPDATE TOWN OF THOMPSON S STATION, TENNESSEE PREPARED FOR: THE TOWN OF THOMPSON S STATION Transportation Consultants, LLC 1101 17 TH AVENUE SOUTH NASHVILLE, TN 37212
TRAFFIC SIGNAL WARRANT STUDY
 TRAFFIC SIGNAL WARRANT STUDY 5 th STREET & ENCHANTED PINES DRIVE JANUARY 2013 TRAFFIC OPERATIONS ENGINEERING SERVICES/PUBLIC WORKS DEPARTMENT TABLE OF CONTENTS INTERSECTION LOCATION MAP ii INTRODUCTION
5858 N COLLEGE, LLC N College Avenue Traffic Impact Study
 5858 N COLLEGE, LLC nue Traffic Impact Study August 22, 2016 Contents Traffic Impact Study Page Preparer Qualifications... 1 Introduction... 2 Existing Roadway Conditions... 5 Existing Traffic Conditions...
TRAFFIC STUDY GUIDELINES Clarksville Street Department
 TRAFFIC STUDY GUIDELINES Clarksville Street Department 9/1/2009 Introduction Traffic studies are used to help the city determine potential impacts to the operation of the surrounding roadway network. Two
Harrah s Station Square Casino
 Transportation Analysis Harrah s Station Square Casino Pittsburgh, Pennsylvania Submitted To: City of Pittsburgh and Pennsylvania Gaming Control Board Prepared By: DKS Associates GAI Consultants December
Roundabout Feasibility Memorandum
 Roundabout Feasibility Memorandum To From Gwen Pipkin Bill Howell Date June 18, 2013 Subject Roundabout Feasibility Study SR 29 PD&E Study From Oil Well Road to SR 82 Collier County, FL FPID 417540-1-22-01
DRAFT. Corridor study. Honeysuckle Road. October Prepared for the City of Dothan, AL. Prepared by Gresham, Smith and Partners
 DRAFT Corridor study Honeysuckle Road October 2017 Prepared for the City of Dothan, AL Prepared by TABLE OF CONTENTS SECTION I... 1 STUDY SUMMARY... 1 INTRODUCTION... 1 CONCLUSIONS... 5 SECTION II... 7
Truck Climbing Lane Traffic Justification Report
 ROUTE 7 (HARRY BYRD HIGHWAY) WESTBOUND FROM WEST MARKET STREET TO ROUTE 9 (CHARLES TOWN PIKE) Truck Climbing Lane Traffic Justification Report Project No. 6007-053-133, P 101 Ι UPC No. 58599 Prepared by:
MEMORANDUM. Layout Of Study Intersections And Traffic Control
 BOSTON REGION METROPOLITAN PLANNING ORGANIZATION Richard A. Davey, MassDOT Secretary and CEO and MPO Chairman Karl H. Quackenbush, Executive Director, MPO Staff DATE November 15, 2012 TO FROM RE Town of
Subject: Solberg Avenue / I-229 Grade Separation: Traffic Analysis
 MEMORANDUM Transportation Bill Troe, AICP Jason Carbee, AICP 12120 Shamrock Plaza Suite 300 Omaha, NE 68154 (402) 334-8181 (402) 334-1984 (Fax) To: Project File Date: Subject: Solberg Avenue / I-229 Grade
DUNBOW ROAD FUNCTIONAL PLANNING
 DUNBOW ROAD FUNCTIONAL PLANNING Final Report August 3, 216 #31, 316 5th Avenue NE Calgary, AB T2A 6K4 Phone: 43.273.91 Fax: 43.273.344 wattconsultinggroup.com Dunbow Road Functional Planning Final Report
THE FUTURE OF THE TxDOT ROADWAY DESIGN MANUAL
 THE FUTURE OF THE TXDOT ROADWAY DESIGN MANUAL Kenneth Mora, P.E. (Design Division) 10/10/2017 Table of contents 1 2 Reduction in FHWA design controlling criteria Innovative Intersection Guidance 3-7 8-42
TABLE OF CONTENTS TABLE OF CONTENTS... I APPENDICES... III LIST OF EXHIBITS... V LIST OF TABLES... VII LIST OF ABBREVIATED TERMS...
 TABLE OF CONTENTS TABLE OF CONTENTS... I APPENDICES... III LIST OF EXHIBITS... V LIST OF TABLES... VII LIST OF ABBREVIATED TERMS... IX 1 INTRODUCTION... 1 1.1 Project Overview... 1 1.2 Analysis Scenarios...
Waterford Lakes Small Area Study
 Waterford Lakes Small Area Study Existing Traffic Conditions PREPARED FOR: ORANGE COUNTY PUBLIC WORKS DEPARTMENT TRAFFIC ENGINEERING DIVISION ORLANDO, FLORIDA PREPARED WITH: INWOOD CONSULTING ENGINEERS
Technical Memorandum TRAFFIC IMPACT STUDY. RIDLEY ROAD CONVENIENCE STORE Southampton County, VA. Prepared for: Mr. David Williams.
 Technical Memorandum TRFFIC IMPCT STUDY RIDLEY ROD CONVENIENCE STORE Southampton County, V Prepared for: Mr. David Williams By: Charles Smith, P.E., PTOE EPR Charlottesville, V July 2014 1 TBLE OF CONTENTS
Draft Report. Traffic Impact Study. Superstore, Wal-Mart, and Kent Development. Yarmouth, Nova Scotia. Prepared for
 oad & Traffic Management Road & Traffic Management R Atlantic Traffic Engineering Specialists Draft Report Traffic Impact Study Superstore, Wal-Mart, and Kent Development Yarmouth, Nova Scotia Prepared
URBAN QUARRY HEADQUARTERS 2717 STEVENAGE DRIVE CITY OF OTTAWA TRANSPORTATION OVERVIEW. Prepared for: Urban Quarry 4123 Belgreen Drive, Ottawa K1G 3N2
 URBAN QUARRY HEADQUARTERS 2717 STEVENAGE DRIVE CITY OF OTTAWA TRANSPORTATION OVERVIEW Prepared for: Urban Quarry 4123 Belgreen Drive, Ottawa K1G 3N2 February 27, 2014 113-584 Overview_1.doc D. J. Halpenny
Intersection Control Evaluation
 Intersection Control Evaluation Lor Ray Drive at Howard Drive in North Mankato, Nicollet County, Minnesota Mankato/North Mankato Area Planning Organization October 2016 SRF No. 016 09243 Table of Contents
Design of Turn Lane Guidelines
 Design of Turn Lane Guidelines CTS Transportation Research Conference May 24, 2012 Howard Preston, PE Minnesota Department of Transportation Research Services Office of Policy Analysis, Research & Innovation
QUICKIE C STORE AND GAS BAR 1780 HERON ROAD OTTAWA, ONTARIO TRANSPORTATION BRIEF. Prepared for:
 QUICKIE C STORE AND GAS BAR 1780 HERON ROAD OTTAWA, ONTARIO TRANSPORTATION BRIEF Prepared for: Quickie Convenience Stores Larny Holdings Ltd. c/o PBC Group April 15, 2015 115-615 Report_1.doc D. J. Halpenny
AMEC Earth and Environmental. Bovaird Drive Environmental Assessment. Traffic Study Final Report. August Excellence in Transportation Planning
 AMEC Earth and Environmental Bovaird Drive Environmental Assessment Traffic Study Final Report August Excellence in Transportation Planning AMEC Earth and Environmental Bovaird Drive Class EA Traffic
INTERSECTION SAFETY STUDY State Route 57 / Seville Road
 INTERSECTION SAFETY STUDY State Route 57 / Seville Road City of Wadsworth, Medina County, Ohio Prepared For: City of Wadsworth Engineering Department 120 Maple Street Wadsworth, OH 44281 Prepared By: GPD
Design Traffic Technical Memorandum
 State Road 7 Extension PD&E Study Design Traffic Technical Memorandum Palm Beach County, FL October 2010 State Road 7 Extension PD&E Study Design Traffic Technical Memorandum Palm Beach County, FL Prepared
Clay Street Realignment Project Traffic Study
 Final Clay Street Realignment Project Traffic Study November 24, 2009 Prepared for: City of Placerville RS07-2466 2990 Lava Ridge Court, Suite 200 Roseville, CA 95661 (916) 773-1900 Fax (916) 773-2015
Gateway Transportation Study
 Gateway Transportation Study Amherst, Massachusetts SUBMITTED TO University of Massachusetts Amherst Town of Amherst SUBMITTED BY Vanasse Hangen Brustlin, Inc. Watertown, Massachusetts March 213 Back of
The proposed development is located within 800m of an existing Transit Station where infill developments and intensification are encouraged.
 Stantec Consulting Ltd. 1331 Clyde Avenue, Suite 4 Ottawa ON K2C 3G4 Tel: (613) 722-442 Fax: (613) 722-2799 May 14, 213 File: 1638823 Robinson Park Development Corp. 5699 Power Road Ottawa, ON, K1G 3N4
TRAFFIC IMPACT ANALYSIS
 TRAFFIC IMPACT ANALYSIS FOR THE CHAMPAIGN UNIT#4 SCHOOL DISTRICT PROPOSED HIGH SCHOOL (SPALDING PARK SITE) IN THE CITY OF CHAMPAIGN Final Report Champaign Urbana Urbanized Area Transportation Study 6/24/2014
DIMARCO CANANDAIGUA PROPERTIES HOUSING PROJECT CANANDAIGUA, ONTARIO COUNTY, NEW YORK
 TRAFFIC IMPACT STUDY FOR THE DIMARCO CANANDAIGUA PROPERTIES HOUSING PROJECT CANANDAIGUA, ONTARIO COUNTY, NEW YORK MARCH 14, 2017 PREPARED FOR: 1950 Brighton Henrietta Town Line Rd Rochester, NY 14623 PREPARED
Los Altos Hills Town Council - June 18, 2015 Palo Alto City Council June 22, AGENDA ITEM #2.B Presentation
 Los Altos Hills Town Council - June 18, 2015 Palo Alto City Council June 22, 2015 AGENDA ITEM #2.B Presentation Previous Presentations Los Altos Hills Town Council in May 2014 and February 2015 Palo Alto
Troutbeck Farm Development
 Troutbeck Farm Development Willistown Township, Chester County PA For Submission To: Willistown Township Last Revised: October, 4 TPD# INLM.A. 5 E. High Street Suite 65 Pottstown, PA 9464 6.36.3 TPD@TrafficPD.com
Donahue Drive Corridor Traffic Operational Evaluation
 Donahue Drive Corridor Traffic Operational Evaluation PREPARED FOR: THE CITY OF AUBURN PREPARED BY: JANUARY 2007 Donahue Drive Corridor Study--Auburn, Alabama TABLE OF CONTENTS Introduction... 1 Background
TRAFFIC CONTROL DEVICES ON EDGEWATER BOULEVARD AT PORT ROYAL AVENUE (NORTH)
") Attachment 2 DATE: August 6, 2012 TO: VIA: FROM: SUBJECT: Mayor and Members of the City Council James C. Hardy, City Manager Ramon Towne, Director of Public Works Leah Edwards, Assistant Engineer TRAFFIC
Attachment 2 DATE: August 6, 2012 TO: VIA: FROM: SUBJECT: Mayor and Members of the City Council James C. Hardy, City Manager Ramon Towne, Director of Public Works Leah Edwards, Assistant Engineer TRAFFIC
BLOSSOM AT PICKENS SIGNALIZED INTERSECTION IMPROVEMENT STUDY
 BLOSSOM AT PICKENS SIGNALIZED INTERSECTION IMPROVEMENT STUDY Class Project Report for ECIV 542 Traffic Engineering Submitted by Omor Sharif Muchun Song Narges Kaveshgar Quyen Pham Chih-Yao Lin Submission
ORANGE COUNTY PUBLIC WORKS TRAFFIC INVESTIGATIONS
 ORANGE COUNTY PUBLIC WORKS TRAFFIC INVESTIGATIONS STAFF REPORT OF: January 6, 2019 SUPERVISORIAL DISTRICT: 5 SUBJECT: LOCATION: INVESTIGATOR: O Neill Drive at Roanoke Drive; Ladera Ranch; TB 922-E6 Clever
400 Intersection Design
 400 Intersection Design Table of Contents 401 Intersections At-Grade... 4-1 401.1 Intersection Locations... 4-1 401.2 Intersection Traffic Control and Operational Analysis... 4-1 401.2.1 Signals. 4-1 401.2.2
Traffic Impact Study. Roderick Place Columbia Pike Thompson s Station, TN. Transportation Group, LLC Traffic Engineering and Planning
 F i s c h b a c h Transportation Group, LLC Traffic Engineering and Planning Traffic Impact Study Roderick Place Columbia Pike Thompson s Station, TN Prepared March 2016 Ms. Gillian L. Fischbach, P.E.,
Grant Avenue Streetscape
 REPORT TYPE GOES HERE Grant Avenue Streetscape PREPARED FOR City of Manassas 9027 Center Street Manassas, VA 20110 PREPARED BY 8300 Boone Boulevard Suite 700 Vienna, Virginia 22182 571.389.8121 July 31,
Traffic Academy: IJS & IMS FAQ/RULES OF THUMB
 FAQ/RULES OF THUMB HCS intersection analysis criteria See LDM Figure 401-14aE Cycle lengths between 60 to 120 seconds No impractical phases, i.e., 1 second green time Yellow + All Red must be no less than
ROUNDABOUTS/TRAFFIC CIRCLES
 GENERAL 1. Description This standard identifies minimum requirements that shall be met for Roundabouts and Neighborhood Traffic Circles in the design and construction of elements for Arlington County Horizontal
3 Palmer Urban Travel Demand Model Development
 3 Palmer Urban Travel Demand Model Development This section discusses the development of the urban travel demand model. The Palmer Urban Transportation Study includes a detailed demand model for the Palmer
DEPARTMENT OF ENVIRONMENTAL SERVICES. North Harrison Street (Lee Highway to Little Falls Road) Comparative Analysis. Prepared for:
 Comparative Analysis. Prepared for:") DEPARTMENT OF ENVIRONMENTAL SERVICES North Harrison Street (Lee Highway to Little Falls Road) Comparative Analysis Prepared for: Arlington County Department of Environmental Services 2100 Clarendon Boulevard,
DEPARTMENT OF ENVIRONMENTAL SERVICES North Harrison Street (Lee Highway to Little Falls Road) Comparative Analysis Prepared for: Arlington County Department of Environmental Services 2100 Clarendon Boulevard,
Shockoe Bottom Preliminary Traffic and Parking Analysis
 Shockoe Bottom Preliminary Traffic and Parking Analysis Richmond, Virginia August 14, 2013 Prepared For City of Richmond Department of Public Works Prepared By 1001 Boulders Pkwy Suite 300, Richmond, VA
List of Attachments. Location Map... Site Plan... City of Lake Elsinore Circulation Element... City of Lake Elsinore Roadway Cross-Sections...
 List of Attachments Exhibits Location Map... Site Plan... City of Lake Elsinore Circulation Element... City of Lake Elsinore Roadway Cross-Sections... Existing Lane Geometry and Traffic Controls... Existing
Washington St. Corridor Study
 FIGURE 7.17 Bridge Alternatives - Cross Sections 86 Discarded Alternative: Short-Term Bridge Repair Short-term repairs and west bridge span replacement were considered during analysis. Short-term repairs
Defining Purpose and Need
 Advanced Design Flexibility Pilot Workshop Session 4 Jack Broz, PE, HR Green May 5-6, 2010 Defining Purpose and Need In your agency s project development process, when do design engineers typically get
9 Leeming Drive Redevelopment Ottawa, ON Transportation Brief. Prepared By: Stantec Consulting Ltd.
 9 Leeming Drive Redevelopment Ottawa, ON Transportation Brief Prepared By: Stantec Consulting Ltd. TIA GUIDELINES CHECKLIST Report Context Municipal Address Comment: Section 1.1 Location relative to major
Intersection Control Evaluation
 Intersection Control Evaluation Stadium Road at Pohl Road in Mankato, Blue Earth County, Minnesota Mankato/North Mankato Area Planning Organization October 2016 SRF No. 016 09243 Table of Contents Introduction...
Appendix B: Forecasting and Traffic Operations Analysis Framework Document
 Existing Conditions Report - Appendix Appendix B: Forecasting and Traffic Operations Analysis Framework Document This document defines the methodology and assumptions that will be used in the traffic forecasting
CITY OF OAKLAND. 27th Street Bikeway Feasibility and Design. Final Report (v3) March 23, Kimley-Horn and Associates, Inc.
 March 23, Kimley-Horn and Associates, Inc.") CITY OF OAKLAND 27th Street Bikeway Feasibility and Design Final Report (v3) March 23, 2007 PREPARED BY: Kimley-Horn and Associates, Inc. Table of Contents 1. Introduction 3 2. 27 th Street/Bay Place Corridor
CITY OF OAKLAND 27th Street Bikeway Feasibility and Design Final Report (v3) March 23, 2007 PREPARED BY: Kimley-Horn and Associates, Inc. Table of Contents 1. Introduction 3 2. 27 th Street/Bay Place Corridor
PINESTONE TRAFFIC IMPACT STUDY Travelers Rest, South Carolina
 PINESTONE TRAFFIC IMPACT STUDY Travelers Rest, South Carolina Prepared for Longbranch Development Prepared by January 13, 219 ii Table of Contents Subject Page Signature Page... i Table of Contents...
STILLWATER AVENUE CORRIDOR STUDY Old Town, Maine
 Draft Study STILLWATER AVENUE CORRIDOR STUDY Old Town, Maine SUBMITTED TO: BANGOR AREA COMPREHENSIVE TRANSPORTATION SYSTEM SUBMITTED BY: I MAY 23, 2017 DRAFT STILLWATER AVENUE STUDY FINAL REPORT Table
5.3 TRAFFIC, CIRCULATION AND PARKING
 5.3 TRAFFIC, CIRCULATION AND PARKING This section is based upon the Downtown Lancaster Specific Plan Traffic Impact Analysis (April 2, 2008) and the Downtown Lancaster Specific Plan Parking Analysis (May
400 Intersection Design
 400 Intersection Design Table of Contents 401 Intersections At-Grade... 4-1 401.1 Intersection Locations... 4-1 401.2 Intersection Traffic Control and Operational Analysis... 4-1 401.2.1 Signals.4-1 401.2.2
ENHANCED PARKWAY STUDY: PHASE 2 CONTINUOUS FLOW INTERSECTIONS. Final Report
 Preparedby: ENHANCED PARKWAY STUDY: PHASE 2 CONTINUOUS FLOW INTERSECTIONS Final Report Prepared for Maricopa County Department of Transportation Prepared by TABLE OF CONTENTS Page EXECUTIVE SUMMARY ES-1
NO BUILD TRAFFIC OPERATIONS
 3. 23 NO BUILD TRAFFIC OPERATIONS This section addresses the operations of the transportation system and details how it would be expected to function under year 23 No Build conditions with the projected
REDEVELOPMENT TRAFFIC IMPACT STUDY
 REDEVELOPMENT TRAFFIC IMPACT STUDY For Wendy s Parker, Colorado January 215 Prepared for: Sterling Design Associates, LLC 29 W. Littleton Boulevard #3 Littleton, Colorado 812 Prepared by: 1233 Airport
TRANSPORTATION IMPACT STUDY PROPOSED RIVERFRONT 47 MIXED USE DEVELOPMENT
 November 2016 TRANSPORTATION IMPACT STUDY PROPOSED RIVERFRONT 47 MIXED USE DEVELOPMENT & Aspinwall Borough, Sharpsburg Borough & O Hara Township, Allegheny County, Pennsylvania Prepared for: Riverfront
Traffic Signal Redesign 50% Design Report
 Traffic Signal Redesign 50% Design Report Joseph Davis, Jace Elkins, Jordan Weyrauch and Zach Crimmins CENE 486 Capstone J3Z Engineering March 10 th, 2016 Table of Contents 1.0 Project Description...1
TECHNICAL MEMORANDUM VDOT Central Region On Call Task Order
 Kittelson & Associates, Inc. T R A N S P O R T A T I O N E N G I N E E R I N G / P L A N N I N G 1850 Centennial Park Drive, Suite 130, 20191 P 703-885-8970 F 703-885-8971 TECHNICAL MEMORANDUM VDOT Central