Bicycle and Pedestrian Level of Service Evaluation
|
|
|
- Melvin Young
- 6 years ago
- Views:
Transcription


1 Bicycle and Pedestrian Level of Service Evaluation June 214
2 Florida Department of Transportation Bicycle and Pedestrian Evaluation Prepared by Sprinkle Consulting Cambridge Systematics For the Florida Department of Transportation Transportation Statistics Office June 214 1
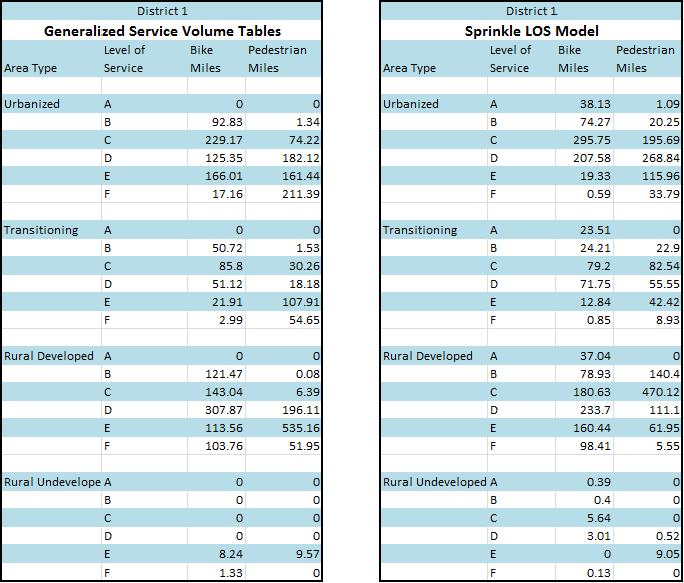
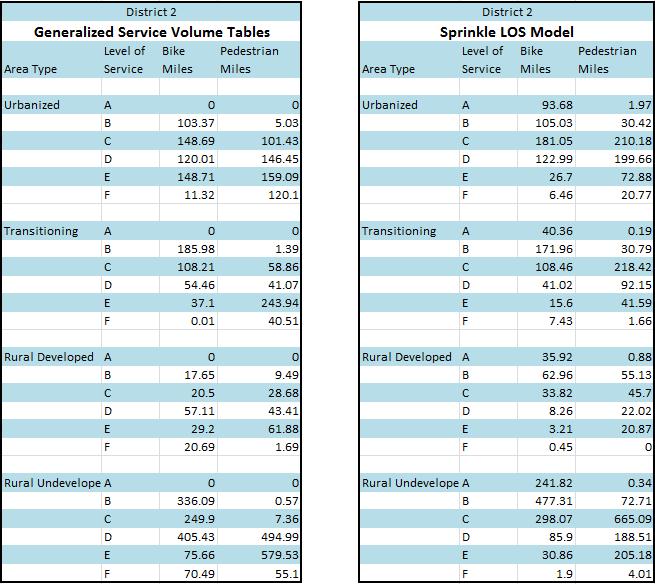
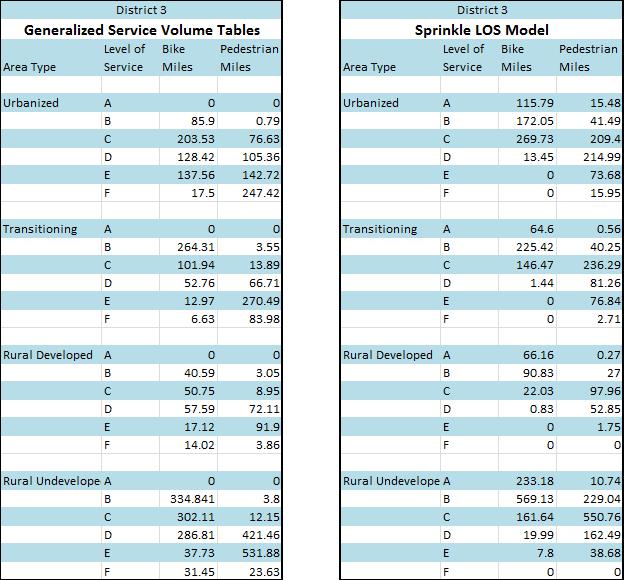
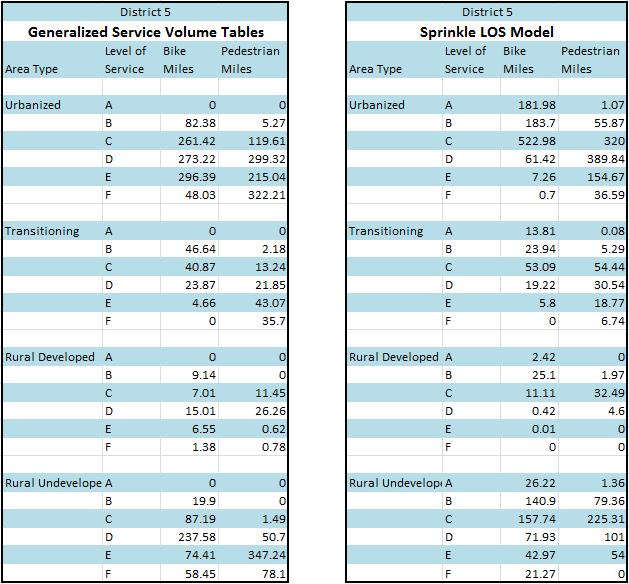
3 Overview Sprinkle Consulting was tasked with calculating both bicycle and pedestrian level of service using the FDOT Q/LOS Handbook Generalized Tables and the Model. Bicycle and pedestrian level of service measures a roadway s fit for purpose and is scored with a letter grade of A, B, C, D, E, or F. The highest obtainable score of A indicates the optimal perception by bicyclists or pedestrians, while an F indicates the facility is perceived as poor by users. The following report compares the results of both methods and suggests modifications to be made to the Generalized Service Volume Tables to improve accuracy. Process Using Microsoft Excel workbooks in addition to data obtained via Cambridge Systematics, level of service scores were calculated separately using the FDOT Generalized Service Volume Tables and then again using the Sprinkle (LOS) Model. This process was repeated for each of the 67 counties in Florida. In order for a finer, more detailed comparison, results were assessed based on a classification of area type: urban, rural, or transitioning. Initial Trends Note that a score of A is not obtainable using the Generalized Service Volume Table (s) method. Also note that not all development patterns are present in all counties. For instance, Hardee County contains no urban roadways and Leon County contains no rural roadways. A few general trends can be seen in comparing the Generalized Service Volume Tables to Sprinkle LOS model results for pedestrian level of service. As evidenced by Figures 1, 2, and 3, Generalized Tables resulted in worse scores whereas the Sprinkle LOS Model resulted in better scores. (It should be noted that an LOS A is not possible using the generalized tables.) Different trends can be seen from comparisons of bicycle level of service (these will be illustrated using Hardee and Leon Counties). For urban areas the Sprinkle LOS model appears to result in better LOS scores than the Generalized Service Volume Tables. However, for outside urban areas Generalized Service Volume Tables resulted in a significant skew towards better scores whereas the Sprinkle LOS Model resulted in a skew towards worse scores. (Figures 4, 5, and 6). 2
4 Figure 1: Comparison of Pedestrian LOS from Generalized Tables and Sprinkle LOS Model for Urban Roads Figure 2: Comparison of Pedestrian LOS from Generalized Tables and Sprinkle LOS Model for Transitioning Roads 3
5 Figure 3: Comparison of Pedestrian LOS from Generalized Tables and Sprinkle LOS Model for Rural Roads Figure 4: Comparison of Bike LOS from Generalized Tables and Sprinkle LOS Model for Urban Roads 4
6 Figure 5: Comparison of Bike LOS from Generalized Tables and Sprinkle LOS Model for Transitioning Roads Figure 6: Comparison of Bike LOS from Generalized Tables and Sprinkle LOS Model for Rural Roads 5
7 Modifications to the Process Based on comparisons between the Generalized Tables and the Sprinkle LOS Model, some conclusions were drawn regarding how scores are calculated. For bicycle level of service, it was found that heavy vehicle (truck) percent was a major influence on level of service scores. For this reason, the LOS was run again in several counties changing 24 hour truck percentages as reported on the FDOT Traffic Information DVD to one third their original values. The hypothesis is that this better represents the peak hour truck volumes. A reanalysis of the roadways resulted in shifting the calculated LOS scores (as opposed to the Generalized Tables). The bike and pedestrian LOS calculated scores now both result in more favorable results than the Generalized Service Volume Tables. See Figures 7 through 1. Figure 7: Bicycle Scores Based on Truck Volumes for Rural Roads in Hardee County 6
8 Figure 8: Bicycle Scores Based on Truck Volumes for Transitioning Roads in Hardee County Figure 9: Bicycle Scores Based on Truck Volumes for Transitioning Roads in Leon County 7
9 Figure 1: Bicycle Scores Based on Truck Volumes for Urban Roads in Leon County We believe the reason the calculated LOS scores result in better overall scores than the Generalized Service Volume Table is due to the assumed percent facilities on a roadway. The percent facilities is calculated based on the presence of a paved shoulder for bikes, or sidewalk or shared use path for pedestrians, for any given road segment. The Generalized Service Volume Tables provides three options for percent coverage. Any coverage less than 5% is rounded down to %, any greater or equal to 5% but less than 85% to is rounded down to 5%, and any greater than or equal to 85% to 1%. This means that all values except those at 85% or higher were rounded down. By rounding percent coverage down, Generalized Service Volume Tables largely yielded poorer scores for level of service than the Sprinkle LOS Model, which used actual weighted averages representing true percent coverage values and no rounding. Figures 12 and 13 illustrate the amount of over and under estimation of the percent facilities for bikes and pedestrians in Leon County urbanized areas. The most important factor influencing the letter grades produced by the s is the presence of a facility e.g. a bike lane or sidewalk. When a sidewalk is present it is nearly impossible to go below LOS D and where there are no sidewalks it is as equally unlikely to produce a LOS letter grade better than E. The Sprinkle LOS Model reports more favorable results than the s when there are no sidewalks present. This may result from the presence of shoulders which favorably impact the pedestrian LOS. Florida DOT has determined the presence of a sidewalk is the most important factor to an individual who is walking. Furthermore the s inability to produce an LOS A letter grade skews LOS results downward. These two explanations help account for the differences between the s pedestrian LOS scores and the Sprinkle LOS mode. 8
10 Figure 11: Percent Pedestrian Facilities Comparison for Urban Roads in Leon County Figure 12: Percent Bicycle Facilities Comparison for Urban Roads in Leon County A review of Figures 11 and 12 reveals that the percent coverage of bicycle and pedestrian facilities is under represented by the s more often than it is over represented. Thus it makes sense that the calculated LOS scores would be more favorable than those obtained from the s. Similar Figures for Miami Dade County urbanized areas are shown below: 9
11 Figure 15: Percent Pedestrian Facilities Comparison for Urban Roads in Miami Dade County Figure 15: Percent Bicycle Facilities Comparison for Urban Roads in Miami Dade County Recommendations for the Generalized Service Volume Tables The Generalized Service Volume Tables provide LOS results that are quite conservative when compared to the more in depth LOS analysis. This may be acceptable for users purposes. Any changes to the s resulting in significant improvements to LOS scores accuaracy would likely involve adding more options to the Generalized Service Volume Tables. To significantly improve the fidelity of s, one would likely implement five categories of facility coverage; this would make the Generalize Service Volume Tables more complicated to use and may not be desirable. There are a significant number or roadway segments that have no facilities or 1 percent facilities. There are also a significant number that have 5% facilities (for pedestrians this often results from having facilities on only one side 1
12 of the roadway). Thus three natural categories for percent coverage would be essentially none, essentially 1 percent, and about 5 percent. The last two categories would be less than 5% and more than 5%. The defaults for these last two categories should be set based upon actual averages (or a sampling of averages) from these categories. Recommendations for Statewide Model Analysis The truck percentage reduction from the transportation statistics database to 1/3 that value seemed to provide more intuitive results. This adjustment only impacts the bicycle level of service results. 11


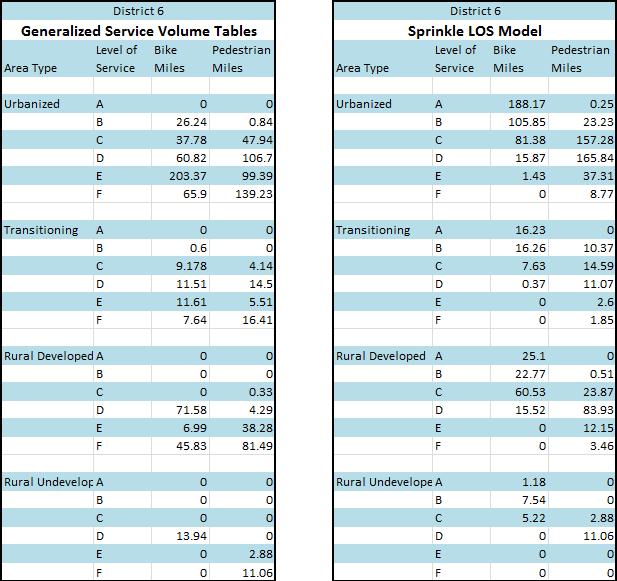
13 Statewide and District Summaries of Results Summaries of the level of service results are provided below. Some districts do not have an area type, e.g. rural undeveloped, in those instances a zero value for mileage is displayed. The slight variation in mileage between the two tables is due to rounding. Statewide Statewide 12
14 Bike LOS 35 3 District 1 Urbanized District 1 Transitioning
15 Bike LOS District 1 Rural Developed District 1 Rural Undeveloped
16 Pedestrian LOS 3 District 1 Urbanized District 1 Transitioning
17 Pedestrian LOS 6 5 District 1 Rural Developed District 1 Rural Undeveloped
18 17
19 Bike LOS 2 18 District 2 Urbanized District 2 Transitioning
20 Bike LOS District 2 Rural Developed District 2 Rural Undeveloped
21 Pedestrian LOS 25 2 District 2 Urbanized District 2 Transitioning
22 Pedestrian LOS 7 6 District 2 Rural Developed District 2 Rural Undeveloped
23 22
24 Bike LOS 3 District 3 Urbanized District 3 Transitioning
25 Bike LOS District 3 Rural Developed District 3 Rural Undeveloped
26 Pedestrian LOS District 3 Urbanized District 3 Transitioning
27 Pedestrian LOS 12 1 District 3 Rural Developed District 3 Rural Undeveloped
28 27
29 Bike LOS 45 4 District 4 Urbanized District 4 Transitioning
30 Bike LOS 7 6 District 4 Rural Developed District 4 Rural Undeveloped
31 Pedestrian LOS 35 3 District 4 Urbanized District 4 Transitioning
32 Pedestrian LOS 12 1 District 4 Rural Developed District 4 Rural Undeveloped
33 32
34 Bike LOS 6 5 District 5 Urbanized District 5 Transitioning
35 Bike LOS District 5 Rural Developed District 5 Rural Undeveloped
36 Pedestrian LOS 45 4 District 5 Urbanized District 5 Transitioning
37 Pedestrian LOS 35 District 5 Rural Developed District 5 Rural Undeveloped
38 37
39 Bike LOS District 6 Urbanized District 6 Transitioning
40 Bike LOS District 6 Rural Developed District 6 Rural Undeveloped
41 Pedestrian LOS District 6 Urbanized District 6 Transitioning
42 Pedestrian LOS 9 8 District 6 Rural Developed District 6 Rural Undeveloped
43 42
44 Bike LOS 3 District 7 Urbanized District 7 Transitioning
45 Bike LOS District 7 Rural Developed District 7 Rural Undeveloped
46 Pedestrian LOS 3 District 7 Urbanized District 7 Transitioning
47 Pedestrian LOS 8 District 7 Rural Developed District 7 Rural Undeveloped
48 47
Addressing Deficiencies HCM Bike Level of Service Model for Arterial Roadways
 Petritsch, et al 1 1 2 3 4 5 6 7 8 9 10 11 12 13 14 15 16 17 18 19 20 21 22 23 24 25 26 27 28 Addressing Deficiencies HCM Bike Level of Service Model for Arterial Roadways Submitted July 31, 2013 Word
appendix b BLOS: Bicycle Level of Service B.1 Background B.2 Bicycle Level of Service Model Winston-Salem Urban Area
 appendix b BLOS: B.1 Background Winston-Salem Urban Area Bicycle Level of Service Level of Service (LOS) is a framework that transportation professionals use to describe existing conditions (or suitability)
Multimodal Arterial Level of Service
 Multimodal Arterial Level of Service DOUGLAS S. MCLEOD Florida Department of Transportation, USA ABSTRACT The concept of quality of service from a user perspective of a transportation facility or service
Complete Street Analysis of a Road Diet: Orange Grove Boulevard, Pasadena, CA
 Complete Street Analysis of a Road Diet: Orange Grove Boulevard, Pasadena, CA Aaron Elias, Bill Cisco Abstract As part of evaluating the feasibility of a road diet on Orange Grove Boulevard in Pasadena,
National Performance Management Measures. April 20, 2016 Webinar
 Safety Performance Measures September 26, 2016 National Performance Management Measures April 20, 2016 Webinar Highway Safety Improvement Program Performance Measures 1 2 3 4 5 Number of fatalities Rate
DEPARTMENT OF ENVIRONMENTAL SERVICES. North Harrison Street (Lee Highway to Little Falls Road) Comparative Analysis. Prepared for:
 Comparative Analysis. Prepared for:") DEPARTMENT OF ENVIRONMENTAL SERVICES North Harrison Street (Lee Highway to Little Falls Road) Comparative Analysis Prepared for: Arlington County Department of Environmental Services 2100 Clarendon Boulevard,
DEPARTMENT OF ENVIRONMENTAL SERVICES North Harrison Street (Lee Highway to Little Falls Road) Comparative Analysis Prepared for: Arlington County Department of Environmental Services 2100 Clarendon Boulevard,
2014 STATE OF THE SYSTEM REPORT
 2014 STATE OF THE SYSTEM REPORT March 2016 This page intentionally left blank System Performance Monitoring This page intentionally left blank System Performance Monitoring State of the System Performance
Safety Emphasis Areas & Safety Project Development Florida Department of Transportation District Seven Tampa Bay
 Safety Emphasis Areas & Safety Project Development Florida Department of Transportation District Seven Tampa Bay Stephen L. Benson, AICP, CNU-A FDOT District Seven Safety Office Presentation Overview Safety
International Journal of Mechanical Engineering and Technology (IJMET), ISSN 0976 INTERNATIONAL JOURNAL OF MECHANICAL ENGINEERING
, ISSN 0976 INTERNATIONAL JOURNAL OF MECHANICAL ENGINEERING") INTERNATIONAL JOURNAL OF MECHANICAL ENGINEERING AND TECHNOLOGY (IJMET) ISSN 0976 6340 (Print) ISSN 0976 6359 (Online) Volume 4, Issue 5, September - October (2013), pp. 244-249 IAEME: www.iaeme.com/ijmet.asp
INTERNATIONAL JOURNAL OF MECHANICAL ENGINEERING AND TECHNOLOGY (IJMET) ISSN 0976 6340 (Print) ISSN 0976 6359 (Online) Volume 4, Issue 5, September - October (2013), pp. 244-249 IAEME: www.iaeme.com/ijmet.asp
Bicyclist Signing Guidelines
 Bicyclist Signing Guidelines April, 2009 1 Introduction This paper describes the Montana Department of Transportation s (MDT) current practices related to bicyclist safety and signing issues and presents
Moving Towards Complete Streets MMLOS Applications
 Moving Towards Complete Streets MMLOS Applications Transportation Education Series May 18 th, 2012 It s not just for cars! Presentation Overview The Complete Streets Movement What is Multi-Modal Level
Planning Guidance in the 2012 AASHTO Bike Guide
 Planning Guidance in the 2012 AASHTO Bike Guide Presentation by: RJ Eldridge Peter Lagerwey August 22, 2012 WEBINAR 2: PLANNING GUIDANCE IN THE 2012 AASHTO BIKE GUIDE Today s Webinar Significant Updates
STANLEY STREET December 19, 2017
 STANLEY STREET December 19, 2017 Welcome Mike Wiza, Mayor Scott Beduhn, Director of Public Works Agenda 1. Introduction 2. Existing Roadway Conditions 3. Current Alternative Improvements 4. Summary of
Title Option One. Operations and Safety of Separated Bicycle Facilities at Single Lane Roundabouts
 Title Option One Operations and Safety of Separated Bicycle Facilities at Single Lane Roundabouts David Stanek, PE Institute of Transportation Engineers Western District Annual Meeting San Diego, CA June
BICYCLE LEVEL OF SERVICE for URBAN STREETS. Prepared by Ben Matters and Mike Cechvala. 4/16/14 Page 1
 BICYCLE LEVEL OF SERVICE for URBAN STREETS Prepared by Ben Matters and Mike Cechvala 4/16/14 Page 1 Introduction The methodology used for the Bicycle (BLOS) analysis is from the Highway Capacity Manual
6.0 PEDESTRIAN AND BICYCLE FACILITIES 6.1 INTRODUCTION 6.2 BICYCLE DEMAND AND SUITABILITY Bicycle Demand
 6.0 PEDESTRIAN AND BICYCLE FACILITIES 6.1 INTRODUCTION Bicycle and pedestrian travel along and in the vicinity of the corridor is part of the vision of Somerset and Hunterdon counties and the integrated
A Traffic Operations Method for Assessing Automobile and Bicycle Shared Roadways
 A Traffic Operations Method for Assessing Automobile and Bicycle Shared Roadways A Thesis Proposal By James A. Robertson Submitted to the Office of Graduate Studies Texas A&M University in partial fulfillment
TECHNICAL MEMORANDUM 3: EXISTING CONDITIONS ANALYSIS FOR THE VILLAGE GREEN MULTIMODAL TRANSPORTATION DISTRICT
 TECHNICAL MEMORANDUM 3: EXISTING CONDITIONS ANALYSIS FOR THE VILLAGE GREEN MULTIMODAL TRANSPORTATION DISTRICT Prepared for: TREASURE COAST REGIONAL PLANNING COUNCIL Prepared by: RENAISSANCE PLANNING GROUP
TABLE OF CONTENTS. Executive Summary
 Executive Summary Background... ES-1 Pedestrian Network... ES-2 Bikeway Network... ES-2 Collision History... ES-2 Public Input... ES-4 Conclusions and Recommendations... ES-4 1. Introduction and Setting
APPENDIX A: Complete Streets Checklist DRAFT NOVEMBER 2016
 APPENDIX A: Complete Streets Checklist DRAFT NOVEMBER 2016 Complete Streets Checklist MetroPlan Orlando s Complete Streets Checklist is an internal planning tool for staff to further implementation of
Clackamas County Comprehensive Plan
 ROADWAYS The County s road system permits the movement of goods and people between communities and regions, using any of a variety of modes of travel. Roads provide access to virtually all property. They
Lincoln Avenue Road Diet Trial
 Lincoln Avenue Road Diet Trial Data Collection Report June 1, 2015 Department of Transportation Table of Contents I. Introduction...... 3 II. Data Collection Methodology & Results...... 5 A. Traffic Volume
FINAL DESIGN TRAFFIC TECHNICAL MEMORANDUM
 FINAL DESIGN TRAFFIC TECHNICAL MEMORANDUM July 2014 FINAL (SR 43) Project Development and Environment Study From State Road 60 (Adamo Drive) to I-4 (SR 400) Hillsborough County, Florida Work Program Item
RETREAT AGENDA ITEM MIDTOWN AREA TRANSPORTATION PLAN UPDATE
 October 17, 2017 RETREAT AGENDA ITEM MIDTOWN AREA TRANSPORTATION PLAN UPDATE STATEMENT OF ISSUE An update on the Midtown Area Transportation Plan will be provided including a discussion of preliminary
Truck Climbing Lane Traffic Justification Report
 ROUTE 7 (HARRY BYRD HIGHWAY) WESTBOUND FROM WEST MARKET STREET TO ROUTE 9 (CHARLES TOWN PIKE) Truck Climbing Lane Traffic Justification Report Project No. 6007-053-133, P 101 Ι UPC No. 58599 Prepared by:
Multimodal Analysis in the 2010 Highway Capacity Manual
 Multimodal Analysis in the 2010 Highway Capacity Manual It s not just cars anymore! Jamie Parks, AICP HCAT Conference May 9-10, 2011 Multimodal LOS in the 2010 HCM History and background Overview of methods
MEMORANDUM. Charlotte Fleetwood, Transportation Planner
 MEMORANDUM Date: Updated August 22, 2017 To: Organization: Charlotte Fleetwood, Transportation Planner Boston Transportation Department From: Jason DeGray, P.E., PTOE, Regional Director of Engineering
Chapter 5 DATA COLLECTION FOR TRANSPORTATION SAFETY STUDIES
 Chapter 5 DATA COLLECTION FOR TRANSPORTATION SAFETY STUDIES 5.1 PURPOSE (1) The purpose of the Traffic Safety Studies chapter is to provide guidance on the data collection requirements for conducting a
Multi-modal performance measures: Are we getting an A? Madeline Brozen Herbie Huff UCLA Institute of Transportation Studies Webinar 9/16/14
 Multi-modal performance measures: Are we getting an A? Madeline Brozen Herbie Huff UCLA Institute of Transportation Studies Webinar 9/16/14 Agenda Why measure the street for walking and bicycling? Measures
LTAP Fact Sheet. Abuzz word among transportation professionals. Kansas. Smarter, Safer Roadways: Road Diets for Rural Communities.
 Spring 2009 Kansas LTAP Fact Sheet A Service of Kansas University Transportation Center for Road, Street & Bridge Agencies Smarter, Safer Roadways: Road Diets for Rural Communities By Mehrdad Givechi,
MUTCD Part 6G: Type of Temporary Traffic Control Zone Activities
 MUTCD Part 6G: Type of Temporary Traffic Control Zone Activities 6G.01 Typical Applications Each temporary traffic control (TTC) zone is different. Many variables, such as location of work, highway type,
Modern Roundabouts. BY : Mark T. Johnson, P.E. An Informational Presentation Prepared For:
 Modern Roundabouts An Informational Presentation Prepared For: Transportation Research Board Roundabout Conference Vail, CO May 2005 Roundabout implementation in constrained urban environment - achieving
DELDOT s Concrete Islands
 DELDOT s Concrete Islands New concrete islands, contrary to Delaware s Bicycle Policy, are being designed as obstacles to a cyclist s right of way through intersections. They add a further danger where
Roundabout Feasibility Memorandum
 Roundabout Feasibility Memorandum To From Gwen Pipkin Bill Howell Date June 18, 2013 Subject Roundabout Feasibility Study SR 29 PD&E Study From Oil Well Road to SR 82 Collier County, FL FPID 417540-1-22-01
Bicycle - Motor Vehicle Collisions on Controlled Access Highways in Arizona
 Bicycle - Motor Vehicle Collisions on Controlled Access Highways in Arizona Analysis from January 1, 1991 to June 30, 2002 Richard C. Moeur, PE Traffic Design Manager, Northern Region Michelle N. Bina
5.0 Roadway System Plan
 Southwest Boise Transportation Study Page 16 5.0 Roadway System Plan The Roadway System Plan outlines roadway improvements in the Initial Study Area. It forecasts future deficiencies on the arterial system,
Access Management in the Vicinity of Intersections
 Access Management in the Vicinity of Intersections FHWA-SA-10-002 Technical Summary Photo: Ralph Bentley (used with permission) 0 Access Management is: The design, implementation and management of entry
Malabar Road (SR 514) PD&E. Town of Malabar Briefing (July 17, 2017)
 PD&E. Town of Malabar Briefing (July 17, 2017)") Malabar Road (SR 514) PD&E Town of Malabar Briefing (July 17, 2017) 1 Agenda Project limits and briefing focus PD&E process and project status Public and agency project comments Review Recommended Alternatives:
Malabar Road (SR 514) PD&E Town of Malabar Briefing (July 17, 2017) 1 Agenda Project limits and briefing focus PD&E process and project status Public and agency project comments Review Recommended Alternatives:
Appendix T 1: Additional Supporting Data
 Appendix T 1: Additional Supporting Data Project Delivery Delays with the implementation of the 2000 TIP became apparent early in the decade. In response to direction among policy officials, ARC began
METHODOLOGY. Signalized Intersection Average Control Delay (sec/veh)
") Chapter 5 Traffic Analysis 5.1 SUMMARY US /West 6 th Street assumes a unique role in the Lawrence Douglas County transportation system. This principal arterial street currently conveys commuter traffic
Chapter 5 Traffic Analysis 5.1 SUMMARY US /West 6 th Street assumes a unique role in the Lawrence Douglas County transportation system. This principal arterial street currently conveys commuter traffic
ADOT Statewide Bicycle and Pedestrian Program Summary of Phase IV Activities APPENDIX B PEDESTRIAN DEMAND INDEX
 ADOT Statewide Bicycle and Pedestrian Program Summary of Activities APPENDIX B PEDESTRIAN DEMAND INDEX May 24, 2009 Pedestrian Demand Index for State Highway Facilities Revised: May 29, 2007 Introduction
Road Diets FDOT Process
 Florida Department of TRANSPORTATION Road Diets FDOT Process Humberto Castillero, PE, PTOE Roadway Design Office Purpose of Guide Develop a statewide lane elimination review process Balance state & local
Mobility and Congestion
 Technical Memorandum Mobility and Congestion Prepared for: Prepared by: September 25, 2013 1 Table of Contents 1. Introduction... 1 2. Congestion Forecasting Process... 1 2.1 Mobility and Congestion Terms...
Bike Lanes at Intersections with Right Turn-Only Lanes
 Bike Lanes at Intersections with Right Turn-Only Lanes Position Statement January 2, 2011 Summary: Throughout the state, DelDOT has identified a system of bicycle routes, as illustrated in Figure 1 on
CITY OF COCOA BEACH 2025 COMPREHENSIVE PLAN. Section VIII Mobility Element Goals, Objectives, and Policies
 CITY OF COCOA BEACH 2025 COMPREHENSIVE PLAN Section VIII Mobility Element Goals, Objectives, and Policies Adopted August 6, 2015 by Ordinance No. 1591 VIII MOBILITY ELEMENT Table of Contents Page Number
Bicycle and Pedestrian Level of Service Measures
 Bicycle and Pedestrian Level of Service Measures June 5, 2003 Midwest Transportation Planning Conference Ed Barsotti League of Illinois Bicyclists 630-978-0583 ed@bikelib.org www.bikelib.org Outline Why
COLLISION STATISTICS May Engineering Services Box 5008, th Avenue Red Deer, AB T4N 3T4
 COLLISION STATISTICS 2016 2016 Red Deer Annual Motor Vehicle Collision Report May 2017 Engineering Services Box 5008, 4914 48th Avenue Red Deer, AB T4N 3T4 engineering@reddeer.ca RCMP GRC Red Deer City
2017 Northwest Arkansas Trail Usage Monitoring Report
 2017 Northwest Arkansas Trail Usage Monitoring Report Summary Findings: The study showed that average daily weekday bicycle volumes per study site increased by about 32% between 2015 and 2017, from 142
Safety Assessment of Installing Traffic Signals at High-Speed Expressway Intersections
 Safety Assessment of Installing Traffic Signals at High-Speed Expressway Intersections Todd Knox Center for Transportation Research and Education Iowa State University 2901 South Loop Drive, Suite 3100
STRAVA - DATA ACCESS AND USES. March 9, 2016 Shaun Davis + Dewayne Carver Florida Dept. of Transportation
 STRAVA - DATA ACCESS AND USES March 9, 2016 Shaun Davis + Dewayne Carver Florida Dept. of Transportation AGENDA Training Accessing the Data Data Characteristics Potential Uses Question and Answer WHAT
Travel and Rider Characteristics for Metrobus
 Travel and Rider Characteristics for Metrobus 040829040.15 Travel and Rider Characteristics for Metrobus: 2012-2015 Overview The Miami Dade County Metropolitan Planning Organization (MPO) conducted a series
Waterford Lakes Small Area Study
 Waterford Lakes Small Area Study Existing Traffic Conditions PREPARED FOR: ORANGE COUNTY PUBLIC WORKS DEPARTMENT TRAFFIC ENGINEERING DIVISION ORLANDO, FLORIDA PREPARED WITH: INWOOD CONSULTING ENGINEERS
APPENDIX C. Systems Performance Report C-1
 APPENDIX C Systems Performance Report C-1 System Performance Report & Requirements According to the FAST Act, a long range transportation plan needs to include a system performance report and subsequent
Cycling and risk. Cycle facilities and risk management
 Cycling and risk Cycle facilities and risk management Failure to recognize possibilities is the most dangerous and common mistake one can make. Mae Jemison, astronaut 6/11/2010 York Regional Council Cycling
CHAPTER 9: SAFETY 9.1 TRAFFIC SAFETY INTERSECTION COLLISIONS
 CHAPTER 9: SAFETY 9.1 TRAFFIC SAFETY Creating a transportation network that is not only efficient but also safe is a key objective of the General Plan and the WBCMP. To assess the current safety conditions
South Carolina Department of Transportation. Engineering Directive
 South Carolina Department of Transportation Engineering Directive Directive Number: ED-22 Effective: December 16, 2009 Subject: References: Purpose: This Directive Applies to: Considerations for Bicycle
An Assessment of Potential Greenhouse Gas Emissions Reductions from Proposed On Street Bikeways
 An Assessment of Potential Greenhouse Gas Emissions Reductions from Proposed On Street Bikeways Through the Sustainable Bethlehem Initiative, the Town of Bethlehem has identified both the improvement of
J Street and Folsom Boulevard Lane Conversion Project (T ) Before and After Traffic Evaluation
 Before and After Traffic Evaluation") J Street and Folsom Boulevard Lane Conversion Project (T15125400) Before and After Traffic Evaluation Prepared by Transportation Division June 2014 Executive Summary On February 12, 2013, the City of Sacramento
J Street and Folsom Boulevard Lane Conversion Project (T15125400) Before and After Traffic Evaluation Prepared by Transportation Division June 2014 Executive Summary On February 12, 2013, the City of Sacramento
Pine Hills Road Pedestrian/Bicycle Safety Study Board of County Commissioners Work Session
 Pine Hills Road Pedestrian/Bicycle Safety Study Board of County Commissioners Work Session February 20, 2018 Meeting Agenda Study Overview Existing Conditions Access Management Potential Gateway Features
CITY OF CAMBRIDGE 2015 BICYCLE PLAN TOWARDS A BIKABLE FUTURE
 CITY OF CAMBRIDGE 2015 BICYCLE PLAN TOWARDS A BIKABLE FUTURE WHICH FUTURE? CAMBRIDGE MUNICIPAL POLICIES 1992: Vehicle Trip Reduction Ordinance 1998: Parking & Transportation Demand Ordinance 2002: Climate
The Traffic Monitoring Guide: Counting Bicyclists and Pedestrians. APBP 2017 June 28: 11:15am-12:45pm
 The Traffic Monitoring Guide: Counting Bicyclists and Pedestrians APBP 2017 June 28: 11:15am-12:45pm 2 Presentation Organization Why count bicyclists and pedestrians? Why report count data? What resources
Front and Myrtle Improvement Project
 Front and Myrtle Improvement Project MAKING BOISE THE MOST LIVABLE CITY IN THE COUNTRY DOWNTOWN: Our unique and vibrant urban neighborhood GUIDING PRINCIPLES: Innovation Celebration Transportation Downtown
Bicycle and Pedestrian Connectivity Study. Old Colony Planning Council
 Bicycle and Pedestrian Connectivity Study Old Colony Planning Council Outline Why consider bike/peds in road designs? Why are measures needed? Connecting Land Use with Transportation Evaluation Tools:
APPENDIX L: COST ESTIMATING TOOLS
 APPENDIX L: COST ESTIMATING TOOLS Rural Arterial From LRE MOT * Mobilization * Subtotal Scope Contingency (25%) Total PE Design (15%) CEI (15%) Total Project ** New (2-Lane Roadway) with 5' Paved Shoulders
LOUISIANA COMPLETE STREETS POLICY. Ellen W. Soll, AICP Principal Soll Planning
 LOUISIANA COMPLETE STREETS POLICY Ellen W. Soll, AICP Principal Soll Planning How is the LOUISIANA COMPLETE STREETS POLICY a success story in context sensitivity? Louisiana s Policy Related state legislation
Pinellas County Metropolitan Planning Organization (MPO) 2014 Crash Data Report
 2014 Crash Data Report") Pinellas County Metropolitan Planning Organization (MPO) 2014 Crash Data Report MPO Board July 8, 2015 2 Crash Data Collection Motorcycle drove between stopped cars, ran a red light and collided with a
Pinellas County Metropolitan Planning Organization (MPO) 2014 Crash Data Report MPO Board July 8, 2015 2 Crash Data Collection Motorcycle drove between stopped cars, ran a red light and collided with a
El Paso County 2040 Major Transportation Corridors Plan
 El Paso County 2040 Major Transportation Corridors Plan Connect-our-County Online Transportation User Survey Preliminary Results June 24, 2010 Years of Residence 2. How many years have you LIVED HERE?
Route 7 Corridor Study
 Route 7 Corridor Study Executive Summary Study Area The following report analyzes a segment of the Virginia State Route 7 corridor. The corridor study area, spanning over 5 miles in length, is a multi
US 41 COMPLETE STREETS CORRIDOR PLANNING STUDY from University Parkway to Whitfield Avenue
 41 US 41 COMPLETE STREETS CORRIDOR PLANNING STUDY from University Parkway to Whitfield Avenue EXECUTIVE SUMMARY DRAFT FEBRUARY 2019 Project Overview The US 41 Complete Streets Corridor Planning Study,
Young Researchers Seminar 2011
 Young Researchers Seminar 2011 Young Researchers Seminar 2011 DTU, Denmark, 8 10 June, 2011 DTU, Denmark, June 8-10, 2011 Methods for assessing the pedestrian level of service: International experience
U.S. Bicycling Participation Study
 U.S. Bicycling Participation Study Report of findings from the 2016 survey Conducted by Corona Insights Commissioned by PeopleForBikes Released July 2017 Table of Contents Background and Objectives 3 Research
FLORIDA STRATEGIC HIGHWAY SAFETY PLAN
 FLORIDA STRATEGIC HIGHWAY SAFETY PLAN 1 FLORIDA STRATEGIC HIGHWAY SAFETY PLAN Presenter: Joe Santos State Safety Engineer FDOT State Safety Office 2 Presentation 3/28/2017 3 FLORIDA STRATEGIC HIGHWAY SAFETY
TRAFFIC CRASHES involving BICYCLISTS
 The Office of the Chief of Police in Berlin BERLIN TRAFFIC CRASHES involving BICYCLISTS A special research project concerning bicycle crashes in West Berlin in the years 1981 through 1985 Police Analyst
Geometric Categories as Intersection Safety Evaluation Tools
 Geometric Categories as Intersection Safety Evaluation Tools John R. Campbell Ayres Associates N19 W24075 Riverwood Drive, Suite 300 Waukesha, WI 53188 campbellj@ayresassociates.com Keith K. Knapp Engineering
Appendix E: Bike Crash Analysis ( )
") Appendix E: Bike Crash Analysis (2009-2012) Davis Bicycle Crashes Analysis 2009-2012 December 2013 Ride Walk Davis Active Transportation Program City of Davis December 2013 Prepared by: Jimmy Fong Active
Appendix E: Bike Crash Analysis (2009-2012) Davis Bicycle Crashes Analysis 2009-2012 December 2013 Ride Walk Davis Active Transportation Program City of Davis December 2013 Prepared by: Jimmy Fong Active
State Road (S.R.) 61 (U.S. 319) FPID s and
 61 (U.S. 319) FPID s and") State Road (S.R.) 61 (U.S. 319) FPID s 220496 2 22 01 and 219747 2 22 01 Crawfordville Highway Conceptual Design and Environmental Reevaluation May 6, 2014 END PROJECT PROJECT LOCATION/LIMITS Project Limits:
State Road (S.R.) 61 (U.S. 319) FPID s 220496 2 22 01 and 219747 2 22 01 Crawfordville Highway Conceptual Design and Environmental Reevaluation May 6, 2014 END PROJECT PROJECT LOCATION/LIMITS Project Limits:
Parks Highway: MP Lucus Road to Big Lake Road
 2 Purpose and Need 2.1 Corridor History The Parks Highway is a 324-mile long Rural Interstate Highway that extends from its intersection with the Glenn Highway north to Fairbanks, Alaska. The Parks Highway
Community Advisory Committee
 Community Advisory Committee Meeting #1 November 19, 2014 Presentation Team Matt Fulda, Greater Bridgeport Regional Council Chris Granatini, P.E., Tighe & Bond Craig Yannes, P.E., PE PTOE, Tighe & Bond
Pedestrian Safety at Roundabouts. Presentation to the Howard-Suamico School Board November 26, 2007
 Pedestrian Safety at Roundabouts Presentation to the Howard-Suamico School Board November 26, 2007 Roundabouts that have replaced stop signs and traffic signals have reduced the number and severity of
Road Diets: Reconfiguring Streets for Multi-Modal Travel
 Road Diets: Reconfiguring Streets for Multi-Modal Travel Tom Grant, P.E., PTOE What is a Road Diet? Reconfiguration of travel lanes to benefit all roadway users (i.e., Complete Street) Reclaiming the space
Walkable Communities and Adolescent Weight
 Walkable Communities and Adolescent Weight Sandy Slater, PhD Assistant Professor, University of Illinois at Chicago, School of Public Health Research Scientist, UIC Institute for Health Research and Policy
PEDESTRIAN/BICYCLIST CRASH ANALYSIS 2015
 PEDESTRIAN/BICYCLIST CRASH ANALYSIS 2015 Central Arkansas Regional Transportation Study Table of Contents Executive Summary... 3 CARTS Pedestrian/Bicycle Crash Analysis... 3 Report Format... 3 Results...
MassDOT s Transportation Choice and Healthy Transportation Policy Initiatives
 MassDOT s Transportation Choice and Healthy Transportation Policy Initiatives Jackie DeWolfe, Director of Sustainable Mobility, MassDOT Michelle Danila, Complete Streets Engineer, MassDOT ACEC April 2018
Off-road Trails. Guidance
 Off-road Trails Off-road trails are shared use paths located on an independent alignment that provide two-way travel for people walking, bicycling, and other non-motorized users. Trails specifically along
Driverless Vehicles Potential Influence on Bicyclist Facility Preferences
 Driverless Vehicles Potential Influence on Bicyclist Facility Preferences MICHAEL BLAU, MCRP, LCI O T E C O C T O B E R 2 6, 2 0 1 6 S E S S I O N # 8 2 - E V A L U AT I N G T H E P E R F O R M A N C E
ORDINANCE NO
 1 Sponsored by: Councilmembers Stan Flemming, Connie Ladenburg, and Rick Talbert 2 Requested by: Executive/Public Works and Utilities - Transportation Services 3 4 5 6 7 10 11 ORDINANCE NO. 2014-445 12
Community Bicycle Planning
 Community Bicycle Planning City of Mentor s Bicycle Facility Plan Allen E. Pennington, P.E. Civil Engineer - Traffic Office of the Mentor City Engineer Why has Mentor participated in bicycle planning?
Dr. M.L. King, Jr. Street North Complete Streets Resurfacing Opportunities HOUSING, LAND USE, AND TRANSPORTATION COMMITTEE MARCH 22, 2018
 Dr. M.L. King, Jr. Street North Complete Streets Resurfacing Opportunities HOUSING, LAND USE, AND TRANSPORTATION COMMITTEE MARCH 22, 2018 What s Happening The City plans to mill and resurface Dr. M.L.
Information on display. Inside this handout. Triangle Area revisions. Project need displays. Preferred alternative on aerial maps
 Public information meeting #4 4 to 7 p.m., September 30, 2009 Hales Corners Welcome Thank you for attending this public information meeting for the WIS 100 Corridor Study. Your interest and comments are
SRTS Programs That Increase Walking and Bicycling to School
 Getting Results: SRTS Programs That Increase Walking and Bicycling to School SafeRoutes National Center for Safe Routes to School Communities initiate Safe Routes to School (SRTS) programs for a variety
Evaluation of M-99 (Broad Street) Road Diet and Intersection Operational Investigation
 Road Diet and Intersection Operational Investigation") Evaluation of M-99 (Broad Street) Road Diet and Intersection Operational Investigation City of Hillsdale, Hillsdale County, Michigan June 16, 2016 Final Report Prepared for City of Hillsdale 97 North Broad
Evaluation of M-99 (Broad Street) Road Diet and Intersection Operational Investigation City of Hillsdale, Hillsdale County, Michigan June 16, 2016 Final Report Prepared for City of Hillsdale 97 North Broad
CORE MPO Non-motorized Transportation Plan. Appendix D
 Appendix D Technical Report on Methodology of Bikeway Conditions Analysis: Bicycle Level of Service Model, version 2, for Segments This page is intentionally left blank. Methodology of Bikeway Conditions
Bicycling and Walking
 Bicycling and Walking Performance Measures Traditional, the new Highway Capacity Manual, and beyond A New Game. Balanced transportation. Multi-modal Complete Streets Livability Sustainable Whatever Economically-Efficient
Cycle Track Design Best Practices Cycle Track Sections
 Design Best Practices Sections It is along street segments where the separation and protection methods of cycle tracks offer more comfort than conventional bicycle lanes, and are more attractive to a wide
Highway 111 Corridor Study
 Highway 111 Corridor Study June, 2009 LINCOLN CO. HWY 111 CORRIDOR STUDY Draft Study Tea, South Dakota Prepared for City of Tea Sioux Falls Metropolitan Planning Organization Prepared by HDR Engineering,
Dear Mr. Tweed: Sincerely, Min Zhou, P.E. Vice President
 December 17, 2012 Mr. Steve Tweed City of Long Beach, Department of Public Works Traffic & Transportation Bureau, 10 th Floor City Hall 333 West Ocean Boulevard Long Beach, CA 90802 Subject: Broadway and
FDOT Bicycle/Pedestrian Focused Initiative & Complete Streets
 Florida Department of TRANSPORTATION FDOT Bicycle/Pedestrian Focused Initiative & Complete Streets Billy L. Hattaway, PE District One Secretary Secretary s Pedestrian Safety Initiative Dangerous by Design
City of Gainesville Transportation/Roadway Needs PROJECT SUMMARY
 A1 Roadway Resurfacing $23,846,000 TYPE: Preservation of existing system Roadway resurfacing A2 Signal Replacement $6,000,000 TYPE: Preservation of existing system Replace traffic signals. B1 W 6th St
Do As I Say Not As I Do: Observed Compliance vs. Stated Understanding of Pedestrian Crossing Laws in Florida
 Do As I Say Not As I Do: Observed Compliance vs. Stated Understanding of Pedestrian Crossing Laws in Florida Achilleas Kourtellis, Ph.D. July 9, 2015 CUTR Webcast Series Center for Urban Transportation
Goodlettsville Bicycle and Pedestrian Plan Executive Summary
 Goodlettsville Bicycle and Pedestrian Plan July 2010 In Cooperation with the Nashville Area Metropolitan Planning Executive Organization Summary Introduction Progressive and forward thinking communities