Outcomes of the Cycling City and Towns programme: monitoring project report
|
|
|
- Verity French
- 6 years ago
- Views:
Transcription
1 Outcomes of the Cycling City and Towns programme: monitoring project report Individual town results: Leighton Linslade April 2017 Report authors: Andy Cope, Research and Monitoring Unit, Sustrans Angela Kennedy, Research and Monitoring Unit, Sustrans Fiona Crawford, Research and Monitoring Unit, Sustrans Nick Cavill, Cavill Associates John Parkin, University of the West of England, Bristol Lynn Sloman, Transport for Quality of Life PART A: INTRODUCTION PART B: DATA COLLECTION AND ANALYTICAL METHODOLOGIES PART C: OVERALL FINDINGS PART D: INDIVIDUAL TOWN RESULTS PART D1: BLACKPOOL PART D2: CAMBRIDGE PART D3: CHESTER PART D4: COLCHESTER PART D5: GREATER BRISTOL PART D6: LEIGHTON LINSLADE PART D7: SHREWSBURY PART D8: SOUTHEND PART D9: SOUTHPORT PART D10: STOKE-ON-TRENT PART D11: WOKING PART D12: YORK
2 About Sustrans Sustrans is the charity making it easier for people to walk and cycle. We are engineers and educators, experts and advocates. We connect people and places, create liveable neighbourhoods, transform the school run and deliver a happier, healthier commute. Sustrans works in partnership, bringing people together to find the right solutions. We make the case for walking and cycling by using robust evidence and showing what can be done. We are grounded in communities and believe that grassroots support combined with political leadership drives real change, fast. Join us on our journey. Head Office Sustrans 2 Cathedral Square College Green Bristol BS1 5DD Sustrans April 2017 Registered Charity No (England and Wales) SC (Scotland) VAT Registration No Acknowledgments The authors are grateful for the extensive assistance of officers in the twelve Cycling City and Towns in supplying monitoring data for this research. We are also grateful for additional support provided by Lisa Muller, Katie Pullen, George Macklon, Katie Thomson, James O Hare, Richard Sanders, Alison Janes, Hannah Delaney, Laurence Bonner, Peter Stephenson, Charlotte Draycott and Jo Watson. Disclaimer Although this report was commissioned by the Department for Transport (DfT), the recommendations are those of the authors and do not necessarily represent the views of the DfT. While every effort has been made to ensure the information in this document is accurate, DfT does not guarantee the accuracy, completeness or usefulness of that information; and it cannot accept liability for any loss or damages of any kind resulting from reliance on the information or guidance this document contains. Mapping (c) Crown Copyright licence no Also OpenStreetMap (c) (and) contributors licence CC-BY-SA ( Outcomes of the Cycling City and Towns programme: monitoring project report
3 Table of contents 1 Introduction Description of the Cycling City and Towns programme in Leighton Linslade Expenditure Summary of available monitoring data Summary of headline findings Analysis of automatic cycle counter data Town-wide analysis Analysis of data from individual sites Relationship between programme activity and automatic count data Analysis of manual count data Analysis of school related data PLASC Local authority hands up survey Analysis of counts of parked bicycles Analysis of casualty data Analysis of physical activity data Maps Outcomes of the Cycling City and Towns programme: monitoring project report
4 1 Introduction 1.1 Description of the Cycling City and Towns programme in Leighton Linslade GoCycle Leighton Linslade, the Cycling City and Towns programme delivered in Leighton Linslade, aimed to double levels of cycling using a combination of infrastructure and smarter measures 1. A total of 4.7km of cycle paths and 1.2km of on-road facilities were developed alongside smaller scale improvements to the cycle network including crossing improvements and the installation of dropped kerbs. Directional signs were added across the 100km of cycle route network in the area. Between 2008 and March 2011, cycle parking provision tripled, with the addition of over 360 spaces across Leighton Buzzard, Linslade and Heath and Reach. Workplace engagement focused on three locations which have a high concentration of businesses. A variety of packages were promoted including Dr Bike sessions, cycle information and training, funding towards the costs of cycle parking and personalised route planning. Cycling was promoted in the area through the provision of 10 new hybrid bicycles which were made available for hire to workplace champions as well as the refurbishment and loan of another 65 children and adult bicycles, five folding bicycles, and two electric bicycles. GoCycle Leighton Linslade targeted schools through Bikebaility training and increased cycle parking provision. The programme engaged with young people through clubs and the cycle play facilities across the town. The station was also improved through the addition of new cycle parking spaces and a cycle hub. 1.2 Expenditure While this report is primarily concerned with the monitoring evidence around outcomes of the Cycling City and Towns programme, it is useful to place these in context through summarising the programme inputs in terms of capital and revenue expenditure. Details of expenditure in Leighton Linslade during the Cycling City and Towns programme are summarised in Table 1-1. Table 1-1 Funds invested in cycling in Leighton Linslade revenue capital Total Cycling England/DfT/DH investment 787, ,203 1,669,090 Matched funding 0 996, ,938 Total 787,887 1,878,141 2,666,028 1 Leighton-Linslade Cycling Town (2011) End of Funding Programme Report, Leighton-Linslade Cycling Town. Available at [Accessed 31 May 2012] 4 Outcomes of the Cycling City and Towns programme: monitoring project report
5 1.3 Summary of available monitoring data The following data sources are available: Data from 13 automatic cycle counters 12 hour manual counts performed quarterly since mid 2009 at nine locations Pupil Level Annual School Census (PLASC) travel data and local authority hands up survey of mode of travel to school counts of parked bicycles performed at the railway station cycling casualty data Active People Survey (APS) data. 1.4 Summary of headline findings Mixed evidence of growth in cycling over time from a relatively low initial baseline A mixed picture of change in levels of cycling in Leighton over time is evident in the available data. The most complete data sets, time series data from automatic cycle counters located predominantly on traffic-free cycle routes, indicate a growth in cycling, although there is considerable within-town variation. Manual counts, however, suggest a decrease in volumes of cyclists over time, also with substantial variation between sites. Notwithstanding the limitations of the data source, levels of cycling to secondary schools appear to have increased over time. Very low levels of cycling to primary school make it difficult to draw firm conclusions around changes in levels of cycling over the course of the programme. Automatic cycle counter data indicate an increase in volumes of cycles counted of +35% against a 2007 baseline. Based on data from the 13 automatic cycle counters, this estimated growth corresponds to an increase from 525 trips per day counted in 2007 to 709 in 2011 An increase was observed at five of the automatic cycle count sites, a decrease at six and no change at two locations Analysis of manual count data collected in comparable periods at nine count locations indicates a significant decrease in counts overall. Significant changes were observed at six sites an increase at two and a decrease at four locations Across all schools, the percentage of children cycling to school as measured by PLASC was 1.8% in 2010/11 compared to 0.9% in 2006/07 Local authority hands up surveys performed in schools suggest higher levels of cycling of 3.9% in 2010 Counts of parked bicycles at the railway station increased during 2009 Compared to pre-programme data, the number of cycling casualties was not significantly different during the Cycling City and Town programme Active People Survey data indicate a decrease in Leighton Linslade in the proportion of respondents cycling once or more per month and a significant decrease in the proportion cycling 12 or more times per month between 2007/8 and 2010/11 5 Outcomes of the Cycling City and Towns programme: monitoring project report
6 2 Analysis of automatic cycle counter data Data from a total of 13 automatic cycle counters have been analysed. In the following sections information regarding the location, volumes of cyclists recorded and change in volumes of cyclists recorded over time are presented for each location. The majority of cycle counters are located to the south of the town centre. One of the 13 count sites was installed in 2005, two in 2006, four in 2008 and the remaining six, in In order to be consistent across the Cycling City and Towns, data from 2007 onwards are included in the analysis. Two distinct sets of analysis have been undertaken using cycle counter data in Leighton Linslade. In the first, all available data were analysed using a regression model to allow an estimate of change in cycle trips recorded over the programme period against a baseline. In the second, data from individual sites were analysed in order to determine the average volumes of cyclists recorded, distribution of cycle trips over the course of the day and (where sufficient data are available) the annual percentage change in the count of cyclists. 2.1 Town-wide analysis Table 2-1 presents the percentage change in cycle counts relative to a 2007 baseline including data to the end of September Table 2-1 Change in cycle count in Leighton Linslade at the end of the Cycling City and Towns period relative to a 2007 baseline (baseline = 2007) Change against 2007 baseline % 114%* 126%* 116%* 135%* * indicates a significant difference (p<0.05) compared to the 2007 baseline The counter data indicate a decline in the volume of cyclists recorded in 2010 compared with the previous year, potentially as a result of periods of poor weather nationally in late 2009 and early and late An additional element was added into the regression model to explore this. Table 2-2 presents the findings of this analysis. Table 2-2 Change in cycle count in Leighton Linslade at the end of the Cycling City and Towns period relative to a 2007 baseline including an adjustment for snow (baseline = 100%) Change against 2007 baseline 100% 114%* * indicates a significant difference (p<0.05) compared to the 2007 baseline 129%* 126%* 134%* When adjusting the model for poor weather conditions, there is an increased percentage change between 2008 and 2009, and a smaller decrease in the volumes of cyclists recorded between 2009 and Outcomes of the Cycling City and Towns programme: monitoring project report
7 2.2 Analysis of data from individual sites Data from individual cycle counters were analysed in order to determine the rate of change in volumes of counts recorded at each location over time. The results of this analysis are summarised in Table 2-3 and alongside more detailed information for each counter in Table 2-4. There are sufficient data available to robustly estimate the annual percentage change in the number of cyclists counted over time for seven counters. For the remaining counters, based on the more limited data available, change over time is positive for one count site and negative for three sites. There was no change at the remaining two sites. Table 2-3 Summary of findings of detailed analysis of data from individual count sites Number of counters for which data are available 13 Number of counters for which sufficient data are available to 7 quantify change over time 2 Number of counters with quantifiable increase 4 Number of counters with no change 0 Number of counters with quantifiable decrease 3 Although a similar number of counters have experienced an increase and a decrease, the difference in magnitude of the counts at these sites have resulted in an overall change between 2007 and 2011 of +35%. Chart 2-1 includes the median daily count in 2010 and annual percentage change for each counter where an annual change can be calculated. The counters are presented in the order in which they were installed, with the first three having been installed over a year before the subsequent counters. Chart 2-1 shows that the highest annual increase was observed in the counter which has the highest average daily count. 2 None of the changes at individual counters are statistically significant. 7 Outcomes of the Cycling City and Towns programme: monitoring project report
8 Chart 2-1 Median daily count in 2010 and annual percentage change by counter Median daily count in counter 2 counter 7 counter 10 counter 1 counter 9 counter 5 counter Annual percentage change Median daily count in 2010 Annual percentage change In the following table counters are ordered by their location relative to the centre of Leighton Linslade, starting with those located closest to the town centre. Map references refer to the accompanying map (section 8). 3 Counter numbers refer to Table Outcomes of the Cycling City and Towns programme: monitoring project report
9 Table 2-4 Description of automatic cycle counters in Leighton Linslade Map reference Location Time period Annual change a Average daily count in Leighton Buzzard Weekday: -2% Overall: 31 riverside Sat/Sun: -10% Weekdays: 33 Weekend days: Canal Walk b Weekday: +6% Overall: 46 Sat/Sun: +4% Weekdays: 41 Weekend days: Canal towpath south No change Overall: 27 Weekdays: 24 Weekend days: Canal towpath north Negative Overall: 57 Weekdays: 52 Weekend days: Grovebury Road Weekday: -2% Sat/Sun: -5% 6. Lovent Drive Open Space Overall: 93 Weekdays: 108 Weekend days: Positive Overall: 64 Weekdays: 68 Weekend days: Black Bridge b Weekday: +6% Sat/Sun: +8% Overall: 115 Weekdays: 127 Weekend days: 79 Comments Located on a traffic-free shared use canal side path in the centre of Leighton Buzzard. A school site is nearby. Located on a traffic-free shared use canal side path in the centre of Leighton Buzzard. A school site is nearby. Located on a traffic-free shared use towpath adjacent to the Grand Union Canal, approximately half a mile from the centre of Leighton Buzzard. Located on National Route 6 of the National Cycle Network, a traffic-free shared use towpath adjacent to the Grand Union Canal approximately half a mile of the centre of Leighton Buzzard. Located on a traffic-free shared use path adjacent to urban green space and industrial estates, half a mile south-east of the centre of Leighton Buzzard. Weekday data show commuting peaks. Located on National Route 6 of the National Cycle Network, a traffic-free shared use path adjacent to Clipstone Brook, half a mile from the centre of Leighton Buzzard. A school site is nearby. Weekday data shows school commuting peaks. Located on a traffic-free shared use railway path half a mile from the centre of Leighton Buzzard and close to industrial estates. Weekday data show commuting and school commuting peaks. 9 Outcomes of the Cycling City and Towns programme: monitoring project report
10 8. Stanbridge Road Weekday:-11% Sat/Sun:-21% 9. The Globe Weekday:+6% Sat/Sun:+1% 10. Appenine Way b Weekday:+7% Sat/Sun:+10% 11. Cycle path running parallel to Clipstone Brook 12. Nelson Road to Vandyke Road narrow gauge railway crossing 13. Danes Way Marley Fields Overall: 58 Weekdays: 65 Weekend days: 47 Overall: 39 Weekdays: 35 Weekend days: 61 Overall: 30 Weekdays: 31 Weekend days: No change Overall: 24 Weekdays: 23 Weekend days: Negative Overall: 26 Weekdays: 32 Weekend days: Negative Overall: 37 Weekdays: 38 Weekend days: 32 Located on a short traffic-free shared use path adjacent to housing, linking a main road with a smaller residential road, approximately three quarters of a mile east of the centre of Leighton Buzzard. A school site is nearby. Weekday data show commuting peaks. Located on a traffic-free shared use canal side path by the Grand Union Canal approximately one mile north of the centre of Leighton Buzzard. A sewage works is nearby. Located on a traffic-free shared use path near Clipstone Brook, through a residential area approximately one mile east of the centre of Leighton Buzzard. Located on a traffic-free shared use path close to Clipstone Brook, through a residential area approximately one mile east of the centre of Leighton Buzzard. This counter is slightly to the North of the Appenine Way counter (10) and monitors access to two local schools. Located on a short traffic-free segregated path crossing a railway line approximately one mile northeast of the centre of Leighton Buzzard. The path links school and college sites to a residential area. Located on a new traffic-free, shared use path between Danes Way and Marley Fields, approximately one mile to the south-west of Leighton, close to residential areas and a playing field. a for counters with less than 36 months of data only a tentative indication as to the direction of the change can be reported, either positive, negative or no change b data are also available for earlier periods, but to ensure consistency these have not been included in the analysis 10 Outcomes of the Cycling City and Towns programme: monitoring project report
11 2.3 Relationship between programme activity and automatic count data Black Bridge The Black Bridge automatic cycle counter recorded the highest average daily count in 2010 of all counters in Leighton Linslade. This counter is located close to the Grovebury Road area - one of the three geographic areas in which the GoCycle team focused workplace engagement. Based on the location, this counter may record cyclists using the route to access Leighton Buzzard railway station. During the programme period additional secure cycle parking spaces were installed at the railway station and promotional activities were held. The counter is located on a route accessing The Cedars School. Go Cycle has worked extensively with this school through the Go Ride programme and the installation of improved cycle parking facilities. Data are available from 2007 onwards for the counter located at Black Bridge. The median counts per hour at this location in 2007 and 2011 are compared in Chart 2-2. Comparison of the 2007 and 2011 count data indicates a growth in cycling between these two years, particularly at commuting times. The growth in cycling during late afternoons may be attributable to cycle trips to school and the early morning and early evening growth is likely to be due to trips to and from work. The estimated change in counts recorded at this site is +6% per year based on weekday data. Chart 2-2 Median count per hour recorded at Black Bridge on weekdays in 2007 and :00 02:00 04:00 06:00 08:00 Median count of cyclists per hour 10:00 12:00 14:00 16:00 18:00 20:00 22: Outcomes of the Cycling City and Towns programme: monitoring project report
 were implemented during the Cycling City and Towns programme.")
12 2.3.2 Movement on the canal towpath The Grand Union Canal passes north south through Leighton Linslade. Improvements to two routes linking to the towpath (in Tiddenfoot Waterside Park and through Linslade Wood) were implemented during the Cycling City and Towns programme. Four counters monitor movement on the canal towpath (ordered from north to south on Map 2-1 below): The Globe (map reference 9) Canal towpath north (map reference 4) Canal Walk (map reference 2) Canal towpath south (map reference 3) Map 2-1 Canal towpath map (site numbers refer to Table 2-4) The route is popular for leisure journeys, and each of the count sites on the canal towpath records greater volumes of cyclists on weekend days than during the week. Based on 2010 data, the average daily count on weekend days was between 1.3 and 1.9 times greater than on weekdays. The median daily count of cyclists recorded at each location between September 2009 and July 2011 are presented in Chart 2-3. The time series show distinct seasonality, typical of routes with strong leisure use, with a greater number of cyclists recorded at the two locations closer to the town centre. 12 Outcomes of the Cycling City and Towns programme: monitoring project report
13 Chart 2-3 Median daily count of cyclists recorded at four locations on the Grand Union Canal towpath Sep-09 Nov-09 Jan-10 Mar-10 May-10 Jul-10 Median daily count of cyclists Sep-10 Nov-10 Jan-11 Mar-11 May-11 Jul-11 The Globe - weekend day Canal Walk - weekend day Canal towpath north - weekend day Canal towpath south - weekend day The median count per hour recorded at locations on the towpath (Chart 2-4) is generally low, however upon comparing weekday and weekend day data, the pattern of counts across the course of the day is similar. The graphs generally include a plateau throughout the day and do not include the distinct commuting peaks in weekday data observed at other locations. This suggests that the towpath is predominantly used as a leisure route and this is supported by the greater volumes of cyclists which are recorded on weekend days. 13 Outcomes of the Cycling City and Towns programme: monitoring project report
14 Chart 2-4 Median hourly count of cyclist recorded on all days in 2010 at count sites on the Grand Union Canal Towpath :00 02:00 04:00 06:00 08:00 10:00 Median count of cyclists per hour 12:00 14:00 16:00 18:00 20:00 22:00 Canal Walk Canal towpath north The Globe Canal towpath south 3 Analysis of manual count data Although Bedfordshire Highways have undertaken ad hoc manual counts as part of the major traffic management works in the town centre, regular manual counts were not undertaken in the area prior to Since quarter 3 of 2009, 12 hour manual counts have been undertaken on a quarterly basis at nine locations indicated on the accompanying map (section 8). Four sites form a screenline based on the railway line: Stoke Road (map reference A) Soulbury Road (map reference B) Southcourt Avenue (map reference C) Wing Road (map reference D) The remaining five sites form a cordon around the town centre: Leighton Road (map reference E) Bassett Road (map reference F) North Street (map reference G) Beaudesert (map reference H) Billington Road (map reference I) Chart 3-1 presents the total counts in each quarter across the nine count sites for which we have data since quarter The seasonality within the data is evident from the higher counts in quarters 2 and 3. An 8% decrease in counts is observed when comparing quarters 3 and and quarter with the corresponding quarters a year later. 14 Outcomes of the Cycling City and Towns programme: monitoring project report
15 Chart 3-1 Total counts for nine manual count sites in Leighton Linslade Total count Q Q Q Q Q Q Q Chart 3-2 compares data from quarters 3 and 4 in 2009 and quarter with data from quarters 3 and 4 in 2010 and quarter Outcomes of the Cycling City and Towns programme: monitoring project report
16 Chart 3-2 Comparison of manual count data collected in Leighton Linslade in quarters 3 and 4 in 2009 and quarter 1 in 2010 with data collected in quarters 3 and 4 in 2010 and quarter 1 in Stoke Road Soulbury Road Southcourt Wing Road Leighton Road Bassett Road North Street Total count Beaudesert Billington Railway line screenline Q Q Q Q Q Q Significant decreases in counts are observed for both the railway screenline and the town centre cordon when data from the relevant count locations are combined. Six of the nine individual sites experienced a significant change in counts between the periods analysed. Four were significant decreases and two were significant increases. One of the sites with a significant increase in counts was Leighton Road, which provides access from the west of the town and has the highest level of counts across the sites. 4 Analysis of school related data Go Cycle worked with all 19 schools in the project area. All schools were engaged in Bikeability, with training delivered to over 2,000 pupils over the course of the programme. Cycle parking was expanded at all schools, increasing the number of cycle parking spaces from 250 to 624. All middle and upper schools, and one special school were engaged with Go Ride, with 3,137 children and young people engaged through the cycle coaching programme. Five new Bike Clubs had been established in Leighton Linslade by March 2011, and a Community Cycling Club was established at Oakbank School. Cycle play facilities were developed at six locations across the town. 4 Marked as significant where p< Outcomes of the Cycling City and Towns programme: monitoring project report
17 4.1 PLASC The percentage of pupils surveyed in Leighton Linslade stating cycling to be their usual mode of travel to school are summarised in Table 4-1. Levels of cycling to school were lower across the entire project period for primary schools than for secondary schools. Considering all schools, the proportion of pupils cycling to school has increased from 0.9% to 1.8%, but this is entirely due to an increase in cycling to secondary schools. Table 4-1 Percentage of pupils surveyed reporting cycling to be their usual mode of travel to school (PLASC) 5 Academic year 2006/ / / / /11 Primary 0.0% 0.0% 0.2% 0.0% 0.0% Secondary 1.5% 1.8% 2.2% 2.5% 2.9%* All schools 0.9% 1.1% 1.4% 1.5% 1.8%* a based on data from 12 primary schools and six secondary schools * indicates a significant change in cycling in the 2010/2011 academic year compared to the 2006/07 academic year (p<0.05) 4.2 Local authority hands up survey Data collected in hands up surveys of mode of travel to school are available for each year since 2002 (with the exception of 2007). The surveys are conducted in the third week of September each year and the percentage of children reporting to travel to school during the Cycling City and Towns programme are presented in Table 4-2. This survey asks pupils How did you travel to school today? and thus differs from the PLASC data presented above where pupils usual mode of travel to school is recorded. The number of schools completing the hands up survey is not the same each year - 6,191 pupils responded in 2006 compared to 2,799 in Suppression of the underlying data for disclosure purposes means that counts of one or two cyclists to a school are not included and therefore although 0% cycling to school has been reported, this does not mean that no pupils cycled to school 17 Outcomes of the Cycling City and Towns programme: monitoring project report
18 Table 4-2 Percentage of pupils surveyed reporting cycling to be their mode of travel to school on the day of the survey (local authority hands up survey data) % cycling to school Lower schools Middle schools Upper schools All schools Number of pupils Year of survey % 0.8% 0.8% 0.7% 0.7% - 4.0% 6.5% 5.4% 0.3% 0.4% 0.6% 1.1% 0.6% - 2.3% 14.9% 6.5% 1.8% 3.9% 5.7% 6.2% 2.7% - 0.0% 4.1% 1.0% 0.7% 1.4% 1.5% 2.3% 1.4% a - 2.8% 7.5% 3.9%* 3,896 3,393 4,019 5,062 6,191-2,799 3,394 3,121 a note that 2006 percentage cycling is calculated omitting data from one school where 87 of 89 pupils were reported to cycle to school * indicates a significant change in cycling in the 2010 compared to the 2006 (p<0.05) 5 Analysis of counts of parked bicycles Counts of parked bicycles have been undertaken at the railway station in Leighton Linslade since June The distribution of the counts across this period has not been consistent, nor has the day of the week or time of day of counts. In performing an analysis of change in volumes of bicycles parked at the station over time, data have been aggregated together to represent quarters. Chart 5-1 shows the seasonally adjusted count values of quarterly daytime counts of bicycles at Leighton Station. 18 Outcomes of the Cycling City and Towns programme: monitoring project report
19 Chart 5-1 Seasonally adjusted series of quarterly daytime counts of bicycles at Leighton Station Q Count Q Q Q Q Q Q Q Q Q Counts of parked bicycles at Leighton railway station display a degree of seasonality, and have increased over time, predominantly during Comparing counts from quarter to quarter with those performed from quarter to quarter indicate an increase of 23%. 6 Analysis of casualty data Cycle user casualty data were obtained for Leighton Linslade from Bedfordshire Highways. The average number of killed, seriously injured and slightly injured in each year prior to the Cycling City and Towns programme ( ) 6 are compared to those occurring during the programme in Table 6-1. The difference between the time periods compared is not significant. Table 6-1 Annual average number of cyclists killed or injured in Leighton Linslade before ( ) and during ( ) the Cycling City and Towns programme Annual average number of casualties Killed Seriously injured Slightly injured Total Pre-programme During programme * indicates a significant change between cycling casualties recorded before and during the Cycling City and Town programme 6 Accident data prior to 2006 were not available from the contractor managing the data; 2006 was the earliest data available 19 Outcomes of the Cycling City and Towns programme: monitoring project report
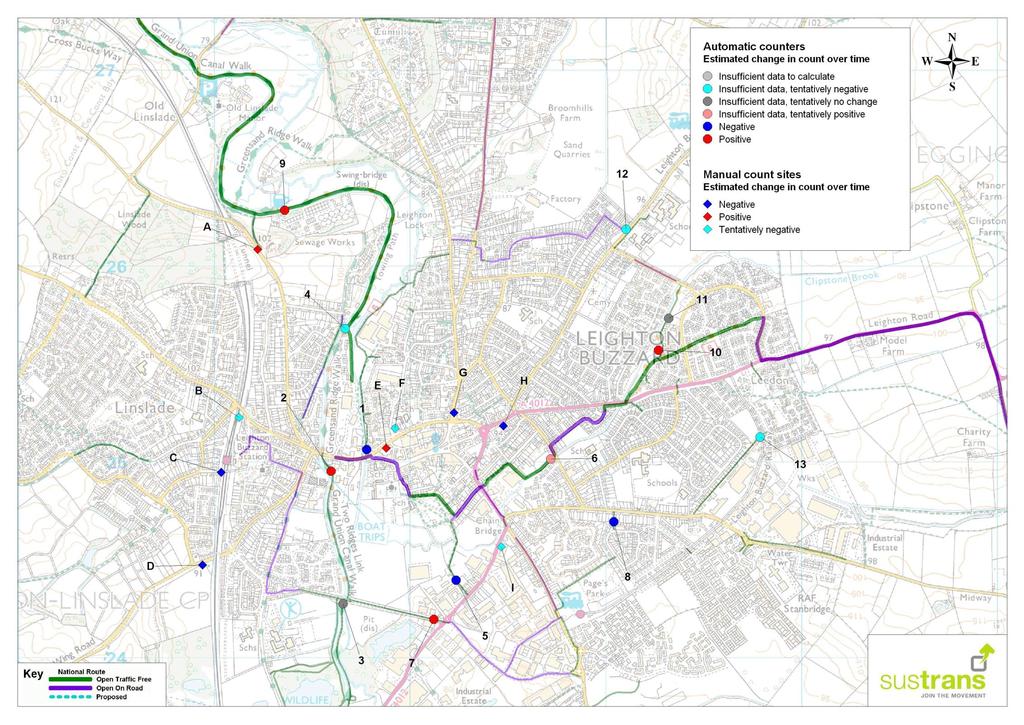
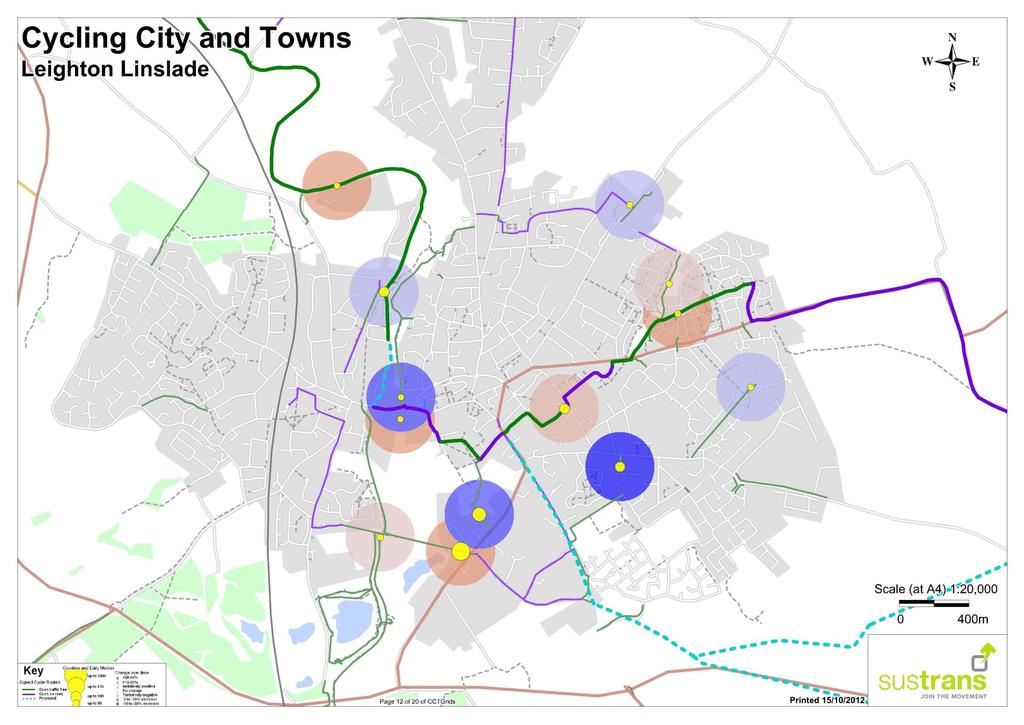
20 7 Analysis of physical activity data Data are available from Sport England s Active People Survey (APS) for two years prior to the Cycling City and Towns programme and all three years of the project. The APS data provide information on the proportion of people cycling for at least 30 minutes once or more per month and the proportion cycling for at least 30 minutes, 12 or more times per month. It should be noted that the data refer only to cycling in bouts of 30 minutes or more and therefore this measure may under represent overall cycling in the towns as shorter journeys are not included. The proportion cycling once or more per month fell by 3.2%-points (from 13.7% to 10.5%) in Leighton Linslade between 2007/8 and 2010/11 7. The proportion cycling 12 or more times per month fell by 1.8%-points (from 2.5% to 0.7%). This is a significant decrease (p<0.05). 8 Maps The following pages contain maps indicating the location of manual count and automatic cycle counter locations, and the estimated change in volumes of cycles recorded at these sites. 7 Not a significant decrease (p=0.12) 20 Outcomes of the Cycling City and Towns programme: monitoring project report
21
22
23
Outcomes of the Cycling City and Towns programme: monitoring project report
 Outcomes of the Cycling City and Towns programme: monitoring project report Individual town results: Colchester April 2017 Report authors: Andy Cope, Research and Monitoring Unit, Sustrans Angela Kennedy,
Outcomes of the Cycling City and Towns programme: monitoring project report
 Outcomes of the Cycling City and Towns programme: monitoring project report Individual town results: Blackpool April 217 Report authors: Andy Cope, Research and Monitoring Unit, Sustrans Angela Kennedy,
Outcomes of the Cycling City and Towns programme: monitoring project report
 Outcomes of the Cycling City and Towns programme: monitoring project report Individual town results: Shrewsbury April 2017 Report authors: Andy Cope, Research and Monitoring Unit, Sustrans Angela Kennedy,
Outcomes of the Cycling Demonstration Towns programme: monitoring project report
 Outcomes of the Cycling Demonstration Towns programme: monitoring project report Individual town results: Lancaster with Morecambe April 217 Report authors: Andy Cope, Research and Monitoring Unit, Sustrans
Outcomes of the Cycling Demonstration Towns programme: monitoring project report
 Outcomes of the Cycling Demonstration Towns programme: monitoring project report Individual town results: Darlington April 217 Report authors: Andy Cope, Research and Monitoring Unit, Sustrans Angela Kennedy,
Outcomes of the Cycling Demonstration Towns programme: monitoring project report
 Outcomes of the Cycling Demonstration Towns programme: monitoring project report Individual town results: Brighton and Hove April 217 Report authors: Andy Cope, Research and Monitoring Unit, Sustrans Angela
Outcomes of the Cycling City and Towns programme: monitoring project report
 Outcomes of the Cycling City and Towns programme: monitoring project report Individual town results: York April 27 Report authors: Andy Cope, Research and Monitoring Unit, Sustrans Angela Kennedy, Research
Summary of Outcomes of the Cycling Demonstration Towns and Cycling City and Towns Programmes
 Summary of Outcomes of the Cycling Demonstration Towns and Cycling City and Towns Programmes Lynn Sloman, Andy Cope, Angela Kennedy, Fiona Crawford, Nick Cavill and John Parkin Report to the Department
ANNEX1 The investment required to achieve the Government s ambition to double cycling activity by 2025
 ANNEX1 The investment required to achieve the Government s ambition to double cycling activity by 2025 May 2016 About Sustrans Sustrans makes smarter travel choices possible, desirable and inevitable.
European Levels of Investment in Cycling: Results and Insights
 Shifting Gears European Levels of Investment in Cycling: Results and Insights UWE, 2 July 2013 Dr Kiron Chatterjee Kiron.Chatterjee@uwe.ac.uk Associate Professor in Travel Behaviour Centre for Transport
The Infrastructure Impact Tool
 1 The Infrastructure Impact Tool Guidance notes Delivered by Sustrans in partnership with: 2 About Sustrans Sustrans is the charity making it easier for people to walk and cycle. We are engineers and educators,
The One Path Initiative
 About Sustrans 2017, Livia Lazar/Sustrans, all rights reserved Sustrans is the charity making it easier for people to walk and cycle. We are engineers and educators, experts and advocates. We connect people
Route User Intercept Survey Report
 Route User Intercept Survey Report Hills Road, Cambridge Fieldwork: October 2016 Report published: December 2016 1 About Sustrans Sustrans makes smarter travel choices possible, desirable and inevitable.
Cycling and Walking Investment Strategy & Local Cycling and Walking Infrastructure Plans
 Cycling and Walking Investment Strategy & Local Cycling and Walking Infrastructure Plans 1 Investing in cycling and walking contributes to a broad range of cross-cutting policy objectives Cycling and walking
Scottish Parent Teacher Council School Travel Survey Introduction
 Introduction Scottish Parent Teacher Council (SPTC) is a membership organisation and charity whose purpose is to make parental involvement in children's education as good as it possibly can be. Sustrans
Transport Poverty in Scotland. August 2016
 Transport Poverty in Scotland August 2016 About Sustrans Sustrans is the charity making it easier for people to walk and cycle. We connect people and places, create liveable neighbourhoods, transform the
Using a Mixed-Method Approach to Evaluate the Behavioural Effects of the Cycling City and Towns Programme
 1 of 25 Using a Mixed-Method Approach to Evaluate the Behavioural Effects of the Cycling City and Towns Programme Kiron Chatterjee (Centre for Transport & Society, UWE) with acknowledgements to research
Transport Poverty in Scotland. August 2016
 Transport Poverty in Scotland August 2016 About Sustrans Sustrans makes smarter travel choices possible, desirable and inevitable. We re a leading UK charity enabling people to travel by foot, bike or
Cycle journeys on the Anderston-Argyle Street footbridge: a descriptive analysis. Karen McPherson. Glasgow Centre for Population Health
 Cycle journeys on the Anderston-Argyle Street footbridge: a descriptive analysis Karen McPherson Glasgow Centre for Population Health March 2017 Key points: There were 116,334 cycle journeys made using
Active Travel Strategy Dumfries and Galloway
 Active Travel Strategy Dumfries and Galloway Our Active Travel Strategy The agreed Interventions for Dumfries and Galloway Council s Local Transport Strategy includes an action to Develop an Active Travel
Active travel and economic performance: A What Works review of evidence from cycling and walking schemes
 1 Making the economic case for active travel Active travel and economic performance: A What Works review of evidence from cycling and walking schemes Active Travel Toolkit Slide Pack July 2017 Active travel
Determining bicycle infrastructure preferences A case study of Dublin
 *Manuscript Click here to view linked References 1 Determining bicycle infrastructure preferences A case study of Dublin Brian Caulfield 1, Elaine Brick 2, Orla Thérèse McCarthy 1 1 Department of Civil,
Stepping up a gear. Our vision for cycling in Cardiff
 Stepping up a gear Our vision for cycling in Cardiff Cardiff is growing fast in fact, over the last 10 years its population has grown quicker than any UK city outside London and this rate of expansion
Delivering Accident Prevention at local level in the new public health system
 1 Safety issue accidents don t have to happen Delivering Accident Prevention at local level in the new public health system Part 2: Accident prevention in practice Raise awareness Fact Sheet Road casualties
CYCLING CHARTER ACTION PLAN EXECUTIVE SUMMARY
 CYCLING CHARTER ACTION PLAN EXECUTIVE SUMMARY THE VISION OF THE CYCLING CHARTER To realise the full potential of cycling s contribution to the health and wealth of the West Midlands creating more sustainable
GD 0043/18 ACTIVE TRAVEL STRATEGY
 GD 0043/18 ACTIVE TRAVEL STRATEGY 2018-2021 May 2018 Minister s Introduction There is strong evidence that regular physical activity reduces the risk of a range of health conditions. The best way to increase
Our Cycle Promise. northernrailway.co.uk. Produced in partnership with Sustrans. July 2017
 Our Cycle Promise Produced in partnership with Sustrans July 2017 northernrailway.co.uk Contents Welcome 3 Working with others 4 Making your journey easier 5 to and from your local station 5 at the station
Cycle journeys on the South-West City Way: a descriptive analysis. Karen McPherson. Glasgow Centre for Population Health
 Cycle journeys on the South-West City Way: a descriptive analysis Karen McPherson Glasgow Centre for Population Health March 2017 Key points: There were 107,000 journeys made using the route during the
WEST YORKSHIRE LTP CYCLE PROSPECTUS
 WEST YORKSHIRE LTP CYCLE PROSPECTUS The West Yorkshire Ambition: To be recognised as a great place for safe cycling, inspiring more people to cycle more often. INTRODUCTION Cycling is low cost, environmentally
Bike To School Week 2017
 Teacher resources pack England & Wales: education@sustrans.org.uk 0117 9150207 Sustrans 2 Cathedral Square, College Green, Bristol, BS1 5DD Northern Ireland schoolsni@sustrans.org.uk 028 9043 4569 Sustrans
Summary of bicycle helmet law results in Western Australia
 Summary of bicycle helmet law results in Western Australia * All graphs, charts and tables presented in this document are scanned directly from reports published by Western Australia government departments,
Part 3: Active travel and public transport planning in new housing developments
 1 Linking active travel and public transport to housing growth and planning Part 3: Active travel and public transport planning in new housing developments Active Travel Toolkit Slide Pack July 2017 Linking
SUSTAINABLE TRAVEL TOWNS: RESULTS AND LESSONS
 SUSTAINABLE TRAVEL TOWNS: RESULTS AND LESSONS Joe Finlay Sustainable Travel Team Department for Transport (UK) Introduction I will: Give brief background on the Sustainable Travel Towns and the projects
2011 Origin-Destination Survey Bicycle Profile
 TRANS Committee 2011 Origin-Destination Survey National Capital Region December 2012 TRANS Committee Members: City of Ottawa, including OC Transpo Ville de Gatineau Société de transport de l Outaouais
Regional Cycle Programme Update
 Agenda Item 10 (ii) Regional Cycle Programme Update Glossary Auckland Council Auckland Transport Cycle Action Auckland New Zealand Transport Agency Regional Cycle Network (AC) (AT) (CAA) (NZTA) (RCN) Executive
Summary of NWA Trail Usage Report November 2, 2015
 Summary of NWA Trail Usage Report November 2, 2015 Summary Findings: The study showed that Northwest Arkansas (NWA) had relatively high cyclist user counts per capita aggregated across the top three usage
Westminster s Joint Health and Wellbeing Strategy
 Westminster s Joint Health and Wellbeing Strategy 2013 2016 Response from Sustrans General comments From a strategic perspective, Sustrans welcomes the Health and Wellbeing Strategy s focus on encouraging
National Cycle Network - Signing and Route Branding
 National Cycle Network - Signing and Route Branding Technical Information Note No. 27 September 2012 About Sustrans Sustrans makes smarter travel choices possible, desirable and inevitable. We re a leading
Cycle Routes. Traffic Advisory Leaflet 3/95 March Introduction. Implementation. Project aims. Design
 Traffic Advisory Leaflet 3/95 March 1995 Cycle Routes Introduction The leaflet summarises the findings of the Cycle Routes Programme. This research was undertaken for the Department of Transport by the
CYCLING SCOTLAND SCOTTISH CHARITY NO.SCO Annual Cycling Monitoring Report
 CYCLING SCOTLAND SCOTTISH CHARITY NO.SCO29760 Annual Cycling Monitoring Report 2018 Annual Cycling Monitoring Report 2018 4 CYCLING SCOTLAND Annual Cycling Monitoring Report 2018 National cycling.scot
Safe Routes to School
 Safe Routes to School Paul Osborne, Safe Routes to Schools Project Director, Sustrans The Danesmead Wing, 33 Fulford Cross, York YO10 4PB, UK paulo@sustrans.org.uk Summary Safe Routes to Schools is a practical
Active Travel Towns Funding Scheme Project Proposal. Sligo. Sligo Local Authorities
 Active Travel Towns Funding Scheme 2014-2016 Project Proposal for Sligo by Sligo Local Authorities Introduction Over the last two years, Sligo Local Authorities have implemented years 1 & 2 of their 5
Central London Bus Services Review
 Central London Bus Services Review Sustrans response to Transport for London November 2018 About Sustrans Sustrans is the charity making it easier for people to walk and cycle. We are engineers and educators,
Cambridgeshire floating bus stops interaction analysis
 Cambridgeshire floating bus stops interaction analysis Final report December 2015 About Sustrans Sustrans makes smarter travel choices possible, desirable and inevitable. We re a leading UK charity enabling
Walking and Cycling Action Plan Summary. A Catalyst for Change The Regional Transport Strategy for the west of Scotland
 Walking and Cycling Action Plan Summary A Catalyst for Change The Regional Transport Strategy for the west of Scotland 2007-2021 Strathclyde Partnership for Transport Contents Purpose...2 Issues, Constraints
KEY FINDINGS OF THE INTERIM EVALUATION OF THE SMARTER TRAVEL AREAS PROGRAMME
 Proceedings 1st - 2nd September 2016 BRICK, CANTWELL, SWIFT: Smarter Travel Areas KEY FINDINGS OF THE INTERIM EVALUATION OF THE SMARTER TRAVEL AREAS PROGRAMME Elaine Brick Associate Director AECOM Mairead
CONTENTS PREFACE 1.0 INTRODUCTION AND SCOPE 2.0 POLICY AND GOVERNANCE 3.0 SUMMARY OF PROGRESS 4.0 NATURE OF DEMAND 5.0 TRAVEL AND PARKING INITIATIVES
 CONTENTS PREFACE 1.0 INTRODUCTION AND SCOPE 2.0 POLICY AND GOVERNANCE 3.0 SUMMARY OF PROGRESS 4.0 NATURE OF DEMAND 5.0 TRAVEL AND PARKING INITIATIVES 6.0. TARGETS PREFACE The University of St Andrews has
University of Leeds Travel Plan
 University of Leeds Travel Plan 2015-2018 Contents 1: Introduction 1.1 What is a Travel Plan? 1.2 Why do we need one? 1.3 Sustainability Strategy 2: Overview 2.1 The bigger picture 2.2 The City scale 2.3
Queensbury Tunnel. Estimating the economic impact of reopening walking and cycling routes around Queensbury Tunnel. June 2017
 Queensbury Tunnel Estimating the economic impact of reopening walking and cycling routes around Queensbury Tunnel June 2017 About Sustrans Sustrans makes smarter travel choices possible, desirable and
12. School travel Introduction. Part III Chapter 12. School travel
 12. School travel 12.1 Introduction This chapter presents the evidence on changes in travel patterns for the journey to school in the three towns over the period of the Sustainable Travel Town project.
Cycle Superhighway 4 from Tower Bridge to Greenwich
 Cycle Superhighway 4 from Tower Bridge to Greenwich About Sustrans Sustrans is the charity making it easier for people to walk and cycle. We are engineers and educators, experts and advocates. We connect
The case study was drafted by Rachel Aldred on behalf of the PCT team.
 Rotherhithe Case Study: Propensity to Cycle Tool This case study has been written to use the Propensity to Cycle Tool (PCT: www.pct.bike) to consider the impact of a bridge in South-East London between
1.5 On this basis it is fundamental that the Transport Strategy for the site focuses on the following key criteria,
 1.0 Introduction 1.1 The Transport Assessment has been prepared on behalf of Eon and Roger Bullivant Ltd in respect of the proposed mixed use sustainable urban extension of Drakelow Park. 1.2 The methodology
Introduction. Summary conclusions. Recommendation
 20 s Plenty for Us calls for Hampshire County Council to withdraw its report on the 20mph Pilot Programme and to press ahead with rolling out 20mph in residential streets across the county. Introduction
Baseline Survey of New Zealanders' Attitudes and Behaviours towards Cycling in Urban Settings
 Baseline Survey of New Zealanders' Attitudes and Behaviours towards Cycling in Urban Settings Highlights 67% of urban New Zealanders, 18 years of age or more own or have access to a bicycle that is in
Sustrans Scotland: walking and cycling outcomes
 Sustrans Scotland: walking and cycling outcomes Sustrans' Scottish Government Grant 2012 2015: First Interim Report September 2013 About Sustrans Sustrans makes smarter travel choices possible, desirable
VGI for mapping change in bike ridership
 VGI for mapping change in bike ridership D. Boss 1, T.A. Nelson* 2 and M. Winters 3 1 Unviersity of Victoria, Victoria, Canada 2 Arizona State University, Arizona, USA 3 Simon Frasier University, Vancouver,
Loughborough University Travel Planning
 Document Ti tle Client Name Loughborough University Travel Planning Loughborough University Travel Plan Executive Summary 2015-2020 23 December 2015 Loughborough University Travel Planning Project no:
Birmingham Connected. Edmund Salt. Transportation Policy Birmingham City Council
 Birmingham Connected Edmund Salt Transportation Policy Birmingham City Council www.birmingham.gov.uk/connected Birmingham Connected the story so far Broadly following EU Guidance We ve done all of this
DOE Climate Change Proposals
 DOE Climate Change Proposals Sustrans response to Proposals for Taking Forward NI Climate Change Legislation January 2016 About Sustrans Sustrans makes smarter travel choices possible, desirable and inevitable.
London Cycle Network Annual Report 2000
 London Cycle Network Annual Report 2000 A cycle network for London by 2005 A cycle network for London by 2005 The London Cycle Network will: provide local links between residential neighbourhoods, railway
This objective implies that all population groups should find walking appealing, and that it is made easier for them to walk more on a daily basis.
 Walking for life The Norwegian Walking Strategy Guro Berge Norwegian public Roads Administration "Walking for life" is the slogan for the National Walking Strategy that is now being formulated in Norway.
Easton Safer Streets - Final Project Report BRISTOL
 - Final Project Report BRISTOL A Sustrans Community Street Design Project in partnership with Bristol City Council February 07 About Sustrans Sustrans makes smarter travel choices possible, desirable and
The real cycling revolution. How the face of cycling is changing
 The real cycling revolution How the face of cycling is changing Contents Cycling steps up a gear on the National Cycle Network 3 Lower costs, no queues, and free exercise are driving change 4 The National
Cycle traffic and the Strategic Road Network. Sandra Brown, Team Leader, Safer Roads- Design
 Cycle traffic and the Strategic Road Network Sandra Brown, Team Leader, Safer Roads- Design Highways England A Government owned Strategic Highways Company Department for Transport Road Investment Strategy
January Transforming cities. The potential of everyday cycling
 January 2019 Transforming cities The potential of everyday cycling What is Bike Life? Bike Life is the UK s biggest assessment of cycling in cities. It is delivered by Sustrans in collaboration with 15
York Scarborough Bridge Economic Appraisal Update Technical Note
 York Scarborough Bridge Economic Appraisal Update Technical Note Specification No. 1 Client name West Yorkshire Combined Authority Client reference M088 Discipline Transportation Project name CCAG2 Economics
A future cycle route network for North Staffordshire mb/08/16 Need for a strategy. Existing cycle route network
 Need for a strategy 1. The government s aim is to double cycling levels nationally by 2025 [note 1]. This would bring significant health, environmental, economic and traffic benefits [note 2]. It is widely
The Scottish Collaboration for Public Health Research and Policy; and 20mph speed limits
 The Scottish Collaboration for Public Health Research and Policy; and 20mph speed limits Dr Ruth Jepson and Dr John McAteer Wellington, Jan 2018 SCPHRP* Scottish Collaboration for Public Health Research
TYPES OF CYCLING. Figure 1: Types of Cycling by Gender (Actual) Figure 2: Types of Cycling by Gender (%) 65% Chi-squared significance test results 65%
 Figure 2: Types of Cycling by Gender (%) 65% Chi-squared significance test results 65%") TYPES OF CYCLING 1,980 responses were received to this question (multiple answers were allowed), 727 female (41%) and 1,242 (71%) from male respondents. The most common responses for both genders were
TYPES OF CYCLING 1,980 responses were received to this question (multiple answers were allowed), 727 female (41%) and 1,242 (71%) from male respondents. The most common responses for both genders were
LESSONS FROM THE GREEN LANES: EVALUATING PROTECTED BIKE LANES IN THE U.S.
 LESSONS FROM THE GREEN LANES: EVALUATING PROTECTED BIKE LANES IN THE U.S. FINAL REPORT: APPENDIX C BICYCLIST ORIGIN AND DESTINATION ANALYSIS NITC-RR-583 by Alta Planning and Design Matt Berkow Kim Voros
Child Road Safety in Great Britain,
 Child Road Safety in Great Britain, 21-214 Bhavin Makwana March 216 Summary This short report looks at child road casualties in Great Britain between 21 and 214. It looks at how children travel, the geographical
University of Victoria Campus Cycling Plan Terms of Reference. 1.0 Project Description
 University of Victoria Campus Cycling Plan Terms of Reference 1.0 Project Description The Campus Cycling Plan, a first for the University, will provide a comprehensive and coordinated approach to support
RE-CYCLING A CITY: EXAMINING THE GROWTH OF CYCLING IN DUBLIN
 Proceedings ITRN2013 5-6th September, Caulfield: Re-cycling a city: Examining the growth of cycling in Dublin RE-CYCLING A CITY: EXAMINING THE GROWTH OF CYCLING IN DUBLIN Brian Caulfield Abstract In the
2017 Northwest Arkansas Trail Usage Monitoring Report
 2017 Northwest Arkansas Trail Usage Monitoring Report Summary Findings: The study showed that average daily weekday bicycle volumes per study site increased by about 32% between 2015 and 2017, from 142
UBC Vancouver Transportation Status Report Fall 2014
 UBC Vancouver Transportation Status Report Fall 2014 July 2015 1. Introduction... 1 1.1. Context... 1 1.2. Transportation Monitoring Program... 2 1.3. Changes at UBC Affecting Travel Patterns... 4 1.4.
UBC Vancouver Transportation Status Report Fall 2017
 UBC Vancouver Transportation Status Report Fall 2017 March 2018 1. Introduction... 1 1.1. Context... 1 1.2. Transportation Monitoring Program... 2 1.3. Changes at UBC Affecting Travel Patterns... 5 1.4.
Slimming the Streets: Best Practices for Designing Road Diet Evaluations
 San Jose State University From the SelectedWorks of Asha W. Agrawal March, 2018 Slimming the Streets: Best Practices for Designing Road Diet Evaluations Hilary Nixon, San Jose State University Asha W.
PERSONALISED TRAVEL PLANNING IN MIDLETON, COUNTY CORK
 PERSONALISED TRAVEL PLANNING IN MIDLETON, COUNTY CORK Elaine Brick Principal Transport Planner AECOM Abstract Smarter Travel funding was awarded to the Chartered Institute of Highways and Transportation
BRIEFING PAPER 29 FINDINGS SERIES. Children s travel to school are we moving in the right direction?
 BRIEFING PAPER 29 FINDINGS SERIES Children s travel to school are we moving in the right direction? February 2011 FINDINGS SERIES 29 BRIEFING PAPER KEY FINDINGS National surveys show that while the level
COUNT ME IN PEDESTRIAN COUNTERS CASE STUDY ABOUT THIS CASE STUDY:
 COUNT ME IN PEDESTRIAN COUNTERS CASE STUDY ABOUT THIS CASE STUDY: Getting hold of good data on the number of pedestrians is invaluable to plan and prioritise walking-friendly streets. This case study explains
What s the issue for transport in Cardiff?
 Demand for travel The number of commuters travelling to work in Cardiff has increased from 190,000 in 2001 to 198,000 in 2010, with some 124,000 Cardiff residents travelling across the city daily to their
Cycle Route Networks Sustrans creates popular cycle routes through public involvement By Tony Russell, Sustrans, England
 ARTICLE FROM THE BOOK: Cyclists & Cycling Around the World Creating Liveable Cyclists and & Cycling Bikeable Around Cities the World Edited by Juan Carlos Dextre, Mike Hughes & Lotte Bech Published by
To: The results of these surveys have been analysed and are summarised within this Technical Note.
 Technical Note Project: Histon Road / Milton Road, Cambridge Parking Surveys To: Andy Harrison Subject: Survey Report v1.6 From: Jonathan Barlow Date: 18 th February 2016 cc: Richard Jones / Dave Boddy
Road Safety Partnership
 Cambridgeshire and Peterborough Road Safety Partnership Cambridgeshire and Peterborough Road Safety Partnership Introduction Road accidents can have a devastating impact not only for the people directly
APPENDIX H EXISTING TRAFFIC CONDITIONS ANALYSIS
 APPENDIX H EXISTING TRAFFIC CONDITIONS ANALYSIS MEMO : Peter Steacy, P.Eng. Date: December 3, 2014 : Ian Borsuk, P.Eng. Job No.: 3414015-000 Subject: City of Ottawa O-Train Extension Planning & EA Study
Nottingham, the great cycle city
 Nottingham, the great cycle city Our vision for the city s cycling future Foreword Councillor Jon Collins Leader of the Council Nottingham has a world class public transport system which is essential to
Government transport policy
 Government transport policy and the implications for planning RTPI TPS Transport Planning Network James Harris P o l i c y a n d N e t w o r k s M a n a g e r R o y a l To w n P l a n n i n g I n s t i
21/02/2018. How Far is it Acceptable to Walk? Introduction. How Far is it Acceptable to Walk?
 21/2/218 Introduction Walking is an important mode of travel. How far people walk is factor in: Accessibility/ Sustainability. Allocating land in Local Plans. Determining planning applications. Previous
TomTom South African Congestion Index
 TomTom South African Congestion Index Disclaimer All copyrights, commercial rights, design rights, trademarks and other elements considered intellectual property that are published in this report are reserved
Horses on the National Cycle Network
 Horses on the National Cycle Network Technical Information Note No. 28 September 2011 About Sustrans Sustrans makes smarter travel choices possible, desirable and inevitable. We re a leading UK charity
GETTING WHERE WE WANT TO BE
 CAMBRIDGESHIRE & peterborough GETTING WHERE WE WANT TO BE A GREEN PARTY TRANSPORT POLICY CONTENTS Our Campaign Priorities 4 Bus Franchising 6 Supporting Active Transport 8 Workplace Parking Levy 9 Tackling
UK Integrated Behaviour Change Programmes
 UK Integrated Behaviour Change Programmes 17 th November 2009 ACT TDM Summit Conference Daniel Johnson, Transport for London Nicky Ward, Steer Davies Gleave Structure 1. UK travel behaviour change 2. An
Public Consultation on Braintree Integrated Transport Package (ITP) HAVE YOUR. Consultation open from 24 September to 5 November 2018 SAY
 HAVE YOUR. Consultation open from 24 September to 5 November 2018 SAY") Public Consultation on Braintree Integrated Transport Package (ITP) HAVE YOUR SAY Consultation open from 24 September to 5 November 2018 Contents Introduction 3 Background 4 Springwood Drive Roundabout
Public Consultation on Braintree Integrated Transport Package (ITP) HAVE YOUR SAY Consultation open from 24 September to 5 November 2018 Contents Introduction 3 Background 4 Springwood Drive Roundabout
An introduction to the benefits of - a we developed monitoring process. Cycling Without Borders Conference. 19 th September 2014
 An introduction to the benefits of - a we developed monitoring process Cycling Without Borders Conference 19 th September 2014 Sustrans Research and Monitoring U Team of 30 - data collection experts Monitor,
Exploring the relationship between Strava cyclists and all cyclists*.
 Exploring the relationship between Strava cyclists and all cyclists*. Dr. David McArthur, Dr. Jinhyun Hong, Dr. Mark Livingston, Kirstie English *This presentation contains preliminary results which are
Travel Plan Monitoring Report. Bourton View, Wellingborough - Residential
 Travel Plan Monitoring Report Bourton View, Wellingborough - Residential Prepared by: Developer Eyes Property and Estate Management, Broughton Grange Business Centre, Headlands, Kettering, Northants, NN15
Using parking policy and parking levies to tackle transport and environmental issues
 Using parking policy and parking levies to tackle transport and environmental issues Stephen Joseph, Chief Executive Campaign for Better Transport Campaign for Better Transport Charitable trust promoting
Becoming a travel champion
 Becoming a travel champion An introduction for schools and colleges Why be a champion? Sustrans has over 140 officers in more than 2,400 schools and colleges to help young people and staff to travel in
Projections of road casualties in Great Britain to 2030
 5 Projections of road casualties in Great Britain to 2030 C G B (Kit) Mitchell and R E Allsop Published March 2014 Contents Section 1 Introduction 4 Section 2 Trends in road casualty rates 6 Section 3