Lessons from the Green Lanes: Evaluating Protected Bike Lanes
|
|
|
- Jessica Hawkins
- 6 years ago
- Views:
Transcription

1 Lessons from the Green Lanes: Evaluating Protected Bike Lanes Christopher M. Jennifer Nathan Portland State University Pro Walk Pro Bike Pro Place Pittsburgh, PA September 9, Photo credit: Nathan McNeil, PSU
 10 2.")
 15")
 25 *Questions from")
 5 7.")
2 Session Overview 1. Overview of Sites (Chris) Methodology (Nathan) 5 3. Change in Ridership (Jennifer) 15 *Questions from audience* 4. Design (Chris) 25 *Questions from audience* 6. Barrier types (Nathan) 5 7. Community Support (Jennifer) 10 *Questions from audience* 2
3 Research Objectives A field-based evaluation of protected bikeways in five U.S. cities to study: Safety of users (both perceived and actual) Effectiveness of the design Perceptions of residents and other road users Attractiveness to more casual cyclists Change in economic activity 3

4 Overview of Sites 4


5 Green Lane Cities Studied 5
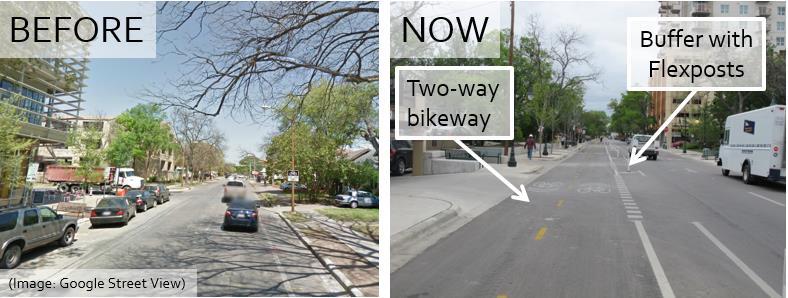
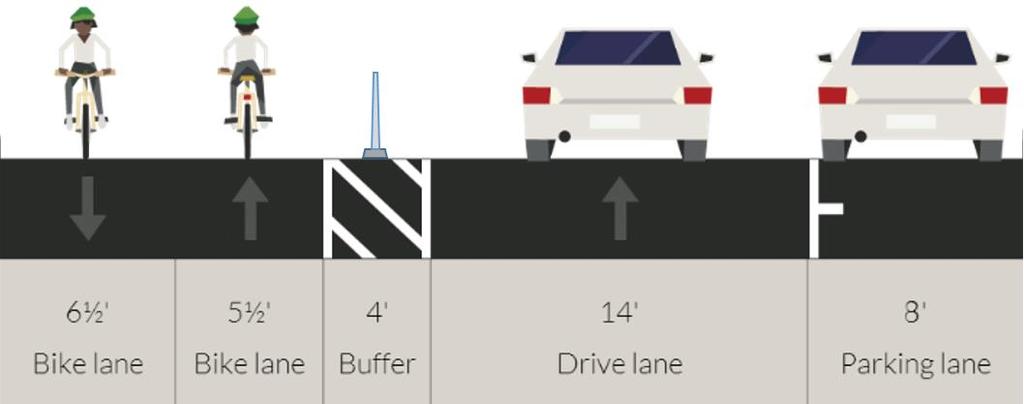
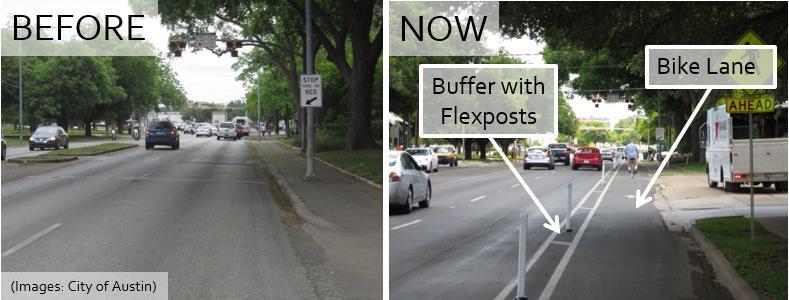
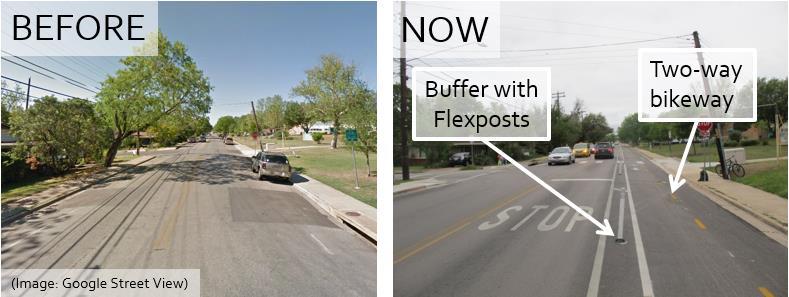
6 Study Facilities: Austin Rio Grande Street Bluebonnet Lane Barton Springs Road 6
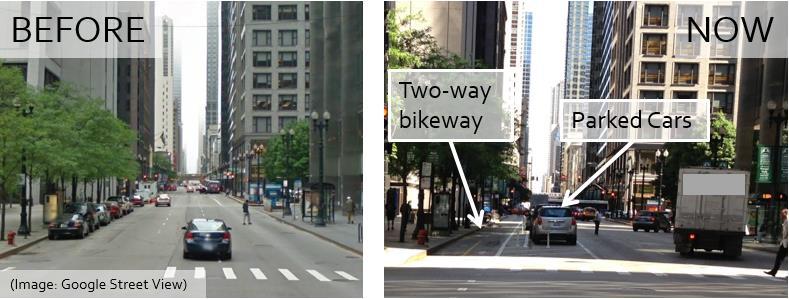
7 Study Facilities: Chicago Chicago: N/S Dearborn Street Chicago: N Milwaukee Avenue 7


8 Study Facilities: Portland Portland: NE Multnomah Street 8
9 Study Facilities: San Francisco SF: Fell Street SF: Oak Street 9

10 Study Facilities: Washington DC DC: L Street 10
11 Methodology 11
 per location 168")
 from San Francisco at")
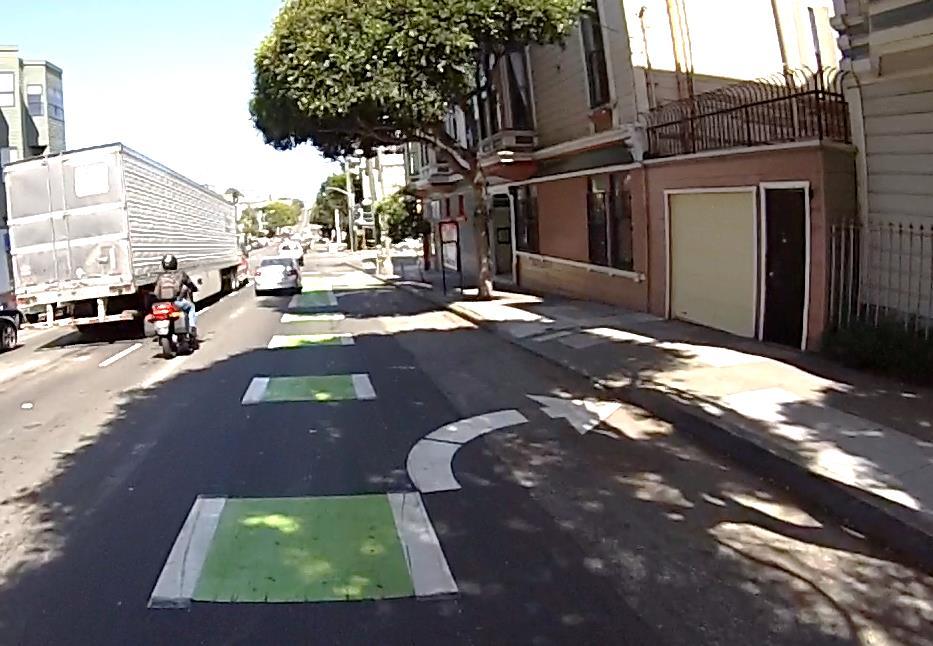
12 Video Data Primarily intersections 3 locations per facility, 2 cameras per location 2 days of video (7am to 7pm) per location 168 hours analyzed 16,393 bicyclists and 19,724 turning vehicles observed Example Video Screenshots (2 views) from San Francisco at Oak and Broderick
 ~2/3 of completions paper")
 Driving Facility- Specific Biking Walking Business")
13 Resident Survey Details Resident Survey Travel Habits/ Opinions Mailed to residents living near new protected BL 8-12 pages (~40 questions) ~2/3 of completions paper survey returned by mail ~1/3 of completions opted for online survey Incentive of $100 Amazon gift card raffle (3 per city) Driving Facility- Specific Biking Walking Business Demographics


14 Bicyclist Survey Details Bicyclist Survey Trip Details Bicyclists intercepted on facility and directed to online survey Incentive of $100 Amazon gift card raffle (3 per city) Experience with operations and safety Facility- Specific Demographics Bikeway encounters and collisions Unique facility treatments and intersections
15 Survey Response Rates City Route Delivered Resident Survey Returned Bicyclist Survey Response Rate Distributed Returned Response Rate Washington, DC L Street 1, % % Bluebonnet Lane 1, % Austin, TX Barton Springs Road* Rio Grande Street % % % San Francisco, CA Oak /Fell 1, % % Chicago, IL Portland, OR N/S Dearborn Street N Milwaukee Avenue NE Multnomah Street 1, % % 1, % % 1, % % TOTAL 9,746 2,283 23% 3,409 1,111 33% *Note Barton Springs Road is also surveyed in the Bluebonnet Lane resident survey
16 Resident Bicyclist Four year degree + Income >$100k Work From Home Work Outside Home Asian Hispanic or Latino/a Black White 55 + years 35 to 54 years <35 years of age Female Own working bicycle Own/Lease a car Car Share Membership Transit Pass Driver's License Children in HH 2+ Adults in HH Home Owners 6% 5% 5% 15% Four year degree 83% + 41% Income >$100k Work From Home Work Outside 66% Home Asian Hispanic or Latino/a Black 81% White 34% 55 + years 40% 35 to 54 years 26% <35 years of age 53% Female Own working 67% bicycle Own/Lease 81% a car 18% Car Share Membership 50% Transit Pass Driver's License 96% 15% Children in HH 2+ 64% Adults in HH 55% Home Owners 0% 20% 40% 60% 80% 100% Source: Resident and Bicyclist surveys, Green Lane evaluation 7% 7% 5% 1% 6% 28% 25% 37% 32% 48% 56% 73% 72% 78% 89% 93% 89% 97% 0% 20% 40% 60% 80% 100% 16
17 Residents by Primary Commute Mode Non-commuter 237 Mix 335 Transit 301 Bicycle 157 Foot 313 Car / Truck Source: Resident surveys, Green Lane evaluation 17
18 Data Methods by Facility Austin Chicago Portland Barton Springs Road Video Data Bicyclist Survey Resident Survey Count Data Bluebonnet Lane Rio Grande Street Dearborn Street Milwaukee Avenue NE Multnomah Street Fell Street San Francisco Oak Street Washington DC L Street 18
19 Data Used in Analysis Research Element Video Data Bicyclist Survey Resident Survey Count Data Change in Ridership Design/Safety Evaluation Barrier Types & Comfort Community Support 19

20 Change in Ridership: Safety perceptions and potential riders 20
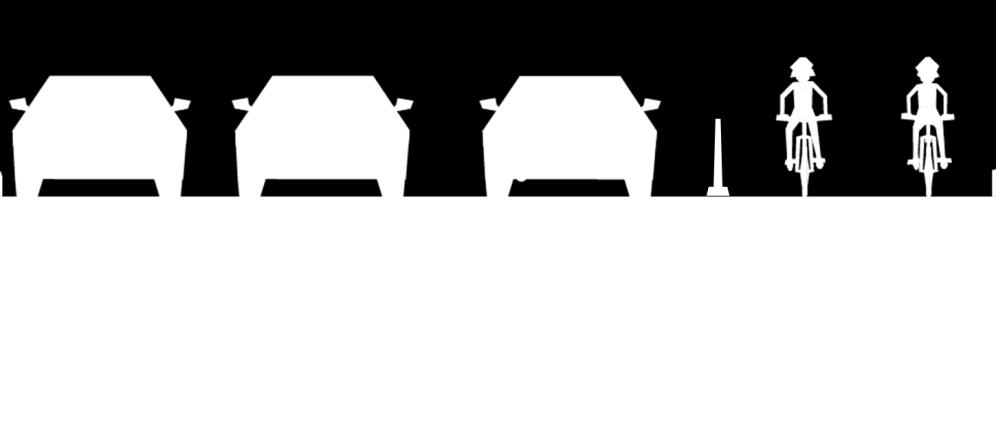
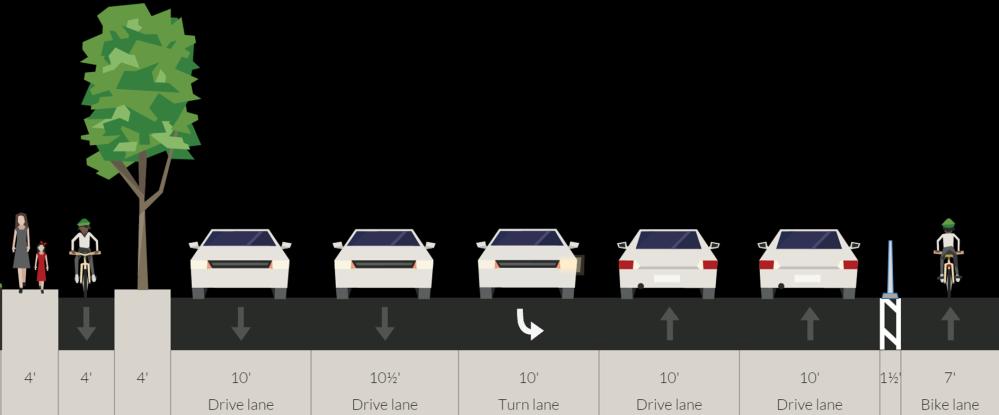
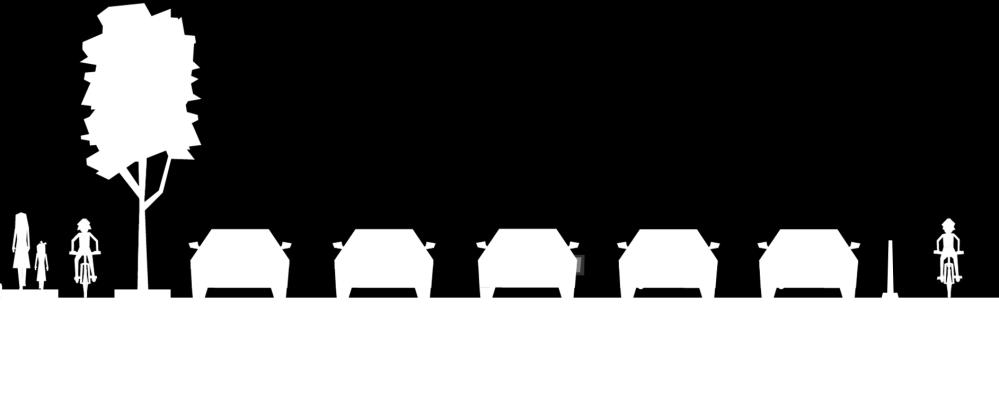
21 Percent Increase Change in Observed Bicycle Volumes 180% 171% 160% Before: One-way travel After: Two-way travel 140% 126% 120% 100% 80% 60% 68% 46% 46% 65% 58% 40% 20% 21% 0% Rio Grande Multnomah Bluebonnet Fell Milwaukee Dearborn L Street Barton Springs Bike lanes prior No bike lanes prior Source: City-provided before and after counts, PSU video counts, ACS Survey 21
22 Before the new facility was built, how would you have made this trip? 100% 80% 60% 17% 21% 55% 56% 56% 65% 75% 80% 83% By bicycle, using this same route Would not have taken trip 40% 60% 7% 10% 10% 6% By other mode 20% 0% 38% 34% 32% 29% Dearborn Rio Grande Multnomah L Street Barton Springs Source: Cyclist intercept surveys, Green Lane evaluation 6% 7% 10% 18% 11% 6% Oak Street Fell Street Milwaukee By bicycle, using another route 22
23 One likely reason: Improved perception of safety I feel the safety of bicycling on has.. Increased Somewhat Increased a Lot Austin Rio Grande SF Oak / Fell Portland Multnomah Chicago Milwuakie DC L Street Chicago Dearborn Austin Barton Springs 27% 18% 33% 31% 29% 18% 33% 66% 81% 59% 65% 66% 82% 56% Source: Cyclist intercept surveys, Green Lane evaluation 0% 20% 40% 60% 80% 100% 23
24 What about attracting new cyclists or increasing cycling? 24
25 Because of the Street separated bikeway, how often I ride a bicycle overall has... 60% 50% Increased Somewhat Increased a lot 40% 30% 20% 10% 0% Men Women Men Women Men Women Men Women Men Women Men Women San Francisco Washington DC Chicago Austin Portland Overall Source: Cyclist intercept surveys, Green Lane evaluation 25
26 Potential New Cyclists by the Four Types Share of Residents Strong and Fearless, 5% Enthused and Confident, 27% Interested but Concerned, 43% No Way No How, 25% I would be more likely to ride a bicycle if motor vehicles and bicycles were physically separated by a barrier. 62% 85% 43% 37% Strong and Fearless Enthused and Confident Interested but Concerned No Way No How 26
27 Because of the protected bike lanes, the safety of bicycling on the street has increased No Way No How 59% Interested But Concerned 88% Enthused and Confident 87% Strong and Fearless 76% 0% 20% 40% 60% 80% 100% Percent of Residents Stating "safety increased" Source: Resident Surveys, Green Lane evaluation 27
28 Potential New Cycling Among residents who have ridden a bicycle on the new facility: 100% 80% 60% 40% 20% 0% 100% 80% 60% 40% 20% 0% Because of the [facility], the likelihood that I will choose to bicycle on this street as opposed to other streets has... 43% Strong and Fearless 20% Enthused and Confident Decreased 78% 78% Interested but Concerned Increased 45% 43% 23% No Way No How Because of the [facility], how often I ride a bicycle overall has... Strong and Fearless Enthused and Confident Interested but Concerned 7% No Way No How Decreased Increased 28
29 Stated Comfort Level (mean. 1=very uncomfortable, 6=very comfortable) Women Residents Who Want to Bike More Non-utilitarian bicyclist (n=181) Utilitarian bicyclist (n=337) path or trail separate from the street commercial street with two lanes of traffic in each direction,traffic speeds of 35 mph, on-street car parking, and no bikeway similar street, but with a striped bikeway added similar street, but with a physically separated bikeway Levels of comfort in different bicycling environments: Women residents who are interested in bicycling more, by current bicycling behavior 29
30 Questions? 30

31 Design: Intersections, Signals, Loading Zone, Green pavement 31
32 Intersections Design Elements Turning and mixing zones Fully signalized Providing curb access Hotel loading zone Other design elements Green pavement marking Minor driveways Look Bikes 32

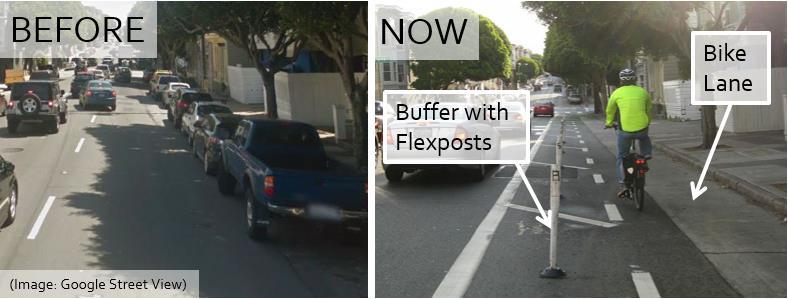
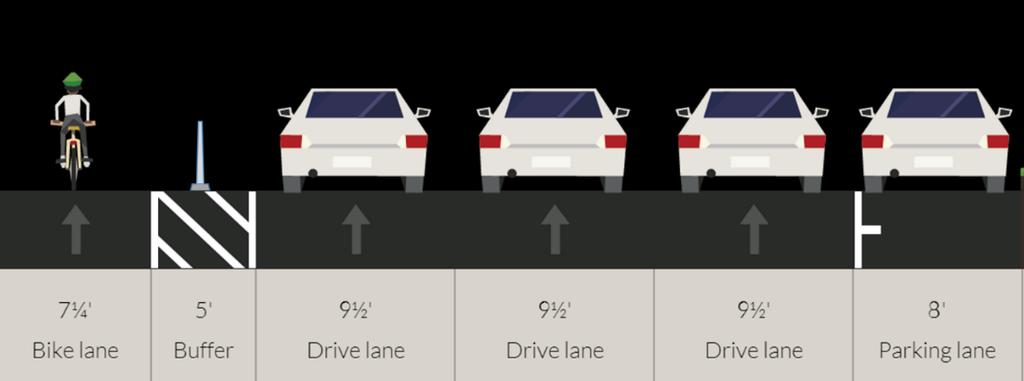
")
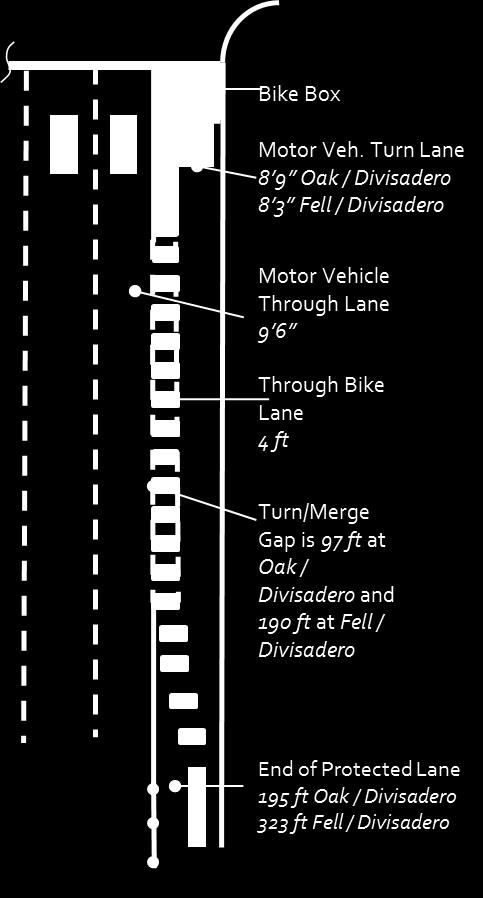
33 Turning Zone with Post Restricted Entry and Through Bike Lane (TBL) 33

34 Turning Zone with Unrestricted Entry and TBL 34


35 Mixing Zone with Yield Entry Markings 35


36 Mixing Zone with Sharrow Marking 36


37 Mixing Zone with Green Skip Coloring 37
 L Street / 15th Turning Zone with Post Restricted Entry and TBL L Street / Connecticut Turning Zone with")
38 Intersection and Type of Design Direction of Turning Traffic Through Bikes Per Hour Turning Vehicles Per Hour Observed Correct Turning Motorist Observed Correct Through Bicycle % of Bicyclists Agreeing They Feel Safe Turning Zone with Post Restricted Entry and Through Bike Lane (TBL) L Street / 15th Turning Zone with Post Restricted Entry and TBL L Street / Connecticut Turning Zone with Unrestricted Entry and TBL Oak / Divisadero Mixing Zone with Yield Entry Markings NE Multnomah / 9th Left % 93% 64% Left % 89% 64% Right % 81% 74% Right % 63% 73% Mixing Zone with Sharrow Marking Oak / Broderick Right % 30% 79% Mixing Zone with Green Skip Coloring Fell / Baker Left % - 84%

39 DC Design on M Street Photo 39

40 Dearborn and Madison, Chicago, IL Photo: C. Monsere 40

41 Bicycle Signals on Dearborn Using the small bicycle in the bicycle signal lens is a good way to communicate the signal is only for bicycles 87% agree I like that bicyclists and turning cars each have their own signal 74% agree At these intersections, it is always clear to me which signal I should use as a motorist 66% agree 41
42 People on Bicycles Waited for green/legal right-turn on red Proceeded illegally on red Dearborn/ Randolph 92% 8% Dearborn/ Madison 77% 23% Dearborn/ Congress 93% 7% People in Motor Vehicles 0% 10% 20% 30% 40% 50% 60% 70% 80% 90% 100% Legal Turn on Green Illegal Turn on Red Arrow Jumped into crosswalk Dearborn/ Randolph 92% 6% 2% Dearborn/ Madison 90% 5% 6% Dearborn/ Congress 84% 10% 6% 0% 10% 20% 30% 40% 50% 60% 70% 80% 90% 100% 42

43 Hotel Loading Zone Bicycle Use Used TBL Did not use TBL Forced out Cars Present, n=128 48% 12% 40% No Cars Present, n=615 37% 63% 0% 20% 40% 60% 80% 100% Motor Vehicle Use In TBL Keeps TBL Clear In Merge Zone Cars Present, n=44 30% 61% 7% 0% 20% 40% 60% 80% 100% 43
44 Meaning of Green Marking I don't know 10% 15% 19% Portland, Multnomah Other Marks space for bicyclists to stop 3% 1% 3% 1% 3% 15% Chicago, Milw Chicago, Dearborn Marked space alerts motorists and/or bicycles of conflict area (includes bicyclists have ROW, use caution, shared area, merge area) 42% 52% 62% Marked space is for bicycles only (a protected lane, a bicycle lane, a place that bikes should be) 14% 30% 31% 0% 10% 20% 30% 40% 50% 60% 70% n= 44

45 Minor Intersections Somewhat Agree The Yield to Bikes signs have made me pay closer attention to cyclists when turning off Milwaukee Ave. Strongly Agree 39% 24% When I want to turn right, I am able to adequately see if there are any approaching cyclists in the bike lane. 32% 11% n=276 0% 10% 20% 30% 40% 50% 60% 70% 45

46 Look Bikes 1=Not effective at all 6= Very Effective How effective do you think these markings will be at warning pedestrians about bicycle traffic? 14% 14% 22% 25% 16% 9% n=191 0% 20% 40% 60% 80% 100% 46
47 Questions? 47

48 Barriers: Buffer types and perceived comfort 48

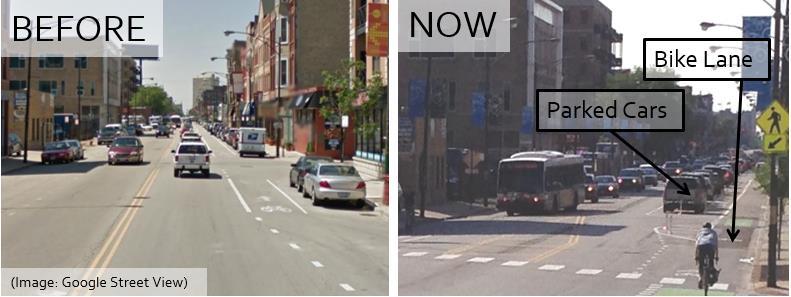
 Parked vehicles and flexposts")

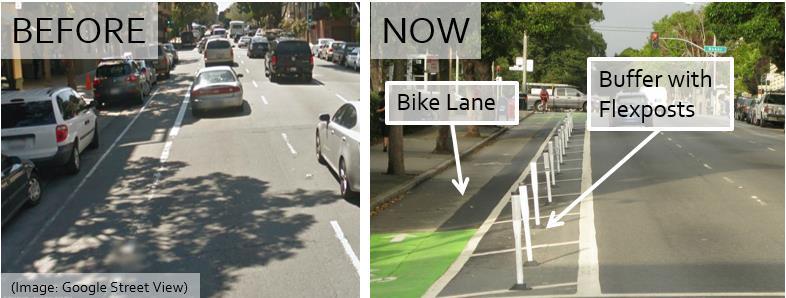
49 Buffer type affects safety and comfort Types of buffers used include: Flexposts and painted buffer (Fell Street, San Francisco) Parked vehicles and flexposts (Milwaukee Avenue, Chicago) Semi-permanent planter with colored pavement (Multnomah St., Portland) 49

, but with the following types of separation from traffic: With a solid painted")

50 Comfort on Hypothetical Facilities with Varying Buffers Residents + Bicyclists Bicyclists Only How comfortable would you feel bicycling on a commercial street with two lanes of traffic in each direction, with traffic speeds of 35 miles per hour (Situation D above), but with the following types of separation from traffic: With a solid painted buffer With a painted 2-3 foot buffer With a painted buffer and parked cars With a raised concrete curb With a 2-3 foot buffer and plastic flexposts With planters separating the bikeway 50

 Painted 2-3 foot")
 2-3 foot buffer and plastic flexposts (2) Planters")
51 Bicyclists: Mean Stated Comfort with Hypothetical Buffers Austin Barton Springs Austin Rio Grande Chicago Dear. Chicago Milw. Portland Mult. SF Oak / Fell Streets D.C. L Street Solid painted buffer (5) Painted 2-3 foot buffer (3) Painted buffer and parked cars (1) Raised concrete curb (6) 2-3 foot buffer and plastic flexposts (2) Planters separating the bikeway (4) 51

52 Percent Increase of Normalized Score (with a standard biccyle lane as base) Change in Stated Comfort (from a bike lane), by bicyclist type Strong and Fearless Enthused and Confident Interested But Concerned 70% 60% 60% 50% 50% 48% 40% 30% 24% 24% 31% 20% 10% 0% -10% 1% -1% -1% -1% A painted 2-3 foot buffer A solid painted buffer -5%-4% A painted buffer and parked cars -2% 1% A raised concrete curb 10% 7% 9% 6% A 2-3 foot buffer and plastic flexposts Planters separating the bikeway
53 Bicyclists: Comparing Stated Comfort on Hypothetical Facilities to Stated Comfort on Actual Facilities Milwaukee (Striped painted buffer) Barton Springs (Flexposts) L Street (Flexposts) Fell Street (Flexposts) Dearborn SB contraflow (two-way) Hypothetical Comfort Oak Street (Flexposts) Multnomah (Planters, Flexposts, Parking) Milwaukee (Flexposts) Stated Comfort Dearborn NB with traffic (two-way) Milwaukee (Parked Cars) Rio Grande NB with traffic (two-way) Rio Grande SB contraflow (two-way) Source: Cyclist intercept surveys, Green Lane evaluation 53
54 Mean Score Bicyclists: Buffer width and Sense of Safety buffer makes me feel safe (shared-use path) Total Width (ft) Far Edge of Bicycle Facility to Near Edge of Motor Vehicle Lane 54


55 Community Support: Motorists, Pedestrians, General 55
56 Support for Protected Lanes Facilities that encourage bicycling for transportation are a good way to improve public health. I would support building more protected bike lanes at other locations. All Residents Car/Truck Non-commuters Mix Transit 43% 39% 36% 47% 43% 83% 75% 79% 69% 80% 75% 84% 76% 82% 78% Because of the protected bike lanes, the desirability of living in my neighborhood has increased Foot Bicycle 45% 66% 79% 88% 97% 95% 0% 20% 40% 60% 80% 100% Source: Resident surveys, Green Lane evaluation 56
57 Because of the protected bike lanes, the safety of on the street has.. Portland, Multnomah San Francisco, Oak 37% 45% 74% 21% 38% 80% Walking Driving Bicycling Austin, Bluebonnet 38% 52% 85% Austin, Barton Springs 44% 43% 82% Chicago, Milwaukee 19% 28% 74% Chicago, Dearborn 15% 23% 76% Washington DC - L St. 27% 30% 80% 0% 20% 40% 60% 80% 100% Percent of Residents Stating Safety Increased" 57 Source: Resident Surveys, Green Lane evaluation
58 Because of the protected bike lanes,...my satisfaction with the walking environment on this street...my sense of safety when crossing this street has Increased No Change Increased No Change L Street 36% 53% L Street 27% 53% Oak/Fell 33% 49% Oak/Fell 24% 55% Multnomah 37% 56% Multnomah 35% 57% Milwaukee 19% 56% Milwaukee 17% 46% Dearborn 17% 54% Dearborn 18% 38% Bluebonnet 49% 41% Bluebonnet 34% 57% Barton Springs 58% 37% Barton Springs 43% 51% 0% 20% 40% 60% 80% 100% 0% 20% 40% 60% 80% 100% Source: Resident Surveys, 78% of respondents have walked on street, Green Lane evaluation 58
59 Perceptions of residents driving on street Percent responding increased L Street Fell Oak Multnomah Milwaukee Dearborn Bluebonnet 27% 20% 22% 32% 15% 52% 54% 48% 63% 44% 54% 53% 59% Since the protected bike lanes were built, the amount of time it takes me to drive on this street has... Since the protected bike lanes were built, how safe and predictable bicyclists are acting has... Barton Springs 18% 58% 0% 20% 40% 60% 80% 59
60 Perceptions about Parking Oak/Fell (-50 spots) 55% Milwaukee (-some) 49% L Street (-150 spots) 46% Bluebonnet (-some) 44% Dearborn (-minimal) 41% Multnomah (+20 spots) 30% 0% 10% 20% 30% 40% 50% 60% 70% % indicating negative impact on... ability to find a parking spot on the street how stressful it is to park on the street 60
 and the Summit Foundation.")
61 Questions? Thanks to support from: National Institute for Transportation and Communities (NITC), a U.S. Department of Transportation university transportation center, People for Bikes (formerly Bikes Belong) and the Summit Foundation. Thanks to City partners: Mike Amsden (CDOT), David Smith (CDOT), Jim Sebastian (DDOT), Mike Goodno (DDOT), Roger Geller (PBOT), Rob Burchfield (PBOT), Ross Swanson (PBOT), Wendy Cawley (PBOT), Lindsay Walker (Lloyd District TMA), Seleta Reynolds (SFMTA), Miriam Sorell (SFMTA), Annick Beaudet (Austin), Nathan Wilkes (Austin), Aleksiina Chapman (Austin). Christopher M. Monsere Portland State University Jennifer Dill Portland State University Nathan McNeil Portland State University monsere@pdx.edu jdill@pdx.edu nmcneil@pdx.edu 61
62 BONUS / REFERENCE SLIDES 62
63 Study Routes: Pre-Conversion Austin Chicago Portland San Francisco DC Barton Springs Road Bluebonnet Lane Rio Grande St N/S Dearborn St N Milwaukee Ave NE Multnomah St Fell St Oak St L Street NW Length (miles) # Signalized Intersections # Unsignalized Intersections ADT 23-28k 3.5k 5k 8-16k 12k 10k 28k 30k 12-14k Transit stops on route Speed Limit % Speed (MPH) n/a n/a 30.5 n/a 63
64 Study Routes: Conversion Austin Chicago Portland San Francisco DC Barton Springs Road Bluebonnet Lane Rio Grande St N/S Dearborn St N Milwaukee Ave NE Multnomah St Fell St Oak St L Street NW Construction Timeframe Spring 2013 Aug-12 Apr-12 Nov./ Dec and May 2013 April/May 2013 Fall 2012/ Winter 2013 Spring /summer 2013 Spring /summer 2013 Oct-12 BL Placement (in relation to traffic) Right Right Left Left Right Right Left Right Left Bike Lane Width (representative) 5'-7' 5' + 5' 6.5' + 5.5' 5' + 4' 7' 4'-7' 7'3" 7'3" 8' Typical Buffer Width 1.5' 2' 4' 3'; 8' parking strip 2-4'; 9' parking strip 2'-8' 5' 5' 3' # Bicycle Signals to Loss of MV Travel Lane No No In places One lane Turn or bus lane, in places One lane in each direction No No In places Net Loss of Parking No ~150 No gained
Webinar: A Comprehensive Evaluation of Protected Cycling Facilities: Lessons from Five Cities
 Portland State University PDXScholar TREC Webinar Series Transportation Research and Education Center (TREC) 3-19-2015 Webinar: A Comprehensive Evaluation of Protected Cycling Facilities: Lessons from
From Protected Bike Lanes to Robust Bikeway Networks
 From Protected Bike Lanes to Robust Bikeway Networks Christopher M. Monsere @CMonsere Jennifer Dill @JenniferDillPSU Portland State University NACTO Designing Cities 2014 1 Background 2 Credit: People
Lessons from the Green Lanes:
 Executive Summary Lessons from the Green Lanes: Evaluating Protected Bike Lanes in the U.S. By Portland State University Chris Monsere Jennifer Dill Nathan McNeil Kelly Clifton Nick Foster Tara Goddard
Lessons from the Green Lanes: Evaluating Protected Bike Lanes in the U.S.
 Portland State University PDXScholar Civil and Environmental Engineering Faculty Publications and Presentations Civil and Environmental Engineering 6-2014 Lessons from the Green Lanes: Evaluating Protected
Lessons from the Green Lanes: Evaluating Protected Bike Lanes in the U.S.
 NATIONAL INSTITUTE FOR TRANSPORTATION AND COMMUNITIES FINAL REPORT Lessons from the Green Lanes: Evaluating Protected Bike Lanes in the U.S. NITC-RR-583 June 2014 A University Transportation Center sponsored
The Influence of Bike Lane Buffer Types on Perceived Comfort and Safety of Bicyclists and Potential Bicyclists
 Portland State University PDXScholar Civil and Environmental Engineering Faculty Publications and Presentations Civil and Environmental Engineering 0 The Influence of Bike Lane Buffer Types on Perceived
A Summary of Recent Evaluations of Cycling Facilities in Portland, OR
 A Summary of Recent Evaluations of Cycling Facilities in Portland, OR Christopher Monsere, Ph.D., P.E. Civil & Environmental Engineering Jennifer Dill, Ph.D. Urban Studies & Planning Nathan McNeil Center
Can Protected Bike Lanes Help Close the Gender Gap in Cycling? Lessons from Five Cities
 0 0 0 0 Can Protected Bike Lanes Help Close the Gender Gap in Cycling? Lessons from Five Cities Paper - Jennifer Dill (Corresponding Author) Transportation Research and Education Center (TREC) Portland
Evaluation of Bike Boxes at Signalized Intersections [Presentation]
![Evaluation of Bike Boxes at Signalized Intersections [Presentation]](/thumbs/89/98792206.jpg "Evaluation of Bike Boxes at Signalized Intersections [Presentation]") Portland State University PDXScholar Urban Studies and Planning Faculty Publications and Presentations Nohad A. Toulan School of Urban Studies and Planning 10-1-2010 Evaluation of Bike Boxes at Signalized
Portland State University PDXScholar Urban Studies and Planning Faculty Publications and Presentations Nohad A. Toulan School of Urban Studies and Planning 10-1-2010 Evaluation of Bike Boxes at Signalized
LESSONS FROM THE GREEN LANES: EVALUATING PROTECTED BIKE LANES IN THE U.S.
 LESSONS FROM THE GREEN LANES: EVALUATING PROTECTED BIKE LANES IN THE U.S. FINAL REPORT: APPENDIX C BICYCLIST ORIGIN AND DESTINATION ANALYSIS NITC-RR-583 by Alta Planning and Design Matt Berkow Kim Voros
Bicycle Corrals Portland Designing Streets NYC October 25, 2012 Roger Geller, Bicycle Coordinator Portland, OR
 Bicycle Corrals Portland 8-80 Designing Streets NYC October 25, 2012 Roger Geller, Bicycle Coordinator Portland, OR Build it and they will come 1990 2012 Build it better 2012 background With bike boxes
2017 North Texas Regional Bicycle Opinion Survey
 2017 North Texas Regional Bicycle Opinion Survey Sustainable Development Program Kevin Kokes, AICP Public Meetings April, 2018 North Central Texas Council of Governments MPO for the Dallas-Fort Worth Region
Evaluation of Innovative Bicycle Facilities:
 Evaluation of Innovative Bicycle Facilities: SW Broadway Cycle Track & SW Stark/Oak Street Buffered Bike Lanes FINAL REPORT Prepared for: City of Portland Bureau of Transportation by: Christopher Monsere,
Cycle Track Design Best Practices Cycle Track Sections
 Design Best Practices Sections It is along street segments where the separation and protection methods of cycle tracks offer more comfort than conventional bicycle lanes, and are more attractive to a wide
Protected Bike Lanes in San Francisco Mike Sallaberry SFMTA NACTO Workshop - Chicago IL
 Protected Bike Lanes in San Francisco Mike Sallaberry SFMTA 10 14 2011 NACTO Workshop - Chicago IL San Francisco 2 nd Highest Density in the U.S. 47 square miles Mild Climate Market Population ~810,000
Bicycle Facilities Planning
 Bicycle Facilities Planning Overview Types of Cyclists Purpose for Riding Types of Facilities Bike Lanes Bicycle Boulevards Cycle Tracks Intersections Signals Signing and Marking Discussion Types of Bicyclists
Lessons Learned from Cycle Tracks (Class IV Bikeways) Design Practice
 Design Practice") Lessons Learned from Cycle Tracks (Class IV Bikeways) Design Practice By: Min Zhou, P.E., Principal/Vice President KOA Corporation 1 What is a Cycle Track (Class IV) TYPICAL BIKEWAY CLASSIFICATION CLASS
Lessons Learned from Cycle Tracks (Class IV Bikeways) Design Practice By: Min Zhou, P.E., Principal/Vice President KOA Corporation 1 What is a Cycle Track (Class IV) TYPICAL BIKEWAY CLASSIFICATION CLASS
Pedestrian & Bicycle Safety Innovations & Applications
 Pedestrian & Bicycle Safety Innovations & Applications County Engineers Association of Maryland Spring, 2017 Conference May 25, 2017 George Branyan Pedestrian Program Coordinator District Department of
Toronto Complete Streets Guidelines
 88 90 5.1 Cycling Design Principles 92 5.2 Context-sensitive Cycling Facilities 96 5.3 Key Cycling Elements Cycling infrastructure provides choice in how people are able to move around the city. Cyclists
Northbound San Jose Avenue & I-280 Off-Ramp Road Diet Pilot Project
 Project Overview Fed by a two-lane Interstate-280 (I-280) off-ramp, high vehicular volumes and speeds are longstanding issues along San Jose Avenue. Residents in the surrounding neighborhoods have expressed
Driverless Vehicles Potential Influence on Bicyclist Facility Preferences
 Driverless Vehicles Potential Influence on Bicyclist Facility Preferences MICHAEL BLAU, MCRP, LCI O T E C O C T O B E R 2 6, 2 0 1 6 S E S S I O N # 8 2 - E V A L U AT I N G T H E P E R F O R M A N C E
Categorizing Cyclists: What Do We Know? Insights from Portland, OR
 Categorizing Cyclists: What Do We Know? Insights from Portland, OR Jennifer Dill, Ph.D. Professor, Urban Studies & Planning Director, Oregon Transportation Research & Education Consortium (OTREC) Portland
Bellevue Downtown Association Downtown Bike Series
 Bellevue Downtown Association Downtown Bike Series Meeting 2 Franz Loewenherz Andreas Piller Kyle Potuzak Chris Long October 26, 2017 Today s Agenda: 1) Meeting Purpose 2) 9/28 Meeting Recap 3) Candidate
Data Analysis February to March Identified safety needs from reported collisions and existing travel patterns.
 Welcome! Thank you for participating in today s Valencia Bikeway Improvements workshop. Data Analysis February to March Identified safety needs from reported collisions and existing travel patterns. Initial
Effective Pedestrian & Bicycle Safety Enforcement
 Effective Pedestrian & Bicycle Safety Enforcement August 29, 2013 George Branyan Pedestrian Program Coordinator District Department of Transportation Sgt. Terry Thorne Special Operations Division Metropolitan
Clybourn Ave. Protected Bike Lane Study Halsted St. to Division St.
 Clybourn Ave. Protected Bike Lane Study Halsted St. to Division St. Nathan Roseberry, Senior Engineer Pam Broviak, Project Manager July 24, 2014 Agenda Project Goals Existing Roadway Conditions Traffic
Richmond-Adelaide Cycle Tracks
 Public Drop-In Event Richmond-Adelaide Cycle Tracks June 25, 2018 12:00 p.m. 3:00 p.m. 4:30 p.m. 7:30 p.m. Metro Hall, Rotunda 55 John Street 1 Purpose of Event In Scope Communicate an update about the
Designing for Pedestrian Safety in Washington, DC
 Designing for Pedestrian Safety in Washington, DC February 25, 2014 George Branyan Pedestrian Program Coordinator District Department of Transportation DC Journey to work mode split: 2012 Means of Transportation
Active Transportation Facility Glossary
 Active Transportation Facility Glossary This document defines different active transportation facilities and suggests appropriate corridor types. Click on a facility type to jump to its definition. Bike
El Paso County 2040 Major Transportation Corridors Plan
 El Paso County 2040 Major Transportation Corridors Plan Connect-our-County Online Transportation User Survey Preliminary Results June 24, 2010 Years of Residence 2. How many years have you LIVED HERE?
Health, Transportation and Bicycling: Connecting the Dotted Lines
 Portland State University PDXScholar Urban Studies and Planning Faculty Publications and Presentations Nohad A. Toulan School of Urban Studies and Planning 11-17-2010 Health, Transportation and Bicycling:
Dr. M.L. King, Jr. Street North Complete Streets Resurfacing Opportunities HOUSING, LAND USE, AND TRANSPORTATION COMMITTEE MARCH 22, 2018
 Dr. M.L. King, Jr. Street North Complete Streets Resurfacing Opportunities HOUSING, LAND USE, AND TRANSPORTATION COMMITTEE MARCH 22, 2018 What s Happening The City plans to mill and resurface Dr. M.L.
Physical Implications of Complete Streets Policies
 Presentation Overview Physical Implications of Complete Norm Cox, ASLA, LLA Landscape Architect Ann Arbor, Michigan, 10:45 to Noon What Are Complete Streets? What Matters to Bicyclists and Pedestrians
Telegraph Avenue Complete Streets DRAFT Recommendations. Oakland Public Works Department September 11 and 13, 2014 Open Houses
 Telegraph Avenue Complete Streets DRAFT Recommendations Oakland Public Works Department September 11 and 13, 2014 Open Houses Presentation Overview What are complete streets? What problem are we trying
Winnipeg Walk Bike Projects Downtown Tire Talk - Summary
 Winnipeg Walk Bike Projects Downtown Tire Talk - Summary Downtown Projected Bike Lane System Connecting The Forks to the Exchange District (Fort Street, Garry Street & The Forks to Assiniboine Connection)
Planning Suburban Bike Networks
 Planning Suburban Bike Networks Stacey Meekins, AICP 28 October, 2015 Bikeway design guidance Different Cyclists Have Different Needs No interest 33% Strong and Fearless 1% Enthused and Confident 7% Interested,
Simulation Analysis of Intersection Treatments for Cycle Tracks
 Abstract Simulation Analysis of Intersection Treatments for Cycle Tracks The increased use of cycle tracks also known as protected bike lanes has led to investigations of how to accommodate them at intersections.
 Community and Business Outreach November 2015 Goal #1: Improve safety in the corridor Goal #2: Make a more livable corridor Goal #3: Improve mobility for all Data Collection Alternatives Recommendations
PBIC Webinar. How to Create a Bicycle Safety Action Plan: Planning for Safety [IMAGE] Oct. 2, 2014, 2 pm
![PBIC Webinar. How to Create a Bicycle Safety Action Plan: Planning for Safety [IMAGE] Oct. 2, 2014, 2 pm](/thumbs/86/93953441.jpg "PBIC Webinar. How to Create a Bicycle Safety Action Plan: Planning for Safety [IMAGE] Oct. 2, 2014, 2 pm") PBIC Webinar How to Create a Bicycle Safety Action Plan: Planning for Safety [IMAGE] Bill Schultheiss, Vice President, Toole Design Peter Lagerwey, Regional Director, Toole Design Oct. 2, 2014, 2 pm Today
PBIC Webinar How to Create a Bicycle Safety Action Plan: Planning for Safety [IMAGE] Bill Schultheiss, Vice President, Toole Design Peter Lagerwey, Regional Director, Toole Design Oct. 2, 2014, 2 pm Today
Appendix C. TRAFFIC CALMING PROGRAM TOOLBOX
 Appendix C. TRAFFIC CALMING PROGRAM TOOLBOX PHASE I...2 Do Not Enter Sign...3 One-Way Sign...4 Turn Prohibition...5 Pavement Markings...6 Speed Monitoring Trailer...7 Neighborhood Speed Watch...8 Police
SPEED MANAGEMENT FOR VISION ZERO
 SPEED MANAGEMENT FOR VISION ZERO LUANN HAMILTON, DEPUTY COMMISSIONER FOR PROJECT DEVELOPMENT CHICAGO DEPARTMENT OF TRANSPORTATION NACTO DESIGNING CITIES 2017 Vision Zero Action Plan Speed management and
Shared Lane Markings: When and Where to Use Them. Mike Sallaberry, SFMTA Pro Walk/Pro Bike in Seattle September 4, 2008
 Shared Lane Markings: When and Where to Use Them Mike Sallaberry, SFMTA Pro Walk/Pro Bike in Seattle September 4, 2008 San Francisco Bicycle Route Network Bike Network: 208 Total Miles 31 Miles of Bike
Overview. Illinois Bike Summit IDOT Complete Streets Policy Presentation. What is a Complete Street? And why build them? And why build them?
 Overview Illinois Bike Summit IDOT Complete Streets Policy Presentation Aren Kriks, P.E. District One Bicycle Coordinator and Bureau of Programming Project Engineer History of Complete Streets IDOT Policy
FEDERAL HIGHWAY ADMINISTRATION APPLICATION
 FEDERAL HIGHWAY ADMINISTRATION APPLICATION REQUEST FOR PERMISSION TO EXPERIMENT WITH A BICYCLE BOX INTERSECTION TREATMENT Submitted by: City of Columbus Department of Public Service Date: June 26, 2009
Monterey Road Complete Streets
 Monterey Road Complete Streets Complete Street Objectives Improve livability and economic vitality Enhance pedestrian environment Accommodate bicyclists safely Reduce noise and air pollution Create attractive,
The Wiggle Route in Context
 The Wiggle Route in Context In a city of hills, the Wiggle is an important route because it winds its way along the flattest streets from Market to the Panhandle, bringing residents to local parks and
Multimodal Analysis in the 2010 Highway Capacity Manual
 Multimodal Analysis in the 2010 Highway Capacity Manual It s not just cars anymore! Jamie Parks, AICP HCAT Conference May 9-10, 2011 Multimodal LOS in the 2010 HCM History and background Overview of methods
When composing the study, our primary source for content analysis was a study
 Denise Arriaga Ibarra Natalie Garcia Vincente Velasco Victor Estrada Jonathan Marin Ignacio Alcaraz Cal Poly Pomona Cyclist Population When composing the study, our primary source for content analysis
Guidance. ATTACHMENT F: Draft Additional Pages for Bicycle Facility Design Toolkit Separated Bike Lanes: Two-Way to One-Way Transitions
 ATTACHMENT F: Draft Additional Pages for Bicycle Facility Design Toolkit Separated Bike Lanes: Two-Way to One-Way Transitions This treatment provides a transition from two-way separated bike lanes to one-way
LANCASTER CITY BICYCLE NETWORK
 LANCASTER CITY BICYCLE NETWORK Downtown Merchants Meeting Wednesday, July 19, 2017 http://www.lancasteratp. DOWNTOWN WALKABILITY ANALYSIS What changes can be made, in the least amount of time, and for
THE OFFICIAL GUIDE TO CYCLING SAFELY IN PHILADELPHIA
 B IKE NICE THE OFFICIAL GUIDE TO CYCLING SAFELY IN PHILADELPHIA A partnership of the City of Philadelphia and the Bicycle Coalition of Greater Philadelphia ABOUT VISION ZERO & BIKE NICE It s a great day
Lessons from Copenhagen. John L Bowman 2013
 Lessons from Copenhagen John L Bowman 2013 Bicycle Strategy Official municipal policy Goals for the next 15 years Updated after 5-10 years 32 page glossy brochure BAC December 2, 2013 John L Bowman 2 Bicycle
Who is Toole Design Group?
 2018 AASHTO Bike Guide Status Update NCHRP 15 60 Amalia Leighton Cody, PE, AICP & Kenneth Loen, PE Washington APWA October 4, 2018 Who is Toole Design Group? TDG is a full service engineering, planning
G AT E WAY PLAN. Community BRIEFING KIT GATEWAY BIKE
 G AT E WAY PLAN GATEWAY BIKE Community BRIEFING KIT PLAN August 2016 TABLE OF CONTENTS INTRODUCTION... 1 THE BENEFITS OF A BIKEABLE COMMUNITY... 2 ECONOMY...2 SAFETY...3 HEALTH...3 HOUSEHOLD SPENDING...3
A Survey of Planning, Design, and Education for Bikeways and Bus Routes on Urban Streets
 A Survey of Planning, Design, and Education for Bikeways and Bus Routes on Urban Streets, Community & Economic Development Agency, Transportation Services Division (510) 238-3983 bikeped@oaklandnet.com
2018 AASHTO BIKE GUIDE
 2018 AASHTO BIKE GUIDE Your presenter Rob Burchfield, PE NW Regional Engineering Director 35 years of experience in traffic engineering and bicycle facility design Toole Design Group Toole Design Group
PEDALING FORWARD. A Glance at the SFMTA s Bike Program for SFMTA.COM
 PEDALING FORWARD A Glance at the SFMTA s Bike Program for 2017-2021 SFMTA.COM INTRODUCTION About This Booklet More people from all walks of life see their bicycle as a more convenient way to get where
9/25/2018. Multi-Modal Level of Service (MMLOS) Bianca Popescu, Transportation Planner
 Bianca Popescu, Transportation Planner") Multi-Modal Level of Service (MMLOS) Bianca Popescu, Transportation Planner 1 What is MMLOS? Is this a nice place to walk? Is this a nice place to bike? Is transit convenient? Bottom line - Are there options
Multi-Modal Level of Service (MMLOS) Bianca Popescu, Transportation Planner 1 What is MMLOS? Is this a nice place to walk? Is this a nice place to bike? Is transit convenient? Bottom line - Are there options
Complete Streets Chicago: Data Driven Design. Luann Hamilton Deputy Commissioner
 Complete Streets Chicago: Data Driven Design Luann Hamilton Deputy Commissioner AGENDA Chicago s goals Complete Streets & Sustainable Infrastructure Guides Data-Driven Planning Setting goals Scoping/research
FLETCHER AVENUE PEDESTRIAN AND BICYCLIST BEHAVIOR CHANGE FORMATIVE RESEARCH PROJECT
 FLETCHER AVENUE PEDESTRIAN AND BICYCLIST BEHAVIOR CHANGE FORMATIVE RESEARCH PROJECT EXTENT OF CHANGES IN PEDESTRIAN AND BICYCLIST ATTITUDES AND BEHAVIORS DIRECTLY AFTER A COMPLETE STREETS PROJECT IN FLORIDA
Bike lanes for. Everyone
 Bike lanes for Everyone Goal: To increase the people riding bicycles as a normal part of every day life People riding bicycles as a normal part of every day life Regardless of age, gender, and social /
Community & Transportation Preferences Survey
 Community & Transportation Preferences Survey Webinar: August 5, 2015 Hugh Morris, AICP, LEED Realtor.org Jennifer Dill, Ph.D. trec.pdx.edu 1 Introduction National Association of Realtors Over 1,000,000
Freeway ramp intersection study
 Freeway ramp intersection study Supporting Vision Zero: Zero traffic deaths in San Francisco by 2024 Study Goals: Primary Improve Safety Improve Accessibility Secondary Provide Efficient Circulation Accommodate
The Traffic Monitoring Guide: Counting Bicyclists and Pedestrians. APBP 2017 June 28: 11:15am-12:45pm
 The Traffic Monitoring Guide: Counting Bicyclists and Pedestrians APBP 2017 June 28: 11:15am-12:45pm 2 Presentation Organization Why count bicyclists and pedestrians? Why report count data? What resources
Safer Cycling: How the City of Vancouver is Proactively Improving Cycling Safety
 Safer Cycling: How the City of Vancouver is Proactively Improving Cycling Safety Brian Patterson, MCIP, RPP Urban Systems 2015 Canadian Association of Road Safety Professionals (CARSP) Conference Session
Rolling Out New Bike Facilities Within the North Bethesda & White Flint Area
 Rolling Out New Bike Facilities Within the North Bethesda & White Flint Area Rolling Out New Bike Facilities Within the North Bethesda & White Flint Area Agenda Designing for all Cyclists Background on
Effective Pedestrian & Bicycle Safety Enforcement
 Effective Pedestrian & Bicycle Safety Enforcement October 20, 2011 George Branyan Pedestrian Program Coordinator District Department of Transportation Increasingly multi-modal region Change in Daily Trip
Data Analysis February to March Identified safety needs from reported collisions and existing travel patterns.
 Welcome! Thank you for participating in today s Valencia Bikeway Improvements workshop. Data Analysis February to March Identified safety needs from reported collisions and existing travel patterns. Initial
Rightsizing Streets: The Seattle Experience
 Rightsizing Streets: The Seattle Experience April 30, 2013 Brian Dougherty Seattle Department of Transportation Complete Streets 16% of households do not have a car Seniors Youth Transit riders Safety
Seattle Bicycle Advisory Board August 3, 2011
 First Hill Streetcar Project Seattle Bicycle Advisory Board August 3, 2011 S teve Durrant Alta Planning + Des ign Mark Dorn UR S J im Peters DK S Context First Hill Cycle Track Key Strategies Segment 1
Central Avenue Bikeway Traffic and Safety Impact Assessment
 FEBRUARY 2018 Lead Agency: San Diego Association of Governments (SANDAG) 401 B Street, Suite 800 San Diego, CA 92101 Contact: Chris Carterette, AICP, Project Manager 619.699.7319 chris.carterette@sandag.org
Bicycle and Pedestrian Connectivity Study. Old Colony Planning Council
 Bicycle and Pedestrian Connectivity Study Old Colony Planning Council Outline Why consider bike/peds in road designs? Why are measures needed? Connecting Land Use with Transportation Evaluation Tools:
25th Avenue Road Diet Project A One Year Evaluation. Transportation Fund for Clean Air Project #05R07
 25th Avenue Road Diet Project A One Year Evaluation Transportation Fund for Clean Air Project #05R07 Submitted by: The San Francisco Municipal Transportation Agency Dan Provence May 22, 2009 EXECUTIVE
City of Wilsonville 5 th Street to Kinsman Road Extension Project
 City of Wilsonville 5 th Street to Kinsman Road Walking Tour & Neighborhood Workshop Summary Report Public Outreach Overview On July 18 th, 2017, the City of Wilsonville hosted a neighborhood walking tour
Laurier Segregated Bike Lane Pilot Project July 2013 update
 Laurier Segregated Bike Lane Pilot Project July 2013 update Presentation Overview Background Pilot Monitoring Results Mitigation Recommendations Next Steps Laurier 2 Background Laurier Avenue Segregated
MTP BICYCLE ELEMENT UPDATE. November 2017
 MTP BICYCLE ELEMENT UPDATE November 2017 TIME FOR AN UPDATE Bicycle Element adopted in July 2008 Almost 10 years old Many planned facilities have been implemented 10 years more experience in planning,
Broad Street Bicycle Boulevard Design Guidelines
 Broad Street Bicycle Boulevard Design Guidelines Building from the strategies introduced in the 2013 Bicycle Transportation Plan and community input received thus far, City Transportation Staff have identified
Cycle Tracks: Concept and Design Practices. February 17, 2010
 Cycle Tracks: Concept and Design Practices February 17, 2010 Today s webinar presenters APBP Board Member Host Brett Hondorp, Principal, Alta Planning + Design Guest Moderator Zach Vanderkooy, Bicycling
A Level-of-Service Model for Protected Bike Lanes
 Portland State University PDXScholar Civil and Environmental Engineering Faculty Publications and Presentations Civil and Environmental Engineering -0 A Level-of-Service Model for Protected Bike Lanes
10TH & 13TH STREET ROADWAY RECONFIGURATION & PROTECTED BICYCLE LANE PROJECTS
 10TH & 13TH STREET ROADWAY RECONFIGURATION & PROTECTED BICYCLE LANE PROJECTS GOALS & OBJECTIVES Create high quality bicycle network in Center City Reconfi gure the parking and loading layout to meet the
Today. Develop Plans. Public Listening Session
 Welcome! 1. Share Existing Conditions and Data 2. Share Details of Proposed Project 3. Gather Feedback from Public M Ju ee ly tin 17 g D th a, 2 te 01 : 7 Meeting Purpose and 26th Street Project Timeline
2014/2015 BIKE ROUTE PLAN 83 AVENUE PROTECTED BIKE LANE
 About the Project The City of Edmonton is planning a major bike route on the southside of Edmonton. The Strathcona Bike Route will connect the communities of Strathcona, Garneau and the University area,
Stress Bikeway Network
 Building Portland s Low- Stress Bikeway Network Photo credit: Michael Anderson Bikeportland.org Designing Streets 2015 Austin, TX October 29 2015 Roger Geller Portland Background Existing low- and lower-stress
Welcome! San Jose Avenue Open House August 25, 2015
 Welcome! San Jose Avenue Open House August 25, 2015 Vision Zero The City and County of San Francisco adopted Vision Zero San Francisco Vision Zero High Injury Network as a policy in 2014, committing an
Dear Mr. Tweed: Sincerely, Min Zhou, P.E. Vice President
 December 17, 2012 Mr. Steve Tweed City of Long Beach, Department of Public Works Traffic & Transportation Bureau, 10 th Floor City Hall 333 West Ocean Boulevard Long Beach, CA 90802 Subject: Broadway and
ABOUT THIS STUDY The Tenderloin-Little Saigon Community-Based Transportation Plan
 ABOUT THIS STUDY The Tenderloin-Little Saigon Community-Based Transportation Plan The Greater Tenderloin Community Study Milestones October Community based organizations (Tenderloin Housing Clinic and
FELL STREET AND MASONIC AVENUE INTERSECTION SURVEY REPORT
 FELL STREET AND MASONIC AVENUE INTERSECTION SURVEY REPORT City and County of San Francisco Municipal Transportation Agency Bicycle Program October 2005 Background The intersection of Fell Street with Masonic
Planning Guidance in the 2012 AASHTO Bike Guide
 Planning Guidance in the 2012 AASHTO Bike Guide Presentation by: RJ Eldridge Peter Lagerwey August 22, 2012 WEBINAR 2: PLANNING GUIDANCE IN THE 2012 AASHTO BIKE GUIDE Today s Webinar Significant Updates
North Park Mid-City Bikeways Project: Traffic and Safety Impact Assessment
 FINAL REPORT North Park Mid-City Bikeways Project: University Bikeway Traffic and Safety Impact Assessment April 23, 2018 Lead Agency: San Diego Association of Governments (SANDAG) 401 B Street, Suite
FRENCH AMERICAN INTERNATIONAL SCHOOL 1155 PAGE STREET TRANSPORTATION PROCEDURES August 2018
 FRENCH AMERICAN INTERNATIONAL SCHOOL 1155 PAGE STREET TRANSPORTATION PROCEDURES August 2018 In an effort to enhance safety, prevent neighborhood congestion, and provide improved security for students,
A Traffic Operations Method for Assessing Automobile and Bicycle Shared Roadways
 A Traffic Operations Method for Assessing Automobile and Bicycle Shared Roadways A Thesis Proposal By James A. Robertson Submitted to the Office of Graduate Studies Texas A&M University in partial fulfillment
Designing Streets for Transit. Presentation to NACTO Designing Cities Kevin O Malley Managing Deputy Commissioner 10/24/2014
 Designing Streets for Transit Presentation to NACTO Designing Cities Kevin O Malley Managing Deputy Commissioner 10/24/2014 Chicago -- Streets for Transit TODAY Jeffery Jump Transit Signal Priority Central
Bicycling Perceptions and Experiences in Oregon and Southwest Washington. Presented to: The Bicycle Transportation Alliance September 8, 2009
 Bicycling Perceptions and Experiences in Oregon and Southwest Washington Presented to: The Bicycle Transportation Alliance September 8, 2009 404 NW 10th Ave Suite 201 Portland, OR 97209 P 800.921.2640
Design Guidance for Bicycle Lane Widths
 Fees et al. 1 1 2 3 Design Guidance for Bicycle Lane Widths Chris A. Fees (Corresponding Author) Staff Traffic Engineer MRIGlobal 425 Volker Boulevard Kansas City, MO 64110 Phone: (816) 326-5435 E-mail:
The DC Pedestrian Master Plan
 The DC Pedestrian Master Plan September 28, 2010 George Branyan Pedestrian Program Coordinator District Department of Transportation Presentation Agenda Scope of the Plan Methodology Recommendations Implementation
Bridgewater Complete Streets Prioritization Plan and Pedestrian Safety Assessment
 Bridgewater Complete Streets Prioritization Plan and Pedestrian Safety Assessment Presented by Luciano Rabito Manager of Complete Streets Presented to Bridgewater, MA Wednesday, April 26, 2017 6:30 P.M.
Bicycling Perceptions and Experiences in Oregon and Southwest Washington. Presented By: The Inavero Institute September 8, 2009
 Bicycling Perceptions and Experiences in Oregon and Southwest Washington Presented By: The Inavero Institute September 8, 2009 404 NW 10th Ave Suite 201 Portland, OR 97209 P 800.921.2640 www.inavero.com
A Insert design-related public comment here.
 Design Guidelines A Insert design-related public comment here. - Public Comment, 2016 This regional plan focuses on connecting regional nodes, such as Wilmington, NC (Gary Shell Cross-City Trail shown
MASONIC AVENUE STREET DESIGN STUDY Community Workshop 3. Masonic Ave Street Design Study Community Workshop 3 September 30, 2010
 Masonic Ave Street Design Study Community Workshop 3 September 30, 2010 Introduction MASONIC AVENUE STREET DESIGN STUDY Community Workshop 3 SF Municipal Transportation Agency Javad Mirabdal, Project Manager
MEET IN THE STREET MOVING TO ZERO
 WE MEET IN THE STREET MOVING TO ZERO Tips for sharing the street Traffic deaths are preventable. We need your help getting the message out. 2 A NEW PLAN A NEW PLAN Philadelphia is proud to adopt Vision