Using GPS Data for Arterial Mobility Performance Measures
|
|
|
- Mervin Nelson
- 6 years ago
- Views:
Transcription


1 Using GPS Data for Arterial Mobility Performance Measures Paul Czech, MnDOT Shawn Turner, TTI CTS Research Conference May 22, 2014 ~ St. Paul, MN
2 Methodology & Results INRIX GPS Data + = Road Inventory Data in GIS: - Func Class - Traffic Volume - Etc
3 Takeaways 1. Private sector probe travel time data 2. Context-sensitive targets on arterials
4 Private sector probe travel times Multiple providers, competitive marketplace Low relative cost - $23k per year for Metro area (historical, not real-time) Travel times are foundational data Mobility, accessibility, economic, etc. Potential to capture multiple modes in future

5 Context-sensitive targets Reflect sliding scale role of mobility for arterial streets in different land use contexts For example, urban streets vs. surburban / exurban highways

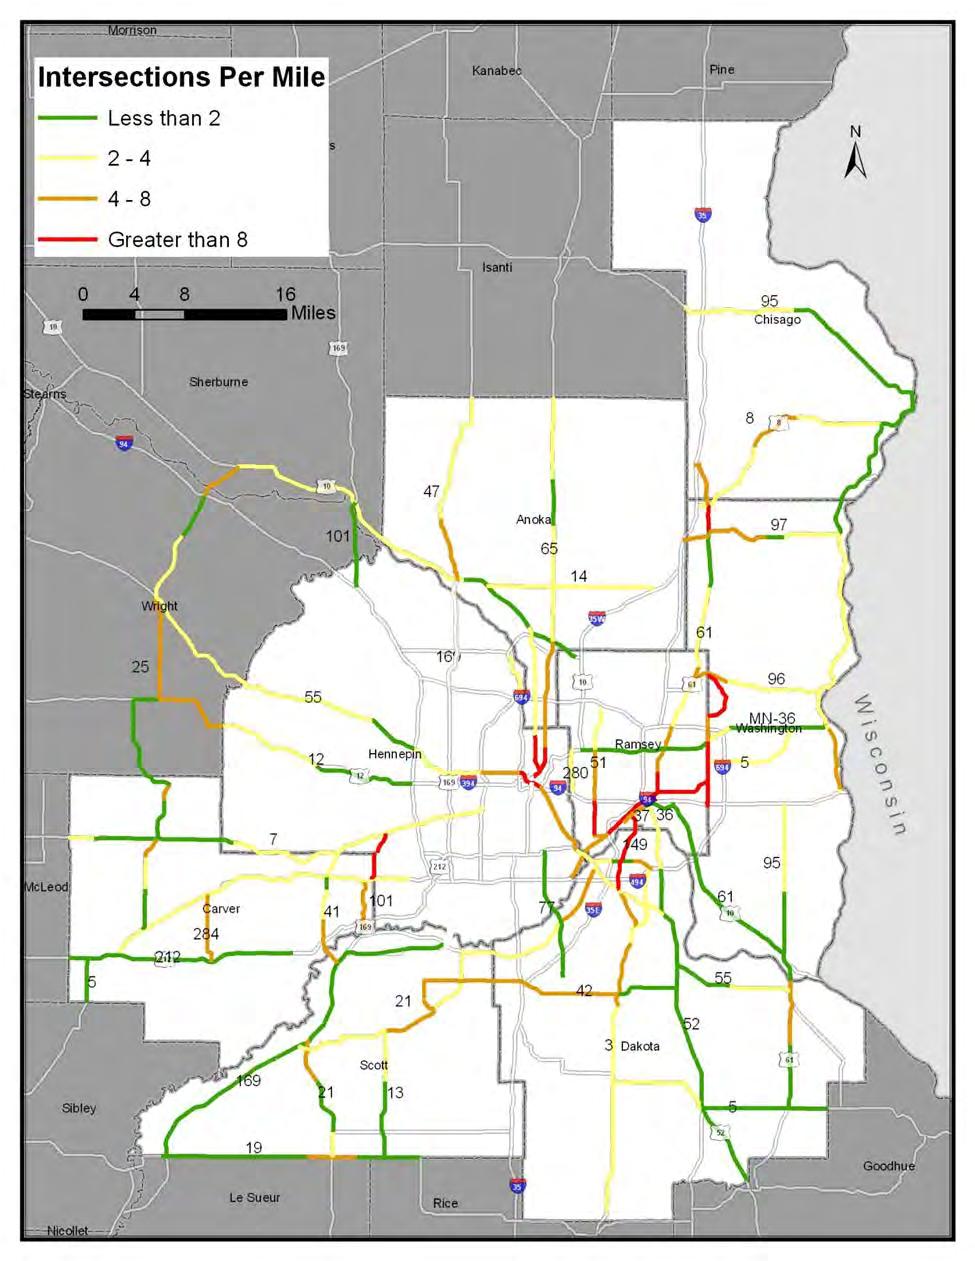
6 Context-sensitive targets How to quantify land use context? Ultimately settled on intersection density Could also be based on policy
7 Context-sensitive targets Slower speed targets in urban, multi-modal contexts (existing or planned) Intersection Density (intersections per mile) Target Value = % of Daytime Uncongested Speed Less than to 8 80 More than 8 70 Vehicle speed only one of multiple MOEs
8 For More Info Paul Czech, MnDOT Project Director Shawn Turner, TTI
9
10 Performance Measures Calculations Three mobility performance measures were calculated for the MnDOT arterial network at different spatial and temporal levels: Segment by Direction Corridor System-wide Mobility performance measures reported: Delay Travel Time Index (TTI) Planning Time Index (PTI)
11 All Directional Arterial Segments by Annual Delay Per Mile Results (Daytime Light Traffic)
12 All Directional Arterial Segments by Annual Target Delay Per Mile Results (Target Values based upon Intersection Density)
13 Top 20 Congested Arterial Segments by Annual Delay Per Mile Results (Daytime Light Traffic)
14 Top 20 Congested Directional Arterial Segments by Annual Target Delay per Mile Results (Target Values based upon Intersection Density)
15 All Directional Arterial Segments in the Morning Peak (6-9am) by Travel Time Index Results (Daytime Light Traffic)
16 All Directional Arterial Segments in the Evening Peak (4-7am) by Travel Time Index Results (Daytime Light Traffic)
17 Top 20 Congested Directional Arterial Segments in the Morning Peak (6-9am) by Travel Time Index Results (Daytime Light Traffic)
18 Top 20 Congested Directional Arterial Segments in the Evening Peak (4-7pm) by Travel Time Index Results (Daytime Light Traffic)
19 All Directional Arterial Segments in the Morning Peak (6-9am) by Planning Time Index Results (Daytime Light Traffic)
20 All Directional Arterial Segments in the Evening Peak (4-7pm) by Planning Time Index Results (Daytime Light Traffic)
21 Top 20 Unreliable Directional Arterial Segments in the Morning Peak (6-9am) by Planning Time Index Results (Daytime Light Traffic)
22 Top 20 Unreliable Directional Arterial Segments in the Evening Peak (4-7pm) by Planning Time Index Results (Daytime Light Traffic)
23 System-wide Results Length of Arterial System: 1,764 miles Total Annual Delay: 7.6 million person-hours Peak Period Delay: 3.8 million person-hours Total Annual Target Delay: 4.1 million person-hours Average Delay per Mile: 4,301 person-hours/mile Average Target Delay per Mile: 2,308 person-hours/mile AM Peak Travel Time Index: 1.07 PM Peak Travel Time Index: 1.08 AM Peak Planning Time Index: 1.36 PM Peak Planning Time Index: 1.41
24
25 Background MnDOT is a performance based organization that uses a variety of measures to track performance including mobility Principal arterial (freeway) measures have been developed and utilized for a number of years Arterial (non-freeway) measures are less developed but needed

26 Background (Freeways) Comprehensive system of inpavement loop detectors and data recorders allows MnDOT to measure performance in several ways: Real-time speeds Recurring congestion Recurring Congestion Speed data is recorded and analyzed for patterns Data is presented in several formats in the annual Metro Freeway Congestion Report
27 Background (non-freeways) Mobility performance measures have NOT been extensively developed on the non-freeway portions of the system (i.e. major signalized arterials) Many of MnDOTs signalized arterials do not have inplace hardware to allow for comprehensive performance data collection similar to freeways The collection of GPS data appears to be a viable costeffective method to support the development of certain arterial street performance measures
28 The Study MnDOT, in consultation with the Metropolitan Council, commissioned a study: Developing Twin Cities Arterial Mobility Performance Measures Using GPS Speed Data Partnered with the Texas Transportation Institute Utilized INRIX private sector speed data Identify illustrative system and corridor level performance measures and targets
29 Scope of Work Procure GPS Travel Time data Review mobility performance measures in MnDOT policy documents and elsewhere Develop arterial street mobility performance measures and supporting analytical process Document the study methods and findings in a final project report
30 Define the network 8-County Metro Area plus a few selected corridors in adjacent counties GIS database of MnDOT non-freeway arterials Some freeway sections added for reference

31 Methodology GPS Data + INRIX Data Set GIS Data
32 Methodology Arterial system categorized into segments for performance reporting purposes that combined multiple MnDOT GIS links with the following characteristics: One travel direction only; Similar cross-section design (e.g., number of lanes, type of land use, etc.); Similar operational characteristics (e.g., traffic volumes, speeds, and queuing); Approximately 2 to 5 miles in urban areas, as long as 8 to 10 miles in suburban or developing areas; Terminates at major cross streets, interchanges, or other traffic generators

33 Methodology Map of Defined Corridors
34 Map Methodology of Segments
35 Methodology Performance Measures Mobility performance measures recommended for arterial streets: Person-based congestion delay per mile, peak period and daily total Percent (%) of free-flow speed (or its inverse, travel time index) Reliability, expressed as 80 th percentile travel time index or % of trips exceeding travel time index of 2.50
36 Methodology Performance Measures Need to have a congestion definition that separates quantitative measurement from travelers perceptions This can be accomplished by defining congestion and unacceptable congestion: Congestion travel time or delay in excess of that normally incurred under light or free-flow travel conditions. Unacceptable Congestion travel time or delay in excess of an agreed-upon norm [or target value]. The agreed-upon norm may vary by type of transportation facility, geographic location, and time of day
37 Methodology Performance Measures Intersection Density reflecting both land use context and street functional class were combined into a single attribute Sub-categories of intersection density were based on MnDOT s Access Management policy: Less than 2 intersections per mile 2 to 4 intersections per mile 4 to 8 intersections per mile Greater than 8 intersections per mile
38
39 Methodology Performance Measures The base light or free-flow speed as defined in the 2010 Highway Capacity Manual is the prevailing light traffic speed with NO traffic control Values were adjusted to account for signal delay (these can be adjusted) Table 3-2. Performance Measure Target Values Based on Intersection Density Intersection Density Target Value = (intersections per mile) Percent of Prevailing Light Traffic Speed Less than to to 8 85 More than 8 75
40 Performance Measures Calculations Three mobility performance measures were calculated for the MnDOT arterial network at different spatial and temporal levels: Segment by Direction Corridor System-wide Mobility performance measures reported: Delay Travel Time Index (TTI) Planning Time Index (PTI)
41 All Directional Arterial Segments by Annual Delay Per Mile Results (Daytime Light Traffic)
42 All Directional Arterial Segments by Annual Target Delay Per Mile Results (Target Values based upon Intersection Density)

43 Top 20 Congested Arterial Segments by Annual Delay Per Mile Results (Daytime Light Traffic)

44 Top 20 Congested Directional Arterial Segments by Annual Target Delay per Mile Results (Target Values based upon Intersection Density)
45 All Directional Arterial Segments in the Morning Peak (6-9am) by Travel Time Index Results (Daytime Light Traffic)
 by Travel Time Index Results (Daytime Light")
46 All Directional Arterial Segments in the Evening Peak (4-7am) by Travel Time Index Results (Daytime Light Traffic)
 by Travel Time Index Results (Daytime Light")
47 Top 20 Congested Directional Arterial Segments in the Morning Peak (6-9am) by Travel Time Index Results (Daytime Light Traffic)
 by Travel Time Index Results (Daytime Light")
48 Top 20 Congested Directional Arterial Segments in the Evening Peak (4-7pm) by Travel Time Index Results (Daytime Light Traffic)
49 All Directional Arterial Segments in the Morning Peak (6-9am) by Planning Time Index Results (Daytime Light Traffic)
50 All Directional Arterial Segments in the Evening Peak (4-7pm) by Planning Time Index Results (Daytime Light Traffic)
51 Top 20 Unreliable Directional Arterial Segments in the Morning Peak (6-9am) by Planning Time Index Results (Daytime Light Traffic)
52 Top 20 Unreliable Directional Arterial Segments in the Evening Peak (4-7pm) by Planning Time Index Results (Daytime Light Traffic)
53 System-wide Results Length of Arterial System: 1,764 miles Total Annual Delay: 7.6 million person-hours Peak Period Delay: 3.8 million person-hours Total Annual Target Delay: 4.1 million person-hours Average Delay per Mile: 4,301 person-hours/mile Average Target Delay per Mile: 2,308 person-hours/mile AM Peak Travel Time Index: 1.07 PM Peak Travel Time Index: 1.08 AM Peak Planning Time Index: 1.36 PM Peak Planning Time Index: 1.41
54 Conclusions and recommendations Private sector data providers are a viable source of travel speed data for mobility performance monitoring on arterial streets Mobility performance measures for arterial streets should be travel speed-based measures that compare peak traffic speeds to speeds during light traffic, recognizing that the light traffic speed is not a target value but simply a reference point for performance measures Performance measure target values can be context-sensitive and based on surrounding land use Ideally, multiple performance measures should be used to quantify and monitor mobility on arterial streets The exact mobility performance measures and target values are likely to evolve and be refined as MnDOT and partner agencies gain experience in performance monitoring on arterial streets
55 Questions? Thank you!
Performance Measure Summary - San Jose CA. Performance Measures and Definition of Terms
 Performance Measure Summary - San Jose CA There are several inventory and performance measures listed in the pages of this Urban Area Report for the years from 1982 to 2014. There is no single performance
Performance Measure Summary - Chicago IL-IN. Performance Measures and Definition of Terms
 Performance Measure Summary - Chicago IL-IN There are several inventory and performance measures listed in the pages of this Urban Area Report for the years from 1982 to 2014. There is no single performance
National Capital Region Congestion Report
 NATIONAL CAPITAL REGION TRANSPORTATION PLANNING BOARD National Capital Region Congestion Report 2nd Quarter 2015 Metropolitan Washington Council of Governments 777 North Capitol Street, N.E., Suite 300,
Performance Measure Summary - Denver-Aurora CO. Performance Measures and Definition of Terms
 Performance Measure Summary - Denver-Aurora CO There are several inventory and performance measures listed in the pages of this Urban Area Report for the years from 1982 to 2014. There is no single performance
100 Most Congested Roadways in Texas
 100 Most Congested Roadways in Texas 2017 EXECUTIVE SUMMARY In response to increased roadway congestion throughout the state, in 2009 the Texas Legislature mandated that the Texas Department of Transportation
3 ROADWAYS 3.1 CMS ROADWAY NETWORK 3.2 TRAVEL-TIME-BASED PERFORMANCE MEASURES Roadway Travel Time Measures
 ROADWAYS Approximately 6 million trips are made in the Boston metropolitan region every day. The vast majority of these trips (80 to percent, depending on trip type) involve the use of the roadway network
Maryland State Highway Mobility Report. Morteza Tadayon
 Maryland State Highway Mobility Report Morteza Tadayon Background Mobility is a Key Performance Area (KPA) in the SHA Business Plan SHA adopts a performance based approach Monitors Highway System to identify
100 Most Congested Roadways in Texas
 100 Most Congested Roadways in Texas 2018 Report EXECUTIVE SUMMARY In response to increased roadway congestion throughout the state, in 2009 the Texas Legislature mandated that the Texas Department of
National Capital Region Congestion Report
 NATIONAL CAPITAL REGION TRANSPORTATION PLANNING BOARD National Capital Region Congestion Report 4th Quarter 2015 Metropolitan Washington Council of Governments 777 North Capitol Street, N.E., Suite 300,
Concurrent Monitoring, Analysis, and Visualization of Freeway and Arterial Performance for Recurring and Non-recurring Congestion
 Concurrent Monitoring, Analysis, and Visualization of Freeway and Arterial Performance for Recurring and Non-recurring Congestion For Presentation at the NATMEC 2010 Session on: Congestion Monitoring and
MONTGOMERY COUNTY PLANNING DEPARTMENT THE MARYLAND-NATIONAL CAPITAL PARK AND PLANNING COMMISSION
 MONTGOMERY COUNTY PLANNING DEPARTMENT THE MARYLAND-NATIONAL CAPITAL PARK AND PLANNING COMMISSION MCPB Item No. 4 Date: 04-17-14 2014 Mobility Assessment Report José Dory, Senior Planner, Functional Planning
CHAPTER 8 APPLICATION AND INTERPRETATION OF CONGESTION MEASURES
 CHAPTER 8 APPLICATION AND INTERPRETATION OF CONGESTION MEASURES Chapter Summary The focus of this chapter is to provide the reader with practical applications and interpretation of the congestion measures
2009 URBAN MOBILITY REPORT: Six Congestion Reduction Strategies and Their. Effects on Mobility
 2009 URBAN MOBILITY REPORT: Six Congestion Reduction Strategies and Their Effects on Mobility David Schrank Associate Research Scientist and Tim Lomax Research Engineer Texas Transportation Institute The
2015 Urban Mobility Scorecard. Scott Weber, Transportation Planner & Analyst James Winters, Regional Planner & Policy Analyst
 2015 Urban Mobility Scorecard Scott Weber, Transportation Planner & Analyst James Winters, Regional Planner & Policy Analyst Introduction 1. Congestion Trends 2. Compounding Problems 3. Possible Solutions
I-105 Corridor Sustainability Study (CSS)
") I-105 Corridor Sustainability Study (CSS) Metro Streets and Freeways Subcommittee March 21, 2019 Gary Hamrick Cambridge Systematics, Inc. I-105 CSS Project History & Background Funded by Caltrans Sustainable
I-105 Corridor Sustainability Study (CSS) Metro Streets and Freeways Subcommittee March 21, 2019 Gary Hamrick Cambridge Systematics, Inc. I-105 CSS Project History & Background Funded by Caltrans Sustainable
City of Wayzata Comprehensive Plan 2030 Transportation Chapter: Appendix A
 A1. Functional Classification Table A-1 illustrates the Metropolitan Council s detailed criteria established for the functional classification of roadways within the Twin Cities Metropolitan Area. Table
Subject: Solberg Avenue / I-229 Grade Separation: Traffic Analysis
 MEMORANDUM Transportation Bill Troe, AICP Jason Carbee, AICP 12120 Shamrock Plaza Suite 300 Omaha, NE 68154 (402) 334-8181 (402) 334-1984 (Fax) To: Project File Date: Subject: Solberg Avenue / I-229 Grade
METHODOLOGY. Signalized Intersection Average Control Delay (sec/veh)
") Chapter 5 Traffic Analysis 5.1 SUMMARY US /West 6 th Street assumes a unique role in the Lawrence Douglas County transportation system. This principal arterial street currently conveys commuter traffic
Chapter 5 Traffic Analysis 5.1 SUMMARY US /West 6 th Street assumes a unique role in the Lawrence Douglas County transportation system. This principal arterial street currently conveys commuter traffic
City of Homewood Transportation Plan
 City of Homewood Transportation Plan Prepared for: City of Homewood, Alabama Prepared by: Skipper Consulting, Inc. May 2007 TABLE OF CONTENTS INTRODUCTION... 1 BACKGROUND INFORMATION... 1 EXISTING TRANSPORTATION
Planning Daily Work Trip under Congested Abuja Keffi Road Corridor
 ISBN 978-93-84468-19-4 Proceedings of International Conference on Transportation and Civil Engineering (ICTCE'15) London, March 21-22, 2015, pp. 43-47 Planning Daily Work Trip under Congested Abuja Keffi
5.0 Roadway System Plan
 Southwest Boise Transportation Study Page 16 5.0 Roadway System Plan The Roadway System Plan outlines roadway improvements in the Initial Study Area. It forecasts future deficiencies on the arterial system,
CONGESTION REPORT 4 th Quarter 2016
 CONGESTION REPORT 4 th Quarter 2016 A quarterly update of the National Capital Region s traffic congestion, travel time reliability, top-10 bottlenecks and featured spotlight January 16, 2018 ABOUT TPB
Management of Multi-Lane Highways in Jordan (Case Study)
") Management of Multi-Lane Highways in Jordan (Case Study) Basim Jrew 1), Nidal Hussein 2) and Rami Al-Kouz 3) 1) Isra University, Jordan. E-Mail: basim.jrew@iu.edu.jo 2) Isra University, Jordan. E-Mail:
Management of Multi-Lane Highways in Jordan (Case Study) Basim Jrew 1), Nidal Hussein 2) and Rami Al-Kouz 3) 1) Isra University, Jordan. E-Mail: basim.jrew@iu.edu.jo 2) Isra University, Jordan. E-Mail:
92% COMMUTING IN THE METRO. Congested Roadways Mode Share. Roadway Congestion & Mode Share
 COMMUTING IN THE METRO Roadway Congestion & Mode Share The majority of major roadways in Greater Des Moines are without congestion and have underutilized capacity. This surplus capacity could be used for
TRAFFIC IMPACT ANALYSIS
 TRAFFIC IMPACT ANALYSIS FOR THE CHAMPAIGN UNIT#4 SCHOOL DISTRICT PROPOSED HIGH SCHOOL (SPALDING PARK SITE) IN THE CITY OF CHAMPAIGN Final Report Champaign Urbana Urbanized Area Transportation Study 6/24/2014
Appendix SEA Seattle, Washington 2003 Annual Report on Freeway Mobility and Reliability
 (http://mobility.tamu.edu/mmp) Office of Operations, Federal Highway Administration Appendix SEA Seattle, Washington 2003 Annual Report on Freeway Mobility and Reliability This report is a supplement to:
Appendix MSP Minneapolis-St. Paul, Minnesota 2003 Annual Report on Freeway Mobility and Reliability
 (http://mobility.tamu.edu/mmp) Office of Operations, Federal Highway Administration Appendix MSP Minneapolis-St. Paul, Minnesota 2003 Annual Report on Freeway Mobility and Reliability This report is a
Chapter 4 Traffic Analysis
 Chapter 4 Traffic Analysis PURPOSE The traffic analysis component of the K-68 Corridor Management Plan incorporates information on the existing transportation network, such as traffic volumes and intersection
Defining Purpose and Need
 Advanced Design Flexibility Pilot Workshop Session 4 Jack Broz, PE, HR Green May 5-6, 2010 Defining Purpose and Need In your agency s project development process, when do design engineers typically get
CHAPTER 7 ACCESS MANAGEMENT. Background. Principles of Access Management. Hennepin County Transportation Systems Plan (HC-TSP)
") CHAPTER 7 ACCESS MANAGEMENT Background Principles of Access Management Hennepin County Transportation Systems Plan (HC-TSP) Chapter 7 Access Management 7.1 Background Access management has become an important
CHAPTER 7 ACCESS MANAGEMENT Background Principles of Access Management Hennepin County Transportation Systems Plan (HC-TSP) Chapter 7 Access Management 7.1 Background Access management has become an important
Basalt Creek Transportation Refinement Plan Recommendations
 Basalt Creek Transportation Refinement Plan Recommendations Introduction The Basalt Creek transportation planning effort analyzed future transportation conditions and evaluated alternative strategies for
Appendix PDX Portland, Oregon 2003 Annual Report on Freeway Mobility and Reliability
 (http://mobility.tamu.edu/mmp) Office of Operations, Federal Highway Administration Appendix PDX Portland, Oregon 2003 Annual Report on Freeway Mobility and Reliability This report is a supplement to:
Annex 9: Measuring Congestion, Reliability Costs and Selection of Calculation Method Direct Costs
 Annex 9: Measuring Congestion, Reliability Costs and Selection of Calculation Method Direct Costs Congestion indicators There are two general approaches for measuring congestion; an operational approach
Preliminary Transportation Analysis
 Preliminary Transportation Analysis Goals of a Robust, Multimodal Transportation Network Safe Accessible/Connected Efficient Comfortable Context-Sensitive Motor Vehicle: Continue to analyze the data to
CONGESTED LOS ANGELES
 CONGESTED LOS ANGELES Prepared For: Mayor Antonio Villaraigosa and City Council City of Los Angeles Prepared By: Jacki Murdock Transportation Analyst LADOT December 11 th, 2011 Outline What causes congestion?
PRELIMINARY DRAFT WADDLE ROAD / I-99 INTERCHANGE PROJECT ALTERNATIVE ANALYSIS FINAL TRAFFIC SUMMARY REPORT
 PRELIMINARY DRAFT WADDLE ROAD / I-99 INTERCHANGE PROJECT ALTERNATIVE ANALYSIS FINAL TRAFFIC SUMMARY REPORT Prepared by: In Association with: November 2013 EXECUTIVE SUMMARY Patton Township, in partnership
Twin Cities Regional Bicycle System Study
 Twin Cities Regional Bicycle System Study Developing a Regional Bicycle Network Steven Elmer, Metropolitan Council Tony Hull, Toole Design Group LLC CTS Research Conference May 21, 2014 Introduction Study
CONGESTION REPORT 4 th Quarter 2017
 CONGESTION REPORT 4 th Quarter 2017 A quarterly update of the National Capital Region s traffic congestion, travel time reliability, top-10 bottlenecks and featured spotlight May 7, 2018 ABOUT TPB Transportation
ADOT Statewide Bicycle and Pedestrian Program Summary of Phase IV Activities APPENDIX B PEDESTRIAN DEMAND INDEX
 ADOT Statewide Bicycle and Pedestrian Program Summary of Activities APPENDIX B PEDESTRIAN DEMAND INDEX May 24, 2009 Pedestrian Demand Index for State Highway Facilities Revised: May 29, 2007 Introduction
Highway 111 Corridor Study
 Highway 111 Corridor Study June, 2009 LINCOLN CO. HWY 111 CORRIDOR STUDY Draft Study Tea, South Dakota Prepared for City of Tea Sioux Falls Metropolitan Planning Organization Prepared by HDR Engineering,
CHAPTER 4: IDENTIFICATION OF ROAD SYSTEM DEFICIENCIES: TRANSPORTATION PLANNING MODEL
 CHAPTER 4: IDENTIFICATION OF ROAD SYSTEM DEFICIENCIES: TRANSPORTATION PLANNING MODEL I. INTRODUCTION Transportation planning models are the primary tools used to predict future travel conditions. With
Appendix LOU Louisville, Kentucky 2003 Annual Report on Freeway Mobility and Reliability
 (http://mobility.tamu.edu/mmp) Office of Operations, Federal Highway Administration Appendix LOU Louisville, Kentucky 2003 Annual Report on Freeway Mobility and Reliability This report is a supplement
CONGESTION REPORT 3 rd Quarter 2017
 CONGESTION REPORT 3 rd Quarter 2017 A quarterly update of the National Capital Region s traffic congestion, travel time reliability, top-10 bottlenecks and featured spotlight May 7, 2018 ABOUT TPB Transportation
Moving Towards Complete Streets MMLOS Applications
 Moving Towards Complete Streets MMLOS Applications Transportation Education Series May 18 th, 2012 It s not just for cars! Presentation Overview The Complete Streets Movement What is Multi-Modal Level
Appendix ELP El Paso, Texas 2003 Annual Report on Freeway Mobility and Reliability
 (http://mobility.tamu.edu/mmp) Office of Operations, Federal Highway Administration Appendix ELP El Paso, Texas 2003 Annual Report on Freeway Mobility and Reliability This report is a supplement to: Monitoring
Impact of Signalized Intersection on Vehicle Queue Length At Uthm Main Entrance Mohd Zulhilmi Abdul Halim 1,b, Joewono Prasetijo 2,b
 Impact of Signalized Intersection on Vehicle Queue Length At Uthm Main Entrance Mohd Zulhilmi Abdul Halim 1,b, Joewono Prasetijo 2,b 1,2 Smart Driving Research Center, Faculty of Civil and Environmental
Traffic Congestion in Houston. Presented by Bill King
 Traffic Congestion in Houston Presented by Bill King www.billkinghouston.com The Travel Time Index Defined 1.36 30 Minute Trip = 41 Minute Trip (+ 36%) The History of Congestion in Houston Growing Congestion
Capacity and Level of Service LOS
 Chapter 21 Capacity and Level of Service LOS 21.1 Introduction Often it is required to ascertain how much a transport facility can accommodate. Such information is useful in the design of traffic facility.
Bi-state metropolitan planning organization (MPO)
") Using a Variety of Data to Identify Locations of Concern in a Transportation Network 3 th Annual MN APA State Planning Conference September, 8 Robert Herling, Planner Duluth-Superior Metropolitan Interstate
Using a Variety of Data to Identify Locations of Concern in a Transportation Network 3 th Annual MN APA State Planning Conference September, 8 Robert Herling, Planner Duluth-Superior Metropolitan Interstate
Operation Green Light Traffic Signal Coordination Report North Oak Trafficway - New Mark Drive to NE 42nd Street
 Introduction Operation Green Light Traffic Signal Coordination Report North Oak Trafficway - New Mark Drive to NE 42nd Street Operation Green Light (OGL) is a regional effort to improve traffic flow and
CONGESTION REPORT 2 nd Quarter 2017
 CONGESTION REPORT 2 nd Quarter 2017 A quarterly update of the National Capital Region s traffic congestion, travel time reliability, top-10 bottlenecks and featured spotlight May 7, 2018 ABOUT TPB Transportation
Planning Committee STAFF REPORT March 7, 2018 Page 2 of 4 The following MTSOs are being used across the five subregions: Intersection Level of Service
 Planning Committee STAFF REPORT Meeting Date: March 7, 2018 Subject Summary of Issues Recommendations Financial Implications Options Attachments Changes from Committee Review Draft 2017 Multimodal Transportation
Appendix C. Corridor Spacing Research
 Appendix C. Corridor Spacing Research Task 3 of the Twin Cities Bicycle Study called for the development of bicycle corridor spacing guidelines. This section summarizes research of the spacing of planned
McGrath Boulevard Project Development Public Meeting #2 May 28 th, 2015 East Somerville Community School
 McGrath Boulevard Project Development Public Meeting #2 May 28 th, 2015 East Somerville Community School Agenda Introductions Project Context Current Construction McGrath Boulevard Project Development
Overview. Existing Conditions. Corridor Description. Assessment
 Overview A study of the 23 rd Street corridor was undertaken to document the existing conditions, analyze traffic operations, and recommend remedies for deficient situations Although 23 rd Street is frequently
Traffic Circulation Study for Neighborhood Southwest of Mockingbird Lane and Airline Road, Highland Park, Texas
 ARIZONA TEXAS NEW MEXICO OKLAHOMA February 13, 2015 Mr. Meran Dadgostar P.E., R.S. Town of Highland Park 4700 Drexel Dr. Highland Park, Texas 75205 Re: Traffic Circulation Study for Neighborhood Southwest
Cairo Traffic Congestion Study Phase 1
 Cairo Traffic Congestion Study Phase 1 Final Report November 2010 This report was prepared by ECORYS Nederland BV and SETS Lebanon for the World Bank and the Government of Egypt, with funding provided
Regional Bicycle Barriers Study
 Regional Bicycle Barriers Study Executive Summary Background and Purpose The 2040 Transportation Policy Plan (TPP) sets policies for planning and investment direction in the transportation system in the
MUTCD Part 6G: Type of Temporary Traffic Control Zone Activities
 MUTCD Part 6G: Type of Temporary Traffic Control Zone Activities 6G.01 Typical Applications Each temporary traffic control (TTC) zone is different. Many variables, such as location of work, highway type,
ENHANCED PARKWAY STUDY: PHASE 2 CONTINUOUS FLOW INTERSECTIONS. Final Report
 Preparedby: ENHANCED PARKWAY STUDY: PHASE 2 CONTINUOUS FLOW INTERSECTIONS Final Report Prepared for Maricopa County Department of Transportation Prepared by TABLE OF CONTENTS Page EXECUTIVE SUMMARY ES-1
Performance Measures Target Setting NCTCOG Public Meetings
 Performance Measures Target Setting NCTCOG Public Meetings October 8,15,18, 2018 Performance-Based Planning Mobility 2045 Regional Goals Performance Measures Measure System Performance and Report Progress
Geometric and Trafc Conditions Summary
 2 Geometric and Trafc Conditions Summary m, RETHNKNG -94 APPENDX T2 GEOMETRC AND TRAFFC CONDTONS SUMMARY ntroduction This memorandum summarizes the geometric and traffic conditions within the Rethinking
Tulsa Metropolitan Area LONG RANGE TRANSPORTATION PLAN
 Tulsa Metropolitan Area LONG RANGE TRANSPORTATION PLAN Indian Nations Council of Governments August 2005 CONTACTING INCOG In developing the Destination 2030 Long Range Transportation Plan, INCOG s Transportation
Unit 7 Speed, Travel Time and Delay Studies
 Unit 7 Speed, Travel Time and Delay Studies Introduction Speed, travel time and delay are all related measures that are common used as indicators of performance for traffic facilities Measure of Effectiveness
Measuring the Distribution and Costs of Congestion. Tim Lomax Texas Transportation Institute
 Measuring the Distribution and Costs of Congestion Tim Lomax Texas Transportation Institute http://mobility.tamu.edu The Congestion Measurement Story Travel time, variations, compare to goals WHAT? WHY?
DEVELOPMENT OF THE DES MOINES ACCESS MANAGEMENT PLAN
 DEVELOPMENT OF THE DES MOINES ACCESS MANAGEMENT PLAN CTRE Project 03-137 Sponsored by the Iowa Department of Transportation and the Des Moines Area Metropolitan Planning Organization Final Report September
Performance Criteria for 2035 Long Range Transportation Plan
 Minimizing Impacts on Natural, Historic, Cultural or Archeological Resources 2035 LRTP Weighting Factor: 7% Objective 1.1: Use appropriate planning and design criteria to protect and enhance the built
Traffic Impact Analysis Walton Acres at Riverwood Athletic Club Clayton, NC
 Traffic Impact Analysis Walton Acres at Riverwood Athletic Club Clayton, NC 1. TABLE OF CONTENTS INTRODUCTION...1 1.1. Site Location and Study Area...1 1.2. Proposed Land Use and Site Access...2 1.3.
MONROE COUNTY NEW YORK
 MONROE COUNTY NEW YORK Intersection Accident Database Enhancement Project (UPWP 4380) FINAL January 2008 Prepared By: Prepared For: Bergmann Associates 200 First Federal Plaza 28 East Main Street Rochester,
Assessing Level of Service for Highways in a New Metropolitan City
 Assessing Level of Service for Highways in a New Metropolitan City Ganesh Pawar Civil Engineering Department G. H. Raisoni College of Engineering Nagpur, India,4416 Dr. Bhalachandra Khode Civil Engineering
Mobility and Congestion
 Technical Memorandum Mobility and Congestion Prepared for: Prepared by: September 25, 2013 1 Table of Contents 1. Introduction... 1 2. Congestion Forecasting Process... 1 2.1 Mobility and Congestion Terms...
Corridor Advisory Group and Task Force Meeting #10. July 27, 2011
 Corridor Advisory Group and Task Force Meeting #10 July 27, 2011 1 Agenda Recap CAG/TF #9 Public Meeting #2 Summary Single Mode Alternatives Evaluation Results Next Steps 2 3 CAG/TF #9 Recap CAG /TF #9
Iowa Corridor Management Pilot Project Overview. Recommendations For A Corridor Management Program August 2004
 Iowa Corridor Management Pilot Project Overview Recommendations For A Corridor Management Program August 2004 Presentation Overview Project goals Pilot project selection process Analysis results Segment
Congestion Management Report
 Congestion Management Report F.E. EVERETT TURNPIKE (NORTH), MERRIMACK Segment Length: 7.0 miles Daily Traffic Volumes: 60,000-69,000 Analysis Period: May 2015 Number of Traffic Signals: 0 Number of travel
Corridor Studies. LA 415 and LA 73
 Corridor Studies LA 415 and LA 73 Project Approach for Both Corridors 1. Data Collection 2. Data Summary 3. Traffic Analysis 4. Micro-Simulation modeling 5. Generation of alternatives 6. Modeling alternatives
SECTION 1 - TRAFFIC PLANNING
 SECTION 1 - TRAFFIC PLANNING 1.1 TRAFFIC OPERATIONS 1.1.1 Roadway Functional Classification The Multnomah County Comprehensive Framework Plan s Policy 34: Trafficways and the Functional Classification
JONESBORO HIGHWAY 63 HIGHWAY 18 CONNECTOR STUDY
 JONESBORO HIGHWAY 63 HIGHWAY 18 CONNECTOR STUDY Craighead County May 2007 JONESBORO HIGHWAY 63 HIGHWAY 18 CONNECTOR STUDY Craighead County May 2007 Prepared by Planning and Research Division Arkansas State
Clackamas County Comprehensive Plan
 ROADWAYS The County s road system permits the movement of goods and people between communities and regions, using any of a variety of modes of travel. Roads provide access to virtually all property. They
Highway 49, Highway 351 and Highway 91 Improvements Feasibility Study Craighead County
 Highway 49, Highway 351 and Highway 91 Improvements Feasibility Study Craighead County Executive Summary March 2015 Highway 49, Highway 351 and Highway 91 Improvements Feasibility Study Craighead County
appendix b BLOS: Bicycle Level of Service B.1 Background B.2 Bicycle Level of Service Model Winston-Salem Urban Area
 appendix b BLOS: B.1 Background Winston-Salem Urban Area Bicycle Level of Service Level of Service (LOS) is a framework that transportation professionals use to describe existing conditions (or suitability)
November 14, Dulles To DC Loop Public-Private Partnership Proposal. Executive Summary
 November 14, 2005 Dulles To DC Loop Public-Private Partnership Proposal Executive Summary Virginia Mobility Associates LLC, a newly established single purpose entity, proposes to privately finance the
INNER LOOP EAST. AIA Rochester Annual Meeting November 13, 2013 TRANSFORMATION PROJECT. Bret Garwood, NBD Erik Frisch, DES
 INNER LOOP EAST TRANSFORMATION PROJECT AIA Rochester Annual Meeting November 13, 2013 Bret Garwood, NBD Erik Frisch, DES Why? We are building a city that encourages walking, biking and enjoying the outdoor
Appendix B: Forecasting and Traffic Operations Analysis Framework Document
 Existing Conditions Report - Appendix Appendix B: Forecasting and Traffic Operations Analysis Framework Document This document defines the methodology and assumptions that will be used in the traffic forecasting
Appendix PIT Pittsburgh, Pennsylvania 2003 Annual Report on Freeway Mobility and Reliability
 (http://mobility.tamu.edu/mmp) Office of Operations, Federal Highway Administration Appendix PIT Pittsburgh, Pennsylvania 2003 Annual Report on Freeway Mobility and Reliability This report is a supplement
Walmart (Store # ) 60 th Street North and Marion Road Sioux Falls, South Dakota
 60 th Street North and Marion Road Sioux Falls, South Dakota") Walmart (Store #4865-00) 60 th Street North and Marion Road Sioux Falls, South Dakota Prepared for: Wal-Mart Stores, Inc. Bentonville, Arkansas Prepared by: Kimley-Horn and Associates, Inc. ã2013 Kimley-Horn
Walmart (Store #4865-00) 60 th Street North and Marion Road Sioux Falls, South Dakota Prepared for: Wal-Mart Stores, Inc. Bentonville, Arkansas Prepared by: Kimley-Horn and Associates, Inc. ã2013 Kimley-Horn
Regional Transportation Needs Within Southeastern Wisconsin
 Regional Transportation Needs Within Southeastern Wisconsin #118274 May 24, 2006 1 Introduction The Southeastern Wisconsin Regional Planning Commission (SEWRPC) is the official areawide planning agency
Operational Ranking of Intersections: A Novel Prioritization Methodology
 Operational Ranking of Intersections: A Novel Prioritization Methodology Reza Omrani, Ph.D. Transportation Engineer CIMA+ 3027 Harvester Road, Suite 400 Burlington, ON L7N 3G7 Reza.Omrani@cima.ca Pedram
2. Context. Existing framework. The context. The challenge. Transport Strategy
 Transport Strategy Providing quality connections Contents 1. Introduction 2. Context 3. Long-term direction 4. Three-year priorities 5. Strategy tree Wellington City Council July 2006 1. Introduction Wellington
2009 PE Review Course Traffic! Part 1: HCM. Shawn Leight, P.E., PTOE, PTP Crawford Bunte Brammeier Washington University
 2009 PE Review Course Traffic! Part 1: HCM Shawn Leight, P.E., PTOE, PTP Crawford Bunte Brammeier Washington University sleight@cbbtraffic.com Topic Areas Highway Capacity Manual Highway Capacity Analysis
Chapter 5 FUNCTIONAL CLASSIFICATION
 Chapter 5 FUNCTIONAL CLASSIFICATION Functional classification is a system by which streets and roadways may be distinguished by types according to their function within the entire transportation network.
Arterial Management Plan for US Route 250 and State Route 623
 Arterial Management Plan for US Route 250 and State Route 623 June 25, 2014 Brad Shelton, AICP Access Management and Traffic Impact Analysis Programs Manager Transportation and Mobility Planning Division
Los Angeles Congested Corridor Study and Comparisons with Texas Transportation Institute Congestion Estimates
 Proceedings of the 2013 Industrial and Systems Engineering Research Conference A. Krishnamurthy and W.K.V. Chan, eds. Los Angeles Congested Corridor Study and Comparisons with Texas Transportation Institute
Classification Criteria
 SCHEDULE D TO RECOMMENDED OFFICIAL PLAN AMENDMENT NO. 40 SCHEDULE C-4 Road Criteria Criteria Traffic Service Objective Land Service/Access Typical Daily Traffic Volume Flow characteristics Travel Speed
US 69 RELIEF ROUTE STUDY
 US 69 RELIEF ROUTE STUDY Jacksonville, Texas PUBLIC MEETING #2 May 29 th, 2018 Welcome to the public meeting for the US 69 Relief Route Study in Jacksonville. This is the second public meeting for this
Focus on New Baseline Conditions, Indicators and Analytic Approaches
 Focus on New Baseline Conditions, Indicators and Analytic Approaches Lindsey Realmuto, MPH Health Program Planner San Francisco Department of Public Health Overview HIA Assessment Tools HDMT and Baseline
CITY OF ALPHARETTA DOWNTOWN MASTER PLAN TRAFFIC EVALUATION
 CITY OF ALPHARETTA DOWNTOWN MASTER PLAN TRAFFIC EVALUATION June 2015 CITY OF ALPHARETTA DOWNTOWN MASTER PLAN TRAFFIC EVALUATION Introduction The Alpharetta Downtown Master Plan was developed in the fall
Traffic Parameter Methods for Surrogate Safety Comparative Study of Three Non-Intrusive Sensor Technologies
 Traffic Parameter Methods for Surrogate Safety Comparative Study of Three Non-Intrusive Sensor Technologies CARSP 2015 Collision Prediction and Prevention Approaches Joshua Stipancic 2/32 Acknowledgements
APPENDIX G: INTERSECTION NEEDS AT OKEECHOBEE BOULEVARD
 APPENDIX G: INTERSECTION NEEDS AT OKEECHOBEE BOULEVARD INTERSECTION NEEDS AT SR 7 and OKEECHOBEE BOULEVARD SR 7 Extension Project Development and Environment (PD&E) Study From Okeechobee Boulevard (SR
Alta Planning + Design
 Alta Planning + Design Gavin Davidson, MCIP, RPP Principal, Senior Planner Vancouver Kate Whitfield, P.Eng., MCIP, RPP Senior Associate Engineer/Planner Ottawa Ottawa, Ontario, Canada Ottawa Toronto Syracuse
2014 Mobility Assessment Report Functional Planning & Policy Montgomery County Planning Department
 2014 Mobility Assessment Report Functional Planning & Policy Montgomery County Planning Department Travel Trends National & Local Travel Trends Multi-Modal Monitoring Pedestrian Bikes Bus Rail Future Efforts