Transit Development Plan December 2011
|
|
|
- Cory Crawford
- 6 years ago
- Views:
Transcription
1 Trasit Developmet Pla December 2011
2 Table of Cotets Chapter Oe - Ivetory Itroductio Data Sources Settig the Stage Service Area Fixed Route Service Routes Overall Ridership No-Express Service Fares Express Service Fares Paratrasit Fudig ad Operatig Expeses Peer Compariso Chapter Two Route Evaluatio Fixed Route Service Total Ridership Trasfers Dashboards Performace Measures Route Skeleto Characteristics Demographic Iformatio Observatios Paratrasit Surveys, Focus Groups ad Observatios Summary Chapter Four Route Modificatios Route Structure Schedule Adherece Frequecy Fixed Route Modificatios Paratrasit Modificatios Reallocatio of Existig Resources Additioal Service Chapter Five Other Recommedatios Route Names Street Trees Fares ad Fare Collectio Wheelchairs AVL System Traiig ad Updates Bus Stop/Walk Network Lad Use Plaig ad Policies PeDOT Costructio Projects Cosideratios for Future Trasportatio Developmet Plas Chapter Three Umet Needs Total Populatio ad Target Populatios Commuter Trips rabbittrasit Fixed Route Study Suitability Aalysis Summary
3 List of Tables Table 1-1 Populatio Desity for York ad Adjacet Couties Core Routes Radial Routes Haover Routes Express Routes Table 1-2 Total Fixed Route Ridership, FY Table 1-3 Total Ridership, Core, FY Table 1-4 Total Ridership, Radial, FY Table 1-5 Total Ridership, Haover, FY Table 1-6 Total Ridership, Express, FY Table 1-7 Route Spa Table 1-8 Fixed Route Fare Structure for Core, Radial ad Haover Service Table 1-9 Total Riders, FY by Fare Type, No-Express Table 1-10 Express Service Fare Structure Table 1-11 Total Riders by Fare Type, FY , Express Service Table 1-12 Paratrasit Ridership, FY Table 1-13 rabbittrasit Fudig, FY Table 1-14 rabbittrasit Operatig Expeses, FY Table 2-1 Study Period Ridership by Route by Hour Table 2-2 Trasfers Percet of Ridership Table 2-3 Trasfers Percet of Trasfers from Route Table 2-4 Dashboard Data Ridership, Fiscal, ad Schedule Adherece Measures Table 2-5 Dashboard Data Route Skeleto Characteristics Table 2-6 Dashboard Data Demographic i Surroudig Area Table 2-7 Top Te Paratrasit Locatios Table 2-8 Breakdow of Paratrasit Survey Respodets by Program Table 3-1 Target Populatios for York Couty ad rabbittrasit Service Area List of Figures Figure 1-1 Average Retail Price per Gallo of Gasolie Figure 1-2 Dow Joes Idustrial Average, Figure 1-3 Pesylvaia Quarterly Employmet Rate, Timelie Figure 1-4 Total Fixed Route Ridership, FY Figure 1-5 Aual Percet Chage i Ridership for Each Service Type, ad Employmet Figure 1-6 Ridership by Route Service Type FY Figure 1-7 Total Ridership, Routes 1, FY Figure 1-8 Total Ridership, Other Core Routes, FY Figure 1-9 Total Ridership, Radial Routes, FY Figure 1-10 Total Ridership, Haover, FY Figure 1-11 Total Ridership, Express Harrisburg, FY Figure 1-12 Total Ridership, Express, FY Figure 1-13 Total Ridership, FY by Fare Type, No-Express Figure 1-14 Breakdow of Riders by Fare Type, FY , No-Express Figure 1-15 Total Riders by Fare Type, FY , Express Service Figure 1-16 Breakdow of Express Riders by Fare Type, FY Figure 1-17 Paratrasit Ridership, FY Figure 1-18 rabbittrasit Fudig, FY Figure 1-19 rabbittrasit Operatig Expeses, FY Figure 2-1 Total Study Period Ridership by Service Type Trasfer Graphs ,6 Figure 2-2 O-Time Performace Showig Before ad After System Revisios Figure 2-3 Late ad Early Performace Showig Before ad After System Revisios Figure 2-4 Breakdow of Paratrasit Trips Figure 2-5Paratrasit Ridership Levels by Day Figure 2-6 Paratrasit Trip Purpose, Biaual Survey Figure 2-7 Paratrasit Fare Paymet, Surveys Figure 2-8 Reaso for Ridig Fixed Route, Biaual Surveys Figure 2-9 Fixed Route Trip Purpose, Biaual Survey Figure 2-10 Fixed Route Fare Paymet, Biaual Survey, Figure 3-1 Service Area Coverage as a Percetage of Couty Total Figure 3-2 Cost to Ride the Bus Figure 3-3 What could rabbittrasit do? Figure 3-4 Factors Ifluetial o Ridership List of Maps Map 1-1 York Couty, Pesylvaia ad Surroudig Area Map 1-2 rabbittrasit Routes by Service Type Map 1-3 Core Service Area Routes Map 1-4 New Route 1B Map 1-5 Radial Service Area Routes Map 1-6 Haover Service Area Routes Map 1-7 Express Service Routes Map 1-8 rabbittrasit Fare Zoes Map 2-1 Ridership by Route by Hour Dashboards Map 2-2 Core Routes with Overall O-Time Performace below 65% Map 2-3 Idividual Itra-York Couty Paratrasit Trips Map 2-4 Top Te Paratrasit Locatios durig Study Period Map 2-5 Itra-York Couty Paratrasit Trips with Fixed Route Buffer Map 2-6 Paratrasit Trips (2A ad 6A Shadow) Map 2-7 Paratrasit Trips (1A Shadow) Map 2-8 Paratrasit Trips (3A Shadow) Map 2-9 Paratrasit Trips (4B Shadow) Map 2-10 Paratrasit Trips (1B/C Shadow) Map 2-11 Paratrasit Trips (4A Shadow) Map 2-12 Paratrasit Trips (2B/3B/6B Shadow) Map 3-1 Coectios Requested withi York Couty Map 3-2 Umet Needs Suitability Aalysis Map 4-1 Alteratives for South York Map 4-2 Alteratives for Reachig OSS Map 4-3 East York Paratrasit Shuttle Map 4-4 Alteratives for Shrewsbury Circulator Map 4-5 Cape Hor Road Alteratives Map 5-1 Sidewalks vs. No Sidewalks at Bus Stop Locatios
4 Trasit Developmet Pla Chapter 1 Ivetory
5 Trasit Developmet Pla Chapter 1 - Ivetory Itroductio The York Couty Trasportatio Authority, kow as rabbittrasit, is the public trasportatio provider for York Couty Pesylvaia. rabbittrasit provides 28 fixed routes, two express routes, plus paratrasit service operatig from oe maiteace ad admiistratio facility. The trasit service area covers the 911 square miles of York Couty ad serves a populatio of 434,972, based o the 2010 US Cesus. Accordig to the Pesylvaia Public Trasportatio Aual Performace Report for the fiscal year , rabbittrasit supplied 1,412,889 rides o fixed route service ad 185,005 o paratrasit. Weekday service spa ra approximately 18 hours each day ad weeked service approximately 14 hours. Providig these mobility services required approximately 1,566,498 vehicle reveue miles ad 124,839 vehicle reveue hours of service, utilizig a total of 91 fleet buses with 36 for fixed route service, ad 55 for paratrasit, alog with 156 full ad part- time employees. Fixed route trasit service is focused maily i the York City urba area with radial service to specific suburba area commuities icludig Dover, Machester, Red Lio, Shrewsbury, ad Haover, as well as a coectio to Columbia i Lacaster Couty. Additioally, the Haover urba area has its ow selfcotaied fixed route service. rabbittrasit also operates two express service routes durig the workweek: oe orthboud to Harrisburg ad the other southboud to Towso, Marylad. For the years 2006 through 2010, rabbittrasit s overall ridership peaked i 2007 ad, with the ecoomic collapse i the fall of 2008, experieced a declie i ridership for the years 2008, 2009 ad Despite these hard times, the overall system performace is good, ad i a peer-compariso, rabbittrasit receives thumbs-up i all but oe measuremet i four performace categories. With the ecoomy still i recovery, federal trasportatio legislatio authorizatio pedig, ad Act 44 fudig oexistet, rabbittrasit is facig a uclear future for public trasit fudig. They caot afford to wait for what happes ad react but must be ready to act i a variety of scearios. The goal of the 2011 rabbittrasit Trasit Developmet Pla is to esure that its curret resources are beig allocated i the most efficiet maer to meet the idetified eeds of the customer. Thus, the goal of the 2011 rabbittrasit Trasit Developmet Pla (the Pla) is to esure that its curret resources are beig allocated i the most efficiet maer to meet the idetified eeds of the customer. Data Sources A variety of data sources are used i the developmet of the Pla. Due to reportig requiremets that have varyig defiitios ad the differet systems used to collect data, ot all of the data is 100% recocilable. Each sectio of evaluatio ad aalysis utilizes the best data available ad appropriate for that sectio, ad every effort has bee made to verify the various sets of data to each other. The data sources used for each sectio of the Pla are idetified i the begiig of that sectio. Additioally, at the time of this pla s developmet, oly the prelimiary data for the 2010 US Cesus has bee released, requirig the use of both 2010 ad 2000 US Cesus data for populatio aalysis. Data Note: I Chapter 1 Ivetory, the issue arose cocerig the York Hospital Employee shuttle project. This project ivolved providig trasportatio from the Queesgate shoppig ceter parkig lot to the York Hospital facility durig a large costructio project at the York Hospital facility. Durig the project period, rabbittrasit provided approximately 534,000 trips for York Hospital employees that were partially subsidized by the York Hospital. The shuttle project eded i November 2007, techically i the middle of fiscal year After much discussio by the Pla s developmet team, the ridership umbers for the shuttle project were removed from the ridership totals as the developmet team felt that these umbers skewed the ridership data ad obscured impacts from other areas. The reveue from this project, however, does appear uder the Fudig ad Expeses sectio of Chapter 1, as it was reported ad published i the Pesylvaia Public Trasportatio Performace Reports for 2006 ad 2007 ad could ot be easily subtracted. A ote to that effect appears i that sectio. Data Sources: Regioal Trasit Coordiatio Study (2011) Souther York Couty I-83 Park ad Ride Study (2011) rabbittrasit Trasit Developmet Pla (2006) Pesylvaia Public Trasportatio Aual Performace Reports ( ) York Couty Comprehesive Pla BARTA Comprehesive Route ad Marketig Study (2008) CAT Service Study (2010) RRTA Log Rage Public Trasportatio Pla (2008) Itegratio of Paratrasit ad Fixed-Route Trasit Service (TRB, 2008) Natioal Trasit Database ad Glossary rabbittrasit 2009 Paratrasit Survey rabbittrasit 2010 Fixed Route Survey rabbittrasit Fixed Route Study (2011) I the followig chapters, the Pla will examie various aspects of rabbittrasit s fixed route ad paratrasit service, measure ad aalyze the trasit demad of York Couty to evaluate whether those eeds are beig met, make recommedatios to improve the efficiecy of rabbittrasit, ad poit the directio for future trasit plaig efforts. Page 1-1


6 Trasit Developmet Pla Chapter 1 - Ivetory Chapter 1 Ivetory This chapter will preset a picture of rabbittrasit s service area, alog with relevat demographic ad socioecoomic characteristics, ad existig operatios with a overview of the five-year period The operatig data for this sectio comes primarily from the Pesylvaia Public Trasportatio Aual Performace Reports for those years ( ) ad the reports submitted to geerate them. The idividual years of refer to the rabbittrasit fiscal year, which ecompasses July of the previous year through the ed of Jue of the curret year. For example, the year 2006 refers to the period of July 1, 2005 through Jue 30, The existig operatio icludes scheduled, fixed-route service as well as shared-ride, Persos with Disabilities (PwD), ad o-public service that will be referred to collectively as paratrasit service. Settig the stage The years 2006 through 2010 were tumultuous years. A combiatio of widely fluctuatig gas prices ad a bakig crisis triggered a stock market crash that caused a ecoomic dowtur with massive job losses, all makig it difficult for both the private ad public sectors to do more tha just hag o util thigs get better. The followig three graphs preset a picture of these evets: gas prices for York Couty (i blue) compared to the atioal average (i red), the Dow Joes Idustrial Average, ad the Employmet rate for Pesylvaia. Figure 1-2 Dow Joes Idustrial Average, Dow Joes Idustrial Average (Quarterly) Ja Jul ,000 14,000 12,000 10,000 8,000 6,000 4,000 2,000 0 Ja-06 Apr-06 Jul-06 Oct-06 Ja-07 Apr-07 Jul-07 Oct-07 Ja-08 Apr-08 Jul-08 Oct-08 Ja-09 Apr-09 Jul-09 Oct-09 Ja-10 Apr-10 Jul-10 The Dow Joes Average, while ot the US Stock Market, is a clear idicator of market value. I October of 2007, the DOW reached a record high of 14,066. Followig a series of bakig crises, the US Stock Market fell 22% i the first two weeks of October 2008 ad kept fallig through April 2009, ladig the DOW at 8,017. While the market s value has mostly recovered, it remais somewhat volatile, frequetly fluctuatig betwee the 10,000 ad 12,000-poit level. Figure 1-3 Pesylvaia Quarterly Employmet Rate, NYS Gas prices rose steadily through 2006 ad They peaked sharply i 2008, reachig a high for York Couty i Jue 2008 at a retail price of $3.98 per gallo. As the graph shows, the York Couty price per gallo is very similar to the atioal average, ad the impact of the high gas prices were felt everywhere as they were passed o through higher food ad commodity prices. Eve though gas prices fell through the fall of 2009, cosumer prices have remaied iflated from 2007 prices as gas prices have crept back up to remai i the mid-$3.00 per gallo price rage. Pesylvaia Employmet Rate (Quarterly) Ja 2006-Oct 2010 Figure 1-1 Average Retail Price per Gallo of Gasolie, York Couty ad Natioal US Dept of Labor, Bureau of Labor Statistics Pesylvaia Employmet (Quarterly) It is ot surprisig that the fall ad fluctuatios i the fiacial markets resulted i a ecoomic recessio that we are still experiecig i Followig the drop i the market, may jobs were lost throughout the ecoomy. The employmet rate i Pesylvaia was at a ear record high i Jauary 2007 at 95.8% (uemploymet rate of 4.2%) but fell steadily after that through Jauary 2010 at 91.2% (uemploymet rate of 8.8%). Despite the large job-creatio effort by the federal govermet, the employmet rate cotiues to hold aroud 92% i mid Page 1-2

7 Trasit Developmet Pla Chapter 1 - Ivetory As we review operatig ad fiscal data for rabbittrasit for the period, it is importat to keep these ecoomic rumbligs i mid ad add to these the drama of Pesylvaia s Act 44. Passed i July 2007, Act 44 was, cocisely, a effort to provide a o-goig mechaism for fudig trasportatio, icludig trasit. While a portio of the fudig for this legislatio was to come from the Pesylvaia Turpike Commissio (PTC), aother portio of fudig was to come from the tollig of Iterstate 80 also through the PTC. After a series of applicatios, reviews ad resubmissios, the federal govermet fially rejected Pesylvaia s applicatio for the tollig of I-80. This failed attempt has left Pesylvaia several hudred millio dollars short i fudig for trasportatio ifrastructure projects ad trasit operatios. Curretly, there is o pla i place to solve this fudig quadary. The future of trasportatio fudig at the federal level remais equally uclear. I both reviewig rabbittrasit s performace over the past five years ad plottig its directio for the future, it is ecessary to keep the ucertaity of the today i mid. Operatioal efficiecy will outweigh expasio without profoudly demostrated eed, ad uder-utilized resources, if idetified, should be reallocated. Service Area The York Couty Trasportatio Authority, kow as rabbittrasit, is the public trasportatio provider for York Couty Pesylvaia. rabbittrasit provides 28 fixed routes plus paratrasit service operatig from oe maiteace ad admiistratio facility located i the orthwest sectio of the York urba area. The trasit service area covers the 911 square miles of York Couty ad, based o the 2010 US Cesus, serves a populatio of 434,972. As show i the followig table, York Couty follows Lacaster Couty ad Dauphi Couty amog its eighbors i actual area. I both populatio ad populatio desity, York Couty follows both Baltimore Couty ad Lacaster Couty. Table 1-1 Populatio Desity for York ad Adjacet Couties Area (mi 2 ) Populatio Desity (populatio/mi 2 ) York Couty , Adams Couty , Cumberlad Couty , Dauphi Couty , Lacaster Couty , Baltimore Couty, MD , Carroll Couty, MD , Harford Couty, MD , Source: 2010 US Cesus Map 1-1 York Couty, Pesylvaia ad Surroudig Area Located i south cetral Pesylvaia, York City at the ceter of York Couty is 33 miles south of the state capitol, Harrisburg, ad 55 miles orth of Baltimore. It is bordered by Cumberlad ad Dauphi Couties to the orth, Lacaster Couty to the east, ad Adams Couty to the west. York Couty is adjacet to three Marylad couties alog its souther border: Carroll Couty, Baltimore Couty, ad Harford Couty, ruig west to east. York Couty has two major trasportatio corridors. Iterstate 83 rus orth-south coectig York Couty with Harrisburg ad Baltimore. I-83 provides the ecessary coectio to accout for the steady icrease over the past two decades that York Couty has experieced i the umber of York Couty residets who commute to the Harrisburg ad Baltimore metropolita areas for work. U.S. Route 30 rus east-west makig a coectio to Lacaster ad Gettysburg. The Pesylvaia Turpike also rus through the very orther part of the couty, ad a sectio of Route 15, ruig from Marylad to Cumberlad Couty, cuts through York Couty i the orthwest. Map 1-1 shows York Couty i relatio to its eighborig couties with these major roadways. Accordig to the 2000 US Cesus iformatio, York Couty s seior populatio umbers 51,396 ad its Uder 18 populatio 94,057. There are approximately 203,500 people i the couty s labor force ad of these, 51,000 travel out of the couty each day to work. The top three out-of-couty commuter destiatios are Cumberlad Couty, Baltimore Couty, ad Dauphi Couty. Ad early 9,850 of 148,219 households, or 7%, have o cars. Page 1-3

8 Trasit Developmet Pla Chapter 1 - Ivetory Fixed Route Service Map 1-2 rabbittrasit Routes by Service Type Fixed route service, accordig to the Natioal Trasit Database Glossary, is trasit service provided o a repetitive, fixed schedule basis alog a specific route with vehicles stoppig to pick up ad deliver passegers to specific locatios; each fixed route trip serves the same origis ad destiatios. rabbittrasit provides 28 scheduled, fixed routes ad two commuter express routes throughout the York Couty service area ad ito adjacet couties. The followig tables list these routes with each oe s origi ad destiatio. The color code of blue for Core, pik for Radial, gree for Haover, ad aqua for EXPRESS will follow the routes ad service type throughout the Pla. Durig the developmet of the Pla, rabbittrasit bega a third express route that travels Route 15 from Gettysburg to Harrisburg. Sice there is ot yet sufficiet data for aalysis, this ew express route was ot icluded i the Pla. Routes All of the fixed routes ca be broke ito four service type categories: CORE: These 14 routes serve the York City urba area ad the surroudig urba areas i adjoiig muicipalities. These routes are show o the map o Page 1-5. Route # Origi Destiatio 1A Trasfer Ceter West Machester 1B Trasfer Ceter York Galleria 1C Trasfer Ceter Pleasat Acres 2A Trasfer Ceter North York via George St 2B Trasfer Ceter South York via Pie St 3A Trasfer Ceter Northwest Plaza 3B Trasfer Ceter York College 4A Trasfer Ceter Memorial Hospital 4B Trasfer Ceter Queesgate 5A Trasfer Ceter West York 5B Trasfer Ceter K-Mart 6A Trasfer Ceter North York via Beaver 6B Trasfer Ceter South York via Pershig 55 York College West Machester Mall The Routes 1A, 1B, ad 1C serve the York City urba ceter ad poits west (1A) ad east (1B, 1C). The Routes 1 are at the ceter of the rabbittrasit route system ad have the greatest frequecy ad the highest ridership of all the route groups. While they are part of the CORE service type, the Routes 1 have bee separated from the other CORE routes throughout the Pla for compariso purposes because their data skews the performace measure averages for the Core group. Core Durig the developmet of the Pla, the 1B ad 1C routes were combied ito oe route, called the 1B or the ew 1B. A map showig the old 1B- 1C ad the ew combied 1B is o Page 1-6. Page 1-4

9 Trasit Developmet Pla Chapter 1 - Ivetory Map 1-3 Core Service Area Routes Page 1-5

10 Map 1-4 New Route 1B Trasit Developmet Pla Chapter 1 - Ivetory Page 1-6

11 Trasit Developmet Pla Chapter 1 - Ivetory Map 1-5 Radial Service Area Routes Page 1-7

12 Trasit Developmet Pla Chapter 1 - Ivetory Map 1-6 Haover Service Area Routes Map 1-7 Express Service Routes Page 1-8

 22B Haover Square Gradview Plaza 23 Haover Square Haover Middle School Haover Timelie Radial 13 West Machester Mall Dover 14E Machester Crossroads Machester 14G Machester")

13 Trasit Developmet Pla Chapter 1 - Ivetory RADIAL: These ie routes serve specific commuities i York Couty outside the York City urba area ad are show o the map o Page 1-7. Route # Origi Destiatio 12 Galleria Mall Wrightsville/Columbia HANOVER: These five routes serve the greater Haover area iclusively. They are show Page 1-8. Route # Origi Destiatio 21A Haover Square N. Haover Mall (Broadway) 21B Haover Square Homewood Village 22A Haover Square N. Haover Mall (Carlisle St) 22B Haover Square Gradview Plaza 23 Haover Square Haover Middle School Haover Timelie Radial 13 West Machester Mall Dover 14E Machester Crossroads Machester 14G Machester Crossroads Machester 14S Machester Crossroads Machester 15 Trasfer Ceter Dallastow/Red Lio 16 Trasfer Ceter Sprig Grove/Haover 17 Trasfer Ceter Shrewsbury 32 York Hospital Apple Hill Medical Ceter Durig the developmet of the Pla, the Board of Directors for the York Couty Trasportatio Authority ad the Adams Couty Trasit Authority voted to merge the two groups becomig the York Adams Trasportatio Authority. While previously, the service area for the Haover circulator routes was strictly withi York Couty; this merger will provide a opportuity to expad the Haover service to the etire Haover urba area, part of which is i Adams Couty. EXPRESS: These two routes serve York Couty s growig out-of-couty commuter populatio. Oe route travels from York City orth to Harrisburg ad the other routes travels from York City south to Towso, Marylad. These routes are show the map o Page 1-8. Route # Origi Destiatio 83 Trasfer Ceter Harrisburg 85 Trasfer Ceter Towso As metioed earlier, rabbittrasit bega aother express service route durig the developmet of the Pla. This route travels Route 15 from Gettysburg to Harrisburg. XP DOW peaks at 14,066 Gas peaks ear $3.90/gallo Gas is $2.60/gallo The DOW Joes is at 11,000 poits PA employmet rate is ear 95% Gas reaches low of $2.35/gallo rabbittrasit aual ridership remais steady, totalig 1,344,099 rabbittrasit total ridership is 1,289,397 rabbittrasit Adult Cash Fare is $1.30 rabbittrasit begis Express service to Harrisburg rabbittrasit raises Adult Cash Fare to $1.35 rabbittrasit raises Adult Cash Fare to $1.40 rabbittrasit begis Express service to Marylad DOW reaches low of 8,017 PA employmet has dropped 4 percetage poits to 91% Page 1-9
14 Trasit Developmet Pla Chapter 1 - Ivetory Overall Ridership For the period from 2006 to 2010, rabbittrasit s fixed route ridership icreased overall by 4.2%; however, 2007 was the piacle for aual ridership durig this period, ad from this poit to 2010, fixed route ridership declied by 4.79%. bega operatig i 2006 showed a icrease for the period but a ridership level decrease i Figure 1-5 Aual Percet Chage i Ridership for Each Service Type, ad Employmet 35% Aual Percet Chage i Ridership System Paratrasit Core Radial Haover Express Employmet The table ad graph below show the ridership levels for the fixed routes as a total for the years , alog with the percetage icrease or decrease from the prior year. 25% Table 1-2 Total Fixed Route Ridership, FY Total 1,289,397 1,411,672 1,403,815 1,385,076 1,344, % -0.56% -1.33% -2.96% 15% 5% 96.0% 95.3% Figure 1-4Total Fixed Route Ridership, FY ,450,000 1,400,000 1,350,000 1,300,000 1,250,000 1,200,000 Total Fixed Route Ridership FY Total Fixed Route Ridership rabbittrasit s ridership basically follows the same patter as the Dow Joes Average ad the employmet rate, as a total system ad idividual service types; the Haover routes ad the ew EXPRESS service excepted. The followig graph (Figure 1-5) shows the aual percetage chage i ridership for all service types, icludig paratrasit ad all trasit service combied (System), i relatio to the employmet rate for York Couty. The pie chart (Figure 1-6) shows a breakdow of all rabbittrasit trasit riders for the fiscal year 2010 by route service type. While the ridership levels of the Routes 1 remaied relatively steady durig , the ridership levels of the Other Core ad Radial routes reflected the layoffs ad job loss experieced by York Couty residets. The ridership for the two mai Haover routes remaied fairly stable. Oly the EXPRESS service that -5% -15% -25% -35% Figure 1-6 Ridership by Route Service Type FY 2010 Ridership by Route Service Type FY 2010 Haover 4% Radial 9% Other Core 39% Express 83 4% Core: Rt 1 44% 90.4% Page 1-10
15 Trasit Developmet Pla Chapter 1 - Ivetory The followig table ad graphs show the ridership levels for all of the Core routes show grouped by the Routes 1 ad the Other Core routes idividually. Table 1-3 Total Ridership, Core, FY , , , , ,253 Core Figure 1-7Total Ridership, Routes 1, FY , , , , , ,254 99,980 97,035 99, ,261 86,978 82, ,276 99, , , , ,409 97, , , , , , ,260 98,735 85,618 79,711 81, ,477 1,109,967 1,168,218 1,160,355 1,149,097 1,119, % -0.7% -1.0% -2.6% Figure 1-8 Total Ridership, Other Core Routes, FY , , , , ,000 80,000 Ridership for Routes Routes 1 Ridership for Other Core Routes The Core routes represet approximately 83% of the fixed route ridership for ay of the years , ad the Routes 1 carry roughly 53% of the Core ridership or about 43% of the total fixed route riders. Idividually, all routes i the Core group show the impacts of the ecoomic dowtur i ridership decreases from levels vs levels. The followig table ad graph shows the ridership levels for the Radial routes, , show idividually. Table 1-4 Total Ridership, Radial, FY Radial Figure 1-9 Total Ridership, Radial Routes, FY ,000 40,000 35,000 30,000 25,000 20,000 15,000 10,000 5, ,923 25,389 22,526 26,117 20, ,638 16,699 21,292 16,411 17, ,264 26,637 41,884 28,073 23, ,820 31,744 32,646 30,532 30, ,039 11,736 4,357 9,216 9, ,238 3,635 4,097 4,338 3, ,070 32,086 17,543 8,501 19, , , , , , % -2.42% % 0.79% Ridership for Radial Routes Route 12 Route 13 Route 14 Route 15 Route 16 Route 17 Route 32 60, Routes 2 Routes 3 Routes 4 Routes 5 Routes 6 The Radial Routes represet 9% of rabbittrasit s total ridership i Route 14 serves several idustrial parks orth of York City ad shows the impact of the York Couty s job loss from more tha ay other route. Route 15 ad Route 17 ridership levels remaied relatively flat durig the etire period, while the other routes had varyig fluctuatio. Page 1-11

16 Trasit Developmet Pla Chapter 1 - Ivetory The followig table ad graph shows the ridership levels for the Haover routes, , show both i total ad idividually. Table 1-5 Total Ridership, Haover, FY Haover Figure 1-10Total Ridership, Haover, FY ,291 23,813 24,183 22,495 21, ,496 22,857 23,600 21,867 24, ,826 13,702 5,573 13,529 7,192 48,613 60,372 53,356 57,891 53, % % 8.50% -8.36% Figure 1-11 Total Ridership, Express Harrisburg, FY Ridership for Express (Harrisburg) ,000 50,000 40,000 30,000 20,000 10, ,000 25,000 Ridership for Haover Routes Express (Harrisburg) From the Souther York Couty I-83 Park N Ride Study (Ja 2011), the followig graph shows the ridership level of both express routes combied from ,000 15,000 10,000 5,000 - The Routes 21 ad 22 ridership levels remaied both relatively stable durig ad almost equal. Overall, the Haover routes experieced a icrease i ridership of 9.1% from 2006 to The followig table ad graph shows the ridership levels for the EXPRESS route (Harrisburg), This commuter service route bega i July of EXPRESS service to the Baltimore area bega i February 2009 ad because the service reported for the Pla timeframe was less tha oe year, this route was ot icluded i the ridership umbers. Table 1-6 Total Ridership, Express, FY Route 21 Route 22 Route 23 Figure 1-12 Total Ridership, Express, FY ,000 16,000 14,000 12,000 10,000 8,000 6,000 4,000 2,000 - rabbitexpress Oe Way Trips (combied) 7,856 7,944 8,594 7,803 JAS OND JFM AMJ JAS OND JFM AMJ Start of rabbitexpress to Baltimore 14,867 13,360 13,795 12,91713,321 11,717 10,43910,249 JAS OND JFM AMJ ,881 17,333 15,561 15,364 JAS OND JFM AMJ JAS: July, Aug, Sept (Summer) OND: Oct, Nov, Dec JFM: Ja, Feb, Mar AMJ: April, May, Jue (Sprig) XP ,156 45,759 54,900 50, % 19.98% -8.72% From the first quarter of operatio i the Summer of 2006 through the ed of Sprig 2010, the ridership levels rose from 7,856 to 17,333 that s 120.6%. Overall, measurig the July-August-September quarters from 2006 through 2009, average growth i ridership has icreased steadily by just uder 30% aually. Page 1-12

17 Trasit Developmet Pla Chapter 1 - Ivetory The schedules for the fixed routes are show below i Table 1-7. All 28 fixed routes ad two express routes operate durig the weekdays Moday through Friday. All Core routes, plus oe Radial route, ad two Haover routes operate o Saturdays. O Sudays, 13 of the 14 Core routes operate, alog with oe Radial route. I 2010, weekday service bega as early as 5:20am ad eded as late as 11:40pm; Saturday service bega as early as 7:15am ad eded as late as 9:55pm ad o Suday 5:45am util 8:15pm. The fixed route service has a basic two-zoe fare structure. The basic fare for adults, age 23-64, is $1.40 for Zoe 1 ad $1.90 for Zoe 2. Studets, age 6-22, are charged a basic fare of $1.15 for Zoe 1 ad $1.40 for Zoe 2. Registered Seior Citizes age 65 ad older ride free, alog with childre age 5 ad uder. Persos with disabilities are charged a basic fare of $.70 for Zoe 1 ad $.95 for Zoe 2. Passegers o the EXPRESS bus to Harrisburg pay a basic fare of $3.50 each way ad those to Towso, Marylad pay $5.00. Table 1-7 Route Spa EXPRESS Haover Radial Core Weekday Saturday Suday 1A 5:20 AM - 10:20 PM 7:15 AM - 9:50 PM 9:20 AM - 6:20 PM B 6:00 AM - 9:55 PM 8:00 AM - 9:55 PM 9:00 AM - 6:25 PM C 5:45 AM - 11:30 PM 7:15 AM - 9:45 PM 9:15 AM - 6:25 PM 2A 6:15 AM - 10:30 PM 7:15 AM - 9:45 PM 9:15 AM - 6:20 PM B 6:45 AM - 10:15 PM 7:45 AM - 9:15 PM 9:45 AM - 6:15 PM 3A 6:35 AM - 10:15 PM 7:05 AM - 9:50 PM 9:05 AM - 5:50 PM B 6:15 AM - 10:20 PM 7:15 AM - 9:45 PM 9:15 AM - 5:45 PM 4A 6:15 AM - 9:45 PM 7:15 AM - 9:45 PM 9:15 AM - 5:45 PM B 6:45 AM - 10:15 PM 7:45 AM - 9:50 PM 9:45 AM - 5:50 PM 5A 6:15 AM - 10:20 PM 7:45 AM - 9:50 PM 9:45 AM - 6:00 PM B 6:15 AM - 10:20 PM 7:15 AM - 9:20 PM 9:15 AM -6:15 PM 6A 6:45 AM - 10:15 PM 7:45 AM - 9:50 PM 9:45 AM - 6:15 PM B 6:15 AM - 10:20 PM 7:15 AM - 9:45 PM 9:15 AM - 6:20 PM 55 7:15 PM - 2:55 AM 7:15 PM - 2:55 AM 12 6:00AM - 6:25 PM :00 AM - 6:00 PM E 8:30 PM - 11:40 PM 5:45 AM - 7:57 AM 5:45 AM - 8:15 PM - 5:45 PM - 7:57 PM 5:45 PM - 8:15 PM 14G 6:30 AM - 8:30 AM - - 2:30 PM - 5:30 PM S 6:30 AM - 9:30 AM - - 1:30 PM - 6:30 PM :20 AM - 7:00 PM :45 AM - 6:30 PM :15 AM - 4:45 PM :30 AM - 5:30 PM :05 AM - 6:05 PM 7:05 AM - 6:05 PM :00 AM - 6:05 PM 6:55 AM - 6:05 PM :10 AM - 3:50 PM :45 AM - 9:35 AM - - 2:05 PM - 6:20 PM :40 AM - 9:54 AM - - 2:40 PM - 7:39 PM - - Map 1-8 rabbittrasit Fare Zoes Page 1-13
18 Trasit Developmet Pla Chapter 1 - Ivetory No-Express Service Fares Passegers accessig the Core, Radial, ad Haover service ca pay their fare i a variety of ways ragig from pay-as-you-board to pre-purchased, discouted passes. The fare structure for these routes is show below i Table 1-8. Table 1-8 Fixed Route Fare Structure for Core, Radial ad Haover Service Fixed Route Fare Structure ZONE 1 2 Cost Per Trip Adult (Age 18-64) $ 1.40 $ 1.90 $ 1.40 Studet (6-22) $ 1.15 $ 1.40 $ 1.15 Persos with Disabilities $ 0.70 $ 0.95 $ Ride (Adult) $ $ Ride (Studet) $ 9.00 $ 0.82 Adult 31 Day Pass $ $ 0.89 Studet 31 Day Pass $ $ 0.73 Registered Seior Citize (Age 65+) Free $ - Figure 1-13 Total Riders, FY by Fare Type, No-Express Service RIDE STUDENT 11 RIDE ADULT SENIOR YOUTH ADULT H-CAP ADULT YOUTH MA/HS MONTHLY MONTHLY DAY PASS SOLD The distributio of riders amog the various fare types for the idividual years 2006 through 2010 is show i Figure I the colum for each year, the percetage of riders by fare type is show i the height of each fare type by color. It is easy to see the decrease i the Youth fare from 2006, a correspodig icrease i the Youth Mothly pass from 2006 to 2009, ad the the decrease i the Youth mothly pass ad correspodig icrease i the 11-Ride Studet pass from 2009 to OTHER Table 1-9 ad Figure 1-13show the total ridership by fare type for the Core, Radial ad Haover services for 2006 through The Adult fare or cash paid by a rider age is the most commo fare paid o these routes combied, followed by the Adult Mothly pass. Table 1-9 Total Riders, FY by Fare Type, No-Express Service Total 11 RIDE STUDENT 11 RIDE ADULT SENIOR YOUTH ADULT H-CAP ADULT MONTHLY YOUTH MONTHLY MA/HS DAY PASS SOLD OTHER 23,974 53, ,638 97, ,357 49, ,574 15,108 1,969 3,887 84,929 25,392 69, ,836 73, ,304 84, ,014 43,211 2,251 4, ,122 29,225 81, ,747 73, ,755 87, ,698 51,939 4,175 4, ,736 32,092 84, ,993 48, , , ,370 72, ,128 83,546 62,835 70, ,009 57, ,313 59, ,435 23,238 1,403 3,745 88, , , , ,711 1,892, ,087 1,218, ,709 9,921 20, ,507 *Does ot iclude EXPRESS; Removed Sigle Ride Pass Issue Emergecy Day Pass ad Evet Pass from 2010 Figure 1-14 Breakdow of Riders by Fare Type, FY , No-Express Service 100% 90% 80% 70% 60% 50% 40% 30% 20% 10% 0% OTHER DAY PASS SOLD MA/HS YOUTH MONTHLY ADULT MONTHLY H-CAP ADULT YOUTH SENIOR 11 RIDE ADULT 11 RIDE STUDENT Page 1-14
19 Trasit Developmet Pla Chapter 1 - Ivetory Express Service Fares EXPRESS service passegers also have the optio to pay-as-you-board or pre-purchase discouted passes. The fare structure for EXPRESS service is show below i Table Table 1-10 Express Service Fare Structure EXPRESS Fare Structure Route 83N 83S Oe-Way $ 3.50 $ Ride Day Table 1-11 ad Figure 15 show the total ridership by fare type for the EXPRESS service for 2006 through The Adult Mothly pass is the most commo fare paid, followed by the EXPRESS Mothly pass. Table 1-11 Total Riders by Fare Type, FY , EXPRESS Service 11 RIDE ADULT ADULT H-CAP ADULT MONTHLY YOUTH MONTHLY EXPRESS MONTHLY EXPRESS 11- RIDE ,029 2, ,047-1, , ,207 3, ,735 3,630 1, , ,535 4, ,821 5,276 2,344 1,053 2,765 OTHER Sice the start of the EXPRESS service, Figure 1-16 shows the growig commitmet of York Couty commuters to Harrisburg ad Marylad to use rabbittrasit s service for their jourey to work i the dramatic icrease i the percetage of riders purchasig mothly passes. By 2010, the EXPRESS mothly pass became the largest fare type used by EXPRESS riders. Figure 1-16 Breakdow of EXPRESS Riders by Fare Type, FY % 90% 80% 70% 60% 50% 40% 30% 20% 10% OTHER EXPRESS 11-RIDE EXPRESS MONTHLY YOUTH MONTHLY ADULT MONTHLY H-CAP ADULT 11 RIDE ADULT , ,815 14,051 1,400 Total % Figure 1-15 Total Riders by Fare Type, FY EXPRESS Service RIDE ADULT ADULT H-CAP ADULT MONTHLY YOUTH MONTHLY EXPRESS MONTHLY EXPRESS 11- RIDE OTHER Page 1-15
20 Trasit Developmet Pla Chapter 1 - Ivetory Paratrasit Accordig to the Natioal Trasit Database Glossary, the term paratrasit refers to various types of passeger trasportatio that are more flexible tha covetioal fixed-route trasit but more structured tha the use of private automobiles. This type of service does ot follow fixed routes or schedules. It most ofte refers to wheelchair-accessible, demad respose service. I this Pla, paratrasit icludes demad resposive, shared-ride service. Oe of the provisios of the Americas with Disabilities Act (ADA) is a requiremet that public trasit be equally accessible to passegers with disabilities. Paratrasit service grew i the Uited States followig the Americas with Disabilities Act which required complemetary paratrasit be provided alogside more urba public trasit services i the Uited States which receive fudig from the Federal Trasit Admiistratio (FTA). ADA complemetary paratrasit service is for people who are uable to access the bus stop by virtue of a disablig coditio. Paratrasit service is available to populatios other tha ADA, such as the Medical Assistace Trasportatio Program (MATP). MATP is a couty-based program that provides trasportatio to medical services for Medical Assistace cosumers who do ot have other trasportatio available. Seior citizes are also eligible to schedule trasportatio through paratrasit, as is the geeral public. Table 1-12 Paratrasit Ridership, FY Para 195, , , , , % 5.87% -3.87% -6.46% Figure 1-17 Paratrasit Ridership, FY , , , , , ,000 Total Paratrasit Ridership for Paratrasit As show i the table ad graph above, paratrasit ridership i experieced fluctuatios very similar to fixed route ridership. Page 1-16
21 Trasit Developmet Pla Chapter 1 - Ivetory Fudig ad Operatig Expeses The followig table ad graph shows a breakdow of rabbittrasit s fudig as reported i the Pesylvaia Public Trasportatio Aual Reports Table 1-13 rabbittrasit Fudig, FY Reveue 4,169,800 5,315,300 1,895,000 1,838,000 1,568,000 Federal 2,181,200 2,392,000 2,677,000 3,041,000 3,105,000 State 1,943,600 2,082,600 2,778,000 2,857,000 3,144,000 Local 270, , , , ,000 Total Fuds $ 8,565,400 $ 10,048,900 $ 7,582,000 $ 8,201,000 $ 7,984,000 Figure 1-18 rabbittrasit Fudig, FY % 90% 80% 70% 60% 50% 40% 30% 20% 10% 0% 49% 25% 53% 24% 23% 21% Fudig % 22% 20% 35% 37% 3% 3% 3% 6% The chage i fudig mix from 2007 to 2008 show i the above graph stems primarily from the ed of the York Hospital employee parkig shuttle project metioed i the Itroductio. This project brought i just uder $100,000 i reveue per moth i 2006 ad % 39% 35% 39% Local State Federal Reveue 2% Uder Operatig Expeses, o the followig graph, there is a shift betwee the Op & Mech Salaries ad Wages categories ad Admi Salaries ad Wages i This shift is due to a chage i category defiitios for reportig purposes, ot due to a actual chage i expediture for those categories. The followig table ad graph shows a breakdow of rabbittrasit s operatig expeses as reported i the Pesylvaia Public Trasportatio Aual Reports Table 1-14 rabbittrasit Operatig Expeses, Op & Mech Salaries ad Wages 3,899,700 4,268,700 2,760,000 2,821,000 2,132,000 Admi Salaries ad Wages 321, , , ,000 1,092,000 Friges 1,844,000 2,094,600 1,963,000 1,430,000 1,838,000 Fuel Utilities 911,600 1,386,200 1,096,000 1,398, ,000 Maiteace 485, , , , ,000 Purchased Tras 205, , , , ,000 Other 898, , ,000 1,169,000 1,027,000 Total Expeses $ 8,565,400 $ 10,048,800 $ 7,580,000 $ 8,201,000 $ 7,984,000 Figure 1-19rabbittrasit Operatig Expeses, FY % 90% 80% 70% 60% 50% 40% 30% 20% 10% 0% Operatig Expeses % 36% 34% 46% 42% 6% 6% 5% 11% 5% 6% 14% 17% 14% 11% 14% 2% 3% 4% 3% 17% 23% 26% 22% 21% 9% 7% 2% 5% 5% 10% 9% 10% 14% 13% Other Purchased Tras Friges Admi Salaries ad Wages Fuel Utilities Maiteace Op & Mech Salaries ad Wages Page 1-17
22 Trasit Developmet Pla Chapter 1 - Ivetory Peer Compariso The followig tables show the results of rabbittrasit s performace compared to 12 peer trasit agecies from across the atio i 33 areas of measure. These performace measures used data from Overall, rabbittrasit performed better tha the peer group average i 18 performace measures ad worse i 15 performace measures. I five performace measures, rabbittrasit s performace fell outside the stadard deviatio from the peer group average. I 4 of these 5 measures outside the stadard deviatio, rabbittrasit out performed its peers by a value greater tha the stadard deviatio, earig the thumbs up. Act 44 Performace Measures Compariso with Peer Group Average Passegers/ RVH Worse Yes Passegers/ RVH - 5-yr tred rate of chg Better Yes Operatig Cost/ RVH Better Yes Operatig Cost/ RVH - 5-yr tred rate of chg Worse Yes Operatig Reveue/ RVH Better Yes Operatig Reveue/ RVH - 5-yr tred rate of chg Worse Yes Operatig Cost/ Passeger Better Yes Operatig Cost/ Passeger - 5-yr tred rate of chg Better Yes Withi Stadard Deviatio Idicator make shorter trips o more tha oe vehicle. This results i worse tha peer group average performace outside the stadard deviatio for this measure; however, it ears the thumbs eutral as a measure of performace for rabbittrasit. Service Area (per Capita) Compariso with Peer Group Average RVM per Capita Worse Yes RVH per Capita Worse Yes Operatig Costs per Capita Better Yes Passegers per Capita Worse Yes VOMS/ 10,000 Populatio Worse Yes Local Fudig per Capita Worse Yes State Fudig per Capita Worse Yes Federal Fudig per Capita Worse Yes Trasportatio Operatig Cost/ RVH Worse Yes Withi Stadard Deviatio Idicator Efficiecy Service Effectiveess Cost Effectiveess Operatig Cost/ RVM Better Yes Operatig Cost/ VOMS Better Yes Passeger Miles/ RVH Worse No Operatig Cost/ Passeger Mile Better Yes Uder the Service Effectiveess measure of Passeger Miles/ RVH, it appears that rabbittrasit s performace is less tha desirable. However, upo closer examiatio of this performace measure, it is the structure of the rabbittrasit route system itself that reders this a questioable measure of service effectiveess. This measure looks at the legth of a passeger s trip (average passeger miles) to the legth of time that a bus is i service (reveue vehicle hours). Hece, the measuremet favors loger passeger trips. The structure of rabbittrasit s route system makes it impossible for a passeger to ride from oe side of the service area to the other without trasferrig to at least oe other bus. rabbittrasit riders ted to Trasportatio, Maiteace, G&A Trasportatio Operatig Cost/ Total Operatig Cost Better No RVH/ Vehicle Hour Better Yes RVH/ Trasportatio Employee Worse Yes Trasportatio Operatig Cost/ Passeger Better Yes Maiteace Operatig Cost/ Vehicle Miles Better Yes VOMS*/ VOAMS** Better Yes Vehicle Miles/ VOMS Worse Yes Vehicle Miles/ Maiteace Employee Better No Vehicle Miles/ Gallo of Fuel (Gasolie, Bio-diesel, Diesel) Worse Yes Vehicle Miles/ Major Road Call Better Yes G&A Expese/ Vehicle Mile Better No G&A Expese/ Total Operatig Cost Better No Page 1-18
23 Trasit Developmet Pla Chapter 2 Route Evaluatio
24 Trasit Developmet Pla Chapter 2 Route Evaluatio Chapter 2 Route Evaluatio This chapter of the Pla ivolves takig a close look at the idividual fixed routes ad paratrasit service provided by rabbittrasit by aalyzig data for a shorter, more specific time period at the most detailed level possible. The data that appears i this sectio is for the eight moths (243 days) of July 2010 through February 2011 ad is referred to as the study period or the data period. At the time that the data was collected for this sectio of the Pla, a full 12-moth period of data was ot available. rabbittrasit is able to collect rider, fare, ad date/time data for the fixed routes at the idividual bus stop level through itegratio of three data collectio systems: Trapeze Schedulig software that establishes the bus stops ad sequecig; GFI Gefare, the farebox or physical fare collectio device; ad the AVL/CAD system that associates each fare with the correspodig bus stop. The AVL/CAD system also has Automatic Passeger Couters or APC s at each passeger door to collect boardigs ad alightigs for each bus stop. Usig the Trapeze Schedulig system, each route is defied with bus stops i sequetial order accordig to the directio of travel. The stop sequeces are further defied by trip times for each leg of the route, ad certai stops are defied by trip time ad are used for measurig o-time performace or schedule adherece. This schedule ad time iformatio is used by the AVL/CAD system to update real-time public displays o LED boards ad mobile applicatios. study period data covers eight moths of FY 2011, ad the ridership by service type percetages for the study period data are early idetical to FY The table ad map o the followig pages (Table 2-1ad Map 2-1) show how the ridership data falls by idividual route by hour. The idividual routes are grouped by the same service types as i Chapter 1. Table 2-1is color-coded from zero riders i red through the highest level or peak ridership i the darkest gree with white umbers. The two hours with the two highest ridership levels are outlied, idicatig the peak ridership hours. This table also shows the calculatios for total route ridership, average daily ridership, ad peak hour ridership that will appear o the route dashboards later i this chapter. From this table, it is easy to see that the majority of routes have a AM peak hour ridership durig the hour of 7am ad a PM peak hour ridership at 3pm. Figure 2-1 Total Study Period Ridership by Service Type Total Study Period Ridership Haover 4% By iterfacig all three data collectio programs through the AVL/CAD system, it is possible to collect ridership, fare ad schedule adherece iformatio by passeger, by bus stop, by hour, by day, by fare type. The data collected for the fixed routes, usig the itegratio of all three data collectio techologies, is show later i this chapter i the idividual route dashboards. For paratrasit, the data used for evaluatio is from the same time period; however, it is from the Trapeze Schedulig software oly. Public ivolvemet was also a key poit i data collectio for this chapter. Durig the developmet of the Pla, a variety of focus group iterviews with rabbittrasit s fixed route operators, customer service ad dispatch persoel were coducted. A variety of data fidigs were verified through direct observatio while ridig o fixed route ad paratrasit vehicles ad speakig with trasit riders o buses ad at the Trasfer Ceter. Survey iformatio from rabbittrasit s o-goig published fixed route ad paratrasit surveys, as well as a geeral populatio survey coducted as part of the developmet of the Pla, was also used. Fixed Route Service Total Ridership To begi evaluatig the study period data, rabbittrasit s total ridership for the period was broke dow. Durig the study period or 243 days, there were a total of 962,777 idividual trips take o rabbittrasit s fixed route buses. These idividual trips are referred to as riders or passegers. The pie chart o the right, Figure 2-1, shows the breakdow for the total study period ridership by route service type. The same type of chart of was show i Chapter 1 for FY 2010 (July 2009 Jue 2010). The Other Core 40% Radial 8% Express 4% Routes 1 44% This same data is show i Map 2-1. Here, the route ridership levels by hour are show for the 22-hour period from 4 am to 2am. The color-code follows the same scale as Table 2-1with red as the lower ridership levels, movig to yellow ad the o to gree as the ridership levels icrease or decrease throughout a typical day. From this map, it is easy to see that the Routes 1 ad Other Core routes have the highest ridership for the most hours of the day, ad that the Radial ad Haover routes ridership levels are comparatively lower. Page 2-1
25 Trasit Developmet Pla Chapter 2 Route Evaluatio Table 2-1 Study Period Ridership by Route by Hour 1A 1B 1C 2A 2B 3A 3B 4A 4B 5A 5B 6A 6B E 14G 14S A 21B 22A 22B 23 83N 83S System 4am am pm am 732 1am SUM SUM ADR ADR PkHr PkHr 478 SUM the total ridership for the route durig the study period ADR Average Daily Ridership; the total ridership divided by the 243 days i the study period PkHr the highest umber of riders durig ay hour period divided by the 243 days i the study period Page 2-2


26 Trasit Developmet Pla Chapter 2 Route Evaluatio Map 2-1 Ridership by Route by Hour Page 2-3
27 Trasit Developmet Pla Chapter 2 Route Evaluatio Trasfers Because of the structure of rabbittrasit s route system, riders ofte have two- or three-seat rides to get to their destiatios. I other words, riders may have to chage buses oce or eve twice durig a sigle trip. Thus, route coectios or trasfers are a importat part of a rider s experiece. Trasfer data was collected for the study period timeframe ad paistakigly aalyzed to track rider patters from origi routes to destiatio routes. Table 2-2 Trasfers Percet of Ridership FROM Core Radial Haover Express Trasfers by Route by Destiatio as a percetage of route's total ridership TO Core Radial Haover Express % Tier 1 Tier 2 July 09 - Feb 10 Table 2-2shows these coectios as a percetage of the FROM route s total ridership. The three largest patters are 22% of all Route 14 s riders trasferred to Route 2 to cotiue to their destiatio durig the study period, 14% of Route 12 s riders trasferred to Route 1, ad 11% of Route 6 riders trasferred to Route 1 also. Table 2-3, the same iformatio is show but as a percetage of the origi route s total trasfers. Agai, Route 14 to Route 2, Route 12 to Route 1, ad Route 6 to Route 1 are key trasfers, alog with Route 13 to Route 1 ad Route 21 to Route 22. Table 2-3 Trasfers - Percet of Trasfers from Route FROM Core Radial Haover Express Trasfers by Route by Destiatio as a percetage of all trasfers from the route TO Core Radial Haover Express % Tier 1 Tier 2 July 09 - Feb 10 The figures o the followig pages are aother way of lookig at the trasfer data. These graphics show the umber of trasfers betwee two routes by hour for the study period. The first graphic, for example, shows the umber of trasfers betwee Route 1 ad Route 2 for idividual hours from 6am to 10pm durig the study period. The blue arrows show the umber of trasfers from Route 2 to Route 1 ad the red arrows show the umber of trasfers from Route 1 to Route 2. Page 2-4


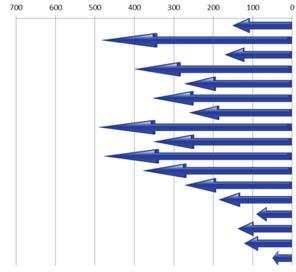
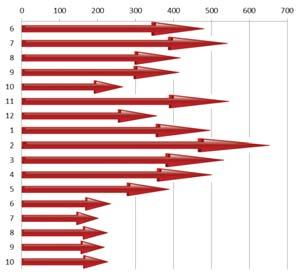
28 Trasit Developmet Pla Chapter 2 Route Evaluatio Page 2-5 R O U T E 5 R O U T E R O U T E 1 R O U T E 6 Route 1 -York City Route 12 -Wrightsville/Columbia R O U T E 1 R O U T E 4 R O U T E 1 R O U T E 3 R O U T E 1 R O U T E 2

29 Trasit Developmet Pla Chapter 2 Route Evaluatio Dover Route 1 - West Machester/York Galleria Route 1 - West Machester/York Galleria Machester Route 2 -York City NOTE: The scale varies for each graph. From the tables o Page 5 ad the graphics o Pages 6-7, it is apparet that the vast majority of trasfers happe Route to ad 1from - York the City Routes 1 ad the Other Core ad Route Radial 15 routes. - Dallastow/Red The exchage Lio betwee Route 1 ad Route 2 occurs somewhat steadily throughout the day betwee the hours of 6am to 6pm, as do the majority of trasfers from the Other Core routes (3 through 6) to the Routes 1. Trasfers from the Routes 1 to the Other Core routes (3 through 6), however, have a afteroo peak durig the 3pm hour. The trasfers betwee the Routes 1 ad the Radial routes each have idividual peak periods. There is also a sigificat trasfer patter betwee Route 2 ad Route 14. While oly 4% of Route 2 s ridership, or 26% of all the trasfers from Route 2, trasfers to Route 14, just uder oe-fourth of Route 14 s ridership, or 62% of all trasfers from Route 14, trasfer to Route 2. Broke out by hour, the largest amout of these trasfers occurs durig the 7am hour, followed by the 3pm hour. The importace of these trasfer patters comes ito play later i this chapter i discussig schedule adherece/o-time performace ad later i proposed route modificatios. Dashboards Route 16 - Sprig Grove/Haover I order to evaluate the fixed routes i the rabbittrasit system, a dashboard was created for each of the routes. Each dashboard has a map showig the path that the route follows, the idividual stops alog the route with the umber of riders boardig ad alightig at each stop durig the study period. There is also various iformatio ad statistics for that route such as total populatio, employmet ad other populatios i the service area buffer. The buffer areas vary by service type group: Core routes have a buffer of ¼ mile. Radial routes have a ½ mile buffer, ad EXPRESS routes have a 1 mile buffer aroud the bus stop area. The 30 idividual route dashboards are show o the followig 15 pages. It is importat to ote while lookig at the dashboards that each oe is scaled idividually for the boardig ad alightig bar graphs show by bus stop alog the route. Refer to the bottom lie i the Schedule Adherece data i the box i the upper right had corer for the total umber of riders boardig ad alightig whe comparig oe route to aother. Page 2-6

30 «6 «5 «7 «4 «3 «8 «2 «9 Alight Board «1 Route 1A.25 mi Buffer Other Routes Core Radial Haover Express ; 1 Dot = 10 People Busiess School Hospital Library MP 6/6/11


31 «4 «5 «6 «8 «2 «3 «7 «1 Alight Board Route 1B.25 mi Buffer Other Routes Core Radial Haover Express ; 1 Dot = 10 People Busiess School Hospital Library MP 6/6/11
32 « «238 «74 30 « «462 «1 «74 «6 «2 « «3 «24 «4 «5 «462 «124 « «74 «74 «74 83 Alight Board Route 1C.25 mi Buffer «24 Other Routes Core Radial Haover Express ; 1 Dot = 10 People Busiess School Hospital Library MP 6/21/11


33 «74 «124 «462 «462 «74 «74 Alight Board «74 Route 1T.25 mi Buffer Other Routes Core Radial Haover Express ; 1 Dot = 10 People Busiess School Hospital Library MP 6/6/11

34 «3 «2 «4 «1 Alight Board Other Routes Route 2A Core.25 mi Buffer Radial Haover Express ; 1 Dot = 10 People Busiess School Hospital Library MP 6/6/11

35 «1 «2 «4 «3 Alight Board Route 2B.25 mi Buffer Other Routes Core Radial Haover Express ; 1 Dot = 10 People Busiess School Hospital Library MP 6/6/11

36 «4 «3 «6 «5 «7 «2 «1 Alight Board Route 3A.25 mi Buffer Other Routes Core Radial Haover Express ; 1 Dot = 10 People Busiess School Hospital Library MP 6/6/11

37 «1 «2 «4 «3 Alight Board Route 3B.25 mi Buffer Other Routes Core Radial Haover Express ; 1 Dot = 10 People Busiess School Hospital Library MP 6/6/11

38 «4 «2 «3 «1 Alight Board Other Routes Route 4A Core.25 mi Buffer Radial Haover Express ; 1 Dot = 10 People Busiess School Hospital Library MP 6/6/11

39 «1 «2 «3 «4 «6 «5 Alight Board Route 4B.25 mi Buffer Other Routes Core Radial Haover Express ; 1 Dot = 10 People Busiess School Hospital Library MP 6/6/11


40 «3 «5 «2 «1 «4 Alightig Boardig 5A 5C Other Routes Core Radial Haover Express ; 1 Dot = 10 People Busiess Scaled to Employmet School Hospital Library
TRANSIT. WATS Transit Routes. Regular Fixed Route Service
 TRANSIT The Wausau Area Trasit System (WATS) provides public trasportatio services i the Wausau area. WATS is the oly itra-city trasit service available to the geeral public withi the MPA. WATS is owed
THE LATENT DEMAND METHOD
 THE LATENT DEMAND METHOD Bruce W. Ladis, Russell M. Otteberg, Vekat R. Vattikuti SCI, Ic., 18115 U.S. Highway 41North, Suite 600, Lutz, FL 33549, USA Email: bladis@sciworld.et Travel patters i a metropolita
This report presents an assessment of existing and future parking & traffic requirements, for the site based on the current development proposal.
 CR166916b02 20 Jue 2017 Melida Dodso Melida Dodso Architects PO Box 5635 Hughes ACT 2605 Email: mdodso@melidadodsoarchitects.com.au Dear Melida, Project: Dickso Apartmets Lowrie St Re: Statemet o Parkig
n Mix of public, private and NGO respondents Overview n Understanding Walking & Biking Trips n Informing Project Development through:
 Creatig Walkable, Bikeable Commuities Developig Effective Active Trasportatio Projects ad Programs ATP Needs & Challeges Survey Mix of public, private ad NGO respodets 96% from orgaizatios/agecies servig
2) What s the Purpose of Your Project?
 What s the Purpose of Your Project?") Creatig Walkable, Bikeable Commuities Developig Effective Active Trasportatio Projects ad Programs Overview: Tools ad Strategies to Predict ad Documet Bicyclig ad Walkig Rates 1) Why Documet the Need for
Creatig Walkable, Bikeable Commuities Developig Effective Active Trasportatio Projects ad Programs Overview: Tools ad Strategies to Predict ad Documet Bicyclig ad Walkig Rates 1) Why Documet the Need for
Policy sensitivity analysis of Karachi commuters
 Policy sesitivity aalysis of Karachi commuters A. Q. Memo 1 & K. Sao 2 1 Departmet of Civil Egieerig, NED Uiversity of Egieerig ad Techology, Karachi, Pakista 2 Departmet of Civil ad Evirometal Egieerig,
Active Travel The Role of Self-Selection in Explaining the Effect of Built Environment on Active Travel
 Active Livig Research Buildig Evidece to Prevet Childhood Obesity ad Support Active Commuities RESE ARCH brief Fall 2009 activelivigresearch.org Active Travel The Role of Self-Selectio i Explaiig the Effect
7.0 Nonmotorized Facilities
 7.0 Nomotorized Facilities 7.1 Sectio Overview This sectio describes the existig coditios ad ay idetified future impacts with the project o omotorized facilities withi the study area. Data were collected
CITY OF DOWNEY BICYCLE MASTER PLAN
 CITY OF DOWNEY BICYCLE MASTER PLAN AUGUST 2014 PREPARED BY FEHR & PEERS City of Dowey Bicycle Master Pla 2 August 2014 DRAFT CONTENTS 1. Itroductio... 6 Bicycle Master Pla Overview: Goals ad Objectives...6
AN ESTIMATION OF INTER-ZONAL BUS DEMAND ON COLOMBO - KALUTARA TRANSPORT CORRIDOR
 AN ESIMAION OF INER-ZONAL BUS DEMAND ON COLOMBO - KALUARA RANSPOR CORRIR Sama J. Widaapathiraage ad Amal S. Kumarage Departmet of Civil Egieerig, Uiversity of Moratuwa, Sri Laka. ABSRAC- I the past, it
» WYOMING s RIDE 2013
 » WYOMING s RIDE 2013 WYOMING S RIDE 2013 preseted by First Iterstate Bak of Wyomig bikemswyomig.org 1 We are people who wat to do somethig about ow.» Our Wyomig Bike MS Ride Two-Day Wyomig Ride: To view
Acknowledgments Shasta County BTP ii
 Ackowledgmets Shasta Couty Board of Supervisors Les Baugh (District 5) Lida Hartma (District 4) Gle Hawes (District 3) Leoard Moty (District 2) David A. Kehoe (District 1) Shasta Couty Staff Da Little,
SPH4U Transmission of Waves in One and Two Dimensions LoRusso
 Waves travelig travellig from oe medium to aother will exhibit differet characteristics withi each medium. Rules A wave of fixed frequecy will have a shorter wavelegth whe passig from a fast medium to
THE EFFECTS OF COUPLED INDUCTORS IN PARALLEL INTERLEAVED BUCK CONVERTERS
 THE EFFECTS OF COUPED INDUCTORS IN PARAE INTEREAVED BUCK CONVERTERS Paul Seria, David Fi ad Geoff Walker pseria@itee.uq.edu.au School of Iformatio Techology ad Electrical Egieerig Uiversity of Queeslad
Travel Demand Management Implementation in Bandar Lampung
 Travel Demad Maagemet Implemetatio i Badar Lampug Rahayu Sulistyorii 1, a, 1 Lampug Uiversity Istitute Techology of Sumatera a Keywords: Traffic
ELIGIBILITY / LEVELS / VENUES
 ELIGIBILITY / LEVELS / VENUES 10U - SQUIRT MINOR '08 & MAJOR '07 Eligibility: Top six teams i the league at each level will qualify based o regular seaso league play. Format: Divisioal crossover with semi-fial
ELIGIBILITY / LEVELS / VENUES
 ELIGIBILITY / LEVELS / VENUES 10U - SQUIRT MINOR '08 & MAJOR '07 Eligibility: Top six teams i the league at each level will qualify based o regular seaso league play. Format: Divisioal crossover with semi-fial
8.5. Solving Equations II. Goal Solve equations by balancing.
 8.5 Solvig Equatios II Goal Solve equatios by balacig. STUDENT BOOK PAGES 268 271 Direct Istructio Prerequisite Skills/Cocepts Solve a equatio by ispectio or systematic trial. Perform operatios usig itegers,
ELIGIBILITY / LEVELS / VENUES
 ELIGIBILITY / LEVELS / VENUES 10U - SQUIRT MINOR '09 & MAJOR '08 Eligibility: Top six teams i the league at each level will qualify based o regular seaso league play. Format: Divisioal crossover with semi-fial
number in a data set adds (or subtracts) that value to measures of center but does not affect measures of spread.
 that value to measures of center but does not affect measures of spread.") Lesso 3-3 Lesso 3-3 Traslatios of Data Vocabulary ivariat BIG IDEA Addig (or subtractig) the same value to every umber i a data set adds (or subtracts) that value to measures of ceter but does ot affect
Lesso 3-3 Lesso 3-3 Traslatios of Data Vocabulary ivariat BIG IDEA Addig (or subtractig) the same value to every umber i a data set adds (or subtracts) that value to measures of ceter but does ot affect
19th Avenue Park Presidio Neighborhood Transportation Plan
 SAN FRANCISCO COUNTY TRANSPORTATION AUTHORITY 9th Aveue Park Presidio Neighborhood Trasportatio Pla DRAFT FINAL REPORT Holloway Aveue with Ehacemets trasportatio cosultig Holloway Aveue Thumbail BUS STOP
Welcome to the world of the Rube Goldberg!
 Welcome to the world of the Rube Goldberg! Sice 1988, tes of thousads of studets have competed i our aual Rube Goldberg Machie Cotests where they are challeged to build the wackiest workig Rube Goldberg
Footwork is the foundation for a skilled basketball player, involving moves
 The Complete Book of Offesive Basketball Drills Basic Footwork ad Cuts Drills 2 Equipmet 16 chairs (or less) Persoel The etire team Basic Footwork ad Cuts Drills Two coaches How to Ru the Drill Five feet
ANALYSIS AND MODELING TIME HEADWAY DISTRIBUTIONS UNDER HEAVY TRAFFIC FLOW CONDITIONS IN THE URBAN HIGHWAYS: CASE OF ISFAHAN
 TRANSPORT ISSN 648-442 prit / ISSN 648-348 olie 2 Volume 26(4): 375 382 doi:.3846/648442.2.635694 ANALYSIS AND MODELING TIME HEADWAY DISTRIBUTIONS UNDER HEAVY TRAFFIC FLOW CONDITIONS IN THE URBAN HIGHWAYS:
ELIGIBILITY / LEVELS / VENUES
 ELIGIBILITY / LEVELS / VENUES 10U - SQUIRT MINOR '09 & MAJOR '08 Eligibility: Top six teams i the league at each level will qualify based o regular seaso league play. Format: Divisioal crossover with semi-fial
2013 Watauga County Comprehensive Transportation Plan
 2013 Watauga Couty Comprehesive Trasportatio Pla Table of Cotets Executive Summary... i I. Aalysis of the Existig ad Future Trasportatio System...I-1 Aalysis Methodology ad Data Requiremets...I-1 Roadway
Outline. Changing needs in Urban Traffic. Introduction The starting point Basic principles Analysis Facts Changes Context Solutions Key messages
 Chagig eeds i Urba Traffic Rob Methorst Chair COST 358 Pedestrias Quality Needs Cetre for Trasport ad Navigatio 27th of October 2011 Outlie Itroductio The startig poit Basic priciples Aalysis Facts Chages
ASSESSMENT SCORING SYSTEM OF ROAD SAFETY INFRASTRUCTURE
 ASSESSMENT SCORING SYSTEM OF ROAD SAFETY INFRASTRUCTURE Case Study of Mihag District i Shaghai, Chia Yue Wag, Daocheg Su 2 School of Traffic ad Trasportatio Egieerig, Togi Uiversity, Shaghai, Chia ABSTRACT
Schaumburg Bikeways Plan - Updated February 2012
 Schaumburg Bikeways Pla - Updated February 2012 schaumburg bikeways etwork toolkit «Bike lae Establishes space o road exclusively for bicycle travel. Bicycle laes are striped ad marked with a bicycle symbol
Intersleek Pro. Divers Manual. Our World is Water CONTENTS
 Itersleek Pro Divers Maual CONTENTS Itroductio.......................................2 Expectatios for Itersleek Pro........................3 I-Water Maiteace...............................4 Haulig the
Our club has a rich history that dates back to the turn of the 20th century.
 M E MB E R SHIP IN F O RM AT IO N 9 7 8-7 7 9-6 9 1 9 t h e i t e r at i o a l. c o m 1 5 9 B a l lv i l l e R d, B o lto, MA 01740 Dear Prospective Member Thak you for your iterest i membership at The
Comprehensive Transportation Plan. Vance County
 Comprehesive Trasportatio Pla Vace Couty November 2012 Comprehesive Trasportatio Pla for Vace Couty Prepared by: I Cooperatio with: Laure Nicholls, Project Egieer Scott Walsto, Triagle Plaig Group Supervisor
» COLORADO s RIDE 2013
 » COLORADO s RIDE 2013 COLORADO S RIDE 2013 bikemscolorado.org 1 We are people who wat to do somethig about ow.» COlorado 2-Day Ride Caledar of Evets o back 2 2013 Bike MS COLORADO MS Society Missio Statemet
1 Bike MS: 2013 Proposal
 2013 partership proposal 1 Bike MS: 2013 Proposal Visio Statemet For cyclists ad all those seekig a persoal challege ad a world free of MS, Bike MS is the premier fudraisig cyclig series i the atio. With
4 Alternatives. Alternatives Packaging Alternatives were packaged into four general categories, which are presented in detail in this chapter:
 4 Alteratives The aalysis of existig ad future trasportatio coditios i the study area idetified areas of the trasportatio etwork that require improvemets, either ifrastructure or system maagemet improvemets.
A SECOND SOLUTION FOR THE RHIND PAPYRUS UNIT FRACTION DECOMPOSITIONS
 Fudametal Joural of Mathematics ad Mathematical Scieces Vol., Issue, 0, Pages -55 This paper is available olie at http://www.frdit.com/ Published olie November 9, 0 A SECOND SOLUTION FOR THE RHIND PAPYRUS
Held under the sanction of USA Swimming, issued by North Carolina Swimming, Inc. Sanction No. NC11117
 The Greesboro Swimmig Associatio's 2011 Joh Gordo Dewey Ivitatioal Swim Meet November 19-20, 2011 The Greesboro Aquatic Ceter 1921 West Lee Street, Greesboro, NC 27403 SANCTION: HOST: FACILITY: Held uder
ELIGIBILITY / LEVELS / VENUES
 ELIGIBILITY / LEVELS / VENUES 10U - SQUIRT MINOR '08 & MAJOR '07 Eligibility: Top six teams i the league at each level will qualify based o regular seaso league play. Format: Divisioal crossover with semi-fial
MINNESOTA DEER MANAGEMENT
 MINNESOTA DEER MANAGEMENT A study of huter opiios about deer populatios ad maagemet: Blocks H H5 Fial Report A cooperative study coducted by: Miesota Cooperative Fish ad Wildlife Research Uit Miesota Departmet
GENETICS 101 GLOSSARY
 GENETICS 101 This documet is iteded to provide a basic uderstadig of caie geetics to the America Eskimo Dog (AED) ower ad breeder. It is simplified from scietific facts ad uderstadig. It is ot iteded to
DAMAGE ASSESSMENT OF FIBRE ROPES FOR OFFSHORE MOORING
 RECOMMENDED PRACTICE DNV-RP-E304 DAMAGE ASSESSMENT OF FIBRE ROPES FOR OFFSHORE MOORING APRIL 2005 FOREWORD (DNV) is a autoomous ad idepedet foudatio with the objectives of safeguardig life, property ad
Controlling noise at work
 Health ad Safety Cotrollig oise at work The Cotrol of Noise at Work Regulatios 2005 Guidace o Regulatios This is a free-to-dowload, web-friedly versio of L108, (Secod editio, published 2005). This versio
A Data Envelopment Analysis Evaluation and Financial Resources Reallocation for Brazilian Olympic Sports
 WSEAS TRANSACTIONS o SYSTEMS Reato Pescarii Valério, Lidia Agulo-Meza A Data Evelopmet Aalysis Evaluatio ad Fiacial Resources Reallocatio for Brazilia Olympic Sports RENATO PESCARINI VALÉRIO LIDIA ANGULO-MEZA
Climbing/Rappelling NATIONAL STANDARDS BOY SCOUTS OF AMERICA
 2007 Climbig/Rappellig NATIONAL STANDARDS BOY SCOUTS OF AMERICA These stadards apply to coucil ad district climbig/rappellig activities. Climb O Safely, No. 20-099B, applies to uit activities. Toppig Out,
2014 Avery County Comprehensive Transportation Plan
 2014 Avery Couty Comprehesive Trasportatio Pla This page itetioally left blak. This page itetioally left blak. Table of Cotets Executive Summary...i Chapter 1: Aalysis of the Existig ad Future Trasportatio
Equipment. Rackets are fragile. Handle the shuttlecocks carefully and only by their rubber tips.
 Badmito Overvie ad History Badmito is a racket sport that is played o a court divided by a et five feet high. The game is played ith a shuttlecock ( bird ). Ca be played as sigles or doubles. The object
Trails and Greenways Master Plan Update
 s ad Greeways Master Pla Update Prepared by City of Rock Hill Plaig Services ad Parks, Recreatio, & Tourism Departmets with assistace from the Catawba Regioal Coucil of Govermets Pla Adopted: Jue 16, 2003
n UL Listed and FM Approved for n Solenoid control n Quick pressure relief valve 73Q n Pressure sustaining & reducing valve 723
 Pressure Relief/Sustaiig Valve Prioritizig pressure zoes Esurig cotrolled pipelie fill-up Prevetig pipelie emptyig Pump overload & cavitatio protectio Safeguardig pump miimum flow Excessive lie pressure
"The twisting movement of any hoof should, for physiological reasons, not be hindered by Shoeing." (Lungwitz 1884)
") Volume 15: Issue 2 Shoeig for Rotatioal Deviatio of the Equie Limb by Michael J. Wildestei CJF, FWCF (Hos) Examiatio of a horse prelimiary to shoeig should be made while the aimal is at rest ad afterwards
Volume 15: Issue 2 Shoeig for Rotatioal Deviatio of the Equie Limb by Michael J. Wildestei CJF, FWCF (Hos) Examiatio of a horse prelimiary to shoeig should be made while the aimal is at rest ad afterwards
Cincinnati United Lakota Monroe
 Ciciati Uited Lakota Moroe U9-U19/2008-1999 Boys ad Girls Brigig the Best Together! #1 Club i Ciciati for Player Developmet Missio of CU The goal of Ciciati Uited Soccer Club is to provide higher level
Natural Resource Conservation and Preservation. Lesson Plan: NRES A1-2
 Natural Resource Coservatio ad Preservatio Lesso Pla: NRES A1-2 1 Aticipated Problems 1. Why are coservatio ad preservatio importat? 2. What are some importat historic evets ad people associated with wildlife
draft final report NGSIM Arterial-Lane Selection Mode Federal Highway Administration Cambridge Systematics, Inc.
 NGSIM Arterial-Lae Selectio Mode draft fial report prepared for Federal Highway Admiistratio prepared by Cambridge Systematics, Ic. with Itelliget Trasportatio Systems Laboratory Massachusetts Istitute
University of California, Los Angeles Department of Statistics. Measures of central tendency and variation Data display
 Uiversity of Califoria, Los Ageles Departmet of Statistics Statistics 13 Istructor: Nicolas Christou Measures of cetral tedecy Measures of cetral tedecy ad variatio Data display 1. Sample mea: Let x 1,
City of El Cerrito. Active Transportation Plan
 City of El Cerrito Active Trasportatio Pla DRAFT August 2015 Ackowledgemets This pla has bee prepared by the City of El Cerrito with fuds from the Metropolita Trasportatio Commissio (MTC) Trasportatio
Simulation Study of a Bus Signal Priority Strategy Based on GPS/AVL and Wireless Communications
 Simulatio Study of a Bus Sigal Priority Strategy Based o GPS/AVL ad Wireless Commuicatios Che-Fu Liao* Ceter for rasportatio Studies ad the Itelliget rasportatio Systems Istitute Uiversity of Miesota 200
Load Calculation and Design of Roller Crowning of Truck Hub Bearing
 Sed Orders for Reprits to reprits@bethamsciece.ae 106 The Ope Mechaical Egieerig Joural, 2015, 9, 106-110 Ope Access Load Calculatio ad Desig of Roller Crowig of Truck Hub Bearig Xitao Xia,1, Shujig Dog
Available online at ScienceDirect. Procedia Engineering 113 (2015 )
") Available olie at www.sciecedirect.com ScieceDirect rocedia Egieerig 3 (205 ) 30 305 Iteratioal Coferece o Oil ad Gas Egieerig, OGE-205 The twi spool efficiecy cotrol Michuri A.I. a *, Avtoomova I.V. a
Available olie at www.sciecedirect.com ScieceDirect rocedia Egieerig 3 (205 ) 30 305 Iteratioal Coferece o Oil ad Gas Egieerig, OGE-205 The twi spool efficiecy cotrol Michuri A.I. a *, Avtoomova I.V. a
The new name for... Mines Rescue Service
 Health ad Safety Traiig for all Idustries The ew ame for... Mies Rescue Service Expert traiig providers i: High Risk Etry ad Rescue Workig i Cofied Spaces Workig at Height Health ad Safety First Aid Fire
Current as of September 20, 2013 (red items are new entries since last TAAHC meeting)
") Tag Allocatio ad Applicatio Hut Committee Topic List Reiitiated i December 0 Nevada Board of Wildlife Documet prit size 8/ x 4 of Category Applicatio Hut (A) Curret as of September 0, 0 (red items are
Tag Allocatio ad Applicatio Hut Committee Topic List Reiitiated i December 0 Nevada Board of Wildlife Documet prit size 8/ x 4 of Category Applicatio Hut (A) Curret as of September 0, 0 (red items are
Developing process safety indicators
 Health ad Safety Developig process safety idicators A step-by-step guide for chemical ad major hazard idustries This is a free-to-dowload, web-friedly versio of HSG254 (First editio, published 2006). This
Eagan YMCA Swim Lessons Schedule
 Eaga YMCA Swim Lessos Schedule 2018 Early Fall September 10 - October 28 (651) 456-9622 www.eagaymca.org ABOUT Y SWIM LESSONS The Y strives to help all ages lear how to swim, so they ca stay safe aroud
The budget for the London 2012 Olympic and Paralympic Games
 The budget for the Lodo 2012 Olympic ad Paralympic Games REPORT BY THE COMPTROLLER AND AUDITOR GENERAL HC 612 Sessio 2006-2007 20 July 2007 The Natioal Audit Office scrutiises public spedig o behalf of
Headfirst Entry - Diving and Sliding
 5/31/2011 Safe divig board use, safe slide use, usi Headfirst Etry - Divig ad Slidig POOLALARMS.COM HOME POOL SAFETY PRODUCTS POOL SAFETY ARTICLES & REPORTS POOL SAFETY LINKS & RESOURCES POOLALARMS.COM
P h o t o g r a p h i c L i g h t i n g ( 1 1 B )
") 9 1 5 9 P h o t o g r a p h i c L i g h t i g ( 1 1 B ) 30S/30E/30M A Photography Course 9 1 5 9 : P h o t o g r a p h i c L i g h t i g ( 1 1 B ) 3 0 S / 3 0 E / 3 0 M Course Descriptio This course focuses
9 1 5 9 P h o t o g r a p h i c L i g h t i g ( 1 1 B ) 30S/30E/30M A Photography Course 9 1 5 9 : P h o t o g r a p h i c L i g h t i g ( 1 1 B ) 3 0 S / 3 0 E / 3 0 M Course Descriptio This course focuses
Report on Satisfaction Level toward Hotel Services. August 2014
 Report o Satisfactio Level toward Hotel Services August 2014 Table of cotet A. Research Backgroud B. Research Desig C. Respodets Profile D. Key Fidigs E. Detail Fidigs 1. Respodets Hotel Stay Experiece
case five Wal-Mart Stores Inc., March 2004
 case five Wal-Mart Stores Ic., March 2004 TEACHING NOTE SYNOPSIS By 2004, Wal-Mart (W-M) was ot oly the world s biggest retailer, it was also (i terms of sales reveue) the world s largest corporatio. I
9 Placerville Airport and Environs
 Chapter 9 Placerville Airport ad Eviros BACKGROUND DATA EL DORADO COUNTY Airport Lad Use Compatibility Pla 9 Backgroud Data: Placerville Airport ad Eviros INTRODUCTION Placerville Airport is a public-use
Draft White-tailed Deer Management Policy for Ontario
 Draft White-tailed Deer Maagemet Policy for Otario Otario Miistry of Natural Resources ad Forestry March 2017 Cette publicatio est dispoible e fraçais. Pour obteir de l aide e fraçais, veuillez commuiquer
BIKE MS: THE CITRUS TOUR, MAY 21-22, 2016 PARTNERSHIP PROPOSAL
 BIKE MS: THE CITRUS TOUR, MAY 21-22, 2016 PARTNERSHIP PROPOSAL 1 Bike MS: 2016 Partership Proposal VISION STATEMENT For cyclists ad all those seekig a persoal challege ad a world free of MS, Bike MS is
Andover YMCA Swim Lessons Schedule
 Adover YMCA Swim Lessos Schedule 2018 Early Fall September 10 - October 28 (763) 230-9622 www.adoverymca.org ABOUT Y SWIM LESSONS The Y strives to help all ages lear how to swim, so they ca stay safe aroud
ANALYSIS AND ASSESSMENT OF LITHUANIAN ROAD ACCIDENTS BY AHP METHOD
 ISSN 1822-427X/eISSN 1822-4288 2018 Volume 13 Issue 3: 238 260 https://doi.org/10.7250/bjrbe.2018-13.414 ANALYSIS AND ASSESSMENT OF LITHUANIAN ROAD ACCIDENTS BY AHP METHOD MARIUS JAKIMAVIČIUS * Dept of
Town of Mooresville, North Carolina Comprehensive Transportation Plan Amendments Addendum Report
 Tow of, North Carolia Comprehesive Trasportatio Pla Amedmets Addedum Report Adopted April 4, 2013 Tow of Developmet Services Departmet Tow of CTP Amedmets Adopted April 4, 2013 Executive Summary The curret
The Analysis of Bullwhip Effect in Supply Chain Based on Strategic Alliance
 The Aalysis of Bullwhip Effect i Supply Chai Based o Strategic Alliace Rui Xu, Xiaoli Li, Xiaomi Sog, Gag Liu School of Busiess, Hubei Uiversy, Wuha, 430062, P. R. Chia, wdxj826@126.com Abstract. Bullwhip
CITY OF PASADENA PEDESTRIAN SAFETY STUDY AT SIGNALIZED INTERSECTIONS
 CITY OF PASADENA PEDESTRIAN SAFETY STUDY AT SIGNALIZED INTERSECTIONS Prepared for: City of Pasadea Submitted by: FEHR & PEERS 201 Sata Moica Blvd., Suite 500 Sata Moica, Califoria 90401 (310) 458-9916
PERFORMANCE TEAM EVALUATION IN 2008 BEIJING OLYMPIC GAMES
 XV INTERNATIONAL CONFERENCE ON INDUSTRIAL ENGINEERING AND OPERATIONS MANAGEMENT The Idustrial Egieerig ad the Sustaiable Developmet: Itegratig Techology ad Maagemet. Salvador, BA, Brazil, 06 to 09 October
(612)
") Shoreview YMCA Swim Lessos Schedule Late Sprig 2019 - April 15 - Jue 2 (612) 230-9622 www.shoreviewymca.org ABOUT Y SWIM LESSONS The Y strives to help all ages lear how to swim, so they ca stay safe aroud
Shoreview YMCA Swim Lessos Schedule Late Sprig 2019 - April 15 - Jue 2 (612) 230-9622 www.shoreviewymca.org ABOUT Y SWIM LESSONS The Y strives to help all ages lear how to swim, so they ca stay safe aroud
Overview. Creating Walkable, Bikeable Communities Developing Effective Active Transportation Projects and Programs. Add photo or photos
 Creatig Walkable, Bikeable Commuities Developig Effective Active Trasportatio Projects ad Programs Add photo or photos Sposored by Caltras ad [local sposors] Overview Effective itervetios that ca improve
Hazard Identificaiton of Railway Signaling System Using PHA and HAZOP Methods
 www.ijape.org Iteratioal Joural of Automatio ad Power Egieerig (IJAPE) Volume 2 Issue 2, February 2013 Hazard Idetificaito of Railway Sigalig System Usig PHA ad HAZOP Methods Jog Gyu Hwag *1, Hyu Jeog
Wondering where to start?
 Bursville YMCA Swim Lessos Schedule 2018 Witer Jauary 8 - February 25 (952) 898-9622 ymcam.org/bursville ABOUT Y SWIM LESSONS The Y strives to help all ages lear how to swim, so they ca stay safe aroud
Emma B. Howe YMCA Swim Lessons Schedule
 Emma B. Howe YMCA Swim Lessos Schedule 2018 Summer Jue 4 - September 9 (763) 785-7882 ymcam.org/emmabhowe ABOUT Y SWIM LESSONS The Y strives to help all ages lear how to swim, so they ca stay safe aroud
Field Studies Tom Habib, Barry Nobert, Eric Brownrigg, & Dr. Evelyn Merrill. University of Alberta 1 October 2009 Deer Tracks
 Uiversity of Alberta 1 October 2009 Tracks The Newsletter of the Norther Border Study With our last trappig seaso behid us, we are ow eterig the fial stages of field work for the Border Study. While we
ANNUAL REPORT OF THE PZU GROUP
 PZU G ANN RE 2007 ANNUAL REPORT OF THE PZU GROUP Table of cotets 1. Basic iformatio o the PZU Group... 3 2. Fiacial highlights of the PZU Group i 2007... 6 3. Letter from the Presidet of PZU SA... 7 4.
IRS ISSUES PROPOSED REGULATIONS FOR COMPARATIVE EFFECTIVENESS RESEARCH FEES
 HUMAN CAPITAL PRACTICE ALERT: HEALTH CARE REFORM BILL July 2012 www.willis.com IRS ISSUES PROPOSED REGULATIONS FOR COMPARATIVE EFFECTIVENESS RESEARCH FEES The Comparative Effectiveess Research (CER) fee
Hastings YMCA Swim Lessons Schedule
 Hastigs YMCA Swim Lessos Schedule 2018 Early Fall September 10 - October 28 (651) 480-8887 www.hastigsareaymca.org ABOUT Y SWIM LESSONS The Y strives to help all ages lear how to swim, so they ca stay
West St Paul YMCA Swim Lessons Schedule
 West St Paul YMCA Swim Lessos Schedule 2018 Early Fall September 10 - October 28 (651) 457-0048 www.weststpaulymca.org ABOUT Y SWIM LESSONS The Y strives to help all ages lear how to swim, so they ca stay
St. Paul Midway YMCA Swim Lessons Schedule
 St. Paul Midway YMCA Swim Lessos Schedule 2018 Late Fall October 29 - December 16 (651) 646-4557 ymcam.org/midway ABOUT Y SWIM LESSONS The Y strives to help all ages lear how to swim, so they ca stay safe
Wondering where to start?
 New Hope YMCA Swim Lessos Schedule 2018 Early Fall September 10 - October 28 (763) 535-4800 www.ewhopeymca.org ABOUT Y SWIM LESSONS The Y strives to help all ages lear how to swim, so they ca stay safe
Introductory Rules of Officiating Small Sided Games Under 6 &Under 8 HANDBOOK
 Itroductory Rules of Officiatig Small Sided Games Uder 6 &Uder 8 O F F I C I A L S HANDBOOK 1 T his hadbook is iteded to be used i cojuctio with the US Youth Soccer Small-sided Game Official s classroom
Range St. Dev. n Mean. Total Mean % Competency. Range St. Dev. n Mean. Total Mean % Competency
 CSWE Core Competecies - MSW 2013 MSW Program Dual Degree MSW/JD Program* *Due to the curret limited umber of Dual Degree studets, the MSW outcomes data represets outcomes for both programs. 1 : Idetify
Wondering where to start?
 Blaisdell YMCA Swim Lessos Schedule 2018 Early Fall September 10 - October 28 (612) 827-5401 www.blaisdellymca.org ABOUT Y SWIM LESSONS The Y strives to help all ages lear how to swim, so they ca stay
Rochester YMCA Swim Lessons Schedule
 Rochester YMCA Swim Lessos Schedule 2018 Early Fall September 10 - October 28 (507) 287-2260 www.ymcam.org/rochester ABOUT Y SWIM LESSONS The Y strives to help all ages lear how to swim, so they ca stay
bike ms 2014: Team Village Guide
 bike ms 2014: Team Village Guide Historic New Ber Ride 2014 bikemsewber.org 1 Team Village What is Team Village? Team Villages are the ceterpoit of the Bike MS overight, as well as a gatherig place for
Wondering where to start?
 Woodbury YMCA Swim Lessos Schedule 2017 Late Fall October 30 - December 17 (651) 731-9507 ymcam.org/woodbury ABOUT Y SWIM LESSONS The Y strives to help all ages lear how to swim, so they ca stay safe aroud
STRUCTURAL FILL, SONOTUBES, CONCRETE, GRAVEL, CLEAR SILICONE, ENGINEERED WOOD FIBRE (E.W.F.), GEO-TEXTILE, SOIL, PLANTS & MULCH ARE NOT SUPPLIED.
, GEO-TEXTILE, SOIL, PLANTS & MULCH ARE NOT SUPPLIED.") SLIDE COMPOETS: DUROLAW MAT WITH STAKES & ZIPTIES: x 4 PRE-MITRED LOG BORDER: x 14.6 lin.m [48 lin.ft] 254mm [10"] S.D.W.S. FASTEER: x 5 DRILL BIT FOR FASTEERS: x 1 STRUCTURAL FILL, SOOTUBES, COCRETE,
SLIDE COMPOETS: DUROLAW MAT WITH STAKES & ZIPTIES: x 4 PRE-MITRED LOG BORDER: x 14.6 lin.m [48 lin.ft] 254mm [10"] S.D.W.S. FASTEER: x 5 DRILL BIT FOR FASTEERS: x 1 STRUCTURAL FILL, SOOTUBES, COCRETE,
M3P. Safety Data Sheet TABLE OF CONTENTS IDENTIFICATION OF THE SUBSTANCE/MIXTURE AND OF THE COMPANY/UNDERTAKING 2 SECTION 2 HAZARDS IDENTIFICATION 2
 Accordig to the Hazard Commuicatio Stadard (CFR29 1910.1200) HazCom 2015 TABLE OF CONTENTS SECTION 1 IDENTIFICATION OF THE SUBSTANCE/MIXTURE AND OF THE COMPANY/UNDERTAKING 2 SECTION 2 HAZARDS IDENTIFICATION
Wondering where to start?
 Ridgedale YMCA Swim Lessos Schedule 2019 Witer Jauary 1 - February 24 (952) 544-7708 www.ridgedaleymca.org ABOUT Y SWIM LESSONS The Y strives to help all ages lear how to swim, so they ca stay safe aroud
STRUCTURAL FILL, SONOTUBES, CONCRETE, GRAVEL, CLEAR SILICONE, ENGINEERED WOOD FIBRE (E.W.F.), GEO-TEXTILE, SOIL, PLANTS & MULCH ARE NOT SUPPLIED.
, GEO-TEXTILE, SOIL, PLANTS & MULCH ARE NOT SUPPLIED.") SLIDE COMPOETS: ATURE'S ISTRUMETS I-PG-1002-01 TRIPLE RAIL HILL SLIDE. I PACKAGE ICLUDES:- HT. SLIDE FRAME: x 1 WITH PRE-ATTACHED SLIDE AD COLLAR WIG WALL POST: x 2 PRE-ASSEMBLED WIG WALL RAILIGS: x 2
SLIDE COMPOETS: ATURE'S ISTRUMETS I-PG-1002-01 TRIPLE RAIL HILL SLIDE. I PACKAGE ICLUDES:- HT. SLIDE FRAME: x 1 WITH PRE-ATTACHED SLIDE AD COLLAR WIG WALL POST: x 2 PRE-ASSEMBLED WIG WALL RAILIGS: x 2
Precautions for Total Hip Replacement Patients Only
 Precautios for Total Hip Replacemet Patiets Oly The followig is a list of precautios to keep you from dislocatig your hip. Dislocatig meas to move a body part out of its usual positio. Durig your stay
securing your safety
 securig your safety LIFE POINT PRO DEFIBRILLATOR AN AUTOMATED EXTERNAL DEFIBRILLATOR (AED) CAN BE THE DIFFERENCE BETWEEN LIFE AND DEATH. Statistics show that early 200,000 people die each year as a result
Design, construction and installation of gas service pipes
 Desig, costructio ad istallatio of gas service pipes Pipelies Safety Regulatios 1996 Approved Code of Practice ad guidace This is a free-to-dowload, web-friedly versio of L81, (First editio, published