MECHANICAL MUSCLE PROPERTIES AND INTERMUSCULAR COORDINATION IN MAXIMAL AND SUBMAXIMAL CYCLING: THEORETICAL AND PRACTICAL IMPLICATIONS
|
|
|
- Martina Hall
- 5 years ago
- Views:
Transcription
1 MECHANICAL MUSCLE PROPERTIES AND INTERMUSCULAR COORDINATION IN MAXIMAL AND SUBMAXIMAL CYCLING: THEORETICAL AND PRACTICAL IMPLICATIONS A thesis submitted for the degree of Doctor of Philosophy By Paul Richard Barratt School of Sport and Education Brunel University March 2014
2 This thesis is dedicated to my wife Emily for her love, support, understanding, encouragement and assistance 2
3 ABSTRACT The ability of an individual to perform a functional movement is determined by a range of mechanical properties including the force and power producing capabilities of muscle, and the interplay of force and power outputs between different muscle groups (intermuscular coordination). Cycling presents an ideal experimental model to investigate these factors as it is an ecologically valid multi-joint movement in which kinematics and resistances can be tightly controlled. The overall goal of this thesis was thereby to investigate mechanical muscle properties and intermuscular coordination during maximal and submaximal cycling. The specific research objectives were (a) to determine the contribution of these factors to maximal and submaximal cycling, and (b) to determine the extent to which these factors set the limit of performance in maximal cycling. The contribution of mechanical muscle properties and intermuscular coordination were investigated by observing joint kinetics and joint kinematics across variations in crank lengths and pedalling rates during maximal and submaximal cycling. The extent to which these factors set the limit of performance in maximal cycling was assessed by observing joint-level kinetics of world-class track sprint cyclists. The findings of this investigation formed the rationale for the fourth study which used an ankle brace intervention to investigate the effects of a fixed ankle on joint biomechanics and performance during maximal cycling. Sophisticated intermuscular coordination strategies were observed in both submaximal and maximal cycling, supporting the generalised notion that high levels of intermuscular coordination are required to perform functional multi-joint movement tasks. Furthermore, it was found that the maximal cycling task is governed by the interaction of the force-velocity relationship and excitation-relaxation kinetics, suggesting that task-specific mechanical muscle properties are the dominant contributing factor in maximal movements. In terms of the extent to which these factors limit performance in maximal cycling, it was demonstrated that world-class track sprint cycling performance is governed by the ability to generate higher joint moments at the ankle and knee, and that these joint moments are facilitated by enhanced muscular strength about these joints. These findings allow us to speculate that the limits of performance in maximal human movements lie in extraordinary muscular strength in task-specific joint actions. These findings give an insight into the mechanisms that underpin maximal and submaximal cycling, and provide a theoretical framework with which to understand sprint cycling performance. This knowledge has significant applied relevance for athletes and coaches seeking to improve sprint cycling performance. 3
4 ACKNOWLEDGEMENTS I gratefully acknowledge the contribution of the following people: Dr. Thomas Korff without whose expertise, dedication and guidance this thesis would not have been possible. Professor Jim Martin for allowing me to use his lab (and expertise) for the first two studies, and in the process becoming the best PhD mentor I could have hoped for. The World-Class Cyclists and Coaches of the Great Britain Cycling Team who gave up their valuable training time to take part in these studies and in the process develop our understanding of cycling performance. The local cyclists from Utah and Manchester who enthusiastically took part in a range of novel cycling tasks. Simon Powers for helping to recruit the best sub-elite cyclists British Cycling has to offer. Julie Bradshaw for saving my bacon on more occasions than I care to admit. Dr. Scott Gardner for sparking my interest in real biomechanics, and for teaching me how to apply it in the real world. The Engineering and Physical Sciences Research Council for financial support for my studies. The English Institute of Sport for financial support for my studies. My wife Emily for her tolerance and patience of having to share weekends and evenings with this thesis. 4
5 CONTENTS Chapter 1: General Introduction.. 12 An Introduction to Pedalling Mechanics and Associated Mechanisms.. 16 General Overview.. 16 The Interaction of Mechanical Muscle Properties and Intermuscular Coordination 17 Definitions. 19 Chapter 2: Literature Review: Joint-Level Analyses of Mechanical Output in Cycling 23 Joint-Level Analyses of Mechanical Output in Submaximal Cycling 24 General Observations 24 Mechanical Muscle Properties.. 25 Intermuscular Coordination Joint-Level Analyses of Mechanical Output in Maximal Cycling.. 28 General Observations Mechanical Muscle Properties.. 29 Intermuscular Coordination Joint-Level Analyses of Mechanical Output in Elite Sprint Athletes Summary 33 Chapter 3: Changes in Joint Kinetics across Crank Lengths and Pedalling Rates During Maximal Cycling. 36 Introduction Methods. 38 Results Discussion.. 47 Chapter 4: Changes in Joint Kinetics across Crank Lengths and Pedal Speeds During Submaximal Cycling. 51 Introduction Methods. 53 Results Discussion.. 63 Chapter 5: Biomechanical Factors Associated with World-Class Track Sprint Cycling Performance.. 68 Introduction Methods. 70 Results Discussion.. 78 Chapter 6: The Effect of a Rigid Ankle on Joint Biomechanics and Performance in Maximal Cycling 83 Introduction Methods. 84 Results Discussion.. 94 Page Number 5
6 Chapter 7: General Discussion Objective Main Findings 101 Implications Objective Main Findings 103 Implications Limitations. 105 Future Directions Summary Chapter 8: References. 109 Chapter 9: Appendix Selection of Filter Cut-Off Frequencies 120 Prediction of Errors due to the Underestimation of Leg Mass in World-Class Track Sprint Cyclists Research Ethics Approval Letters. 126 Published Journal Paper 130 Conference Presentations
7 LIST OF TABLES Table 1. Power delivered to the right pedal during maximal cycling with variations in crank length and pedalling rate. Joint powers are averaged over complete pedal cycles and normalised to pedal power. Joint powers are presented as means and standard deviations on the main diagonal of each table. Effect sizes for pairwise comparisons are presented in the remaining cells. Table 2. Extension and flexion powers produced at the ankle, knee and hip. Powers are normalised to pedal power. Means and standard deviations are presented on the main diagonal of each table. Effect sizes for pairwise comparisons are presented in the remaining cells. Table 3. Joint angular velocities at the hip, knee and ankle. Means and standard deviations are presented on the main diagonal of each table. Effect sizes for pairwise comparisons are presented in the remaining cells. Table 4. Joint excursions at the hip, knee and ankle. Means and standard deviations are presented on the main diagonal of each table. Effect sizes for pairwise comparisons are presented in the remaining cells. Table 5. Crank lengths, pedalling rates and pedal speeds used in both experimental conditions. The constant pedal speed condition was included to test whether crank length per se would have a confounding effect on any of the dependent variables. Table 6. Details of the statistical analyses in the constant pedalling rate and constant pedal speed conditions. In the constant pedalling rate condition increases in pedal speed caused large increases extension and flexion velocities at the knee and hip, and moderate decreases in knee extension moment. Table 7. Joint angular velocities at the ankle, knee and hip. Means and standard deviations are presented on the main diagonal of each table. Effect sizes for pairwise comparisons are presented in the remaining cells. Table 8. Joint extension and flexion moments at the ankle, knee and hip. Means and standard deviations are presented on the main diagonal of each table. Effect sizes for pairwise comparisons are presented in the remaining cells. Table 9. Extension and flexion powers produced at the ankle, knee and hip. Powers are normalised to pedal power. Means and standard deviations are presented on the main 7
8 diagonal of each table. Effect sizes for pairwise comparisons are presented in the remaining cells. Table 10. Joint excursions at the ankle, knee and hip. Means and standard deviations are presented on the main diagonal of each table. Effect sizes for pairwise comparisons are presented in the remaining cells. Table 11. Comparison of peak joint moments produced at 60 rpm between world-class track cyclists and sub-elite cyclists. Joint moments are ranked by the magnitude of effect size (largest at the top). Significant differences are indicated by means of asterisk (*). Table 12. Comparison of measures of rate of moment development and rate of moment reduction between world-class track sprint cyclists and sub-elite cyclists across pedalling rates. Values are reported in absolute terms as well as normalised to the values of strength (peak moments at 60 rpm). Significant differences are indicated by means of asterisk (*). Table 13. Descriptive statistics comparing pedal power, joint action powers and peak EMG between the ankle brace and ankle weights conditions during maximal cycling at 90 rpm. Table 14. Descriptive statistics comparing pedal power, joint action powers and peak EMG between the ankle brace and ankle weights conditions during maximal cycling at 120 rpm. Table 15. Variations in optimal cut-off frequencies across pedalling rates, as determined by residual analysis. 8
9 LIST OF FIGURES Figure 1. A schematic diagram illustrating the interaction of mechanical muscle properties and intermuscular coordination during cycling Figure 2. Joint power profiles for the 150 mm, 170 mm and 190 mm cranks when pedalling rate was optimised for maximum power. The profiles were averaged within each crank length group, and normalised to pedal power. Zero and 360 deg. on the horizontal axis refer to top dead centre of the pedal cycle; 180 deg. refers to bottom dead centre of the pedal cycle. Figure 3. Joint power profiles from the 150mm and 190mm cranks when pedalling rate was constant. The profiles were averaged within each crank length group, and normalised to pedal power. Zero and 360 deg. on the x-axis refer to top dead centre of the pedal cycle; 180 deg. refers to bottom dead centre of the pedal cycle. Figure 4. Changes in knee extension velocity, moment and power in the constant pedalling rate and constant pedal speed conditions. The large changes in joint velocity across crank lengths in the constant pedalling rate condition were counteracted by changes in joint moment such that joint power remained unchanged. Figure 5. Comparison of relative joint powers produced by world-class track sprint cyclists (blue) and sub-elite cyclists (red). Relative joint powers were calculated by normalising individual joint powers against overall cycling power, and averaging over joint extension and flexion phases. There was no difference in relative joint powers between groups. Figure 6. Comparison of joint powers between the ankle brace (red) and ankle weight (blue) conditions during maximal cycling at 90 rpm. The ankle brace and ankle weights hip power curves tend to diverge at the point of peak power production. Figure 7. Comparison of joint powers between the ankle brace (red) and ankle weight (blue) conditions during maximal cycling at 120 rpm. The ankle brace and ankle weights hip power curves tend to diverge during the early phase of the pedal cycle (0-90 degrees). Figure 8. The effect of different filter cut-off frequencies on knee power data collected during maximal cycling at three different pedalling rates (60 rpm, 120 rpm, 180 rpm). Data are compared when filter cut-off frequencies were set at 6 Hz, 12 Hz and 18 Hz. Y-axes are knee power (W) and X-axes are crank angle (deg.) for all plots. 9
10 Figure 9. Residual Analyses comparing the optimal filter cut-off frequency at different pedalling rates. Figure 11. (A) Predicted error (%) in joint power data due to underestimation of leg mass data. (B). Predicted error (%) in joint power data due to underestimation of leg mass data. These data are the same as in (A), only with Hip Flexion and Hip Transfer Flexion Power removed to provide clarity on the remaining joint powers. 10
11 CHAPTER 1 11
12 GENERAL INTRODUCTION The ability of an individual to perform a functional movement is determined by a range of mechanical properties. These include the force and power producing capabilities of muscle, and the interplay of force and power outputs between different muscle groups (intermuscular coordination) (Bobbert & van Ingen Schenau 1988; Pandy et al. 1990; Pandy & Zajac 1991; Jacobs & van Ingen Schenau 1992; Anderson & Pandy 2001). Regarding the former, the force and power output is governed by the primary mechanical properties of muscle, namely the force-velocity relationship (Fenn 1924; Hill 1938), the length-tension relationship (Gordon et al. 1966) and excitation-relaxation kinetics (Caiozzo & Baldwin 1997; Martin et al. 2000; Neptune & Kautz 2001). Understanding the importance of the various mechanical properties, and the underlying contributing factors, is thus very important when observing and analysing functional movement. Although the primary mechanical properties of muscle are very well understood in isolation (Fenn 1924; Hill 1938; Gordon et al. 1966), far less is known about how they relate to the performance of functional movements. This is due in part to the difficulties in using the findings of investigations into isolated muscle contractions to predict the complex interplay that occurs between the various mechanical muscle properties during functional movements (Caiozzo 2002; Martin 2007). In functional movements, muscles are required to perform under conditions in which shortening velocity, length and excitation level can all vary simultaneously (Caiozzo 2002). This is a very different environment to that occurring during reductionist investigations of mechanical muscle properties, in which the variable of interest is manipulated while all other variables are held constant (Caiozzo 2002; Martin 2007). This issue is exemplified by the fact that the force-velocity relationship for isolated muscle contraction is well known to be hyperbolic (Fenn 1924; Hill 1938) and yet during a range of functional movements, including running (Morin et al. 2010), cycling (Gardner et al. 2007) and wheelchair propulsion (Hintzy et al. 2003), the relationship is linear. The disparity in observations between isolated muscle contractions and functional movements raises a host of interesting basic science questions relating to the mechanisms underpinning functional movement. It also makes it very difficult to directly apply the findings from reductionist investigations to predict the contribution of the various mechanical muscle properties to functional movement performance. In order to execute a functional movement, muscles are required to turn on and switch off in a timely manner, and the magnitude of force output needs to be appropriately controlled (de Koning et al. 1991; Pandy & Zajac 1991; Jacobs & van Ingen Schenau 1992). 12
13 This intermuscular coordination requirement means that in functional movements, unlike in isolated muscle contractions, muscles cannot be simultaneously maximally activated. This is one reason why the mechanical interactions observed in isolated muscle do not always translate to functional movements. The optimal intermuscular coordination strategy for any functional movement is determined by the overall task objective (Bernstein 1967; Whiting 1983). If, for example, the movement is submaximal, then the optimal intermuscular coordination strategy may seek to minimise energy expenditure (Anderson & Pandy 2001; Vanrenterghem et al. 2008), neuromuscular fatigue (Neptune & Hull 1999), or centre of gravity jerk (Bobbert & Casius 2011). If, by comparison, the movement is maximal, then the optimal intermuscular coordination strategy will likely maximise the overall mechanical output based upon the mechanical properties of muscle (force-velocity relationship, lengthtension relationship, excitation-relaxation kinetics) (Bobbert & van Ingen Schenau 1988; Pandy et al. 1990; Jacobs & van Ingen Schenau 1992; van Soest & Casius 2000). This interplay between mechanical muscle properties and intermuscular coordination demonstrates that they are interdependent factors. In order to achieve an understanding of the mechanisms underlying functional movement, and their relevance to task performance, it is thus necessary to adopt an integrated approach and analyse mechanical muscle properties and intermuscular coordination in concert. Cycling presents an ideal experimental model for this purpose as it is an ecologically valid multi-joint movement in which kinematics and resistances can be tightly controlled (Martin & Spirduso 2001). The ability to alter joint kinematics in a predictable and consistent manner is of particular relevance when seeking to investigate mechanical muscle properties, as joint kinematics are surrogate measures for muscle kinematics (Yoshihuku & Herzog 1990, 1996; Martin & Spirduso 2001). A cycling model also allows for movements to be performed under both submaximal and maximal conditions, which is important when investigating the contribution of different mechanical factors across task objectives (e.g. in maximal (Pandy et al. 1990) versus submaximal (Vanrenterghem et al. 2008) jumping). Finally, by adopting a joint-level mechanical analysis of cycling power production, it is possible to analyse joint-specific mechanical muscle properties (Martin & Brown 2009) and intermuscular coordination (Korff & Jensen 2007; Korff et al. 2009) simultaneously and during an ecologically valid functional movement. Within the context of cycling, the interdependency of mechanical muscle properties and intermuscular coordination raises a number of important scientific questions that are currently not understood. One such topic is how the contribution of these factors alters with task objective, for example between maximal and submaximal cycling conditions. Observations describing the influence of task objective on mechanical muscle properties and 13
14 intermuscular coordination can provide a significant insight into the function of the neuromuscular system, and in particular how the musculoskeletal system and central nervous system interact during functional movements (Pandy & Zajac 1991; Vanrenterghem et al. 2008; Bobbert & Casius 2011). The clear distinction in task objectives between maximal and submaximal cycling, together with the high degree of control of joint kinematics, mean that maximal and submaximal cycling tasks are ideal experimental models for this purpose. In submaximal cycling, it is possible to meet the task objective, in terms of the overall mechanical output, by using different intermuscular coordination strategies (Raasch & Zajac 2009). This redundancy of degrees of freedom occurs because the same overall power output can be produced with different contributions from the various muscle groups. In maximal cycling, by comparison, the objective is to maximise short-term mechanical power output, and so the number of optimal intermuscular coordination strategies theoretically reduces to one (Yoshihuku & Herzog 1990; Yoshihuku & Herzog 1996; Raasch et al. 1997; van Soest & Casius 2000). This is because a single intermuscular coordination strategy should maximise overall mechanical output and thus accomplish the task objective (Yoshihuku & Herzog 1990; Yoshihuku & Herzog 1996; Raasch et al. 1997; van Soest & Casius 2000). Under maximal conditions, the lack of variety in optimal intermuscular coordination strategies together with the requirement of the muscle to produce maximum mechanical output suggests that the mechanical properties of muscle are likely to be the most relevant mechanical factor. Conversely, under submaximal conditions, the fact that muscles are not required to work at their maximum mechanical output, and the variety of possible intermuscular coordination strategies available, makes it probable that intermuscular coordination rather than the mechanical properties of muscle will have greater relevance to task performance. A second key scientific topic that can be addressed by investigating the interdependency of mechanical muscle properties and intermuscular coordination during cycling is the limits of human performance. World-class track sprint cyclists are amongst the most powerful humans on the planet (Dorel et al. 2005; Martin et al. 2006; Gardner et al. 2009). However, the factors that facilitate this ability are not well understood (Martin et al. 2007). Thus by determining the contribution of mechanical muscle properties and intermuscular coordination to world-class track sprint cycling performance it should be possible to gain a unique insight into the mechanisms that facilitate the production of extraordinary maximal power outputs. This scenario presents a very rare opportunity to describe the factors that limit the performance of maximal movement tasks in humans. An understanding of these joint-level mechanical factors is also useful from an applied 14
15 perspective, as it creates a theoretical framework with which to understand sprint cycling performance. Thus it should be possible to use the understanding of the factors that limit maximal cycling power to develop evidence-based interventions, for example training exercises or manipulations of the constraints of the cycling task, which facilitate increases in overall power output and so enhance sprint cycling performance. The overall goal of this thesis was to investigate mechanical muscle properties and intermuscular coordination during maximal and submaximal cycling. The specific research objectives were (a) to determine the contribution of these factors to maximal and submaximal cycling, and (b) to determine the extent to which these factors set the limit of performance in maximal cycling. Two experimental studies were performed to address the first research objective of determining the contribution of mechanical muscle properties and intermuscular coordination to maximal and submaximal cycling. In the first study, changes in joint kinetics were observed across variations in crank lengths and pedalling rates during maximal cycling. In the second study, changes in joint kinetics were observed across variations in crank lengths and pedalling rates during submaximal cycling. The two studies were similar in their experimental design but different with respect to the objective of the movement task. Thus the findings of these studies were used to identify task objective-specific contributions from mechanical muscle properties and intermuscular coordination. Two further experimental studies were performed to address the second research objective of determining the extent to which mechanical muscle properties and intermuscular coordination set the limit of performance in maximal cycling. In the third study, joint-level kinetic analyses of world-class track sprint cyclists were performed. This investigation explained the extent to which joint-level mechanical muscle properties and intermuscular coordination determined world-class sprint cycling performance, and also gave an insight into the contributing physical and physiological factors. The findings of this investigation formed the rationale for the fourth study which used an ankle brace intervention to investigate the effects of a fixed ankle on joint biomechanics and performance during maximal cycling. 15
16 An Introduction to Pedalling Mechanics and Associated Mechanisms General Overview Pedal power is ultimately produced by the muscles crossing the hip, knee and ankle joints. The aim of the pedalling movement, therefore, is to coordinate the timing and magnitude of contractions from these muscles so that power is effectively transferred from the muscle to the pedal. The exact muscle coordination pattern used by cyclists to do this can vary depending upon external factors (e.g. power output, cadence, bicycle position, road gradient) however a number of features are common across all pedalling conditions. Firstly, it is clear that each leg undertakes a cycle of extension and flexion. Due to the constrained nature of pedalling, the exact path the joints take during the extension and flexion phases is mostly set by the saddle position, the path of the pedal spindle and the length of the various leg segments, all of which are fixed. There is some freedom for the cyclist to selectively alter the movement of the leg by modifying the position of the ankle and the hip joint. At the ankle, for example, the cyclist can choose to use a heel-down or heel-up pedalling style, and at the hip the cyclist can alter the amount of side-to-side rocking that occurs in the pelvis. The ability to modify a given movement pattern is termed the biomechanical degrees of freedom of a movement, and it is interesting to consider how many fewer degrees of freedom there are in cycling in comparison to other sporting movements, including swimming or running. As such, the range of possible techniques in pedalling is far less than during many other sporting movements. Data from instrumented cycling pedals demonstrate that the vast majority of power is produced during the leg extension phase. The hip and knee joints go through the largest ranges of motion during the extension phase, and it is the muscles surrounding these joints that provide the largest contribution to overall cycling power. The largest and most powerful hip extensor muscle is the gluteus maximus. The most important knee extensor is the quadriceps femoris, which is comprised of four separate muscles. The knee extensors and hip extensors are two of the largest muscle groups in the human body, and so they are very well suited to the task of producing high power outputs. During the leg extension phase there is also a smaller but significant power contribution from the ankle extensors (plantarflexors). The most important plantarflexors are the gastrocnemius and soleus muscles. Interestingly, in addition to directly producing pedal power, the ankle extensors have a secondary role during the leg extension phase. The ankle extensors are additionally required to strengthen the ankle joint so that the power developed by the knee and hip extensors can be transferred 16
17 to the pedal. The simplest way to visualize this mechanism is to imagine how the leg may function if the muscles surrounding the ankle were inactive and so the ankle joint had no strength at all. In this scenario, during leg extension, the power produced by the knee and hip extensors would simply cause the ankle to dorsiflex (meaning the foot would be in an extremely heel-down, toe-up position) and the knee to hyper-extend. In this scenario the power produced by the knee and hip extensors would be used to accelerate the leg into this position, rather than deliver power to the pedal. Although the vast majority of power is produced during leg extension, there is a small but significant power output produced during leg flexion. As the leg begins to transition from extension into flexion, the knee flexor muscle group is activated. This activation delivers power directly to the pedal, and also slows down (decelerates) the leg extension action. In addition to the knee flexors, the hip flexors also act to produce power during leg flexion by applying an upwards force at the pedal. In a similar manner to the leg extension phase, the ankle needs to be sufficiently strong in leg flexion so that the hip flexor power can deliver an upwards force to the pedal and ultimately produce a useful power output. Therefore the ankle flexor (dorsiflexor) muscles are activated simultaneously with the hip flexors during leg flexion so that pedal power can be produced. Finally, it is important to consider the role of the upper body in pedalling. The muscles of the upper body are activated during pedalling and the resulting power output is transferred to the hip joint, across the leg and ultimately provides an additional pedal power contribution. The muscle activation is timed so that the vast majority of upper body power contribution occurs within the leg extension phase. This contribution is minimal during low power cycling although it becomes much larger and more important as the overall power demands increase. The Interaction of Mechanical Muscle Properties and Intermuscular Coordination From the above overview it is apparent that coordinating the mechanical output of the various muscle groups is a complex task. Thus the interaction between the factors that determine the mechanical muscle output (mechanical muscle properties), and the timing and magnitude of the various mechanical muscle outputs (intermuscular coordination) is a fundamental aspect of cycling power production. For clarity, this interaction is illustrated in Figure 1 and the sequence of steps described in detail below. 17

 and the mechanical muscle properties.")
18 Figure 1. A schematic diagram illustrating the interaction of mechanical muscle properties and intermuscular coordination during cycling 1. The pedalling movement is initiated by a sequence of muscle activations controlled by the central nervous system. In general, the extensor muscle groups are active during joint extension phases and the flexor muscles are active during joint flexion phases. 2. Each muscle group activation results in a force output, the magnitude of which is determined by the activation level (i.e. the proportion of total muscle group fibres the central nervous system has recruited) and the mechanical muscle properties. 18
19 3. The primary mechanical muscle properties are the force-velocity relationship, the lengthtension relationship and excitation-relaxation kinetics. Thus for any given combination of shortening velocity, length and excitation time, there will be a force output described by the resulting interaction of these individual relationships. 4. The force-velocity relationship, length-tension relationship and excitation-relaxation kinetics are influenced by a number of underlying physiological factors. These factors can be broadly categorised as either strength related (i.e. they do influence the maximum force that can be produced by a muscle) or non-strength related (i.e. they do not influence the maximum force that can be produced by a muscle). 5. The net result of the forces produced by the muscle groups surrounding a joint is a net joint moment. Net joint moments can thus be used to assess intermuscular coordination as their genesis is predominantly muscle group force. It is additionally possible to quantify the contribution of the upper body via the hip transfer force (i.e. the net force acting at the hip joint). 6. If a joint moment occurs simultaneously with a joint angular velocity, then a power output is expressed at the joint. Joint power is a surrogate for muscle power, as muscle power is the product of muscle force and shortening velocity, and joint moment and joint angular velocity are surrogates for muscle force and muscle shortening velocity, respectively. 7. The overall movement power output, termed pedal power in cycling, is the sum of all the individual joint powers. Definitions Central nervous system Crank angle Crank length Excitation time Excitationrelaxation kinetics The system responsible for processing sensory information and delivering activation signals to the muscle. The angle of the crank arm within a pedal cycle (0-360 deg.) The length of the crank arm. The time available for a muscle to contract and relax within a cycle of extension and flexion. In cycling, due to the prescribed nature of pedalling, this is a constraint imposed upon the neuromuscular system by the cycling task. Excitation time is given by the pedalling rate. The relationship between force and excitation time in a contracting muscle group or an isolated muscle fibre. Describes both the delay between the neural activation arriving at the muscle and the muscle developing force (excitation), and also the delay between the neural 19
20 activation ceasing and the force falling to zero (relaxation). A mechanical muscle property. Extension power Flexion power Force-velocity relationship Functional movement Hip transfer power Intermuscular coordination Joint action power Joint angular velocity Joint excursion Joint extension phase Joint flexion phase Joint moment Joint power Length-tension relationship Mechanical muscle properties Muscle activation Muscle length The product of joint moment and joint angular velocity, averaged over the joint extension phase. The product of joint moment and joint angular velocity, averaged over the joint flexion phase. The relationship between force and velocity in a contracting muscle group or isolated muscle fibre. A mechanical muscle property. Voluntary, ecologically valid movement. Typically multi-joint in nature. The product of hip joint reaction force and hip linear velocity, averaged over a complete pedal cycle. A marker of upper body contribution to pedal power. The interplay of mechanical outputs between different muscle groups. Can be described by way of muscle activations, muscle forces, joint moments or joint powers. A collective term for joint extension and flexion powers. The differential of joint angle, averaged over the corresponding extension and flexion phases. The angle of the corresponding joint. A marker of muscle length. The phase of the pedal cycle in which the joint is extending (i.e. the joint angular velocity is positive). The phase of the pedal cycle in which the joint is flexing (i.e. the joint angular velocity is negative). The net result of the forces produced by the muscle groups surrounding a joint, averaged over a complete pedal cycle. The product of joint moment and joint angular velocity, averaged over a complete pedal cycle. The relationship between length and tension in a contracting muscle group or an isolated muscle fibre. A mechanical muscle property. The mechanical relationships that describe the function of a contracting muscle group or an isolated muscle fibre. The neural signal sent from the central nervous system to the muscle. The length of a muscle group or isolated muscle fibre. In cycling, due to the prescribed nature of pedalling, this is a constraint imposed upon the 20
21 neuromuscular system by the cycling task. Muscle length can be indirectly inferred from joint excursion. Muscle shortening velocity Musculoskeletal system Neuromuscular system Peak joint moment Peak rate of moment development Peak rate of moment reduction Pedal cycle Pedal power Pedal speed Pedalling rate Relative joint power The velocity at which a muscle group or isolated muscle fibre is shortening. In cycling, due to the prescribed nature of pedalling, this is a constraint imposed upon the neuromuscular system by the cycling task. Muscle shortening velocity can be indirectly inferred from joint angular velocity. The system of muscles, bones and connective tissues responsible for converting activation signals from the central nervous system into a mechanical output. The combination of the central nervous system and the musculoskeletal system. Both systems are required to work together to produce functional movement. The highest instantaneous moment developed about a joint. A measure of joint-specific strength. The highest instantaneous rate of moment development about a joint. A measure of joint-specific excitation kinetics. The highest instantaneous rate of moment reduction about a joint. A measure of joint-specific relaxation kinetics. A complete revolution of the pedal/crank arm. The product of pedal force and pedal linear velocity, averaged over a complete pedal cycle. The linear velocity of the pedal. The cycle frequency of the pedal. Joint power normalized against pedal power. 21
22 CHAPTER 2 22
23 LITERATURE REVIEW: JOINT-LEVEL ANALYSES OF MECHANICAL OUTPUT IN CYCLING The objective of this thesis is two-fold. Firstly, it is to determine the contribution of mechanical muscle properties and intermuscular coordination to maximal and submaximal cycling. Secondly, it is to determine the extent to which mechanical muscle properties and intermuscular coordination set the limit of performance in maximal cycling. In order to achieve these objectives, it is desirable to observe and analyse how force and power are generated by the various muscle groups, transferred across the limb and ultimately delivered to the pedal during cycling. A joint-level analysis of mechanical output is thus an ideal approach for this purpose, as joint-specific mechanical outputs allow insight to physiologically relevant mechanical muscle properties across multiple joints (Martin & Brown 2009). In addition, a joint-level analysis of mechanical output gives an overview of how energy is modulated by the limb as a whole and thus is a method of quantifying intermuscular coordination across the limb (Korff & Jensen 2007; Korff et al. 2009). Crucially, a joint-level analysis of mechanical output also allows for mechanical muscle properties and intermuscular coordination to be analysed in concert. This is important as mechanical muscle properties and intermuscular coordination are interdependent factors and thus an integrated approach is required to achieve a complete understanding of their contribution to functional movement performance. The existing literature concerning joint-level analyses of mechanical output in cycling will subsequently be reviewed and discussed. The focus of this review will be on those findings with specific relevance to the experimental chapters of this thesis, namely submaximal cycling, maximal cycling and the mechanical analysis of world-class sprint athletes. In this context, maximal is defined as an all-out, unpaced effort where the participant is attempting to maximise the short-term mechanical output (Martin & Spirduso 2001), and submaximal is defined as any exercise intensity below maximal, including efforts both above and below physiological thresholds relating to the contributions of aerobic and anerobic energy systems (Dekerle et al. 2003). 23
24 Joint-Level Analyses of Mechanical Output in Submaximal Cycling General Observations Hull and Jorge (1985) and Gregor and colleagues (1985) were the first researchers to describe joint-level mechanical outputs during cycling. Although these early studies were pioneering they were also somewhat limited by their small sample sizes (less than five participants in each), which were presumably influenced by the extensive data processing required to generate inverse dynamics data at the time. Subsequent studies (Ericson 1988; van Ingen Schenau et al. 1990; Broker & Gregor 1993; Elmer et al. 2011; Mornieux et al. 2007) were able to investigate a more appropriate number of participants. The outcomes of these are discussed below and they provide robust observations on the manner in which cycling force and power are produced. Ericson (1988), van Ingen Schenau and colleagues (1990), Broker and Gregor (1993), Mornieux and colleagues (2007) and Elmer and colleagues (2011) all agree that overall crank moment and power are produced mainly through the sagittal plane joint actions of knee extension, knee flexion, hip extension and ankle plantarflexion. Knee and hip extension together are the dominant joint actions (~70% of total positive work (Ericson 1988)), which is logical given the size and force producing capabilities of the knee and hip extensor muscle groups (Lieber & Friden 2000). The knee flexion action provides a small but significant contribution to overall power (~10% of total positive work (Ericson 1988)). Ankle plantarflexion is an interesting joint action as it not only adds a substantial power output to the leg (~20% of total positive work (Ericson 1988)), but is also responsible for transferring power from the limb to the cycling crank (Raasch & Zajac 2009; Neptune et al. 2000; Zajac et al. 2002). That is, without sufficient moment produced by the ankle, the dominant knee and hip extensor actions would simply act to accelerate the limbs (knee hyper extension, ankle dorsiflexion) in the leg extension phase, rather than deliver power to the crank (Raasch & Zajac 2009; Neptune et al. 2000; Zajac et al. 2002). Finally, there is a small but significant contribution to overall pedal power provided by the upper body, which is quantified by the joint power transferred across the hip joint ( hip transfer power ) (Broker & Gregor 1993). Ericson (1988), Broker and Gregor (1993), Mornieux and colleagues (2007) and Elmer and colleagues (2011) described how the contribution of the different joints changes with overall cycling power output. As the overall cycling power output increases, so does the absolute power produced at the ankle, knee and hip joints, and also hip transfer power (Ericson 1988; Broker & Gregor 1993; Elmer et al. 2011). In terms of relative changes in 24
25 joint contribution, the most complete investigation into this issue was undertaken by Elmer and colleagues (2011), as their results were not confounded by pedalling rate, given that this was held constant across all power outputs, and observations were made across a very wide range of power outputs ( W), including exercise intensities both above and below the various physiological thresholds relating to the contributions of aerobic and anaerobic energy systems (Dekerle et al. 2003). The main finding reported by these authors was that as overall power increases, there is a significant increase in the relative contribution of the knee joint, caused by a greater reliance on the knee flexion action (Elmer et al. 2011). One explanation as to why relative joint contributions change across power outputs is that intermuscular coordination strategies alter between low and high power pedalling conditions (Elmer et al. 2011). Korff et al. (2007) demonstrated that increased use of the flexor muscle groups is associated with reduced (gross) efficiency during submaximal cycling, so it would be logical for the extensor muscle groups to be preferentially recruited at low power outputs in order to minimise metabolic cost and thus maximise efficiency. With reference to the findings of Elmer and colleagues (2011) this implies that the knee flexors are only recruited when required at high power outputs; that is, the knee flexors are recruited only when additional muscle power is needed in order to meet the increased power demands of the task. Further support for this notion comes from a secondary finding of Elmer and colleagues (2011) that the relative upper body contribution (hip transfer power) increases with overall power output. Hip transfer power is associated with increased upper body movement (Martin & Brown 2009; Broker & Gregor 1993), and increased upper body movement causes a reduction in efficiency during submaximal cycling (McDaniel et al. 2005). Taken together, these findings suggest that as power outputs increase, the intermuscular coordination strategy alters from one that seeks to, at least in part, maximise efficiency at low cycling power outputs, to one that seeks to maximise mechanical muscle output at high cycling power outputs. Equivalent intermuscular coordination strategy changes are typical when gait transitions from low to high speeds in humans (Novacheck 1998; Farris & Sawicki 2012) and animals (Roberts & Scales 2002; Roberts & Scales 2004; Gillis & Biewener 2001; Gillis et al. 2005; Ahn 2004). Mechanical Muscle Properties As highlighted in the introduction to this thesis, it is not straightforward to use the results of reductionist investigations into isolated muscle contractions to predict the 25
26 importance of the various mechanical muscle properties in functional movement performance. The investigations discussed in this section are therefore restricted to those using a cycling model, to ensure that the findings can be directly applied to the cycling movement without misinterpretation. Cycling is a multi-joint movement in which joint kinematics (joint excursions, joint angular velocities and cycle frequencies) are heavily influenced by the bicycle setup parameters, such as pedalling rate, saddle height and crank length (Yoshihuku & Herzog 1990; Yoshihuku & Herzog 1996). Investigations into bicycle setup parameters can therefore provide insight into the role of mechanical muscle properties such as the lengthtension relationship (joint excursion), the force-velocity relationship (joint angular velocity) and excitation-relaxation kinetics (cycle frequency) in the performance of the cycling task, and in functional movements in general (Martin & Spirduso 2001; Yoshihuku & Herzog 1996; Yoshihuku & Herzog 1990). A reasonable number of researchers have used a joint-level mechanical analysis to investigate how bicycle setup parameters influence force and power production during submaximal cycling. Ericson (1988) and Broker and Gregor (1993) demonstrated that changes in pedalling rate, which affect both muscle shortening velocities and the time available for muscle excitations (Martin & Spirduso 2001; van Soest & Casius 2000), do not significantly alter the distribution of joint work or joint powers, respectively, over a wide range of pedalling rates (40 to 110 rpm (Ericson 1988; Broker & Gregor 1993)). Simulation studies by Redfield and Hull (1986), Hull and Gonzalez (1988) and Gonzalez and Hull (1989) indicate that pedalling rate does, however, alter relative joint moments, a finding substantiated in experimental studies by Ericson and colleagues (1986) and Mornieux and colleagues (2007). These authors demonstrated a reduction in hip moment and an increase in knee moment as pedalling rates increased from 60 rpm to 100 rpm (Ericson et al. 1986; Mornieux et al. 2007). Saddle height directly alters muscle lengths (joint excursions) and, assuming that pedalling rate remains constant, it also indirectly alters muscle shortening velocities (Yoshihuku & Herzog 1990; Yoshihuku & Herzog 1996; Gonzalez & Hull 1989). Bini and colleagues (2014) investigated the effects of saddle height on joint work and found that 5% changes in saddle height do alter joint excursions and joint angular velocities, although relative joint work at the ankle, knee or hip does not change. Ericson and colleagues (1986) and Bini and colleagues (2010) found that similar changes in saddle height do, however, alter joint moments. Finally, Ericson and colleagues (1986) demonstrated that changes in pedal cleat position (foot fore-aft) do not alter joint moments about the knee or hip. 26
27 An interesting global finding relating to the studies of bicycle setup parameters outlined above is that the relative distribution of joint powers, or joint work (joint powers integrated over a complete cycle, or over flexion and extension phases), is relatively insensitive to a wide range of pedalling constraints. The central nervous system is able to choose different intermuscular coordination strategies to perform the submaximal cycling task, due to the redundant degrees of freedom available (Raasch & Zajac 2009). Therefore, the robustness of the joint power distribution to changes in pedalling constraints suggests that the central nervous system may seek to preserve this factor, or a related factor, as a consistent intermuscular coordination strategy across changes in muscle constraints, including muscle length (joint excursion), muscle shortening velocity (joint angular velocity) and excitation time (cycle frequency). These and other factors relating to the intermuscular coordination strategy used in submaximal cycling will subsequently be discussed. Intermuscular Coordination From a mechanical perspective the objective of submaximal cycling is to produce sustainable muscle power for a prolonged period of time. It is probable, therefore, that an intermuscular coordination strategy is adopted that minimises some factor, or a combination of factors, associated with metabolic cost (Korff et al. 2007) or neuromuscular fatigue (Neptune & Hull 1999). A common approach in the literature to addressing this issue has been to observe which factor, or combination of factors ("cost function"), are minimised in self-selected cycling conditions. In particular, there have been a number of studies which have used a joint-level mechanical analysis to observe which mechanical factors are minimised at the self-selected pedalling rate. These will subsequently be discussed. Joint moments are a surrogate measure of muscle force (Hull & Gonzalez 1988; Gonzalez & Hull 1989), so it has been suggested by several authors that cyclists might adopt an intermuscular coordination strategy that seeks to minimise the net joint moments across the limb (Hull & Jorge 1985; Kautz & Hull 1995; Redfield & Hull 1986b). Marsh and colleagues (2000) tested this hypothesis and observed a general trend that the sum of the ankle, knee and hip moments was smaller at freely chosen pedalling rates. This notion, however, is not supported by the numerous investigations into bicycle setup parameters discussed earlier (Ericson et al. 1986; Bini et al. 2010; Mornieux et al. 2007), in which significant changes in joint kinematics cause changes in joint moments, whilst other factors (e.g. the joint power distribution) remain constant. 27
28 A more relevant mechanical factor for muscular endurance may be mechanical muscle stress, which Hull and colleagues (1988) and Neptune and Hull (1999) modelled using muscle force, calculated using joint moment data and estimates of muscle moment arms, together with estimates of physiological cross sectional area. Both of these studies reported a moderate relationship between minimised values of muscle stress at freely chosen pedalling rates. Neptune and Hull (1999) additionally compared a range of other neuromuscular parameters including peak activation and muscle endurance, and concluded that minimised muscle activation was the best predictor of preferred pedalling rate. It is worth noting that the above findings reported by Neptune and Hull (1999) and Hull and colleagues (1988) were the result of musculoskeletal simulations, and were not validated by experimental data. The results of these investigations should therefore be interpreted somewhat cautiously at present, as significant assumptions are required when modelling and predicting the complex interplay between the various mechanical muscle properties, as well as when predicting the intermuscular coordination used to transfer force and power across the limb. Although gross efficiency is not minimised at the preferred pedalling rate (Hansen, Smith 2009), it seems probable that the minimisation of metabolic cost also contributes to the intermuscular coordination strategy, as gross efficiency is a contributing factor to performance in endurance activities such as cycling (Coyle et al. 1988; Joyner & Coyle 2008). In support of this notion, Korff and colleagues (2007) demonstrated that gross efficiency is maximised when cyclists use their preferred pedalling technique, an indirect marker of relative joint powers across the ankle, knee and hip (Korff et al. 2007). Gross efficiency is determined by muscular efficiency (Hansen et al. 2002; Coyle 2005), and muscular efficiency decreases with an increase in negative muscle work (Neptune & Herzog 1999). Thus, minimising negative muscle work may be an additional contributing factor to the intermuscular coordination strategy adopted during submaximal cycling. In support of this, Neptune and Herzog (1999) demonstrated that net negative muscle work, quantified via inverse dynamics analysis, increases at pedalling rates above those freely chosen by cyclists (80-90 rpm (Hansen et al. 2002; Hansen et al. 2009)). Joint-Level Analyses of Mechanical Output in Maximal Cycling General Observations A very small number of experimental studies have described joint-level mechanical outputs during maximal cycling. Indeed a joint-level understanding of power production in 28
29 maximal cycling has only recently been achieved by Martin and Brown (2009), and then again more recently by Elmer and colleagues (2011) and McDaniel and colleagues (2014). These studies (McDaniel et al. 2014; Martin & Brown 2009; Elmer et al. 2011) agree that maximal cycling is not simply a scaled up version of submaximal cycling. Instead maximal cycling has greater reliance on the hip extension and knee flexion actions, as well as increased upper body contribution (McDaniel et al. 2014; Martin & Brown 2009; Elmer et al. 2011). There are also significant differences in joint kinematics between submaximal and maximal cycling, most notably with respect to the ratio between extension and flexion actions at both a joint-level and a limb-level. Within a movement cycle, the ratio between the time spent in extension and the time spent in flexion is termed the duty cycle (Askew & Marsh 1997), and can be quantified across the whole leg, as well as at individual joints (Martin & Brown 2009; Elmer et al. 2011). In maximal compared to submaximal cycling, there are longer duty cycles across the leg as a whole and at the ankle, knee and hip joints (Martin & Brown 2009; Elmer et al. 2011); that is, a greater proportion of the overall pedal cycle is spent in extension rather than flexion during maximal cycling compared to submaximal cycling. The implications of these differences between maximal and submaximal cycling with regard to intermuscular coordination strategies will be discussed later in this review Mechanical Muscle Properties As previously discussed, investigations into the impact of bicycle setup parameters on joint-level mechanical outputs provide an insight into the role of mechanical muscle properties such as the length-tension relationship (joint excursion), the force-velocity relationship (joint angular velocity) and excitation-relaxation kinetics (cycle frequency) in the performance of the cycling task. To date, however, only one study has investigated the effect of bicycle setup parameters on joint-level mechanical output during maximal cycling (McDaniel et al. 2014). McDaniel and colleagues (2014) investigated the effect of pedalling rate on joint power outputs and demonstrated that power-pedalling rate relationships are joint-specific. That is, the optimal pedalling rate for maximum power output is different across the ankle, knee and hip joints. These findings are important as they demonstrate that pedalling rates of rpm - the conditions typically found to illicit maximum overall cycling power output (Dorel et al. 2005; Gardner et al. 2007) - do not correspond to the optimal conditions for maximum power output for each contributing muscle group. Rather, this maximum cycling power 29
30 output is made up of a combination of sub-maximum joint and muscle powers. The finding from this mechanical analysis is in agreement with the results of musculoskeletal simulation studies (Yoshihuku & Herzog 1996; Bobbert 2012) and experimental EMG studies (Dorel et al. 2012; Wakeling et al. 2010) that muscle groups are not able to maximise power output simultaneously during maximal cycling. In the absence of other joint-level analyses the best insight into the role of mechanical muscle properties in maximal cycling performance has been achieved by crank-level analyses. The reduced kinematic degrees of freedom available within cycling, particularly in comparison to other multi-joint functional movements (for example, walking and running), mean that authors have often used a crank level analysis of maximal muscle power as a means to gain a mechanistic insight into neuromuscular performance during functional movements (Martin et al. 2000; Martin 2007; Tomas et al. 2010). A confounding factor with this approach however is that changes in the outcome measures of force or power output may in fact be due to changes in intermuscular coordination rather than mechanical muscle properties, an issue that investigators often acknowledge when interpreting their results (Tomas et al. 2010; Martin et al. 2000). The results of these investigations nonetheless provide an insight into the determinants of maximum cycling power, as well as the determinants of muscle power in general. Numerous studies have reported that pedalling rate strongly affects maximum cycling power (Gardner et al. 2007; Dorel et al. 2010; Dorel et al. 2005; Sargeant 2007; Martin & Spirduso 2001). This finding has been interpreted to mean that the force-velocity relationship solely determines maximum cycling power (Sargeant 2007), given that pedalling rate is assumed to be a surrogate measure of muscle shortening velocity (Martin et al. 2000), and shortening velocity is well known to influence muscle power (Hill 1938). Pedalling rate however also sets the time within which muscles must become excited, produce force whilst shortening, and relax whilst lengthening (Martin 2007). This time frame reduces muscle force and power, and so changes in pedalling rate additionally affect power via excitation-relaxation kinetics (Martin et al. 2007). Martin and Spirduso (2001) used a variable crank length paradigm to separate out the effects of the force-velocity relationship and excitation-relaxation kinetics and demonstrated that both are very important mechanical muscle properties in maximal cycling. This importance of excitation-relaxation kinetics is supported by musculoskeletal simulation studies by van Soest and Casius (2000), Neptune and Kautz (2001) and Rankin and Neptune (2008). An important tangential finding by Martin and Spirduso (2001) is that changes in crank length per se do not alter overall power output. Assuming that changes in crank length 30
31 correspond to altered muscle lengths (McDaniel et al. 2002), this finding implies that the length-tension relationship, despite being a fundamental mechanical muscle property, does not greatly influence maximum muscle power output during cycling. This finding is supported by the results of simulation studies (Yoshihuku & Herzog 1996; Yoshihuku & Herzog 1990). It is important to note however that these findings, and also the findings relating to the force-velocity relationship and excitation-relaxation kinetics described above (Martin et al. 2000), are confounded by two issues. Firstly, as discussed earlier, changes in intermuscular coordination that might have occurred across changes in cycling conditions (e.g. changes in crank length or pedalling rate) were not accounted for using a crank-level analysis. Secondly, crank-level kinematics do not necessarily prescribe joint- and musclelevel kinematics, as the central nervous system could seek to counteract the enforced changes in crank kinematics by exploiting the kinematic degrees of freedom available at the knee and hip. These findings therefore provide a suitable direction for future studies on joint-level mechanical outputs that are able to assess mechanical muscular properties and intermuscular coordination independently. Intermuscular Coordination The differences in joint kinetics and joint kinematics observed between maximal and submaximal cycling (Martin & Brown 2009; Elmer et al. 2011; McDaniel et al. 2014) are consistent with the notion that the intermuscular coordination strategy changes from one that seeks to maximise endurance performance in submaximal cycling to one that seeks to maximise mechanical output in maximal cycling. The sequencing of muscle group activations is largely set by the kinematic constraints of the pedalling action, and so changes in task objective have only minor influence on this sequence (Dorel et al. 2012). Between submaximal and maximal cycling however, there are large increases in the magnitude of muscle activation such that there is near-maximal recruitment of all muscle groups at the appropriate phase of the pedal cycle (Dorel et al. 2012). In terms of intermuscular coordination strategy, therefore, joint action contributions that may have been avoided in a submaximal intermuscular coordination strategy, due to the associated reduction in efficiency or endurance performance (e.g. knee flexion (Korff et al. 2007) or upper body contribution (McDaniel et al. 2005)) are recruited with far greater intensity in maximal cycling (Martin & Brown 2009; Elmer et al. 2011; McDaniel et al. 2014) in order to maximise the overall mechanical muscle output. In addition, duty cycles at the ankle, knee and hip are longer in maximal cycling (Martin & Brown 2009; Elmer et al. 2011), a strategy which maximises the amount of time spent in powerful joint extension actions and thus 31
32 maximises average power output across the cycle (Martin & Brown 2009; Elmer et al. 2011). Similar increases in duty cycle have been observed across a range of maximal animal movements including high speed take-offs in quails (Askew & Marsh 2002; Askew et al. 2001; Askew, Marsh 2001) and pigeons (Biewener et al. 1998). A consequence of longer duty cycles would be shorter times between muscle contractions. It has been suggested that shorter times between muscle contractions would increase metabolic cost in cycling (Raasch & Zajac 2009), which in addition would explain why the longer duty cycles observed in maximal cycling are not adopted during submaximal cycling. A musculoskeletal simulation of maximal cycling by Raasch and colleagues (1997) further indicated the key role of muscle group synergies in the transfer of muscle power across the limb. In particular, they demonstrated that co-contraction by the ankle extensors is necessary in order to deliver the dominant hip extension power to the crank arm. That is, without simultaneous production of an ankle extension moment, power developed in the hip extension action would simply act to accelerate the limbs (hyper-extend the knee, dorsiflex the ankle) rather than deliver power to the crank arm. The importance of the ankle extensors in transferring power to the crank was emphasised when Dorel and colleagues (2012) observed in an EMG analysis that the ankle extensors were maximally recruited during maximal cycling, potentially indicating that this was even a limiting factor in maximal cycling power output. This intermuscular coordination strategy is likely to require a high level of neuromuscular control in order to co-contract the ankle extensors at the correct phase of the pedal cycle (McDaniel et al. 2014), particularly as movement speeds increase. Indeed this potential increase in the level of intermuscular coordination required led one author (McDaniel et al. 2014) to speculate that the reduction in ankle excursion observed at high pedalling rates in maximal cycling was an attempt by the central nervous system to simplify the task by removing a kinematic degree of freedom. Joint-Level Analyses of Mechanical Output in Elite or World-Class Sprint Athletes There is an abundance of literature demonstrating that sprint performance across a range of disciplines is facilitated by the ability to produce a high net mechanical output (Martin et al. 2006; Gardner et al. 2009; Dorel et al. 2005; de Koning et al. 1991; Lee & Piazza 2009; van Ingen Schenau et al. 1994; Bezodis et al. 2014). Successful sprint athletes therefore, via either genetic predisposition or training adaptation, are optimised for short-term mechanical output. Furthermore, the highest performing sprint athletes, such as those found in elite 32
33 sprint competitions (i.e. Elite athletes) or, in particular, those found in World and Olympic sprint competitions (i.e. World-Class athletes), are likely to represent the limits of shortterm maximal power production in humans. Joint-level analyses of mechanical output of elite or world-class sprint athletes should thus offer a rare opportunity to analyse and understand the mechanisms that limit the performance of maximal functional movements in humans. Unfortunately the relative scarcity of joint-level analyses of mechanical output in maximal movement tasks and also the difficulty in recruiting these levels of athletes for research studies means that very few investigations have achieved this insight to date. One investigation that did achieve this research goal was performed by de Koning and colleagues (1991), who observed joint mechanical outputs in elite speed skaters. These authors demonstrated that intermuscular coordination is not different between elite and subelite speed skaters. Rather, the difference in performance level between these groups is due to the ability of the elite speed skaters to realise larger net joint moments. Bezodis and colleagues (2014) recently investigated joint-level mechanical outputs of elite sprint runners and similarly concluded that the ability to generate a large knee extensor moment appeared to be a key difference between the highest performing athlete and the other athletes, albeit in a cohort of only three elite athletes. This study highlights the inherent difficulty in investigations of elite or world-class athletes; that of recruiting a sufficient number of participants to enable generalised conclusions to be made (i.e. beyond individual case studies), whilst preserving the quality of the athletes such that the definition of elite or world-class is still appropriate. Summary In summary, a review of the existing literature demonstrates that joint-level analyses have provided some insight into mechanical muscle properties and intermuscular coordination during cycling. In submaximal cycling in particular, these studies have identified how changes in task constraints influence joint kinetics and joint kinematics, and provide some insight to the intermuscular coordination strategy that is adopted during submaximal cycling. In maximal cycling by comparison, very few studies have described joint-level mechanical outputs, and thus the understanding of the contribution of mechanical muscle properties and intermuscular coordination is largely limited to crank-level analyses. The outcomes of these studies are limited but provide an excellent direction for future studies on joint-level mechanical outputs that are able to assess mechanical muscular properties and intermuscular coordination independently. Finally, joint-level mechanical 33
34 analyses of elite or world-class sprint athletes in the literature are especially rare. Additional research in this area should thus provide considerable progression with respect to our understanding of the limits of performance in maximal human movements. 34
35 CHAPTER 3 35
36 CHANGES IN JOINT KINETICS ACROSS CRANK LENGTHS AND PEDALLING RATES DURING MAXIMAL CYCLING Introduction Muscular power produced during cyclic contractions is primarily limited by muscle shortening velocity, excitation time and muscle length (Josephson 1999; Martin et al. 2000; Martin 2007; Sargeant 2007). These constraints have been reported to affect muscular power during voluntary activities (Askew & Marsh 2002; Marsh 1999) as well as in situ and in vitro isolated muscle actions (Caiozzo & Baldwin 1997; Josephson 1999). In particular, the constraints limit power production during maximal voluntary cycling exercise (Dorel et al. 2010; Martin et al. 2000; van Soest & Casius 2000; Yoshihuku & Herzog 1996; Yoshihuku & Herzog 1990). During cycling, muscle shortening velocity and hence velocity-specific force (via the force-velocity relationship), are generally constrained by pedal speed (Yoshihuku & Herzog 1996; Yoshihuku & Herzog 1990), which is the product of crank length and crank angular velocity. Furthermore, muscle excitation times across the complete pedal cycle are set by pedalling rate (Martin et al. 2000). Finally, crank length may also directly limit muscular force production via the length-tension relationship (Yoshihuku & Herzog 1996; Yoshihuku & Herzog 1990). Thus, crank length may affect short-term maximal cycling power, which is considered to be a major determinant of sprint cycling performance (Martin et al. 2007), via several fundamental mechanical muscle properties. Investigators have previously reported differing results with respect to the effect of crank length on short-term maximal cycling power (Inbar et al. 1983; Martin et al. 2000; Martin & Spirduso 2001; Yoshihuku & Herzog 1996; Yoshihuku & Herzog 1990; Too & Landwer 2000). Inbar and colleagues (1983) and Too and Landwer (2000) used a Wingate anaerobic test model and reported that peak cycling power varied by 8% over crank lengths of mm. The Wingate test used by these investigators is limited in that it does not account for changes in pedalling rate, which strongly affects short-term maximal cycling power (Dotan & Bar-Or 1983; Patton et al. 1985). Consequently, it is not clear whether these results reflect the effect of crank length per se, or the effect of pedalling rate on maximum cycling power. Yoshihuku and Herzog (1990, 1996) used a mathematical model of the lower limb during cycling to investigate the effect of crank length on pedal power. These authors 36
37 reported that maximum power varied by 0-10% for crank lengths of mm. Their model included an assumption of instantaneous muscle excitation and relaxation and thus was not affected by excitation-relaxation kinetics, which are known to affect maximum muscular power production (Caiozzo & Baldwin 1997; van Soest & Casius 2000). Martin and Spirduso (2001) and Martin and colleagues (2000) reported short-term maximal cycling power across a range of pedalling rates and crank lengths ( mm). These authors reported that the effect of crank length on maximum power production was small (<4%) and only significant when comparing extreme lengths (120 mm, 220 mm). They also reported that the product of pedalling rate and pedal speed (a construct variable they termed cyclic velocity (Hz m/s)) accounted for most of the variation in cycling power across all of the crank lengths tested. These findings suggest that once pedalling rate and pedal speed are accounted for - and thus the respective mechanical muscle properties of the force-velocity relationship and excitation-relaxation kinetics - crank length has only a small effect on shortterm maximal cycling power. Cycling power is produced mainly by the muscles that span the hip, knee and ankle joints (Broker & Gregor 1993; Martin & Brown 2009). These joint powers can be determined with standard inverse dynamics techniques, which provide an insight into intermuscular coordination strategies that are not apparent when observing overall cycling power. Martin and Brown (2009) demonstrated that short-term maximal cycling power is produced mainly through hip extension, knee extension, knee flexion, and ankle extension (plantarflexion) actions. They further demonstrated that during a maximal 30-s cycling trial, hip extension power was the most resistant to fatigue, whereas knee extension power was highly fatigable. In addition, fatigue has been reported to be reduced when cycling with greater crank lengths (Tomas et al. 2010). Tomas and colleagues (2010) speculated that increased crank length may cause a shift in the relative power produced at the hip, knee and ankle, such that longer cranks rely more on the fatigue resistant hip extension power. Taken together these findings make it clear that a greater understanding of the effects of crank length on intermuscular coordination during short-term maximal cycling may have important implications for cycling performance. The purpose of conducting this study was to determine if changes in crank length affect the relative contributions of hip, knee, and ankle power to overall cycling power. Five crank lengths were investigated within the range previously reported ( mm (Martin & Spirduso 2001)) to allow similar overall cycling power. These crank lengths were used with pedalling rate controlled in two ways. First, all crank lengths were tested at a standard pedalling rate of 120 rpm which is associated with the apex of the power-pedalling rate curve for standard length crank lengths (van Soest & Casius 2000). Second, each crank 37
38 length was evaluated at separate pedalling rates set to produce maximum short-term power for each length (Martin & Spirduso 2001). Based on previous results (Martin & Spirduso 2001; van Soest & Casius 2000), it was hypothesised that the effect of crank length on joint power would depend on how pedalling rate was accounted for. More specifically, it was hypothesised that: a) crank length would not affect relative joint power when pedalling rate was optimised for maximum power; and b) crank length would affect relative joint power when pedalling rate was constant. Methods Fifteen cyclists [12 males (76 ± 7 kg) and 3 females (66 ± 7 kg)] aged yrs volunteered for the study. All of the participants were experienced cyclists who regularly took part in local cycling races. The procedures were explained verbally and in writing, and all of the participants provided written informed consent. The procedures used in this study were reviewed and approved by the Research Ethics Committee of Brunel University and the Institutional Review Board of the University of Utah. All of the participants reported to the Neuromuscular Function Laboratory at the University of Utah on four separate occasions. During the week prior to the experimental data collection, the participants performed two familiarisation sessions with the shortest and longest crank lengths (150 and 190 mm). The participants did not perform familiarisation sessions with the standard crank lengths (165, 170 and 175 mm) as they regularly cycled on cranks within this range. During each familiarisation session, the participants performed 10 min of submaximal cycling at a self-selected power output of W followed by two maximal cycling trials of 3 s. These trials were performed with the 150 and 190 mm crank lengths during each visit. The order of presentation of the two lengths was counterbalanced between participants and visits. The familiarisation sessions allowed the participants to practise twice with the shortest and longest crank lengths before the experimental data collection. This procedure is in accordance with previous investigations (Martin et al. 2000). The experimental data were collected on two separate days. The data collection began at the same time of day for each participant. On each experiment day, the participants reported to the laboratory where their body mass, thigh length (greater trochanter to lateral femoral condyle), leg length (lateral femoral condyle to lateral malleolus), foot length (heel to toe), and kinematic foot length (pedal spindle to lateral malleolus) were recorded. All of the anthropometric measures were collected by the same investigator. The ergometer seat height was adjusted to match each participant s measured cycling position. When the crank 38
39 length was changed, the seat height was adjusted to ensure a constant distance between the top of the saddle and the pedal spindle when the leg was in its most extended position. The handlebar height was adjusted so that the vertical distance between the saddle and the handlebar was constant for all crank length conditions. The participants wore cycling shoes with cleats that locked onto the pedal interface (Speedplay Inc. SanDiego, USA). The participants performed a 5 min warm-up of submaximal cycling at a self-selected power output of W with the crank length to be tested first. They then rested for 2 min before performing two 3 s maximal isokinetic cycling trials. The participants performed one trial at a pedalling rate resulting in a cyclic velocity of 4.27 Hz m/s (Martin et al. 2000) and one trial at a pedalling rate of 120 rpm. The pedalling rates corresponding to each crank length can be found in Table 1. The condition of pedalling rate matched for cyclic velocity was intended to elicit maximum power (the apex of the power-pedalling rate curve) for each crank length (Martin & Spirduso 2001). Maximum power was defined as pedal power averaged over the revolutions of interest. The condition of constant pedalling rate at 120 rpm was included as this value is typically associated with the apex of the power-pedalling rate curve for standard crank lengths (van Soest & Casius 2000). Each participant performed a total of nine maximal cycling trials (two pedalling rate conditions and 5 crank lengths - the trial at 120 rpm and a crank length of 170 mm was used for both pedalling rate conditions). The order of crank lengths was randomised. Within each crank length condition, the order of the two maximal trials was also randomised. The nine maximal cycling trials were performed over two testing days. Participants were either tested on two crank lengths on the first day and three crank lengths on the second day of data collection or vice versa. For all of the maximal cycling trials, the participants were instructed to use the absolute maximum effort they could produce whilst remaining seated. Standardised verbal encouragement was provided throughout the trial. A Monark (Vansbro, Sweden) cycle ergometer frame and flywheel were used to construct an isokinetic ergometer. The ergometer flywheel was driven by a 3750 W direct current motor (Baldor Electric Company model CDP3605, FortSmith, AR, USA). The motor was controlled by a speed controller equipped with regenerative braking (Minarik model RG5500U, Glendale, CA, USA). The ergometer controlled pedalling rate to within an accuracy of one rpm for each experimental trial. An adjustable crank (SRM multi-length crank, Schoberer Rad Messtechnik, Jülich, Germany) was used to provide crank lengths of 150, 165, 170, 175 or 190 mm. The right pedal was equipped with two 3-component piezoelectric force transducers (Kistler 9251: Kistler USA, Amherst, NY, USA), and the right pedal and crank were equipped with digital position encoders (S5S-1024-IB, US Digital, Vancouver, WA), which measured the angles of the pedal and the crank in the 39
40 inertial reference frame. Using the pedal angle, normal and tangential pedal forces were resolved into (absolute) vertical and horizontal components. The position of the right iliac crest was recorded using a two-segment instrumented spatial linkage as described by (Martin et al. 2007). Pedal forces, pedal position, crank position and instrumented spatial linkage position were recorded at 240 Hz using Bioware software (Kistler USA, Amherst, NY, USA). These data were filtered using a fourth-order zero-lag Butterworth low pass filter with a cut-off frequency of 8 Hz. The position of the hip joint was inferred from the position of the iliac crest, assuming a constant offset that was measured in a static condition (Neptune & Hull 1995). The location of the ankle joint was determined using the angular positions of the crank and pedal as well as the length from the pedal spindle to the lateral malleolus. It was assumed that the position of the lateral malleolus relative to the pedal surface was fixed throughout the pedal cycle (Hull & Jorge 1985). Using the locations of the hip and ankle joints, as well as thigh and leg lengths, the position of the knee joint centre was determined by means of the law of cosines. Segment angles were calculated from joint positions and segment lengths, and joint angles were calculated from segment angles. Linear and angular velocities and accelerations of the limb segments were determined by finite differentiation of position data with respect to time. Segmental masses, moments of inertia, and segmental centre of mass locations were estimated using the regression equations reported by de Leva (1996). Sagittal plane joint reaction forces and net joint moments at the hip, knee and ankle were derived using standard inverse dynamics techniques (Elftman 1939). To perform the inverse dynamics analysis, it was assumed that the hip, knee and ankle functioned as frictionless revolute joints, and that the foot, leg and thigh were rigid segments with fixed centres of mass and segmental moments of inertia. Joint powers were calculated as the product of net joint moments and joint angular velocities; power transferred across the hip joint was calculated as the dot product of hip joint reaction force and linear velocity (Broker & Gregor 1993). Pedal power was defined as the dot product of pedal force and pedal linear velocity. Data representative of all complete pedal cycles during the trial were analysed. Each trial lasted 3 s and therefore included 4 6 complete pedal cycles, depending on the pedalling rate. Pedal and joint powers were calculated as average values over these pedal cycles. Joint powers were normalised to average pedal power. In addition, averaged extension and flexion powers were calculated at each joint. Extension and flexion phases were defined based on the numerical sign of the corresponding joint angular velocity (positive and negative joint angular velocities corresponding to extension and flexion, 40
41 respectively). Extension and flexion powers were normalised to average pedal power. As joint powers are affected by joint angular velocity and angular excursion (Yoshihuku & Herzog 1996; Yoshihuku & Herzog 1990), in addition, the effect of crank length on angular velocities and excursions was quantified at the ankle, knee and hip for the two pedalling rate conditions. Joint angular velocities were averaged over the corresponding extension and flexion phases. Joint excursion was defined as the difference between maximum and minimum joint angle for the corresponding joint. To test the hypothesis that the effect of crank length on joint power would depend on how pedalling rate was accounted for, a multivariate analysis of variance was performed (repeated measures Factor MANOVA) with 10 dependent variables (hip power, hip transfer power, knee power, ankle power, hip extension power, hip flexion power, knee extension power, knee flexion power, ankle extension power, ankle flexion power), with crank length and method of accounting for pedalling rate (constant pedalling rate vs. optimised for maximum power) being the within-subject factors. In case of the crank by method interaction being significant, separate follow-up repeated measures MANOVAs were then performed for each method of standardising pedalling rate. The significance level for all of the MANOVAs was set to P<0.05. In case of these follow-up MANOVAs being significant, one-way analyses of variance (ANOVAs) were performed with repeated measures for each dependent variable, with crank length being the within-subject factors. To account for type I error inflation the significance level of these ANOVAs was adjusted by dividing the original significance level of P<0.05 by the number of dependent variables. If an ANOVA indicated a significant main effect for crank length, post hoc pairwise comparisons (Bonferroni) were performed to identify crank length pairs with significantly different relative joint powers. All statistical procedures were performed using SPSS 14.0 (SPSS Inc., Chicago, IL). To further describe the interactive effect of crank and method to account for pedalling rate on joint power, means, standard deviations and effect sizes were calculated for pairwise comparisons. The same descriptive statistics were used to report the effect of crank length on joint angular velocities and excursions. Effect sizes were interpreted based on Cohen s (1988) classification scheme: Effect sizes smaller than 0.5 were considered small, effect sizes greater than 0.5 and smaller than 0.8 were considered moderate, and effect sizes greater than 0.8 were considered large. 41
42 Results The repeated measures Factor MANOVA revealed that the crank length by method of accounting for pedalling rate was significant (Wilks Lambda = 0.284; F (36,182) = 2.201, P = 0.002). The first follow-up repeated measures MANOVAs revealed that crank length did not affect joint powers when pedalling rate was optimised for maximum power (Wilks Lambda = 0.490; F(40,180) = 0.932, P = 0.591). Figure 2 illustrates the similarity in the relative joint power profiles produced with the 150 mm, 170 mm and 190 mm cranks when pedalling rate was optimised for maximum power. Figure 2. Joint power profiles for the 150 mm, 170 mm and 190 mm cranks when pedalling rate was optimised for maximum power. The profiles were averaged within each crank length group, and normalised to pedal power. Zero and 360 deg. on the horizontal axis refer to top dead centre of the pedal cycle; 180 deg. refers to bottom dead centre of the pedal cycle. 42
43 Constant Pedaling Rate Optimized Pedaling Rate Crank Length (mm) Pedal Rate (rpm) Pedal Power (W) 494 ± ± ± ± ± ± ± ± ± ±104 Ankle Power (%) ± ± ± ± ± ± ± ± ± ±7 Knee Power (%) ± ± ± ± ± ± ± ± ± ±6 Hip Power (%) ± ± ± ± ± ± ± ± ± ±7 Hip Transfer Power (%) ± ± ± ± ± ± ± ± ± ±3 Table 1. Power delivered to the right pedal during maximal cycling with variations in crank length and pedalling rate. Joint powers are averaged over complete pedal cycles and normalised to pedal power. Joint powers are presented as means and standard deviations on the main diagonal of each table. Effect sizes for pairwise comparisons are presented in the remaining cells. 43
44 Figure 3. Joint power profiles from the 150mm and 190mm cranks when pedalling rate was constant. The profiles were averaged within each crank length group, and normalised to pedal power. Zero and 360 deg. on the x-axis refer to top dead centre of the pedal cycle; 180 deg. refers to bottom dead centre of the pedal cycle. The second follow-up repeated measures MANOVA revealed that crank length had a significant effect on joint powers when pedalling rate was constant at 120 rpm (Wilks Lambda = 0.224; F(40,180) = 2.179, P < 0.001). Follow up ANOVAs revealed that crank length significantly affected relative knee power and relative hip power averaged over complete pedal cycles (P < 0.001) (Table 1). Post-hoc t-tests revealed that cycling with 150 mm cranks resulted in greater relative knee power (P = 0.001) and smaller relative hip power (P < 0.001) when compared to 190 mm cranks. Further, crank length significantly affected relative knee flexion power (P = 0.011) and relative hip extension power (P = 0.044) (Table 2). Post hoc t-tests revealed that relative knee flexion power was greater (P < 0.001) and relative hip extension power was smaller (P = 0.01) when cycling with 150 mm cranks compared with 190 mm cranks. Figure 3 illustrates that knee and hip power profiles produced with 150 mm and 190 mm cranks diverge during parts of the pedal cycle (Figure 3). 44
45 Constant Pedaling Rate Optimized Pedaling Rate Ankle Extension Power (%) Ankle Extension Power (%) ± ± ± ± ± ± ± ± ± ±11 Ankle Flexion Power (%) Ankle Flexion Power (%) ± ± ± ± ± ± ± ± ± ±5 Knee Extension Power (%) Knee Extension Power (%) ± ± ± ± ± ± ± ± ± ±13 Knee Flexion Power (%) Knee Flexion Power (%) ± ± ± ± ± ± ± ± ± ±10 Hip Extension Power (%) Hip Extension Power (%) ± ± ± ± ± ± ± ± ± ±15 Hip Flexion Power (%) Hip Flexion Power (%) ± ± ± ± ± ± ± ± ± ±13 Table 2. Extension and flexion powers produced at the ankle, knee and hip. Powers are normalised to pedal power. Means and standard deviations are presented on the main diagonal of each table. Effect sizes for pairwise comparisons are presented in the remaining cells. The analysis of joint angular velocities indicated that when pedalling rate was optimised for maximum power, crank length only had a small effect on joint angular velocities. The corresponding effect sizes were smaller than 0.5 (Table 3). When pedalling 45
46 rate was constant at 120 rpm, longer crank lengths produced greater extension and flexion velocities at the hip and knee than shorter cranks. The effect sizes revealed that this difference increased with more extreme comparisons (Table 3). In particular, effect sizes were large for extension and flexion velocities at the knee and hip joints when 150 mm cranks were compared to 190 mm cranks. The analysis of joint excursions indicated that longer crank lengths resulted in increased hip and knee excursions than shorter cranks during both pedalling rate conditions (Table 4). Again, the effect sizes became larger when more extreme cranks were compared. These differences were similar across both methods of standardising pedalling rate. With one exception, the effect sizes relating to ankle excursion were small for all comparisons (Table 4). Constant Pedaling Rate Optimized Pedaling Rate Ankle Extension Velocity (deg/s) Ankle Extension Velocity (deg/s) ± ± ± ± ± ± ± ± ± ±38 Ankle Flexion Velocity (deg/s) Ankle Flexion Velocity (deg/s) ± ± ± ± ± ± ± ± ± ±36 Knee Extension Velocity (deg/s) Knee Extension Velocity (deg/s) ± ± ± ± ± ± ± ± ± ±25 Knee Flexion Velocity (deg/s) Knee Flexion Velocity (deg/s) ± ± ± ± ± ± ± ± ± ±33 Hip Extension Velocity (deg/s) Hip Extension Velocity (deg/s) ± ± ± ± ± ± ± ± ± ±33 Hip Flexion Velocity (deg/s) Hip Flexion Velocity (deg/s) ± ± ± ± ± ± ± ± ± ±26 Table 3. Joint angular velocities at the hip, knee and ankle. Means and standard deviations are presented on the main diagonal of each table. Effect sizes for pairwise comparisons are presented in the remaining cells. 46
47 Constant Pedaling Rate Optimized Pedaling Rate Ankle Excursion (deg) Ankle Excursion (deg) ± ± ± ± ± ± ± ± ± ±11 Knee Excursion (deg) Knee Excursion (deg) ± ± ± ± ± ± ± ± ± ±7 Hip Excursion (deg) Hip Excursion (deg) ± ± ± ± ± ± ± ± ± ±7 Table 4. Joint excursions at the hip, knee and ankle. Means and standard deviations are presented on the main diagonal of each table. Effect sizes for pairwise comparisons are presented in the remaining cells. Discussion The purpose of conducting this study was to determine if changes in crank length would affect the relative contributions of hip, knee and ankle power to overall pedal power. The main finding was that the effect of crank length on relative joint power production was dependent upon the control of pedalling rate. In agreement with the hypothesis, crank length did not affect relative joint powers when pedalling rate was set to optimise maximum power (matched for cyclic velocity). This finding extends upon previous work that overall pedal power is similar across a range of crank lengths (Martin & Spirduso 2001) by demonstrating that pedal power is produced with similar joint power contributions across crank lengths. In contrast, crank length significantly affected relative joint power when pedalling rate was held constant at 120 rpm but only when comparing the shortest and longest cranks (150 and 190 mm). When pedalling rate is constant across crank lengths, pedal speed is linearly related to crank length. Pedal speed is highly related to joint angular velocity at the hip and knee (Martin et al. 2000) and therefore serves as a surrogate measure of muscle shortening velocity at these joints (Yoshihuku & Herzog 1990; Yoshihuku & Herzog 1996). 47
48 Consequently, the significant effect of crank length on hip and knee power in the constant pedalling rate condition could be a result of the interaction between crank length and joint angular velocity, rather than an effect of crank length per se. This notion is supported by the analysis of joint angular velocities. When pedalling rate was held constant at 120 rpm, increased crank length resulted in a greater increase in knee flexion velocity and hip extension velocity when compared to the condition which controlled for cyclic velocity (Table 3). Furthermore, the effect of crank length on joint excursion, which serves as an indicator of muscle length (Yoshihuku & Herzog 1990; Yoshihuku & Herzog 1996) of the knee and the hip did not differ between pedalling rate conditions (Table 4.). Taken together, these findings support the notion that joint powers are governed by joint angular velocities (and therefore the shortening velocities of muscles) across crank lengths. However, these data do not provide incontrovertible evidence to support this speculation. In previous work, Martin and Spirduso (2001) demonstrated that the relationships between pedal power and cyclic velocity (pedal speed x cycle frequency) did not differ for crank lengths of 145, 170 and 195 mm. The observation of similar joint powers at a constant value of cyclic velocity supports those findings and emphasises the dual roles of pedal speed and cycle frequency in determining maximum power during cycling via two different mechanisms. Pedal speed sets the shortening velocity of muscles spanning the hip, knee and ankle joints, and thereby affects power via the force-velocity relationship of muscle (Yoshihuku & Herzog 1990; Yoshihuku & Herzog 1996; Martin & Spirduso 2001). Cycle frequency sets the time within which these muscles become excited, produce force whilst shortening, and relax before lengthening. Thus, cycle frequency affects power via the muscle excitation-relaxation kinetics (Caiozzo & Baldwin 1997; Martin et al. 2000; van Soest & Casius 2000; Neptune & Kautz 2001). The present data demonstrate that the interactive effects of shortening velocity and cycle frequency give rise to similar joint power production at the optimal cyclic velocity. These data also suggest that cyclic velocity may affect joint power production over a range of cyclic velocities, which should be the subject of future research. Relative contributions of joint powers to overall power have important implications for fatiguing exercises. Martin and Brown (2009) demonstrated that during fatiguing maximal cycling, the hip extensors are more fatigue resistant than the knee extensors. Furthermore, Tomas and colleagues (2010) reported that fatigue is reduced when cycling with 220 mm cranks in comparison to 120 mm cranks with pedalling rates optimised for maximum power. These authors speculated that their results could be due to their participants relying more heavily on the less fatigable hip extensors when pedalling with longer cranks. These data indicate that joint powers are not affected by crank length when 48
49 pedalling rate is optimised for maximum power and thus do not support this speculation. These findings allow us to speculate that the reduced fatigue on longer cranks observed by Tomas and colleagues (2010) was due to other factors, such as total work or the number of maximal muscle contractions. However, these data do not provide irrefutable evidence to support this speculation, as the range of crank lengths used in this study was different than that used by Tomas and colleagues (2010). These findings have implications for competitive cyclists and coaches as they demonstrate that changes between cranks of standard length ( mm) do not compromise maximum cycling power or modify the relative joint power contributions to pedal power. For this range of crank lengths, similarities in pedal powers and joint powers were observed for both methods of controlling pedalling rate. Therefore, these results suggest that cyclists can select crank lengths based upon other factors, such as reduced aerodynamic drag or reduced risk of injury (e.g. by controlling joint ranges of motion) without concerns about compromising their maximum power capability. Furthermore, these findings demonstrate that once the effects of pedalling rate and pedal speed are accounted for (by matching pedalling rate for cyclic velocity), even large changes in crank length ( mm) do not affect joint maximal power production. These findings could have particular relevance to bicycle designs incorporating novel crank lengths and gearing systems. Finally, researchers investigating relative joint powers can allow participants to use their preferred crank length without introducing a confounding factor to the study. This notion may be of importance for research undertaken on elite cyclists, in which it may be preferable for participants to perform experimental protocols in their accustomed cycling position. In summary, these findings demonstrate that the effect of crank length on relative joint power production is dependent on the control of pedalling rate. When pedalling rate is set to be optimal for maximum power production, changes in crank length of mm do not affect overall cycling power or relative joint powers at the hip, knee or ankle. When pedalling rate is constant across crank lengths, extremely long cranks (190 mm) can result in less relative knee flexion power and more relative hip extension power when compared to very short cranks (150 mm). These data support speculation that these effects are due to variations in joint angular velocity, and therefore muscle shortening velocity, across the crank length range. These results extend previous findings that crank length per se is not an important determinant of short-term maximum cycling power by demonstrating that crank length does not influence joint-specific maximal power production. 49
50 CHAPTER 4 50
51 CHANGES IN JOINT KINETICS ACROSS CRANK LENGTHS AND PEDAL SPEEDS DURING SUBMAXIMAL CYCLING Introduction Power delivered to cycling pedals is produced by muscles that span the ankle, knee, and hip and by power produced in the upper body that is transferred across the hip joint (Broker & Gregor 1993; Martin & Brown 2009). It was reported in Chapter 3 that contributions of the various power producing joint actions during maximal cycling were not influenced by changes in range of motion induced by variations in crank length (Barratt et al. 2011). Maximal cycling, however, may represent maximal application of all of the muscular actions available for delivering power to the cycling cranks and thus the relative contributions could be difficult to perturb. During submaximal cycling, by comparison, the central nervous system has the freedom to selectively utilise combinations of the various power producing joint actions to meet the task objective. The chosen intermuscular coordination strategy may represent some optimisation such as minimising muscle activation (Neptune & Hull 1999), muscle stress (Hull et al. 1988), or overall metabolic cost (Korff et al. 2007). This notion is supported by analyses of preferred pedalling rates. Cyclists freely choose pedalling rates that are associated with small values for joint moments (Marsh et al. 2000; Gonzalez & Hull 1989; Hull & Gonzalez 1988), muscle stress (Hull et al. 1988), negative muscle work (Neptune & Herzog 1999) and muscle activation (Neptune & Hull 1999). Although metabolic cost is not minimised at the preferred pedalling rate (Marsh & Martin 1993), it is likely that the minimisation of metabolic cost also contributes to the intermuscular coordination strategy. In support of this notion, Korff and colleagues (2007) demonstrated that metabolic cost is minimised when cyclists use their preferred pedalling technique, an indirect marker of intermuscular coordination (Korff et al. 2009; Korff & Jensen 2007). Whilst it is likely that the intermuscular coordination strategy adopted during submaximal cycling is an optimisation based upon some combination of mechanical and metabolic factors, the specific interaction remains poorly understood. Therefore, the overall goal of this study was to investigate the intermuscular coordination strategy adopted during 51
52 submaximal cycling by observing the relative contribution of the joint actions across different pedalling conditions. Within this context, it is of particular importance to understand the relationship between joint angular velocities (which are indicative of muscle shortening velocities), joint moments (which are indicative of muscular force) and joint powers (which are indicative of muscular power). Alterations in pedal speed (the mathematical product of crank length and pedalling rate) provide the ideal perturbation to investigate these interactions. This is best done by varying the crank length and keeping pedalling rate constant in order to remove cycle frequency, which is related to muscle excitation-relaxation kinetics (Martin 2007; Neptune & Kautz 2001), as a confounding factor. Knee and hip extension velocity are tightly coupled to pedal speed (Martin et al. 2000), and thus changes in pedal speed should illicit large changes in joint angular velocities (and therefore muscle shortening velocities) in these dominant power producing joint actions (Elmer et al. 2011; Zajac et al. 2002). It has previously been shown that the joint power distribution is preserved across pedalling rates (Ericson 1988; Broker & Gregor 1993). If a constant joint power distribution is also sought across pedal speeds and muscle shortening velocities, we would observe the large changes in joint angular velocities to be counteracted by changes in the corresponding joint moments to keep joint powers (the mathematical product of these two quantities) constant. That is, across pedal speeds, joint moments would alter in response to joint angular velocity changes, but joint powers would remain constant. In cycling, a thorough understanding of these factors is important for two reasons. Firstly, submaximal cycling is a repetitive movement in which joint excursions and joint angular velocities can be tightly controlled. It is therefore an ideal functional movement to gain mechanistic insights into the contribution of the associated mechanical muscle properties (the length-tension relationship and the force-velocity relationship, respectively) to the chosen intermuscular coordination strategy. Secondly, knowledge of the mechanical and metabolic factors which govern the movement strategy adopted during submaximal cycling would improve our understanding of endurance cycling performance (Jeukendrup, Martin 2001; Joyner & Coyle 2008) and could give insights into more optimal training and intervention strategies for cyclists. The specific purpose of this study was therefore to investigate the effect of pedal speed on joint angular velocities and the distribution of joint powers in submaximal cycling. The specific hypotheses were: (1) increases in pedal speed would increase joint angular velocities at the knee and hip; and (2) increases in joint angular velocity would be 52
53 counteracted by decreases in joint moments such that joint powers at the ankle, knee and hip would be preserved across pedal speeds. Methods Participants Fifteen trained cyclists [12 men (76 ± 7 kg), 3 women (66 ± 7 kg)] aged yrs, all of whom regularly compete in regional cycling races, volunteered to take part in the study. The experimental procedures were approved by the Institutional Review Board of the University of Utah and the Research Ethics Committee of Brunel University. The participants received a verbal and written explanation of all of the procedures, and gave their written informed consent. Procedure The participants visited the laboratory on four separate occasions. During the first two visits, they practised cycling with the non-standard crank lengths (150 mm and 190 mm). Practice was not required for the standard crank lengths (165mm, 170mm, 175mm), as participants regularly cycled on cranks within this range. On each familiarisation day, the participants performed two 10 min trials of submaximal cycling (one on the shortest crank (150 mm) and one on the longest crank (190 mm)). Each trial consisted of 8 min cycling at a self-selected power output (e.g. ~ W) followed by 2 min cycling at a power output of 240 W. All of the practice sessions were performed on the same isokinetic cycling ergometer as used for the experimental data collection. During the third and fourth visits, the participants performed the experimental submaximal cycling protocol, with two or three crank lengths tested on each visit. The order of the crank lengths was randomised, as was the number of crank lengths tested on each experiment day (three crank lengths on the first day and two on the second or vice versa). The data collection took place on two separate days in order to minimise fatigue across the experimental trials. For each participant, the data collection began at the same time on both of the experiment days. On the first day, body mass, thigh length (greater trochanter to lateral femoral condyle), leg length (lateral femoral condyle to lateral malleolus), foot length (heel to toe), and kinematic foot length (pedal spindle to lateral malleolus) were measured. All of the anthropometric measures were collected by the same investigator. 53
54 The experimental trials consisted of two 30 s trials of isokinetic cycling at each crank length (150 mm, 165 mm, 170 mm, 175 mm, and 190 mm). One trial was performed at a pedalling rate of 90 rpm and the other trial was performed at a constant pedal speed of 1.60 m/s (equivalent to the middle condition of 170 mm crank length and 90 rpm). The constant pedal speed condition was included to test whether crank length per se would have a confounding effect on any of the dependent variables. This could be the case as alterations in crank length change joint and muscle length (Mileva, Turner 2003). Table 5 details the crank lengths, pedalling rates and pedal speeds used in both experimental conditions. The order of the two experimental trials was randomised, and a minimum of 3 min recovery was given between them. The participants were asked to maintain a target power output of 240 W against the isokinetic resistance (Elmer et al. 2011); feedback regarding their instantaneous pedal power was provided by means of a calibrated SRM power measurement system (Schoberer Rad Messtechnik, Jülich, Germany). Constant Pedaling Rate Condition (independent variable: pedal speed) Trial Crank Length (mm) Pedal Rate (rpm) Pedal Speed (m/s) Constant Pedal Speed Condition (independent variable: crank length) Trial Crank Length (mm) Pedal Rate (rpm) Pedal Speed (m/s) Table 5. Crank lengths, pedalling rates and pedal speeds used in both experimental conditions. The constant pedal speed condition was included to test whether crank length per se would have a confounding effect on any of the dependent variables. Cycle Ergometer All of the cycling trials were performed on an isokinetic ergometer, constructed from a Monark cycle ergometer frame and flywheel (Monark Exercise AB, Vansbro, Sweden). The ergometer flywheel was coupled to a 3.75kW direct current motor (Baldor Electric Company model CDP3605, FortSmith, AR, USA) and controlled by a speed 54
55 controller equipped with regenerative braking (Minarik model RG5500U, Glendale, CA, USA). Two reference measurements were recorded on each participant s training bicycle and used to set the ergometer position; seat height, as defined by the distance between the top of the saddle and the pedal spindle when the crank was positioned to allow maximum displacement between these two points, and handlebar drop, as defined by the vertical drop from the top of the saddle and the top of the handlebars. When the crank length was changed on the ergometer (SRM multi-length crank, Schoberer Rad Messtechnik, Jülich, Germany) the height of the seat and the handlebars were both altered to maintain these two reference measurements (seat height, handlebar drop) across all crank lengths. The Handlebar reach, as defined by the horizontal distance between the saddle and the handlebars, remained constant across all crank lengths. The participants wore cycling shoes with cleats that locked onto the pedal interface (Speedplay Inc. San Diego, CA, USA). Instrumentation The instrumentation and procedures used to obtain cycling kinematic and kinetic data have been described in several previous studies (Barratt et al. 2011; Elmer et al. 2011; Martin & Brown 2009). Normal and tangential pedal forces were recorded on the right pedal using two 3-component piezoelectric force transducers (Kistler 9251: Kistler USA, Amherst, NY, USA). The right pedal and crank were equipped with digital position encoders (S5S IB, US Digital, Vancouver, WA, USA), and the pedal and crank angles were used to resolve the normal and tangential pedal forces into absolute vertical and horizontal components. The position of the right iliac crest was recorded with a two-segment instrumented spatial linkage (Martin et al. 2007). Pedal forces, pedal position, crank position and instrumented spatial linkage position were all sampled at 240 Hz using Bioware software (Kistler USA, Amherst, NY, USA) and filtered with a fourth-order zero-lag Butterworth low pass filter at a cut-off frequency of 8 Hz. The position of the hip joint was calculated from the position of the iliac crest, assuming a constant offset, measured in a static condition (Neptune & Hull 1995). The location of the ankle joint was determined using the angular positions of the crank and pedal and the distance from the pedal spindle to the lateral malleolus, assuming that the position of the lateral malleolus relative to the pedal surface was fixed throughout the pedal cycle (Hull & Jorge 1985). The position of the knee joint centre was calculated by means of the law of cosines, using the locations of the hip and ankle joints as well as thigh and leg lengths. Joint angles were calculated from joint positions and segment lengths. Linear and angular 55
56 velocities and accelerations of the limb segments were determined by finite differentiation of position data with respect to time. Segmental masses, moments of inertia, and segmental centre of mass locations were estimated using the regression equations reported by de Leva (1996). Sagittal plane joint intersegmental forces and net muscle moments about the joint (joint moments) were derived at the ankle, knee and hip using standard inverse dynamics techniques (Elftman 1939), as described in Chapter 3 (Barratt et al. 2011). Joint powers were defined as the product of joint moments and joint angular velocities. Power delivered to the right pedal was defined as the product of the component of pedal force acting normal to the crank and the linear velocity of the pedal. Derivation of Dependent Variables All complete pedal cycles during the 30 s trial were analysed. Joint angular velocities and joint powers were determined over extension and flexion phases and calculated as average values over these pedal cycles. Extension and flexion phases were defined based on the numerical sign of the corresponding joint angular velocity (positive joint angular velocity indicating extension, negative joint angular velocity indicating flexion). Statistical Analysis To test the hypothesis that changes in pedal speed would alter joint angular velocities at the knee and hip, in the constant pedalling rate condition a one-way analysis of variance (ANOVA) with repeated measures was performed for the joint extension and flexion velocities at the ankle, knee and hip. To test the hypothesis that changes in joint angular velocity would be counteracted by changes in joint moments such that the joint power distribution would be preserved, in the constant pedalling rate condition a one-way ANOVA with repeated measures was performed for the joint extension and flexion moments at the ankle, knee and hip, and a one-way ANOVA with repeated measures on extension and flexion powers at the ankle, knee and hip joints. For all of the analyses described above, pedal speed was the independent variable (see Table 5 for details). To examine the potential confounding effect of crank length per se on the dependent variables, in the constant pedal speed condition eighteen separate one-way analyses of 56
57 variance (ANOVAs) were performed with repeated measures for the joint extension and flexion velocities, joint extension and flexion moments and joint extension and flexion powers. Here, crank length was the independent variable, and data were analysed at the five crank lengths (Table 5). If an ANOVA indicated a significant main effect, post hoc pairwise comparisons (Bonferroni) were performed to locate where those differences occurred. In addition, effect sizes were calculated to describe pairwise differences. Effect sizes were interpreted on the basis of Cohen s (Cohen 1988) classification scheme: effect sizes <0.5 were considered to be small, effect sizes between 0.5 and 0.8 were considered to be moderate, and effect sizes >0.8 were considered to be large. The alpha level was set at 0.05 and all statistical procedures were performed using SPSS 15.0 (SPSS Inc., Chicago, IL, USA). 57
58 Results Constant Pedaling Rate ANOVA Main Effect Significant pairwise comparisons F-Value P-Value (P-Value in brackets) F-Value P-Value (1 =1.41 m/s, 2 = 1.56 m/s, 3 = 1.60 m/s, 4 = 1.65 m/s, 5 = 1.79 m/s) Constant Pedal Speed ANOVA Main Effect Significant pairwise comparisons (P-Value in brackets) (1 = 150 mm, 2 = 165 mm, 3 = 170 mm, 4 = 175 mm, 5 = 190 mm) Joint Velocity (rad/s) Ankle Extension Ankle Flexion * 1>4 (0.034) Knee Extension * 2>1 (0.000), 3>1 (0.000), 4>1 (0.000), >1 (0.000), 4>2 (0.009), 5>2 (0.000), 4>3 (0.021), 5>3 (0.000), 5>4 (0.034) Knee Flexion * 2>1 (0.000), 3>1 (0.000), 4>1 (0.000), * 1>5 (0.001) 5>1 (0.000), 4>2 (0.008), 5>2 (0.000), Hip Extension * 2>1 (0.000), 3>1 (0.000), 4>1 (0.000), >1 (0.000), 4>2 (0.004), 5>2 (0.000), 4>3 (0.004), 5>3 (0.000), 5>4 (0.015) Hip Flexion * 2>1 (0.000), 3>1 (0.000), 4>1 (0.000), 5>1 (0.000), 3>2 (0.004), 4>2 (0.009), 5>2 (0.000), 5>3 (0.000), 5>4 (0.000) * 1>5 (0.026), 2>5 (0.013), 3>5 (0.007) Joint Moment (Nm) Ankle Extension * none Ankle Flexion Knee Extension * 1>4 (0.005), 1>5 (0.015), 2>5 (0.025) Knee Flexion Hip Extension Hip Flexion Joint Power (W) Ankle Extension Ankle Flexion Knee Extension Knee Flexion Hip Extension Hip Flexion * 5>2 (0.049, 0.36) Table 6. Details of the statistical analyses in the constant pedalling rate and constant pedal speed conditions. In the constant pedalling rate condition increases in pedal speed caused large increases extension and flexion velocities at the knee and hip, and moderate decreases in knee extension moment. Constant Pedalling Rate Condition The main effects of pedal speed on extension and flexion velocities at the knee and hip were significant (P<0.001) (see Table 6 for details of all statistical tests). The main effects of pedal speed on ankle extension and flexion velocities were non-significant (P>0.05). Post hoc pairwise comparisons revealed that extension and flexion velocities at the knee and hip increased with increases in pedal speed. The significant pedal speed pairs are shown in Table 6. The magnitude of effect size of the pairwise comparisons was largest (effect size > 0.8) between the most different pedal speeds (see Table 6 for details). Table 7 58
59 provides descriptive statistics on the joint angular velocities for both pedalling rate conditions. Constant Pedaling Rate (1 =1.41 m/s, 2 = 1.56 m/s, 3 = 1.60 m/s, 4 = 1.65 m/s, 5 = 1.79 m/s) Constant Pedal Speed (1 = 150 mm, 2 = 165 mm, 3 = 170 mm, 4 = 175 mm, 5 = 190 mm) Ankle Extension Velocity (rad/s) ± ± ± ± ± 0.35 Ankle Flexion Velocity (rad/s) ± ± ± ± ± 0.33 Knee Extension Velocity (rad/s) ± ± ± ± ± 0.35 Knee Flexion Velocity (rad/s) ± ± ± ± ± 0.29 Hip Extension Velocity (rad/s) ± ± ± ± ± 0.33 Hip Flexion Velocity (rad/s) ± ± ± ± ± 0.25 Ankle Extension Velocity (rad/s) ± ± ± ± ± 0.39 Ankle Flexion Velocity (rad/s) ± ± ± ± ± 0.26 Knee Extension Velocity (rad/s) ± ± ± ± ± 0.37 Knee Flexion Velocity (rad/s) ± ± ± ± ± 0.29 Hip Extension Velocity (rad/s) ± ± ± ± ± 0.34 Hip Flexion Velocity (rad/s) ± ± ± ± ± 0.23 Table 7. Joint angular velocities at the ankle, knee and hip. Means and standard deviations are presented on the main diagonal of each table. Effect sizes for pairwise comparisons are presented in the remaining cells. Changes in pedal speed affected knee extension moment (P<0.001). Post hoc pairwise comparisons revealed a greater knee extension moment at 1.41 m/s in comparison to 1.65 m/s and 1.79 m/s, and at 1.56 m/s in comparison to 1.79 m/s (Table 6). The magnitudes of the effects describing these pairwise comparisons were moderate (0.5 < effect size < 0.8) and small (effect size < 0.5) (see Table 6 for details). Although the ANOVA indicated a significant main effect for pedal speed on ankle extension moment (P=0.019), post hoc pairwise comparisons did not reveal any significantly different pedal speed pairs. 59
60 Pedal speed did not affect flexion moment at the ankle, knee or hip (P>0.05). The effect of pedal speed on hip extension moment was also non-significant (P>0.05). Table 8 provides descriptive statistics on the joint moments for both pedalling rate conditions. Pedal speed did not affect joint powers at the ankle, knee or hip (P>0.05) (Table 6). Table 9 provides descriptive statistics on the joint powers for both pedalling rate conditions. Constant Pedaling Rate (1 =1.41 m/s, 2 = 1.56 m/s, 3 = 1.60 m/s, 4 = 1.65 m/s, 5 = 1.79 m/s) Constant Pedal Speed (1 = 150 mm, 2 = 165 mm, 3 = 170 mm, 4 = 175 mm, 5 = 190 mm) Ankle Extension Moment (Nm) ± ± ± ± ± 5 Ankle Flexion Moment (Nm) ± ± ± ± ± 4 Knee Extension Moment (Nm) ± ± ± ± ± 8 Knee Flexion Moment (Nm) ± ± ± ± ± 5 Hip Extension Moment (Nm) ± ± ± ± ± 8 Hip Flexion Moment (Nm) ± ± ± ± ± 8 Ankle Extension Moment (Nm) ± ± ± ± ± 6 Ankle Flexion Moment (Nm) ± ± ± ± ± 5 Knee Extension Moment (Nm) ± ± ± ± ± 8 Knee Flexion Moment (Nm) ± ± ± ± ± 6 Hip Extension Moment (Nm) ± ± ± ± ± 9 Hip Flexion Moment (Nm) ± ± ± ± ± 8 Table 8. Joint extension and flexion moments at the ankle, knee and hip. Means and standard deviations are presented on the main diagonal of each table. Effect sizes for pairwise comparisons are presented in the remaining cells. 60
61 Constant Pedaling Rate (1 =1.41 m/s, 2 = 1.56 m/s, 3 = 1.60 m/s, 4 = 1.65 m/s, 5 = 1.79 m/s) Constant Pedal Speed (1 = 150 mm, 2 = 165 mm, 3 = 170 mm, 4 = 175 mm, 5 = 190 mm) Ankle Extension Power (W) ± ± ± ± ± 12 Ankle Flexion Power (W) ± ± ± ± ± 4 Knee Extension Power (W) ± ± ± ± ± 31 Knee Flexion Power (W) ± ± ± ± ± 21 Hip Extension Power (W) ± ± ± ± ± 24 Hip Flexion Power (W) ± ± ± ± ± 20 Ankle Extension Power (W) ± ± ± ± ± 13 Ankle Flexion Power (W) ± ± ± ± ± 4 Knee Extension Power (W) ± ± ± ± ± 30 Knee Flexion Power (W) ± ± ± ± ± 24 Hip Extension Power (W) ± ± ± ± ± 26 Hip Flexion Power (W) ± ± ± ± ± 19 Table 9. Extension and flexion powers produced at the ankle, knee and hip. Powers are normalised to pedal power. Means and standard deviations are presented on the main diagonal of each table. Effect sizes for pairwise comparisons are presented in the remaining cells. 61
62 Constant Pedaling Rate (1 =1.41 m/s, 2 = 1.56 m/s, 3 = 1.60 m/s, 4 = 1.65 m/s, 5 = 1.79 m/s) Constant Pedal Speed (1 = 150 mm, 2 = 165 mm, 3 = 170 mm, 4 = 175 mm, 5 = 190 mm) Ankle Excursion (rad) ± ± ± ± ± 0.11 Knee Excursion (rad) ± ± ± ± ± 0.10 Hip Excursion (rad) ± ± ± ± ± 0.09 Ankle Excursion (rad) ± ± ± ± ± 0.36 Knee Excursion (rad) ± ± ± ± ± 0.12 Hip Excursion (rad) ± ± ± ± ± 0.10 Table 10. Joint excursions at the ankle, knee and hip. Means and standard deviations are presented on the main diagonal of each table. Effect sizes for pairwise comparisons are presented in the remaining cells. Constant Pedal Speed Condition With pedal speed held constant, the effect of crank length on extension velocities at the ankle, knee and hip was non-significant (P>0.05) (Table 6). Crank length significantly affected flexion velocities at the ankle, knee and hip (P<0.05) (Table 6). Post hoc pairwise comparisons between crank length pairs revealed that ankle flexion velocity was greater at a crank length of 175 mm compared to 150 mm. Furthermore, knee flexion velocity was greater at a crank length of 190 mm compared to 150 mm, and hip flexion velocity was greater at a crank length of 190 mm compared to 150 mm, 165 mm and 170 mm (Table 6). The magnitude of each of these effects was small (effect size < 0.5) (Table 7). At a constant pedal speed, the effect of crank length on flexion power at the ankle and knee joints was non-significant (P>0.05) (Table 6). Crank length significantly affected hip flexion power (P<0.05), with post hoc pairwise comparisons revealing that hip flexion power was greater at a crank length of 190 mm compared to 165 mm (Table 6). The magnitude of this effect was small (effect size < 0.5) (Table 7). With pedal speed held constant, crank length did not affect extension or flexion moments at the ankle, knee or hip (P>0.05) (Table 6). Changes in crank length did not affect extension power at the ankle, knee and hip (P>0.05) (Table 6). 62


63 Figure 4. Changes in knee extension velocity, moment and power in the constant pedalling rate and constant pedal speed conditions. The large changes in joint velocity across crank lengths in the constant pedalling rate condition were counteracted by changes in joint moment such that joint power remained unchanged. Discussion The purpose of this study was to investigate the effect of pedal speed on joint angular velocities and the distribution of joint powers during submaximal cycling. To achieve this, pedal speed was altered by changing crank length while keeping pedalling rate constant. Implicit in this experimental design is the assumption that joint velocities and joint powers are not confounded by changes in joint excursions and muscle lengths in response to changes in crank length. Thus, in addition the effect of crank length on the dependent variables was determined independent of pedal speed. The results demonstrate that when pedal speed was held constant, joint angular velocities, joint moments and joint powers were very similar across crank lengths. Although there was a statistically significant difference in hip flexion power between the 165 mm and 190 mm cranks, the size of this effect was small and the difference was negligible in absolute terms. Similarly, the differences in ankle, knee and hip flexion velocities were small even across extremely different crank lengths. This 63
64 finding demonstrates that crank length per se has minimal influence on joint velocities, joint moments or joint powers in submaximal cycling. These findings are relevant not only to the main purpose of this study; they extend our understanding of the length-tension relationship during cyclical, work producing muscular actions. Specifically they provide evidence that despite the length-tension relationship being a fundamental property of skeletal muscle (Lieber & Friden 2000), changes in joint excursions and muscle length do not considerably alter joint power production during submaximal cycling. These results extend upon similar findings in maximal cycling (Martin & Spirduso 2001; Yoshihuku & Herzog 1990; Barratt et al. 2011). More generally, they provide supporting evidence for the notion that during repetitive movements in which the muscle undergoes lengthening before shortening, the plateau region in the length-tension relation is increased and muscle length-tension effects are minimised (Martin 2007; Leonard et al. 2010; Nishikawa et al. 2012). Finally, these results confirm the validity of the experimental paradigm chosen for this study, which was to alter pedal speed by altering crank length and holding pedalling rate constant. The fact that crank length per se did not affect the dependent variables allows any differences observed in the constant pedalling rate condition to be attributed to pedal speed rather than crank length. The first objective was to test the hypothesis that increases in pedal speed would increase joint angular velocities at the knee and hip. Knee extension velocity and hip extension velocity are tightly coupled to pedal speed (Martin et al. 2000) and thus changes in pedal speed should illicit large changes in joint angular velocities in these dominant power producing joint actions. Large increases in extension and flexion velocity were found in both the knee and hip joints with increases in pedal speed. The first hypothesis therefore was supported, and the question arises as to the intermuscular coordination strategy adopted in response to these changes in joint angular velocities. Within this context, results relating to the second hypothesis provide some valuable insights. The second objective was to test the hypothesis that changes in joint angular velocity would be counteracted by changes in joint moments such that the distribution of joint powers between the ankle, knee and hip would be preserved across pedal speeds. It has previously been shown that the distribution of joint powers about the ankle, knee and hip is preserved across pedalling rates during submaximal cycling (Ericson 1988; Broker & Gregor 1993). Thus, it is possible that the central nervous system would also seek to preserve this distribution across pedal speeds. In support of the second hypothesis, the results reveal that in spite of the large changes in knee extension velocity, knee extension power was maintained across pedal speeds. Bearing in mind that joint power is the mathematical 64
65 product of joint moment and joint angular velocities, it is a mathematical necessity that pedal speed induced changes in joint angular velocities must be accompanied by opposing changes in joint moments. Indeed, these data reveal that changes in knee extension velocity across the pedal speed range were opposed by changes in knee extension moment, the combination of which resulted in an unchanged knee extension power across pedal speeds (Figure 4). These results suggest that muscular force produced by the knee extensor muscle group (vastii/rectus femoris) altered across muscle shortening velocities, with concomitantly preserved power output of the same muscle group. A possible explanation for these findings is that similar joint powers across pedal speeds could represent the central nervous system seeking to preserve a consistent distribution of muscle powers across a range of pedalling conditions. A potential mechanism underlying this conjecture is that muscle activation remained constant across pedal speeds. We know that joint angular velocities change as a result of pedal speed. If muscle activation was constant, then the force-velocity relationship of muscle would dictate that joint moments would also change across pedal speeds. These changes in joint angular velocities and joint moments could cancel each other out to yield constant joint power outputs across pedalling conditions. Support for this explanation comes from Neptune and Herzog (2000), who altered pedal speed via changes in chainring shape (which like the crank length paradigm does not alter cycle frequency) and reported no change in electromyography of the major power producing muscles across pedal speeds equivalent to the range used in this study. This explanation is further supported by the notion that mono-articular muscles, such as the dominant vastii muscle group, play a relatively invariant role as primary power producers in cycling (Ryan & Gregor 1992; van Ingen Schenau et al. 1992; Hug & Dorel 2009). Finally, the concept of constant activation of the major power producing muscles is also consistent with the suggestion that the central nervous system uses a small number of robust muscle synergies across a variety of different pedalling conditions in order to address the complexity of the cycling task (Raasch & Zajac 2009; Hug et al. 2010). Future research could use electromyography along with joint velocity and power measures to specifically test these hypotheses. From a practical perspective, these results will enable researchers and clinicians to prescribe submaximal cycling protocols with the knowledge that changes in pedal speed will alter joint moment predominantly in knee extension. This is especially relevant when choosing to prescribe a pedal speed or pedalling rate for a given exercise trial or to allow a self-selected pedalling rate, as they describe the extent to which knee extension moment will vary across typical submaximal pedal speeds. They further provide a theoretical rationale as to how cyclists will adjust knee extension moment in response to changes in bicycle setup 65
66 parameters that may alter knee extension velocity, such as gear ratio or saddle position. The finding that joint powers do not change in response to changes in crank length will allow cyclists and coaches to explore other benefits of altered crank lengths, such as personal comfort, reduced or increased range of motion for rehabilitation purposes, or reduced aerodynamic resistance. In addition, the insensitivity of joint powers to crank length alterations will enable researchers to allow cyclists to use their preferred crank length during laboratory assessments, without fear of modifying the joint power distribution. This is especially pertinent when making comparisons between cyclists of different disciplines (track sprint, road, BMX, mountain bike, etc.) as the standard crank length used within each discipline will differ, and thus the ability to allow personal preference, without introducing a confounding factor, is highly desirable. Limitations to this study should be considered when interpreting these results. The interpretation that knee extension power represents power produced by the knee extensor muscle group (vastii/rectus femoris) requires the non-trivial assumption that knee extension power is not greatly influenced by co-activation of the knee flexors. I believe however that this assumption is justified, firstly as the vastii muscle group (uni-articular knee extensor) is the primary power producing group in submaximal cycling and so dominates power output during this joint action (Zajac et al. 2002). Secondly, although co-activation of the knee flexor hamstring muscle group does occur near bottom dead centre (maximum leg extension) in order to resist the deceleration of the crank in the extension-to-flexion transition (Zajac et al. 2002), the extent to which this muscle group influences power output over the extension phase as a whole is minimal. Taken together, it appears highly probable that knee extension power indeed represents knee extensor muscle group power (vastii/rectus femoris), with knee extension moment representing the force produced in the same muscle group. In summary, these results demonstrate that during submaximal cycling, a constant distribution of joint powers is a robust intermuscular coordination strategy across changes in muscle length (crank length) and muscle shortening velocity (pedal speed), which could be indicative of an optimised movement strategy. From a basic science perspective, these results increase our understanding of the interaction between mechanical muscle properties and intermuscular coordination during submaximal functional movements. From a practical perspective, these results could have direct implications for researchers, clinicians, coaches and athletes. 66
67 CHAPTER 5 67
68 BIOMECHANICAL FACTORS ASSOCIATED WITH WORLD-CLASS TRACK SPRINT CYCLING PERFORMANCE Introduction Sprinting performance is determined by short-term force and power output. Those athletes that are able to produce higher short-term force and power outputs are more likely to succeed in races (Dorel et al. 2005; Martin et al. 2006; Gardner et al. 2007). Successful sprint athletes therefore, via either genetic predisposition or training adaptation, are optimised for short-term force and power output (Martin et al. 2007; van Ingen Schenau et al. 1994). Furthermore, the highest performing sprint athletes, such as those found in World and Olympic sprint competitions ( World-Class athletes), are likely to represent the limits of short-term force and power production in humans (van Ingen Schenau et al. 1994). More successful sprint athletes are generally stronger (Stone et al. 2004; Häkkinen & Keskinen 1989; Dowson et al. 1998), have a larger muscle mass (Foley et al. 1989; Watts et al. 2012; Stoggl et al. 2010) and a more optimal muscle fibre type distribution (Korhonen et al. 2006; Inbar et al. 1981). Given the differing biomechanical demands of the various sprinting disciplines (van Ingen Schenau et al. 1994), it seems logical that high performing sprint athletes should also have specific biomechanical attributes which are optimised for maximum performance within their given sprint discipline. Lee and Piazza (2009), for example, demonstrated that elite sprint runners have foot size and lower limb muscle moment arms that are optimised for maximum performance during running accelerations. Similarly, optimised values of muscle length, limb length, moment arm, shortening velocity and intermuscular coordination, have been found in a range of high-power animal movements including frog jumping (Lutz & Rome 1994), high-speed take-offs in quails (Askew & Marsh 2002), and running acceleration in turkeys (Roberts & Scales 2002) and horses (Crook et al. 2010). Within the context of human performance, amongst the highest reported short-term maximal power outputs are those produced by world-class track sprint cyclists (Dorel et al. 2005; Gardner et al. 2007; Martin et al. 2006). Therefore this population provides us with a window to investigate the biomechanical mechanisms underlying the limits of human power production capabilities during functional movements. 68
69 We know that higher performing track sprint cyclists have greater leg strength (Stone et al. 2004), which is likely to be facilitated by their greater leg muscle mass (McLean & Parker 1989; Foley et al. 1989). In addition to large, strong muscles, it is important that the relative timing and magnitude of muscle contractions (intermuscular coordination) is also optimised for maximum overall power output (Raasch et al. 1997; Yoshihuku & Herzog 1990; Yoshihuku & Herzog 1996). The repetition of fast, multi-joint movements has been demonstrated to cause the learning of a more optimal intermuscular coordination strategy (Schneider et al. 1989; Almasbakk & Hoff 1996). Therefore the high volume of maximal cycling training efforts performed by world-class track sprint cyclists suggests that they may have developed a more optimal intermuscular coordination strategy, which would be a contributing factor to enhanced maximal cycling power output. In fast movements the limited time available dictates that the rate at which muscular force can be developed is an important determinant of performance (Häkkinen et al. 1985; Martin 2007). Furthermore, in fast cyclic movements, force needs to be reduced quickly to avoid inefficient negative muscular work, so the rate at which muscular force can be reduced is also important (Neptune & Kautz 2001). Excitation-relaxation kinetics may consequently limit muscular force output in during cyclical movements in two ways. Firstly, the time may not be sufficient to allow complete development of muscular force (Martin 2007). Secondly, even if the muscle does reach maximum force within the movement, the reduced force at the onset (excitation) and offset (relaxation) of muscle contraction will reduce average muscle force for the cycle (Martin 2007). The limits imposed by excitation-relaxation kinetics increases with cycle frequency (Caiozzo & Baldwin 1997; McDaniel et al. 2010; Martin 2007; van Soest & Casius 2000), thus they are likely to be particularly relevant to sprint cycling performance, as very high cycle frequencies (>150rpm) are common in elite races (Dorel et al. 2005; Gardner et al. 2009)). The ability to rapidly produce and reduce force is facilitated by increased muscle strength (Aagaard et al. 2002; Inglis et al. 2013; Hannah et al. 2012). In addition to muscle strength, this ability depends upon calcium kinetics in the muscle (Neptune & Kautz 2001), and also on the intermuscular coordination strategy for example via reduced co-contraction of agonist and antagonist muscle groups (Osu et al. 2013). These factors may therefore also play an important role in the enhanced power producing capabilities of world-class track sprint cyclists. From the above it is clear that enhanced maximum cycling performance could be facilitated by a number of factors including muscular strength, intermuscular coordination and excitation-relaxation kinetics (both strength related and non-strength related). Understanding the relative contribution of these in world-class sprint athletes will allow us to understand the mechanisms underlying the limits of human muscular power capacity. 69
70 From an applied perspective, such an understanding could have implications for coaching and training interventions. Therefore, the purpose of this study was to determine the contribution of muscular strength, intermuscular coordination and excitation-relaxation kinetics to world-class track sprint cycling performance. It was hypothesised that, in comparison to sub-elite cyclists, world-class track sprint cyclists would have a) increased strength b) an altered intermuscular coordination strategy, c) increased excitation-relaxation kinetics. Methods Participants Seven world-class male track sprint cyclists (29 ± 6 years old, 83.6 ± 5.4 kg) and twelve sub-elite male cyclists (32 ± 7 years old, 82.4 ± 10.9 kg) volunteered to take part in the study. The inclusion criterion for the world-class group was a personal best time in a competitive flying 200m time trial of less than 10.2 seconds. This time is within 5% of the Olympic Record (9.713 seconds, Jason Kenny, August 4 th 2012, London, UK ( and thus represents an exceptionally high standard of track sprint cycling performance. Furthermore, all seven participants in the world-class group had competed in a major final in at least one World or Olympic track sprint cycling competition. Participants in the sub-elite group were trained cyclists (training a minimum of three times per week for the last three years), all of whom used track cycling as part of their training regimes. The procedures were explained verbally and in writing to all of the participants, and written informed consent was obtained. All of the procedures used in this investigation were approved by the Research Ethics Committee of Brunel University. Protocol and Instrumentation The testing protocol consisted of several maximal isokinetic cycling sprints. For this purpose, a standard SRM ergometer (SRM Ergometer, Schoberer Rad Messtechnik, Jülich, Germany) was modified in order for two-dimensional force data to be collected while the ergometer was operated in an isokinetic mode. Firstly, the SRM powermeter cranks (Schoberer Rad Messtechnik, Jülich, Germany) were replaced with instrumented force cranks that measure normal and tangential forces acting on the right and left crank arms, and crank angle (Vector Cranks, BF1 Systems, Diss, UK). Then the SRM powermeter and 70
71 sensor cable were relocated to a position on the ergometer frame such that a magnet attached to the crank arm would trip the powermeter reed-switch. In this setup the powermeter continued to provide a pedalling rate signal to the SRM software, as required for the ergometer eddy-current brake to provide an isokinetic resistance to the cyclist. Additionally, a 2.2-kw DC motor was coupled via a tooth-belt drive to a gearwheel mounted on the ergometer flywheel shaft. The motor rotated the flywheel at the target angular velocity prior to each cycling bout, such that the cyclists commenced their bouts at the target pedalling rate, rather than expending energy in accelerating the flywheel. Throughout the testing protocol, this isokinetic ergometer setup was able to hold the pedalling rate to within 2 rpm of the target pedalling rate for all cycling bouts. Prior to the cycling testing protocol, each participant s height, body mass and foot length were recorded. Saddle height, saddle setback, handlebar height and handlebar reach were measured on the participant s racing bicycle and transferred to the cycling ergometer. The crank length was altered to match the participant s bicycle setup, as it was shown in Chapter 3 that variations in crank length within the normal range ( mm) do not alter overall or joint-specific short-term maximal power (Barratt et al. 2011). Pedals were also matched to the participant s racing bicycle, and each participant used their own shoes and pedal cleats. The participants undertook a warm-up of 10 mins submaximal cycling at a selfselected power output and pedalling rate, followed by two 3-s maximal isokinetic sprints at 120 rpm. Following the warm-up, all-out 4-s maximal sprints were performed at 60 rpm, 90 rpm, 120 rpm, 150 rpm and 180 rpm. The order of the sprints was randomised, and there was a minimum of 5 mins recovery between sprints. For each sprint the cyclist was instructed to start pedalling from stationary, and once the cyclist was at the target pedalling rate (typically 1-2 s) the investigator gave a 3-s countdown and the cyclist performed a maximal 4-s sprint against the isokinetic resistance. Cyclists were vigorously encouraged throughout each sprint. Two-dimensional kinematics of the right leg were recorded at 300 Hz via a high speed camera (EX-F1, Casio, US) placed at a right angle to the sagittal plane of the leg. Reflective markers were positioned on the centre of the bottom bracket, centre of the pedal spindle, lateral malleolus, lateral femoral condyle, greater trochanter and the iliac crest. Reflective markers were positioned by the same investigator for all participants. The photographic plane of the right leg was calibrated with a square of known vertical and horizontal distance, and the two-dimensional position of each reflective marker was obtained via an automatic digitisation procedure (Quintic Biomechanics v21, Coventry, UK). These 71
72 kinematic data were synchronised with the kinetics data (normal crank force, tangential crank force, crank angle) via a light switch that illuminated with the right crank in the vertical position (top dead centre). Kinetic data were up-sampled via linear interpolation from 200 Hz to 300 Hz to match the sampling frequency of the kinematic data, and all data were smoothed using a fourth order (zero-lag) low-pass butterworth filter. In order to preserve the same filter characteristics across the different cycle frequencies (pedalling rates), the cut-off frequency was set at the fourth harmonic (4 x cycle frequency) for all pedalling rates (see appendix), which resulted in cut-off frequencies of 4 Hz, 6 Hz, 8 Hz, 10 Hz and 12 Hz at pedalling rates of 60 rpm, 90 rpm, 120 rpm, 150 rpm, 180 rpm respectively. Data Analysis Joint moments and powers were determined by means of an inverse dynamics algorithm. For this purpose, the right leg was modelled as a two-dimensional three-segment rigid mechanism (foot, shank and thigh) with each segment pair connected by frictionless hinge joints (pedal spindle, ankle, knee and hip). Ankle and knee joint centres were estimated from the locations of the lateral malleolus and femoral condyle, respectively. For the hip joint centre (greater trochanter) a constant vector was taken from the iliac crest marker. The vector from the greater trochanter to the iliac crest was determined in a static trial in which the crank was positioned in a forward and horizontal position (90 degrees from top dead centre) (Neptune & Hull 1995). Segmental centres of mass and principal moments of inertia were estimated via the tables of de Leva (1996). Segment centres of mass and joint centre displacement data were differentiated (finite) to determine velocities and accelerations. Track sprint cyclists have significantly larger legs than the normal population (McLean & Parker 1989; Foley et al. 1989), so a sensitivity analysis was performed to ensure that incorrect assumptions in their body segment parameter data did not alter the dependent variables (see appendix). The normal and tangential crank force data were decomposed into their absolute vertical and horizontal components acting at the pedal spindle, and the vertical and horizontal joint reaction forces and net joint moments were computed by standard link segment mechanics (Elftman 1939). Joint powers were calculated as the product of joint moment and joint angular velocity, and hip transfer power was calculated as the dot product of hip reaction force and linear hip velocity. This investigation concerned fatigue-free maximal power output, so the analysis was focussed on the first three crank revolutions of each maximal cycling bout. A constant 72
73 number of pedal cycles was used, rather than a constant time frame, as fatigue during maximal cycling occurs on a per cycle basis (Tomas et al. 2010). For the measure of strength, absolute peak extension and flexion moments developed at the ankle, knee and hip joints were taken from the slowest pedalling rate bout (60 rpm). At this pedalling rate, the extension phase will last 500 milliseconds (assuming an equal time spent in extension and flexion). This was deemed to be an acceptable time to allow peak muscular force to be developed, as the time to peak tension in human leg muscle is reported to take between 150 and 400 milliseconds (Aagaard et al. 2002; Tillin et al. 2010; Hannah et al. 2012) For the measure of intermuscular coordination, the relative distribution of joint powers was used (Korff & Jensen 2007; Korff et al. 2009). Joint powers were averaged over extension and flexion phases as defined by joint angular velocities (positive velocity for extension, negative velocity for flexion) and normalised to overall cycling power produced at the right crank. The intermuscular coordination requirement during fast multi-joint movements such as maximal cycling is suggested to increase with movement speed (McDaniel et al. 2014), thus relative joint powers were determined across all five pedalling rates (60 rpm, 90 rpm, 120 rpm, 150 rpm, 180 rpm). With respect to excitation-relaxation kinetics, the peak rate of moment development and the peak rate of moment reduction at the ankle, knee and hip joints were used. To derive these values, joint moment data were finitely differentiated, and then a zero-lag moving average filter with a sample window of 100 milliseconds was used to identify the peak rate of development and the peak rate of moment reduction occurring in each bout. The sample window of 100 millisecond was used, firstly, as this is less than the time needed to develop peak tension in human leg muscle (Aagaard et al. 2002; Tillin et al. 2010; Hannah et al. 2012), and secondly, for consistency with existing literature (e.g. Aagaard et al. 2002). The importance of excitation-relaxation kinetics during cyclic movements are suggested to increase with reductions in cycle time (Martin 2007; van Soest & Casius 2000), thus these values were determined across all five pedalling rates (60 rpm, 90 rpm, 120 rpm, 150 rpm, 180 rpm). To determine the contribution of strength to excitation-relaxation kinetics, these values were additionally normalized against the measures of strength. The absolute rates of moment development and reduction were therefore normalized by the corresponding extensor and flexor peak joint moments at 60 rpm, respectively. 73
74 Statistical Analysis To test the hypothesis that world-class track sprint cyclists have increased strength an ANOVA was performed to compare the measures of strength (absolute peak joint moments at 60 rpm) between groups. To test the hypothesis that world-class track sprint cyclists produce maximal cycling with a different relative joint power distribution, a MANOVA was performed to compare relative joint powers between groups. To test the hypotheses that world-class track sprint cyclist have increased excitation-relaxation kinetics, four MANOVAs were performed to compare the measures of absolute peak rate of moment development, relative peak rate of moment development, absolute peak rate of moment reduction and relative peak rate of moment reduction between groups. Group was the between subject factor (fixed) for all of the analyses of variance, and additionally for the MANOVAs pedalling rate was set as a within subject factor (repeated measures). For the ANOVA, if the group main effect was significant post hoc independent t-tests (Bonferroni) were performed on each dependent variable. For the MANOVAs, if both the group main effect and the group by pedalling rate interaction were significant, post hoc independent t- tests (Bonferroni) were performed on each dependent variable. If the group main effect of a MANOVA was significant but the group by pedalling rate interaction was non-significant, the dependent variables were collapsed over all pedalling rates and a follow up MANOVA with post-hoc independent t-test (Bonferroni) was performed. In addition, effect sizes were calculated to describe pairwise differences. Effect sizes were interpreted on the basis of Cohen s (Cohen 1988) classification scheme: effect sizes <0.5 were considered to be small, effect sizes between 0.5 and 0.8 were considered to be moderate, and effect sizes >0.8 were considered to be large. All statistical tests were performed in IBM SPSS Statistics 19. Results With respect to the measures of strength, the repeated-measures ANOVA revealed that peak joint moments at 60 rpm were different between the world-class track sprint cyclists and the sub-elite cyclists (Wilks Lambda = 0.269, F(6,12) = 5.433, P=0.006). Posthoc pairwise comparisons revealed that the world-class track sprint cyclists produced higher peak moments in ankle flexion, ankle extension, knee extension and knee flexion (Table 11). The corresponding effect sizes were all large (effect size > 0.8). 74
75 Peak Joint Moment (Nm) Sub-Elite World-Class P-Value Effect Size Knee Extension 200 ± ± * 2.02 Knee Flexion -96 ± ± * 1.53 Ankle Flexion -16 ± 4-23 ± * 1.40 Ankle Extension 149 ± ± * 0.95 Hip Flexion -86 ± ± Hip Extension 185 ± ± Table 11. Comparison of peak joint moments produced at 60 rpm between world-class track cyclists and sub-elite cyclists. Joint moments are ranked by the magnitude of effect size (largest at the top). Significant differences are indicated by means of asterisk (*). With respect to the measure of intermuscular coordination, the first repeatedmeasures MANOVA revealed that relative joint powers were not different between the world-class track sprint cyclists and the sub-elite cyclists (Wilks Lambda = 0.495, F (8, 9) = 1.148, P=0.417), and further that there was not a group by pedalling rate interaction (Wilks Lambda = 0.576, F (32, 212) = 1.066, P=0.379). Figure 5 illustrates the similarity of relative joint powers between the two groups across all pedalling rates. 75

=7.473, P=0.003) and reduction (Wilks Lambda = 0.306, F(3,14)=10.606, P=0.")
76 Figure 5. Comparison of relative joint powers produced by world-class track sprint cyclists (blue) and sub-elite cyclists (red). Relative joint powers were calculated by normalising individual joint powers against overall cycling power, and averaging over joint extension and flexion phases. There was no difference in relative joint powers between groups. With respect to excitation-relaxation kinetics, the MANOVAs revealed that peak rate of absolute moment development (Wilks Lambda = 0.384, F(3,14)=7.473, P=0.003) and reduction (Wilks Lambda = 0.306, F(3,14)=10.606, P=0.001) were both different between the two groups, and further that there was a group by pedalling rate interaction for both (Rate of moment development: Wilks Lambda = 0.596, F(12,164)=2.962, P=0.001, Rate of moment reduction: Wilks Lambda = 0.707, F(12,164)=1.914, P=0.036). Post-hoc pairwise comparisons revealed that world-class track sprint cyclists produced higher peak rates of absolute ankle moment development at 60 rpm, 90 rpm and 120rpm, and higher peak rates of absolute knee moment development at all pedalling rates. Furthermore, worldclass track sprint cyclists produced a higher rate of absolute ankle moment reduction at 60 rpm and higher rates of absolute knee moment reduction at 120 rpm, 150 rpm and 180 rpm (Table 12). The magnitudes of all of these effects were large (effect size > 0.8). 76
77 Absolute Values (Nm/s) Peak Rate of Moment Development Sub-Elite World-Class P-Value Normalized to Strength (1/s) Effect Size Sub-Elite World-Class P-Value Ankle ± ± * ± ± 0.8 n/a ± ± * ± ± 1.1 n/a ± ± * ± ± 1.1 n/a ± ± ± ± 1.4 n/a ± ± ± ± 2.6 n/a Knee ± ± * ± ± 0.7 n/a ± ± * ± ± 2.9 n/a ± ± * ± ± 0.8 n/a ± ± * ± ± 2.0 n/a ± ± * ± ± 1.0 n/a Hip ± ± ± ± 0.8 n/a ± ± ± ± 3.7 n/a ± ± ± ± 3.6 n/a ± ± ± ± 3.5 n/a ± ± ± ± 2.4 n/a Peak Rate of Moment Reduction Sub-Elite World-Class P-Value Effect Size Sub-Elite World-Class P-Value Ankle ± ± * ± ± ± ± ± ± ± ± ± ± ± ± ± ± ± ± ± ± Knee ± ± ± ± ± ± ± ± ± ± * ± ± * ± ± * ± ± ± ± * ± ± Hip ± ± * ± ± ± ± ± ± ± ± ± ± ± ± ± ± ± ± ± ± Effect Size Effect Size Table 12. Comparison of measures of rate of moment development and rate of moment reduction between worldclass track sprint cyclists and sub-elite cyclists across pedalling rates. Values are reported in absolute terms as well as normalised to the values of strength (peak moments at 60 rpm). Significant differences are indicated by means of asterisk (*). When the rates of moment development and reduction were normalised to the indices of strength (peak joint moments at 60 rpm), the peak rate of moment development (Wilks Lambda = 0.953, F (3, 14) = 0.232, P=0.873) was not different between the worldclass track sprint cyclists and sub-elite cyclists. The peak rate of moment reduction however was different (Wilks Lambda = 0.590, F (3, 15) = 3.471, P=0.043) between the two groups, and there also was a group by pedalling rate interaction (Wilks Lambda = 0.090, F (12, 6) = 5.063, P=0.029). Post hoc pairwise comparisons revealed that world-class track sprint cyclists have a higher rate of relative ankle moment development at 60 rpm and a higher relative knee moment reduction at 120 rpm than sub-elite cyclists (Table 12). The magnitude of this effect was large (effect size = 1.47). 77
78 Discussion The overall goal of this investigation was to gain an insight into the optimised intermuscular coordination strategies and mechanical muscle properties that facilitate enhanced maximal cycling power. This was done by comparing intermuscular coordination and joint-specific measures of strength, rate of moment development and rate of moment reduction between world-class track sprint cyclists and sub-elite cyclists. It was found that world-class track sprint cyclists have greater strength in knee extension, knee flexion, ankle extension and ankle flexion compared to sub-elite cyclists. At low and moderate pedalling rates, world-class track sprint cyclists produced higher absolute rates of ankle moment development, and at all pedalling rates they produced higher absolute rates of knee moment development. With respect to rate of moment reduction, in absolute terms the largest effects were observed at the knee at moderate and high pedalling rates and there was also a significant difference in the rate of ankle moment reduction at the lowest pedalling rate. Once normalised against values of strength, the rates of moment development and reduction were generally not different between groups. The only difference in this measure was the rate of knee moment reduction at 120 rpm. Intermuscular coordination did not differ between groups at any pedalling rate. Taken together, these findings indicate that the exceptionally high maximal cycling power outputs generated by world-class track sprint cyclists are facilitated at low and moderate pedalling rates by enhanced ankle and knee strength, and at high pedalling rates by enhanced knee strength. The finding that world-class track sprint cyclists produce higher absolute rates of moment development and reduction support the logical notion that enhanced excitationrelaxation kinetics is desirable for high maximal power output. Although intuitively this ability may only seem important at high pedalling rates, these results demonstrate that it is in fact an important determinant of high overall cycling power output even at very low pedalling rates of 60 rpm (i.e. one revolution per second). More pertinently, these results provide an insight as to which mechanisms underpin this ability. Once normalised to strength, the rates of moment development and reduction were only different between groups in one joint action at one pedalling rate (rate of knee moment reduction at 120 rpm), suggesting that the higher absolute values in the world-class track sprint cyclists are facilitated by strength related factors rather than strength independent factors. Strength related factors include fibre type (Caiozzo 2002; Häkkinen et al. 1985), muscle mass (Garfinkel & Cafarelli 1992; Narici et al. 1989), skeletal muscle architecture (muscle length, fibre length, pennation angle) (Lieber & Friden 2000) and neural drive (Aagaard et al. 2002; Narici et al. 1989). These are the factors therefore that are likely to explain the enhanced 78
79 excitation-relaxation kinetics of the world-class track sprint cyclists rather than strengthindependent factors such as calcium kinetics (Caiozzo 2002; Martin 2007; Neptune & Kautz 2001) and reduced agonist-antagonist co-activation (Carolan & Cafarelli 1992). The results are in agreement with previous studies (Martin & Brown 2009; Elmer et al. 2011; Barratt et al. 2011) demonstrating that power during maximal cycling is produced mostly through the actions of hip extension, knee extension, knee flexion, ankle extension and through hip transfer power. The data show that the knee joint contributes 46-61% of the total power output and thus it is logical that improvements in joint moments during knee extension and knee flexion, as seen in the world-class track sprint cyclists, should have a substantial impact upon overall power output. By comparison, the importance of ankle extension and flexion may be less expected as the ankle joint provides a relatively modest contribution to the overall power output (11 16%). This finding could be explained by the secondary role required of the muscle groups surrounding the ankle joint during the pedalling action; to transfer energy from the limb to the crank. The ankle plantarflexors, in addition to producing their own muscle power, act to stiffen the ankle joint during leg extension in order to deliver hip extensor and knee extensor power to the crank (Raasch et al. 1997). Within the context of these results, world-class track sprint cyclists would thus require concomitantly enhanced ankle extension moment at low and moderate pedalling rates, when the extension force produced by the leg is at its highest, in order to deliver their enhanced leg power to the crank. Without an increased ankle extension moment, the increased knee extension moment developed by the world-class track sprint cyclists would simply act to accelerate the limbs (flexing the ankle, and hyperextending the knee) rather than the crank (Raasch et al. 1997). In support of the finding that ankle extension and knee extension are important actions in maximal cycling, Dorel and colleagues (2012) used an electromyography approach in a similar cohort of world-class track sprint cyclists to demonstrate that the ankle extensors and knee extensors are both maximally recruited during maximal cycling at moderate pedalling rates. Interestingly they (Dorel et al. 2012) additionally reported that the hip extensors were not maximally recruited during the same maximal cycling task. The results of this study show, similarly, that neither hip extension strength nor hip rate of moment development or reduction were significantly larger in the world-class track sprint cycling group compared to the sub-elite cyclists. This is very surprising as the hip provides the largest individual joint action contribution to overall leg power (Elmer et al. 2011), and so one would assume that an enhanced power output and maximal activation in this muscle group was important for high overall power output. The reason why this is not the case is unclear. One potential explanation is that the power output of the hip extensors, and thus the 79
80 overall power output of the leg, could be limited by the strength of the ankle joint at low and moderate pedalling rates. That is, if the ankle extension moment were insufficient, then one might expect the central nervous system to regulate hip extensor activation and thus hip extension power output in order to prevent acceleration of the limbs (ankle flexion, knee hyperextension) rather than the crank. It may therefore be the case that, even in a population of world-class track sprint cyclists, a greater ankle joint extension moment is required to allow maximal hip extensor activation and thus maximum hip extension power to be developed at low and moderate pedalling rates. Future research should focus on the relationship between ankle extension moment and hip extensor activation and hip extension power to address this issue. A high level of intermuscular coordination is required to perform the cycling task (Wakeling & Horn 2009). It has previously been unclear, however, whether a more optimal intermuscular coordination strategy is used by world-class cyclists to enhance power output. These data show that the relative distribution of joint powers, a marker of intermuscular coordination (Korff et al. 2009; Korff & Jensen 2007), did not differ between the worldclass track sprint cyclists and the sub-elite cyclists. An altered intermuscular coordination strategy would also likely be reflected in the values of strength-normalised rate of moment development and reduction, via reduced co-contraction of agonist and antagonist muscle groups (Almasbakk & Hoff 1996). The finding therefore that strength-normalised rates of moment development and reduction, was only different between groups at one joint action at one pedalling rate (rate of knee moment reduction at 120 rpm), together with the finding that relative joint powers were not different, strongly implies that a more optimal intermuscular coordination strategy does not explain high performance in maximal cycling. The finding that the strength-normalised rate of knee moment reduction was different at 120 rpm is puzzling. If this result does indeed represent a reduction in co-contraction, it is perhaps not surprising that it should occur at the knee joint, as this is the only joint with substantial power produced by both agonist and antagonist muscle groups (Martin & Brown 2009), and so appropriate timing of muscle contractions in this joint action would likely have the largest effect on power output. Future research with electromyography alongside joint moment data could assist in determining the extent to which reduced co-contraction of the knee extensors and knee flexors may explain this finding. These findings allow us to speculate on the limits of performance in maximal human movements. These results show that world-class track sprint cycling performance is governed by the ability to generate higher joint moments at the ankle and knee, and suggest that these joint moments are facilitated by enhanced muscular strength about these joints. Higher moments in task-specific joint actions have also been reported to explain high 80
81 performance in speed skating (de Koning et al. 1991) and sprint running (Bezodis et al. 2014). Although these investigations did not determine the contributing factors, it seems probable that enhanced muscular strength might also be the mechanism by which these high performing sprint athletes produced enhanced joint moments. Taken together, these findings allow us to speculate that the limits of performance in maximal human movements lie in extraordinary muscular strength in task-specific joint actions. Enhanced muscular strength can be facilitated by more optimal muscle size, muscle architecture, muscle moment arms or tendon properties (Caiozzo 2002; Lieber & Friden 2000). Future research could thus seek to achieve a more detailed understanding of the contributing factors to enhanced joint-specific muscular strength in world-class sprint athletes, which would further provide insight as to what extent the limits of performance in maximal human movements are set by training adaptation compared to genetic predisposition. These findings have clear implications for the training programmes of developing cyclists. Specifically, they demonstrate that enhancing knee extensor and knee flexor strength should be a primary focus for seated maximal power development, and that at low and moderate pedalling rates, improvements in ankle strength are also likely to facilitate increased power outputs. Muscular strength is a trainable quality (Crewther et al. 2005; Folland & Williams 2007), and therefore sub-elite sprint cyclists seeking to improve performance should place significant emphasis on developing muscular strength at the ankle and knee joints. When translating these findings to track sprint cycling performance it should however be considered that real-life cycling requires maximal power to be produced on a moving bicycle and so the limiting factors may differ from those of stationary ergometer cycling, as defined in this study. The extent to which the biomechanics of maximal sprint cycling differs between static ergometer cycling and real-life cycling is not known and should be the focus of future studies to assess the ecological validity of these findings. In summary, it was found that the enhanced overall maximal cycling power outputs developed by world-class track sprint cyclists are facilitated mostly by increased strength at the ankle and knee joint. A more optimal intermuscular coordination strategy was not found to be a contributing factor to world-class performance. These findings suggest that the limits of performance in maximal human movements may lie in extraordinary muscular strength in task-specific joint actions. They have clear implications on the training programmes of developing cyclists. 81
82 CHAPTER 6 82
83 THE EFFECT OF A RIGID ANKLE ON JOINT BIOMECHANICS AND PERFORMANCE IN MAXIMAL CYCLING Introduction Maximal cycling power is predominantly produced by hip extensor, knee extensor, knee flexor and plantarflexor power (McDaniel et al. 2014; Barratt et al. 2011; Elmer et al. 2011; Martin & Brown 2009). Each of these muscle actions has different roles. The knee extensors and knee flexors deliver energy directly to the crank. The hip extensors deliver energy to the limbs (Fregly & Zajac 1996; Raasch et al. 1997; Raasch & Zajac 2009). Hip extensor power is absorbed by the plantarflexors and transferred to the crank (Fregly & Zajac 1996; Raasch et al. 1997; Raasch & Zajac 2009). This hip extensor/plantarflexor synergy is a powerful mechanism to transfer energy to the crank indirectly. For this mechanism to work effectively, the ankle needs to contract quasi-isometrically, which requires strong plantarflexor muscles. In support of the notion of the importance of the ankle joint during maximal cycling, it was demonstrated in Chapter 5 that at low and moderate pedalling rates the increased maximal cycling power outputs generated by world-class track sprint cyclists are facilitated by enhanced strength in ankle extension and ankle flexion (Barratt 2014). Dorel and colleagues (2012) demonstrated in a similar cohort of world-class track sprint cyclists that the ankle extensors are maximally recruited during short-term maximal cycling at moderate pedalling rates. Interestingly, these authors (Dorel et al. 2012) additionally reported that the hip extensors were not maximally recruited during the same maximal cycling task. In agreement with these findings, it was demonstrated in Chapter 5 that hip extension strength was not significantly larger in world-class track sprint cyclists compared to trained sub-elite cyclists. Taken together, these findings suggest that the amount of usable hip extension power may be limited at low and moderate pedalling rates by the plantarflexor s ability to stiffen the ankle joint sufficiently, in order for mechanical energy generated at the hip to be transferred to the crank. If this is the case, a stronger ankle joint may allow the hip extensors to operate more closely to its maximal capacity, which would in turn result in higher overall maximum power. Confirmation of such a mechanism would give a significant insight into the factors underlying power production during maximal multi-joint movements. This 83
84 understanding would also reveal the potential benefits of training interventions targeting ankle joint strength for sprint cycling performance. The force producing capability of the hip extensors is greater at low pedalling rates, due to the force-velocity relationship of muscle (Hill 1938) and the increased excitation time within a cycle (Caiozzo & Baldwin 1997). This implies, therefore, that the ankle joint moment required to resist dorsiflexion, in order for the hip extensor/plantarflexor synergy to deliver energy to the crank, will also be greater at low pedalling rates. Conversely, as pedalling rates increase, the force producing capacity of the hip extensors reduces, and thus the ankle joint moment required to resist dorsiflexion will also reduce. If hip extensor power is indeed limited by ankle strength we would therefore expect the hip extensors to be working furthest from their maximal capacity at low pedalling rates. This notion would explain the findings from Chapter 5 in which it was demonstrated that ankle joint strength facilitates enhanced maximal cycling power outputs at low and moderate pedalling rates (Barratt 2014), but at high pedalling rates it was not a differentiating factor. Furthermore, it would imply that the benefit of a stronger ankle on increased hip extension power would be greater at lower compared to higher pedalling rates. The overall goal of this study was to investigate the interaction between ankle strength and hip extension power, and furthermore to provide support for the notion that ankle strength limits hip extension power in maximal cycling. For this purpose joint biomechanics were observed during maximal cycling when the ankle joint was fixed in place by a rigid brace. It was hypothesised that a rigid ankle joint would result in increased hip extension power during maximal cycling. It was also hypothesised that a rigid ankle joint would result in a greater increase in hip extension power at a low pedalling rate compared to a high pedalling rate during maximal cycling. Methods Participants and Protocol Eight cyclists (31 ± 5 years old, 79.2 ± 6.1 kg), all of whom had undertaken cycling training or racing at least three times per week for the last three years, volunteered to take part in the study. The experimental procedures were approved by the Research Ethics Committee of Brunel University. The participants received verbal and written explanations of all of the procedures, and gave their written informed consent. 84
85 The participants undertook a protocol consisting of two maximal cycling bouts with braces that held the ankle joint in a fixed-position. For the control condition, the participants performed the same protocol with weights of equivalent mass to the braces (1.16 kg per leg) attached to each leg. Ankle weights were used for the control condition, rather than normal cycling, to ensure that any observed differences when using the ankle braces were due to the fixed position of the ankle joint and not the additional mass of the ankle braces. The weights were positioned at the same location as the centre of mass of the braces (approximately 4 cm above the lateral malleolus). The participants visited the laboratory for two separate familiarisation sessions and two separate data collection sessions. The purpose of the two familiarisation sessions was to ensure that the participants were fully practised at cycling using both the ankle braces and the ankle weights prior to data collection. The familiarisation sessions consisted of a 20 min period of cycling with the ankle braces, and a 20 min period of cycling with the ankle weights. Each 20 min period included 15 minutes of submaximal cycling at W, followed by a short (4s) sprint at 90 rpm and a short (4s) sprint at 120 rpm. The participants undertook two separate data collection sessions in which they performed maximal cycling using both the ankle braces and the ankle weights. The purpose of having two data collection sessions was to remove the order effect when comparing the two conditions. Thus, the participants undertook the same testing protocol in both data collection sessions, only with the presentation order of the two experimental conditions alternated between the two sessions. For each data collection session, ankle braces or ankle weights were fitted to the participant (depending upon which condition was first) and they undertook a 15 min warm up of submaximal cycling at a self-selected workload of W. Following the warm up the participants performed a testing protocol consisting of a short (4s) maximal cycling bout at 90 rpm and a short (4s) maximal cycling bout at 120 rpm. 5 min recovery was given between each cycling bout. Following the 120 rpm sprint, the warm up and testing protocol was repeated in the second experimental condition. The cycling bouts were initiated by a verbal command from the investigator and the participants were vigorously encouraged to give maximal effort throughout. Equipment All testing was performed on the same modified SRM cycling ergometer (SRM Ergometer, Schoberer Rad Messtechnik, Jülich, Germany). An alternative crank force measurement system to the SRM powermeter was used, and so to provide the necessary 85
86 pedalling rate signal to the SRM data logger, the SRM powermeter and sensor cable were relocated to a position on the ergometer frame such that a magnet attached to the crank arm would trip the powermeter reed-switch. For the maximal cycling bouts the ergometer was operated in isokinetic mode. In this mode the SRM ergometer software regulates the output of an eddy-current brake to ensure that pedalling rate is not higher than a pre-set value. A 2.2-kW DC motor was additionally coupled to the flywheel shaft in order to rotate the ergometer flywheel at the target angular velocity prior to each cycling bout. Using the motor enabled the participants to commence their maximal cycling bouts at the target pedalling rate, rather than expending energy in accelerating the flywheel up to speed. Measurements of saddle height (distance from the top of saddle to the pedal spindle when the distance between these two points is at its maximum), saddle setback (horizontal distance from the front of the saddle and the centre of the bottom bracket), handlebar drop (vertical distance from the top of the saddle to the top of the handlebars) and handlebar reach (distance from the front of the saddle to the handlebar centre of the handlebar grips) were recorded on each participant s bicycle. For the ankle weight condition these measurements were transferred directly to the ergometer. During the first familiarisation session, knee angle at maximum leg extension was recorded when pedalling with the ankle weights, using a high speed camera (EX-F1, Casio, US), reflective markers placed at the joint centres of the ankle, knee and hip, and digitisation software (Quintic Biomechanics v21, Coventry, UK). The saddle height of the ergometer was then adjusted in the ankle brace condition, such that the maximum knee angle was consistent between the ankle brace and ankle weight conditions. The purpose of this was to ensure that the kinematics of the hip and the knee joints were consistent between the two experimental conditions. Once the saddle height had been set using this method, the measurements of saddle setback, handlebar drop and handlebar reach were then transferred directly from the participant s bicycle to the ergometer. The crank length was set at 170 mm throughout, pedals were matched to the participant s bicycle, and each participant used their own shoes and pedal cleats. The ankle braces were designed and manufactured specifically for the study. The braces were constructed from a welded metal frame of box section mild steel. A shin guard from a commercial ankle support device (Rebound Air Walker, Ossur, UK) was attached to the frame and fitted to the shank of the participant via two large Velcro straps. High strength leather straps fitted the frame to the carbon footplate of the participant s cycling shoe. The braces fixed the foot at 90 +/- 10 degrees to the shank and allowed for only a minor (5 degrees) amount of excursion of the ankle joint during maximal cycling, due to slight movement within the shin pad and straps. Each brace was tested to ensure that it could withstand pedal forces of up to 2000 N, which was deemed to be a suitable margin of safety, 86
87 given that the highest pedal forces recorded in equivalent pedalling conditions were 1500 N (produced by world-class track sprint cyclists data taken from Chapter 5). The participants reported that the braces felt tight and restrictive, but they did not report any feelings of discomfort. Instrumentation Instrumented force cranks (Vector Cranks, BF1 Systems, Diss, UK), operating at 200 Hz, acquired normal and tangential forces acting on the right and left crank arms, and crank angle. Sagittal plane kinematic data of the right leg were acquired at 300 Hz by means of a high speed camera (EX-F1, Casio, US) and an automatic digitisation procedure (Quintic Biomechanics v21, Coventry, UK). For this purpose, the photographic plane of the right leg was calibrated with a square of known vertical and horizontal distance. Reflective markers were positioned at the centre of the pedal spindle, lateral malleolus, lateral femoral condyle, greater trochanter and the iliac crest of the right leg. The same investigator placed the reflective markers for each trial. Two-dimensional position data for each marker were acquired via an automatic digitisation procedure (Quintic Biomechanics v21, Coventry, UK). Kinetics data (normal crank force, tangential crank force, crank angle) and kinematics data were synchronised using a light switch that illuminated with the right crank in the vertical position (top dead centre). Kinetic data were up-sampled via linear interpolation from 200 Hz to 300 Hz to match the sampling frequency of the kinematic data, and all data were smoothed using a fourth order (zero-lag) low-pass butterworth filter. The filter cut-off frequency was set at 8 Hz. The surface EMG of four muscles of the right leg was recorded continuously throughout the experimental trials: Gluteus maximus (GMax), longhead of biceps femoris (BF), vastus medialis (VM) and gastrocnemius medialis (GM). For each muscle, a pair of surface electrodes was attached to the skin and located according to the recommendations of Delagi and colleagues (2011). Raw EMG signals were amplified, simultaneously digitized at a sampling rate of 1 khz (Trigno, Delsys, UK), high-pass filtered (20 Hz, Butterworth filter), and root mean squared (RMS) with a 25-ms moving rectangular window (Dorel et al. 2012). 87
88 Data Analysis Joint powers were determined by means of an inverse dynamics procedure. For this purpose, the right leg was assumed to be a link-segment model. The foot, shank and thigh of the right leg were modelled as the rigid segments, and the pedal spindle, ankle, knee and hip were modelled as frictionless hinge joints. Ankle and knee joint centres were estimated from the location of the lateral malleolus and femoral condyle, respectively. The hip joint centre (greater trochanter) was estimated from the position of the iliac crest, by using a constant vector between these two points. This vector was determined in a prior static trial in which the crank was positioned in a forward and horizontal position (90 degrees from top dead centre) (Neptune & Hull 1995). For the inverse dynamics calculation, it was necessary to account for the additional mass and altered moment of inertia caused by the ankle brace and ankle weights. For this purpose, the centre of mass of the ankle brace was measured by balancing the brace on a rigid edge. This point corresponded to a position approximately 4 cm above the lateral malleolus when the brace was in use. To ensure consistency between ankle brace conditions with respect to segmental dynamics, the centre of mass of the ankle weights was also positioned at 4 cm above the lateral malleolus. In the inverse dynamics calculation therefore, 1.16 kg (the mass of the ankle brace or ankle weight) was added to the predicted shank mass estimated via the tables of de Leva (1996). The moment of inertia of the ankle brace or ankle weights were calculated with respect to the shank segment, by assuming the additional mass acted as a point at the centre of mass of the ankle brace or ankle weight. This value was then added to the estimated moment of inertia of a normal shank segment (de Leva 1996), to determine the new moment of inertia of the leg with the ankle brace or ankle weight. All other segmental centres of mass and moments of inertia were estimated directly from the tables of de Leva (1996). Segment centres of mass and joint centre displacement data were differentiated (finite) to determine velocities and accelerations. The normal and tangential crank force data were decomposed into their absolute vertical and horizontal components acting at the pedal spindle, and the vertical and horizontal joint reaction forces and net joint moments were computed by standard link segment mechanics (Elftman 1939). Joint powers were calculated as the product of joint moment and joint angular velocity, and hip transfer power was calculated as the dot product of hip reaction force and linear hip velocity. With respect to EMG, the peak amplitude within each bout was selected for analysis. 88
89 Statistical Analysis With respect to statistical testing, to determine if hip extension power was greater when cycling with a fixed ankle brace, one ANOVA was performed with brace condition and pedalling rate as within subject factors (repeated measures). If the brace condition by pedalling rate interaction was significant then a post-hoc paired t-test was performed at each pedalling rate. If the brace condition by pedalling rate interaction was non-significant, then hip extension powers were collapsed over both pedalling rates and a follow up ANOVA with post-hoc paired t-test was performed. Descriptive statistics (mean, standard deviation, effect size) were used to describe differences in the joint power data and the EMG data. Effect sizes were interpreted on the basis of Cohen s (1988) classification scheme: effect sizes <0.5 were considered to be small, effect sizes between 0.5 and 0.8 were considered to be moderate, and effect sizes >0.8 were considered to be large. Results With respect to hip extension power, the repeated measures ANOVA revealed a significant interaction between pedalling rate and brace condition (F = 4.736, P = 0.034). Post-hoc paired t-tests were thus performed to determine the effect of the ankle brace on hip extension power at each pedalling rate. At 90 rpm, there was a trend of increased hip extension power when using the ankle brace compared to the ankle weights, although this difference did not quite achieve statistical significance (P=0.056). The magnitude of this effect was moderate (effect size = 0.73). Figure 6 illustrates that the ankle brace and ankle weights hip power curves tend to diverge at the point of peak power production during the pedal cycle (approximately 135 degrees). The EMG data demonstrated that peak hip extensor (GMax) activations were similar between brace conditions (effect size = 0.06). 89
90 Figure 6. Comparison of joint powers between the ankle brace (red) and ankle weight (blue) conditions during maximal cycling at 90 rpm. The ankle brace and ankle weights hip power curves tend to diverge at the point of peak power production. 90
91 At 120 rpm, hip extension power was reduced when using the ankle braces compared to the ankle weights (P = 0.040). The magnitude of this effect was moderate (effect size = 0.58). Figure 7 illustrates that the ankle brace and ankle weights hip power curves diverge during the early phase of the pedal cycle (0 to 90 degrees). The EMG data demonstrated that peak hip extensor (GMax) activations were similar between brace conditions (effect size = 0.11). 91
 and ankle weight (blue) conditions during maximal cycling at 120 rpm.")
92 Figure 7. Comparison of joint powers between the ankle brace (red) and ankle weight (blue) conditions during maximal cycling at 120 rpm. The ankle brace and ankle weights hip power curves tend to diverge during the early phase of the pedal cycle (0-90 degrees). 92
93 The analysis of effect sizes indicates that, in both pedalling rate conditions, the use of the ankle brace caused a large reduction (90 rpm; effect size = 0.86, 120 rpm; effect size = 1.14) in peak activation of the ankle extensor muscle group (GM). In addition, the use of the ankle brace caused a large reduction in ankle extension power (90 rpm; effect size = 3.65, 120 rpm; effect size = 4.18) and ankle flexion power (90 rpm; effect size = 3.39, 120 rpm; effect size = 2.56). Means, standard deviations and effect sizes for all joint action power and peak muscle activation comparisons in the 90 rpm pedalling rate condition are given in Table 13. Equivalent measures for the 120 rpm condition are given in Table 14. Braces Weights Mean ± SD Mean ± SD Effect Size Crank Power (W) 490 ± ± Joint Action Powers (W) Ankle Extension 52 ± ± Ankle Flexion -8 ± 4-32 ± Knee Extension 85 ± ± Knee Flexion 309 ± ± Hip Extension 567 ± ± Hip Flexion -106 ± ± Peak EMG (V 10-4 ) Ankle Extensors (GM) 1.47 ± ± Knee Extensors (VM) 1.72 ± ± Knee Flexors (BF) 3.40 ± ± Hip Extensors (GMax) 0.85 ± ± Table 13. Descriptive statistics comparing pedal power, joint action powers and peak EMG between the ankle brace and ankle weights conditions during maximal cycling at 90 rpm. 93
94 Braces Weights Mean ± SD Mean ± SD Effect Size Crank Power (W) 544 ± ± Joint Action Powers (W) Ankle Extension 61 ± ± Ankle Flexion -9 ± 5-35 ± Knee Extension 172 ± ± Knee Flexion 424 ± ± Hip Extension 578 ± ± Hip Flexion -201 ± ± Peak EMG (V 10-4 ) Ankle Extensors (GM) 1.64 ± ± Knee Extensors (VM) 1.68 ± ± Knee Flexors (BF) 3.78 ± ± Hip Extensors (GMax) 0.75 ± ± Table 14. Descriptive statistics comparing pedal power, joint action powers and peak EMG between the ankle brace and ankle weights conditions during maximal cycling at 120 rpm. Discussion In cycling, co-contraction of the ankle extensors and hip extensors is required in order for the mechanical energy generated at the hip to be transferred to the crank (Raasch et al. 1997; Zajac et al. 2002). Previous findings (Barratt 2014, Dorel et al. 2012) suggest that, under maximal cycling conditions, the amount of usable hip extension power may be limited at low and moderate pedalling rates by the plantarflexor s ability to stiffen the ankle joint sufficiently. If this is the case, a stronger ankle joint may allow the hip extensors to operate closer to their maximal capacity, which would in turn result in higher power output and improved sprint cycling performance. If such a mechanism does exist we would further expect the hip extensors to be working furthest from their maximal capacity at low pedalling rates. This is because as pedalling rates increase, the force producing capacity of the hip extensors reduces, and thus the ankle joint moment required to resist dorsiflexion will also reduce. Therefore, the effect of a stronger ankle on hip extension power would be greater at low compared to high pedalling rates. A rigid ankle brace was used during maximal cycling at two different pedalling rates to simulate experimentally the effects of a stronger ankle joint on hip extension power. It 94
95 was hypothesised that a rigid ankle joint would result in increased hip extension power during maximal cycling, and also that a rigid ankle joint would result in a greater increase in hip extension power at a low pedalling rate compared to a high pedalling rate during maximal cycling. The results demonstrated an interaction between the ankle brace condition and pedalling rate. At the lower pedalling rate (90rpm), using the ankle brace tended to increase hip extension power (P = 0.056). At the higher pedalling rate (120 rpm), using the ankle brace decreased hip extension power. Taken together, these findings are thereby in agreement with the notion that ankle strength limits hip extension power, although they do not provide incontrovertible evidence to support this. It was hypothesised that using the ankle brace would result in a greater increase in hip extension power at a low pedalling rate compared to a high pedalling rate, but it was unexpected that it would result in a reduced hip extension power at the higher pedalling rate. It is not possible to use these results to determine the exact mechanism that explains this reduction in hip extension power, although it is clear that other aspects of intermuscular coordination would have been altered by using the ankle brace. For example, although only changes in hip extension power were tested for statistical significance, it is apparent from the descriptive statistics that the use of the fixed ankle joint also had other unexpected consequences (Table 13 and Table 14.). Most notable are the moderate increases in knee extension power, and moderate reductions in hip flexion power at the higher pedalling rate (Table 14.). It seems possible, therefore, that although the ankle brace could have offered the possibility of a greater hip extension power via the hip/ankle extensor synergy, it may also have negatively affected other power-producing mechanisms typically at play under normal cycling conditions. The effects of a fixed ankle joint on the optimal intermuscular coordination have previously been simulated in submaximal functional electrical simulation cycling using a musculoskeletal simulation (van Soest et al. 2005). Such an approach may be useful to identify the additional consequences of a fixed ankle on optimal intermuscular coordination during maximal cycling, and thus may explain some of the additional changes in intermuscular coordination that were observed in this study. Although the joint power data imply that using the ankle brace enhanced hip extensor power output at 90 rpm, this conclusion is not supported by the EMG data. Rather, the EMG data show that peak hip extensor (GMax) activation was similar between ankle brace conditions (effect size = 0.06). There are a number of possible explanations for this discrepancy. Firstly, it could be that the signal-to-noise ratio of the EMG data was lower compared to the joint power data, such that real differences were illustrated in the joint power data but not in the EMG data. Although it seems likely that surface EMG data do have a lower signal-to-noise ratio than sagittal plane joint kinetics data (Kadaba et al. 1989), 95
96 the fact that the ankle extensors (GM) showed large differences between brace conditions suggests that if peak activation was indeed higher, then the statistical power was appropriate for this still to be demonstrated in the EMG data. A second explanation for the discrepancy is that it is due to differences in temporal characteristics between the two data sets. Differences in hip power between the conditions of the two braces were most apparent at the point of peak hip power production, occurring at a crank angle approximately 135 degrees from vertical (Figures 6., 7.). Peak GMax activation during maximal cycling, by comparison, occurs much earlier at a crank angle of approximately 20 degrees from vertical (Dorel et al. 2012). Thus, if the enhanced ankle strength facilitated increased hip extensor power at a later phase of the pedal cycle, as seems likely from the hip power curves (Figure 7.), this would not have been reflected in the EMG data. Finally, this discrepancy may be due to the fact that different compartments of a muscle are activated based upon the specific task demands (Wakeling 2009). Therefore, although unlikely, it may be that the area of the GMax that was consistently used in this study to acquire an EMG signal was not relevant to the maximal cycling task. Taken together, it appears that differences in temporal characteristics are most likely to explain the discrepancy between these two datasets. Future research should use alternative methods of describing the intensity of muscle activation, such as EMG averaged over a joint flexion or extension phase, to avoid this issue. The EMG data do demonstrate that the intermuscular coordination strategy used to produce maximal cycling power was adapted when using the ankle brace. Specifically, ankle extensor (GM) activity was reduced to a large extent when using the ankle brace. This observation is easily explained, as the altered task constraints meant that ankle extensor (GM) activation was no longer required to be maximal, given that the ankle brace provided additional load-bearing about the ankle joint. This finding is significant as it demonstrates the remarkable plasticity of the central nervous system. Despite the fact that these participants were trained cyclists who had repeatedly performed the cycling task for many years, they were able to adapt to new task constraints over the time-course of only two practice sessions, each comprising just two maximal cycling sprints using the ankle braces. These findings support the notion that the central nervous system is able to quickly optimise the intermuscular coordination strategy for a given task (Pousson et al. 1999; Almasbakk & Hoff 1996). They additionally provide evidence that changes in intermuscular coordination can explain the rapid rise in task performance during the early phase of learning a new maximal movement skill (e.g. strength training exercises (Gabriel et al. 2006)) The findings in Chapter 5 (Barratt 2014), and the findings of others (Bezodis et al. 2014; de Koning et al. 1991), have indicated that high performance in maximal functional movements is facilitated by enhanced muscular strength during task-specific joint actions. 96
97 One might assume that enhanced muscular strength would only be important in the major power-producing joint actions of a given movement, for example in the dominant actions of knee extension and hip extension during maximal cycling (Martin & Brown 2009; McDaniel et al. 2014). The finding that ankle extensor strength is likely to facilitate maximal cycling power output indicates, however, that enhanced strength is in fact also required for other purposes. Specifically, this finding suggests that muscle and joint synergies play an important role in developing overall limb power and thus strength is concomitantly required in the smaller distal muscle groups as well as the larger proximal muscle groups, in order to transfer enhanced power across the limb. This finding highlights that the mechanical properties of muscle and intermuscular coordination are inter-dependent factors, and thus it is necessary to adopt an integrated approach and analyse these factors in concert to achieve a full understanding of functional movement. These findings give an insight as to the potential benefits of training interventions targeting ankle joint strength for sprint cycling performance. Together with the findings from Chapter 5 (Barratt 2014), they support the notion that ankle joint strength is an important determinant of maximal cycling power at low pedalling rates. Thus, sprint cyclists seeking to improve performance at low pedalling rates, for example in accelerations from a standing start (Gardner et al. 2007), should adopt training interventions that will improve muscular strength in the ankle extensors. Indeed, as the pedalling rate at the initial phase of a standing start will be zero, the potential benefits of a stronger ankle joint on hip extension power are likely to be greatest under these conditions. Although the findings suggest that an ankle joint which has been fixed in place by an external device will tend to increase hip extension power, there is no evidence to suggest that such an equipment intervention would actually improve overall cycling performance. When using the fixed ankle brace at low pedalling rates, the increase in hip extension power was offset by the reduction in ankle power, due to minimised velocity and therefore power output at the joint, such that overall cycling power output was less. Furthermore, it was observed that hip extension power was reduced at higher pedalling rates by using the fixed ankle brace. Thus an equipment intervention which performed in a similar manner to the brace used in this study would be likely to compromise overall sprint cycling performance. An important limitation to consider when interpreting these results is the use of ankle weights for the control condition. This condition was used as the experimental control, rather than normal cycling, in order to account for the effects of the additional mass and altered moment of inertia due to the ankle brace. However, this may have altered the segmental dynamics of the task sufficiently to mean that the joint power and EMG data in the ankle weight condition are not representative of normal cycling. Qualitatively, the 97
98 distribution of joint powers in the ankle weights condition is similar to that observed during normal maximal cycling (Martin & Brown 2009; McDaniel et al. 2014; Elmer et al. 2011), although changes in segmental mass and moment of inertia are reported to alter intermuscular coordination during cycling (Brown & Jensen 2006) as well as other activities (e.g. walking (Browning et al. 2007)), so it is possible that inconsistencies may be present. In summary, a rigid ankle brace was used during maximal cycling at two different pedalling rates to simulate experimentally the effects of a stronger ankle joint on hip extension power. It was demonstrated that hip extension power tended to be greater when using the ankle brace at low pedalling rates. This is in agreement with the notion that ankle strength limits hip extension power, although it does not provide incontrovertible evidence to support this. These findings confirm that ankle joint strength is an important determinant of maximal cycling power at low pedalling rates, and indicate that sprint cyclists seeking to improve performance at low pedalling rates should adopt training interventions that will improve muscular strength in the ankle extensors. In addition, they add support to the notion that enhanced performance in maximal functional movements is facilitated by increased strength in task-specific joint actions. On a basic science level, they additionally highlight the remarkable plasticity of the central nervous system, as they show how quickly it is able to re-optimise the intermuscular coordination strategy in response to altered task constraints. 98
99 CHAPTER 7 99
100 GENERAL DISCUSSION Functional movement is determined by a number of mechanical properties, including the primary mechanical properties of muscle (force-velocity relationship (Hill, 1938), length-tension relationship (Gordon et al. 1966), excitation-relaxation kinetics (Caiozzo & Baldwin 1997)) and intermuscular coordination (Pandy & Zajac 1991). Understanding the relative contribution of these factors is important when analysing and observing functional movement, and when seeking to improve task performance. Although the primary mechanical properties of muscle are very well understood in isolation (Fenn 1924; Gordon et al. 1966; Hill 1938), far less is known about how they relate to the performance of functional movements. This is due in part to the difficulties in using the findings of investigations into isolated muscle contractions to predict the complex interplay that occurs between the various mechanical muscle properties during functional movements (Caiozzo 2002; Martin 2007). In reductionist investigations of mechanical muscle properties, the variable of interest is manipulated while all other variables are held constant. This is a very different environment to that occurring during functional movements, in which muscles are required to perform under conditions in which shortening velocity, length and excitation level can all vary simultaneously (Caiozzo 2002). This issue is illustrated clearly by the fact that the mechanical relationships of functional movements can differ dramatically to equivalent measures taken from isolated muscle contractions (e.g. the force-velocity relationship). The disparity in observations between isolated muscle contractions and functional movements raises a host of interesting basic science questions relating to the mechanisms underpinning functional movement. I sought to use a joint-level mechanical analysis of maximal and submaximal cycling to understand the contribution of joint-specific mechanical muscle properties (Martin & Brown 2009) and intermuscular coordination (Korff et al. 2009; Korff & Jensen 2007) to the performance of an ecologically valid functional movement. The specific research objectives were: (a) to determine the contribution of mechanical muscle properties and intermuscular coordination to maximal and submaximal cycling; and (b) to determine the extent to which mechanical muscle properties and intermuscular coordination set the limit of performance in maximal cycling. The aim of this approach was to gain an insight into the mechanisms that underpin functional movement, as well as provide a theoretical framework with which to understand sprint cycling performance. 100
101 Objective 1: To determine the contribution of mechanical muscle properties and intermuscular coordination to maximal and submaximal cycling Main Findings Three of the four experimental studies provide the main findings with respect to this objective. Firstly, the investigation of crank length and pedalling rate in maximal cycling demonstrated that mechanical muscle properties determine both overall and joint-level power outputs in maximal cycling. Secondly, the investigation into crank length and pedal speed in submaximal cycling demonstrated that the intermuscular coordination strategy is preserved across changes in mechanical muscle properties. Thirdly, despite this not being the main objective of the study, the investigation of the effects of a fixed ankle joint on maximal cycling provided evidence that during maximal cycling the central nervous system is able to quickly optimise the intermuscular coordination strategy in response to a change in task constraints. With regard to the first objective of this thesis therefore, I found that sophisticated intermuscular coordination strategies are present in both maximal and submaximal cycling tasks. Specifically, this is demonstrated in submaximal cycling by the finding that the central nervous system makes subtle changes in muscle force in order to preserve the joint power distribution across changes in cycling conditions. In maximal cycling, this is demonstrated by the evidence that the central nervous system was able to re-optimise the intermuscular coordination strategy after only two practice sessions of using the fixed ankle braces. Taken together, these findings indicate that intermuscular coordination plays a significant role in both submaximal and maximal cycling tasks. In terms of the contribution of mechanical muscle properties to the cycling task, the findings identify differences between submaximal and maximal conditions. The results show that the mechanical muscle properties of the force-velocity relationship and excitationrelaxation kinetics together govern power production during maximal cycling on both a limb and an individual joint-level. In maximal cycling, mechanical muscle properties are thus very important task determinants. In submaximal cycling, by contrast, changes in the task constraints which would directly influence mechanical muscle properties did not change the intermuscular coordination strategy and thus the manner in which overall cycling power was produced. In addition, there was no evidence of the central nervous system seeking to counteract the enforced changes in muscle shortening velocity or muscle length by exploiting the kinematic degrees of freedom available at the knee and hip. The results 101
102 therefore indicate that mechanical muscle properties only have minor relevance to the submaximal cycling task. Implications These findings are significant as they demonstrate that a high level of intermuscular coordination occurs in both submaximal cycling and maximal cycling. These findings are in agreement with analyses of other multi-joint functional movements such as walking (Anderson & Pandy 2001), running (Jacobs & van Ingen Schenau 1992), hopping (Bobbert & Casius 2011; Ferris & Farley 1997) and jumping (Bobbert & van Ingen Schenau 1988; Pandy & Zajac 1991), which demonstrate that sophisticated intermuscular coordination strategies facilitate these movement tasks. These findings thereby provide evidence to support the generalised notion that high levels of intermuscular coordination must be present in functional multi-joint movement tasks in order for movements with such a large number of degrees of freedom to be performed in a stereotypically similar manner across different individuals (Bernstein 1967; Whiting 1983). The investigation into crank length in maximal cycling show that performance of the maximal cycling task ultimately depends on the interaction of two mechanical muscle properties: the force-velocity relationship and excitation-relaxation kinetics. This is in agreement with the findings of studies on other maximal functional movements (maximal height jumping (Bobbert & van Ingen Schenau 1988; Bobbert & van Soest 1994), maximum speed running (Jacobs & van Ingen Schenau 1992), which show that task performance is determined by mechanical muscle properties. These findings thereby allow us to speculate that mechanical muscle properties are the dominant contributing factor in maximal movements where the goal is to maximise overall mechanical output within the kinematic constraints of the task. These findings also have significant methodological implications. It was demonstrated that some mechanical properties of muscle, despite being fundamental determinants of force and power production in isolated muscle contractions (Fenn 1924; Gordon et al. 1966; Hill 1938), were not necessarily influential factors during functional movement. In submaximal cycling, for example, large changes in muscle length and muscle shortening velocity were in effect counteracted by the chosen intermuscular coordination strategy such that the mechanical joint contribution did not change. Thus, the mechanical muscle properties of the force-velocity relationship and the length-tension relationship did not influence submaximal cycling task performance. Even in maximal cycling, when task 102
103 performance is determined by mechanical muscle properties (Martin et al. 2007; Yoshihuku & Herzog 1996), it was found that muscle length - again a fundamental constraint of force and power production in isolated muscle contractions (Gordon et al., 1966) - did not limit force or power output during maximal cycling. By contrast, muscle shortening velocity and excitation time were found to be highly influential. These findings highlight the importance of observing mechanical muscle properties in situ. They further question the efficacy of using results from isolated muscle contractions to make direct conclusions relating to the performance of functional movements. Objective 2: To determine the extent to which mechanical muscle properties and intermuscular coordination set the limit of performance in maximal cycling Main Findings The main finding with respect to this objective was that world-class track sprint cyclists achieve higher maximal cycling powers via enhanced mechanical muscle properties, rather than a more optimal intermuscular coordination strategy. Specifically, joint-specific muscular strength about the ankle and knee joint were demonstrated to be the key factors facilitating this enhanced maximal cycling power output. Thus the limit of performance in maximal cycling is set by the joint-specific muscular strength at the ankle and knee joints. The analysis of world-class track sprint cyclists also provided an insight as to potential areas for performance improvement in sprint cycling. One such area was the concept that hip extension power is limited by ankle strength in maximal cycling. This provided the rationale for the fixed ankle brace study, the results of which are in agreement with the notion that ankle strength limits hip extension power during maximal cycling. Implications The most significant findings of this thesis are likely to be those relating to the mechanical construction of world-class track sprint cycling performance. Very few research studies have been able to gain an insight into the mechanisms facilitating Olympic and World Championship level sporting performances. Particularly rare are investigations that have a sufficient number of participants to make generalised observations of world-class performance, whilst still preserving the quality of the athletes such that the definition of 103
104 world-class is still appropriate. In the investigation of world-class track sprint cyclists, it was demonstrated that world-class performance in sprint cycling is not facilitated by a more optimal intermuscular coordination strategy. Rather, world-class track sprint cycling is governed by the ability to generate higher joint moments at the ankle and knee, and that these joint moments are facilitated by enhanced muscular strength about these joints. These findings were supported and extended by the results of the ankle brace study which indicated that, due to the ankle/hip extensor muscle synergy, ankle extension is likely to limit hip extension power and thus overall maximal cycling power. During maximal cycling, ankle extension is therefore one such task-specific joint action in which increased muscular strength facilitates enhanced performance. This is interesting as one might assume that increased strength might only be relevant in the major power-producing joint actions of a given movement, for example in the dominant actions of knee extension and hip extension during maximal cycling (Martin & Brown 2009; McDaniel et al. 2014). These results however, highlight that muscle and joint synergies play an important role in developing overall limb power and thus strength is also required in the smaller distal muscle groups as well as the larger proximal muscle groups, in order to transfer enhanced power across the limb. Higher moments in task-specific joint actions have also been reported to explain high performance in speed skating (de Koning et al. 1991) and sprint running (Bezodis et al. 2014). Although these investigations did not determine the contributing factors, it seems probable that enhanced muscular strength might also be the mechanism by which these sprint athletes produced enhanced joint moments. Taken together, these findings allow us to speculate that the limits of performance in maximal human movements lie in extraordinary muscular strength in task-specific joint actions. In most sporting applications, the important issue regarding functional movements is how to improve performance. These findings add considerably to this understanding in sprint cycling, in particular by identifying the factors most likely to facilitate progression from sub-elite to world-class level. It was demonstrated that world-class level maximal cycling performance is facilitated to a large extent by muscular strength at the ankle and knee. Muscular strength is a trainable quality (Crewther et al 2005; Folland & Williams 2007), and therefore sub-elite sprint cyclists seeking to improve their performance should place significant emphasis on developing muscular strength at the ankle and knee joints. An interesting caveat to this argument is provided by the results of Bobbert and van Soest (1994). These authors used a musculoskeletal model to simulate the effect of increased strength on maximal jumping performance and interestingly indicated that an alteration in 104
105 intermuscular coordination is required following a strength improvement, in order to translate the increase in strength to improvements in jumping performance. These authors argued that strength training programmes should thus be accompanied by exercises in which athletes practise with their changed muscle properties. Although these simulated results have not being validated experimentally, that is by showing that isolated strength training is less effective in improving performance in a maximal functional movement than strength training combined with movement practice, it is the experience of this author that this concept is in agreement with the training programme structure adopted by many world-class sprint athletes and coaches. This notion provides further insight into the high level of interdependency that potentially occurs between mechanical muscle properties and intermuscular coordination. Limitations Limitations should be considered when interpreting the results of these studies. Firstly, joint kinematics data were used as a proxy for muscle kinematics throughout this thesis. This approach is limited however, as muscle moment arms and muscle architecture are not consistent across different joints or different individuals (Lieber & Friden 2000), and further joint excursion can be caused by tendon rather than muscle length change (Fukunaga et al. 2002; Muraoka et al. 2001). Therefore, changes in joint kinematics, which have been interpreted as changes in muscle kinematics in this thesis, may in fact have been due to other factors. Secondly, the decision to investigate mechanical muscle properties and intermuscular coordination using an inverse dynamics approach resulted in joint-level analyses of mechanical output. Whilst this approach does provide an insight into physiologically relevant properties, this is limited as it does not give a direct measure of muscle force, which is ultimately the key factor in terms of mechanical muscle properties and intermuscular coordination (Zajac et al. 2002). Translating joint-level findings to a muscle level understanding is somewhat hampered by uncertainties with respect to the storage and recovery of elastic energy in the tendons, and intercompensation due to biarticular muscles (Zajac et al. 2002). Thus, a number of assumptions are required in order to interpret joint-level mechanical outputs in the context of muscle function, each of which places a limitation on the robustness of the findings. Thirdly, with the exception of the final study, electromyography (EMG) data were not used to additionally describe muscle activations in these investigations. It is likely that 105
106 further insight may have been achieved, particularly in relation to intermuscular coordination, by quantifying the timing and magnitude of muscular contractions during these studies, alongside the joint-level mechanical outputs. Finally, the implications of these findings have been extensively discussed within the context of sprint cycling performance. However, a key assumption here is that the roles of mechanical muscle properties and intermuscular coordination do not differ greatly between cycling on a static ergometer and cycling on a moving bicycle. It seems likely that some difference will occur although the extent of these differences is not known, and hence this is an additional limitation to the findings reported in this thesis. Future Directions In order to address some of the methodological limitations described above, future research could seek to describe mechanical muscle properties and intermuscular coordination during cycling on an individual muscle level. This approach is possible using forward dynamics musculoskeletal modelling (Rankin & Neptune 2008; Zajac et al. 2002). The use of these models may thus offer additional insight into muscular function and intermuscular coordination strategies during maximal and submaximal cycling. These findings suggest that the limits of performance in maximal human movements lie in extraordinary muscular strength in task-specific joint actions. Enhanced muscular strength can be facilitated by more optimal muscle size, muscle architecture, muscle moment arms or tendon properties (Caiozzo 2002; Lieber & Friden 2000). Future research could thus seek to achieve a more detailed understanding of the factors contributing to enhanced jointspecific muscular strength in world-class sprint athletes, which would provide an insight as to the extent to which the limits of performance in maximal human movements are due to training adaptation compared to genetic predisposition. These findings imply that in order to enhance sprint cycling performance, considerable emphasis should be placed upon enhancing muscular strength at the ankle and knee joints, and that intermuscular coordination does not greatly influence performance. However, some authors argue that greater improvements in performance will occur if strength training programmes are accompanied by exercises in which athletes practise with their changed muscle properties (Bobbert & van Soest 1994). Confirmation of either notion would have direct application to the training programmes of sprint athletes, as well as provide considerable insight into the interdependency of mechanical muscle properties and 106
107 intermuscular coordination during functional movement. An appropriate experimental design for this purpose would be an intervention study investigating whether isolated strength training is more or less effective in improving performance in a maximal functional movement than strength training combined with movement practice. Summary In summary, these findings demonstrate that sophisticated intermuscular coordination strategies are present in both submaximal and maximal cycling. This supports the generalised notion that high levels of intermuscular coordination are required to perform functional multi-joint movement tasks. Furthermore, it was found that the maximal cycling task is governed by the interaction of the force-velocity relationship and excitationrelaxation kinetics, suggesting that task-specific mechanical muscle properties are the dominant contributing factor in maximal movements. In addition, it was demonstrated that world-class track sprint cycling performance is governed by the ability to generate higher joint moments at the ankle and knee, and that these joint moments are facilitated by enhanced muscular strength about these joints. These findings allow us to speculate that the limits of performance in maximal human movements lie in extraordinary muscular strength in task-specific joint actions. These findings give an insight into the mechanisms that underpin maximal and submaximal cycling, and provide a theoretical framework with which to understand sprint cycling performance. This knowledge has significant applied relevance for athletes and coaches seeking to improve sprint cycling performance. 107
108 CHAPTER 8 108
109 REFERENCES Aagaard, P., Simonsen, E.B., Andersen, J.L., Magnusson, P., Dyhre-Poulsen P., Increased rate of force development and neural drive of human skeletal muscle following resistance training. Journal of Applied Physiology, 93, pp Ahn, A.N., Furrow, E., Biewener, A.A., Walking and running in the red-legged running frog, Kassina maculata. Journal of Experimental Biology, 207(3), pp Almasbakk, B. & Hoff, J., Coordination, the determinant of velocity specificity? Journal of Applied Physiology, 80(5), pp Anderson, F.C. & Pandy, M.G., Dynamic optimization of human walking. Journal of Biomechanical Engineering, 123(5), pp Askew, G.N. & Marsh, R.L., Muscle designed for maximum short-term power output : quail flight muscle. Journal of Experimental Biology, 205, pp Askew, G.N. & Marsh, R.L., The effects of length trajectory on the mechanical power output of mouse skeletal muscles. The Journal of Experimental Biology, 200(Pt 24), pp Askew, G.N. & Marsh, R.L., The mechanical power output of the pectoralis muscle of blue-breasted quail (Coturnix chinensis): the in vivo length cycle and its implications for muscle performance. Journal of Experimental Biology, 204, pp Askew, G.N., Marsh, R.L., Ellington, C.P., The mechanical power output of the flight muscles of blue-breasted quail (Coturnix chinensis) during take-off. Journal of Experimental Biology, 204, pp Barratt, P.R., Korff, T., Elmer, S.J., Martin, J.C., Effect of Crank Length on Joint- Specific Power during Maximal Cycling. Medicine & Science in Sports & Exercise, 43(9), pp Barratt, P.R., Biomechanical Factors Associated with World-Class Track Sprint Cycling Performance. Bernstein, N.A., The co-ordination and regulation of movements, Pergamon Press. Bezodis, N.E., Salo, A.I.T., Trewartha, G., Lower limb joint kinetics during the first stance phase in athletics sprinting: three elite athlete case studies. Journal of Sports Sciences, 32(8), pp Biewener, A.A., Corning, W.R., Tobalske, B.W., In vivo pectoralis muscle forcelength behavior during level flight in pigeons (Columba livia). Journal of Experimental Biology, 201, pp Bini, R.R., Hume, P.A., Kilding, A.E., Saddle height effects on pedal forces, joint mechanical work and kinematics of cyclists and triathletes. European Journal of Sport Science, 14(1), pp
110 Bini, R.R., Tamborindeguy, A.C., Mota, C.B., Effects of Saddle Height, Pedaling Cadence, and Workload on Joint Kinetics and Kinematics During Cycling. Journal of Sport Rehabilitation, 19, pp Bobbert, M.F., Why is the force-velocity relationship in leg press tasks quasi-linear rather than hyperbolic? Journal of Applied Physiology, 112(12), pp Bobbert, M.F. & Casius, L.J.R., Spring-like leg behaviour, musculoskeletal mechanics and control in maximum and submaximum height human hopping. Philosophical transactions of the Royal Society of London. Series B, Biological sciences, 366(1570), pp Bobbert, M.F. & van Ingen Schenau, G.J., Cordination in vertical jumping. Journal of Biomechanics, 21(3), pp Broker, J.P. & Gregor, R.J., Mechanical energy management in cycling: source relations and energy expenditure. Medicine & Science in Sports & Exercise, 26(1), pp Brown, N.A. & Jensen, J.L., The Role of Segmental Mass and Moment of Inertia in Dynamic-Contact Task Construction. Journal of Motor Behavior, 38(4), pp Browning, R.C., Modica, J.R., Kram, R., Goswami, A., The effects of adding mass to the legs on the energetics and biomechanics of walking. Medicine & Science in Sports & Exercise, 39(3), pp Caiozzo, V.J., Plasicity of skeletal muscle phenotype: mechanical consequences. Muscle & Nerve, 26, pp Caiozzo, V.J. & Baldwin, K.M., Determinants of work produced by skeletal muscle: potential limitations of activation and relaxation. The American Journal of Physiology, 273, pp Carolan, B. & Cafarelli, E., Adaptations in coactivation after isometric resistance training. Journal of Applied Physiology, 73(3), pp Cohen, J., Statistical power analysis for the behavioral sciences, second edition, Hillsdale (NJ): Lawrence Erlbaum Associates. Coyle, E.F., Coggsn, A.R., Hopper, M.K., Walters, T.J., Determinants of endurance in well-trained cyclists. Journal of Applied Physiology, 64(6), pp Coyle, E.F., Improved muscular efficiency displayed as Tour de France champion matures. Journal of Applied Physiology, 98, pp Crewther, B., Cronin, J., Keogh, J., Possible Stimuli for Strength and Power Adaptation. Sports Medicine, 35(11), pp Crook, T.C., Cruickshank, S.E., McGowan, C.M., Stubbs, N., Wilson, A.M., Hodson-Tole, E., Payne, R.C., A comparison of the moment arms of pelvic limb muscles in horses bred for acceleration (Quarter Horse) and endurance (Arab). Journal of Anatomy, 217, pp
111 Dekerle, J., Baron, B., Dupont, L., Vanvelcenaher, J., Pelayo, P., Maximal lactate steady state, respiratory compensation threshold and critical power. European Journal of Applied Physiology, 89(3-4), pp Delagi, E.F., Iazzetti, J., Perotto, A.O., Anatomical Guide for the Electromyographer: The Limbs and Trunk Fifth., Charles C Thomas Pub Ltd. Dorel, S., Guilhem, G., Couturier, A., Hug, F., Adjustment of muscle coordination during an all-out sprint cycling task. Medicine & Science in Sports & Exercise, 44(11), pp Dorel, S., Coutrier, A., Lacour, J.-R.,Vandewalle, H., Hautier, C., Hug, F., Forcevelocity relationship in cycling revisited: benefit of two-dimensional pedal forces analysis. Medicine & Science in Sports & Exercise, 42(6), pp Dorel, S., Hautier, C.A., Rambaud, O., Rouffet, D., Van Praagh, E., Lacour, J.-R., Bourdin, M., Torque and power-velocity relationships in cycling: relevance to track sprint performance in world-class cyclists. International Journal of Sports Medicine, 26, pp Dotan, R. & Bar-Or, O., Load optimization for the Wingate Anaerobic Test. European Journal of Applied Physiology and Occupational Physiology, 51(3), pp Dowson, M.N., Nevill, M.E., Lakomy, H.K.A., Nevill, A.M., Hazeldine, R.J., Modelling the relationship between isokinetic muscle strength and sprint running performance. Journal of Sports Sciences, 16(3), pp Elftman, H., Forces and energy changes in the leg during walking. American Journal of Physiology, 125(2), pp Elmer, S.J., Barratt, P.R., Korff, T., Martin, J.C., Joint-specific power production during submaximal and maximal cycling. Medicine & Science in Sports & Exercise, 43(10), pp Ericson, M.O., Bratt, A., Nisell, R., Arborelius, U.P., Ekholm, J., Load moments about the hip and knee joints during ergometer cycling. Scandinavian Journal of Rehabilitation Medicine, 18(4), pp Ericson, M.O., Mechanical muscular power output and work during ergometer cycling at different work loads and speeds. European Journal of Applied Physiology, 57, pp Farris, D.J. & Sawicki, G.S., The mechanics and energetics of human walking and running: a joint level perspective. Journal of the Royal Society, Interface / the Royal Society, 9(66), pp Fenn, W.O., The relation between the work performed and the energy liberated in muscular contraction. Journal of Physiology, (58), pp Foley, J.P., Bird, S.R., White, J.A., Anthropometric comparison of cyclists from different events. British Journal of Sports Medicine, 23(1), pp
112 Folland, J.P. & Williams, A.G., The Adaptations to Strength Training: Morphological and Neurological Contributions to Increased Strength. Sports Medicine, 37(2), pp Fregly, B.J. & Zajac, F.E., A state-space analysis of mechanical generation, absorption and transfer during pedalling energy. Journal of Biomechanics, 29, pp Gabriel, D.A., Kamen, G., Frost, G., Neural Adaptations to Resistive Exercise: Mechanisms and Recommendations for Training Practices. Sports Medicine, 36(2), pp Gardner, A.S., Martin, J.C., Martin, D.T., Barras, M., Jenkins, D.G., Maximal torqueand power-pedaling rate relationships for elite sprint cyclists in laboratory and field tests. European Journal of Applied Physiology. Gardner, A.S., Martin, D.T., Jenkins, D.G., Dyer, I., Van Eijden, J., Barrass, M., Martin, J.C., Velocity-Specific Fatigue: Quantifying Fatigue during Variable Velocity Cycling. Medicine & Science in Sports & Exercise, 41(4), pp Garfinkel, S. & Cafarelli, E., Relative changes in maximal force, EMG, and muscle cross-sectional area after isometric training. Medicine & Science in Sports & Exercise, 24(11), pp Gillis, G.B., Flynn, J.P., McGuigan, P., Biewener, A.A., Patterns of strain and activation in the thigh muscles of goats across gaits during level locomotion. The Journal of Experimental Biology, 208(Pt 24), pp Gillis, G.B. & Biewener, A. A., Hindlimb muscle function in relation to speed and gait: in vivo patterns of strain and activation in a hip and knee extensor of the rat (Rattus norvegicus). The Journal of Experimental Biology, 204(Pt 15), pp Gonzalez, H. & Hull, M.L., Mulitvariate optimization of cycling biomechanics. Journal of Biomechanics, 22(11/12), pp Gordon, A.M., Huxley, A.F., Julian, F.J., The variation in isometric tension with sarcomere length in vertebrate muscle fibres. Journal of Physiology, 184, pp Gregor, R.J., Cavanagh, P.R., Lafortune, M.A., Knee flexor moments during propulsion in cycling - a creative solution to Lombard's paradox. Journal of Biomechanics, 18(5), pp Häkkinen, K., Alén, M., Komi, P. V, Changes in isometric force- and relaxation-time, electromyographic and muscle fibre characteristics of human skeletal muscle during strength training and detraining. Acta Physiologica Scandinavica, 125(4), pp Häkkinen, K. & Keskinen, K.L., Muscle cross-sectional area and voluntary force production characteristics in elite strength- and endurance-trained athletes and sprinters. European Journal of Applied Physiology and Occupational Physiology, 59(3), pp Hannah, R., Minshull, C., Buckthorpe, M.W., Folland, J.P., Explosive neuromuscular performance of males versus females. Experimental Physiology, 97(5), pp
113 Hansen, E.A., Jensen, K., Hallen, J., Rasmussen, J., Pedersen, P.K., Effect of Chain Wheel Shape on Crank Torque, Freely Chosen Pedal Rate, and Physiological Responses during Submaximal Cycling. Journal of Physiological Anthropology, 28(6), pp Hansen, E.A., Andersen, J.L., Nielsen, J.S., Sjogaard, G., Muscle fibre type, efficiency, and mechanical optima affect freely chosen pedal rate during cycling. Acta Physiologica Scandinavica, 176, pp Hansen, E.A. & Smith, G., Factors Affecting Cadence Choice During Submaximal Cycling and Cadence Influence on Performance. International Journal of Sports Physiology and Performance, 4, pp Hill, A. V, The heat of shortening and dynamic constants of muscle. Proceedings of Royal Society of London B, 126, pp Hintzy, F., Tordi, N., Predine, E., Rouillon, J.-D., Belli, A., Force velocity characteristics of upper limb extension during maximal wheelchair sprinting performed by healthy able-bodied females. Journal of Sports Sciences, 21, pp Hug, F., Turpin, N.A., Guevel, A., Dorel, S., Is interindividual variability of EMG patterns in trained cyclists related to different muscle synergies? Journal of Applied Physiology, 108, pp Hug, F. & Dorel, S., Electromyographic analysis of pedaling : A review. Journal of Electromyography and Kinesiology, 19, pp Hull, M.L. & Gonzalez, H., Bivariate optimization of pedalling rate and crank arm length in cycling. Journal of Biomechanics, 21(10), pp Hull, M.L., Gonzalez, H., Redfield, R., Optimization of Pedaling Rate in Cycling Using a Muscle Stress-Based Objective Function. International Journal of Sports Biomechanics, 4, pp Hull, M.L. & Jorge, M., A method for biomechanical analysis of bicycle pedalling. Journal of Biomechanics, 18(9), pp Inbar, O., The effect of bicycle crank-length variation upon power performance. Ergonomics, 26(12), pp Inbar, O., Kaiser, P., Tesch, P., Relationships between leg muscle fiber type distribution and leg exercise performance. International Journal of Sports Medicine, 2(3), pp Van Ingen Schenau, G.J., Van Woensel, W.W.L.M., Boots, P.J.M., Snackers, R.W., de Groot, G., Determination and interpretation of mechanical power in human movement: application to ergometer cycling. European Journal of Applied Physiology, (61), pp Van Ingen Schenau, G.J., The constrained control of force and position in multi-joint movements. Neuroscience, 46(1), pp
114 Van Ingen Schenau, G.J., de Koning, J.J., Groot, G. De, Optimisation of Sprinting Performance in Running, Cycling and Speed Skating. Sports Medicine, 17(4), pp Inglis, J.G., Vandenboom, R., Gabriel, D. a, Sex-related differences in maximal rate of isometric torque development. Journal of Electromyography and Kinesiology, 23(6), pp Jacobs, R. & van Ingen Schenau, G.J., Intermuscular coordination in a sprint push-off. Journal of Biomechanics, 25(9), pp Jeukendrup, A.E. & Martin, J.C., Improving Cycling Performance: How Should We Spend Our Time and Money. Sports Medicine, 31(7), pp Josephson, R.K., Dissecting muscle power output. Journal of Experimental Biology, 202, pp Joyner, M.J. & Coyle, E.F., Endurance exercise performance: the physiology of champions. Journal of Physiology, 1, pp Kadaba, M.P., Repeatability of kinematic, kinetic, and electromyographic data in normal adult gait. Journal of Orthopaedic Research, 7(6), pp Kautz, S.A. & Hull, M.L., Dynamic optimisation analysis for equipment setup problems in endurance cycling. Journal of Biomechanics, 28(11), pp Koning, J. de, Groot, G. de, van Ingen Schenau, G.J., Coordination of leg muscles during speed skating. Journal of Biomechanics, 24(2), pp Korff, T., Romer, L.M., Mayhew, I., Martin, J.C., Effect of Pedaling Technique on Mechanical Effectiveness and Efficiency in Cyclists. Medicine & Science in Sports & Exercise, 39(6), pp Korff, T., Hunter, E.L., Martin, J.C., Muscular and non-muscular contributions to maximum power cycling in children and adults: implications for developmental motor control. Journal of Experimental Biology, 212, pp Korff, T. & Jensen, J.L., Age-related differences in adaptation during childhood: the influences of muscular power production and segmental energy flow caused by muscles. Experimental Brain Research, 177(3), pp Korhonen, M.T., Cristea, A., Alen, M., Hakkinen, K., Sipila, S., Mero, A., Viitasalo, J.T., Larsson, L., Suominin, H., Aging, muscle fiber type, and contractile function in sprint-trained athletes. Journal of Applied Physiology, pp Lee, S.S.M. & Piazza, S.J., Built for speed: musculoskeletal structure and sprinting ability. Journal of Experimental Biology, 212, pp Leonard, T.R., DuVall, M., Herzog, W., Force enhancement following stretch in a single sarcomere. American Journal of Physiology, 299(6), pp.c De Leva, P., Adjustments to Zatsiorsky-Seluyanov s Segment Inertia Parameters. Journal of Biomechanics, 29(9), pp
115 Lieber, R.L. & Friden, J., Functional and Clinical Significance of Skeletal Muscle Architecture. Muscle & Nerve, 23, pp Lutz, G.J. & Rome, L.C., Built for Jumping : The Design of the Frog Muscular System. Science, 263(5145), pp Marsh, A.P. & Martin, P.E., The association between cycling experience and preferred and most economical cadences. Medicine & Science in Sports & Exercise, 25(11), pp Marsh, A.P., Martin, P.E., Sanderson, D.J., Is a joint moment-based cost function associated with preferred cycling cadence? Journal of Biomechanics, 33, pp Marsh, R.L., How muscles deal with real-world loads: the influence of length trajectory on muscle performance. Journal of Experimental Biology, 202, pp Martin, J.C., Brown, N.A., Anderson, F.C., Spirduso, W.W., A governing relationship for repetitive muscular contraction. Journal of Biomechanics, 33, pp Martin, J.C., Elmer, S.J., Horscroft, R.D., Brown, N.A., Shultz, B.B., A low-cost instrumented spatial linkage accurately determines ASIS position during cycle ergometry. Journal of Applied Biomechanics, 23, pp Martin, J.C., Gardner, S., Barras, M., Martin, D.T., Modeling Sprint Cycling Using Field-Derived Parameters and Forward Integration. Medicine & Science in Sports & Exercise, 38(3), pp Martin, J.C., Muscle power: the interaction of cycle frequency and shortening velocity. Exercise and Sport Sciences Reviews, 35(2), pp Martin, J.C. & Brown, N.A., Joint-specific power production and fatigue during maximal cycling. Journal of Biomechanics, 42, pp Martin, J.C., Davidson, C.J., Pardyjak, E.R., Understanding Sprint-Cycling Performance: The Integration of Muscle Power, Resistance, and Modeling. International Journal of Sports Physiology and Performance, 2, pp Martin, J.C., Diedrich, D., Coyle, E.F., Time course of learning to produce maximum cycling power. International Journal of Sports Medicine, 21(7), pp Martin, J.C. & Spirduso, W.W., Determinants of maximal cycling power: Crank length, pedaling rate and pedal speed. European Journal of Applied Physiology, 84, pp McDaniel, J., Durstine, J.L., Hand, G.A., Martin, J.C., Determinants of metabolic cost during submaximal cycling. Journal of Applied Physiology, 93(3), pp McDaniel, J., Behjani, N.S., Elmer, S.J., Brown, N.A., Martin, J.C., Joint-specific power-pedaling rate relationship during maximal cycling. Journal of Applied Biomechanics, Epub. 115
116 McDaniel, J., Elmer, S.J., Martin, J.C., Limitations of relaxation kinetics on muscular work. Acta Physiologica, 198, pp McDaniel, J., Subudhi, A., Martin, J.C., Torso stabilization reduces the metabolic cost of producing cycling power. Canadian Journal of Applied Physiology, 30(4), pp McLean, B.D. & Parker, A.W., An anthropometric analysis of elite Australian track cyclists. Journal of Sports Sciences, 7(3), pp A Mileva, K. & Turner, D., Neuromuscular and biomechanical coupling in human cycling: Adaptations to changes in crank length. Experimental Brain Research, 152, pp Morin, J.B., Samozino, P., Bonnefoy, R., Edouard, P., Belli, A., Direct measurement of power during one single sprint on treadmill. Journal of Biomechanics, 43, pp Mornieux, G., Guenette, J.A., Sheel, A.W., Sanderson, D.J., Influence of cadence, power output and hypoxia on the joint moment distribution during cycling. European Journal of Applied Physiology, 102, pp Narici, M. V, Changes in force, cross-sectional area and neural activation during strength training and detraining of the human quadriceps. European Journal of Applied Physiology and Occupational Physiology, 59(4), pp Neptune, R.R. & Herzog, W., Adaptation of muscle coordination to altered task mechanics during steady-state cycling. Journal of Biomechanics, 33, pp Neptune, R.R. & Herzog, W., The association between negative muscle work and pedaling rate. Journal of Biomechanics, 32, pp Neptune, R.R. & Hull, M.L., A theoretical analysis of preferred pedaling rate selection in endurance cycling. Journal of Biomechanics, 32, pp Neptune, R.R. & Hull, M.L., Accuracy assessment of methods for determining hip movements in seated cycling. Journal of Biomechanics, 28(4), pp Neptune, R.R. & Kautz, S.A., Muscle activation and deactivation dynamics: the governing properties in fast cyclical human movement performance? Exercise and Sport Sciences Reviews, 29(2), pp Neptune, R.R., Kautz, S.A., Zajac, F.E., Muscle contributions to specific biomechanical functions do not change in forward versus backward pedaling. Journal of Biomechanics, 33, pp Nishikawa, K.C., Monroy, J.A., Uyeno, T.E., Yeo, S.H., Pai, D.K., Lindstedt, S.L., Is titin a winding filament? A new twist on muscle contraction. Proceedings. Biological sciences / The Royal Society, 279(1730), pp Novacheck, T.F., The biomechanics of running. Gait and Posture, 7, pp
117 Osu, R., Franklin, D.W., Kato, H., Gomi, H., Domen, K., Yoshioka, T., Kawato, M., Short- and Long-Term Changes in Joint Co-Contraction Associated With Motor Learning as Revealed From Surface EMG. Journal of Neurophysiology, pp Pandy, M.G., Zajaz, F.E., Sim, E., Levine, W.S., An optimal control model for maximum-height human jumping. Journal of Biomechanics, 23(12), pp Pandy, M.G. & Zajac, F.E., Optimal muscular coordination strategies for jumping. Journal of Biomechanics, 24(1), pp Patton, J.F., Murphy, M.M., Frederick, F.A., Maximal power outputs during the Wingate anaerobic test. International Journal of Sports Medicine, 6(2), pp Pousson, M., Amiridis, I.G., Cometti, G., Van Hoecke, J., Velocity-specific training in elbow flexors. European Journal of Applied Physiology, 80, pp Raasch, C.C., Zajac, F.E., Ma, B., Levine, W.S., Muscle coordination of maximumspeed pedaling. Journal of Biomechunics, 30(6), pp Raasch, C.C. & Zajac, F.E., Locomotor Strategy for Pedaling: Muscle Groups and Biomechanical Functions. Journal of Neurophysiology, 82, pp Rankin, J. & Neptune, R.R., A theoretical analysis of an optimal chainring shape to maximize crank power during isokinetic pedaling. Journal of Biomechanics, 41, pp Redfield, R.L. & Hull, M.L., 1986a. On the relation between joint moments and pedalling rates at constant power in bicycling. Journal of Biomechanics, 19(4), pp Redfield, R.L. & Hull, M.L., 1986b. Prediction of pedal forces in bicycling using optimization methods. Journal of Biomechanics, 19(7), pp Roberts, T.J. & Scales, J.A, Adjusting muscle function to demand: joint work during acceleration in wild turkeys. The Journal of Experimental Biology, 207(Pt 23), pp Roberts, T.J. & Scales, J.A., Mechanical power output during running accelerations in wild turkeys. Journal of Experimental Biology, 1494, pp Ryan, M.M. & Gregor, R.J., EMG profiles of lower extremity muscles during cycling at constant workload and cadence. Journal of Electromyography and Kinesiology, 2(2), pp Sargeant, A.J., Structural and functional determinants of human muscle power. Experimental Physiology, 92(2), pp Schneider, K., Zernicke, R.F., Schmidt, R.A., Hart, T.J., Changes in limb dynamics during the practice of rapid arm movements. Journal of Biomechanics, 22(8-9), pp Van Soest, A.J.K. & Casius, L.J.R., Which factors determine the optimal pedaling rate in sprint cycling. Medicine & Science in Sports & Exercise, 32(11), pp
118 Stoggl, T., Enqvist, J., Muller, E., Holmberg, H.-C., Relationships between body composition, body dimensions, and peak speed in cross-country sprint skiing. Journal of Sports Sciences, 28(2), pp Stone, M.H., Sands, W.A., Carlock, J., Callan, S., Dickie, D., Daigle, K., Cotton, J., Smith, S.L., Hartman, M., The importance of isometric strength and peak rate-of-force development in sprint cycling. Journal of Strength & Conditioning Research, 18(4), pp Tillin, N.A., Jimenez-Reyes, P., Pain, M.T.G., Folland, J.P., Neuromuscular Performance of Explosive Power Athletes versus Untrained Individuals. Medicine & Science in Sports & Exercise, 42(4), pp Tomas, A., Ross, E.Z., Martin, J.C., Fatigue during maximal sprint cycling: unique role of cumulative contraction cycles. Medicine & Science in Sports & Exercise, 42(7), pp Too, D. & Landwer, G.E., The effect of pedal crank arm length on joint angle and power production in upright cycle ergometry. Journal of Sports Sciences, 18, pp Vanrenterghem, J., Bobbert, M.F., Casius, L.J.R., de Clercq, D., Is energy expenditure taken into account in human sub-maximal jumping?--a simulation study. Journal of Electromyography and Kinesiology, 18(1), pp Wakeling, J.M., Blake, O.M., Chan, H.K., Muscle coordination is key to the power output and mechanical efficiency of limb movements. The Journal of Experimental Biology, 213, pp Wakeling, J.M. & Horn, T., Neuromechanics of muscle synergies during cycling. Journal of Neurophysiology, 101, pp Watts, A.S., Coleman, I., Nevill, A., The changing shape characteristics associated with success in world-class sprinters. Journal of Sports Sciences, 30(11), pp Whiting, H.T.A., Human motor actions: Berstein reassessed, Elsevier. Yoshihuku, Y. & Herzog, W., Maximal muscle power output in cycling: A modelling approach. Journal of Sports Sciences, 14(2), pp Yoshihuku, Y. & Herzog, W., Optimal design parameters of the bicycle-rider system for maximal muscle power output. Journal of Biomechanics, 23(10), pp Zajac, F.E., Neptune, R.R., Kautz, S.A., Biomechanics and muscle coordination of human walking. Part I: introduction to concepts, power transfer, dynamics and simulations. Gait and Posture, 16, pp
119 CHAPTER 9 119

120 APPENDIX Selection of Filter Cut-Off Frequencies Upon inspection of pilot joint power data it was apparent that the chosen filter cutoff frequency significantly altered the data, in particular when making comparisons across pedalling rates. This issue is best illustrated using a graphical comparison of the effect of cut-off frequency on joint power data across different pedalling rates, as shown in Figure 8. Figure 8. The effect of different filter cut-off frequencies on knee power data collected during maximal cycling at three different pedalling rates (60 rpm, 120 rpm, 180 rpm). Data are compared when filter cut-off frequencies were set at 6 Hz, 12 Hz and 18 Hz. Y-axes are knee power (W) and X-axes are crank angle (deg.) for all plots. It is clear from Figure 8 that there is an interaction between pedalling rate and the optimal cut-off frequency. A filter cut-off frequency of 6 Hz, for example, seems suitable for a pedalling rate of 60 rpm (Figure 8. top-left), but appears to over-smooth data collected at a pedalling rate of 180 rpm (Figure 8, bottom-left). By comparison a filter cut-off frequency of 18 Hz is suitable for a pedalling rate of 180 rpm (Figure 8, bottom-right), but appears to under-smooth data collected at a pedalling rate of 60 rpm (Figure 8, top-right). The interaction between optimal cut-off frequency and pedalling rate is logical given the movement speed, and thus frequency content, of cycling is determined by the pedalling 120


121 rate. Therefore the frequency content of the true signal will change with pedalling rate, and thus the optimal cut-off frequency will be different. This issue may not be significant if datasets are analysed in isolation, or across similar pedalling rates, but when seeking to compare data across large changes in pedalling rates (for example across 60 rpm to 180 rpm as in Chapter 4: Biomechanical Factors Associated with World-Class Track Sprint Cycling Performance) it is important to preserve filter characteristics across pedalling rates, in order to make reliable comparisons of joint kinetics. To address this issue a residual analysis was performed to determine how the frequency content within the signal altered in response to changes in pedalling rates. For this purpose kinematic data from maximal cycling at five different pedalling rates were used: 60 rpm, 90 rpm, 120 rpm, 150 rpm, 180 rpm (Figure 9). Figure 9. Residual Analyses comparing the optimal filter cut-off frequency at different pedalling rates. 121
122 The results of the residual analysis confirmed that the optimal cut-off frequency altered systematically with pedalling rate (Figure 9.). Therefore in order to preserve filter characteristics when observing joint power data across large changes in pedalling rates (e.g. Chapter 4: Biomechanical Factors Associated with World-Class Track Sprint Cycling Performance), cut-off frequencies were altered across pedalling rates. The cut-off frequencies were chosen by determining the cut-off frequencies that resulted in similar residuals across pedalling rates (Table 15.). Using this approach it is possible to reliably compare joint moment and power data across large changes in pedalling rate. Pedalling Rate Cut-Off Frequency Required for a Residual of (m) Actual Residual (m) Table 15. Variations in optimal cut-off frequencies across pedalling rates, as determined by residual analysis. 122
123 Prediction of Errors due to the Underestimation of Leg Mass in World-Class Track Sprint Cyclists World-class track sprint cyclists have significantly larger legs than the normal population (McLean & Parker 1989; Foley et al. 1989). Inverse dynamics analysis requires body segment parameter data in order to calculate joint powers. It is therefore necessary to quantify the effect of an underestimation of leg mass on joint power data, so that the reliability of inverse dynamics data on world-class track sprint cyclists can be assessed. For this purpose one dataset was used from a world-class track sprint cyclists performing maximal cycling at 120 rpm. The total leg mass was altered systematically by increasing the estimated mass of foot, shank and thigh segments (de Leva) in 10% increments up to a maximum underestimation of 50%. The location of the centre of mass and the moment of inertia were assumed to be remain unchanged. Joint powers errors are reported in relative terms (i.e. normalized to the absolute joint power) to provide appropriate context. 123
 and panel (B) are the same, only with Hip Flexion and Hip Transfer Flexion Power removed in panel (B) to provide clarity on the remaining joint powers.")
124 Figure 11. Predicted error (%) in joint power data due to underestimation of leg mass data. The data in panel (A) and panel (B) are the same, only with Hip Flexion and Hip Transfer Flexion Power removed in panel (B) to provide clarity on the remaining joint powers. The underestimation of leg mass had the largest effect in the actions of hip flexion and hip transfer power during flexion (Figure 11.). These joint actions had errors many orders of magnitude higher than the other joint actions (up to 2500%, (Figure 11.)). By comparison, underestimations of leg mass caused only small errors in the joint actions of ankle extension, ankle flexion, knee extension, knee flexion and hip extension. These joint actions had errors of 6% in response to an underestimation in leg mass of 50% (Figure 11.). 124
125 In summary, underestimation of leg mass can cause large errors in joint powers during the actions of hip flexion and hip transfer power during flexion. Thus, when analysing joint powers from world-class track sprint cyclists, data from these joint actions should be interpreted with caution. The remaining leg actions are far less sensitive to the underestimation of leg mass and so joint power data from world-class track sprint cyclists in these actions can be interpreted with confidence. 125
126 Research Ethics Approval Letters 126
127 127
128 128
129 129

130 Published Journal Papers 130

131 Conference Presentations 131
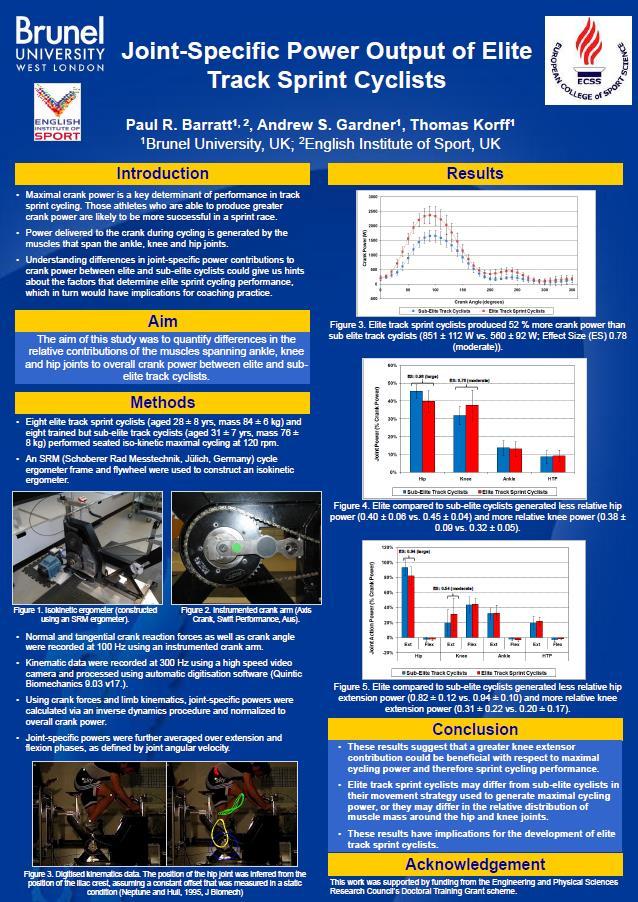
132 132
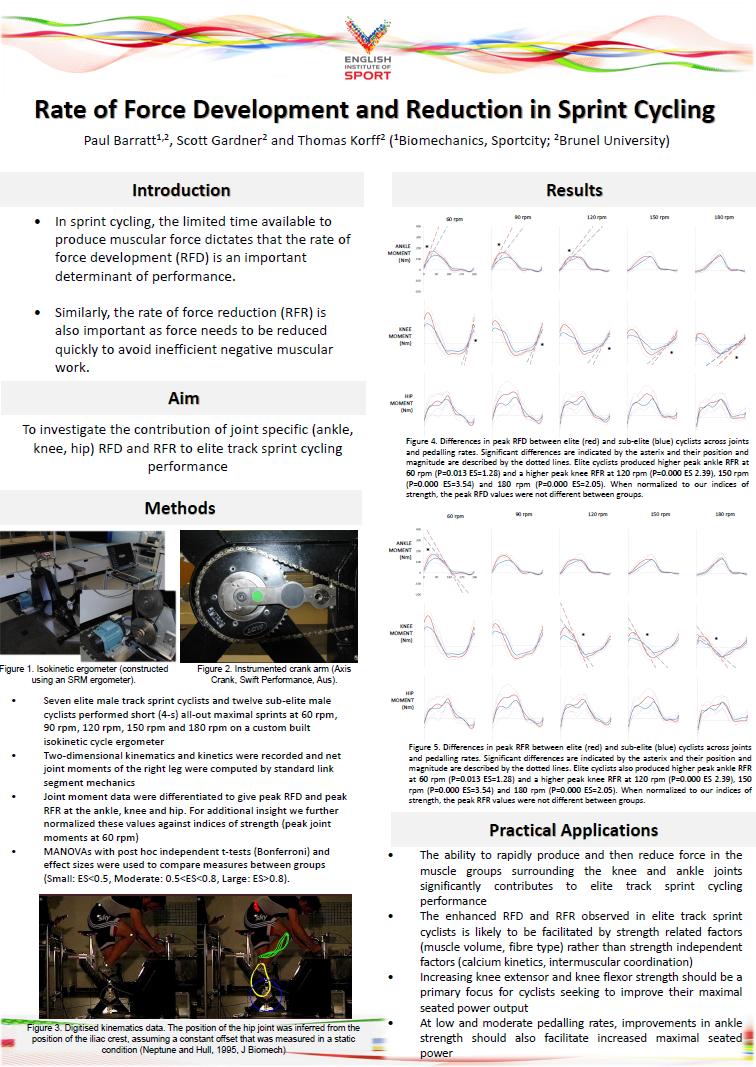
133 133
Myths and Science in Cycling
 Myths and Science in Cycling John McDaniel, PhD Kent State University Jim Martin, PhD - U of Utah Steve Elmer, PhD- Michigan Tech Who am I PhD in Exercise Physiology under Dr. Jim Martin at the University
Available online at Prediction of energy efficient pedal forces in cycling using musculoskeletal simulation models
 Available online at www.sciencedirect.com Engineering 2 00 (2010) (2009) 3211 3215 000 000 Engineering www.elsevier.com/locate/procedia 8 th Conference of the International Sports Engineering Association
Joint Torque Evaluation of Lower Limbs in Bicycle Pedaling
 11th conference of the International Sports Engineering Association, ISEA 216 Delft University of Technology; July 12 th Joint Torque Evaluation of Lower Limbs in Bicycle Pedaling Hiroki Yamazaki Akihiro
A Biomechanical Approach to Javelin. Blake Vajgrt. Concordia University. December 5 th, 2012
 A Biomechanical Approach to Javelin Blake Vajgrt Concordia University December 5 th, 2012 The Biomechanical Approach to Javelin 2 The Biomechanical Approach to Javelin Javelin is one of the four throwing
Artifacts Due to Filtering Mismatch in Drop Landing Moment Data
 Camenga et al. UW-L Journal of Undergraduate Research XVI (213) Artifacts Due to Filtering Mismatch in Drop Landing Moment Data Elizabeth T. Camenga, Casey J. Rutten, Brendan D. Gould, Jillian T. Asmus,
A Novel Gear-shifting Strategy Used on Smart Bicycles
 2012 International Conference on Industrial and Intelligent Information (ICIII 2012) IPCSIT vol.31 (2012) (2012) IACSIT Press, Singapore A Novel Gear-shifting Strategy Used on Smart Bicycles Tsung-Yin
Simulation-based design to reduce metabolic cost
 Simulation-based design to reduce metabolic cost Overview: Lecture + Hands On Exercise 1. Generating and evaluating a muscledriven simulation of walking 2. Metabolics 101 3. Designing and evaluating devices
COMPARISON OF BIOMECHANICAL DATA OF A SPRINT CYCLIST IN THE VELODROME AND IN THE LABORATORY
 COMPARISON OF BIOMECHANICAL DATA OF A SPRINT CYCLIST IN THE VELODROME AND IN THE LABORATORY Louise Burnie 1,2, Paul Barratt 3, Keith Davids 1, Paul Worsfold 2,4, Jon Wheat 1 Centre for Sports Engineering
An investigation of kinematic and kinetic variables for the description of prosthetic gait using the ENOCH system
 An investigation of kinematic and kinetic variables for the description of prosthetic gait using the ENOCH system K. OBERG and H. LANSHAMMAR* Amputee Training and Research Unit, University Hospital, Fack,
GROUND REACTION FORCE DOMINANT VERSUS NON-DOMINANT SINGLE LEG STEP OFF
 GROUND REACTION FORCE DOMINANT VERSUS NON-DOMINANT SINGLE LEG STEP OFF Sara Gharabaghli, Rebecca Krogstad, Sara Lynch, Sofia Saavedra, and Tamara Wright California State University, San Marcos, San Marcos,
Analysis of ankle kinetics and energy consumption with an advanced microprocessor controlled ankle foot prosthesis.
 Analysis of ankle kinetics and energy consumption with an advanced microprocessor controlled ankle foot prosthesis. D.Moser, N.Stech, J.McCarthy, G.Harris, S.Zahedi, A.McDougall Summary This study reports
+ t1 t2 moment-time curves
 Part 6 - Angular Kinematics / Angular Impulse 1. While jumping over a hurdle, an athlete s hip angle was measured to be 2.41 radians. Within 0.15 seconds, the hurdler s hip angle changed to be 3.29 radians.
The overarching aim of the work presented in this thesis was to assess and
 CHAPTER 7 EPILOGUE Chapter 7 The overarching aim of the work presented in this thesis was to assess and understand the effort for balance control in terms of the metabolic cost of walking in able-bodied
INTERACTION OF STEP LENGTH AND STEP RATE DURING SPRINT RUNNING
 INTERACTION OF STEP LENGTH AND STEP RATE DURING SPRINT RUNNING Joseph P. Hunter 1, Robert N. Marshall 1,, and Peter J. McNair 3 1 Department of Sport and Exercise Science, The University of Auckland, Auckland,
INVESTIGATION OF POWER OUTPUT ON A NOVEL BICYCLE DRIVE IN COMPARISON WITH THE COMMON BICYCLE DRIVE
 117 Biomechanics Symposia 2001 / University of San Francisco INVESTIGATION OF POWER OUTPUT ON A NOVEL BICYCLE DRIVE IN COMPARISON WITH THE COMMON BICYCLE DRIVE T. Angeli and R. Pawlik Institute for Machine
Pedaling effectiveness. Jon Iriberri & Javier Sola WKO4
 Pedaling effectiveness Jon Iriberri & Javier Sola WKO4 About us Jon Iriberri @iriberrijon ceo@custom4.us Javier Sola @jsolalo jsola@training4ll.com 2 Usefull & useless forces Osorio Valencia 2007 Tangential
Gait. Kinesiology RHS 341 Lecture 12 Dr. Einas Al-Eisa
 Gait Kinesiology RHS 341 Lecture 12 Dr. Einas Al-Eisa Definitions Locomotion = the act of moving from one place to the other Gait = the manner of walking Definitions Walking = a smooth, highly coordinated,
KICKBIKE Your key to optimum sports performance
 KICKBIKE Your key to optimum sports performance Efficient Running is essential to optimum performance of most sports we play. Whether we want to maximize our speed, maximize our endurance, or both, an
Outline. Newton's laws of motion What is speed? The technical and physical demands of speed Speed training parameters Rugby specific speed training
 Linear speed Outline Newton's laws of motion What is speed? The technical and physical demands of speed Speed training parameters Rugby specific speed training Outline Session structure Teaching guidelines
Muscular and non-muscular contributions to maximum power cycling in children and adults: implications for developmental motor control
 599 The Journal of Experimental Biology 212, 599-63 Published by The Company of Biologists 29 doi:1.1242/jeb.218 Muscular and non-muscular contributions to maximum power cycling in children and adults:
The Starting Point. Prosthetic Alignment in the Transtibial Amputee. Outline. COM Motion in the Coronal Plane
 Prosthetic Alignment in the Transtibial Amputee The Starting Point David C. Morgenroth, MD, Department of Rehabilitation Medicine University of Washington VAPSHCS Outline COM Motion in the Coronal Plane
Posture influences ground reaction force: implications for crouch gait
 University of Tennessee, Knoxville From the SelectedWorks of Jeffrey A. Reinbolt July 14, 2010 Posture influences ground reaction force: implications for crouch gait H. X. Hoang Jeffrey A. Reinbolt, University
A New Approach to Modeling Vertical Stiffness in Heel-Toe Distance Runners
 Brigham Young University BYU ScholarsArchive All Faculty Publications 2003-12-01 A New Approach to Modeling Vertical Stiffness in Heel-Toe Distance Runners Iain Hunter iain_hunter@byu.edu Follow this and
Critical Factors in the Shot Put
 Critical Factors in the Shot Put Operational Terminology By Michael Young Louisiana State University Flight phase: The duration of time where the athlete is moving towards the front of the throwing circle
EXSC 408L Fall '03 Problem Set #2 Linear Motion. Linear Motion
 Problems: 1. Once you have recorded the calibration frame for a data collection, why is it important to make sure the camera does not shut off? hat happens if the camera automatically shuts off after being
Current issues regarding induced acceleration analysis of walking using the integration method to decompose the GRF
 Current issues regarding induced acceleration analysis of walking using the integration method to decompose the GRF George Chen May 17, 2002 Stanford Neuromuscular Biomechanics Lab Group Muscle contribution
Define terms and compute basic physics problems related to sprinting
 LINEAR SPEED AN INTRODUCTION TO ACCELERATION LEARNING OBJECTIVES Define terms and compute basic physics problems related to sprinting Identify and explain how specific kinematic and kinetic elements relate
Biomechanics of extreme sports a kite surfing scenario
 Biomechanics of extreme sports a kite surfing scenario Lundgren, L1, Olandersson, S1, Hilliges M1, Osvalder, A-L2 1 Product Development in Healthcare, PRODEA research group, Halmstad University, Halmstad,
CHAPTER IV FINITE ELEMENT ANALYSIS OF THE KNEE JOINT WITHOUT A MEDICAL IMPLANT
 39 CHAPTER IV FINITE ELEMENT ANALYSIS OF THE KNEE JOINT WITHOUT A MEDICAL IMPLANT 4.1 Modeling in Biomechanics The human body, apart of all its other functions is a mechanical mechanism and a structure,
Normal and Abnormal Gait
 Normal and Abnormal Gait Adrielle Fry, MD EvergreenHealth, Division of Sport and Spine University of Washington Board Review Course March 6, 2017 What are we going to cover? Definitions and key concepts
Biomechanics and Models of Locomotion
 Physics-Based Models for People Tracking: Biomechanics and Models of Locomotion Marcus Brubaker 1 Leonid Sigal 1,2 David J Fleet 1 1 University of Toronto 2 Disney Research, Pittsburgh Biomechanics Biomechanics
Steffen Willwacher, Katina Fischer, Gert Peter Brüggemann Institute of Biomechanics and Orthopaedics, German Sport University, Cologne, Germany
 P01-3 ID126 SURFACE STIFFNESS AFFECTS JOINT LOADING IN RUNNING Steffen Willwacher, Katina Fischer, Gert Peter Brüggemann Institute of Biomechanics and Orthopaedics, German Sport University, Cologne, Germany
A bit of background. Session Schedule 3:00-3:10: Introduction & session overview. Overarching research theme: CPTA
 A Cognitive-Biomechanical Perspective for the Management of Common Chronic Musculoskeletal Conditions Skulpan Asavasopon, PT, PhD Loma Linda University Christopher M. Powers, PT, PhD, FAPTA University
by Michael Young Human Performance Consulting
 by Michael Young Human Performance Consulting The high performance division of USATF commissioned research to determine what variables were most critical to success in the shot put The objective of the
video Purpose Pathological Gait Objectives: Primary, Secondary and Compensatory Gait Deviations in CP AACPDM IC #3 1
 s in CP Disclosure Information AACPDM 71st Annual Meeting September 13-16, 2017 Speaker Names: Sylvia Ounpuu, MSc and Kristan Pierz, MD Differentiating Between, Secondary and Compensatory Mechanisms in
Serve the only stroke in which the player has full control over its outcome. Bahamonde (2000) The higher the velocity, the smaller the margin of
 The higher the velocity, the smaller the margin of") Lower Extremity Performance of Tennis Serve Reporter: Chin-Fu Hsu Adviser: Lin-Hwa Wang OUTLINE Introduction Kinetic Chain Serve Types Lower Extremity Movement Summary Future Work INTRODUCTION Serve the
Lower Extremity Performance of Tennis Serve Reporter: Chin-Fu Hsu Adviser: Lin-Hwa Wang OUTLINE Introduction Kinetic Chain Serve Types Lower Extremity Movement Summary Future Work INTRODUCTION Serve the
Aerodynamic study of a cyclist s moving legs using an innovative approach
 Aerodynamic study of a cyclist s moving legs using an innovative approach Francesco Pozzetti 30 September 2017 Abstract During a period of four weeks in September, I completed a research project in fluid
The Physical and Physiological Characteristics of 3x3. Results of Medical Study & Scientific Test
 The Physical and Physiological Characteristics of 3x3 Results of Medical Study & Scientific Test Prepared by Dr. Paul Montgomery & Brendan Maloney (Aspetar Orthopaedic Hospital) In cooperation with FIBA
ASSISTED AND RESISTED METHODS FOR SPEED DEVELOPMENT (PART 1)
") ASSISTED AND RESISTED METHODS FOR SPEED DEVELOPMENT (PART 1) By Adrian Faccioni Adrian Faccioni, a lecturer at the Centre of Sports Studies, University of Canberra, Australia, presents a detailed evaluation
ASSISTED AND RESISTED METHODS FOR SPEED DEVELOPMENT (PART 1) By Adrian Faccioni Adrian Faccioni, a lecturer at the Centre of Sports Studies, University of Canberra, Australia, presents a detailed evaluation
Biomechanical analysis of the medalists in the 10,000 metres at the 2007 World Championships in Athletics
 STUDY Biomechanical analysis of the medalists in the 10,000 metres at the 2007 World Championships in Athletics by IAAF 23:3; 61-66, 2008 By Yasushi Enomoto, Hirosuke Kadono, Yuta Suzuki, Tetsu Chiba,
In memory of Dr. Kevin P. Granata, my graduate advisor, who was killed protecting others on the morning of April 16, 2007.
 Acknowledgement In memory of Dr. Kevin P. Granata, my graduate advisor, who was killed protecting others on the morning of April 16, 2007. There are many others without whom I could not have completed
Rugby Strength Coach. Speed development guide
 Rugby Strength Coach Speed development guide Outline Why do Newton's laws of motion matter? What is speed? The technique and physical demands of speed Speed training parameters Rugby specific speed training
Coaching the Triple Jump Boo Schexnayder
 I. Understanding the Event A. The Run and Its Purpose B. Hip Undulation and the Phases C. Making the Connection II. III. IV. The Approach Run A. Phases B. Technical Features 1. Posture 2. Progressive Body
USA Track & Field Heptathlon Summit- November
 USA Track & Field Heptathlon Summit- November 1994 1 I. Technical considerations in the sprint hurdles Practical Biomechanics For the 100m Hurdles By Gary Winckler University of Illinois A. General flow
Control Strategies for operation of pitch regulated turbines above cut-out wind speeds
 Control Strategies for operation of pitch regulated turbines above cut-out wind speeds Helen Markou 1 Denmark and Torben J. Larsen, Risø-DTU, P.O.box 49, DK-4000 Roskilde, Abstract The importance of continuing
Chapter I examines the anthropometric and physiological factors that. determine success in sport. More specifically it discusses the somatotype
 CHAPTER 1 INTRODUCTION Chapter I examines the anthropometric and physiological factors that determine success in sport. More specifically it discusses the somatotype ratings, VO 2 max and running economy
Coaching the Hurdles
 Coaching the Hurdles Monica Gary, Sprints & Hurdles Coach Purdue University Important components to consider in hurdle training: a. Rhythm for the hurdler is the primary concern for the coach -short rhythm
A Pilot Study on Electromyographic Analysis of Single and Double Revolution Jumps in Figure Skating
 Journal of Exercise Science and Physiotherapy, Vol. 5, No. 1: 14-19, 2009 A Pilot Study on Electromyographic Analysis of Single and Double Revolution Jumps in Figure Skating Taylor¹, C. L. and Psycharakis²,
Denny Wells, Jacqueline Alderson, Kane Middleton and Cyril Donnelly
 11:45 am-12:00 pm Denny Wells. Assessing the accuracy of inverse kinematics in OpenSim to estimate elbow flexionextension during cricket bowling: Maintaining the rigid linked assumption. (201) ASSESSING
Positive running posture sums up the right technique for top speed
 Positive running, a model for high speed running Frans Bosch positive running posture sums up the right technique for top speed building blocks in running: Pelvic rotation for- and backward and hamstring
Identify and explain how specific kinematic and kinetic elements relate to the absolute speed technical model
 LINEAR SPEED: ABSOLUTE SPEED THEORY AND APPLICATION LEARNING OBJECTIVES Identify and explain how specific kinematic and kinetic elements relate to the absolute speed technical model Recognize the coaching
The Effect of a Seven Week Exercise Program on Golf Swing Performance and Musculoskeletal Screening Scores
 The Effect of a Seven Week Exercise Program on Golf Swing Performance and Musculoskeletal Screening Scores 2017 Mico Hannes Olivier Bachelor of Sport Science Faculty of Health Sciences and Medicine Bond
PIG MOTION AND DYNAMICS IN COMPLEX GAS NETWORKS. Dr Aidan O Donoghue, Pipeline Research Limited, Glasgow
 PIG MOTION AND DYNAMICS IN COMPLEX GAS NETWORKS Dr Aidan O Donoghue, Pipeline Research Limited, Glasgow A model to examine pigging and inspection of gas networks with multiple pipelines, connections and
REPORT. A comparative study of the mechanical and biomechanical behaviour of natural turf and hybrid turf for the practise of sports
 REPORT A comparative study of the mechanical and biomechanical behaviour of natural turf and hybrid turf for the practise of sports Addressed to: PSF - PALAU TURF Date: May 2015 Table of Contents SHEET
Goodyear Safety Research Project 2008 Presentation by Competitive Measure at the FEI Eventing Safety Forum. Presented by Tim Deans and Martin Herbert
 Goodyear Safety Research Project 2008 Presentation by Competitive Measure at the FEI Eventing Safety Forum Presented by Tim Deans and Martin Herbert The presentation discusses the Goodyear Safety Research
Effect of Pedaling Technique on Mechanical Effectiveness and Efficiency in Cyclists
 Biodynamics Effect of Pedaling Technique on Mechanical Effectiveness and Efficiency in Cyclists THOMAS KORFF 1, LEE M. ROMER 1, IAN MAYHEW 1, and JAMES C. MARTIN 2 1 Brunel University, Centre for Sports
Muscle force redistributes segmental power for body progression during walking
 Gait and Posture 19 (2004) 194 205 Muscle force redistributes segmental power for body progression during walking R.R. Neptune a,b,, F.E. Zajac b,c,d, S.A. Kautz b,e,f,g a Department of Mechanical Engineering,
The Mechanics of Modern BREASTSTROKE Swimming Dr Ralph Richards
 The Mechanics of Modern BREASTSTROKE Swimming Dr Ralph Richards Breaststroke is the least efficient of the four competition strokes because a large amount of water resistance is created due to body position
Optimization of an off-road bicycle with four-bar linkage rear suspension
 Proceedings of MUSME 2008, the International Symposium on Multibody Systems and Mechatronics San Juan (Argentina), 8-12 April 2008 Paper n. 02-MUSME08 Optimization of an off-road bicycle with four-bar
A REVIEW OF AGE ADJUSTMENT FOR MASTERS SWIMMERS
 A REVIEW OF ADJUSTMENT FOR MASTERS SWIMMERS Written by Alan Rowson Copyright 2013 Alan Rowson Last Saved on 28-Apr-13 page 1 of 10 INTRODUCTION In late 2011 and early 2012, in conjunction with Anthony
A QUALITATIVE ANALYSIS OF THE HIGH RACQUET POSITION BACKHAND DRIVE OF AN ELITE RACQUETBALL PLAYER
 A QUALITATIVE ANALYSIS OF THE HIGH RACQUET POSITION BACKHAND DRIVE OF AN ELITE RACQUETBALL PLAYER John R. Stevenson Wayne P. Hollander Since 1950, when Joe Sobek put strings on his paddleball paddle, the
110m Hurdle Theory and Technique
 110m Hurdle Theory and Technique Ralph Lindeman Head Track Coach, U.S. Air Force Academy Men's Hurdle Development Chairman, USATF WANTED: Highly motivated sprinters to attempt one of track & field's most
The Discus. By Al Fereshetian. Nature of the Event
 11 The Discus By Al Fereshetian Nature of the Event Because of the numerous diverse qualities necessary for success, the discus throw is one of the most complex events in all of track and field. Discus
Neurorehabil Neural Repair Oct 23. [Epub ahead of print]
![Neurorehabil Neural Repair Oct 23. [Epub ahead of print]](/thumbs/86/94477916.jpg "Neurorehabil Neural Repair Oct 23. [Epub ahead of print]") APPENDICE Neurorehabil Neural Repair. 2009 Oct 23. [Epub ahead of print] Segmental Muscle Vibration Improves Walking in Chronic Stroke Patients With Foot Drop: A Randomized Controlled Trial. Paoloni M,
APPENDICE Neurorehabil Neural Repair. 2009 Oct 23. [Epub ahead of print] Segmental Muscle Vibration Improves Walking in Chronic Stroke Patients With Foot Drop: A Randomized Controlled Trial. Paoloni M,
Australia. Australia
 C2-3 ID97 IT S ABOUT HOW WELL YOU USE IT: SKATING STRIDE IN NOVICE, INTERMEDIATE AND ADVANCED INLINE SKATERS Lucy Parrington 1,2, Paul Grimshaw 3 and Alec Buttfield 4 1 College of Sport and Exercise Science,
The importance of physical activity throughout an individual's life is indisputable. As healthcare
 What to Expect When They re Expecting: A Look at Biomechanical Changes in Walking/Running During Pregnancy Jennifer Bruer-Vandeweert, Megan Hotchkiss, Jamie Kronenberg, Kristin Olson Dr. Rumit Singh Kakar,
Predictive Dynamic Simulation of Seated Start-Up Cycling Using Olympic Cyclist and Bicycle Models
 Proceedings Predictive Dynamic Simulation of Seated Start-Up Cycling Using Olympic Cyclist and Bicycle Models Conor Jansen * and John McPhee Systems Design Engineering, University of Waterloo, Waterloo,
Center of Mass Acceleration as a Surrogate for Force Production After Spinal Cord Injury Effects of Inclined Treadmill Walking
 Center of Mass Acceleration as a Surrogate for Force Production After Spinal Cord Injury Effects of Inclined Treadmill Walking Mark G. Bowden, PhD, PT Research Health Scientist, Ralph H. Johnson VA Medical
CHAP Summary 8 TER 155
 CHAPTER 8 Summary 155 SUMMARY Feral horses are social animals, which have adopted early predator detection and flight as their prime defence mechanisms. They rely on survival strategies centered on the
The Block Start and Accerlartion. Loren Seagrave Director of Track & Field and Cross Country Director of Speed and Movement
 The Block Start and Accerlartion Loren Seagrave Director of Track & Field and Cross Country Director of Speed and Movement Phases of Acceleration (Linear) The Start Greatest Rate of Acceleration Pure Acceleration
A STUDY OF THE LOSSES AND INTERACTIONS BETWEEN ONE OR MORE BOW THRUSTERS AND A CATAMARAN HULL
 A STUDY OF THE LOSSES AND INTERACTIONS BETWEEN ONE OR MORE BOW THRUSTERS AND A CATAMARAN HULL L Boddy and T Clarke, Austal Ships, Australia SUMMARY CFD analysis has been conducted on a 100m catamaran hull
Supplementary Figure S1
 Supplementary Figure S1: Anterior and posterior views of the marker set used in the running gait trials. Forty-six markers were attached to the subject (15 markers on each leg, 4 markers on each arm, and
HPA Power Transmission. Everardo Uribe
 HPA Power Transmission There are several forces the HPA has to overcome, most of these forces will have to be overcome by the power transmission component. The main force will of course be aerodynamic
Assessments SIMPLY GAIT. Posture and Gait. Observing Posture and Gait. Postural Assessment. Postural Assessment 6/28/2016
 Assessments 2 SIMPLY GAIT Understanding movement Evaluations of factors that help therapist form professional judgments Include health, palpatory, range of motion, postural, and gait assessments Assessments
Modelling the stance leg in 2D analyses of sprinting: inclusion of the MTP joint affects joint
 1 Technical Note 2 3 4 5 Title: Modelling the stance leg in 2D analyses of sprinting: inclusion of the MTP joint affects joint kinetics (corrected version) 6 7 8 9 10 11 Authors: Neil E. Bezodis a,b, Aki
Complex movement patterns of a bipedal walk
 1 Complex movement patterns of a bipedal walk Objectives After completing this lesson, you will be able to: Describe the complex movement patterns of a bipedal walk. Describe the biomechanics of walking
Putting Report Details: Key and Diagrams: This section provides a visual diagram of the. information is saved in the client s database
 Quintic Putting Report Information Guide Putting Report Details: Enter personal details of the client or individual who is being analysed; name, email address, date, mass, height and handicap. This information
ARE YOU A SLOW- OR A FAST-TWITCH RUNNER?
 ARE YOU A SLOW- OR A FAST-TWITCH RUNNER? How can we individualize our training towards our different goals based on our muscular makeup? In this article you will learn how to decide if you are a Fast-twitch,
Does Ski Width Influence Muscle Action in an Elite Skier? A Case Study. Montana State University Movement Science Laboratory Bozeman, MT 59717
 Does Ski Width Influence Muscle Action in an Elite Skier? A Case Study John G. Seifert 1, Heidi Nunnikhoven 1, Cory Snyder 1, Ronald Kipp 2 1 Montana State University Movement Science Laboratory Bozeman,
Acoustical Modeling of Reciprocating Compressors With Stepless Valve Unloaders
 Acoustical Modeling of Reciprocating Compressors With Stepless Valve Unloaders Kelly Eberle, P.Eng. Principal Engineer keberle@betamachinery.com Brian C. Howes, M.Sc., P.Eng. Chief Engineer bhowes@betamachinery.com
CHAPTER THREE METHODOLOGY
 CHAPTER THREE METHODOLOGY Subjects A total of twelve, male, students, and studying sport at the University of Wales, Institute Cardiff (UWIC), and members of the university cricket squad participated in
Analysis of performance at the 2007 Cricket World Cup
 Analysis of performance at the 2007 Cricket World Cup Petersen, C., Pyne, D.B., Portus, M.R., Cordy, J. and Dawson, B Cricket Australia, Department of Physiology, Australian Institute of Sport, Human Movement,
Assessment of an International Breaststroke Swimmer Using a Race Readiness Test
 International Journal of Sports Physiology and Performance, 2009, 4, 139-143 2009 Human Kinetics, Inc. Assessment of an International Breaststroke Swimmer Using a Race Readiness Test Kevin G. Thompson
Kinematic Differences between Set- and Jump-Shot Motions in Basketball
 Proceedings Kinematic Differences between Set- and Jump-Shot Motions in Basketball Hiroki Okubo 1, * and Mont Hubbard 2 1 Department of Advanced Robotics, Chiba Institute of Technology, 2-17-1 Tsudanuma,
Human hoppers compensate for simultaneous changes in surface compression and damping
 Journal of Biomechanics 39 (2006) 1030 1038 www.elsevier.com/locate/jbiomech www.jbiomech.com Human hoppers compensate for simultaneous changes in surface compression and damping Chet T. Moritz a,b,, Claire
Motion Control of a Bipedal Walking Robot
 Motion Control of a Bipedal Walking Robot Lai Wei Ying, Tang Howe Hing, Mohamed bin Hussein Faculty of Mechanical Engineering Universiti Teknologi Malaysia, 81310 UTM Skudai, Johor, Malaysia. Wylai2@live.my
Proposed Paralympic Classification System for Va a Information for National federations and National Paralympic Committees
 Proposed Paralympic Classification System for Va a Information for National federations and National Paralympic Committees Prepared by the research team Johanna Rosén, MSc, PhD student, member Paracanoe
Biomechanics and the Rules of Race Walking. Brian Hanley
 Biomechanics and the Rules of Race Walking Brian Hanley Biomechanics and the Rules of Race Walking Brian Hanley b.hanley@leedsmet.ac.uk www.evaa.ch The rules and judging Judging is probably the most contentious
-Elastic strain energy (duty factor decreases at higher speeds). Higher forces act on feet. More tendon stretch. More energy stored in tendon.
. Higher forces act on feet. More tendon stretch. More energy stored in tendon.") As velocity increases ( ) (i.e. increasing Froude number v 2 / gl) the component of the energy cost of transport associated with: -Internal kinetic energy (limbs accelerated to higher angular velocity).
As velocity increases ( ) (i.e. increasing Froude number v 2 / gl) the component of the energy cost of transport associated with: -Internal kinetic energy (limbs accelerated to higher angular velocity).
Running injuries - what are the most important factors
 Created as a free resource by Clinical Edge Based on Physio Edge podcast 59 with Greg Lehman, Tom Goom and Dr Christian Barton Get your free trial of online Physio education at Why do runners get injured?
video Outline Pre-requisites of Typical Gait Case Studies Case 1 L5 Myelomeningocele Case 1 L5 Myelomeningocele
 Outline Evaluation of Orthosis Function in Children with Neuromuscular Disorders Using Motion Analysis Outcomes Terminology Methods Typically developing Case examples variety of pathologies Sylvia Õunpuu,
wj net work done by the jth joint (j = 1,2,3,4,5,6), J W extra, net work done beyond external work (intercompensated),
, J W extra, net work done beyond external work (intercompensated),") Pergamon J. Biomechanics, Vol. 21, No. 12, pp. 1459-1467, 1994 Copyright 0 1994 Elscvier Science Ltd Printed 0021-9290(94)EOO19-Y in Great Britain. All rights -cd @X-9290/94 S7.00+.00 A COMPARISON OF MUSCULAR
Pergamon J. Biomechanics, Vol. 21, No. 12, pp. 1459-1467, 1994 Copyright 0 1994 Elscvier Science Ltd Printed 0021-9290(94)EOO19-Y in Great Britain. All rights -cd @X-9290/94 S7.00+.00 A COMPARISON OF MUSCULAR
Using GPOPS-II to optimize sum of squared torques of a double pendulum as a prosthesis leg. Abstract
 Using GPOPS-II to optimize sum of squared torques of a double pendulum as a prosthesis leg Abstract Milad Zarei MCE 593 Prosthesis Design & Control A two-dimensional, two links pendulum is developed to
Despite the high speeds that can be reached using
 SPECIAL COMMUNICATIONS Technical Note Ice friction in speed skating: can klapskates reduce ice frictional loss? HAN HOUDIJK, ARJEN J. WIJKER, JOS J. DE KONING, MAARTEN F. BOBBERT, and GERT DE GROOT Institute
COMPARISON STUDY BETWEEN THE EFFICIENY OF THE START TECHNIQUES IN THE ROMANIAN COMPETITIVE SWIMMING
 Bulletin of the Transilvania University of Braşov Series IX: Sciences of Human Kinetics Vol. 6 (55) No. 1 2013 COMPARISON STUDY BETWEEN THE EFFICIENY OF THE START TECHNIQUES IN THE ROMANIAN COMPETITIVE
BIOMECHANICAL MOVEMENT
 SECTION PART 5 5 CHAPTER 12 13 CHAPTER 12: Biomechanical movement Practice questions - text book pages 169-172 1) For which of the following is the athlete s centre of mass most likely to lie outside of
Competitive Performance of Elite Olympic-Distance Triathletes: Reliability and Smallest Worthwhile Enhancement
 SPORTSCIENCE sportsci.org Original Research / Performance Competitive Performance of Elite Olympic-Distance Triathletes: Reliability and Smallest Worthwhile Enhancement Carl D Paton, Will G Hopkins Sportscience
Sprinting: A Biomechanical Approach By Tom Tellez
 Sprinting: A Biomechanical Approach By Tom Tellez World class male sprinters stride approximately forty-three times for a 100 meter race. If a mechanical error costs one-one thousandth of a second per
PUBLISHED PROJECT REPORT PPR850. Optimisation of water flow depth for SCRIM. S Brittain, P Sanders and H Viner
 PUBLISHED PROJECT REPORT PPR850 Optimisation of water flow depth for SCRIM S Brittain, P Sanders and H Viner Report details Report prepared for: Project/customer reference: Copyright: Highways England,
INVESTIGATIONS OF THE STEP LENGTH-STEP FREQUENCY RELATIONSHIP IN SPRINTING: APPLIED IMPLICATIONS FOR PERFORMANCE. Ian Bezodis
 Wednesday 1:15-2:15 pm Dr. Ian Bezodis, University of Wales Institute Cardiff, Cardiff, Wales. Investigations of the step length-step frequency relationship in sprinting: Applied implications for performance.