350 SPARKS STREET, OTTAWA HOTEL AND RESIDENTIAL DEVELOPMENT. Transportation Study. Prepared For: Morguard Real Estate Investment Trust.
|
|
|
- Francine Wilson
- 5 years ago
- Views:
Transcription

1 SPARKS STREET, OTTAWA HOTEL AND RESIDENTIAL DEVELOPMENT Transportation Study Prepared For: Morguard Real Estate Investment Trust June,
2 BA Consulting Group Ltd. St. Clair Avenue West, Suite Toronto, ON MV K

3 June, Brian Athey Vice President Morguard Real Estate Investment Trust City Centre Drive, Suite Mississauga, ON LB M RE: Sparks Street, Ottawa Hotel and Residential Development Transportation Study Dear Mr. Athey: We are pleased to provide this Transportation Study report for Sparks Street, which covers our review of various transportation elements for the redevelopment of this site. This report has been prepared in support of the Site Plan Application for the subject lands. If you have any questions regarding this study, please do not hesitate to contact the undersigned. Sincerely, BA Consulting Group Ltd. Stephen J. Bahadoor, P.Eng Transportation Engineer Vincent Cudia, C.E.T. Senior Associate BA Consulting Group Ltd. MOVEMENT St. Clair Ave. W TEL 7 IN URBAN Toronto ON MV K bagroup@bagroup.com ENVIRONMENTS BAGROUP.COM P:\8\\\Report\ Sparks Street - Cover Letter and Brief check list - june--.docx
4 TRANSPORTATION BRIEF CHECKLIST This transportation brief check list has been prepared for the submission of the Sparks Street Hotel and Residential Development Transportation Study (June ). Provided below is a list key items covered in the City of Ottawa s TIA guidelines. Where an item has not been explicitly covered in this report, the reasons behind this omission are provided. Report Context. Municipal address:_. Location relative to major elements of the existing transportation system:. Existing land uses or permitted use provisions in the Official Plan, Zoning By-law, etc:. Proposed land uses and relevant planning regulations to be used in the analysis:. Proposed development size and location on site:. Estimated date of occupancy: 7. Planned phasing of development: 8. Proposed number of parking spaces:. Proposed access points and type of access:. Study area:. Time periods and phasing:. Horizon years (include reference to phased development): Forecast traffic volumes were the addition of site traffic to traffic as discussed with City staff. Existing Conditions. Existing roads and ramps in the study area, including jurisdiction, classification, number of lanes, and posted speed limit;. Existing intersections, indicating type of control, lane configurations, turning restrictions, and any other relevant data (e.g., extraordinary lane widths, grades, etc.);. Existing access points to adjacent developments (both sides of all roads bordering the site);. Existing transit system, including stations and stops;. Existing on- and off-road bicycle facilities and pedestrian sidewalks and pathway networks;. Existing system operations (V/C, LOS) 7. Major trip generators/ attractors within the Study Area should be indicated Demand Forecasting. General background growth: See Report Context Item. Other study area developments: See Report Context Item. Changes to the study area road network:. Future background system operations (V/C, LOS, queue lengths): See Report Context Item. include figures documenting future background travel demands by mode for each horizon year. Trip generation rates: 7. Trip distribution and assignment: MOVEMENT IN URBAN ENVIRONMENTS BAGROUP.COM
5 Impact Analysis. future system operations (V/C, LOS, queue lengths);_. Signal and auxiliary lane (device) warrants:. Operational/ safety assessment (e.g., sight line assessment where grades are an issue):. Storage analysis for closely spaced intersections:. Pedestrian and bicycle network connections and continuity:. On-site circulation and design: 7. Potential for neighbourhood impacts and TDM: CTS Impact Analysis. Network Capacity Analysis:. Non-auto network connections and continuity:. Potential for community impacts, and TDM:. Synchro Files: Will be sent on request via . Screenline Analysis: The scale of the project is not anticipated to have substantial overall network impacts MOVEMENT IN URBAN ENVIRONMENTS BAGROUP.COM
6 TABLE OF CONTENTS. INTRODUCTION.... EXISTING CONDITIONS.... Existing Site Conditions..... Site Access, Parking and Loading..... Parking Garage.... Area Transportation Context.... Road Network.... Transit Facilities.... Cycling and Pedestrian Facilities.... Existing Traffic Volumes....7 Existing Operations Methodology Saturation Flow Signal Timing Plans Analysis Results.... PLANNED TRANSPORTATION INFRASTRUCTURE.... Confederation Line.... Queen Street Renewal Project Bike Share Program SITE PLAN Development Program Site Access, Parking and Loading Site Access, Parking and Pick-Up Drop-Off Loading Areas DEMAND FORECASTING.... Background Traffic Growth.... Site Trip Generation..... Office Trip Generation..... Apartment Trip Generation..... Hotel Trip Generation.... Trip Distribution and Assignment.... FUTURE TRAFFIC OPERATIONS.... Capacity Analysis..... Queuing Review Sparks Street... SPARKS STREET - TRANSPORTATION STUDY JUNE, 8- P:\8\\\Report\ Sparks - Transportation Study - June--.docx
7 7. FINDINGS AND RECOMMENDATIONS... 7 LIST OF TABLES Table HCM Level of Service... Table Capacity Analysis Summary - Existing Traffic Operations... Table Site Traffic Generation... Table Overall Trip Distribution Pattern... Table Capacity Analysis Summary Future Traffic Operations (Area Road Network As-Is)... Table Queuing Review Sparks Street... TABLE OF APPENDICES APPENDIX A: APPENDIX B: APPENDIX C: APPENDIX D: APPENDIX E: APPENDIX F: APPENDIX G: Context Figures Traffic Volume Figures Turning Movement Data Existing Traffic Operations Capacity Analysis Sheets Vehicle Manoeuvring As of Right Comparison, Mode Split and Routing Future Traffic Operations Capacity Analysis Sheets SPARKS STREET - TRANSPORTATION STUDY JUNE, 8- P:\8\\\Report\ Sparks - Transportation Study - June--.docx
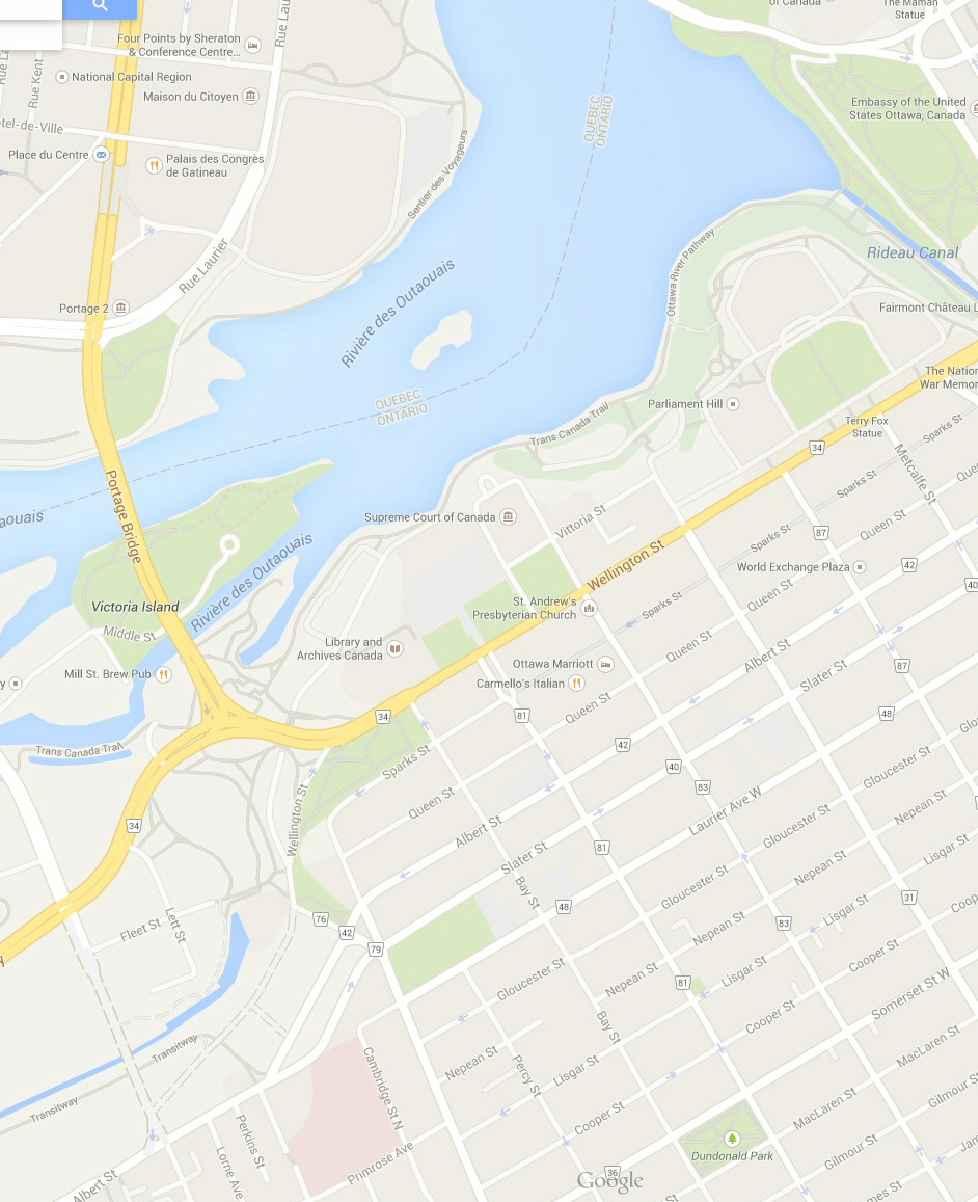
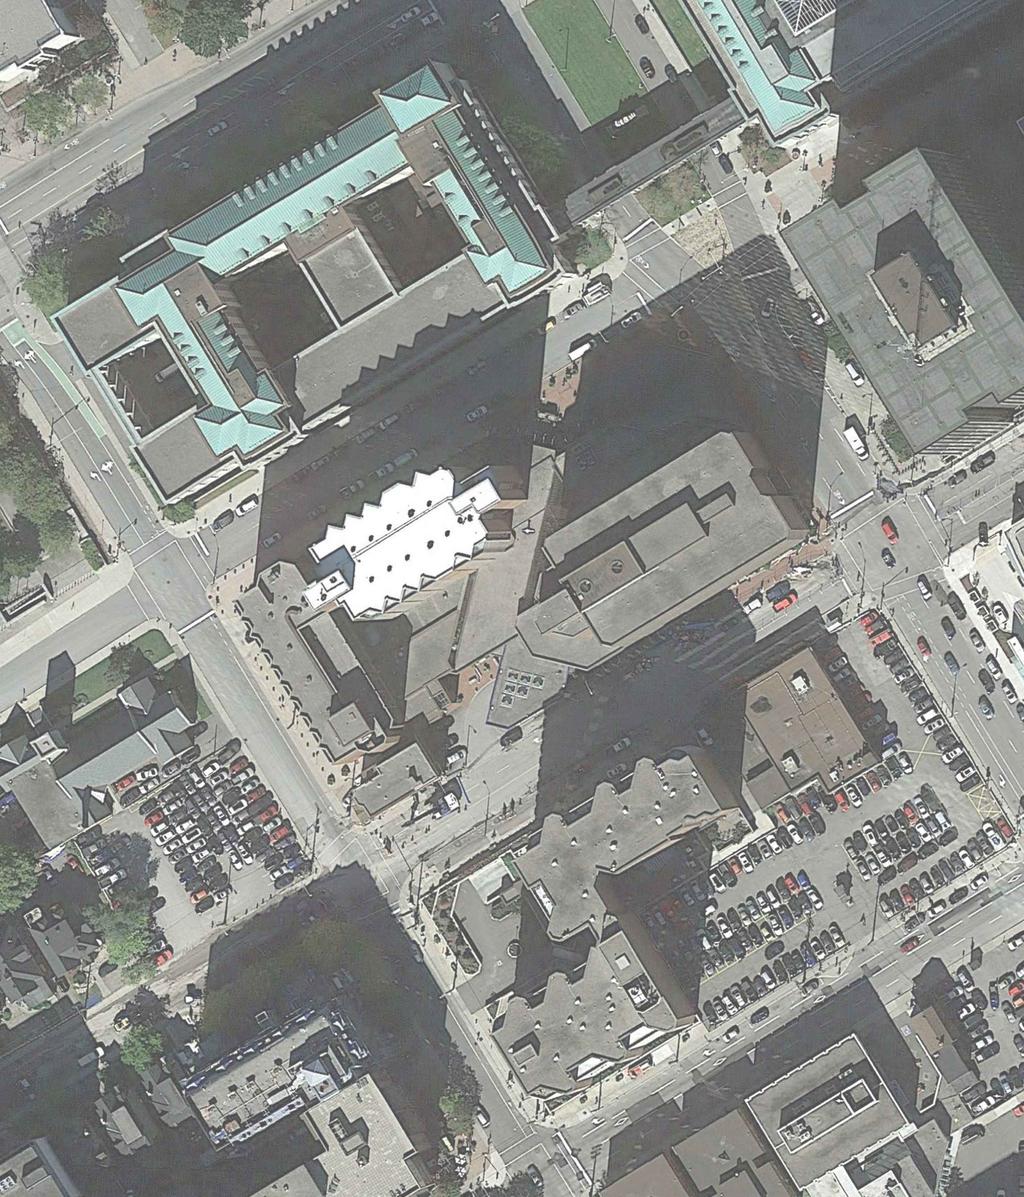
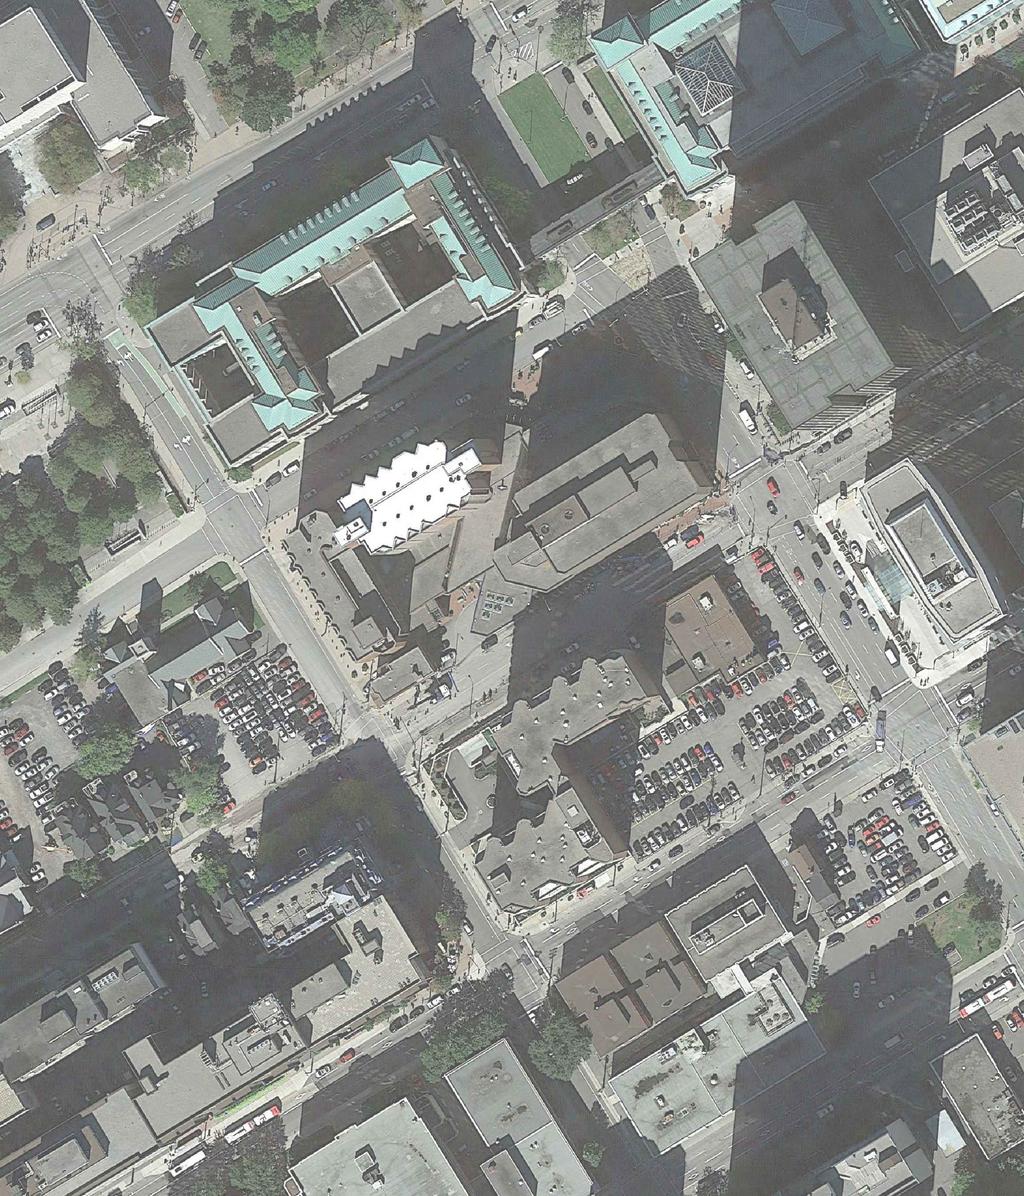
8 . INTRODUCTION BA Group has been retained by Morguard Real Estate Investment Trust to provide transportation advisory services in support of the redevelopment of Sparks Street in the City of Ottawa. The site is a City block bounded by Sparks Street to the north, Queen Street to the south, Bay Street to the west and Lyon Street North to the east. The site location is shown in Figure A. The site currently contains a -storey office building, a suite hotel and a small residential building. The hotel and residential building are vacant at this time. The site has a supporting 7 space underground paid parking garage, with access onto Queen Street, which is also available to the general public. The development plan would seek to demolish the existing hotel and small residential buildings and replace them with a new hotel and apartment building. The new hotel would contain a total of suites, and the apartment building would contain units. The existing office tower would remain as-is, with exception to some improvements to the façade on the ground floor. The underground garage would be expanded to provide a total of 8 parking stalls. As part of the development program, access to the parking garage would be relocated from Queen Street to Sparks Street. The site is well situated from a transportation context point of view and is within walking distance to a variety of employment and entertainment destinations. It is also in close proximity to existing and planned transit infrastructure. The future Confederation Line LRT will further improve transit operations in the area and a station is being constructed adjacent to the site at the southwest corner of the Queen Street / Lyon Street North intersection. BA Group has undertaken a transportation study to document and analyze various aspects of the redevelopment of the site. This includes a review of the following: The existing site The area transportation context Existing area road network traffic volumes and operations The development program Forecast travel demands Future area road network traffic operations and Key transportation elements of the Site Plan This report provides a summary of our review. SPARKS STREET - TRANSPORTATION STUDY JUNE, 8-
9 . EXISTING CONDITIONS. EXISTING SITE CONDITIONS Sparks forms a City block bounded by Sparks Street to the north, Queen Street to the south, Bay Street to the west and Lyon Street North to the east. The site is zoned as a MD Mixed-Use Downtown and currently contains a -storey sq.ft office building, a suite hotel and a small residential building. The hotel and small residential building are vacant at this time. The site area context is further illustrated in Figure A... Site Access, Parking and Loading The site features an underground paid parking garage, which serves the office and the formerly in operation hotel uses on site and is also available to the general public. Access to the garage is provided via a driveway onto Queen Street. Pick-up / drop-off operations occur via a lay-by and circular driveway onto Queen Street. Site loading operations occur today through three main areas on Queen Street, Bay Street and Sparks Street, two of which are on street. On Queen Street a designated loading area is provided along the north side of the street, just east of the site parking garage driveway. Today, this area typically accommodates courier activity for the office building. A second on-street loading area is provided on Sparks Street, west of Lyon Street North. This area also provides loading for both the office building and has a separate zone for Diplomat Loading. Larger delivery vehicles are generally accommodated within this loading area. The third loading area is within a loading dock internal to the hotel building and fronts onto Bay Street, just south of Sparks Street. This area accommodates a single truck, and was previously used by the hotel... Parking Garage The parking garage is generally located on the eastern portion of the lands underneath the office building. It contains a total of 7 parking spaces on two levels.. AREA TRANSPORTATION CONTEXT. ROAD NETWORK An overview of the study area roads is provided below. A diagram illustrating the area traffic control and lane configuration is provided in Figure A. Bay Street is a one-way northbound local road that provides connectivity between Catherine Street to the South and Wellington Street to the north. In the vicinity of the site it has two vehicular travel lanes and a cycling lane. It is signalized at Queen Street at the southwest corner of the site, and a pedestrian crossing signal is provided at Sparks Street, which permits pedestrians to cross Bay Street under signal control. SPARKS STREET - TRANSPORTATION STUDY JUNE, 8-
10 Sparks Street is a local road that has vehicular travel lanes between Lyon Street North to the east and Bronson Road to west. Between Bay Street and Lyon Street North, along the north side of the site two-way travel is permitted. It is signalized at Lyon Street North, and traffic operates under STOP control at its intersection with Bay Street. Lyon Street North is generally a one-way southbound arterial road that extends from Wellington Street in the north to Catherine Street in the south. Its south terminus is an onramp to Highway 7 westbound. A small section of Lyon Street North permits northbound travel between Sparks Street and Wellington Street. In this section northbound and southbound travel is separated by a median. It has four travel lanes in the immediate site area. Queen Street is a two-way local road that runs between Elgin Street in the east and Bronson Road in the west. It is signalized at its intersections with Lyon Street North and Bay Street. At Lyon Street North it has a width to accommodate two westbound lanes and one eastbound lane. All study area roads noted above have a speed limit of km/h.. TRANSIT FACILITIES The site is well served by the a number of existing bus routes and is within walking distance ( to city blocks) to the Transitway on Albert Street and Slater Street. The transitway has bus service that connects to City of Ottawa at large. Frequent service is provide seven days a week on OC Transpo routes,,,, 7, 8 and. Routes, and 7 operate extended hours until the early morning. Bus routes and 7 run hours a day. Area transit routes and bus stops are illustrated in Figure A.. CYCLING AND PEDESTRIAN FACILITIES The site benefits from its proximity existing cycling infrastructure in the area, where there are bicycle lanes on Bay Street and Lyon Street North. These lanes allow for north-south travel within dedicated pavement area and connect to existing east-west cycling lanes on Wellington Road and Laurier Avenue. Sidewalks are provided on all area roads bounding the site. Sparks Street, to the east of Lyon provides a pedestrian corridor through to Elgin Street, allowing for excellent east-west pedestrian connectivity through the downtown core to a variety of key attractions and north-south streets.. EXISTING TRAFFIC VOLUMES Existing weekday morning and afternoon peak hour baseline traffic volumes are shown in Figure B. These peak hours represent when the area is typically the busiest during the course of a week. These volumes were established through traffic data collected by the City of Ottawa and BA Group. Traffic count data is provided in Appendix C. Adjustments were made to balance traffic volumes between adjacent intersections. The data indicates shows that traffic flows to/from the north are somewhat tidal in nature, relating to traffic entering the downtown core in the morning and leaving in the afternoon. Traffic volumes travelling to the south on Lyon Street North in the morning peak hour are substantially higher than during the afternoon peak hour. Conversely, traffic volumes to the north on Bay Street are much higher in the weekday afternoon than in the weekday morning peak hour. SPARKS STREET - TRANSPORTATION STUDY JUNE, 8-
11 .7 EXISTING OPERATIONS Traffic operations were reviewed at the following intersections: Bay Street / Sparks Street (pedestrian signal) Bay Street / Queen Street (signalized) Lyon Street North / Sparks Street (signalized) Lyon Street North / Queen Street (signalized) Parking garage driveway onto Queen Street (unsignalized).7. Methodology Traffic operations analyses have been undertaken in accordance with the methodologies outlined in the Highway Capacity Manual (HCM ) using the Synchro (Version ) software package. The primary product of the signalized intersection capacity analysis evaluation is two sets of intersection performance indices. The first is a volume-to-capacity (or v/c) ratio that provides an indication of the capacity utilization for movements at an intersection and at the intersection overall. A v/c ratio of. indicates that a turning movement or intersection may be operating at or near its theoretical capacity. The second measure is a level of service (LOS) indicator that provides a measure of the average level of delay that a motorist may experience while travelling through an intersection. The level of service indicator ranges from LOS A (little delay) to LOS F (extended delays). Level of Service criteria for signalized and unsignalized intersections is summarized in Table. TABLE HCM LEVEL OF SERVICE Level of Service (LOS) Signalized Intersections Unsignalized Intersections LOS A s s LOS B > s and s > s and s LOS C > s and s > s and s LOS D > s and s > s and s LOS E > s and 8s > s and s LOS F > 8s > s A summary of the capacity results are provided in the following. Detailed capacity analysis data sheets are provided in Appendix D. SPARKS STREET - TRANSPORTATION STUDY JUNE, 8-
12 .7. Saturation Flow The Synchro analysis has been prepared with a base saturation flow of,8 vehicles per hour per lane per City of Ottawa TIA Guidelines. Additionally, the Central Business District (CBD) adjustment factor in Synchro has been applied, which effectively further reduces saturation flow by an additional percent to account for downtown conditions..7. Signal Timing Plans Signal timing plans obtained by the City of Ottawa were applied in the Synchro model. The Bay Street / Sparks Street intersection contains a pedestrian signal. In order to assess the pedestrian signal operations, this intersection was modelled as a signalized intersection, where the eastbound and westbound phases would only be activated by pedestrians pushing the crossing button (to stop northbound traffic ) in order to cross Bay Street. Turns onto Bay Street from Sparks Street, would be under permissive control and can occur when gaps are present in the Bay Street traffic flow. Limitations to this approach are that any through movements across Bay Street on Sparks Street can only occur if the pedestrian signal is pressed, whereas under existing conditions a through movement can occur when a gap in Bay Street traffic is present. Therefore, due to the limitations of this approach, intersection v/c delays values may be modestly overstated for through movements on Sparks Street at the Bay Street intersection. SPARKS STREET - TRANSPORTATION STUDY JUNE, 8-
13 .7. Analysis Results Capacity analysis results for area intersections under existing conditions are summarized in Table. Capacity analysis results indicate that the study area intersections operate in a satisfactory manner. All intersections operate with overall v/c ratios of less than.7 during peak hours, which is indicative of available reserve capacity. All delays experienced by individual movements are in the LOS A to D range which is considered reasonable within an urban environment. The only movement which operates with higher end v/c ratios is the westbound through-left movement at the Lyon Street North / Queen Street intersection which has a v/c ratio of.8 during the weekday afternoon peak hour. TABLE CAPACITY ANALYSIS SUMMARY - EXISTING TRAFFIC OPERATIONS Intersection Weekday Morning Peak Hour Weekday Afternoon Peak Hour Overall Key Moves v/c, Delay, LOS Overall Key Moves v/c, Delay, LOS Signalized Intersections Bay Street / Sparks Street.,s,A WBTR NBLTR.,s,B.,s,A.,s,B WBTR NBLTR.,s,B.,s,B Bay Street / Queen Street.8,s,B EBTL WBT WBR NBLTR.,s,B.,7s,A.,s,A.,s,B.,s,B EBTL WBT WBR NBTR.7,s,C.,s,B.,s,C.8,s,B Lyon Street North / Sparks Street.8,s,A EBR SBTR.,7s,D.7,s,A.,s,A EBR SBTR.,s,C.7,s,A Lyon Street North / Queen Street.,s,B EBTR WBTL SBLTR.,s,D.8,8s,D.,s,B.,8s,B EBTR WBTL SBLTR.,7s,B.88,s,C.,s,A Unsignalized Intersections Garage Driveway / Queen Street - SBLTR.,s,B - SBLTR.,s,C Analysis results show that the existing garage driveway onto Queen Street operates with a Level of Service of B during the weekday morning peak hour and a Level of Service C during the weekday afternoon peak hour, which is indicative of acceptable intersection delays.. PLANNED TRANSPORTATION INFRASTRUCTURE. CONFEDERATION LINE The Confederation Line LRT project will expand east-west service capacity in the City of Ottawa. It will extend between Blair Road at Highway 7 in the west through the downtown to Tunney s Pasture in the east. The line will contain a total of thirteen stations. A section of the LRT will be underground along the Queen Street corridor, with stops at Lyon Street North, O Connor Street (i.e. Parliament Station) and the Rideau Centre. The Lyon Station will have access from the Place de Ville and Delta Hotel, immediately to the east of the site. Substantial completion of the LRT construction is planned for 7. SPARKS STREET - TRANSPORTATION STUDY JUNE, 8-
14 . QUEEN STREET RENEWAL PROJECT The City of Ottawa has undertaken an Environmental Assessment and detailed design in support of changes to Queen Street between Bronson Street and Elgin Street. The project involves changes the streetscape, to respond to the new transit and pedestrian context of the Queen Street corridor. The detailed design for Queen Street identifies changes to Queen Street, Bay Street and Lyon Street North adjacent to the site. These include: Reducing the pavement width between Queen Street between Bay Street and Lyon Street North to provide additional boulevard. Providing sharrows along Queen Street Provision of a bike box for travel from Bay Street northbound to Queen Street westbound The narrowing of the Lyon Street North pavement width north of Queen Street to provide additional boulevard. Lyon Street North would also have a bike lane. Narrowing Queen Street east of Lyon Street North to provide additional boulevard. The westbound approach to this intersection would be modified to have a left turn lane and a through lane. A sensitivity analysis has been completed in this study to review future traffic conditions with these planned network changes in place.. BIKE SHARE PROGRAM VeloGo, a bike share program, is planned to roll out in the Fall of. This service, similar to Ottawa s past Bixi service, will allow members to use a shared pool of bikes through downtown Ottawa and Gatineau. Bikes could be picked-up, used, and dropped off at various locations. There is anticipated to be approximately locations. Available documentation reviewed at the time of this study suggests a bike share location off-site is planned near the Queen Street / Lyon Street North intersection. SPARKS STREET - TRANSPORTATION STUDY JUNE, 8-7
15 . SITE PLAN. DEVELOPMENT PROGRAM The development plan would seek to demolish the existing hotel and small residential buildings and replace them with a new hotel and apartment building. The new hotel would contain a total of suites, and the apartment building would contain units. The existing office tower would remain as-is, with exception to some improvements to the façade on the ground floor. The Site Plan is illustrated in Figure A. The redevelopment of the site is anticipated to start in.. SITE ACCESS, PARKING AND LOADING.. Site Access, Parking and Pick-Up Drop-Off Access to the parking garage would be relocated from its current location on Queen Street to Sparks Street, approximately metres east of the westbound stop bar of the Bay Street / Sparks Street intersection (measured to the centreline of the driveway). The parking garage would contain a total 8 parking spaces, allocated as follows office, hotel and apartment. Of the apartment spaces, are proposed to facilitate car-share, and are proposed for visitor use. The supply provided meets the zoning by-law requirements and will satisfy the needs of the site. The new Sparks Street driveway will contain a bike ramp, which provides access to the bike parking mezzanine level, which contains bicycle parking spaces. bicycle parking spaces will be provided at-grade. The bicycle parking supply meets the zoning by-law requirements for the new site uses. Pick-up / Drop-off for this site would be on Queen Street, as under existing conditions, however the configuration of this facility would be modified. The Pick-Up / Drop-Off area would be an internal courtyard, which would have access via a single driveway onto Queen Street. The facility would accommodate all uses on site: office, hotel and apartment. Notably, all buildings have doors which front onto this courtyard. A vehicle manoeuvring diagram has been prepared to demonstrate that vehicles can enter and exit the facility in a suitable manner (Appendix E)... Loading Areas Two on site loading area are provided to serve the three site uses, one on Bay Street the other on Sparks Street. The Bay Street loading area contains two loading spaces and is designated to accommodate hotel and office uses. The Sparks Street loading area would primarily function to serve resident move in. SPARKS STREET - TRANSPORTATION STUDY JUNE, 8-8
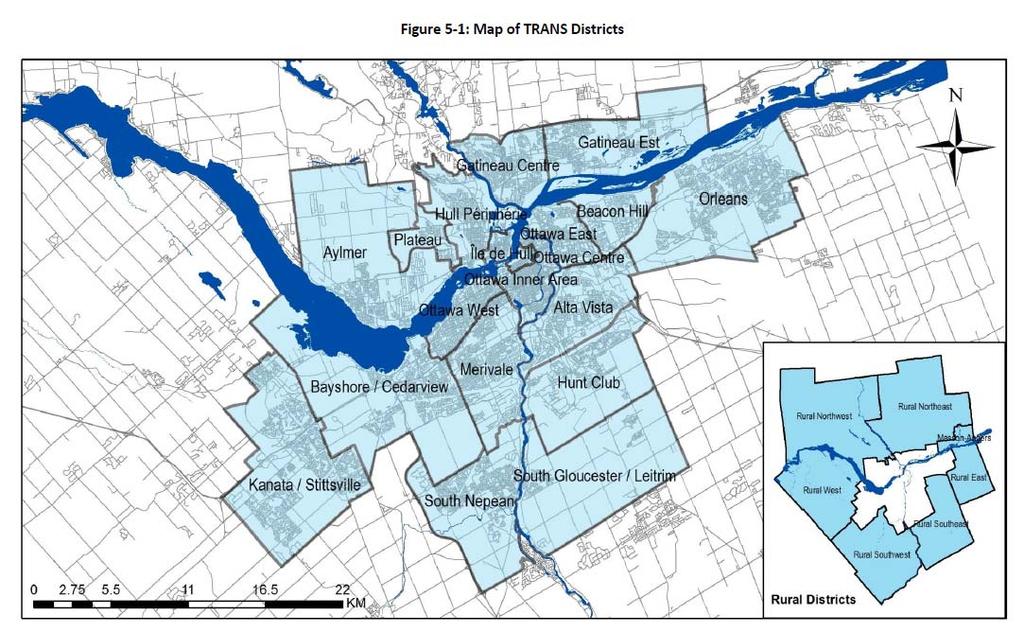
16 . DEMAND FORECASTING Traffic forecasts were prepared for future conditions considering potential area growth and site related traffic.. BACKGROUND TRAFFIC GROWTH It is anticipated that traffic volumes on the Queen Street corridor will either remain consistent with existing conditions or reduce with the completion of the Confederation Line, which will improve transit service in this area. For the purposes of this study, future traffic volumes without the redevelopment of the site have been assumed be consistent with existing conditions. This methodology is similar to vehicular traffic forecasting identified in the Queen Street Renewal Transportation Assessment report (Declan, May ) prepared in support of the Queen Street Renewal Environmental Assessment.. SITE TRIP GENERATION Traffic volumes were generated for the site based on a review of traffic counts performed at the site and use of the ITE Trip Generation Manual. Modal split information from the Trans O-D Survey report for Ottawa Centre was also used to allocate trips by transportation mode for the apartment and hotel uses. Trip generation for the office is based on existing driveway counts. Development of traffic volumes associated with the various development uses is summarized below. The resulting trip generation for the site is summarized in Table... Office Trip Generation The existing parking garage, which contains approximately 7 spaces, is predominately used by office workers for the site and is also available for general public use. Existing traffic counts show that this garage generates approximately two-way trips during the weekday morning and two-way trips during the weekday afternoon peak hour. Also on site today is the existing pick-up / drop-off facility, which is used by office workers and generates approximately two-way trips during the weekday morning peak hour and two-way trips during the weekday afternoon peak hour. After redevelopment of the site, the parking spaces available for the office use will decrease from 7 spaces which exist today to approximately spaces. Therefore, it is anticipated that traffic generated by the office use would also decrease. To maintain a conservative stance, it has been assumed for this study that office vehicular travel demands after redevelopment of the site would be similar in the future. This may modestly overstate the traffic impact of the redevelopment. SPARKS STREET - TRANSPORTATION STUDY JUNE, 8-
17 .. Apartment Trip Generation Trips generation for the apartment building was performed based on a person trip generation basis. Information regarding person trip generation was adopted from the ITE Trip Generation Manual. Land Use Code ITE High Rise apartment was referred to. The apartment is anticipated to generate approximately 8 two-way person trips during the weekday morning peak hour and two-way person trips during the weekday afternoon peak hour. Person trips were allocated as follows based on a review of mode split information in the Trans O-D survey : Car-driver: % Car-passenger: % Non-Motorized: % Transit: % The car-driver mode split of % was applied to calculate vehicular trips generated by the apartment use. In total, the apartment is estimated to generate approximately two-way vehicular trips during the weekday morning peak hour and two-way vehicular trips during the weekday afternoon peak hour... Hotel Trip Generation Trips generation for the hotel building was performed on a person trip generation basis, similar to the apartment building. Land Use Code ITE Hotel was used to estimate person trips. Person trips were allocated as follows: Car-driver: % Car-passenger: % Non-Motorized: % Transit: % Taxi (as primary passenger): % Taxi (as additional passenger): % These proportions are similar to the apartment mode splits, with adjustments made to reflect a greater usage of personal vehicles to travel to hotels, and taxis. Key vehicular trip generators, noting the above, are from passenger cars and taxis. A further breakdown of these vehicle types is provided below. Forecast vehicular trips generated through the application of ITE Trip generation rates were inflated by passenger occupancy rates presented in the ITE Trip Generation Handbook to forecast person trips as shown in Table. Please refer to Appendix F for additional information. SPARKS STREET - TRANSPORTATION STUDY JUNE, 8-
18 ... Passenger Car Trips The car-driver mode split of % was applied to calculate passenger car trips generated by the hotel use. In total, the hotel is estimated to generate approximately 7 two-way vehicular trips during the weekday morning peak hour and two-way vehicular trips during the weekday afternoon peak hour. For the purposes of trip assignment, these trips were broken down into two main categories: those who drive directly to/from the parking garage, and those who utilize the pick-up / drop-off area before/after travelling to/from the garage. This split was assumed to be /.... Taxi Trips The taxi primary passenger mode split of % was applied to calculate the number of taxi calls generated by the hotel use. The hotel is estimated that patrons would require taxis to arrive and taxis to leave the hotel during the weekday morning peak hour. Assuming that all arriving taxis after dropping off guests would be utilized to provide services to outbound guests, this would result in two-way (i.e. inbound; outbound) trips during the weekday morning peak hour. The hotel is estimated that patrons would require taxis to arrive and taxis to leave the hotel during the weekday afternoon peak hour. Assuming that all arriving taxis (after dropping off guests) would be utilized to provide services to outbound guests, this would result in two-way trips (i.e. inbound; outbound) during the weekday afternoon peak hour.... Site Traffic and As of Right Comparison The entire site upon build-out is anticipated to generate approximately to two-way trips. This is an increase beyond existing conditions, where only the office is in operation, of approximately to twoway trips. A review was undertaken to estimate the traffic conditions on site prior to the closure of the existing hotel, which contained a total of 8 suites (larger than the current plan) (see Appendix F). Based on the rates presented in Table, the site at that time would generate approximately to two-way trips. A comparison of the proposed development plan traffic generation to the site prior to the hotel closure indicates the proposed development plan would generate approximately additional two-way trips. The anticipated traffic of the proposed development plan is very similar to site prior to the hotel closure. SPARKS STREET - TRANSPORTATION STUDY JUNE, 8-
19 TABLE SITE TRAFFIC GENERATION Land Use Information Weekday Morning Peak Hour Weekday Afternoon Peak Hour In Out -way In Out -way Office - Existing Office Garage Traffic Ex. Counts Office - Pick-Up / Drop-Off Ex. Counts Office Related Traffic High Rise Apartment Units ITE Baseline Trip Rate ITE Person Trip Rate Person Trips % 8 Car Driver % 8 Car Passenger % 7 7 Transit % Non-Motorized % Vehicular Trips (Rounded to Nearest ) % Hotel Suites ITE Baseline Trip Rate ITE Person Trip Rate Person Trips % Car Driver % Car Passenger % 7 Non-Motorized % 7 Transit % 8 Taxi - primary passenger % Taxi - as an additional passenger % 8 Passenger Car Trips Passenger Car Trips (Rounded to Nearest ) 7 straight to garage % % using PUDO / Valet, then Garage (7) Taxi Trips Taxi Calls (Rounded to Nearest ) Taxi Trips (in and out of PUDO) AL SITE TRIPS () INCREASE BEYOND EXISTING 8 CONDITIONS () INCREASE BEYOND AS OF RIGHT CONDITIONS () () () () () () () 7 () () () () () () 8 () () () 7 () () () () () SPARKS STREET - TRANSPORTATION STUDY JUNE, 8-
20 Notes:. Person Trip rate = ITE Baseline Rate x Car Occupancy x Transit Adjustment (to adjust for inherent non-auto use in baseline ITE data) For Apartment: ITE Baseline Rate x. passengers per car (per ITE handbook) x. For Hotel: ITE Baseline Rate x. passengers per car x.. Mode split information based on review of AM Peak Period travel information in TRANS O-D survey. Refer to Appendix E.. ( ) Bracketed values reflect the entry / exit at the PUDO and the parking garage which effective dou8bles the in and out volumes at the site driveways.. TRIP DISTRIBUTION AND ASSIGNMENT The trip distribution pattern was determined for the site uses based on a review of travel patterns recorded in Trans O-D Survey report and the surrounding road network connectivity. Detailed information regarding the distribution is provided in Appendix F. Office and Hotel distribution patterns were assumed to be the same for the purposes of this analysis. The resulting distribution pattern is shown in Table. TABLE OVERALL TRIP DISTRIBUTION PATTERN Orientation Office Residential Hotel Outbound Queen Street - East.%.%.% Lyon Street North - South.%.%.% Bay Street - North.%.%.% Queen Street - West.%.%.% Sparks Street - West.%.%.% % % % Inbound Queen Street - East.%.%.% Lyon Street North - North.%.%.% Bay Street - South.%.%.% Queen Street - West.%.%.% Sparks Street - West.%.%.% Queen Street - East.%.%.% % % % Trips were assigned to the road network as shown in Figures B through Figure B. The resulting Future total traffic volumes, which represent the addition of site traffic volumes to existing traffic volumes are shown in Figure B. SPARKS STREET - TRANSPORTATION STUDY JUNE, 8-
21 . FUTURE TRAFFIC OPERATIONS. CAPACITY ANALYSIS Capacity analysis results under future traffic conditions are summarized in Table. Detailed capacity analysis sheets are provided in Appendix G. The results indicate that the study area intersections will continue to operate in a satisfactory manner. All intersections operate with overall v/c ratios of less than.8 during peak hours, which is indicative of available reserve capacity. All delays experienced by individual movements are in the LOS A to D range which is considered reasonable within an urban environment. The westbound through-left movement at the Lyon Street North / Queen Street intersection operates with a higher end, but still acceptable v/c ratios during the weekday afternoon peak hour of.8. The Queen Street / Lyon Street North intersection was further assessed with the planned changes demonstrated in the Queen Street Renewal project. Under this configuration the intersection will have overall v/c ratios higher than those experienced under the current configuration; however, intersection operations will still be satisfactory. The Queen Street Pick-Up / Drop off is forecast to operate well during peak hours and the key southbound STOP controlled approach is forecast to operate with a Level of Service C during the weekday morning and afternoon peak hours. The Sparks Street Garage Driveway is also forecast to operate well, and the key northbound STOP controlled approach will operate with Levels of Service in the A to B range. The results indicate that site traffic can be suitably accommodated by the area road network. SPARKS STREET - TRANSPORTATION STUDY JUNE, 8-
22 TABLE CAPACITY ANALYSIS SUMMARY FUTURE TRAFFIC OPERATIONS (AREA ROAD NETWORK AS-IS) Intersection Weekday Morning Peak Hour Weekday Afternoon Peak Hour Overall Key Moves v/c, Delay, LOS Overall Key Moves v/c, Delay, LOS Signalized Intersections Bay Street / Sparks Street.8,7s,A EBTL WBTR NBLTR.,s,B.,s,B.,7s,A.8,s,B EBTL WBTR NBLTR -,-, A.,s,B.7,s,B Bay Street / Queen Street.7,s,B EBTL WBT WBR NBLTR.,s,C.8,7s,A.,s,A.,s,B.7,8s,B EBTL WBT WBR NBTR.7,s,C.7,s,B.8,s,C.,s,B Lyon Street North / Sparks Street.77,s,B EBR SBTR.,s,D.78,s,A.,8s,A EBR SBTR.,s,C.,s,A Lyon Street North / Queen Street.7,s,C EBTR WBTL SBLTR.7,s,D.,s,D.,s,B.,7s,B EBTR WBTL SBLTR.,s,B.8,8s,C.8,s,B Lyon Street North / Queen Street - After Queen Street Renewal.7,s,C EBTR WBL WBT SBLTR.7,s,D.,s,D.,7s,D.78,8s,B.7,s,B EBTR WBL WBT SBLTR.,s,B.8,s,D.7,s,C.,s,B Unsignalized Intersections Pick-Up / Drop-Off Driveway onto Queen Street Garage Driveway / Sparks Street - - EBTL WBTR SBLR EBTR WBTL NBLR.,s,A.,s,A.8,s,C.,s,A.,s,A.,s,A Notes:. Nominal traffic volumes associated with this movement. No delays, or v/c reported. - - EBTL WBTR SBLR EBTR WBTL NBLR.,s,A.8,s,A.,7s,C.,s,A.,s,A.,s,B.. Queuing Review Sparks Street A queuing review was conducted to determine the extent of westbound queuing at the Bay Street / Sparks Street intersection to confirm the appropriateness of the driveway spacing. The Synchro based queuing results are provided in Table. The results indicate that th percentile queues will not spill back to the parking garage driveway location which is metres east of Bay Street (measured from the Bay Street STOP bar to the centre of the driveway). Therefore, the location is an appropriate distance from Bay Street. SPARKS STREET - TRANSPORTATION STUDY JUNE, 8-
23 TABLE QUEUING REVIEW SPARKS STREET Queues Weekday Morning Weekday Afternoon Peak Hour Driveway Location th percentile (m) th percentile (m) th percentile (m) th percentile (m) WBLTR 7m 7m 7m 7m m east of Bay Street Notes:. Vehicle queues rounded up to the nearest 7 metres to reflect the length of a passenger vehicle + buffer distance to the next vehicle. All reported queues through Synchro are less than 7 metres. SPARKS STREET - TRANSPORTATION STUDY JUNE, 8-
24 7. FINDINGS AND RECOMMENDATIONS BA Group has undertaken a transportation impact assessment to review the proposed development plan for Sparks Street. The site is a City block bounded by Sparks Street to the north, Queen Street to the south, Bay Street to the west and Lyon Street North to the east. Key findings from our review are documented below: Transportation Context The site is well situated from a transportation context point of view and is within walking distance to a variety of employment and entertainment destinations. Sidewalks are provided on all area roads bounding the site. Sparks Street, to the east of Lyon provides a pedestrian corridor through to Elgin Street, providing excellent east-west pedestrian connectivity through the downtown core to a variety of key attractions. The site benefits from its proximity to existing and planned transit infrastructure. The future Confederation Line LRT will further improve transit operations in the area and a station is being constructed immediately adjacent to the site at the southwest corner of the Queen Street / Lyon Street North intersection. The site is well situated from a cycling perspective, given its proximity existing cycling infrastructure in the area, where there are cycling lanes on Bay Street and Lyon Street North. These lanes allow for north-south travel within dedicated pavement area and connect to existing east-west cycling lanes on Wellington Road and Laurier Avenue. The City of Ottawa has undertaken an Environmental Assessment and detailed design in support of changes to Queen Street between Bronson Street and Elgin Street. The project involves changes the streetscape, to respond to the new transit and pedestrian context of the Queen Street corridor. The site will operate in a reasonable manner with and without the planned changes. Site Traffic The entire site upon build-out is anticipated to generate approximately to two-way trips. This is an increase beyond existing conditions, where only the office is in operation, and the site generates approximately to two-way trips. A review was undertaken to estimate the traffic conditions on site prior to the closure of the existing hotel, which contained a total of 8 suites. Under prior conditions the site would generate approximately to two-way trips. The proposed development generates approximately more two-way trips and is therefore similar, to the prior site in terms of trip generation potential. SPARKS STREET - TRANSPORTATION STUDY JUNE, 8-7
25 Traffic Operations Capacity analysis results indicate that the study area intersections operate in a satisfactory manner under Existing conditions. This is forecast to continue under future conditions upon build-out of the site. All study intersections are forecast operate with overall v/c ratios of less than.8 during peak hours, which is indicative of available reserve capacity. All delays experienced by individual movements are in the Level of Service A to D range which is considered reasonable within an urban environment. The Queen Street / Lyon Street North intersection was further assessed with the planned changes illustrated in the Queen Street Renewal project. Under this configuration the intersection will have overall v/c ratios higher than those experienced under the current configuration; however, forecast intersection operations will continue to be satisfactory. Based upon our review, the study area road network can reasonably accommodate forecast traffic demands and study area intersections and site driveways will operate in a suitable manner. SPARKS STREET - TRANSPORTATION STUDY JUNE, 8-8
26 APPENDIX A: Context Figures SPARKS STREET - TRANSPORTATION STUDY JUNE, 8-
27
28
29
30
31
32 APPENDIX B: Traffic Volume Figures SPARKS STREET - TRANSPORTATION STUDY JUNE, 8-
33
34
35
36
37
38
39
40
41
42 APPENDIX C: Turning Movement Data SPARKS STREET - TRANSPORTATION STUDY JUNE, 8-
43 Public Works - Traffic Services Turning Movements Count - Full Study Diagram BAY QUEEN ST Survey Date: Start Time: Wednesday, May, WO#: 8 7: Device: BAY ST N W E 8 S Trucks Cars QUEEN ST 8 MD Period 8 Hours 7 7: 8: Cars Trucks Validation Note: Results generated Nov,. All records still in violation were set to Edited. -Dec- Page of
44 Public Works - Traffic Services Turning Movements Count - Full Study Diagram BAY QUEEN ST Survey Date: Start Time: Wednesday, May, WO#: 8 7: Device: BAY ST N W E 8 S Trucks Cars 7 QUEEN ST AM Period 8 Hours 8 7: 8: Cars Trucks 8 8 Validation Note: Results generated Nov,. All records still in violation were set to Edited. -Dec- Page of
45 Public Works - Traffic Services Turning Movements Count - Peak Period Diagram BAY QUEEN ST Survey Date: Start Time: Wednesday, May, WO No: 8 7: Device: Peak Period: MD Period : : BAY ST W N E 7 7 S Trucks Cars QUEEN ST 8 MD Period : : 7 Cars Trucks 88 Validation Note: Results generated Nov,. All records still in violation were set to Edited. -Dec- Page of
46 Public Works - Traffic Services Turning Movements Count - Full Study Diagram BAY QUEEN ST Survey Date: Start Time: Wednesday, May, WO#: 8 7: Device: BAY ST N W E 8 S Trucks Cars QUEEN ST PM Period 8 Hours 7 7: 8: Cars Trucks 7 7 Validation Note: Results generated Nov,. All records still in violation were set to Edited. -Dec- Page of
47 Public Works - Traffic Services Turning Movements Count - Peak Period Diagram BAY QUEEN ST Survey Date: Start Time: Wednesday, May, WO No: 8 7: Device: Peak Period: PM Period : : BAY ST W N E S Trucks Cars QUEEN ST 7 PM Period 7 : : Cars 7 Trucks 7 7 Validation Note: Results generated Nov,. All records still in violation were set to Edited. -Dec- Page of
48 Turning Movement Count - Minute Summary Report Survey Date: BAY QUEEN ST Wednesday, May, 8 Observed U-Turns Northbound: Eastbound: Southbound: Westbound: Public Works - Traffic Services W.O. Grand STR W RT ST LT E RT ST LT STR S RT ST LT N RT ST LT Time Period Northbound Southbound Eastbound Westbound BAY ST QUEEN ST 7 7: 7: : 7: : 7: : 7: 8 8: 8: : 8: 77 8: 8: 8 : 8: 7 8 : : 7 8 : : : : : : : : : : : : : : 8 : : 8 8 : : : : : : 7 : : : : : : : : : : : : : : : : : 7: 7 7: 7: 8 8 7: 7: : 7: Validation Note: Note: U-Turns are included in s. Results generated Nov,. All records still in violation were set to Edited Page of December,
49 Public Works - Traffic Services Turning Movement Count - Cyclist Volume Report Work Order 8 BAY QUEEN ST Count Date: Wednesday, May, Start Time: 7: BAY ST QUEEN ST Time Period Northbound Southbound Street Eastbound Westbound Street Grand 7: 8: 8: : 7 7 : : : : : : : : : 7: : 8: Validation Note: Results generated Nov,. All records still in violation were set to Edited. -Dec- Page of
50 Public Works - Traffic Services Turning Movements Count - Full Study Diagram BAY QUEEN ST Survey Date: Start Time: Wednesday, May, WO#: 8 7: Device: BAY ST N W E S Trucks Cars QUEEN ST Full Study 8 Hours 7 8 7: 8: Cars Trucks 8 Validation Note: Results generated Nov,. All records still in violation were set to Edited. -Dec- Page of
51 Public Works - Traffic Services Turning Movement Count - Heavy Vehicle Report W.O. 8 BAY QUEEN ST Survey Date: Wednesday, May, BAY ST QUEEN ST Time Period Northbound ST LT RT N Southbound LT ST RT S STR Eastbound LT ST RT E Westbound LT ST RT W STR Grand 7: 8: 8: : 8 8 : : 77 : : 7 : : : : 7 : 7: : 8: : 8 Heavy Vehicles are vehicles having one rear axle with four or more wheels, or having two or more rear axles. These vehicles include most O.C. Transpo, school and inter-city buses. Further, they ARE included in the Turning Movement Count Summary. -Dec- Page of
52 CITY OPERATIONS - PUBLIC WORKS Turning Movement Count - Pedestrian Volume Report Work Order 8 Count Date: BAY QUEEN ST Wednesday, May, Start Time: 7: BAY ST QUEEN ST Time Period Northbound Southbound Street Eastbound Westbound 7: 7: 8 7: 7: 7 8 7: 7: 7 8 7: 8: 8 7: 8: 8: 8: 8: 8: 7 8 8: 8: 7 8: : 7 8: : 78 8 : : 7 7 : : 8 : : : : 7 : : : : 7 : : 8 7 : : 7 : : : : 7 7 : : : : : : 8 7 : : 8 : : 88 8 : : 7 : : : : : : : : 8 : : 7 7 : : : : 8 : 7: : 7: : 7: 7: 7: 7: 7: 7 7: 8: 7 7: 8: Validation Note: Results generated Nov,. All records still in violation were set to Edited. Street Grand Dec- Page of
53 Public Works - Traffic Services Turning Movement Count - Summary Report Work Order 8 Survey Date: 7: Period 8: LT Wednesday, May, Northbound ST RT 8 BAY ST NB Southbound LT ST BAY QUEEN ST RT Northbound: Eastbound: SB Observed U-Turns STR Southbound: Full Study Eastbound LT ST Westbound: RT QUEEN ST EB 8 Westbound LT ST RT AADT Factor. WB 8 STR Grand 8: : : : : : : : : : : 7: : 8: Equ Hr Note: These values are calculated by multiplying the totals by the appropriate expansion factor.. Avg Hr Note: These volumes are calculated by multiplying the Equivalent hr. totals by the AADT factor Avg Hr Note: These volumes are calculated by multiplying the Average Daily hr. totals by to expansion factor Validation Note: Results generated Nov,. All records still in violation were set to Edited. -Dec- Page of
54 Public Works - Traffic Services Turning Movements Count - Peak Period Diagram BAY QUEEN ST Survey Date: Start Time: Wednesday, May, WO No: 8 7: Device: Peak Period: AM Period 8: : BAY ST W N E S Trucks Cars 8 7 QUEEN ST AM Period : : 8 Cars 7 7 Trucks 8 Validation Note: Results generated Nov,. All records still in violation were set to Edited. -Dec- Page of
55 Turning Movement Count - Minute Summary Report Survey Date: BAY SPARKS ST Thursday, April, Observed U-Turns Northbound: Eastbound: Southbound: Westbound: Public Works - Traffic Services W.O. Grand STR W RT ST LT E RT ST LT STR S RT ST LT N RT ST LT Time Period Northbound Southbound Eastbound Westbound BAY ST SPARKS ST : 7: : 7: : 7: 7 7 8: 7: 8 8 8: 8: : 8: : 8: : 8: 8 7 : : : : : : : : 8 8 : : 7 8 : : : : : : : : : : : : 7 87 : : : : 7 : : : : 8 : : 7 7 : : 7 7 : : 7 7 : : 7 7: : 7 7: 7: 7 7: 7: : 7: : 7: Comment: Note: U-Turns are included in s AL: Page of -Apr-
56 Public Works - Traffic Services Turning Movement Count - Cyclist Volume Report Work Order BAY SPARKS ST Count Date: Thursday, April, Start Time: 7: BAY ST SPARKS ST Time Period Northbound Southbound Street Eastbound Westbound Street Grand 7: 8: 8: : : : : : : : 8 : : 8 8 : 7: 7 7: 8: Comment: Note: These volumes consists of bicycles only (no mopeds or motorcycles) and ARE NOT included in the Turning Movement Count Summary. -Apr- Page of
57 Public Works - Traffic Services Turning Movement Count - Full Study Diagram BAY SPARKS ST Survey Date: Start Time: Thursday, April, WO#: 7: Device: Miovision BAY ST N W E S Heavy Vehicles Cars SPARKS ST Hours : 8: Cars Heavy Vehicles 8 8 Comments -Apr- Page of
58 Public Works - Traffic Services Turning Movement Count - Heavy Vehicle Report W.O. BAY SPARKS ST Survey Date: Thursday, April, BAY ST SPARKS ST Time Period Northbound ST LT RT N Southbound LT ST RT S STR Eastbound LT ST RT E Westbound LT ST RT W STR Grand 7: 8: 8: : : : : : : : 7 : : : 7: 7: 8: : 8 Heavy Vehicles are vehicles having one rear axle with four or more wheels, or having two or more rear axles. These vehicles include most O.C. Transpo, school and inter-city buses. Further, they ARE included in the Turning Movement Count Summary. Printed on: -Apr- Page of
59 Public Works - Traffic Services Turning Movement Count - Pedestrian Volume Report Work Order Count Date: BAY SPARKS ST Thursday, April, Start Time: 7: Time Period NB Approach (E or W Crossing) SB Approach (E or W Crossing) EB Approach (N or S Crossing) WB Approach (N or S Crossing) Grand 7: 7: 7: 7: 7: 8: 8: 8: 8: 8: : : : : : : : : : : : : : : : : : : : : : : : : : 7: 7: 7: 7: 7: 7: 7: 7: 8: 8: 8: 8: 8: : : : : : : : : : : : : : : : : : : : : : : : : : 7: 7: 7: 7: 7: 8: 8: Comment: -Apr- Page of
60 Survey Date: 7: Period 8: LT Public Works - Traffic Services Turning Movement Count - Full Study Summary Report Thursday, April, Northbound ST 8 RT BAY ST NB Southbound LT ST BAY SPARKS ST RT Northbound: Eastbound: SB Observed U-Turns STR Southbound:. Full Study Eastbound LT ST Westbound: SPARKS ST RT EB Westbound LT ST RT 7 Work Order AADT Factor WB STR Grand 8: : : : 8 8 : : : : : : : 7: 7 8 7: 8: Equ Hr Note: These values are calculated by multiplying the totals by the appropriate expansion factor Avg Hr Note: These volumes are calculated by multiplying the Equivalent hr. totals by the AADT factor Avg Hr Note: These volumes are calculated by multiplying the Average Daily hr. totals by to expansion factor.. Comments: Note: U-Turns are included in s. -Apr- Page of
61 Public Works - Traffic Services Turning Movement Count - Full Study Peak Hour Diagram BAY SPARKS ST Survey Date: Start Time: Thursday, April, WO No: 7: Device: Miovision BAY ST N W E Heavy Vehicles Cars 8 8 S SPARKS ST AM Period Peak Hour: 7: 8: 7 Cars Heavy Vehicles Comments -Apr- Page of
62 Public Works - Traffic Services Turning Movement Count - Full Study Peak Hour Diagram BAY SPARKS ST Survey Date: Start Time: Thursday, April, WO No: 7: Device: Miovision BAY ST N W E Heavy Vehicles Cars S SPARKS ST MD Period Peak Hour: 7 : : Cars Heavy Vehicles Comments -Apr- Page of
63 Public Works - Traffic Services Turning Movement Count - Full Study Peak Hour Diagram BAY SPARKS ST Survey Date: Start Time: Thursday, April, WO No: 7: Device: Miovision BAY ST N W E Heavy Vehicles Cars 8 8 S SPARKS ST 8 PM Period Peak Hour: : : 7 8 Cars Heavy Vehicles Comments -Apr- Page of
64 Public Works - Traffic Services Turning Movements Count - Full Study Diagram QUEEN LYON ST Survey Date: Start Time: Thursday, May, WO#: 8 7: Device: LYON ST N W E 7 S Trucks Cars QUEEN ST 88 8 AM Period 8 Hours : 8: Cars Trucks Validation Note: Results generated Nov,. All records still in violation were set to Edited. -Dec- Page of
65 Public Works - Traffic Services Turning Movements Count - Peak Period Diagram QUEEN LYON ST Survey Date: Start Time: Thursday, May, WO No: 8 7: Device: Peak Period: AM Period 8: : LYON ST W N E 8 8 S Trucks Cars QUEEN ST 8 AM Period : : 8 8 Cars Trucks Validation Note: Results generated Nov,. All records still in violation were set to Edited. -Dec- Page of
66 Public Works - Traffic Services Turning Movements Count - Full Study Diagram QUEEN LYON ST Survey Date: Start Time: Thursday, May, WO#: 8 7: Device: LYON ST N W E 78 S Trucks Cars 7 QUEEN ST MD Period 8 Hours : 8: Cars Trucks Validation Note: Results generated Nov,. All records still in violation were set to Edited. -Dec- Page of
67 Public Works - Traffic Services Turning Movements Count - Peak Period Diagram QUEEN LYON ST Survey Date: Start Time: Thursday, May, WO No: 8 7: Device: Peak Period: MD Period : : LYON ST W N E S Trucks Cars QUEEN ST 8 MD Period 8 8 : : 88 Cars 7 Trucks 7 7 Validation Note: Results generated Nov,. All records still in violation were set to Edited. -Dec- Page of
68 Public Works - Traffic Services Turning Movements Count - Full Study Diagram QUEEN LYON ST Survey Date: Start Time: Thursday, May, WO#: 8 7: Device: LYON ST N W E 7 S 8 Trucks Cars 77 7 QUEEN ST PM Period 8 Hours : 8: Cars Trucks 8 8 Validation Note: Results generated Nov,. All records still in violation were set to Edited. -Dec- Page of
69 Public Works - Traffic Services Turning Movements Count - Peak Period Diagram QUEEN LYON ST Survey Date: Start Time: Thursday, May, WO No: 8 7: Device: Peak Period: PM Period : 7: LYON ST W N E S Trucks Cars QUEEN ST PM Period : 7: 8 7 Cars Trucks Validation Note: Results generated Nov,. All records still in violation were set to Edited. -Dec- Page of
70 Turning Movement Count - Minute Summary Report Survey Date: QUEEN LYON ST Thursday, May, 8 Observed U-Turns Northbound: Eastbound: Southbound: Westbound: Public Works - Traffic Services W.O. Grand STR W RT ST LT E RT ST LT STR S RT ST LT N RT ST LT Time Period Northbound Southbound Eastbound Westbound LYON ST QUEEN ST 8 8 7: 7: 8 7: 7: 7 8 7: 7: 7 7 8: 7: 8 8 8: 8: : 8: : 8: : 8: 8 8 : : : : : : 8 7 : : : : : : : : 7 : : : : : : 7 7 : : : : : : : : 7 : : 7 : : : : : : : : : : : 7: : 7: : 7: : 7: Validation Note: Note: U-Turns are included in s. Results generated Nov,. All records still in violation were set to Edited Page of December,
71 Public Works - Traffic Services Turning Movement Count - Cyclist Volume Report Work Order 8 QUEEN LYON ST Count Date: Thursday, May, Start Time: 7: LYON ST QUEEN ST Time Period Northbound Southbound Street Eastbound Westbound Street Grand 7: 8: : : 7 7 : : : : : : : : : 7: 8 7 7: 8: Validation Note: Results generated Nov,. All records still in violation were set to Edited. -Dec- Page of
72 Public Works - Traffic Services Turning Movements Count - Full Study Diagram QUEEN LYON ST Survey Date: Start Time: Thursday, May, WO#: 8 7: Device: LYON ST N W E 8 8 S 7 7 Trucks Cars QUEEN ST 87 Full Study 8 Hours : 8: Cars Trucks Validation Note: Results generated Nov,. All records still in violation were set to Edited. -Dec- Page of
73 Public Works - Traffic Services Turning Movement Count - Heavy Vehicle Report W.O. 8 QUEEN LYON ST Survey Date: Thursday, May, LYON ST QUEEN ST Time Period Northbound ST LT RT N Southbound LT ST RT S STR Eastbound LT ST RT E Westbound LT ST RT W STR Grand 7: 8: 7 8 8: : : : 7 : : 8 : : : : : 7: : 8: 8 8 : 7 7 Heavy Vehicles are vehicles having one rear axle with four or more wheels, or having two or more rear axles. These vehicles include most O.C. Transpo, school and inter-city buses. Further, they ARE included in the Turning Movement Count Summary. 8 -Dec- Page of
74 CITY OPERATIONS - PUBLIC WORKS Turning Movement Count - Pedestrian Volume Report Work Order 8 Count Date: QUEEN LYON ST Thursday, May, Start Time: 7: LYON ST QUEEN ST Time Period Northbound Southbound Street Eastbound Westbound 7: 7: 7 7: 7: 7: 7: 7 7: 8: : 8: : 8: 7 8: 8: : 8: 8 8: : 7 8 8: : : : 8 7 : : 7 8 : : 8 : : 8 8 : : 7 7 : : : : 8 : : 7 : : 8 : : : : 8 : : : : 8 7 : : 7 8 : : 7 7 : : 78 7 : : 7 7 : : : : 8 : : : : 8 : : 8 : : 8 8 : 7: : 7: 8 7 7: 7: 88 7: 7: : 7: : 8: 8 7 7: 8: Validation Note: Results generated Nov,. All records still in violation were set to Edited. Street Grand Dec- Page of
75 Public Works - Traffic Services Turning Movement Count - Summary Report Work Order 8 Survey Date: 7: Period 8: LT Thursday, May, Northbound ST RT LYON ST NB Southbound LT ST 7 QUEEN LYON ST RT Northbound: Eastbound: SB Observed U-Turns STR Southbound: Full Study Eastbound LT ST Westbound: RT QUEEN ST EB 77 Westbound LT ST RT AADT Factor. WB 7 STR Grand 8: : : : : : : : : : : 7: : 8: Equ Hr Note: These values are calculated by multiplying the totals by the appropriate expansion factor.. Avg Hr Note: These volumes are calculated by multiplying the Equivalent hr. totals by the AADT factor.. 8 Avg Hr Note: These volumes are calculated by multiplying the Average Daily hr. totals by to expansion factor Validation Note: Results generated Nov,. All records still in violation were set to Edited. -Dec- Page of
76 Turning Movement Count - Minute Summary Report Survey Date: LYON SPARKS ST Thursday, April, Observed U-Turns Northbound: Eastbound: Southbound: Westbound: Public Works - Traffic Services W.O. Grand STR W RT ST LT E RT ST LT STR S RT ST LT N RT ST LT Time Period Northbound Southbound Eastbound Westbound LYON ST SPARKS ST : 7: : 7: 7: 7: : 7: : 8: : 8: 8: 8: 8 : 8: : : : : : : : : : : : : 8 : : : : : : 8 8 : : : : 8 8 7: : : 7: : 7: : 7: : 7: Comment: Note: U-Turns are included in s. 8 AL: Page of -Apr-
77 Public Works - Traffic Services Turning Movement Count - Cyclist Volume Report Work Order LYON SPARKS ST Count Date: Thursday, April, Start Time: 7: LYON ST SPARKS ST Time Period Northbound Southbound Street Eastbound Westbound Street Grand 7: 8: 8: : : : : : 8 : 7: 7: 8:... Comment: Note: These volumes consists of bicycles only (no mopeds or motorcycles) and ARE NOT included in the Turning Movement Count Summary. -Apr- Page of
78 Public Works - Traffic Services Turning Movement Count - Full Study Diagram LYON SPARKS ST Survey Date: Start Time: Thursday, April, WO#: 7: Device: Miovision LYON ST N W E S Heavy Vehicles Cars 8 SPARKS ST 8 8 Hours 8 7: 8: 8 Cars Heavy Vehicles 8 Comments -Apr- Page of
79 Public Works - Traffic Services Turning Movement Count - Heavy Vehicle Report W.O. LYON SPARKS ST Survey Date: Thursday, April, LYON ST SPARKS ST Time Period Northbound ST LT RT N Southbound LT ST RT S STR Eastbound LT ST RT E Westbound LT ST RT W STR Grand 7: 8: 8: : : : : : : 7: 7: 8: : Heavy Vehicles are vehicles having one rear axle with four or more wheels, or having two or more rear axles. These vehicles include most O.C. Transpo, school and inter-city buses. Further, they ARE included in the Turning Movement Count Summary. Printed on: -Apr- Page of
80 Public Works - Traffic Services Turning Movement Count - Pedestrian Volume Report Work Order Count Date: LYON SPARKS ST Thursday, April, Start Time: 7: Time Period NB Approach (E or W Crossing) SB Approach (E or W Crossing) EB Approach (N or S Crossing) WB Approach (N or S Crossing) Grand 7: 7: 7: 7: 7: 8: 8: 8: 8: 8: : : : : : : : : : : : : : : : 7: 7: 7: 7: 7: 7: 7: 7: 8: 8: 8: 8: 8: : : : : : : : : : : : : : : : 7: 7: 7: 7: 7: 8: 8: Comment: -Apr- Page of
81 Survey Date: 7: Period 8: LT Public Works - Traffic Services Turning Movement Count - Full Study Summary Report Thursday, April, Northbound ST RT LYON ST NB Southbound LT ST 8 LYON SPARKS ST RT Northbound: Eastbound: SB Observed U-Turns STR Southbound:. Full Study Eastbound LT ST Westbound: SPARKS ST RT EB Westbound LT 7 ST RT Work Order AADT Factor WB 8 STR 7 Grand 8: : 7 : : : : : 7: : 8: Equ Hr Note: These values are calculated by multiplying the totals by the appropriate expansion factor Avg Hr Note: These volumes are calculated by multiplying the Equivalent hr. totals by the AADT factor Avg Hr Note: These volumes are calculated by multiplying the Average Daily hr. totals by to expansion factor.. Comments: Note: U-Turns are included in s. -Apr- Page of
82 Public Works - Traffic Services Turning Movement Count - Full Study Peak Hour Diagram LYON SPARKS ST Survey Date: Start Time: Thursday, April, WO No: 7: Device: Miovision LYON ST N W E Heavy Vehicles Cars 7 S SPARKS ST 8 7 AM Period 7 7 Peak Hour: 8 7: 8: 7 8 Cars Heavy Vehicles 8 Comments -Apr- Page of
83 Public Works - Traffic Services Turning Movement Count - Full Study Peak Hour Diagram LYON SPARKS ST Survey Date: Start Time: Thursday, April, WO No: 7: Device: Miovision LYON ST N W E Heavy Vehicles Cars S 8 SPARKS ST 8 PM Period Peak Hour: : 7: 77 Cars Heavy Vehicles 7 77 Comments -Apr- Page of
84 Project No: 8. Project Name: Sparks St Study Location: Queen St Municipality: Ottawa Study Date: Wed April, Study Time: 7: : & : : Study Type: Traffic Counts Driveway: Queen St, Layby (PUDO) End Inbound Outbound Two Way Time Right Left Right Left Hourly 7: 7: 7: 8 8: 8: 8: 8 8: 8 : 7 : : : 8 : 8 Peak Hour 8: : 7 7 Driveway: Queen St, Layby (PUDO) End Inbound Outbound Two Way Time Right Left Right Left Hourly : : : : 8 : 8 : : 7: 7: 8 7: 7: 8: Peak Hour : : 7 7 // : AM P:\8\\\Data Collection\TMC\Queen St Driveways \Queen St Driveway Traffic.xlsx QueenLayby
85 Project No: 8. Project Name: Sparks St Study Location: Queen St Municipality: Ottawa Study Date: Wed April, Study Time: 7: : & : : Study Type: Traffic Counts Driveway: Hotel & Public Parking Lot End Inbound Outbound Two Way Time Right Left Right Left Hourly 7: 7: 8 7 7: 8: 8 8: 7 8: 8 8: : 7 : : 8 : : Peak Hour 8: : Driveway: Hotel & Public Parking Lot End Inbound Outbound Two Way Time Right Left Right Left Hourly : 7 7 : 7 : : 7 : : 7 8 : 7: 7: 7 7 7: 7: 7 8: 7 8 Peak Hour : 7: 8 // : AM P:\8\\\Data Collection\TMC\Queen St Driveways \Queen St Driveway Traffic.xlsx Hotel& Public P Lot
86 Project No: 8. Project Name: Sparks St Study Location: Queen St Municipality: Ottawa Study Date: Wed April, Study Time: 7: : & : : Study Type: Traffic Counts Driveway: Capital Parking Lot End Inbound Outbound Two Way Time Right Left Right Left Hourly 7: 7: 7: 8: 7 7 8: 8: : 7 : : : : : 7 Peak Hour 7: 8: 7 Driveway: Capital Parking Lot End Inbound Outbound Two Way Time Right Left Right Left Hourly : : 8 : : 7 : : 8 : 7 7: 7 7: : 8 7: 8 8: 8 7 Peak Hour : : // : AM P:\8\\\Data Collection\TMC\Queen St Driveways \Queen St Driveway Traffic.xlsx Capital P Lot
87 Project No: 8 Project Name: Sparks St Study Location: Queen St Municipality: Ottawa Study Date: Wed April, Study Time: 7: : & : : Study Type: Traffic Counts AM PEAK HOUR 8: : 8: : Bay St Queen St Layby PUDO Hotel & Public Parking Lot Lyon St 7 N Queen St 7 Capital Parking Lot 7: 8: PM PEAK HOUR : : : 7: Bay St Queen St Layby PUDO Hotel & Public Parking Lot Lyon St 7 8 Queen St Capital Parking Lot : :
88 APPENDIX D: Existing Traffic Operations Capacity Analysis Sheets SPARKS STREET - TRANSPORTATION STUDY JUNE, 8-
89 Queues : Bay & Queen // Lane Group EBT WBT WBR NBT Lane Group Flow (vph) v/c Ratio....8 Control Delay Queue Delay.... Delay Queue Length th (m) Queue Length th (m) 7.. m..8 Internal Link Dist (m).7.. Turn Bay Length (m). Base Capacity (vph) Starvation Cap Reductn Spillback Cap Reductn Storage Cap Reductn Reduced v/c Ratio....8 Intersection Summary m Volume for th percentile queue is metered by upstream signal. Sparks // Existing AM Synchro Report SJB Page HCM Signalized Intersection Capacity Analysis : Bay & Queen // Movement EBL EBT EBR WBL WBT WBR NBL NBT NBR SBL SBT SBR Lane Configurations Volume (vph) 8 Ideal Flow (vphpl) Lost time (s).... Lane Util. Factor.... Frpb, ped/bikes.... Flpb, ped/bikes.... Frt...8. Flt Protected.8... Satd. Flow (prot) 7 7 Flt Permitted.8... Satd. Flow (perm) 7 7 Peak-hour factor, PHF Adj. Flow (vph) RTOR Reduction (vph) Lane Group Flow (vph) 7 8 Confl. Peds. (#/hr) Confl. Bikes (#/hr) Heavy Vehicles (%) 7% 8% % % % 8% % % % % % % Turn Type Perm NA NA Perm Perm NA Protected Phases 8 Permitted Phases 8 Actuated Green, G (s).... Effective Green, g (s).... Actuated g/c Ratio.... Clearance Time (s).... Vehicle Extension (s).... Lane Grp Cap (vph) v/s Ratio Prot. v/s Ratio Perm c... v/c Ratio.... Uniform Delay, d.... Progression Factor.... Incremental Delay, d.... Delay (s) Level of Service B A A B Approach Delay (s).... Approach LOS B A B A Intersection Summary HCM Control Delay. HCM Level of Service B HCM Volume to Capacity ratio.8 Actuated Cycle Length (s). Sum of lost time (s) 8. Intersection Capacity Utilization.% ICU Level of Service B Analysis Period (min) c Critical Lane Group Sparks // Existing AM Synchro Report SJB Page
90 Queues : Lyon & Queen // Lane Group EBT WBT SBT Lane Group Flow (vph) v/c Ratio..8. Control Delay. 8.. Queue Delay... Delay. 8.. Queue Length th (m).7..8 Queue Length th (m) Internal Link Dist (m)... Turn Bay Length (m) Base Capacity (vph) 878 Starvation Cap Reductn 7 Spillback Cap Reductn Storage Cap Reductn Reduced v/c Ratio..8. Intersection Summary Sparks // Existing AM Synchro Report SJB Page HCM Signalized Intersection Capacity Analysis : Lyon & Queen // Movement EBL EBT EBR WBL WBT WBR NBL NBT NBR SBL SBT SBR Lane Configurations Volume (vph) 8 8 Ideal Flow (vphpl) Lost time (s)... Lane Util. Factor...8 Frpb, ped/bikes... Flpb, ped/bikes...8 Frt.7.. Flt Protected... Satd. Flow (prot) 7 7 Flt Permitted... Satd. Flow (perm) 7 Peak-hour factor, PHF Adj. Flow (vph) RTOR Reduction (vph) Lane Group Flow (vph) 7 7 Confl. Peds. (#/hr) Confl. Bikes (#/hr) Heavy Vehicles (%) % % % % % % % % % % % % Turn Type NA Perm NA Perm NA Protected Phases 8 Permitted Phases 8 Actuated Green, G (s).. 7. Effective Green, g (s).. 7. Actuated g/c Ratio... Clearance Time (s).. Vehicle Extension (s).. Lane Grp Cap (vph) 87 v/s Ratio Prot c.8 v/s Ratio Perm..8 v/c Ratio..8. Uniform Delay, d..7.7 Progression Factor... Incremental Delay, d... Delay (s). 7.. Level of Service D D B Approach Delay (s) Approach LOS D D A B Intersection Summary HCM Control Delay. HCM Level of Service B HCM Volume to Capacity ratio. Actuated Cycle Length (s). Sum of lost time (s). Intersection Capacity Utilization 7.% ICU Level of Service D Analysis Period (min) c Critical Lane Group Sparks // Existing AM Synchro Report SJB Page
91 Queues : Bay & Sparks // Lane Group WBT NBT Lane Group Flow (vph) v/c Ratio.7. Control Delay.. Queue Delay.. Delay..8 Queue Length th (m).7. Queue Length th (m)..7 Internal Link Dist (m).. Turn Bay Length (m) Base Capacity (vph) Starvation Cap Reductn Spillback Cap Reductn Storage Cap Reductn Reduced v/c Ratio.7. Intersection Summary Sparks // Existing AM Synchro Report SJB Page HCM Signalized Intersection Capacity Analysis : Bay & Sparks // Movement EBL EBT EBR WBL WBT WBR NBL NBT NBR SBL SBT SBR Lane Configurations Volume (vph) Ideal Flow (vphpl) Lost time (s).. Lane Util. Factor.. Frpb, ped/bikes.8. Flpb, ped/bikes.. Frt.. Flt Protected.. Satd. Flow (prot) 88 Flt Permitted.. Satd. Flow (perm) 88 Peak-hour factor, PHF Adj. Flow (vph) 8 RTOR Reduction (vph) Lane Group Flow (vph) 7 Confl. Peds. (#/hr) 7 7 Confl. Bikes (#/hr) Heavy Vehicles (%) % % % % % % % % % % % % Turn Type NA Perm NA Protected Phases 8 Permitted Phases Actuated Green, G (s) 8.. Effective Green, g (s).. Actuated g/c Ratio.. Clearance Time (s).. Vehicle Extension (s).. Lane Grp Cap (vph) v/s Ratio Prot c. v/s Ratio Perm.8 v/c Ratio.. Uniform Delay, d. 7. Progression Factor..7 Incremental Delay, d.. Delay (s)..7 Level of Service B A Approach Delay (s)...7. Approach LOS A B A A Intersection Summary HCM Control Delay. HCM Level of Service A HCM Volume to Capacity ratio. Actuated Cycle Length (s). Sum of lost time (s) 7. Intersection Capacity Utilization.% ICU Level of Service A Analysis Period (min) c Critical Lane Group Sparks // Existing AM Synchro Report SJB Page
92 Queues : Lyon & Sparks // Lane Group EBR SBT Lane Group Flow (vph) 7 8 v/c Ratio.7. Control Delay..7 Queue Delay.. Delay..7 Queue Length th (m).. Queue Length th (m) Internal Link Dist (m).7 Turn Bay Length (m) Base Capacity (vph) 7 Starvation Cap Reductn Spillback Cap Reductn Storage Cap Reductn Reduced v/c Ratio.. Intersection Summary Sparks // Existing AM Synchro Report SJB Page 7 HCM Signalized Intersection Capacity Analysis : Lyon & Sparks // Movement EBL EBR NBL NBT SBT SBR Lane Configurations Volume (vph) 7 Ideal Flow (vphpl) Lost time (s).8. Lane Util. Factor.. Frpb, ped/bikes.77. Flpb, ped/bikes.. Frt.8. Flt Protected.. Satd. Flow (prot) Flt Permitted.. Satd. Flow (perm) Peak-hour factor, PHF Adj. Flow (vph) RTOR Reduction (vph) 8 Lane Group Flow (vph) 8 Confl. Peds. (#/hr) 7 Confl. Bikes (#/hr) Heavy Vehicles (%) % % % % % % Turn Type Perm NA Protected Phases Permitted Phases Actuated Green, G (s). 8. Effective Green, g (s). 8. Actuated g/c Ratio..87 Clearance Time (s).8. Vehicle Extension (s).. Lane Grp Cap (vph) v/s Ratio Prot c. v/s Ratio Perm c. v/c Ratio..7 Uniform Delay, d.. Progression Factor.. Incremental Delay, d.. Delay (s) 7.. Level of Service D A Approach Delay (s) 7... Approach LOS D A A Intersection Summary HCM Control Delay. HCM Level of Service A HCM Volume to Capacity ratio.8 Actuated Cycle Length (s) 7. Sum of lost time (s). Intersection Capacity Utilization 7.% ICU Level of Service D Analysis Period (min) c Critical Lane Group Sparks // Existing AM Synchro Report SJB Page 8
93 HCM Unsignalized Intersection Capacity Analysis : Queen & Parking Dwy // Movement EBL EBT EBR WBL WBT WBR NBL NBT NBR SBL SBT SBR Lane Configurations Volume (veh/h) 7 Sign Control Free Free Stop Stop Grade % % % % Peak Hour Factor Hourly flow rate (vph) Pedestrians Lane Width (m).... Walking Speed (m/s).... Percent Blockage Right turn flare (veh) Median type None None Median storage veh) Upstream signal (m) 8 7 px, platoon unblocked vc, conflicting volume vc, stage conf vol vc, stage conf vol vcu, unblocked vol tc, single (s) tc, stage (s) tf (s) p queue free % 7 cm capacity (veh/h) Direction, Lane # EB WB NB SB Volume 7 Volume Left 7 Volume Right 7 csh Volume to Capacity.... Queue Length th (m).... Control Delay (s).7... Lane LOS A A B B Approach Delay (s).7... Approach LOS B B Intersection Summary Average Delay. Intersection Capacity Utilization.% ICU Level of Service A Analysis Period (min) Sparks // Existing AM Synchro Report SJB Page Queues : Bay & Queen // Lane Group EBT WBT WBR NBT Lane Group Flow (vph) 8 8 v/c Ratio.7... Control Delay..7.. Queue Delay.... Delay..7.. Queue Length th (m).8... Queue Length th (m). m7. m8. 8. Internal Link Dist (m).7.. Turn Bay Length (m). Base Capacity (vph) 7 8 Starvation Cap Reductn Spillback Cap Reductn Storage Cap Reductn Reduced v/c Ratio.7... Intersection Summary m Volume for th percentile queue is metered by upstream signal. Sparks // Existing PM Synchro Report SJB Page
94 HCM Signalized Intersection Capacity Analysis : Bay & Queen // Movement EBL EBT EBR WBL WBT WBR NBL NBT NBR SBL SBT SBR Lane Configurations Volume (vph) Ideal Flow (vphpl) Lost time (s).... Lane Util. Factor.... Frpb, ped/bikes Flpb, ped/bikes.8... Frt...8. Flt Protected.8... Satd. Flow (prot) 7 87 Flt Permitted.... Satd. Flow (perm) 7 87 Peak-hour factor, PHF Adj. Flow (vph) 7 RTOR Reduction (vph) Lane Group Flow (vph) 8 88 Confl. Peds. (#/hr) Confl. Bikes (#/hr) 8 Heavy Vehicles (%) 7% 8% % % % 8% % % % % % % Turn Type Perm NA NA Perm Perm NA Protected Phases 8 Permitted Phases 8 Actuated Green, G (s) Effective Green, g (s).... Actuated g/c Ratio.... Clearance Time (s).... Vehicle Extension (s).... Lane Grp Cap (vph) v/s Ratio Prot c. v/s Ratio Perm... v/c Ratio Uniform Delay, d.... Progression Factor.... Incremental Delay, d....8 Delay (s)..7.. Level of Service C B C B Approach Delay (s).... Approach LOS C C B A Intersection Summary HCM Control Delay. HCM Level of Service B HCM Volume to Capacity ratio. Actuated Cycle Length (s). Sum of lost time (s) 8. Intersection Capacity Utilization 7.7% ICU Level of Service C Analysis Period (min) c Critical Lane Group Sparks // Existing PM Synchro Report SJB Page Queues : Lyon & Queen // Lane Group EBT WBT SBT Lane Group Flow (vph) 8 v/c Ratio..88. Control Delay.7..7 Queue Delay... Delay.7..7 Queue Length th (m) Queue Length th (m). #.. Internal Link Dist (m)... Turn Bay Length (m) Base Capacity (vph) Starvation Cap Reductn Spillback Cap Reductn Storage Cap Reductn Reduced v/c Ratio..88. Intersection Summary # th percentile volume exceeds capacity, queue may be longer. Queue shown is maximum after two cycles. Sparks // Existing PM Synchro Report SJB Page
95 HCM Signalized Intersection Capacity Analysis : Lyon & Queen // Movement EBL EBT EBR WBL WBT WBR NBL NBT NBR SBL SBT SBR Lane Configurations Volume (vph) Ideal Flow (vphpl) Lost time (s)... Lane Util. Factor...8 Frpb, ped/bikes... Flpb, ped/bikes...8 Frt... Flt Protected..8. Satd. Flow (prot) 8 Flt Permitted..7. Satd. Flow (perm) Peak-hour factor, PHF Adj. Flow (vph) RTOR Reduction (vph) Lane Group Flow (vph) Confl. Peds. (#/hr) 7 7 Confl. Bikes (#/hr) 8 Heavy Vehicles (%) % % % % % % % % % % % % Turn Type NA Perm NA Perm NA Protected Phases 8 Permitted Phases 8 Actuated Green, G (s) Effective Green, g (s)... Actuated g/c Ratio...7 Clearance Time (s)... Vehicle Extension (s)... Lane Grp Cap (vph) 7 v/s Ratio Prot. v/s Ratio Perm c.. v/c Ratio..88. Uniform Delay, d... Progression Factor... Incremental Delay, d... Delay (s) 7... Level of Service B C A Approach Delay (s) Approach LOS B C A A Intersection Summary HCM Control Delay 8. HCM Level of Service B HCM Volume to Capacity ratio. Actuated Cycle Length (s). Sum of lost time (s). Intersection Capacity Utilization 8.% ICU Level of Service C Analysis Period (min) c Critical Lane Group Sparks // Existing PM Synchro Report SJB Page Queues : Bay & Sparks // Lane Group WBT NBT Lane Group Flow (vph) v/c Ratio.. Control Delay 8..8 Queue Delay.. Delay 8.. Queue Length th (m).7. Queue Length th (m).8 8. Internal Link Dist (m).. Turn Bay Length (m) Base Capacity (vph) Starvation Cap Reductn 7 Spillback Cap Reductn Storage Cap Reductn Reduced v/c Ratio.. Intersection Summary Sparks // Existing PM Synchro Report SJB Page
96 HCM Signalized Intersection Capacity Analysis : Bay & Sparks // Movement EBL EBT EBR WBL WBT WBR NBL NBT NBR SBL SBT SBR Lane Configurations Volume (vph) Ideal Flow (vphpl) Lost time (s).. Lane Util. Factor.. Frpb, ped/bikes.. Flpb, ped/bikes.. Frt.. Flt Protected.. Satd. Flow (prot) 7 Flt Permitted.. Satd. Flow (perm) 7 Peak-hour factor, PHF Adj. Flow (vph) RTOR Reduction (vph) Lane Group Flow (vph) Confl. Peds. (#/hr) Confl. Bikes (#/hr) Heavy Vehicles (%) % % % % % % % % 8% % % % Turn Type NA Perm NA Protected Phases 8 Permitted Phases Actuated Green, G (s) 8.. Effective Green, g (s).. Actuated g/c Ratio.. Clearance Time (s).. Vehicle Extension (s).. Lane Grp Cap (vph) v/s Ratio Prot c. v/s Ratio Perm. v/c Ratio.. Uniform Delay, d. 8. Progression Factor.. Incremental Delay, d..7 Delay (s).. Level of Service B B Approach Delay (s).... Approach LOS A B B A Intersection Summary HCM Control Delay.7 HCM Level of Service B HCM Volume to Capacity ratio. Actuated Cycle Length (s). Sum of lost time (s) 7. Intersection Capacity Utilization 8.8% ICU Level of Service B Analysis Period (min) c Critical Lane Group Sparks // Existing PM Synchro Report SJB Page Queues : Lyon & Sparks // Lane Group EBR SBT Lane Group Flow (vph) 8 v/c Ratio.. Control Delay.. Queue Delay.. Delay.. Queue Length th (m).. Queue Length th (m).. Internal Link Dist (m).7 Turn Bay Length (m) Base Capacity (vph) 7 7 Starvation Cap Reductn Spillback Cap Reductn Storage Cap Reductn Reduced v/c Ratio.. Intersection Summary Sparks // Existing PM Synchro Report SJB Page 7
97 HCM Signalized Intersection Capacity Analysis : Lyon & Sparks // Movement EBL EBR NBL NBT SBT SBR Lane Configurations Volume (vph) 7 Ideal Flow (vphpl) Lost time (s).8. Lane Util. Factor.. Frpb, ped/bikes.8. Flpb, ped/bikes.. Frt.8. Flt Protected.. Satd. Flow (prot) Flt Permitted.. Satd. Flow (perm) Peak-hour factor, PHF Adj. Flow (vph) 7 7 RTOR Reduction (vph) Lane Group Flow (vph) 87 Confl. Peds. (#/hr) Confl. Bikes (#/hr) Heavy Vehicles (%) % % % % % % Turn Type Perm NA Protected Phases Permitted Phases Actuated Green, G (s).. Effective Green, g (s).. Actuated g/c Ratio..8 Clearance Time (s).8. Vehicle Extension (s).. Lane Grp Cap (vph) 8 v/s Ratio Prot c.7 v/s Ratio Perm c. v/c Ratio.. Uniform Delay, d.. Progression Factor.. Incremental Delay, d.. Delay (s)..8 Level of Service C A Approach Delay (s)...8 Approach LOS C A A Intersection Summary HCM Control Delay. HCM Level of Service A HCM Volume to Capacity ratio. Actuated Cycle Length (s).8 Sum of lost time (s). Intersection Capacity Utilization.7% ICU Level of Service A Analysis Period (min) c Critical Lane Group Sparks // Existing PM Synchro Report SJB Page 8 HCM Unsignalized Intersection Capacity Analysis : Queen & Parking Dwy // Movement EBL EBT EBR WBL WBT WBR NBL NBT NBR SBL SBT SBR Lane Configurations Volume (veh/h) Sign Control Free Free Stop Stop Grade % % % % Peak Hour Factor Hourly flow rate (vph) Pedestrians Lane Width (m).. Walking Speed (m/s).. Percent Blockage Right turn flare (veh) Median type None None Median storage veh) Upstream signal (m) 7 7 px, platoon unblocked vc, conflicting volume vc, stage conf vol vc, stage conf vol vcu, unblocked vol 8 8 tc, single (s) tc, stage (s) tf (s) p queue free % 8 77 cm capacity (veh/h) Direction, Lane # EB WB NB SB Volume Volume Left 8 Volume Right 7 8 csh 7 7 Volume to Capacity.... Queue Length th (m).... Control Delay (s) Lane LOS C C Approach Delay (s) Approach LOS C C Intersection Summary Average Delay. Intersection Capacity Utilization.% ICU Level of Service A Analysis Period (min) Sparks // Existing PM Synchro Report SJB Page
98 APPENDIX E: Vehicle Manoeuvring SPARKS STREET - TRANSPORTATION STUDY JUNE, 8-
99
100 APPENDIX F: As of Right Comparison, Mode Split and Routing SPARKS STREET - TRANSPORTATION STUDY JUNE, 8-
101 Sparks 8 As of Right Trip Generation Existing Site AM Peak SAT Peak in out two way in out two way Office Office Garage Existing Counts Office PUDO Existing Counts As of Right Trip Generation AM Peak SAT Peak in out two way in out two way Apartment ITE Baseline Vehicular Trip Gen. Rate ITE High Rise Apartment units Person Trip Rate (,). passengers per vehicle Person Trips Car Driver % 8 Car Passenger % Transit % Non Motorized % Equivalent Rate % Vehicular Trips Rounded to Nearest Hotel ITE Baseline Vehicular Trip Gen. Rate ITE Hotel units Person Trip Rate (,). passengers per vehicle Person Trips Car Driver % Car Passenger % Non Motorized % Transit % Taxi primary passenger % Taxi Second passenger % Passenger Car Trips 7 straight to garage % using PUDO / Valet (7) () () () () () Taxi Calls Taxi Trips (in and out of PUDO) Vehicular Trips Rounded to Nearest AS OR RIGHT AL 8 8 Notes:. Analysis assumes inherent % modal split in Baseline ITE data.. Vehicular occupancy adopted from ITE Trip Generation Manual Handbook, Appendix C. for apartments,. for hotels. Mode split based on review of information in Trans O D Survey Report for Ottawa Centre (AM outbound trips from district). ( ) Bracketed values reflect the entry / exit at the PUDO and the parking garage which effective dou8bles the in and out volumes at the site driveways.. Statistics based on information provided by Morguard Properties and WZMH.
102
9 Leeming Drive Redevelopment Ottawa, ON Transportation Brief. Prepared By: Stantec Consulting Ltd.
 9 Leeming Drive Redevelopment Ottawa, ON Transportation Brief Prepared By: Stantec Consulting Ltd. TIA GUIDELINES CHECKLIST Report Context Municipal Address Comment: Section 1.1 Location relative to major
HENDERSON DEVELOPMENT 213, 217, 221, 221 ½, 223 HENDERSON AVENUE and 65 TEMPLETON STREET OTTAWA, ONTARIO TRANSPORTATION OVERVIEW.
 HENDERSON DEVELOPMENT 213, 217, 221, 221 ½, 223 HENDERSON AVENUE and 65 TEMPLETON STREET OTTAWA, ONTARIO TRANSPORTATION OVERVIEW Prepared for: 2294170 Ontario Inc. February 2, 2017 117-652 Report_1.doc
OFFICE/RETAIL DEVELOPMENT 1625 BANK STREET OTTAWA, ONTARIO TRANSPORTATION BRIEF. Prepared for: Canada Inc.
 OFFICE/RETAIL DEVELOPMENT 1625 BANK STREET OTTAWA, ONTARIO TRANSPORTATION BRIEF Prepared for: 9402209 Canada Inc. December 15, 2015 115-625 Report_2.doc D. J. Halpenny & Associates Ltd. Consulting Transportation
MEDICAL/OFFICE BUILDING 1637 BANK STREET OTTAWA, ONTARIO TRANSPORTATION OVERVIEW. Prepared for:
 MEDICAL/OFFICE BUILDING 1637 BANK STREET OTTAWA, ONTARIO TRANSPORTATION OVERVIEW Prepared for: 2434984 Ontario Inc. 13-5510 Canotek Road Ottawa, Ontario K1J 9J5 June 4, 2015 115-613 Report_2.doc D. J.
INDUSTRIAL BUILDING 1660 COMSTOCK ROAD CITY OF OTTAWA TRANSPORTATION OVERVIEW. Prepared for:
 INDUSTRIAL BUILDING 1660 COMSTOCK ROAD CITY OF OTTAWA TRANSPORTATION OVERVIEW Prepared for: Simluc Contractors Limited 2550 Blackwell Street, Ottawa K1B 5R1 October 18, 2013 113-584 Overview_1.doc D. J.
HOLIDAY INN HOTEL 235 KING EDWARD AVENUE CITY OF OTTAWA TRANSPORTATION BRIEF. Prepared for:
 HOLIDAY INN HOTEL 235 KING EDWARD AVENUE CITY OF OTTAWA TRANSPORTATION BRIEF Prepared for: Momentum Planning & Communications 1165 Greenlawn Crescent Ottawa, ON K1L 6C2 June 29, 2015 115-618 Brief_1.doc
Place Vanier 250 Montreal Road Transportation Impact Study Addendum. Prepared for Broccolini Construction September 20 th, 2012
 Update for the May 31 st, 2012 Traffic Impact Study Prepared for Broccolini Construction 111-23596-00 September 20 th, 2012 2611 Queensview Drive, Suite 300, Ottawa, Ontario CANADA K2B 8K2 Telephone: 613-829-2800
The proposed development is located within 800m of an existing Transit Station where infill developments and intensification are encouraged.
 Stantec Consulting Ltd. 1331 Clyde Avenue, Suite 4 Ottawa ON K2C 3G4 Tel: (613) 722-442 Fax: (613) 722-2799 May 14, 213 File: 1638823 Robinson Park Development Corp. 5699 Power Road Ottawa, ON, K1G 3N4
CPC Parking Lot Riverside Drive. Transportation Brief
 CPC Parking Lot 2785 Riverside Drive Transportation Brief Prepared By: NOVATECH Suite 2, 24 Michael Cowpland Drive Ottawa, Ontario K2M P6 7 / 5 / 25 Novatech File: 49 Ref: R-25-22 July 5 th, 25 City of
INDUSTRIAL BUILDING 3009 HAWTHORNE ROAD CITY OF OTTAWA TRANSPORTATION OVERVIEW REVISED. Prepared for: Canada Inc.
 INDUSTRIAL BUILDING 3009 HAWTHORNE ROAD CITY OF OTTAWA TRANSPORTATION OVERVIEW REVISED Prepared for: 7849648 Canada Inc. Octiober 1, 2015 114-598 Overview_2.doc D. J. Halpenny & Associates Ltd. Consulting
QUICKIE C STORE AND GAS BAR 1780 HERON ROAD OTTAWA, ONTARIO TRANSPORTATION BRIEF. Prepared for:
 QUICKIE C STORE AND GAS BAR 1780 HERON ROAD OTTAWA, ONTARIO TRANSPORTATION BRIEF Prepared for: Quickie Convenience Stores Larny Holdings Ltd. c/o PBC Group April 15, 2015 115-615 Report_1.doc D. J. Halpenny
URBAN QUARRY HEADQUARTERS 2717 STEVENAGE DRIVE CITY OF OTTAWA TRANSPORTATION OVERVIEW. Prepared for: Urban Quarry 4123 Belgreen Drive, Ottawa K1G 3N2
 URBAN QUARRY HEADQUARTERS 2717 STEVENAGE DRIVE CITY OF OTTAWA TRANSPORTATION OVERVIEW Prepared for: Urban Quarry 4123 Belgreen Drive, Ottawa K1G 3N2 February 27, 2014 113-584 Overview_1.doc D. J. Halpenny
VIVA RETIREMENT COMMUNITIES OAKVILLE TRAFFIC IMPACT STUDY
 VIVA RETIREMENT COMMUNITIES OAKVILLE TRAFFIC IMPACT STUDY VIVA RETIREMENT COMMUNITIES OAKVILLE TRAFFIC IMPACT STUDY DECEMBER 2012 READ, VOORHEES & ASSOCIATES TORONTO, ONTARIO Read, Voorhees & Associates
19 July 2016 OUR REF:
 19 July 2016 OUR REF: 602263-01000 194168 Ontario Ltd. 320 McRae Street Ottawa, ON K1Z 5R8 Attention: Brian Casagrande Dear Brian: Re: 320 McRae/1976 Scott Redevelopment CTS Addendum #1 This Addendum has
OTTAWA TRAIN YARDS PHASE 3 DEVELOPMENT CITY OF OTTAWA TRANSPORTATION IMPACT STUDY. Prepared for:
 OTTAWA TRAIN YARDS PHASE 3 DEVELOPMENT CITY OF OTTAWA TRANSPORTATION IMPACT STUDY Prepared for: The Ottawa Train Yards Inc. 223 Colonnade Road South, Suite 212 Nepean, Ontario K2E 7K3 January 17, 2012
APARTMENT BUILDING DEVELOPMENT 1161 HERON ROAD OTTAWA, ONTARIO TRANSPORTATION IMPACT STUDY. Prepared for:
 APARTMENT BUILDING DEVELOPMENT 1161 HERON ROAD OTTAWA, ONTARIO TRANSPORTATION IMPACT STUDY Prepared for: 1649362 Ontario Inc. c/o Manor Park Management 231 Brittany Drive, Suite D Ottawa ON K1K 0R8 July
HILTON GARDEN INN HOTEL HOTEL EXPANSION 2400 ALERT ROAD, OTTAWA TRANSPORTATION BRIEF. Prepared for:
 HILTON GARDEN INN HOTEL HOTEL EXPANSION 2400 ALERT ROAD, OTTAWA TRANSPORTATION BRIEF Prepared for: Bona Building & Management Co. Ltd. Place Vanier, 333 North River Road Vanier, Ontario K1L 8B9 October
FAIRFIELD INN & SUITES HOTEL 135 THAD JOHNSON PRIVATE OTTAWA TRANSPORTATION BRIEF. Prepared for:
 FAIRFIELD INN & SUITES HOTEL 135 THAD JOHNSON PRIVATE OTTAWA TRANSPORTATION BRIEF Prepared for: Bona Building & Management Co. Ltd. Place Vanier, 333 North River Road Vanier, Ontario K1L 8B9 August 12,
MEETING FACILITY 2901 GIBFORD DRIVE CITY OF OTTAWA TRANSPORTATION BRIEF. Prepared for: Holiday Inn Express 2881 Gibford Drive Ottawa, ON K1V 2L9
 MEETING FACILITY 2901 GIBFORD DRIVE CITY OF OTTAWA TRANSPORTATION BRIEF Prepared for: Holiday Inn Express 2881 Gibford Drive Ottawa, ON K1V 2L9 December 18, 2012 112-566 Brief_1.doc D. J. Halpenny & Associates
NEW YORK CENTRAL PARK SUBDIVISION BLAIS STREET/ST-PIERRE STREET EMBRUN, ONTARIO TRAFFIC IMPACT STUDY. Prepared for:
 NEW YORK CENTRAL PARK SUBDIVISION BLAIS STREET/ST-PIERRE STREET EMBRUN, ONTARIO TRAFFIC IMPACT STUDY Prepared for: Solidex Holdings Limited & Investissement Maurice Lemieux Investments Attn: Mr. Anthony
COMMERCIAL DEVELOPMENT 2015 ROBERTSON ROAD OTTAWA, ONTARIO TRANSPORTATION BRIEF. Prepared for:
 COMMERCIAL DEVELOPMENT 2015 ROBERTSON ROAD OTTAWA, ONTARIO TRANSPORTATION BRIEF Prepared for: First Bay Properties Inc. 311 Richmond Road, Suite 203 Ottawa, ON K1Z 6X3 August 8, 2017 117-663 Brief_1.doc
Traffic Impact Analysis Chatham County Grocery Chatham County, NC
 Chatham County Grocery Chatham County, NC TABLE OF CONTENTS 1. INTRODUCTION... 1 1.1. Location and Study Area... 1 1.2. Proposed Land Use and Access... 2 1.3. Adjacent Land Uses... 2 1.4. Existing ways...
BLUE SEA VILLAGE MER BLEUE 2159 MER BLEUE ROAD OTTAWA, ONTARIO TRANSPORTATION IMPACT ASSESSMENT. Prepared for: Ontario Limited.
 BLUE SEA VILLAGE MER BLEUE 2159 MER BLEUE ROAD OTTAWA, ONTARIO TRANSPORTATION IMPACT ASSESSMENT Prepared for: 2534189 Ontario Limited April 6, 2018 117-668 TIA Report_2.doc D. J. Halpenny & Associates
5858 N COLLEGE, LLC N College Avenue Traffic Impact Study
 5858 N COLLEGE, LLC nue Traffic Impact Study August 22, 2016 Contents Traffic Impact Study Page Preparer Qualifications... 1 Introduction... 2 Existing Roadway Conditions... 5 Existing Traffic Conditions...
TRANSPORTATION IMPACT STUDY
 Dundas MEP Developments Inc. City of Toronto 219 and 231 Dundas Street East, Proposed Mixed-Use Development TRANSPORTATION IMPACT STUDY 9782/2 April 216 LEA Consulting Ltd. Consulting Engineers & Planners
Traffic Impact Analysis Walton Acres at Riverwood Athletic Club Clayton, NC
 Traffic Impact Analysis Walton Acres at Riverwood Athletic Club Clayton, NC 1. TABLE OF CONTENTS INTRODUCTION...1 1.1. Site Location and Study Area...1 1.2. Proposed Land Use and Site Access...2 1.3.
Walmart (Store # ) 60 th Street North and Marion Road Sioux Falls, South Dakota
 60 th Street North and Marion Road Sioux Falls, South Dakota") Walmart (Store #4865-00) 60 th Street North and Marion Road Sioux Falls, South Dakota Prepared for: Wal-Mart Stores, Inc. Bentonville, Arkansas Prepared by: Kimley-Horn and Associates, Inc. ã2013 Kimley-Horn
Walmart (Store #4865-00) 60 th Street North and Marion Road Sioux Falls, South Dakota Prepared for: Wal-Mart Stores, Inc. Bentonville, Arkansas Prepared by: Kimley-Horn and Associates, Inc. ã2013 Kimley-Horn
APPENDIX H EXISTING TRAFFIC CONDITIONS ANALYSIS
 APPENDIX H EXISTING TRAFFIC CONDITIONS ANALYSIS MEMO : Peter Steacy, P.Eng. Date: December 3, 2014 : Ian Borsuk, P.Eng. Job No.: 3414015-000 Subject: City of Ottawa O-Train Extension Planning & EA Study
Transportation Impact Study for Abington Terrace
 Transportation Impact Study for Abington Terrace Abington Township, Montgomery County, PA Sandy A. Koza, P.E., PTOE PA PE License Number PE059911 Prepared by McMahon Associates, Inc. 425 Commerce Drive,
Gateway Transportation Study
 Gateway Transportation Study Amherst, Massachusetts SUBMITTED TO University of Massachusetts Amherst Town of Amherst SUBMITTED BY Vanasse Hangen Brustlin, Inc. Watertown, Massachusetts March 213 Back of
Harrah s Station Square Casino
 Transportation Analysis Harrah s Station Square Casino Pittsburgh, Pennsylvania Submitted To: City of Pittsburgh and Pennsylvania Gaming Control Board Prepared By: DKS Associates GAI Consultants December
TRAFFIC IMPACT ANALYSIS
 TRAFFIC IMPACT ANALYSIS FOR THE CHAMPAIGN UNIT#4 SCHOOL DISTRICT PROPOSED HIGH SCHOOL (SPALDING PARK SITE) IN THE CITY OF CHAMPAIGN Final Report Champaign Urbana Urbanized Area Transportation Study 6/24/2014
2136 And 2148 Trafalgar Road Townhouse Development Traffic Brief. Paradigm Transportation Solutions Limited
 2136 And 2148 Trafalgar Road Townhouse Development Traffic Brief Paradigm Transportation Solutions Limited March 217 March 217 Project: 1627 Diana Vlasic, M.C.I.P., R.P.P Metropolitan Consulting 445 Paletta
CastleGlenn Consultants Inc.
 February 1 st, 2010 CastleGlenn Consultants Inc. Engineers, Project Managers & Planners Mr. Kevin Yemm Planning and Land Development Richraft Ltd. 2280 St. Laurent Boulevard Suite 201 Ottawa, Ontario (Tel:
DUNBOW ROAD FUNCTIONAL PLANNING
 DUNBOW ROAD FUNCTIONAL PLANNING Final Report August 3, 216 #31, 316 5th Avenue NE Calgary, AB T2A 6K4 Phone: 43.273.91 Fax: 43.273.344 wattconsultinggroup.com Dunbow Road Functional Planning Final Report
Traffic Impact Study WestBranch Residential Development Davidson, NC March 2016
 Traffic Impact Study WestBranch Residential Development Davidson, NC March 216 TRAFFIC IMPACT STUDY FOR THE WestBranch Residential Development LOCATED IN DAVIDSON, NC Prepared For: Lennar Carolinas, LLC
Magnolia Place. Traffic Impact Analysis. Prepared for: City of San Mateo. Prepared by: Hexagon Transportation Consultants, Inc.
 Magnolia Place Traffic Impact Analysis Prepared for: City of San Mateo Prepared by: Hexagon Transportation Consultants, Inc. Updated January 4, 2010 Table of Contents 1. Introduction...1 2. Existing Conditions...6
TRANSPORTATION ANALYSIS REPORT US Route 6 Huron, Erie County, Ohio
 TRANSPORTATION ANALYSIS REPORT US Route 6 Huron, Erie County, Ohio December 12, 2012 Prepared for: The City of Huron 417 Main Huron, OH 44839 Providing Practical Experience Technical Excellence and Client
Traffic Circulation Study for Neighborhood Southwest of Mockingbird Lane and Airline Road, Highland Park, Texas
 ARIZONA TEXAS NEW MEXICO OKLAHOMA February 13, 2015 Mr. Meran Dadgostar P.E., R.S. Town of Highland Park 4700 Drexel Dr. Highland Park, Texas 75205 Re: Traffic Circulation Study for Neighborhood Southwest
192 & 196 Bronson Avenue / 31 Cambridge Street
 Bronson Inc. July 213 192 & 196 Bronson Avenue / 31 Cambridge Street TRANSPORTATION BRIEF Prepared by: Study 192 Bronson Type Avenue July 213 Study Transportation Name Brief February 211 TB Check List
TRAFFIC IMPACT STUDY And A TRAFFIC SIGNAL WARRANT ANALYSIS FOR A SENIOR LIVING AND APARTMENT DEVELOPMENT
 TRAFFIC IMPACT STUDY And A TRAFFIC SIGNAL WARRANT ANALYSIS FOR A SENIOR LIVING AND APARTMENT DEVELOPMENT DEERFIELD TOWNSHIP, WARREN COUNTY, OHIO Nantucket Circle and Montgomery Road () Prepared for: ODLE
CITY OF OTTAWA ROADWAY MODIFICATION APPROVAL UNDER DELEGATED AUTHORITY
 RMA-2015-ATM-038 CITY OF OTTAWA ROADWAY MODIFICATION APPROVAL UNDER DELEGATED AUTHORITY DATE: April 22, 2015 SUBJECT Approval of Roadway Modifications Recommended through an Area Traffic Management Study
Bistro 6. City of Barrie. Traffic Impact Study for Pratt Hansen Group Inc. Type of Document: Final Report. Project Number: JDE 1748
 City of Barrie Traffic Impact Study for Pratt Hansen Group Inc. Type of Document: Final Report Project Number: JDE 1748 Date Submitted: June 12 th, 2017 06/12/17 John Northcote, P.Eng. Professional License
December TRANSPORTATION BRIEF 1-19 Beechwood Avenue, Ottawa, ON TRANSPORTATION INFORMATION TE WATER
 December 2012 TRANSPORTATION BRIEF 1-19 Beechwood Avenue, Ottawa, ON TRANSPORTATION INFORMATION TE WATER 1-19 Beechwood Avenue Mixed Use Development Transportation Brief prepared for: Minto Communities
Having held a public hearing, that Council approve:
 3. MODIFICATIONS TO MERIVALE ROAD FROM FALLOWFIELD ROAD TO OLD HIGHWAY 16 TO ACCOMMODATE THE GROWTH WITHIN THE SOUTH MERIVALE BUSINESS PARK - PUBLIC HEARING COMMITTEE RECOMMENDATIONS Having held a public
Henderson Avenue Mixed-Use Development
 Zoning Case: Z145-3 Traffic Impact Analysis Henderson Avenue Mixed-Use Development Dallas, TX October 26 th, 216 Kimley-Horn and Associates, Inc. Dallas, Texas Project #644827 Registered Firm F-928 Traffic
Waterford Lakes Small Area Study
 Waterford Lakes Small Area Study Existing Traffic Conditions PREPARED FOR: ORANGE COUNTY PUBLIC WORKS DEPARTMENT TRAFFIC ENGINEERING DIVISION ORLANDO, FLORIDA PREPARED WITH: INWOOD CONSULTING ENGINEERS
Joe Rocca P.Eng., Traffic and Asset Management Supervisor. Review for Proposed Kingsway Sports and Entertainment Complex, City of Greater Sudbury
 LETTER REPORT TO: Joe Rocca P.Eng., Traffic and Asset Management Supervisor FROM: Brett Sears and Ubaid Ali, WSP SUBJECT: Review for Proposed Kingsway Sports and Entertainment Complex, City of Greater
ORLEANS GARDENS SHOPPING CENTRE 1615 ORLEANS BOULEVARD CITY OF OTTAWA, ONTARIO TRANSPORTATION IMPACT STUDY. Prepared for:
 ORLEANS GARDENS SHOPPING CENTRE 1615 ORLEANS BOULEVARD CITY OF OTTAWA, ONTARIO TRANSPORTATION IMPACT STUDY Prepared for: Orleans Gardens Shopping Centre Inc. 2851 John Street, Suite 1 Markham, ON K3R 5R7
Parking Lot P6C Transportation Impact Assessment
 Transportation Carleton University Parking Lot P6C Transportation Impact Assessment Prepared by: AECOM 302 1150 Morrison Drive 613 820 8282 tel Ottawa, ON, Canada K2H 8S9 613 820 8338 fax www.aecom.com
ALLEY 24 TRAFFIC STUDY
 ALLEY 24 TRAFFIC STUDY in City of Frostburg, Maryland January 2013 3566 Teays Valley Road Hurricane, WV Office: (304) 397-5508 www.denniscorporation.com Alley 24 Traffic Study January 2013 Frostburg, Maryland
Multnomah County Courthouse Relocation. Transportation Alternatives Analysis Technical Memorandum: FINAL
 Multnomah County Courthouse Relocation Portland, Oregon Transportation Alternatives Analysis Technical Memorandum: FIL Prepared for Multnomah County Facilities and Property Management Division 41 N Dixon
Troutbeck Farm Development
 Troutbeck Farm Development Willistown Township, Chester County PA For Submission To: Willistown Township Last Revised: October, 4 TPD# INLM.A. 5 E. High Street Suite 65 Pottstown, PA 9464 6.36.3 TPD@TrafficPD.com
Draft Report. Traffic Impact Study. Superstore, Wal-Mart, and Kent Development. Yarmouth, Nova Scotia. Prepared for
 oad & Traffic Management Road & Traffic Management R Atlantic Traffic Engineering Specialists Draft Report Traffic Impact Study Superstore, Wal-Mart, and Kent Development Yarmouth, Nova Scotia Prepared
List of Attachments. Location Map... Site Plan... City of Lake Elsinore Circulation Element... City of Lake Elsinore Roadway Cross-Sections...
 List of Attachments Exhibits Location Map... Site Plan... City of Lake Elsinore Circulation Element... City of Lake Elsinore Roadway Cross-Sections... Existing Lane Geometry and Traffic Controls... Existing
1223 Michael Street, Suite 100, Ottawa, Ontario, K1J 7T2 P: l F: l
 1223 Michael Street, Suite 100, Ottawa, Ontario, K1J 7T2 P: +1 613.738.4160 l F: +1 613.739.7105 l www.parsons.com City of Ottawa 2017 TIA Guidelines Date July 3, 2018 TIA Screening Form Project 116 York
THIS PAGE LEFT BLANK INTENTIONALLY
 GA SR 25 Spur at Canal Road Transportation Impact Analysis PREPARED FOR GLYNN COUNTY, GEORGIA 1725 Reynolds Street, Suite 300 Brunswick, Georgia 31520 PREPARED BY 217 Arrowhead Boulevard Suite 26 Jonesboro,
CPC Parking Lot Riverside Drive. Transportation Rationale
 CPC Parking Lot Transportation Rationale Prepared By: NOVATECH Suite 200, 240 Michael Cowpland Drive Ottawa, Ontario K2M 1P6 September 2015 Novatech File: 114093 Ref: R-2015-153 Table of Contents 1.0 INTRODUCTION...
Evaluation of M-99 (Broad Street) Road Diet and Intersection Operational Investigation
 Road Diet and Intersection Operational Investigation") Evaluation of M-99 (Broad Street) Road Diet and Intersection Operational Investigation City of Hillsdale, Hillsdale County, Michigan June 16, 2016 Final Report Prepared for City of Hillsdale 97 North Broad
Evaluation of M-99 (Broad Street) Road Diet and Intersection Operational Investigation City of Hillsdale, Hillsdale County, Michigan June 16, 2016 Final Report Prepared for City of Hillsdale 97 North Broad
St. Stefan Serbian Orthodox Church 1989 and 1993 Prince of Wales Drive, Ottawa REVISED TRANSPORTATION BRIEF
 St. Stefan Serbian Orthodox Church 1989 and 1993 Prince of Wales Drive, Ottawa REVISED TRANSPORTATION BRIEF Prepared By: NOVATECH ENGINEERING CONSULTANTS LTD. Suite 200, 240 Michael Cowpland Drive Ottawa,
List of Exhibits...ii
 One Brickell Traffic Study TABLE OF CONTENTS List of Exhibits...ii EXECUTIVE SUMMARY...1 1. INTRODUCTION...2 1.1 Study Area...2 1.2 Study Objective...5 2. EXISTING TRAFFIC CONDITIONS...6 2.1 Data Collection...6
Figure 1: Vicinity Map of the Study Area
 ARIZONA TEXAS NEW MEXICO OKLAHOMA May 5, 2016 Mr. Anthony Beach, P.E. BSP Engineers 4800 Lakewood Drive, Suite 4 Waco, Texas 76710 Re: Intersection and Access Analysis along Business 190 in Copperas Cove
Fieldgate. Traffic Impact Study Proposed Retail Commercial and Residential Development Thompson Road and Louis St. Laurent Avenue Town of Milton
 Fieldgate Traffic Impact Study Proposed Retail Commercial and Residential Development Thompson Road and Louis St. Laurent Avenue Town of Milton September 214 September 23 214 Ms Debbie Pacchiarotti Our
Appendix C. NORTH METRO STATION AREA TRAFFIC IMPACT STATEMENT 88th Avenue Station
 Appendix C NORTH METRO STATION AREA TRAFFIC IMPACT STATEMENT 88th Avenue Station Prepared for: Regional Transportation Department and URS Corporation as part of the North Metro EIS David Evans and Associates,
84-88 Columbia Street West Waterloo, Ontario Transportation Impact Study. Paradigm Transportation Solutions Limited
 84-88 Columbia Street West Waterloo, Ontario Transportation Impact Study Paradigm Transportation Solutions Limited June 217 Project Summary Project Number 15255 June 217 Client Masri O Inc. Architects
Harbord Street and Hoskin Avenue Bicycle Lane Upgrades
 STAFF REPORT ACTION REQUIRED and Bicycle Lane Upgrades Date: April 22, 2014 To: From: Wards: Reference Number: Public Works and Infrastructure Committee General Manager, Transportation Services 19 and
REDEVELOPMENT TRAFFIC IMPACT STUDY
 REDEVELOPMENT TRAFFIC IMPACT STUDY For Wendy s Parker, Colorado January 215 Prepared for: Sterling Design Associates, LLC 29 W. Littleton Boulevard #3 Littleton, Colorado 812 Prepared by: 1233 Airport
Table of Contents FIGURES TABLES APPENDICES. Traffic Impact Study Hudson Street Parking Garage MC Project No.: A Table of Contents
 Traffic Impact Study Hudson Street Parking Garage MC Project No.: 151714A Table of Contents Table of Contents I. INTRODUCTION... 2 II. EXISTING CONDITIONS... 5 III. 215 EXISTING TRAFFIC CONDITIONS... 6
Corporation of the Town of Oakville. December 16, 2013
 Corporation of the Town of Oakville Transportation Impact Analysis and Parking Study for Proposed Secondary School, Oakville Draft Final Report Submitted by: HDR Corporation 100 York Boulevard, Suite 300
3.2.2 Proposed Road Network within Phase 1B Lands
 3.2.2 Proposed Road Network within Phase 1B Lands Figure 3.1 also shows the proposed road network within the Premier Gateway Phase 1B Employment Area lands, which features two collector roads providing
TABLE OF CONTENTS TABLE OF CONTENTS... I APPENDICES... III LIST OF EXHIBITS... V LIST OF TABLES... VII LIST OF ABBREVIATED TERMS...
 TABLE OF CONTENTS TABLE OF CONTENTS... I APPENDICES... III LIST OF EXHIBITS... V LIST OF TABLES... VII LIST OF ABBREVIATED TERMS... IX 1 INTRODUCTION... 1 1.1 Project Overview... 1 1.2 Analysis Scenarios...
NO BUILD TRAFFIC OPERATIONS
 3. 23 NO BUILD TRAFFIC OPERATIONS This section addresses the operations of the transportation system and details how it would be expected to function under year 23 No Build conditions with the projected
Marina Loft (DRC 51-R-12)
") Marina Loft (DRC 51-R-12) traffic study prepared for: Cymbal Development OCtober 2012 Traf Tech October 1, 2012 Mr. Asi Cymbal - President Cymbal Development 3470 North Miami Avenue Upper Suite Miami,
Marina Loft (DRC 51-R-12) traffic study prepared for: Cymbal Development OCtober 2012 Traf Tech October 1, 2012 Mr. Asi Cymbal - President Cymbal Development 3470 North Miami Avenue Upper Suite Miami,
Traffic Impact Study. Westlake Elementary School Westlake, Ohio. TMS Engineers, Inc. June 5, 2017
 TMS Engineers, Inc. Traffic Impact Study Westlake Elementary School Westlake, Ohio June 5, 2017 Prepared for: Westlake City Schools - Board of Education 27200 Hilliard Boulevard Westlake, OH 44145 TRAFFIC
Proposed Addition to Pickering Islamic Centre
 TRAFFIC IMPACT STUDY, PARKING STUDY, SITE CIRCULATION REVIEW & TDM PLAN Proposed Addition to Pickering Islamic Centre 265 Brock Road City of Pickering, Ontario Prepared for: Pickering Islamic Centre Masjid
Glebe Parking Garage 170 Second Avenue, Ottawa, Ontario Transportation Impact Study
 Glebe Parking Garage 17 Second Avenue, Ottawa, Ontario Transportation Impact Study C i t y o f O t t a w a S e p t e m b e r 2 13 www.genivar.com GENIVAR 2611 Queensview Drive, Suite 3 Ottawa, Ontario
FINAL REPORT Traffic Analysis Report Port Coquitlam Recreation Complex Port Coquitlam, BC
 FINAL REPORT Traffic Analysis Report Port Coquitlam Recreation Complex Port Coquitlam, BC Howes Technical Advantage Ltd. This report was prepared by Howes Technical Advantage Ltd. for the City of Port
TRAFFIC ASSESSMENT River Edge Colorado
 TRAFFIC ASSESSMENT River Edge Colorado Submitted by: Fehr & Peers 621 17th Street, Ste. 231 Denver, CO 8293 (33) 296-43 December, 21 App. M-2 Traffic Assessment River Edge Colorado December 21 TABLE OF
FRONT RANGE CROSSINGS TRAFFIC IMPACT STUDY
 FRONT RANGE CROSSINGS TRAFFIC IMPACT STUDY Prepared for: City of Thornton And Colorado Department of Transportation Prepared by: 11 Blake Street, Suite 2 Denver, Colorado 822 Contact: Brian Bern, PE, PTOE
Transportation Impact Study Guidelines AS ADOPTED BY REGION OF WATERLOO COUNCIL SEPTEMBER 18, 2013 REPORT NO. P
 Transportation Impact Study Guidelines AS ADOPTED BY REGION OF WATERLOO COUNCIL SEPTEMBER 18, 2013 REPORT NO. P-13-088 HOUSEKEEPING EDITS APPLIED UPDATED TO FILE VERSION 4, JULY 22, 2014 TABLE OF CONTENTS
EXECUTIVE SUMMARY. Page 1 of 6
 EXECUTIVE SUMMARY The purpose of this report is to identify conformance with the original traffic impact study for the proposed retail development on Lot 5 of Riverdale Retail Filing No. 1 located on the
Traffic Impact Study for Rolling Ridge Redevelopment
 Traffic Impact Study for Rolling Ridge Redevelopment Webster Groves, Missouri October 19, 2018 Prepared For: Gershman Commercial Real Estate 150 North Meramec Avenue Suite 500 St. Louis, Missouri 63105
Traffic Impact Study. Crestline Piggly Wiggly Mountain Brook, Alabama. Goodwyn, Mills and Cawood, Inc. Birmingham, Alabama.
 Traffic Impact Study Crestline Piggly Wiggly Mountain Brook, Alabama Prepared for: Goodwyn, Mills and Cawood, Inc. Birmingham, Alabama September 214 Revision 1 October 214 Crestline Piggly Wiggly Mountain
CRYSTAL HOUSE III TRAFFIC IMPACT ANALYSIS ARLINGTON COUNTY, VA
 CRYSTAL HOUSE III TRAFFIC IMPACT ANALYSIS ARLINGTON COUNTY, VA Prepared for: Roseland, A Mack-Cali Company Prepared by: Wells + Associates, Inc. Michael R. Pinkoske, PTP Henry C. Clarke, EIT 70.97.660
TRAFFIC IMPACT ANALYSIS. Photo here CAL MET ROYAL MRF EXPANSION. City of Paramount, CA. arch beach C O N S U L T I N G.
 TRAFFIC IMPACT ANALYSIS z Photo here CAL MET ROYAL MRF EXPANSION City of Paramount, CA arch beach C O N S U L T I N G June 23, 214 TRAFFIC IMPACT ANALYSIS CAL MET ROYAL MATERIALS RECOVERY FACILITY (MRF)
Classification Criteria
 SCHEDULE D TO RECOMMENDED OFFICIAL PLAN AMENDMENT NO. 40 SCHEDULE C-4 Road Criteria Criteria Traffic Service Objective Land Service/Access Typical Daily Traffic Volume Flow characteristics Travel Speed
Michael A. Werthmann, PE, PTOE Principal
 9575 West Higgins Road, Suite 400 Rosemont, Illinois 60018 p: 847-518-9990 f: 847-518-9987 MEMORANDUM TO: FROM: Brian Lorenc GHB-630, LLC Michael A. Werthmann, E, TOE rincipal Luay R. Aboona, E rincipal
March 11, Lynnfield Board of Selectmen Town of Lynnfield 55 Summer Street Lynnfield, MA Walnut Street Traffic Assessment
 March 11, 2015 Lynnfield Board of Selectmen Town of Lynnfield 55 Summer Street Lynnfield, MA 01940 Re: Walnut Street Traffic Assessment Dear Board of Selectmen Members: As requested, BETA Group, Inc. (BETA)
Bank Street Retail/Hotel Development
 M a y 214 89-9 Bank Street Retail/Hotel Development Transportation Brief Google 214 Bing 214 Prepared for: Prepared by: Study 89-9 Type Bank Street May 214 Study Retail/Hotel Name Development February
William Jackson Drive & Earl Grey Avenue, Pickering, ON Transportation Study. Trillium Housing Oak Non-Profit Corp.
 William Jackson Drive & Earl Grey Avenue, Pickering, ON Transportation Study Trillium Housing Oak Non-Profit Corp. R.J. Burnside & Associates Limited 1465 Pickering Parkway Suite 2 Pickering ON L1V 7G7
Traffic Study North Shore School District 112
 Traffic Study North Shore School District 112 Proposed Expansion of Northwood Junior High School Prepared By: May 1, 2015 1. Introduction Kenig, Lindgren, O Hara, Aboona, Inc. (KLOA, Inc.) has been retained
Shockoe Bottom Preliminary Traffic and Parking Analysis
 Shockoe Bottom Preliminary Traffic and Parking Analysis Richmond, Virginia August 14, 2013 Prepared For City of Richmond Department of Public Works Prepared By 1001 Boulders Pkwy Suite 300, Richmond, VA
South Street Campus Lands Development. City of London TRANSPORTATION IMPACT ASSESSMENT
 South Street Campus Lands Development City of London TRANSPORTATION IMPACT ASSESSMENT TW1387 South Street Campus Lands Development City of London TRANSPORTATION IMPACT ASSESSMENT May 2013 South Street
TRAFFIC IMPACT STUDY CRITERIA
 Chapter 6 - TRAFFIC IMPACT STUDY CRITERIA 6.1 GENERAL PROVISIONS 6.1.1. Purpose: The purpose of this document is to outline a standard format for preparing a traffic impact study in the City of Steamboat
South Albion-Bolton Community Plan North Hill Supermarket Transportation Study Part B: Evaluation of Alternatives
 Community Plan North Hill Supermarket Transportation Study Part B: Evaluation of Alternatives Prepared for: The Town of Caledon August 9 Transportation Solutions Ltd. 43 Forest Road Cambridge, ON N1S 3B4
Glenn Avenue Corridor Traffic Operational Evaluation
 Glenn Avenue Corridor Traffic Operational Evaluation PREPARED FOR: THE CITY OF AUBURN PREPARED BY: DECEMBER 2007 Glenn Avenue Corridor Study--Auburn, Alabama TABLE OF CONTENTS Introduction... 1 Background
Proposed Residential Building Bank at Fifth (99 Fifth Avenue)
") Transportation Impact Assessment Second Submission Proposed Residential Building Bank at Fifth (99 Fifth Avenue) Prepared for Minto Communities Canada by IBI Group May 8, 2018 IBI GROUP TRANSPORTATION
Transportation Impact Assessment Second Submission Proposed Residential Building Bank at Fifth (99 Fifth Avenue) Prepared for Minto Communities Canada by IBI Group May 8, 2018 IBI GROUP TRANSPORTATION
Grant Avenue Streetscape
 REPORT TYPE GOES HERE Grant Avenue Streetscape PREPARED FOR City of Manassas 9027 Center Street Manassas, VA 20110 PREPARED BY 8300 Boone Boulevard Suite 700 Vienna, Virginia 22182 571.389.8121 July 31,
Mr. Randy Kowalchuk, President
 October 20, 2017 #201, 8506-200th Street, Langley, BC V2Y 0M1 T: 604.371.0091 F: 604.371.0098 Our Reference: 31931 Naramata Benchland Properties 176 Fraser Court, Penticton, BC V2A 8B4 Attention: Mr. Randy
May 5, 2009 File:
 MMM Group Limited Suite 600 1455 West Georgia Street Vancouver, BC V6G 2T3 t: 604-685-9381 f: 604-683-8655 www.mmm.ca May 5, 2009 File: 50-09001-007 1420 1055 West Hastings Street Vancouver, BC V6E 2E9