Transportation Master Plan
|
|
|
- Kenneth Brice Price
- 5 years ago
- Views:
Transcription
1
2 City of Owen Sound Transportation Master Plan City of Owen Sound September 2010 HDR itrans 260 Holiday Inn Drive Suite 23, Building A Cambridge, ON N3C 4E8 Tel: (519) Fax: (519) Project # 5454
3 HDR itrans Project Team Principal Project Manager Technical Team Ray Bacquie, P.Eng., AVS Stewart Elkins, B.E.S. Hongtao Gao, P.Eng., PTOE. Andrew Evans M.Sc. ~ 3 ~
4 EXECUTIVE SUMMARY A. Introduction The City of Owen Sound has embarked on the development of a multifaceted and comprehensive Transportation Master Plan known as A Plan in Motion. The growth in population within the City its outlying areas, increasing traffic congestion in some areas of the City, and changing demographics and societal values, contribute to support for more sustainable modes of travel. Transportation related opportunities and challenges have reinforced the need to develop a comprehensive transportation plan to better manage existing and future transportation infrastructure and to ensure that Owen Sound maintain its position as the key regional centre in Grey and Bruce Counties. This TMP is a practical guide for implementing transportation investments, policies, and actions to the year 2026 and beyond. The guiding principles from this document firstly ensure consistency and help to achieve the goals and objectives of other City policies such as the Official Plan and the Strategic Plan, and secondly provide for traceable recommendations to ensure that once they have been approved they can be implemented. The Owen Sound Transportation Master Plan has been conducted in accordance with the master planning process outlined in the Municipal Class Environmental Assessment process (June 2000, Amended 2007) as approved by the Minister of the Environment. The Transportation Master Plan builds on the approaches and ideas conveyed in the Sustainable Planning Guidelines report (developed by Transport Canada and the Transportation Association of Canada) adheres to the Municipal Class Environmental Assessment process. This multilayered process ensures that the appropriate transportation investments, policies, and actions can be verified, proposed, accepted, and implemented to support goals of sustainability, economic vitality, and healthy communities. The TMP process incorporated, to various degrees, the 12 key principles identified by Transport Canada for sustainable transportation planning. Key principles for Sustainable Transportation Planning Sustainable Communities & Transportation Systems Principle 1: Integration with land use planning Principle 2: Environmental health Principle 3: Economic and social objectives Principle 4: Modal sustainability Principle 5: Transportation demand management Principle 6: Transportation supply management Sustainable & Effective Transportation Planning Principle 7: Strategic approach Principle 8: Implementation guidance Principle 9: Financial guidance Principle 10: Performance measurement Principle 11: Public involvement Principle 12: Plan maintenance ~ i ~
5 B. Public Consultation Process The public consultation process was an essential component of the study. A public consultation program contained the following components: Steering Committee Meetings These meetings provided for an exchange of ideas between the City and the Consultation team. Visioning Workshop A Visioning Workshop was formed to allow citizens and individuals representing groups, agencies and organizations a special opportunity to provide input early on in the study and to provide feedback on preliminary alternatives. The Visioning Workshop is described in greater detail in Section 2.2. Community Traffic Issues Meeting A meeting with the City of Owen Sound Operations Committee and citizens about community traffic issues in known hot spots was arranged to allow individuals to provide feedback about their concerns and suggestions how to mitigate the traffic issues in their community. The Community Traffic Issues Meeting is described in greater detail in Section 2.2. Public Information Centre (PIC) One formal meeting was held during the Study, consisting of an open house format with display panels and a formal presentation followed by a discussion session. The PIC is described in greater detail in Section 2.2. Newspaper Advertisements Advertisements were placed in the local newspaper to announce the Notice of Study Commencement, the Visioning Workshop, and the PIC. Notices were hand delivered to specific neighbourhoods to advise of the Community Issues Meeting. The newspaper advertisements invited the public to attend the meetings and to provide input. The advertisements provided information on contact names, telephone numbers, and addresses. The input received from the public and stakeholders throughout the course of the study was very important with respect to the direction the study took, the alternatives that were assessed and carried forward, and the emphasis that was placed on various aspects of the transportation network. C. Policy Context To guide the Transportation Master Plan within the context of the overall direction provided by Provincial policy, Grey county policy and City of Owen Sound strategic policy direction was reviewed at the outset of the study. Key documents included the Provincial Policy Statement 2005, Grey County Official Plan, 2000, City of Owen Sound Strategic Plan 2008 and the City of Owen Sound Official Plan ~ ii ~
6 D. Existing Transportation Network Road Network The main road network within the study area includes Provincial Highways, County of Grey Roads, and municipal Arterial and Collector Roads. The East-West road network is discontinuous due to the topographic nature of the land with limited connections up to either side of the Escarpment. As a result, the existing roads in Owen Sound that do ascend/descend the Escarpment experience capacity and congestion problems today. Congestion (especially on 10th Street) also leads to traffic spilling over onto residential collector roads, raising residents concerns over traffic infiltration, safety, and speeding in residential areas. Transit Services The City of Owen Sound operates both a Conventional Transit and a Specialized Transit service. The Conventional Transit service is a four (4) route system. All four routes provide half hour service from 6:30 AM to 6:00 PM Monday through Friday. On Saturdays, bus service operates between 9:00 PM and 5:30 PM. The Specialized Transit service provides a door-to-door transportation service for residents of the City with mobility limitations 5 days a week Monday to Friday from 8:00 AM. to 5:00 PM. Pedestrian and Cycling Infrastructure The City currently provides the following active transportation opportunities: Hard and soft surface trails and on-road connections, Sidewalks, typically adjacent to public roadways; and, On-road cycling permitted on local, collector and arterial roadways (but not marked as formal cycling routes). There is currently a grid of pedestrian connections throughout the urban portion of the City. Sidewalks are provided on most County roads, arterial roads and collector roads on one or both sides of the road. The trail system also provides pedestrian connections. The City of Owen Sound has planned a network of walk and cycle trails providing connections with recreational activities. The City Park Trails Master Plan of City of Owen Sound Official Plan identifies the planned walking trail and cycling network. There are a couple of missing links including a missing sidewalk link on 19th Street East from 7th Avenue East to 5th Avenue East, a missing link along 8th Street East (Grey Road 5) from 16th Avenue to the Railway Line, and 8th Avenue West from 16th Street West to 19th Street West. For cycling network, there are also several short distance missing links that would help provide network continuity and complete the proposed network. ~ iii ~
7 E. Traffic Conditions Travel Patterns An origin-destination survey was conducted of Friday October 23, 2009 to determine the amount of provincial, regional, and local traffic with origins or destinations to Owen Sound versus the amount of through traffic on City and County Roads. The survey was conducted on key arterial routes for vehicles inbound to the City (with the exception of Grey Road 18). The City of Owen Sound was the main destination travel on roadway approaches to the City. By analysing the destinations by individual station location, it is apparent that there are three main areas within the city that draw the most trips: the Downtown core; the 16th Street East commercial area; and the 8th Street East institutional area. However it was determined that there is a significant percentage of traffic that does travel through the City of Owen Sound without origin or destination within Owen Sound: 15% from the west 14% from the south 18% from the east Existing Traffic Capacity An assessment of existing and future traffic conditions was undertaken as part of the Transportation Master Plan. The two measures of effectiveness used for the analysis include link capacity (vehicles per lane/per hour) and intersection capacity (volume / capacity ratio). Both are reported using a level of service indicator. The analysis has indicated that under typical day peak hour conditions, east-west arterials in the west and east sides of the city have sufficient residual capacity available. The east-west crossings of the Sydenham River also have spare capacity available during the PM peak hour even though 10th Street is congested in this section of the City which indicates that roadways such as 8th Street East/West and 9th Street East/West have the residual capacity. The northsouth screenlines (Grey County Road 1 and 4th Avenue West in the Northwest, Grey County Road 15 and 9th Avenue East in the north east, and Grey County Road 5 and 9th Avenue East in the south) are showing that there is sufficient capacity available during the PM peak hour on all routes. Overall, for the majority of the transportation network there is sufficient capacity available. The capacity deficiency along 10th Street can be rectified if motorists are encouraged to utilize other east-west routes parallel to 10th Street such as 9th Street and 8th Street. The majority of key intersections (arterial to arterial or collector to arterial) operate with an overall level of service D or better during the PM peak hour, which is acceptable. The signalized intersections along the arterial connecting links (i.e. the 10th Street corridor downtown, 9th Avenue East, and 16th Street East) operate with an overall level of service D indicating that the congestion on these links is caused by the intersections. ~ iv ~
8 Site Specific Operational Issues An analyses of three key arterial road sections along three main corridors in the City of Owen Sound was undertaken to identify a number of improvements to the signal timing plans at each signalized intersection along each of the respective corridors to optimize the signal timing plans and facilitate the movement of through traffic by reducing the overall delay to motorists. The three corridors are: 10th Street between 3rd Avenue West and 4th Avenue East, 9th Avenue East between 6th Street East and 16th Street East, and 16th Street East from 9th Avenue East to 18th Street East. The existing signal timing plans along the 10th Street corridor have a cycle length of 120 seconds and are coordinated. To improve traffic operations, the updated signal timing plans are recommended having a cycle length of 70 seconds for all peak periods. For the 9th Avenue East corridor, the existing signal timing plans have a cycle length of 100 seconds and are coordinated. To improve existing conditions, updated AM peak hour signal timing plans have a cycle length of 70 seconds for the first three intersections and 80 seconds for the final intersection. During the PM peak hour, a cycle length of 90 seconds is recommended for the first three intersections and 80 seconds for the final intersection. During the mid-day peak hour, the second and third intersections are coordinated and a cycle length of 75 seconds, the first intersection 55 seconds and the last intersection 80 seconds. The signalized intersections along the 16th Street East corridor have a cycle length of 100 seconds and are coordinated. The updated signal timing plans have a cycle length of 80 seconds for all peak periods and are coordinated to include adequate through bands in both directions during the AM, Mid-day, and PM peak hours. Future Traffic Capacity The 2026 horizon year represents the worst case scenario given that it assumes the full buildout of vacant residential, industrial and commercial lands. The assessment of travel conditions assumed that all planned or programmed road network improvements would be in place. The forecasting and network assessment methodology is based on the principal assumption that current travel trends will remain stable and continue in the future. The analysis has indicated that under future PM peak hour conditions, traffic flows on eastwest routes such as 10th Street, 9th Street, and 8th Street across the Sydenham River, 10th Street West and Alpha Street in the west end, and Superior Street, 8th Street East, 16th Street East, 20th Street East, and 26th Street East in the east end of the city have sufficient residual capacity available. The east-west crossings of the Sydenham River also have some reserve capacity available during the PM peak hour with the exception of 10th Street which is congested in the Downtown area of the City. The north-south screenlines (Grey County Road 1 and 4th Avenue West in the Northwest, Grey County Road 15 and 9th Avenue East in the ~ v ~
9 north east, and Grey County Road 5 and 9th Avenue East in the south) are showing sufficient capacity available during the 2026 PM peak hour. The majority of key intersections (arterial to arterial or collector to arterial) operate with an overall level of service E or worse during the future 2026 PM peak hour. The signalized intersections along the arterial connecting links (i.e. the 10th Street corridor downtown, 9th Avenue East, and 16th Street East) show that future intersection operations are the main cause of congestion on these corridors. F. Problem Statement Based on traffic forecasts and a detailed analysis of existing and future conditions, the key transportation challenges for Owen Sound are summarized below: Owen Sound functions as a regional centre for Grey and Bruce Counties, and is therefore affected by overall growth in the Region. The majority of traffic in the study area has origins and destinations to Owen Sound. This reliance on the Owen Sound transportation network will continue to increase as the City and adjacent municipalities in Grey and Bruce Counties experience modest growth. Approximately 15% to 25% of traffic (depending on the route and principal direction) in Owen Sound is through traffic originating and/or destined to other municipalities in the County and Province. As the general population in Ontario and abroad grows, and tourist and recreational pursuits continue to grow, through traffic will further increase pressures on the City road network. As with the arterial road network, the collector road network lacks mid-block, continuous east-west and north-south connections due to the natural environmental and cultural environment heritage of the area. This lack of connectivity puts pressures on the few through connections present in the City to facilitate longer distance travel. It also increases the propensity for traffic to find alternative routes on roadways that are not designed or intended to accommodate modest to heavy volumes of traffic. Transportation requirements are closely related to economic activity. In economic terms, however, transportation is a diseconomy factor, meaning that the increase in cost of the transport of goods and services is directly related to increases in the cost of purchasing goods and services, and is subsequently passed on the consumers. Increases in traffic congestion and delays will negatively affect the City economic well-being and competitiveness. Considering all the above, the assessment of existing and future conditions concludes that the provision of additional intersection capacity at select intersections is required in addition to the need for additional capacity on 10th Street through the Downtown. There also needs to be a greater emphasis or reliance on other modes of travel. Enhanced public transit, improved walking and cycling facilities, and transportation substitutes such as communication technologies, will be required to meet the accessibility and mobility needs of the City s residents and businesses. ~ vi ~
10 G. Identification and Evaluation of Alternatives Alternative Solutions The project team identified and evaluated three long-term, alternative transportation planning strategies, plus a Do-Nothing scenario. The transportation planning alternatives were evaluated for 2026 travel demands, against a set of Evaluation Criteria to gauge their ability to address the challenges identified in the Problem Statement. Do Nothing The Do Nothing scenario reflects the current condition of the roadway network carried over to the 2026 horizon year without any capacity improvements. Except for the 10th Street extension, there are no planned expansions or additions to the arterial road network or Provincial highway system. Alternative 1 Maximize Use of Existing Infrastructure - Alternative 1 does not propose any significant infrastructure improvements, rather the intent of this alternative is to maximize the use of existing infrastructure and direct through traffic from routes that have capacity deficiencies onto alternative routes that have significant reserve capacity. Through traffic that normally travels along the corridors of 10th Street and 16th Street East will be redistributed onto the alternate routes by use of either static or dynamic signage. The alternate routes include an outer alternate route and inner alternate routes. Alternative 2 Multi-Modal Network with Maximum Utility of Existing Infrastructure - Alternative 2 includes all measures in Alternative 1, plus improvements to the pedestrian, cycling and transit network. The improvements to the pedestrian, cycling and transit network are listed below: Cycling Routes - A cycle lane spine network is proposed where a north-south and eastwest cycle lane network will be established to provide strong cycling connections from existing residential areas to key attractions/generators in the City such as the downtown core, the 16th Street East commercial area, and the east side industrial area. Express Transit Routes and Park and Ride Lots - Two express transit routes (East- West and North-South) are proposed to further enhance existing transit service and support proposed travel demand management options including potential Park and Ride lots situated at the west, east, and south ends of the City. Alternative 3 Multi-Modal Network with Roadway Expansion - Alternative 3 includes all measures as included in Alternatives 1 and 2, plus a new crossing of the Sydenham River and/or Harbour. There are two potential options for the location of a bridge/harbour crossing - at 11th Street West or 14th Street West. ~ vii ~
11 Evaluation Methodology The performance and impact of the Do-Nothing scenario and the three Transportation Planning Alternatives were evaluated using a consistent set of evaluation criteria. The criteria are consistent with the recommended practice for Municipal Class Environmental Assessment and incorporate the environmental constraints within the City of Owen Sound. The six evaluation criteria are: 1. Supporting sustainable development, 2. Providing high level of service on multi-modal transportation network, 3. Socio-economic impact, 4. Impact on natural environment, 5. Public support; and, 6. Capital cost. Evaluation of Alternatives Table 7.4 shows the preference rating and the results of the evaluation of the planning alternatives. Alternative 2, Multi-Model Network with Maximum Utility of Existing Infrastructure emerged as the most preferred alternative with the highest overall score when assessing all of the criteria. Based on the evaluation of the alternatives, the recommended long-term transportation strategy for Owen Sound is Alternative 2 Multi-Modal Network with Maximum Utility of Existing Infrastructure. The key advantages of the preferred alternative are that it offers the best opportunity to: Address the issues at the root cause of the current and future transportation challenges, Satisfy County and City growth objectives, Encourage alternate travel trips (cycle and transit) while reducing auto trips, Minimize congestion and the cost of congestion, Support goods movement and access to employment areas; and, Support traveller visiting needs. ~ viii ~
12 Table E.1: Evaluation of the Planning Alternatives Supporting sustainable development Providing a high level of service on a multi-modal transportation network Mitigating Socioeconomic impact Do Nothing Alternative 1- Maximize Use of Existing Infrastructure Alternative 2- Multi-Modal Network with Maximum Utility of Existing Infrastructure Alternative 3- Multi-Modal Network with Roadway Expansion Mitigating the environment impacts Public support Capital cost Overall Legend Least Preferred Most Preferred ~ ix ~
13 H. Recommended Long-Term Transportation Strategy The components of the recommended transportation strategy are listed below and described in the remainder of this section: Land Use and Development, Transit, Arterial Roads, Goods Movement, Walking and Cycling, Travel Demand Management; and, Traffic Calming. Land Use and Development Intensification of primary transit corridors and downtown areas has been shown in other jurisdictions to encourage higher transit usage, increased waking and cycling. In turn, it can reduce reliance on auto travel and relieve accompanying traffic pressures. Within the City of Owen Sound opportunities exist for encouraging walking, cycling and transit use through the development along 10th Street, 9th Avenue East and in the downtown core. It is recommended that development planning and design principles incorporate methods identified in the Transit-Supportive guidelines prepared by the Province of Ontario. Road designs could be updated to accommodate cyclist and pedestrian needs. It is recommended that road design standards be updated to accommodate on-road bicycle lanes and cyclists within the boulevard, and include pedestrian-friendly treatments at intersections and along residential and industrial collector roads. It is recommended that development applications be reviewed to identify requirements of development applications that meet pedestrian and bicycle needs consistent with this plan. Zoning requirements should be reviewed to consider the needs for cycling infrastructure such as required bicycle parking on site. Transit Recommendations for the Owen Sound Transit surface route network would be to undertake a detailed transit service network review which should include the provision of East-West and North-South Express services along the key corridors which connect the high attraction trips in the City. Accordingly, the recommendations are emphasized to support TDM based ride-sharing initiatives and discourage single-occupancy vehicle travel. ~ x ~
14 Arterial Roads Recommended improvements to the County and City arterial road network should focus on improving on the available link and intersection capacity, rather than major new infrastructure investment. This includes further investigating and scheduling intersection improvements and directing traffic to corridors with reserve capacity. This policy recommendation is critical in meeting City s objectives in providing adequate level of service for transit and maximizing transit modal split. In addition, this study recognizes that arterial roads and collector roads are multi-modal corridors that serve cars, transit vehicles, pedestrians, and cyclists. The key recommendations for the road network are summarized below. Promote the use of the outer alternate route around Owen Sound for through truck traffic using the County and Provincial highway network. Implement traffic control signal timing improvements on 10 th Street Monitor traffic conditions and implement traffic control signals when warrants are met Initiate corridor studies on 10 th Street and 16 th Street to assess the functional feasibility of intersection improvements (as identified in Chapter 6) and develop a preliminary design with implementation coordinated through the capital program process Goods Movement and Alternate Route Design It is recognized that efficient goods movement is an important element of an economically viable region and that maintaining efficient goods movement is an objective of the City of Owen Sound. However, there is a need for a balance between efficient goods movement and maintaining a liveable community and meeting community traffic needs. The following are recommendations to improve the movement of goods and services in Owen Sound: Promote the use of the outer alternate routes (using Grey Roads 11 and 18) around Owen Sound for through truck traffic using the County and Provincial highway network. Work cooperatively with the County and province in review and design of roads used recommended as the alternate routes. Co-operate with the Province of Ontario and Grey County in implementing the use of traffic management tools such as Commercial Vehicle Operations (CVO), Intelligent Transportation System (ITS), and Advanced Traffic Management Systems (ATMS) that provides detection of traffic conditions in downtown Owen Sound and displays conditions at the approaches to the City along Highway 6 and 21(approaching County Roads 11 and 18). Discourage truck traffic through the downtown core on 2 nd Avenue East by encouraging truck traffic to utilize north / south through parallel routes such as 3rd Avenue East and 2nd Avenue West. ~ xi ~
15 Traffic Calming Traffic calming measures are being applied in both new developments and existing neighbourhoods in many Ontario municipalities, as a way to mitigate the adverse impacts of vehicular traffic (such as speeding and high volumes), and to improve the quality of life in the neighbourhoods. The primary goals in developing a traffic calming policy is to reduce high traffic speeds and decrease through traffic on local roads to acceptable levels to maintain the liveability of residential neighbourhoods, maintain access and mobility of all users of the road allowance, and improve safety for pedestrians and motorists. Where possible, consideration should be given to maintaining or improving the aesthetics of the roadway. Traffic Calming is seen as part of the City of Owen Sound Transportation Master Plan solution. It may be applicable on certain local roads to manage measured and documented operational problems. The draft Traffic Calming Policy recommended for the City of Owen Sound is provided in Appendix I of the Transportation Master Plan Report. The evaluation of new traffic calming requests is typically coordinated with an annual construction schedule. Based on the typical cost of traffic calming measures, the required consultation efforts, and the staff resources, an overall amount of $200,000 should be sufficient to complete up to three (3) traffic calming projects per year including the data collection, analysis, design and construction. The number of traffic calming initiatives undertaken annually will depend on the number of requests received from the public, the merits of these requests, the funding allocated to the Operating and Capital Budgets for traffic calming projects and staff resources available. It is recommended that a list of projects will be maintained and updated annually. Where funding is limited, a phased project implementation plan should be considered. Cycling Infrastructure Implementation The benefits of cycling as an activity and mode of travel are well documented. The development of an active transportation strategy for the City of Owen Sound provides focus and direction in increasing bicycle use and realizing benefits that include: Integrating healthy, physical activity into everyday travel, fostering active lifestyles; Reducing transportation costs; Reducing traffic congestion and carbon dioxide emissions; Conserving energy resources; and Contributing to a more connected community. In order to support cycling as a competitive mode of travel, there is a need to develop continuous and direct routes to cycling destinations within the City and to neighbouring municipalities. The public has indicated that a key factor affecting their decision to consider cycling to work is the need for safe and direct routes. The public had indicated a need for ~ xii ~
16 well marked cycling routes, paths, roads and that there is a need for more bike friendly designs of streets. Primary cycling routes are identified in the Official Plan Trail Master Plan. They provide opportunities for commuting along continuous corridors and provide connections key municipal destinations. Key destinations served by the planned routes are identified below. Downtown (eg. City Hall, Farmers Market, Public Library, Tom Thomson Art Gallery) Shopping centres (eg. Heritage Place Shopping Centre) Offices such as Grey County Institutional uses (including Georgian College, Grey Bruce Regional Health Centre) Community uses (eg. Harry Lumley Bayshore Community Centre, Victoria Park) Secondary cycling routes supplement primary routes. They are the local and collector connections within the neighborhoods. Secondary connections can help to reduce traffic congestion and improve traffic safety around school zones and promote active, healthy living. It is recommended that additional routes be considered in conjunction with the school boards in developing cycle to school / walk to school programs. Key objectives for secondary cycling routes include: 1. Safe connections to the primary and off-road multi-use trail routes; 2. Opportunity to provide a parallel alternative routes to primary routes; 3. Provide connections to neighbourhood destinations such as schools; and, 4. Promote healthy and active living within communities by providing cycling opportunities. Implementation of these routes is subject to further detailed assessment of feasibility and the determination of any local safety issues or impacts to operations such as street parking. Short, medium and long-range targets for implementation of bicycle routes will be established. The first priorities will include routes that meet one or more of the following criteria: Develop a spine network of major north / south and east / west routes; Recognize the Downtown as the primary activity centre and destination; Connect to other key City destinations; Provide cycling route connectivity in cycling routes; and Achieve feasible low cost early wins to demonstrate successes. Cycling functional reviews are recommended for each corridor to develop a design consistent with the design guidelines in this document, confirm that traffic and parking impacts are acceptable and ensure that the public is informed and have an opportunity to provide input. Prior to the reconstruction of any roadway identified in the cycling plan noted below, it is recommended that a cycling functional review be implemented. ~ xiii ~
17 North-South Routes 6 th Avenue West (1 st Street W. to 7 th Street W to Alpha Street) 2 nd Avenue West (6 th Street to 8 th Street) 1 st Avenue West (8 th Street W to 22 nd Street W) West Waterfront (10 th Street W to 22 nd Street W) East Waterfront 3 rd Avenue East (10 th Street E to 36 th Street E) 2 nd Avenue East (Harrison Park to 7 th Street E) 4 th Avenue East 15 th Street East - 5 th Avenue East (Harrison Park to 28 th Street E) 5 th Avenue East (7 th Street East to 10 th Street East) 7 th Avenue East (City Boundary to 10 th Street) ) - New Recommended Route 8 th Avenue East (15 th Street East to 23 rd Street East) - New Recommended Route 16 th Avenue East (8 th Street E to 17 th Street E) Former CP Railway (8 th Street E to 28 th Street E) 28 th Avenue East (Superior Street to 20 th Street E) East-West Routes 6 th Street Superior Street (Sydenham River to 28 th Avenue E) 8 th Street West (2 nd Avenue W to 28 th Avenue E) 11 th Street West (Alpha Street to 1 st Avenue W) Alpha Street (West boundary to 4 th Street West) 16 th Street West (3 rd Street W to 8 th Street W) 15 th Street East 10 th Street East (4 th Avenue E to Georgian College) 20 th Street East 17 th Street East (Heritage Place to 28 th Avenue) To support the network development, it is recommended that the City implement the following: Establish a signage (wayfinding) for corridors as the cycling network as route development Incorporate bicycle parking requirements for major developments within the zoning bylaw Establish bicycle parking including covered bicycle parking a key multimodal transfer points and bicycle racks at key community destinations and throughout the downtown An Active Transportation Plan that the City can implement is attached to the TMP Report in Appendix H. ~ xiv ~
18 Pedestrian Network and Crossings We recommend that the City of Owen Sound should focus their efforts and funding towards the construction of missing links and providing connectivity for the sidewalk network. The feasibility of establishing pedestrian levels of service related to standards for the requirement of sidewalks on one or both sides of the street needs further assessment of the feasibility and cost implications. The ultimate plan for the development of the pedestrian environment will be the gradual completion of the planned pedestrian network shown in Exhibit 4.8. The implementation and operation of pedestrian crossings in the City of Owen Sound will need to comply with the legislative context of the Ontario Traffic Act, have regard for best practices in pedestrian accommodation and meet the needs of the City of Owen Sound. The Highway Traffic Act indicates that when a pedestrian is about to step from the boulevard onto the roadway there are fundamentally two different forms of pedestrian crossing. The crossing may be either / or: A controlled crossing where vehicles must yield to pedestrians. An uncontrolled crossing where pedestrians must yield to vehicles. It is recommended that the City of Owen Sound proactively address pedestrian safety needs and establish a program of reviews of pedestrian crossings either through on-going traffic operations studies or annual corridor reviews. It is recommended that pedestrian crossing features be implemented where warranted, where environmental conditions are consistent with other geometric and design requirements, and when funds are available within the City s capital programming process. It is recommended that the City of Owen Sound reassess its pedestrian crossing policy with regard to recommended pedestrian features upon completion of OTM Book 15.Compliance with pedestrian crossing practices is recommended for review regular review including identifying and programming the necessary roadway and traffic control modifications for implementation. It is recommended that prior to the reconstruction of any roadway; it is recommended that a pedestrian infrastructure needs be reviewed including sidewalk and crossing infrastructure and that design criteria in this document be considered. ~ xv ~
19 Transportation Demand Management Transportation Demand Management (TDM) program will form part of the overall TMP strategy. Specific recommendations for TDM measures in Owen Sound include: Reviewing and modifying transit, cycling and pedestrian-related Official Plan policies to acknowledge their important role in City wide travel demand management. Reviewing and modifying site design guidelines, traffic impact study requirements and site plan approval process to encourage applicants to adopt TDM initiatives. Development of TDM supportive parking policy such as paid parking, shared parking and other parking management strategies. Development of Park and Ride lots located at the edges of the City to encourage transit usages as well as carpooling initiatives. Reviewing alternative work schedules at larger employment centres to encourage flexitime, compressed work week, and staggered shifts to encourage peak travel to/from these employment areas to occur at different times of the days instead of one set time in the morning and one set time in the afternoon. Encourage the use of tele-commuting as a substitute of physical travel. Encourage the citizens of Owen Sound to be active and have a positive attitude toward reducing car use and relying on alternative forms transportation through promotional efforts. A staff position be created to support and manage all pedestrian, cycling, transit and TDM initiatives undertaken by the City to ensure compliance with the various polices and measures being recommended as part of the Transportation Master Plan. I. Implementation Cost Considerations The timing and implement strategy of recommended road network improvements, pedestrian, cycling, TDM, transit and other support programs is directly related to cost and available budget. Funds will be necessary for the planning, design, property, utility impact mitigation, capital construction/acquisition and on-going operation and maintenance of new transportation infrastructure and services. Preliminary cost estimates have been identified for identified improvements based on their anticipated need (i.e. short term, medium term, long term). The timing of improvements will be dependant on the City of Owen Sound capital budget approval process. The management of the implementation of the City of Owen Sound Transportation Master Plan will require expertise and efforts beyond current staff levels of service. The implementation will require functional feasibility studies, engineering design and experience in alternative modes of travel. It is recommended that consideration be given to additional transportation engineering support in the form of allocation of staff resources (transportation engineer) or consultant support. ~ xvi ~
20 Infrastructure Cost The recommended long-term transportation strategy will require an estimated $5 million in capital projects and engineering studies. Additional costs will be associated with the administration, operation and maintenance of these improvements. Transit related costs will be determined through a separate Transit Strategy Study. Funding Sources Improvements to arterial roads and collector roads are under the jurisdiction of the City of Owen Sound. Improvements triggered by growth within the City are eligible for funding through City of Owen Sound Development Charges (DC) and Capital Program. It is recommended that the City develop/ update a development charge by-law to reflect the costs of identified improvements. Expansion of pedestrian facilities, cycle paths and travel demand management services should be included in future development charge updates. Recognizing constraints on capital and operating budgets, alternative funding sources will be investigated. The following sections identify opportunities for federal, provincial, and third party funding sources. Below is a list of possible financial resources available to implement the Master Plan: Bicycle Trade Association of Canada TD Friends of the Environment Health Canada Grant/Contributions Program Shell Environment Fund Ontario Cycling Association and Environment Canada EcoAction International Mountain Biking Association Community Funding Gas Tax Contributions Trillium Foundation Federal Government Communities in Action Fund Ontario Transportation Demand Management Moving on Sustainable Municipal Grant Program Transportation (MOST) program Provincial Government dedicated funding Developers or affected businesses In order to make use of available external funding, the City of Owen Sound will need to develop projects within the scope of the master plan that are shovel ready. ~ xvii ~
21 TABLE OF CONTENTS Executive Summary... i 1. Introduction Background Purpose of the Transportation Master Plan Why is a Transportation Plan Needed? Goals and Objectives of the Master Transportation Study Interdependent Transportation, Economic, Social, and Environmental Goals Transportation Master Plan and Environmental Assessment Process A Sustainable Transportation Planning Approach Study Organization Public Consultation Process Description of the Public Consultation Process Workshop and Public Information Centre Visioning Workshop April 14, Community Traffic Issues Meeting May 12, Public Information Centre June 16, Comments Received and Project Team Responses Background Documents Policy Documents Ontario Provincial Policy Grey County Policy City of Owen Sound Policy Data Sources Existing Conditions Socio-Economic Environment Population and Employment Existing Land Uses Development Activity Socio-Cultural Heritage Environment Natural Environment Key Environmental Features Existing Transportation Network Road Network Transit Services Goods Movement Sidewalks and Bicycle Paths Park and Ride and Carpool Lots Origin-Destination Survey Results of Origin-Destination Survey O-D Survey Summary Existing Network Performance Level-of-Service Considerations Data Sources ~ i ~
22 Road Network Capacity Intersection Capacity Signal Warrant Analyses Assess the Merit of Opposing North-South Left Turn Lanes on 9th Avenue East and 6th Street East Assess the Merit of Converting the Northbound Through - Right Lane to Exclusive Right Turn Lane on 9th Avenue East at 8th Street East Signal Timing and Level of Service Issues th Street Corridor th Avenue Corridor th Street Corridor Conversion of 1 st Avenue West to One-way Southbound Only Convert 1 st Avenue West to One-Way Southbound Convert 1 st Avenue West to One-way Southbound and 1 st Avenue East to One-Way Northbound Community Traffic Issues Alpha Street Moores Hill th Street East B Review of Street Name Signs Future Conditions TRANSPORTATION MODEL Model Development Network Performance Year 2011 and Network Performance Year Road Network Capacity Intersection Capacity Transportation Needs Road Capacity Needs Existing Conditions Conditions Conditions Active Transportation Modes Problem Statement Transportation Alternatives Identification of Transportation Planning Alternatives Evaluation Methodology Evaluation of Alternatives Recommended Long-Term Transportation Strategy Land Use and Development Transit Roads Arterial Roads Goods Movement Traffic Calming ~ ii ~
23 8.4 Walking and Cycling Pedestrian Network Pedestrian Crossings Bicycle Network Transportation Demand Management Implementation Cost Considerations Short Term Needs Medium Term Needs Long Term Needs Administrative Needs Infrastructure Cost Funding Sources Plan Maintenance Appendices A Public Consultation B Agency Comments C Demographic D Cultural Heritage E Natural Environmental F Traffic Operations G Community Traffic Issues Memo H Active Transportation Plan I Traffic Calming Policy Tables Table 4.1: Owen Sound Population Data Table 4.2: Owen Sound Population Projection Based on Historic Growth Table 4.3: Population Projection in the City of Owen Sound Table 4.4: Population Projection for the City of Owen Sound (Grey County) Table 4.5: Owen Sound Existing Employment Table 4.6: Employment Projections for the City of Owen Sound Table 4.7: 2009 Owen Sound Heavy Vehicle Cordon Counts Table 4.8: OD Survey Locations Table 4.9: OD Survey Questionnaire Handed Out by Location Table 4.10: OD Survey Number of Returned Questionnaires Table 4.11: OD Survey Origin Locations Table 4.12: OD Survey Destination Locations Table 4.13: 9 th Avenue East at 6 th Street East Operations Comparison Table 4.14: 9 th Avenue East at 8 th Street East Operations ~ iii ~
24 Table 4.15: 9 th Avenue East at 8 th Street East Operations with Northbound Right Turn Lane Table 4.16: 10 th Street Corridor Existing Signal Timing Operations Table 4.17: 10 th Street Corridor Updated Signal Timing Operations Table 4.18: 9 th Avenue Corridor Existing Signal Timing Operations Table 4.19: 9 th Avenue Corridor Updated Signal Timing Operations Table 4.20: 16 th Street Corridor Existing Signal Timing Operations Table 4.21: 16 th Street Corridor Updated Signal Timing Operations Table 7.1: Transportation Alternatives Pedestrian, Cycling, Transit, and Roadways. 82 Table 7.2: Evaluation Criteria Table 7.3: Analysis of Transportation Planning Alternatives Table 7.4: Evaluation of the Planning Alternatives Table 9.1: Solution Cost for Short Term Needs Table 9.2: Solution Costs for Medium Term Needs Table 9.3: Solution Costs for Long Term Needs Exhibits Exhibit 1.1: City of Owen Sound, Grey County, Ontario... 3 Exhibit 1.2: Class Environmental Assessment Process, Phase 1 and Exhibit 1.3: Key Principles for Sustainable Transportation Planning, Transport Canada... 6 Exhibit 4.1: Schedule 'A' Owen Sound OP Land Uses Exhibit 4.2: Heritage Designation Register Exhibit 4.3: Ecological Constraints Exhibit 4.4: Major Road Network Exhibit 4.5: Existing Number of Travel Lanes Exhibit 4.6: Owen Sound Transit Route Map Exhibit 4.7: Permitted Truck Routes Exhibit 4.8: Owen Sound Planned Walking Network Exhibit 4.9: Owen Sound Proposed Cycling Network Exhibit 4.10: OD Survey Questionnaire Exhibit 4.11: OD Survey Origin Map Exhibit 4.12: OD Survey - Destination Map Exhibit 4.13: OD Summery From South Exhibit 4.14: OD Summary from West-Northwest Exhibit 4.15: OD Summary from East-Northeast Exhibit 4.16: Trip Purpose Summary Exhibit 4.17: Trip Frequency Summary Exhibit 4.18: Route Selection Summary Exhibit 4.19: Vehicle Type Summary Exhibit 4.20: Existing Traffic Screenline Capacity Map Exhibit 4.21: Existing Traffic Level of Service Map Exhibit 4.22: Intersection of 9 th Avenue East at 6 th Street East from the South Exhibit 4.23: Intersection of 9th Avenue East at 8th Street East from the South ~ iv ~
25 Exhibit 5.1: 2026 PM Peak Hour Screenline Exhibit 5.2: 2026 PM Peak Hour Intersection Level of Service Exhibit 7.1: Alternative 1 - Maximum Use of Existing Infrastructure Exhibit 7.2: Alternative 2 - Multi-Modal Network with Maximum Utility of Existing Infrastructure Exhibit 7.3: Alternative 3 - Multi-Modal Network with Roadway Expansion ~ v ~
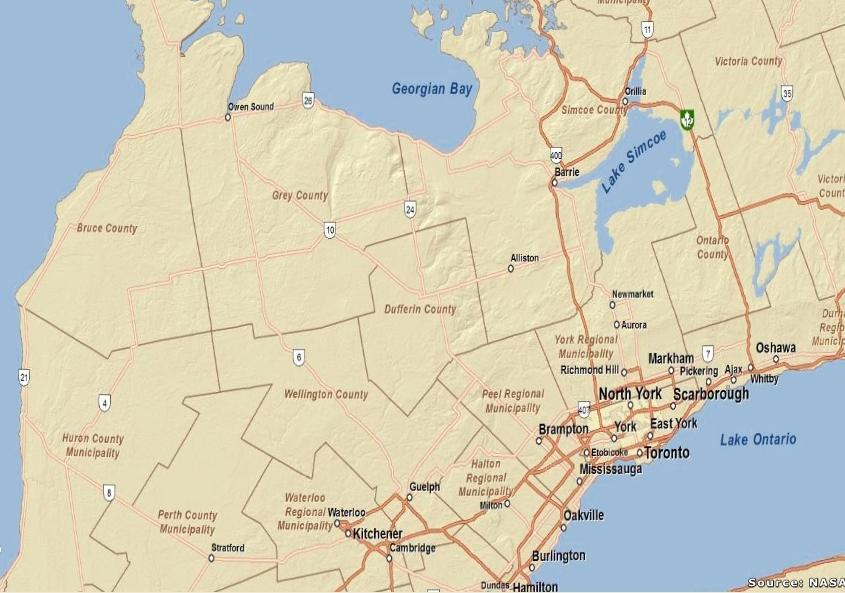
26 1. INTRODUCTION 1.1 Background The City of Owen Sound has embarked on the development of a multifaceted and comprehensive Transportation Master Plan known as A Plan in Motion. The growth in population within the City its outlying areas, increasing traffic congestion in some areas of the City, and changing demographics and societal values, contribute to support for more sustainable modes of travel. Transportation related opportunities and challenges have reinforced the need to develop a comprehensive transportation plan to better manage existing and future transportation infrastructure and to ensure that Owen Sound maintain its position as the key regional centre in Grey and Bruce Counties. Owen Sound has a challenging environment in which two sets of important needs compete: The need to preserve a high standard of living for Owen Sound residents by managing growth, minimizing disruptions and impacts on the environment, and preserving the City s unique character. The need to ensure that Owen Sound transportation network continues to provide sufficient capacity to maintain a strong competitive position to attract business and enhance economic vitality. Owen Sound is regionally located in the north-east of Grey County, as illustrated in Exhibit 1.1. Owen Sound faces north-south and east-west pressures from provincial recreational travel, regional commuter traffic, and from development within the City itself. The transportation system in Owen Sound is therefore strongly affected by the transportation demands from neighbouring communities in Grey and Bruce Counties, as well as longer distance provincial traffic. For example, Owen Sound is faced with the challenge of managing increasing east-west through traffic on the Provincial connecting links such as 10th Street, 9th Avenue East, and 16th Street East with much of the traffic originating from the north and west of Owen Sound destined to the commercial and institutional lands located in the eastern half of the City. The resulting congestion on 10th Street through the downtown area continues to increase pressure on collector and local roads in the City, increasing concerns of local residents over traffic infiltration, traffic impacts, and safety. ~ 1 ~
27 1.2 Purpose of the Transportation Master Plan The City of Owen Sound Transportation Master Plan is a platform to move forward with the implementation of the transportation vision defined by the citizens in a workshop held in September, 2008 to develop the Terms of Reference for this TMP. This vision embraces sustainable development, protection of the natural environment, economic vitality, and a healthy community while providing safe, affordable, and efficient transportation for people, goods and services. 1.3 Why is a Transportation Plan Needed? This 2010 TMP is a practical guide for implementing transportation investments, policies, and actions to the year 2026 and beyond. The guiding principles from this document firstly ensure consistency and help to achieve the goals and objectives of other City policies such as the Official Plan and the Strategic Plan. Secondly it provides for traceable recommendations to ensure that once they have been approved they can be implemented. 1.4 Goals and Objectives of the Master Transportation Study The TMP provides comprehensive long term strategies (by 2011, 2016, 2026, and beyond) that will guide the City through the next 20 years of the development of its transportation system. The strategies are designed to manage growth and reduce traffic impacts by balancing forecast population and employment growth with the mobility needs of the City s residents. The TMP incorporates recent investments in infrastructure improvements, community goals and expectations and changes in transportation system planning from a sustainability perspective. The study gives special consideration to: Developing a transportation system that will accommodate future population and employment growth to the year 2026 and beyond Building a sustainable transportation system Addressing current transportation challenges such as: Congestion on arterial roads including 10th Street through the downtown core, and along other arterial roads such as 16th Street East and 9th Avenue East Considering the multi-modal character of transportation Promoting the use of transit Promoting travel demand management Considering the needs of cyclists and pedestrians Recognizing goods movement as a key component of economical vitality Public consultation Giving consideration to environmental effects ~ 2 ~
28
29 1.5 Interdependent Transportation, Economic, Social, and Environmental Goals The TMP considers a comprehensive, system-wide approach that includes, in addition to transportation goals, economic, social and environmental goals of the City. The following key points illustrate the importance of ensuring such interdependence: The various goals should be mutually supportive Transportation goals will not be achieved unless other goals are achieved (and vice-versa). The various goals also influence each other. For example, economic vitality depends, in part, upon adequate transportation services but the demand for travel is in turn driven to some degree by economic growth. The nature of personal travel and goods movement is highly complex and variable Municipal government alone cannot meet all these needs cost-effectively given today s constraints on public finances. Coordination with other governmental bodies, ability to seek and attract funding partners, and a careful valuation of the cost of growth becomes critical. We cannot build our way out of congestion The need to develop and apply new transportation solutions geared at increased network efficiency maximizing the use of existing infrastructure, higher return on investment, and halting urban sprawl are pressing. Designing an integrated mobility system capable of addressing the needs of person travel and goods movement is essential. The needs and expectations of society are changing New population driven factors have emerged and created new challenges for policy makers. Issues triggered by the aging population, increased growth pressure, and environmental protection have to be faced, resolved, and assimilated. The need to protect our natural heritage is critical Transportation is known to be a significant source of air contaminants and of greenhouse gas emissions attributed to climate change and health problems. Decreasing auto dependence and shifting travel to more efficient and cleaner transportation modes is vital. 1.6 Transportation Master Plan and Environmental Assessment Process The Owen Sound Transportation Master Plan (TMP) has been conducted in accordance with the master planning process outlined in the Municipal Class Environmental Assessment process (June 2000, Amended 2007) as approved by the Minister of the Environment. The TMP study process addresses Phase 1 and Phase 2 of the environmental assessment process as shown in Exhibit 1.2. Phase 1 defines the problem or opportunity while Phase 2 identifies alternative solutions, considers a range of environmental implications of each solution, consults with the public and affected agencies, and selects the preferred solution(s). ~ 4 ~
30 Exhibit 1.2: Class Environmental Assessment Process, Phase 1 and 2 The results of the Owen Sound TMP will constitute Phases 1 and 2 of the Environmental Assessment process and will be used as input into future environmental assessment studies for transportation projects arising from the recommendations of the study. Public consultation was designed to: Provide open communication with the public, other municipalities, and agencies, Provide information to the public as a basis for engaging in active dialogue with the public and ensuring public participation, Seek the public s input on the identification of issues, the development of alternative solutions, and the selection of the preferred alternative; and, Ensure that the plan has general support from the community. Public consultation in this study has involved: Public notices of study commencement and of public meetings, References to the study through the City of Owen Sound web site, A Steering Committee meeting held at City Hall on March 17, 2010 A Visioning Workshop held at Owen Sound & North Grey Union Public Library on April 14, 2010 A Community Traffic Issues Meeting held at City Hall on May 12, 2010 A Public Information Centre held at City Hall on June 16, 2010 Details on the public consultation process are provided in Appendices A and B and discussed further in Section 2. ~ 5 ~
31 1.7 A Sustainable Transportation Planning Approach The Transportation Master Plan builds on the approaches and ideas conveyed in the Sustainable Planning Guidelines report (developed by Transport Canada and the Transportation Association of Canada), is supported by the Province of Ontario Places to Grow Act, and adheres to the Municipal Class Environmental Assessment process. This multilayered process ensures that the appropriate transportation investments, policies, and actions can be verified, proposed, accepted, and implemented to support goals of sustainability, economic vitality, and healthy communities. The TMP process incorporated, to various degrees, the 12 key principles identified by Transport Canada for sustainable transportation planning as featured in Exhibit 1.3. Key Principles for Sustainable Transportation Planning Sustainable Communities & Transportation Systems Principle 1: Integration with land use planning Principle 2: Environmental health Principle 3: Economic and social objectives Principle 4: Modal sustainability Principle 5: Transportation demand management Principle 6: Transportation supply management Sustainable & Effective Transportation Planning Principle 7: Strategic approach Principle 8: Implementation guidance Principle 9: Financial guidance Principle 10: Performance measurement Principle 11: Public involvement Principle 12: Plan maintenance Exhibit 1.3: Key Principles for Sustainable Transportation Planning, Transport Canada 1.8 Study Organization The study was jointly directed by Mr. Chris Webb, Manager of Engineering Services, and Mr. Jim Coburn, former Traffic Coordinator for the City of Owen Sound. The consultant project team was led by Mr. Ray Bacquie of HDR itrans. He was supported by Mr. Stewart Elkins who served as Team Leader. The Steering Committee consisted of the representatives of the following agencies and departments: City of Owen Sound Engineering Services Division City of Owen Sound Planning Division City of Owen Sound Operations Advisory Committee County of Grey Ministry of Transportation Ontario ~ 6 ~
32 2. PUBLIC CONSULTATION PROCESS 2.1 Description of the Public Consultation Process The public consultation process was an essential component of the study. Considering the population characteristics in the Study Area and localized transportation issues, there were moderate levels of public interest. The public consultation program contained the following components: Steering Committee Meetings These meetings provided for an exchange of ideas between the City and the Consultation team. Visioning Workshop A Visioning Workshop was formed to allow citizens and individuals representing groups, agencies and organizations a special opportunity to provide input early on in the study and to provide feedback on preliminary alternatives. The Visioning Workshop is described in greater detail in Section 2.2. Community Traffic Issues Meeting A meeting with the City of Owen Sound Operations Committee and citizens about community traffic issues in known hot spots was arranged to allow individuals to provide feedback about their concerns and suggestions how to mitigate the traffic issues in their community. The Community Traffic Issues Meeting is described in greater detail in Section 2.2. Public Information Centre (PIC) One formal meeting was held during the Study, consisting of an open house format with display panels and a formal presentation followed by a discussion session. The PIC is described in greater detail in Section 2.2. Newspaper Advertisements Advertisements were placed in the local newspaper to announce the Notice of Study Commencement, the Visioning Workshop, and the PIC. Notices were hand delivered to specific neighbourhoods to advise of the Community Issues Meeting. The newspaper advertisements invited the public to attend the meetings and to provide input. The advertisements provided information on contact names, telephone numbers, and addresses. 2.2 Workshop and Public Information Centre Visioning Workshop April 14, 2010 The Visioning Workshop was open to all citizens and stakeholders. A stakeholder was generally an individual representing a group, agency or organization that has a particular interest in the Study Area. Government agencies, environmental groups, ratepayers associations and land developers are examples of typical stakeholders who could attend. The Visioning Workshop was held on April 14, 2010 between 6:00 PM and 9:00 PM. Poster boards about the project were displayed on easels and attendees were provided with the opportunity to examine them. HDR itrans led a presentation describing the existing ~ 7 ~
33 transportation conditions, future transportation conditions (2026), and some preliminary alternatives. The alternatives were used primarily to solicit input from the group and gauge their acceptability. Attendees also had the opportunity to provide feedback about the study by completing and submitting comment sheets about the analysis and proposed alternatives. Approximately 20 individuals attended the Visioning Workshop in the lower auditorium of the Owen Sound & North Grey Union Public Library in Owen Sound. The following topics were covered at the workshop: Existing Conditions Draft Problem and Opportunity Statement Alternate Route Alternative One-Way Paring of 8th Street and 9th Street Alternative Cycle Spine Lane Network Alternatives Alternative River and Harbour Crossings Community Traffic Issues Hot Spots More details of the Visioning Workshop are available in Appendix A Community Traffic Issues Meeting May 12, 2010 A Community Traffic Issues meeting was held on May 12, 2010 between 6:00 PM and 9:00 PM. HDR itrans led a presentation which included an overview / primer on traffic calming, as well as the data collection, assessment, and alternatives for each of the three roadways which included Alpha Street, Moores Hill, and 15th Street A East. Attendees provided feedback to the City s Operations Committee as well as the Consultant. Residents also had the opportunity to provide feedback about the study by completing and submitting comment sheets about the findings and proposed alternatives developed for each of the roadways. Approximately 40 individuals attended the Community Traffic Issues Meeting in the City Hall Council Chambers. The following topics were covered at the meeting: Traffic Calming Primer Alpha Street: Existing Conditions List and Evaluation of Alternatives Preferred Alternative Moores Hill: Existing Conditions List and Evaluation of Alternatives Preferred Alternative 15 th Street A East: Existing Conditions List and Evaluation of Alternatives Preferred Alternative More details of the Community Issues Meeting are available in Appendix A2. ~ 8 ~
34 2.2.3 Public Information Centre June 16, 2010 The purpose of the PIC was to present the following topics to the public for their input and comments: Study Background Problem and Opportunity Statement List of Alternatives Draft Evaluation of Alternatives Draft Recommended Alternatives The public responses will be used to refine the preliminary preferred alternatives and select the preferred alternative. More details of the Public Information Centre are available in Appendix A Comments Received and Project Team Responses All comments received from the public, stakeholders, and agencies throughout the study were recorded by the project team. Appendix A4 summarizes public and stakeholder comments received throughout the study. The input received throughout the course of the study was very important with respect to the direction the study took, the alternatives that were assessed and carried forward, and the emphasis that was placed on various aspects of the transportation network. ~ 9 ~
35 3. BACKGROUND DOCUMENTS 3.1 Policy Documents To guide the Transportation Master Plan within the context of the overall direction provided by Provincial policy, Grey county policy and City of Owen Sound strategic policy direction was reviewed at the outset of the study. This Chapter provides a brief summary of key background polices that have shaped and influenced the development of the current transportation system in Owen Sound and provide direction for the future Ontario Provincial Policy In the Ontario Government report Provincial Policy Statement 2005, provides direction on matters of provincial interest related to land use planning and development, and promotes the provincial policy-led planning system. The statement includes direction on Transportation Systems and Transportation and Infrastructure Corridors. The following transportation policies have been identified to be used as guidelines in developing a Transportation Master Plan: Transportation systems should be provided which are safe, energy efficient, facilitate the movement of people and goods, and are appropriate to address projected needs. Efficient use shall be made of existing and planned infrastructure. Connectivity within and among transportation systems and modes should be maintained and, where possible, improved including connections which cross jurisdictional boundaries. A land use pattern, density and mix of uses should be promoted that minimize the length and number of vehicle trips and support the development of viable choices and plans for public transit and other alternative transportation modes, including commuter rail and bus. Transportation and land use considerations shall be integrated at all stages of the planning process. Planning authorities shall plan for and protect corridors and rights-of-way for transportation, transit and infrastructure facilities to meet current and projected needs. Planning authorities shall not permit development in planned corridors that could preclude or negatively affect the use of the corridor for the purpose(s) for which it was identified. The preservation and reuse of abandoned corridors for purposes that maintain the corridor s integrity and continuous linear characteristics should be encouraged, wherever feasible. When planning for corridors and rights-of-way for significant transportation and infrastructure facilities, consideration will be given to the significant resources in Section 2: Wise Use and Management of Resources. ~ 10 ~
36 3.1.2 Grey County Policy The Grey County Official Plan, County of Grey Official Plan 2000, provides direction on growth within the County. Policies provide primary direction on County roads and coordination between levels of government in developing the transportation system. Key County transportation policies are summarized as follows: The County does not support the abandonment of railway operations but where rail rightof-way closures are being considered, a public hearing should be held. The County and/or local municipal councils shall give consideration to the purchase of a closed right-of-way where it is feasible to do so. The County shall take measures to ensure that the movement of hazardous materials takes place in a manner which minimizes the risk to local residents and the natural environment. County Roads generally be a 20 metre right-of-way width The scenic qualities of road corridors will be considered when undertaking road improvements along County Roads. Attempts will be made to retain or otherwise protect scenic features located within the road allowance but only when traffic safety can be maintained. Within the Niagara Escarpment Plan the policies of this Section apply, however only essential transportation and utility facilities are permitted in Escarpment Natural Area and Mineral Resource Extraction Areas City of Owen Sound Policy The City of Owen Sound developed a strategic plan in 2008 Strategic Plan for the Corporation of the City of Owen Sound, to provide overall corporate direction for the City. It states that Owen Sound s vision is to be a community of choice for all, distinguishable by its authenticity, natural amenities, diversity and community spirit. It notes that the City of Owen Sound governs and advocates on behalf of all citizens by providing infrastructure and services which respect the environment and allow individuals and businesses to prosper. Key City of Owen Sound transportation policies that provide direction to the development of the TMP are summarized as follows: The City should provide a specialized transit service for people throughout the week with mobility problems to provide equitable access for persons with disabilities. The City should ensure the provision of adequate parking facilities to serve the downtown area. The City should develop an updated Transportation Plan for the City, which makes provision for projected east/west traffic movements. The City should complete a comprehensive Bicycle Master Plan for the community including links between residential and business areas and make provision for bicycle parking. ~ 11 ~
37 The Owen Sound Official Plan, March 2006 provides direction on growth within the City. It identifies goals and objectives, land use policies, transportation and municipal services policies and direction on implementation. Key transportation policies related to the development of the TMP include the following: The City shall establish a coordinated transportation system in accordance with Schedule C Transportation Plan, designed to facilitate the satisfactory movement of both people and goods. The transportation system is intended to facilitate safe and efficient movement of traffic between areas within the City as well as to ensure traffic movement through the City and external linkages with the overall transportation system in the regional setting. Within 5 years from the adoption of this Plan an updated Transportation Plan should be developed and updated in conjunction with Official Plan reviews which provides for projected east/west traffic movements, and other initiatives necessary to ensure an efficient, reliable and safe transportation system in the City. The City shall ensure a bridge corridor is maintained, free of significant development, through the lands east of 1st Avenue West at the end of 14th Street West and 12th Street West so as to leave various options open for a future bridge across the inner harbour. An alternative bridge route is along 11th Street West/11th Street East. Where private lands are proposed for development within this corridor the City may require the dedication of land for the purposes of securing ownership of the said corridor. The final route is to be determined by the Transportation Plan referred to in Section of the Official Plan. The final route as determined by Council may require an amendment to this Plan. The preservation and reuse of abandoned rail corridors shall continue to be encouraged and the pedestrian paths existing on abandoned rail corridors shall be maintained. Rail corridors into the City through to industrial areas shall be preserved and re-used. Rail corridors along the waterfront and Downtown may be transferred, relocated and redeveloped where a more favourable waterfront location or similar site preserving public access is determined. A viable public transit system which supports alternate modes of transportation such as walking and cycling will be supported by encouraging a land use pattern, density and mix of uses that reduces the growth in the length and number of vehicle trips. The City will encourage the use of future technologies that will support a safe and efficient transportation system. 3.2 Data Sources Land use data for this study were obtained from the City of Owen Sound Planning Department. Traffic data were obtained from City of Owen Sound, Grey County, and the Ministry of Transportation Ontario (MTO). To supplement available traffic data, HDR itrans commissioned Pyramid Traffic Inc. to conduct extensive traffic volume and origindestination data as part of the TMP study. ~ 12 ~
38 4. EXISTING CONDITIONS 4.1 Socio-Economic Environment Population and Employment Existing Population Based on previous Statistics Canada census data, like many smaller cities in Ontario, Owen Sound experienced only a modest rate of population growth between 1981 and The average annual growth rate was calculated at 0.38%, compared to the average annual population growth rate for the Province of Ontario of 1.64%. The historic population data is summarized in Table 4.1. Further information is provided by Grey Bruce Health Unit in Appendix B. Table 4.1: Owen Sound Population Data Census Year City of Owen Sound Ontario ,833 8,625, ,804 9,101, ,674 10,084, ,390 10,753, ,431 11,410, ,753 12,160,282 Average Annual Growth Rate from 1981 to % 1.64% Projected Population Based on the average annual growth rate of 0.38% calculated from historic Stats Canada census data, the forecasted growth of the City of Owen Sound is shown in Table 4.2. Table 4.2: Owen Sound Population Projection Based on Historic Growth Projected Population 22,002 22,423 23,290 From the report Owen Sound Official Plan Background Study, prepared by The Biglieri Group Ltd in October 2003, there are three scenarios that were used for the population projection in the City of Owen Sound. The three scenarios used were: Share of Growth were is was assumed that the City of Owen Sound will receive about 24.5% of the growth in Grey County Slow Growth were migration for each age group is assumed to be at the same rate as for 1996 to 2001 Economic Revival were the out-migration rate of young people is gradually reduced and the in-migration rates for other age groups gradually increase. The projected population based on the three scenarios is summarized in Table 4.3. ~ 13 ~
39 Table 4.3: Population Projection in the City of Owen Sound Share of Growth 21,740 22,467 23,472 Slow Growth 21,173 20,894 20,245 Economic Revival 22,830 24,139 27,558 Based on Grey County Growth Management Strategy Report prepared by Malone Given Parsons Ltd. and the Centre for Spatial Economic in April 2008, population projections for the City of Owen Sound are quite different from the Owen Sound Official Plan Background Study. The County projected population for the City of Owen Sound is summarized in Table 4.4. Table 4.4: Population Projection for the City of Owen Sound (Grey County) Projected Population 23,400 24,000 24,900 As shown in the above three tables, there is modest growth expected to occur in the City of Owen Sound over the long term. The projected population of Owen Sound in 2026 can expected to be between 23,300 and 27,600 persons. This does not include population projections for the surrounding areas, but it can be assumed that they will grow at a similar rate to that of the City of Owen Sound Existing Employment Based on Statistics Canada census data, the amount of employment in the City of Owen Sound is summarized in Table 4.5. Compared to the unemployment rate for the province of Ontario, the City of Owen Sound has historically had a higher unemployment rate. Table 4.5: Owen Sound Existing Employment Census Year City of Owen Sound Ontario 1996 Persons in the labour force 9,826 5,539,738 Employed 8,805 5,077,670 Unemployment Rate 11.6% 9.1% 2006 Persons in the labour force 10,780 6,587,580 Employed 9,980 6,164,245 Unemployment Rate 7.4% 6.4% Projected Employment Based on the Grey County Growth Management Strategy Report prepared by Malone Given Parsons Ltd. and the Centre for Spatial Economic in April 2008, the employment projections for the City of Owen Sound are summarized in Table 4.6. ~ 14 ~
40 Table 4.6: Employment Projections for the City of Owen Sound Projected Employment 13,900 14,200 14,400 Employment growth is expected to be slow in the City of Owen Sound with a net increase of 500 jobs over the next 15 years. The detailed demographic were attached in Appendix C Existing Land Uses Existing land uses in the Study Area are summarized in Schedule A from the Owen Sound Official Plan as illustrated in Exhibit 4.1. The major attraction land uses in the City include: Commercial There are three main commercial areas within the City of Owen Sound. The first area is its Downtown Core (centred on 2 nd Avenue East). The Downtown Core is comprised of mainly independent stores mixed with office space and residential apartments. The second area is a highway commercial area along 20 th Street East. This is comprised mainly of regional shopping destinations such as Heritage Place Mall and big box retailers such as Wal-Mart, Home Depot, and Canadian Tire. There is also a smaller highway commercial area situated on 10 th Street West between 6 th Avenue West and 9 th Avenue West. Outside of the City s boundary, there is additional highway commercial on Highways 6 and 21. Industrial - The main industrial area is located in the north-eastern area of the City centred around 20 th Street East and 16 th Avenue East. This area comprises light industry (warehousing) to heavy industrial (manufacturing) land uses. There is also a marine industrial area located on both sides of Owen Sound harbour where large grain / other aggregate silos are situated for interim storage before being transported by ground transport and marine vessels. Institutional - There are several large institutional land uses that draw significant trips. These include the Grey-Bruce Health Services Hospital, Georgian College, and Owen Sound Collegiate and Vocational Institute on 8 th Street East, the Government of Ontario Regional Court House on 9 th Avenue East, West Hill Secondary School on 9 th Street West, and St. Mary s Catholic Secondary School on 15 th Street East. Recreational - There are also several recreational areas that can draw significant number of trips. These include the Regional Recreational Centre (currently under construction), Bayshore Community Arena, Duncan McClellan Park, Harrison Park, Kelso Beach Park, and the Bruce Trail. Residential - The majority of residential land uses in the City of Owen Sound are comprised of low density, single family units at the north of the City. The single family units in the river valley floor are older units more densely spaced units. Medium and higher density residential units are scattered throughout the City. ~ 15 ~
41 City of Owen Sound Not To Scale September 2010 Transportation Master Plan Exhibit 4.1 Schedule A from Owen Sound Official Plan HDR itrans Project # 5454
42 4.1.3 Development Activity As identified in the Owen Sound Official Plan, the majority of future development is anticipated to occur in the east side of the city in and around the 8th Street East and 16th Street East area. The majority of future development will likely take the form of commercial and residential land uses. 4.2 Socio-Cultural Heritage Environment A Stage 1 archaeological assessment was conducted in September 2009 to determine the presence of and/or potential for any heritage resources that might be extant in the study area and, if so, what steps need to be taken for their management. The survey was conducted in accordance with the Ministry of Culture (MoC) guidelines for lands, which exhibit a moderate to high heritage potential. A number of sites within the Study Area have been registered with the City of Owen Sound Heritage Register, and have been identified as having heritage value or interest by other studies. There is a concentration of heritage sites in the downtown area of the City. The 24 listed heritage buildings are illustrated in Exhibit 4.2. The detailed cultural heritage report is included in Appendix D. 4.3 Natural Environment Key Environmental Features Natural Resource Solutions Inc. (NRSI) was retained by HDR itrans as part of the Transportation Master Plan. NRSI s role was to compile background information on environmental constraints within the study area and produce a stand alone summary report. The Ecological Constraints Analysis Report dated October, 2009 provides a summary of the natural environment constraints, found in the study area, as input to the development of ecologically sensitive transportation options. The ecological constraint mapping shown on Exhibit 4.3 identifies significant natural features including aquatic habitats, woodlands, wetlands, significant plant and wildlife species and designated significant natural areas. Some of these designations are overlapping which identifies that there are various areas, some within, and some just out-side of the City limits, which have multiple constraints. The greater the number of constraints identified for a given area, the greater the potential for impacts. Future proposed transportation upgrades proximal to these features will likely require feature-specific studies to determine the precise boundaries and extent of the feature, as well as suitable protection measures such as buffers. Permits from the GSCA, DFO and MNR may also be required. The detailed report is attached in Appendix E. ~ 17 ~
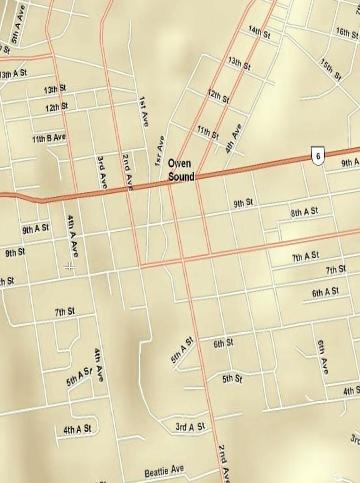
43
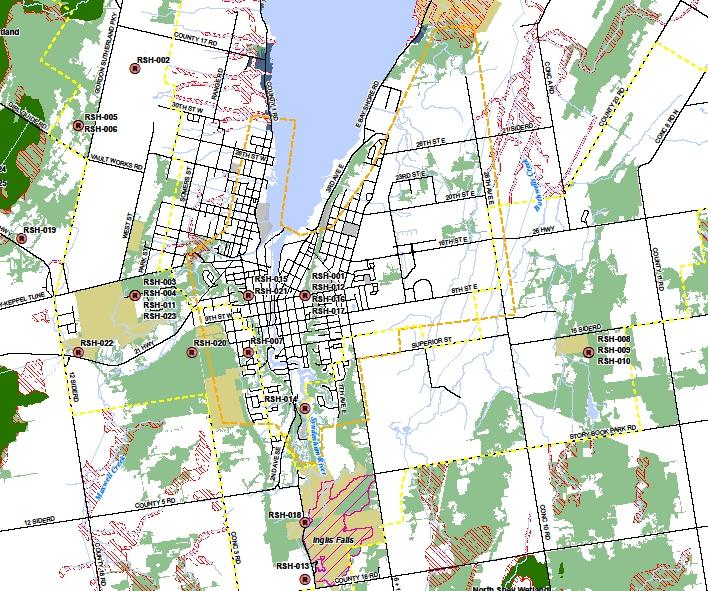
44
45 4.4 Existing Transportation Network This section discusses the existing transportation network in Owen Sound Road Network The main road network within the study area includes Provincial Highways, County of Grey Roads, and municipal Arterial and Collector Roads. The East-West road network is discontinuous due to the topographic nature of the land with limited connections up either side of the Escarpment. As a result, some of the existing roads in Owen Sound that do ascend/descend the Escarpment experience capacity and congestion problems today. Congestion (especially on 10th Street) also leads to traffic spilling over onto residential collector roads, raising residents concerns over traffic infiltration, safety, and speeding in residential areas. Exhibit 4.4 illustrates the major road network in Owen Sound, while Exhibit 4.5 shows the existing number of travel lanes Transit Services The City of Owen Sound operates both a Conventional Transit and a Specialized Transit service. Conventional Transit The Conventional Transit service is provided via four (4) routes. All four routes provide half hour service from 6:30 AM to 6:00 PM Monday through Friday. On Saturdays, bus service operates between 9:00 AM and 5:30 PM. The City's new Eldorado Low Floor Buses were put into service in September 2005 and are fully accessible to everyone. They have a kneeling feature which lowers the height of the bus approximately three (3) inches for ease of entry as well as ramps at the front and rear doors for loading and unloading a wheelchair or scooter. They also have bicycle racks installed on the front of the bus that can accommodate two bicycles. Dial-A-Bus Service is a complementary service to the four route system. For transit service from the terminal to East Bay Shore Road and the industrial park or from East Bay Shore Road and the industrial park to the terminal riders are supposed to phone one hour in advance for pick-up. The bus routes are shown in Exhibit 4.6. Specialized Transit The Specialized Transit service provides a door-to-door transportation service for residents of the City with mobility limitations that restrict their ability to use the Conventional Transit service. The service uses a wheelchair accessible bus and operates 5 days a week Monday to Friday from 8:00 AM to 5:00 PM. ~ 20 ~
46
47
48
49 To be able to use this service an Application Form must be completed and submitted to the City for approval. Once approved the applicant is issued an Owen Sound Specialized Transit Card and Identification Number which is used when booking the door-to-door transit service. Approval to use the service must be renewed every two (2) years. Both transit services are operated out of the Owen Sound Transit Terminal located at rd Avenue East. Thomas Norris Limited provides the transit services under contract with the City of Owen Sound. Inter-City Bus Transit Intercity bus service is also available from the Transit Terminal by Greyhound Bus Lines. Grey Bruce Air Bus provides transportation service to Pearson Airport in Toronto and Aboutown Transit provides transportation to the London area Goods Movement The volume of goods moved to, from, and through the City is substantial. The major generators of goods movement in Owen Sound are the industrial and employment areas north of 16th Avenue East, and the area around the harbour and 14th Street West. The Provincial highways (Highways 6, 10, 21, and 26) provide access for trucks to the transportation networks of Southern Ontario, the Great Lakes, Canada, and the United States. Truck movements generally take place on the highways, arterial roads, and industrial collector roads. Trucks are restricted in residential areas. The permitted truck routes are illustrated in Exhibit 4.7. The arterial road links with the highest daily truck volumes and / or percentage of total vehicles are shown in Table 4.7. Table 4.7: 2009 Owen Sound Heavy Vehicle Cordon Counts 2009 PM Peak Hour Traffic Count Total Volume Truck Percentage Alpha Street North of 11th Street West % 10th Street W East of 9th Avenue West % Eddie Sergent Pkwy North of 19th Street West % 10th Street W East of 2nd Avenue West % 9th Street W East of 2nd Avenue West % 8th Street W East of 2nd Avenue West % 9th Avenue East South of 20th Street East % 16th Street East East of 18th Avenue East % 8th Street East East of 16th Avenue East % 20th Street East East of 16th Avenue East % 9th Avenue East South of 6th Street East % ~ 24 ~
50
51 4.4.4 Sidewalks and Bicycle Paths The City currently accommodates pedestrians and cyclists within roadway corridors and along trails. These features include: Hard and soft surface trails and on-road connections, Sidewalks, typically adjacent to public roadways; and, On-road cycling permitted on local, collector and arterial roadways (but not marked as formal cycling routes). The existing walking network is shown in Exhibit 4.8. There is currently a grid of pedestrian connections throughout the urban portion of the City. Sidewalks are provided on most County roads, arterial roads and collector roads on one or both sides of the road. The trail system also provides pedestrian connections. The City of Owen Sound has planned a network of walk and cycle trails providing connections with recreational activities. The City Park Trails Master Plan of City of Owen Sound Official Plan identifies the planned walking trail and cycling network that is shown in Exhibit 4.9. The on-road cycling network has not been developed and existing cycling facilities that are separated from vehicles is limited to the off-road trail system. Based on our review of the planned walking network, there are a couple of missing links including a missing sidewalk link on 19th Street East from 7th Avenue East to 5th Avenue East, a missing link along 8th Street East (Grey Road 5) from 16th Avenue to the Railway Line, and 8th Avenue West from 16th Street West to 19th Street West. The feasibility and cost implications of these connections require further investigation For cycling network, there are several short distance missing links that would help provide network continuity and complete the proposed network. The following links may be considered further as opportunities to complete the planned network: 6 th Street East and Superior Street Provides an additional east-west corridor to a river crossing 8 th Street (Grey Road 5 east of 16 th Avenue East) Provides continuous route in east Owen Sound 20 th Street (7 th Avenue E to 20 th Avenue E) Provides a continuous route in east Owen Sound 7 th Avenue East Provides a north-south connection linking to the planned Recreational Centre Park and Ride and Carpool Lots There are currently no Park and Ride lots in the vicinity of Owen Sound. ~ 26 ~
52
53
54 4.5 Origin-Destination Survey The origin-destination survey was conducted on key arterial routes in the City and for inbound vehicles only (with the exception of Grey Road 18. The primary intent of the origindestination study was to determine the amount of provincial, regional, and local traffic that had origins or destinations to Owen Sound versus the amount of through traffic on City and County Roads. The locations of the survey stations are listed in Table 4.8 below. Table 4.8: OD Survey Locations Survey Station Street Location Date 1 Southbound Grey Road 15 North of 28th St E 23-Oct-09 4 Westbound Hwy 26 (16th St. E) East of 16th Ave. E 23-Oct-09 5 Westbound 8th St. E East of 9th Ave. E 23-Oct-09 7 Northbound Hwy 6 & 10 (9th Ave. E) South of 6 th St E 23-Oct-09 8 Northbound Grey Road 5 (2nd Ave W) South of 6 th St E 23-Oct-09 9 Eastbound Hwy 6 & 21 (10th St W) West of 8th Ave W 23-Oct Southbound Grey Road 1 (3rd Ave W) North of 19 th St W 23-Oct Eastbound Grey Road 18 West of Highway 6 & Oct Westbound Grey Road 18 East of Highway 6 & Oct-09 In order to limit delays to the travelling public, the OD survey was conducted using a prepaid mail back questionnaire method. In order to allow for the safety of the staff handing out the questionnaires, the station locations were set at existing signalized intersections located within the boundaries of the City and the questionnaires were handed out only during the red phase of the cycle. The only exception to this was at Station 1 where there was no traffic signal and the use of a flagman was used to stop vehicles. An origin-destination questionnaire was handed out to drivers by Pyramid Traffic Inc. on behalf of HDR itrans and the City of Owen Sound during the afternoon of Friday October 23, A copy of the questionnaire used in this OD survey is shown in Exhibit ~ 29 ~
55 Exhibit 4.10: OD Survey Questionnaire A total number of 4,650 questionnaires were handed out at the 9 stations. The number of questionnaires handed out at each station was based on 25 percent of the historic 2006 AADT traffic volumes at each location. This percentage of daily traffic was expected to provide a large enough sample to draw findings and conclusions from. The number of questionnaires handed out at each station is listed in Table 4.9 below. Table 4.9: OD Survey Questionnaire Handed Out by Location Location Number of Questionnaires Percentage #1 - Grey Road #4-16th Street East #5-8th Street East #7-9th Avenue East #8 - Grey Road 5 (2nd Ave W) #9-10th Street West #13 - Grey Road 1 (3rd Ave W) #14EB - Grey Road #14WB - Grey Road Total ~ 30 ~
56 4.5.1 Results of Origin-Destination Survey Out of the 4,650 questionnaires handed out, a total of 623 (13.4%) of questionnaires were returned. Table 4.10 below shows the number of returned questionnaires by station location along with the percentages compared to the number of questionnaires handed out and the percentage of returned questionnaires. Table 4.10: OD Survey Number of Returned Questionnaires Location Number of Returned Questionnaires Percentage Returned Percentage from Station Returned #1 - Grey Road #4-16th Street East #5-8th Street East #7-9th Avenue East #8 - Grey Road 5 (2nd Ave W) #9-10th Street West #13 - Grey Road 1 (3rd Ave W) #14EB - Grey Road #14WB - Grey Road Total The general summary of the origin-destination survey is provided below and also included in Appendix F Trip Origins A list of all originating trips are listed in Table 4.11 and shown graphically in Exhibit ~ 31 ~
57 Table 4.11: OD Survey Origin Locations Origin # % Origin # % Origin # % Owen Sound Markdale Kimberley Wiarton Rockford Kincardine Shallow Lake Walkerton Listowel Chatsworth Burlington Mar Tara Durham Massie Kemble Keady Mississauga Sauble Beach Kilsyth Mooresburg Meaford Mount Forest Neustadt Port Elgin Paisley Niagara Falls Annan Thornbury Northern Bruce Peninsula Hepworth Tiverton Oliphant Georgian Bluffs Tobermory Peterborough Lions Head Barrie Priceville Desboro Berkley Ready Hanover Hamilton Ripley Leith Holland Center Rural Unidentified Kitchener Sarnia Chesley Springmount Shelburne Southampton Teeswater Sideroad Toronto Uxbridge Stokes Bay Williamsford Big Bay Sydenham Twp Allenford Bradford Wasaga Beach Brampton Cargill Windsor Collingwood Clarksburgh Woodford Guelph East Linton Bogner Gravenhurst TOTAL Flesherton Kemptville The majority of trips are originating in the greater Owen Sound area which includes Grey and Bruce Counties. This includes 46.5 percent (290 of 623) of the returned questionnaires originating from the City of Owen Sound. The second highest origin area was the Town of Wiarton in Bruce County with 5.1 percent (or 32 out of 623). This finding indicates that almost half of the traffic on the major road network is localized traffic that originated in Owen Sound Trip Destinations A list of the destinations are provided in Table 4.12 and shown graphically in Exhibit ~ 32 ~
58 Table 4.12: OD Survey Destination Locations Destinations # % Destinations # % Owen Sound Echville Chatsworth Fergus Unidentified Georgion Bluffs Wiarton Grey County Meaford Kemble Rockford North Bay Big Bay Oakville Collingwood Port Elgin Leith Renfrew Annan Sauble Beach Brampton Springmount Burlington Tara Flesherton Thornbury Kilsyth Toronto Southampton Walkerton Berkeley Waterloo Durham TOTAL As shown in the above table, the majority of trips (88.9 percent) are destined to the City of Owen Sound reinforcing the fact that Owen Sound is a major attractor of trips Trip Destinations within Owen Sound As shown by the destination results, the City of Owen Sound was the main destination for the majority of respondents in the survey. By analysing the destinations by individual station location, it is apparent that there are three main areas within the city that draw the most trips: the Downtown core; the 16th Street East commercial area; and the 8th Street East institutional area. This is illustrated in Exhibit 4.13 through Exhibit 4.15 which shows the percentage of trips and their approximate routing to their final destinations from the south, north-northwest, and east-northeast. ~ 33 ~
59
60
61
62
63
64 Trip Purpose A question asked to the public as part of the mail back survey was what is the main purpose of their trip. Answers included: Work; Shopping; Visiting; Vacation; and Other. The results of this question are illustrated in Exhibit 4.16 below. Other 13% Multi-Purpose 15% Work 30% Vacation 2% Visiting 9% Shopping 31% Work Shopping Visiting Vacation Other Multi-Purpose Exhibit 4.16: Trip Purpose Summary As shown in the exhibit above, shopping and working were the most popular responses with approximately 31 and 30 percent respectively. This finding suggests that Owen Sound is a major attractor for both commerce and employment Trip Frequency Another question asked was how frequent they made this trip. Choices on the mailback survey included: daily; weekly; monthly; and first time. The results from the returned questionnaires are illustrated in Exhibit Not Identified 26% Daily 22% First time 3% Monthly 9% Weekly 40% Daily Weekly Monthly First time Not Identified Exhibit 4.17: Trip Frequency Summary As shown in the exhibit above, the majority of vehicle trips are weekly and daily trips. This tends to indicate that the majority of drivers do this trip fairly frequently and are confident in their knowledge of route selection and direction of travel through Owen Sound. ~ 39 ~
65 Route Selection Exhibit 4.18 illustrates the overall response of why respondents chose the route they took. Multi-reason 29% Safe 1% Fast 9% Other 3% Only choice 24% Scenic 2% Road condition 1% Convenient 31% Safe Fast Convenient Scenic Road condition Only choice Other Multi-reason Exhibit 4.18: Route Selection Summary Route convenience at 31% was the primary reason they chose a specific route. 29% of the respondents chose multiple-reason, and 24% of the respondents chose only choice Vehicle Type Exhibit 4.19 illustrates the vehicle type of the respondents. Single Unit Truck 16% Unidentified 1% Large Truck 1% Passenger Car Single Unit Truck Large Truck Unidentified Passenger Car 82% Exhibit 4.19: Vehicle Type Summary Passenger car was the primary mode of travel for respondents with approximately 82 percent of all travel occupancy via automobile. Large trucks only represented 1% of the respondents O-D Survey Summary Owen Sound is clearly a regional centre within the County of Grey where residents from neighbouring communities in Grey and Bruce Counties choose to do their daily / weekly activity. This is confirmed by the majority of daily/weekly trip frequency, trip purpose, and vehicle type responses received from the survey. ~ 40 ~
66 4.6 Existing Network Performance Level-of-Service Considerations The concept of level-of-service is a measure describing operational conditions of the roadway perceived by the user. A common method of representing level-of-service has traditionally been a qualitative letter grading system corresponding to six levels of service. The letter designations are from "A" to "F", with "A" representing the best operating conditions and "F" the worst. These levels are measured by quantifiable parameters that describe operating quality, such as travel delay, average speed or reserve capacity. Level-of-service at intersections is measured in terms of the amount of capacity is utilized and conveyed as decimal value referred to as a volume-to-capacity ratio (v/c ratio). Level-foservice is also measured based on average vehicle delay at each intersection. The delay is related to letter designations from LOS "A" (less than 25 seconds per intersection) to "F" (greater than 80 seconds). Most jurisdictions in Ontario strive to maintain level-of-service D for a typical commuter day. Congested traffic conditions directly increase fuel consumption and vehicle emissions. Level-of-service affects average vehicle speed and number of stops. There is a direct interrelationship between vehicle speed and air quality. At least half of transportation based pollution occurs as a result of the vehicle trip. Operations at a lower level-of-service, example: level of service E rather than D would increase vehicle emissions on affected facilities in the order of 25%. Given the environmental and transportation objectives of the Town of Owen Sound as defined in the strategic plan and Official Plan, current and future conditions were assessed relative to a level-of-service D Data Sources Land use data for this study were obtained from the City of Owen Sound Planning Department. Traffic data were obtained from the Pyramid Traffic Inc., City of Owen Sound, Grey County, and the Ministry of Transportation Ontario (MTO). The details of the data sources are provided in Appendix F2. An assessment of existing and future traffic conditions was undertaken as part of the Transportation Master Plan. The initial step in the traffic assessment is to establish the existing capacity and operating characteristics of the road network. The assessment of existing conditions is used as a benchmark to compare with future conditions, as well as to determine the extent of improvements that are required which affects the development and selection of alternatives. The two measures of effectiveness used for the analysis include link capacity (vehicles per lane/per hour) and intersection capacity (volume / capacity ratio). Both are reported using a level of service indicator. ~ 41 ~
67 Road Network Capacity For planning purposes, it is generally accepted that screenline volume to capacity (v/c) ratios of 0.85 to 0.90 signify stop-and-go conditions, long intersection queuing and delays, and indicate capacity deficiencies on one or more roadways included in a screenline. Exhibit 4.20 illustrates volume to capacity ratios calculated for the existing travel conditions during the PM peak period for select screenlines situated around the City of Owen Sound. The colour of each screenline shows the level of congestion and has been defined as follows: Green coloured arrows - indicate that roads crossing the screenline and the intersection have spare capacity. Roads are operating at a v/c ratio of less than 0.75, Yellow coloured arrows - indicate that roads crossing the screenline are at capacity. These roads are operating at a v/c ratio of 0.79 to 0.90 meaning the roads that comprise the screenline experience some congestion; and, Red coloured arrows - indicate that roads crossing the screenline are over capacity and severely congested. In such case a number of roads would operate at a v/c ratio of 0.90 or more signalling severe capacity deficiency. Screenlines capture traffic flows on east-west routes such as 10th Street, 9th Street, and 8th Street across the Sydenham River, 10th Street West and Alpha Street in the west end, and Superior Street, 8th Street East, 16th Street East, 20th Street East, and 26th Street East in the east end. As shown in Exhibit 4.20 the east-west arterials in the west and east sides of the city have sufficient residual capacity available. The east-west crossings of the Sydenham River also have spare capacity available during the PM peak hour even though 10th Street is congested in this section of the City which indicates that roadways such as 8th Street East/West and 9th Street East/West have the residual capacity. The north-south screenlines (Grey County Road 1 and 4th Avenue West in the Northwest, Grey County Road 15 and 9th Avenue East in the north east, and Grey County Road 5 and 9th Avenue East in the south) are showing that there is sufficient capacity available during the PM peak hour on all routes. In summary, the screenline analysis for 2009 existing conditions shows that for the majority of the transportation network there is sufficient capacity available. Additional capacity along 10th Street can be afforded if motorists are encouraged to utilize other east-west routes parallel to 10th Street such as 9th Street and 8th Street. ~ 42 ~
68
69 Intersection Capacity Exhibit 4.21 illustrates the level of service calculated for the existing traffic conditions during the PM peak hour for select signalized and unsignalized intersections situated throughout the study area. The colour of each intersection shows the current level of service and has been defined as follows: Green coloured circle indicate that the intersection is operating with a level of service A or B and that intersection and individual turning movements have spare capacity, Yellow coloured circle indicate that the intersection is operating with a level of service C or D and that the intersection and individual turning movements are experiencing some congestion. Some individual turning movement may experience level of service F with volume to capacity ratios greater than 0.90, Red coloured circle indicate that the intersection is operating with a level of service E or F and that the intersection and/or individual turning movements are approaching or over capacity signalling severe capacity deficiency. Some individual turning movements may also experience level of service F with volume to capacity ratios greater than As shown in Exhibit 4.21, the majority of key intersections (arterial to arterial or collector to arterial) operate with an overall level of service D or better during the PM peak hour. Some signalized intersection along the arterial connecting links (i.e. the 10th Street corridor downtown, 9th Avenue East, and 16th Street East) show that they operate with an overall level of service in excess of D indicating that the congestion on these links is caused by the intersections Signal Warrant Analyses As part of the scope of this study the City requested that a number of unsignalized intersections be assessed to determine if traffic signals at these intersections would be justified. Traffic signal justification analysis was based on the latest OTM Book 12 Ministry of Transportation Ontario (OTM) methodology. The analysis was undertaken at the following unsignalized intersections: 3rd Avenue East at 15th Street East (St. Mary s Hill) 16th Avenue East at 20th Street East 9th Avenue East at 20th Street East 4th Avenue East at 8th Street East 9th Avenue East at 15th Street East A 6th Avenue East at 16th Street East There are six justifications for traffic signals in the Book 12. The first four were applied, which are based on turning movement counts. Signals were not justified for any intersection under the first three justifications, which are based on eight hour turning movement counts. ~ 44 ~
70
 and 6th Avenue East at 16th Street East warranted traffic signals based on the fourth justification, which is a four hour turning movement count.")
71 The intersections of 3rd Avenue East at 15th Street East (St. Mary s Hill) and 6th Avenue East at 16th Street East warranted traffic signals based on the fourth justification, which is a four hour turning movement count. The purpose of the four hour count justification is for areas with commuter-dominated roadways, commercial areas, or manufacturing, office, or industrial areas. The details of existing traffic signal warrant analyses are summarized in Appendix F Assess the Merit of Opposing North-South Left Turn Lanes on 9th Avenue East and 6th Street East As part of the scope of this study the City requested that the merit of installing opposing north-south left turn land at the 9th Avenue East and 6th Street East intersection be assessed (Exhibit 4.22). Based on site investigations, the 9th Avenue at 6th Street East intersections lane configurations are as follows: On the north approach, there are two approach lanes with one shared southbound through-right lane and one shared southbound through-left lane and two receiving lanes. On the south approach, there are three approach lanes with one exclusive northbound left turn lane, one exclusive northbound through lane, one exclusive northbound right turn lane and two receiving lanes. Exhibit 4.22: Intersection of 9 th Avenue East at 6 th Street East from the South The second northbound receiving lane could be repainted within the existing pavement surface to accommodate a southbound exclusive left turn lane and would have the following potential benefits: Increase southbound approach capacity. ~ 46 ~
72 Improve safety As there is only one northbound through approach lane and two receiving lanes, the exclusive southbound left turn lane will not impact the northbound through movement capacity. However, consideration to eastbound left turning vehicles from 6th Street East would have to be taken into account through signing or pavement markings as well, so that vehicles accustomed to making this manoeuvre are directed to the northbound receiving lane and not the southbound left turn lane. Having the northbound and southbound opposing left turn lanes will improve left turn traffic sight lines and also reduce left turn traverse distance which result in the risk for left turn collisions being reduced. The traffic operations for the weekday PM peak hour for the intersection of 9th Avenue East at 6th Street East under existing conditions and with the southbound left turn lane being implemented are summarized in Table Table 4.13: 9 th Avenue East at 6 th Street East Operations Comparison Intersection & Movement 9 th Avenue East at 6 th Street East Weekday PM Peak Hour (Existing) Weekday PM Peak Hour (With Southbound Left Turn Lane) LOS v / c LOS v / c Overall C C Eastbound left and through E 0.65 E 0.65 Eastbound right C 0.29 C 0.29 Westbound left, through, and right C 0.25 C 0.25 Northbound left A 0.20 A 0.20 Northbound through A 0.19 A 0.19 Northbound right A 0.02 A 0.02 Southbound left, through, and right B Southbound left B 0.06 Southbound through, and right B 0.31 There is no change in the overall intersection operations during the weekday PM peak hour with the addition of the exclusive southbound left turn lane. The exclusive southbound left turn lane results in a small decrease in the volume to capacity ratio for the shared southbound through-right turn lane. There are no changes to the eastbound, westbound, or northbound turning movement level of service and volume to capacity ratios. Further improvements to intersection operations could be achieved by optimizing the signal timing plans for this intersection (which is outlined in Section of this report). Based on the Synchro analysis, the existing southbound queue is reported at 32.4m for the 50th percentile queue reach and 61.0m for the 95th percentile queue reach. With the addition of an exclusive southbound left turn lane, the southbound left turn will have a 50th percentile queue reach of 10.6m and a 95th percentile queue reach of 28.0m. The southbound through- ~ 47 ~
73 right lanes will have a 50th percentile queue reach of 3.4m and a 95th percentile queue reach of 37.6m. The addition of an exclusive southbound left turn lane would not adversely effect the overall intersection operations of 9th Avenue East and 6th Street East. Given the operational benefits it is recommended that an exclusive southbound left turn lane with a storage length of 30m be provided Assess the Merit of Converting the Northbound Through - Right Lane to Exclusive Right Turn Lane on 9th Avenue East at 8th Street East As part of the scope of this study the City requested that the merit of converting the northbound through / right turn lane to an exclusive right turn lane on 9th Avenue East at 8th Street East be assessed. Based on site investigations, the intersection of 9th Avenue East at 8th Street East lane configurations are as follows: On the north approach, there are three approach lanes with one exclusive southbound left turn lane, one exclusive southbound through lane, one shared southbound through-right lane and two receiving lanes. On the south approach, there are three approach lanes with one exclusive northbound left turn lane, one exclusive northbound through lane, one shared northbound through-right lane and two receiving lanes. The merit of modifying the northbound curb lane from a shared through-right lane to an exclusive northbound right turn lane depends on the northbound approach traffic volumes. If the northbound traffic volumes are high especially the northbound right turn traffic volumes then the exclusive right turn lane is beneficial. Otherwise, the exclusive right turn lane is not required. Exhibit 4.23 shows the existing northbound lanes at the intersection. ~ 48 ~

74 Exhibit 4.23: Intersection of 9th Avenue East at 8th Street East from the South Based on the turning movement counts collected at the intersection of 9th Avenue East at 8th Street East during the weekday AM, mid-day, and PM peak periods, the intersection has been assessed with the existing lane configuration, as summarized in Table 4.14, and with the proposed northbound left turn lane, as summarized in Table Table 4.14: 9 th Avenue East at 8 th Street East Operations Intersection & Movement 9 th Avenue East at 8 th Street East Weekday AM Peak Hour Weekday Midday Peak Hour Weekday PM Peak Hour LOS v / c LOS v / c LOS v / c Overall D C D Eastbound left B 0.15 C 0.21 C 0.35 Eastbound through and right E 0.95 D 0.78 D 0.67 Westbound left D 0.77 E 0.90 F 1.02 Westbound through and right C 0.65 D 0.65 D 0.83 Northbound left B 0.08 B 0.08 B 0.08 Northbound through and right C 0.68 B 0.38 C 0.50 Southbound left C 0.69 A 0.25 B 0.30 Southbound through and right B 0.25 B 0.23 B 0.31 ~ 49 ~
Transportation Master Plan Advisory Task Force
 Transportation Master Plan Advisory Task Force Network Alternatives & Phasing Strategy February 2016 BACKGROUND Table of Contents BACKGROUND Purpose & Introduction 2 Linking the TMP to Key Council Approved
Chapter 7. Transportation. Transportation Road Network Plan Transit Cyclists Pedestrians Multi-Use and Equestrian Trails
 Chapter 7 Transportation Transportation Road Network Plan Transit Cyclists Pedestrians Multi-Use and Equestrian Trails 7.1 TRANSPORTATION BACKGROUND The District of Maple Ridge faces a number of unique
Exhibit 1 PLANNING COMMISSION AGENDA ITEM
 Exhibit 1 PLANNING COMMISSION AGENDA ITEM Project Name: Grand Junction Circulation Plan Grand Junction Complete Streets Policy Applicant: City of Grand Junction Representative: David Thornton Address:
Moving Cambridge. City of Cambridge Transportation Master Plan Public Consultation Centre. March 7, :00 8:00 PM.
 City of Cambridge Transportation Master Plan Public Consultation Centre March 7, 2018 5:00 8:00 PM Region of Waterloo City of Cambridge Transportation Master Plan Public Consultation Centre March 7, 2018
WELCOME TO OPEN HOUSE # 1 June 14, 2017
 Langstaff Road Weston Road to Highway 7 Class Environmental Assessment Study WELCOME TO OPEN HOUSE # 1 June 14, 2017 Please sign in and join our mailing list Purpose of Open House #1 & Study Area York
University of Victoria Campus Cycling Plan Terms of Reference. 1.0 Project Description
 University of Victoria Campus Cycling Plan Terms of Reference 1.0 Project Description The Campus Cycling Plan, a first for the University, will provide a comprehensive and coordinated approach to support
TRANSPORTATION NEEDS ASSESSMENT
 TRANSPORTATION NEEDS ASSESSMENT A travel demand analysis was carried out to determine the operational issues and the potential benefit that adding traffic capacity would have on the road network. All the
City of Hamilton s Transportation Master Plan (TMP) Public Consultation 3 December 2015
 Public Consultation 3 December 2015") City of Hamilton s Transportation Master Plan (TMP) Public Consultation 3 December 2015 McPhail Transportation Planning Services Ltd. AGENDA 6:00 7:00 pm Viewing Boards / Q & A with the Team 7:00 7:50
City of Hamilton s Transportation Master Plan (TMP) Public Consultation 3 December 2015 McPhail Transportation Planning Services Ltd. AGENDA 6:00 7:00 pm Viewing Boards / Q & A with the Team 7:00 7:50
EXECUTIVE SUMMARY OF CALEDON TRANSPORTATION NEEDS STUDY
 EXECUTIVE SUMMARY OF CALEDON TRANSPORTATION NEEDS STUDY The Caledon Transportation Needs Study has been undertaken as a joint project by the Town of Caledon and the Region of Peel to determine the existing
Corporate. Report COUNCIL DATE: June 26, 2006 NO: C012 COUNCIL-IN-COMMITTEE. TO: Mayor & Council DATE: June 22, 2006
 Corporate NO: C012 Report COUNCIL DATE: June 26, 2006 COUNCIL-IN-COMMITTEE TO: Mayor & Council DATE: June 22, 2006 FROM: General Manager, Engineering FILE: 0410-20(MoT/Gate) SUBJECT: Surrey Response on
Welcome. Background. Goals. Vision
 Welcome The formal Public Information Centre (PIC) for the Transportation Master Plan How We GO will be held in early 2017. At that time we will present the recommended transportation system for Niagara
Welcome. The Brooklin Secondary Plan and Transportation Master Plan are collectively referred to as the Brooklin Study.
 Welcome The Town of Whitby is undertaking a study to prepare a Secondary Plan and Transportation Master Plan to guide and manage growth in the Brooklin area. The Brooklin Secondary Plan and Transportation
Performance Criteria for 2035 Long Range Transportation Plan
 Minimizing Impacts on Natural, Historic, Cultural or Archeological Resources 2035 LRTP Weighting Factor: 7% Objective 1.1: Use appropriate planning and design criteria to protect and enhance the built
CITY OF COCOA BEACH 2025 COMPREHENSIVE PLAN. Section VIII Mobility Element Goals, Objectives, and Policies
 CITY OF COCOA BEACH 2025 COMPREHENSIVE PLAN Section VIII Mobility Element Goals, Objectives, and Policies Adopted August 6, 2015 by Ordinance No. 1591 VIII MOBILITY ELEMENT Table of Contents Page Number
Prepared For: Shieldbay Developments Inc. c/o Matson, McConnell Ltd. 2430A Bloor Street West Toronto, Ontario M6S 1P9.
 Prepared For: Shieldbay Developments Inc. c/o Matson, McConnell Ltd. 2430A Bloor Street West Toronto, Ontario M6S 1P9 Prepared By: URS Canada Inc. 4 th Floor, 30 Leek Crescent Richmond Hill, Ontario L4B
APPENDIX 2 LAKESHORE ROAD TRANSPORTATION REVIEW STUDY EXECUTIVE SUMMARY
 APPENDIX 2 LAKESHORE ROAD TRANSPORTATION REVIEW STUDY EXECUTIVE SUMMARY Appendix 2 City of Mississauga Lakeshore Road FINAL REPORT Transportation Review Study December 2010 EXECUTIVE SUMMARY Study Purpose
WEST AND SOUTH WEST RING ROAD DOWNSTREAM TRAFFIC IMPACTS
 Page 1 of 9 EXECUTIVE SUMMARY Alberta Transportation ( AT ) is preparing to construct the final sections of the Calgary Ring Road. This includes the South West Ring Road ( SWRR ) (from Lott Creek Blvd
Service Business Plan
 Service Business Plan Service Name Transportation Planning Service Type Public Service Owner Name Kaylan Edgcumbe Budget Year 2019 Service Owner Title Service Description Manager of Transportation Planning
Chapter 4 Transportation Strategies to Support Growth
 City of Brantford Chapter 4 Transportation Strategies to Support Growth TABLE OF CONTENTS 4.1 DESIGNING A TRANSPORTATION STRATEGY... 1 4.2 STRATEGIES TO INCREASE SUPPLY... 2 4.2.1 Optimizing the Existing
AIRPORT ROAD ENVIRONMENTAL ASSESSMENT
 WELCOME TO PUBLIC INFORMATION CENTRE #1 AIRPORT ROAD ENVIRONMENTAL ASSESSMENT From Braydon Boulevard/Stonecrest Drive to Countryside Drive November 23, 2017 6:30 PM 8:30 PM Please sign in and fill out
CONNECTING PEOPLE TO PLACES
 CONNECTING PEOPLE TO PLACES 82 EAST BENCH MASTER PLAN 07 Introduction The East Bench transportation system is a collection of slow moving, treelined residential streets and major arteries that are the
4. ENVIRONMENTAL IMPACT ANALYSIS 9. TRANSPORTATION AND TRAFFIC
 4. ENVIRONMENTAL IMPACT ANALYSIS 9. TRANSPORTATION AND TRAFFIC 4.9.1 INTRODUCTION The following section addresses the Proposed Project s impact on transportation and traffic based on the Traffic Study
Solana Beach Comprehensive Active Transportation Strategy (CATS)
") Solana Beach Comprehensive Active Transportation Strategy (CATS) 3.0 Goals & Policies The Solana Beach CATS goals and objectives outlined below were largely drawn from the Solana Beach Circulation Element
Solana Beach Comprehensive Active Transportation Strategy (CATS) 3.0 Goals & Policies The Solana Beach CATS goals and objectives outlined below were largely drawn from the Solana Beach Circulation Element
Pedestrian Crosswalk Audit
 1200, Scotia Place, Tower 1 10060 Jasper Avenue Edmonton, Alberta T5J 3R8 edmonton.ca/auditor Pedestrian Crosswalk Audit June 19, 2017 The conducted this project in accordance with the International Standards
CITY OF BLOOMINGTON COMPLETE STREETS POLICY
 CITY OF BLOOMINGTON COMPLETE STREETS POLICY POLICY OBJECTIVE: The City of Bloomington will enhance safety, mobility, accessibility and convenience for transportation network users of all ages and abilities,
Proposed. City of Grand Junction Complete Streets Policy. Exhibit 10
 Proposed City of Grand Junction Complete Streets Policy Exhibit 10 1 City of Grand Junction Complete Streets Policy Vision: The Complete Streets Vision is to develop a safe, efficient, and reliable travel
COUNCIL POLICY NAME: COUNCIL REFERENCE: 06/119 06/377 09/1C 10llC 12/1C INDEX REFERENCE: POLICY BACKGROUND
 COUNCIL POLICY NAME: COUNCIL ADVISORY COMMITTEES - TERMS OF REFERENCE ISSUED: APRIL 3, 2006 AMENDED: NOVEMBER 27, 2006 NOVEMBER 23, 2009 JANUARY 11, 2010 DECEMBER 17, 2012 POLICY COUNCIL REFERENCE: 06/119
Sixth Line Development - Transit Facilities Plan
 Memorandum Date: November 13, 2012 To: From: c.c. Subject: Rob Freeman (Freeman Planning) Kevin Phillips Sixth Line Development - Transit Facilities Plan 33016631 This memo was prepared to review the transit
CITY OF SAINT JOHN TRAFFIC CALMING POLICY
 CITY OF SAINT JOHN TRAFFIC CALMING POLICY VERSION: 1.0 April 10, 2012 Pedestrians, Cyclists and Motorists Sharing Street Spaces CONTENTS INTRODUCTION... 3 POLICY GOAL... 3 POLICY OBJECTIVES... 3 GUIDING
City of Novi Non-Motorized Master Plan 2011 Executive Summary
 City of Novi Non-Motorized Master Plan 2011 Executive Summary Prepared by: February 28, 2011 Why Plan? Encouraging healthy, active lifestyles through pathway and sidewalk connectivity has been a focus
York Region Population and Employment Growth
 March 1, 2016 1 York Region Population and Employment Growth York Region needs to comply with The Provincial Growth Plan and new forecasts introduced to 2036 and 2041 2 Regional Official Plan Review York
Shifting Gears for a Healthier City
 Shifting Gears for a Healthier City Mississauga s Cycling Master Plan is an ambitious strategy that sets out to transform Mississauga into a city that is conducive to cycling for daily transportation needs.
Tonight is an opportunity to learn about the Study and ask questions of the Study Team members.
 Exhibit 1 Welcome Second Open House Tonight is an opportunity to learn about the Study and ask questions of the Study Team members. A first Public Open House was held on September 18th, 2013 which presented
AMATS Complete Streets Policy
 AMATS Complete Streets Policy Table of Contents: Section 1. Definition of Complete Streets Section 2. Principles of Complete Streets Section 3. Complete Streets Policy Section 4. Consistency Section 5.
Public Consultation Centre
 Region of Waterloo Transportation Master Plan Update Public Consultation Centre See the Information Package on how to contact the Project Team and complete the Comment Sheet www.regionofwaterloo.ca/en/exploring-the-region/transportation-master-plan.aspx
North Coast Corridor:
 North Coast Corridor: Connecting People, Transportation & Environment Legislative Hearing: 11.8.10 1 North Coast Corridor Region s Lifeline A Regional Strategy Mobility, Economy & Environment North Coast
WELCOME! To the Centennial Neighbourhoods Secondary Plan and Transportation Management Plan Information Centre. City of Hamilton
 WELCOME! To the Centennial Neighbourhoods Secondary Plan and Transportation Management Plan Information Centre City of Hamilton Public Information Centre #2 Dec 1, 2015 CENTENNIAL NEIGHBOURHOODS SECONDARY
EXECUTIVE SUMMARY: TRANSIT-ORIENTED DEVELOPMENT IN SMITHS FALLS, ONTARIO; A COMPARISON BETWEEN TWO SITES
 EECUTIVE SUMMARY: TRANSIT-ORIENTED DEVELOPMENT IN SMITHS FALLS, ONTARIO; A COMPARISON BETWEEN TWO SITES Topic and Purpose In 2007, the Mayor of Ottawa s Task Force on Transportation suggested adding a
Welcome to the Open House
 Leslie Street Between 19 th Avenue and Stouffville Road Addendum to Class Environmental Assessment Study Welcome to the Open House Please sign in at the front desk. March 28, 2017 Richmond Green Sports
2. Context. Existing framework. The context. The challenge. Transport Strategy
 Transport Strategy Providing quality connections Contents 1. Introduction 2. Context 3. Long-term direction 4. Three-year priorities 5. Strategy tree Wellington City Council July 2006 1. Introduction Wellington
CPC Parking Lot Riverside Drive. Transportation Rationale
 CPC Parking Lot Transportation Rationale Prepared By: NOVATECH Suite 200, 240 Michael Cowpland Drive Ottawa, Ontario K2M 1P6 September 2015 Novatech File: 114093 Ref: R-2015-153 Table of Contents 1.0 INTRODUCTION...
PEDESTRIAN ACTION PLAN
 ATTACHMENT 2 CITY OF SANTA MONICA PEDESTRIAN ACTION PLAN CITY OF SANTA MONICA PEDESTRIAN ACTION PLAN This page intentionally left blank EXECUTIVE SUMMARY CHAPTER 1 EXECUTIVE SUMMARY Setting the Stage
Bicycle Master Plan Goals, Strategies, and Policies
 Bicycle Master Plan Goals, Strategies, and Policies Mobilizing 5 This chapter outlines the overarching goals, action statements, and action items Long Beach will take in order to achieve its vision of
County of Simcoe Transportation Master Plan
 FINAL REPORT County of Simcoe July 2008 PREPARED FOR: County of Simcoe County Administration Centre 1110 Highway #26 Midhurst, ON L0L 1X0 PREPARED BY: Earth Tech Canada Inc. 105 Commerce Valley Drive West
2018 Integrated Transportation Plan Update
 2018 Integrated Transportation Plan Update FINAL REPORT June 27, 2018 Prepared for: Town of Canmore Prepared by: Stantec Consulting Ltd. Mobycon Corp. Table of Contents EXECUTIVE SUMMARY... i A. Introduction
CITY OF VAUGHAN EXTRACT FROM COUNCIL MEETING MINUTES OF OCTOBER 30, 2012
 CITY OF VAUGHAN EXTRACT FROM COUNCIL MEETING MINUTES OF OCTOBER 30, 2012 Item 31, Report No. 39, of the Committee of the Whole, which was adopted without amendment by the Council of the City of Vaughan
Welcome. If you have any questions or comments on the project, please contact:
 Welcome This drop-in public open house is intended to provide information about the Bay Street bike lanes project. This project proposes a dedicated cycling facility along Bay Street between Aberdeen Avenue
RESOLUTION NO ?? A RESOLUTION OF THE CITY OF NEPTUNE BEACH ADOPTING A COMPLETE STREETS POLICY
 RESOLUTION NO. 2018-?? A RESOLUTION OF THE CITY OF NEPTUNE BEACH ADOPTING A COMPLETE STREETS POLICY WHEREAS, safe, convenient, and accessible transportation for all users is a priority of the City of Neptune
Chapter 5 Future Transportation
 Chapter 5 Future Transportation The Future Land Use Plan identifies the desired land use designations. The land uses desired for Crozet depend, in large part, on the success of the transportation system,
Active Transportation Infrastructure Investment A Business Case
 Active Transportation Infrastructure Investment A Business Case In 2016, the Real Estate Foundation awarded the Capital Regional District a $50,000 grant for Shifting Gears: Land Use Change through Active
TRAFFIC IMPACT STUDY CRITERIA
 Chapter 6 - TRAFFIC IMPACT STUDY CRITERIA 6.1 GENERAL PROVISIONS 6.1.1. Purpose: The purpose of this document is to outline a standard format for preparing a traffic impact study in the City of Steamboat
South Albion-Bolton Community Plan North Hill Supermarket Transportation Study Part B: Evaluation of Alternatives
 Community Plan North Hill Supermarket Transportation Study Part B: Evaluation of Alternatives Prepared for: The Town of Caledon August 9 Transportation Solutions Ltd. 43 Forest Road Cambridge, ON N1S 3B4
Develop a Multi-Modal Transportation Strategy (Theme 6)
") DEVELOP A MULTI-MODAL TRANSPORTATION STRATEGY (THEME 6) WHY IS THIS THEME ADDRESSED? Develop a Multi-Modal Transportation Strategy (Theme 6) Statement of Ideal Reduce resident and visitor reliance on single
DEVELOP A MULTI-MODAL TRANSPORTATION STRATEGY (THEME 6) WHY IS THIS THEME ADDRESSED? Develop a Multi-Modal Transportation Strategy (Theme 6) Statement of Ideal Reduce resident and visitor reliance on single
BIKE PLAN CONTENTS GATEWAY
 CONTENTS Acknowledgments...vii Great Rivers Greenway District Board of Directors... vii Great Rivers Greenway District Staff... vii Project Consultants... vii Committees... viii Citizens Advisory Committee
Ajax: The Road to Complete Streets
 Ajax: The Road to Complete Streets Hubert Ng, Senior Transportation Planner Elysia Leung, Transportation Demand Management Coordinator Complete Streets Forum October 1, 2015 Overview 1 2 Introduction to
Chapter 2. Bellingham Bicycle Master Plan Chapter 2: Policies and Actions
 Chapter 2 Bellingham Bicycle Master Plan Chapter 2: Policies and Actions Chapter 2: Policies and Actions The Bicycle Master Plan provides a road map for making bicycling in Bellingham a viable transportation
City of Homewood Transportation Plan
 City of Homewood Transportation Plan Prepared for: City of Homewood, Alabama Prepared by: Skipper Consulting, Inc. May 2007 TABLE OF CONTENTS INTRODUCTION... 1 BACKGROUND INFORMATION... 1 EXISTING TRANSPORTATION
Discussion Paper 1 June 2014 Current State of Transportation in Burlington
 Discussion Paper 1 June 2014 Current State of Transportation in Burlington www.burlington.ca/goyourway Discussion Paper 1: Current State of Transportation in Burlington The City of Burlington is developing
APPENDIX B. TDM Existing Conditions
 APPENDIX B TDM Existing Conditions SCARBOROUGH CENTRE TMP TRANSPORTATION DEMAND MANAGEMENT INTRODUCTION Scarborough Centre has grown into a mixed-use hub for population, transportation, and employment
NM-POLICY 1: Improve service levels, participation, and options for non-motorized transportation modes throughout the County.
 Transportation PRINCE WILLIAM COUNTY 2008 COMPREHENSIVE PLAN NON-MOTORIZED PLAN CONTENTS Goals, Policies, and Action Strategies Table 4 (Bike Facility Classifications and Descriptions) Table 5 (Bike Facility
South King County High-Capacity Transit Corridor Study
 HIGH-CAPACITY TRANSIT CORRIDOR STUDY South King County Corridor South King County High-Capacity Transit Corridor Study Corridor Report August 2014 South King County High Capacity Transit Corridor Report
Proposed Bridge Street East Bicycle Lanes Public Open House Thursday, April 27, 2017
 WELCOME Proposed Bridge Street East Bicycle Lanes Public Open House Thursday, April 27, 2017 Purpose of the Open House The purpose of this Open House is to gain public input on the bicycle lanes proposed
TOWARDS A BIKE-FRIENDLY CANADA A National Cycling Strategy Overview
 TOWARDS A BIKE-FRIENDLY CANADA A National Cycling Strategy Overview NationalCyclingStrategFrameworkv3.indd 1 Potential for this modal shift can be found in municipalities of all sizes, in every population
January Project No
 January 13 2015 Project No. 5070.05 Neil Connelly, Director University of Victoria, Campus Planning and Sustainability PO Box 1700 STN CSC Victoria, BC V8P 5C2 Dear Neil: Re: UVic 2014 Traffic Final Report
Hamilton Transportation Master Plan Public Consultation. Public Information Centre One Summary
 Hamilton Transportation Master Plan Public Consultation Public Information Centre One Summary Table of Contents Introduction 1 Purpose 2 What Was Presented 2 Who Came to the Meeting 2 The Breakout Sessions
Clackamas County Comprehensive Plan
 ROADWAYS The County s road system permits the movement of goods and people between communities and regions, using any of a variety of modes of travel. Roads provide access to virtually all property. They
SANTA CLARA COUNTYWIDE BICYCLE PLAN August 2008
 SANTA CLARA COUNTYWIDE BICYCLE PLAN August 2008 To assist VTA and Member Agencies in the planning, development and programming of bicycle improvements in Santa Clara County. Vision Statement To establish,
Public Works and Infrastructure Committee. General Manager, Transportation Services. P:\2016\Cluster B\TRA\TIM\pw16009tim.docx
 Ten Year Cycling Network Plan Date: May 3, 2016 STAFF REPORT ACTION REQUIRED PW13.11 To: From: Wards: Reference Number: Public Works and Infrastructure Committee General Manager, Transportation Services
Preliminary Transportation Analysis
 Preliminary Transportation Analysis Goals of a Robust, Multimodal Transportation Network Safe Accessible/Connected Efficient Comfortable Context-Sensitive Motor Vehicle: Continue to analyze the data to
NOTES FROM JUNIOR COUNCIL ORIENTATION SESSION HELD ON MONDAY, JANUARY 22, 2018, AT 3:30 PM IN COUNCIL CHAMBERS, CITY HALL
 CITY OF KAMLOOPS Junior Council Meeting Agenda March 12, 2018, at 3:30 pm in Council Chambers, 7 Victoria Street West, Kamloops, BC Page 1. APPROVAL OF THE AGENDA 2. MINUTES Attachment Recommendation:
CITY OF HAMILTON PLANNING AND ECONOMIC DEVELOPMENT DEPARTMENT Transportation Planning and Parking Division
 CITY OF HAMILTON PLANNING AND ECONOMIC DEVELOPMENT DEPARTMENT Transportation Planning and Parking Division TO: Chair and Members Public Works Committee COMMITTEE DATE: June 18, 2018 SUBJECT/REPORT NO:
Rochester Area Bike Sharing Program Study
 roc bike share Rochester Area Bike Sharing Program Study Executive Summary ~ January 2015 JANUARY 2015 8484 Georgia Avenue, Suite 800 Silver Spring, MD 20910 3495 Winton Pl., Bldg E, Suite 110 Rochester,
Highway 49, Highway 351 and Highway 91 Improvements Feasibility Study Craighead County
 Highway 49, Highway 351 and Highway 91 Improvements Feasibility Study Craighead County Executive Summary March 2015 Highway 49, Highway 351 and Highway 91 Improvements Feasibility Study Craighead County
4 DISRUPTION MANAGEMENT PLAN HIGHWAY 7 RAPIDWAY CONSTRUCTION BETWEEN BAYVIEW AVENUE AND WARDEN AVENUE TOWNS OF MARKHAM AND RICHMOND HILL
 4 DISRUPTION MANAGEMENT PLAN HIGHWAY 7 RAPIDWAY CONSTRUCTION BETWEEN BAYVIEW AVENUE AND WARDEN AVENUE TOWNS OF MARKHAM AND RICHMOND HILL The Transportation Services Committee recommends the adoption of
A CHANGING CITY. of Edmonton, it is essential that it reflects the long-term vision of the City.
 A CHANGING CITY By the year 2040, Edmonton will be home to more than 1 million people. To accommodate growth and support a healthy and compact city, we need a new approach to development/redevelopment
Circulation in Elk Grove includes: Motor vehicles, including cars and trucks
 Circulation, as it is used in this General Plan, refers to the many ways people and goods move from place to place in Elk Grove and the region. Circulation in Elk Grove includes: Motor vehicles, including
City of Elizabeth City Neighborhood Traffic Calming Policy and Guidelines
 City of Elizabeth City Neighborhood Traffic Calming Policy and Guidelines I. Purpose: The City of Elizabeth City is committed to ensure the overall safety and livability of residential neighborhoods. One
Transportation Master Plan Update Final Report
 Transportation Master Plan Update The Corporation of the Town of Innisfil May 2018 100 York Boulevard, Suite 300 Richmond Hill, ON L4B 1J8 289.695.4600 We practice increased use of sustainable materials
Kelowna On the Move. Pedestrian and Bicycle Master Plan
 Kelowna On the Move Pedestrian and Bicycle Master Plan Executive Summary April 2016 Purpose of the Plan The Pedestrian and Bicycle Master Plan identifies infrastructure, planning, and policy requirements
CITY OF WEST KELOWNA COUNCIL POLICY MANUAL
 CITY OF WEST KELOWNA COUNCIL POLICY MANUAL Page 1 of 7 DEPARTMENT: Engineering Services SUBJECT: Traffic Calming Policy (Revised June 6, 2017) Policy Statement: The provision of traffic calming measures
METHODOLOGY. Signalized Intersection Average Control Delay (sec/veh)
") Chapter 5 Traffic Analysis 5.1 SUMMARY US /West 6 th Street assumes a unique role in the Lawrence Douglas County transportation system. This principal arterial street currently conveys commuter traffic
Chapter 5 Traffic Analysis 5.1 SUMMARY US /West 6 th Street assumes a unique role in the Lawrence Douglas County transportation system. This principal arterial street currently conveys commuter traffic
Non-Motorized Transportation 7-1
 Non-Motorized Transportation 7-1 Transportation facilities no longer mean just accommodating a vehicle powered by a combustion engine. Pedestrian and non-motorized facilities are important modes of travel
WALKNBIKE DRAFT PLAN NASHVILLE, TENNESSEE EXECUTIVE SUMMARY NASHVILLE, TENNESSEE
 NASHVILLE, TENNESSEE EXECUTIVE SUMMARY Executive Summary A world-class multi-modal transportation system is essential to a vibrant city and better quality of life. -Mayor Barry The WalknBike plan aims
Kitchener Integrated Transportation Master Plan
 Final Report Kitchener Integrated Transportation Master Plan TRANSPORTATION S ROLE IN A COMPLETE AND HEALTHY KITCHENER June 2013 Table of Contents Executive Summary: Implementation Measures... 1 1. Travel
Eastern PA Trail Summit October 1, 2018
 Eastern PA Trail Summit October 1, 2018 WHO WE ARE + WHY + WE RE * HERE * * * * * * Session Goals: Discuss how to coordinate planning and design in small, urbanized towns Consider how to develop alternative
Climate Change Action Plan: Transportation Sector Discussion Paper: Cycling
 Climate Change Action Plan: Transportation Sector Discussion Paper: Cycling ontario.ca/climatechange Contents 1. Minister of Transportation s message... 3 2. Introduction... 5 3. Sector Overview and Support
Appendix C 3. Bicycle / Pedestrian Planning
 Appendix C 3. Bicycle / Pedestrian Planning BICYCLE/PEDESTRIAN PLANNING 2005 Master Plan GOAL: Provide for safe and convenient bicycle and pedestrian circulation throughout the City. Develop a city-wide
WELCOME. Purpose of the Open House. Update you on the project. Present a draft recommended plan. Receive your input
 WELCOME Purpose of the Open House The Town of Smiths Falls has initiated the Beckwith Street Redevelopment Plan that includes the preparation of a streetscape functional design for the renewal of Beckwith
Section 9. Implementation
 Section 9. Implementation The transportation system is just one of many aspects that must be carefully planned to maintain and enhance the quality of living in Cecil County. The Cecil County Bicycle Plan
Draft MOBILITY ELEMENET. Community Meeting May 22, 2013
 Draft MOBILITY ELEMENET Community Meeting May 22, 2013 Agenda Presentation Ira Brown New Mobility Paradigm Movement of People Implementation Q&A Ira Brown and Dave Roseman Small Group Discussion at Each
Public Information Centre
 WELCOME Public Information Centre Father Tobin Road Lougheed Middle School - Library Wednesday November 7, 2012 7:00 p.m.to 9:00 p.m. Please sign in Neighbourhood Traffic Calming Guide Background The City
Nomination. Halton Region in Context
 Transportation Association of Canada Sustainable Urban Transportation Award Nomination of: Region of Halton Regional Transportation Master Plan Study March 2005 Nominated by: Nomination The TAC Sustainable
Public Works and Infrastructure Committee. General Manager, Transportation Services
 STAFF REPORT ACTION REQUIRED Extending the Bay Street Bicycle Lanes Date: May 16, 2013 To: From: Public Works and Infrastructure Committee General Manager, Transportation Services Wards: Toronto Centre
Sustainable Transportation Initiatives and Plans in Caledon
 Sustainable Transportation Initiatives and Plans in Caledon Arash Olia, P.Eng., PhD. Coordinator, Transportation Development Finance & Infrastructure Services Town of Caledon Eric Chan, P.Eng., PMP Manager,
ACTIVE TRANSPORTATION/NONMOTORIZED TRANSPORTATION
 ACTIVE TRANSPORTATION/NONMOTORIZED TRANSPORTATION BACKGROUND Active transportation, also known as nonmotorized transportation, is increasingly recognized as an important consideration when planning and
Goal 3: Foster an environment of partnerships and collaboration to connect our communities and regions to one another.
 Non-Motorized Transportation Plan (NMTP) Draft Vision, Goal and,, Tri-County Regional Planning Commission (TCRPC) Purpose The purpose of the Tri-County Regional Planning Commission (TCRPC) Non-Motorized
102 Avenue Corridor Review
 February 26, 2015 102 Avenue Corridor Review Transportation Association of Canada Road Safety Engineering Award Submission for the City of Edmonton Introduction Transportation Association of Canada Road
Executive Summary Route 30 Corridor Master Plan
 Route Corridor Master Plan Project Overview The Route Corridor Master Plan is a coordinated multimodal transportation and land use plan for the entire stretch of Route through East Whiteland Township,
Traffic Impact Study. Westlake Elementary School Westlake, Ohio. TMS Engineers, Inc. June 5, 2017
 TMS Engineers, Inc. Traffic Impact Study Westlake Elementary School Westlake, Ohio June 5, 2017 Prepared for: Westlake City Schools - Board of Education 27200 Hilliard Boulevard Westlake, OH 44145 TRAFFIC
APPROVE A RESOLUTION ADOPTING A COMPLETE STREETS POLICY
 STAFF REPORT MEETING DATE: September 13, 2016 TO: FROM: City Council Bob Brown, Community Development Director Russ Thompson, Public Works Director Patrick Filipelli, Management Analyst 922 Machin Avenue