Pedestrian and Bicycle Volume Counts Methods and Technologies for Pedestrian and Bicycle Volume Data Collection.
|
|
|
- Theodore Cannon
- 5 years ago
- Views:
Transcription
1 I will be presenting today, along with Kelly Laustsen, on the topic of Pedestrian and Bicycle Volume Counts. I will first speak to the topic of: why pedestrian and bicycle volume counts. Why pedestrian and bicycle volume data is important. Why we should be thinking about ped and bike volume data collection... and why this should be a part of your data collection plan for your projects and for your transportation management plans. Kelly will speak on the topic of how pedestrian and bicycle volume counts may be performed. Kittelson recently complete National Cooperative Research Program (NCHRP) Project 7-19: Methods and Technologies for Pedestrian and Bicycle Volume Data Collection. 1

2 While Kelly will speak about methods and technologies for data collection, the NCHRP 7-19 statement of need goes more directly toward my topic: Why Ped and Bike volume counts. I would add that the lack of ped and bike data severely limits our ability to understand the effect of the things we do to enhance ped and bike mobility and safety. And therefore it limits our ability understand how our outputs contribute to our primary mission: Making the best use of available resources to provide greater mobility and safety for the people of AZ.
3

4 Ezra Hauer - the father of modern traffic safety analysis The Road Ahead was ASCE 2005 paper of the year. Everyone involved in transportation should take the time to read this paper As well as his 1999 paper: Safety in Geometric Design.

5 From this perspective, I suppose it is fair to say that everyone in this room today will influence the road safety future of AZ. 5
6 Basic construct for objective evaluation of risk in transportation safety established by Ezra Hauer in Add in discussion: Relationship not necessarily linear, in many cases is not. Critical: The objective evaluation of risk is based on the observed measures of safety: such as number of crashes, number of fatalities And observed measures of exposure, such as MV volumes, bicycle volumes or number of pedestrian crossings.

7 I think it is fair to say that there is no one best measure of safety or exposure. The measures used depends on the question you are trying to answer. If you are trying to assess the safety of a particular section of roadway, then one should look at crashes and vehicle miles of travel. If you are trying to assess the effect of a particular change in the seat belt law, it may be best to look at the number of victims and passenger miles of travel.
8 8

9 This graph shows the change in the number of fatalities in AZ from ( in pink). It also shows the change in VMT 9 (in blue). There could be a great deal of discussion of the trends in fatalities and MVT over the past 25 plus years. What is notable is the general increase in both from about , at about the same slope. The trend really changed in This graph was presented to Director Halikowski in It did not include the 2011 data at that time. He had one basic question: Why? Why the drop in fatalities? Of course this was exactly the question that should be asked. Why? Is it something we are doing or is the drop due to other factors? The fact is, I have spent a good amount of time trying to answer this question. Some of what I have found I will present today, as I believe it is directly related to the issue of ped and bicycle volumes. But as you will see, I have more questions than answers at this point in time. Using 2007 as the base year: MV fatalities dropped by 29% from 2007 to
10 Traffic volume decreased by only 5% over this period. Why? And What happened in 2011? 9

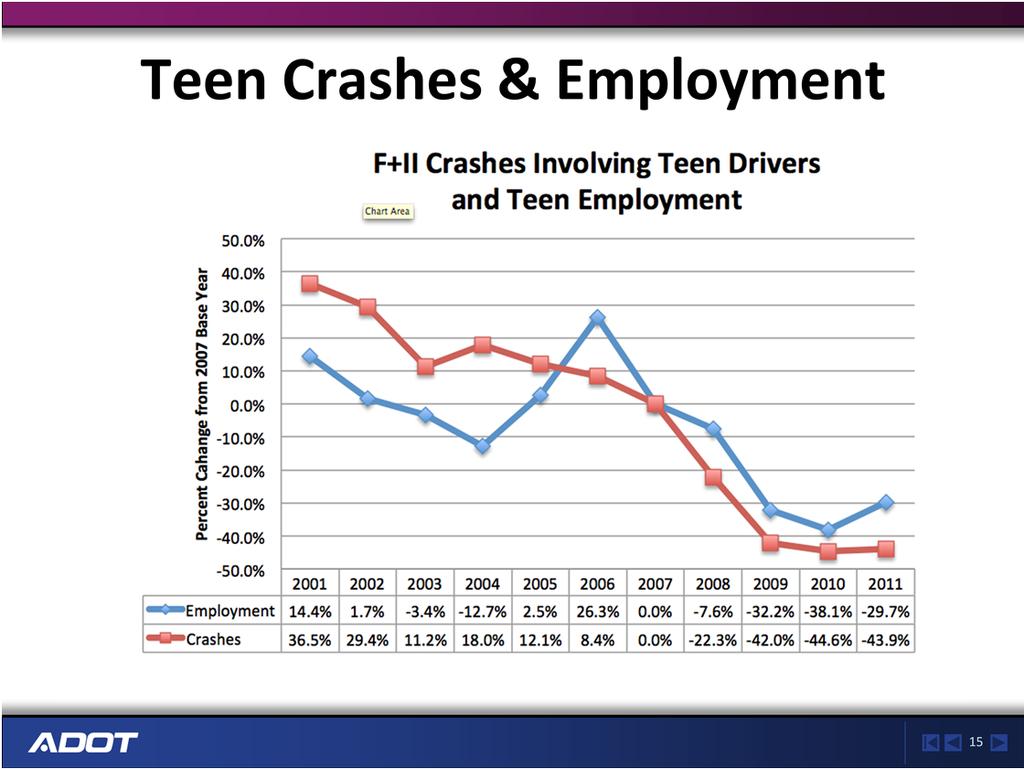
11 In order to answer the Director s question: A series of graphs were generated to examine trends based on a percent change from the base year of 2007, the base year for the 2007 SHSP. Percent change was used to normalize the data to the same scale. We looked at the various emphasis areas in our 2007 SHSP and found that young drivers was showing the largest drop. Blue line: total fatalities plotted as a percent change from base year, = 1301 Peak 2007 base year = low = 759 (29% drop from base year) Red line: young driver involved fatalities again plotted as a percent change from 2007 base year. This method of plotting based on percent change allows for direct comparison of total a various emphasis areas peak = base = low = 160 fatalities 10
12 55% drop over this three year period. This compares to 42% decrease for speed related, second best performing emphasis area to is more than 100% of the increase in total fatalities (+66) over this period. 10

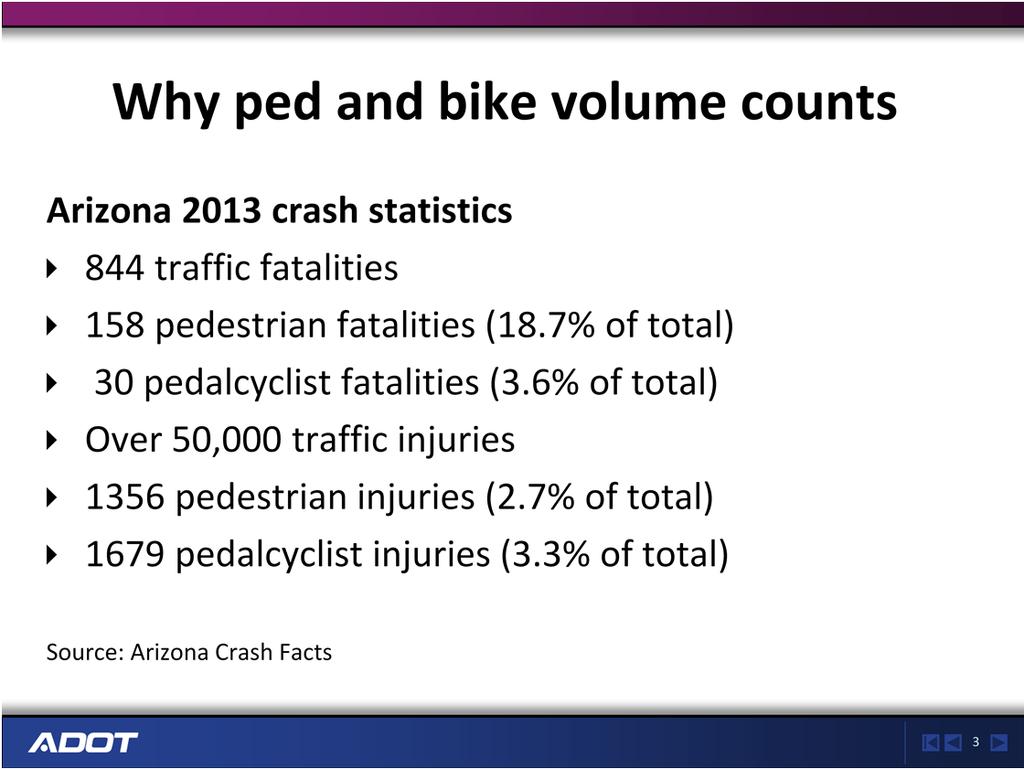
13 Ped Peak: 172 in 2006 Low: 122 in 2009 but close to same values in 2003 (126) and 2008 (125) In 2013 we are almost exactly where we were in 2007 This data indicates very little change in ped fatalities from 2001 to The variation is up and down, basically random change. 11
14 The trend is generally speaking flat. 11
15 12
16 13
17 14
18 15
19 16

20 Valley Metro has an excellent research and data on their website. It should be noted, this increase of 20 million transit related walking trips is not a piece of data you will find in the Valley Metro data. It is a value that I calculated using Valley Metro data on the increase in number of transit trips and mode of travel to and from transit. 17

21 New Zealand is using VMT and household travel survey data to estimate VMT by age and gender. Males Based on VKT = = /25 = approximate 9 Based on licensed drivers = = /200 = 3.3

22 It the same type of relative risk values hold for AZ it could explain why a relatively small change in VMT could result in such a large change in the number of fatalities. 19

23 This information leads me to ask many questions.
Speed Management Action Plan
 Speed Management Action Plan National Selection Criteria Criteria Description Fatalities The number of fatalities resulting from speeding-related crashes. Percentage Compares total fatalities in each State
Vision Zero Task Force February 28, Collision Landscape Analysis
 Vision Zero Task Force February 28, 2017 Collision Landscape Analysis Welcome! What happened since our last Task Force meeting: City Council adopted the Vision Zero Resolution Applied for an OTS grant
SAFETY PERFORMANCE MEASURES AND TARGET SETTING. Transportation Subcommittee September 15, 2017
 SAFETY PERFORMANCE MEASURES AND TARGET SETTING Transportation Subcommittee September 15, 2017 ACTION REQUESTED No action is requested. This item is for presentation and discussion. PREVIOUS ACTION Presented
PRELIMINARY DRAFT FIRST AMENDMENT TO VISION 2050: A REGIONAL LAND USE AND TRANSPORTATION PLAN FOR SOUTHEASTERN WISCONSIN
 PRELIMINARY DRAFT FIRST AMENDMENT TO VISION 2050: A REGIONAL LAND USE AND TRANSPORTATION PLAN FOR SOUTHEASTERN WISCONSIN ESTABLISHING TARGETS FOR FEDERAL PERFORMANCE MEASURES: HIGHWAY SAFETY SOUTHEASTERN
Bicycle Crashes. Number of Bike Crashes. Total Bike Crashes. are down 21% and severe bike crashes down 8% since 2013 (5 years).
.") Bicycle Crashes The City of Fort Collins is well known for its bike culture, and there is a strong focus on encouraging increased riding. Bike safety is an important component of supporting these efforts.
Bicycle Crashes The City of Fort Collins is well known for its bike culture, and there is a strong focus on encouraging increased riding. Bike safety is an important component of supporting these efforts.
FLORIDA STRATEGIC HIGHWAY SAFETY PLAN
 FLORIDA STRATEGIC HIGHWAY SAFETY PLAN 1 FLORIDA STRATEGIC HIGHWAY SAFETY PLAN Presenter: Joe Santos State Safety Engineer FDOT State Safety Office 2 Presentation 3/28/2017 3 FLORIDA STRATEGIC HIGHWAY SAFETY
Draft Report: Traffic Crashes in the Denver Region
 Click to edit Master title style Click to edit Master title style Draft Report: Traffic Crashes in the Denver Region Presented by: Steve Cook Board Nov. 16, 2016 Click Report Click to to edit on edit Master
APPENDIX C. Systems Performance Report C-1
 APPENDIX C Systems Performance Report C-1 System Performance Report & Requirements According to the FAST Act, a long range transportation plan needs to include a system performance report and subsequent
Appendix A: Before-and-After Crash Analysis of a Section of Apalachee Parkway
 Appendix A: Before-and-After Crash Analysis of a Section of Apalachee Parkway 3 Safety Impacts of Median Conversion: A Case Study on Apalachee Parkway 1. Introduction (Prepared by FIU, 11/10/2011) The
Appendix E: Bike Crash Analysis ( )
") Appendix E: Bike Crash Analysis (2009-2012) Davis Bicycle Crashes Analysis 2009-2012 December 2013 Ride Walk Davis Active Transportation Program City of Davis December 2013 Prepared by: Jimmy Fong Active
Appendix E: Bike Crash Analysis (2009-2012) Davis Bicycle Crashes Analysis 2009-2012 December 2013 Ride Walk Davis Active Transportation Program City of Davis December 2013 Prepared by: Jimmy Fong Active
the Ministry of Transport is attributed as the source of the material
 Cyclists 2015 Disclaimer All reasonable endeavours are made to ensure the accuracy of the information in this report. However, the information is provided without warranties of any kind including accuracy,
MTCF. Michigan Traffic Crash Facts FACT SHEETS
 FACT SHEETS This page left intentionally blank GENERAL FACTS The driver, the roadway, and the motor vehicle contribute in some measure to every crash. A preponderance of evidence, however, points to driver
Risk on the Road. Pedestrians, Cyclists and Motorcyclists August 2015
 Risk on the Road Pedestrians, Cyclists and Motorcyclists August 215 Contents Key Facts... 4 Pedestrians... 5 Pedestrian risk by time of day and age... 8 Cyclists... 11 Motorcyclists... 14 Glossary... 17
Intermodal Connections with Light Rail in Phoenix, AZ Wulf Grote, P.E. Director, Planning & Development
 Intermodal Connections with Light Rail in Phoenix, AZ Wulf Grote, P.E. Director, Planning & Development 12th National LRT Conference Salt Lake City, UT November 12, 2012 Outline METRO Light Rail Overview
Transportation Safety Planning at DVRPC
 Transportation Safety Planning at DVRPC New York Safety Planning Peer Exchange June 15, 2010 Zoe Neaderland, AICP Manager, Office of Transportation Safety & Congestion Management DVRPC Overview Federally-Designated
PASSENGER SURVEY RESULTS
 ROGUE VALLEY TRANSPORTATION DISTRICT PASSENGER SURVEY RESULTS Date: December 12, 2018 Project #: 21289 To: Paige West, RVTD From: Susan Wright, PE; Molly McCormick; (Kittelson & Associates, Inc.) Subject:
The Traffic Monitoring Guide: Counting Bicyclists and Pedestrians. APBP 2017 June 28: 11:15am-12:45pm
 The Traffic Monitoring Guide: Counting Bicyclists and Pedestrians APBP 2017 June 28: 11:15am-12:45pm 2 Presentation Organization Why count bicyclists and pedestrians? Why report count data? What resources
People killed and injured per million hours spent travelling, Motorcyclist Cyclist Driver Car / van passenger
 Cyclists CRASH FACTSHEET 27 CRASH STATISTICS FOR THE YEAR ENDED 31 DEC 26 Prepared by Strategy and Sustainability, Ministry of Transport Cyclists have a number of risk factors that do not affect car drivers.
MTCF. Michigan Traffic Crash Facts FACT SHEETS
 FACT SHEETS This page left intentionally blank GENERAL FACTS The driver, the roadway, and the motor vehicle contribute in some measure to every crash. A preponderance of evidence, however, points to driver
What is the problem? Transportation Safety Planning Purdue Road School. 42,636 Fatalities. Nearly 3M Injuries. Over 4M PDO crashes
 Transportation Safety Planning Purdue Road School March 29, 2006 What is the problem? 42,636 Fatalities Nearly 3M Injuries Over 4M PDO crashes $230B Cost to the Nation Trends in Motor Vehicle Fatality
Deaths/injuries in motor vehicle crashes per million hours spent travelling, July 2007 June 2011 (All ages) Mode of travel
 Mode of travel") Cyclists CRASH STATISTICS FOR THE YEAR ENDED 31 DECEMBER 211 Prepared by the Ministry of Transport CRASH FACTSHEET 212 Cyclists have a number of risk factors that do not affect car drivers. The main risk
Cyclists CRASH STATISTICS FOR THE YEAR ENDED 31 DECEMBER 211 Prepared by the Ministry of Transport CRASH FACTSHEET 212 Cyclists have a number of risk factors that do not affect car drivers. The main risk
Characteristics of Fatal Pedestrian Crashes on Freeways. Kay Fitzpatrick Texas A&M Transportation Institute
 Characteristics of Fatal Pedestrian Crashes on Freeways Kay Fitzpatrick Texas A&M Transportation Institute Transportation Short Course Design Session October 15, 2013 Project Background (0-6702) Motivation:
Ongoing Challenges with Pedestrian Safety Data May 15: 10:15AM-11:45AM. PedsCount! 2014 May 14-16, 2014 Sacramento, CA
 Ongoing Challenges with Pedestrian Safety Data May 15: 10:15AM-11:45AM PedsCount! 2014 May 14-16, 2014 Sacramento, CA David Ragland, Director, Safe Transportation Research & Education Center (SafeTREC),
SUSTAINABILITY, TRANSPORT, & HEALTH. Ralph Buehler, Virginia Tech
 SUSTAINABILITY, TRANSPORT, & HEALTH Ralph Buehler, Virginia Tech Prepared for National Academies Roundtable on Science and Technology for Sustainability 6 December 2013 Overview Trends in Motorization
We believe the following comments and suggestions can help the department meet those goals.
 The Honorable Secretary Anthony Foxx The Secretary of Transportation United States Department of Transportation 1200 New Jersey Avenue, SE Washington, DC 20590 August 30, 2013 Dear Secretary Foxx, Thank
Findings and Lessons from Safe Routes to Transit (SR2T) David Weinzimmer, SafeTREC, UC Berkeley PedsCount!, May 2014
 David Weinzimmer, SafeTREC, UC Berkeley PedsCount!, May 2014") Findings and Lessons from Safe Routes to Transit (SR2T) David Weinzimmer, SafeTREC, UC Berkeley PedsCount!, May 2014 Safe Routes to Transit (SR2T) Funded by Regional Measure 2 (2004), $20M in total funding
Findings and Lessons from Safe Routes to Transit (SR2T) David Weinzimmer, SafeTREC, UC Berkeley PedsCount!, May 2014 Safe Routes to Transit (SR2T) Funded by Regional Measure 2 (2004), $20M in total funding
Transportation Trends, Conditions and Issues. Regional Transportation Plan 2030
 Transportation Trends, Conditions and Issues Regional Transportation Plan 2030 23 Regional Transportation Plan 2030 24 Travel Characteristics Why Do People Travel? Over one-half of trips taken in Dane
Cyclist Safety in Australia
 Cyclist Safety in Australia From BITRE Trauma Statistical Summary, August 218 http://www.bitre.gov.au/publications/ongoing/road_deaths_australia_annual_summaries.aspx Trends in cyclist trauma numbers These
National Performance Management Measures. April 20, 2016 Webinar
 Safety Performance Measures September 26, 2016 National Performance Management Measures April 20, 2016 Webinar Highway Safety Improvement Program Performance Measures 1 2 3 4 5 Number of fatalities Rate
Toward Zero Deaths. Regional SHSP Road Show Meeting. Virginia Strategic Highway Safety Plan. presented by
 Toward Zero Deaths Regional SHSP Road Show Meeting presented by Virginia Strategic Highway Safety Plan December 1, 2016 1 Welcome & Introductions Purpose of the Meeting Objectives & Key Outcomes Agenda»
The Who and What: Bus Rapid Transit Riders and Systems in the U.S.
 The Who and What: Bus Rapid Transit Riders and Systems in the U.S. Cheryl Thole December 12, 2013 Webinar Center for Urban Transportation Research University of South Florida Pre presentation How familiar
How familiar are you with BRT?
 The Who and What: Bus Rapid Transit Riders and Systems in the U.S. Cheryl Thole December 12, 2013 Webinar Center for Urban Transportation Research University of South Florida Pre presentation How familiar
Briefing Paper #1. An Overview of Regional Demand and Mode Share
 2011 Metro Vancouver Regional Trip Diary Survey Briefing Paper #1 An Overview of Regional Demand and Mode Share Introduction The 2011 Metro Vancouver Regional Trip Diary Survey is the latest survey conducted
Complete Streets Accessible Networks for an Age-Friendly World
 Complete Streets Accessible Networks for an Age-Friendly World Jana Lynott, AICP Senior Strategic Policy Advisor AARP Public Policy Institute @JanaLynott What are Complete Streets? AARP Bulletin Complete
Double Pair Comparisons PART III AGE & GENDER. Age and Crash Risk. Subject & control groups Relative risk or rate. Relative Accident Involvement Ratio
 Double Pair Comparisons PART III AGE & GENDER Subject & control groups Relative risk or rate Ratio of subject to control Relative Accident Involvement Ratio Age and Crash Risk RAIR = % at-fault % not at-fault
Maine Highway Safety Facts 2016
 Maine Highway Safety Facts 216 216 MAINE HIGHWAY SAFETY FACTS The Bureau of Highway Safety and the Maine Department of Transportation are pleased to present the 216 edition of Maine Highway Safety Facts.
Update on Regional Bicycle, Pedestrian, & Trail Planning. Presented to TCC November 21, 2014
 Update on Regional Bicycle, Pedestrian, & Trail Planning Presented to TCC November 21, 2014 Survey Measure Assess Focus Area Performance- Driven Process Policy Policy Implement Plan Criteria Criteria Criteria
Safety & Convenience for All Users, in All Modes. Barbara McCann NCSL December 3, 2013
 Safety & Convenience for All Users, in All Modes Barbara McCann NCSL December 3, 2013 Safety & Convenience for All Users? Who was left out when this road was planned? Takaaki Iwabu for Raleigh News Observer
CHAPTER 2 LITERATURE REVIEW
 CHAPTER 2 LITERATURE REVIEW 2.1 Introduction This chapter presents some background information of the available literature related to the development of accident rates, accident models and accident statistic
Walking in New Zealand May 2013
 May 2013 Walking makes up 13 percent of total time travelled and 16 percent of the number of trip legs. On average women spend more time walking than men, walking 57 minutes per person per week, compared
ROAD SAFETY IN RUSSIA
 ROAD SAFETY IN RUSSIA United Nations Road Safety Collaboration First Deputy Minister of Internal Affairs of the Russian Federation A.V. Gorovoy New York, 12 April 2018 Russia supports the global road safety
Motor Vehicle Related Fatalities 10-year Statistics for British Columbia Research and Data Unit Policy and Strategic Initiatives Branch
 Motor Vehicle Related Fatalities 1-year Statistics for British Columbia 27-216 Research and Data Unit Website: www.gov.bc.ca/roadsafetybc Twitter: http://twitter.com/ Contents Contents... 2 Introduction
Multimodal Transportation Plan
 Multimodal Transportation Plan The Multimodal Transportation Plan will accommodate MILLENIALS ARE DRIVING LESS. WE CANNOT BUILD OUR WAY all modes of transportation by keeping pedestrians, OUT OF CONGESTION.
Complete Streets 101: The Basics
 Complete Streets 101: The Basics Michigan Municipal League - Capital Conference March 21, 2017 Chip Smith, AICP - Senior Planner - Wade Trim Inc. and City Council member City of Ann Arbor 2017 MML Capital
Part 1 Road Transport
 Part 1 Road Transport Chapter 1 Road Traffic Accident Trends I Outline of Present Situation Title 1 Land Transport 1 Long-Term Transition of Road Traffic Accidents Traffic fatalities are reduced in 1 consecutive
RSTF Measurements and Status
 RSTF Measurements and Status Items in green text are on or ahead of target. Items in red text need attention. Objective & Measures Status November, 2011 Winter, 3/8/12 Build, Maintain, & Leverage Partnerships
HAWK Signal. Pedestrian Safety. Illinois Traffic Engineering & Safety Conference Thursday, October 21, 2010
 HAWK Signal Pedestrian Safety Illinois Traffic Engineering & Safety Conference Thursday, October 21, 2010 Background Information High-intensity Activated crosswalk Developed by the City of Tuscon, AZ First
IMPROVING PEDESTRIAN SAFETY AT UNCONTROLLED CROSSINGS. Guidelines for Marked Crosswalks
 IMPROVING PEDESTRIAN SAFETY AT UNCONTROLLED CROSSINGS Presented by Nazir Lalani P.E. Traffex Engineers Inc. N_lalani@hotmail.com Guidelines for Marked Crosswalks Source: FHWA, Safety Effects of Marked
Click to edit Master title style Click to edit Master title style
 Click to edit Master title style Click to edit Master title style Transportation in the Denver Region Presented by: Jacob Riger, AICP September 28, 2017 Click Today s Click to Topics edit edit Master title
Pedestrian Accidents in Utah
 TRANSPORTATION RESEARCH RECORD 1325 69 Pedestrian Accidents in Utah ERIC YUAN-CHIN CHENG The objectives are to investigate the trend of Utah's pedestrian accident rate and to analyze and discuss some of
Appendix T 1: Additional Supporting Data
 Appendix T 1: Additional Supporting Data Project Delivery Delays with the implementation of the 2000 TIP became apparent early in the decade. In response to direction among policy officials, ARC began
Des Moines Area MPO Safety Performance Targets and Methodology
 Des Moines Area MPO Safety Performance Targets and Methodology February 2019 2 P a g e CONTENTS BACKGROUND... 3 Safety Goals in Mobilizing Tomorrow... 3 STATEWIDE TARGETS... 4 DES MOINES AREA MPO SAFETY
2003 road trauma for. Wairoa District. Road casualties Estimated social cost of crashes* Major road safety issues WAIROA DISTRICT JULY 2004
 WAIROA DISTRICT JULY 24 T he Land Transport Safety Authority (LTSA) has prepared this road safety issues report. It is based on reported crash data and trends for the 1999 23 period. The intent of the
Attachment One. Integration of Performance Measures Into the Bryan/College Station MPO FY 2019 FY 2022 Transportation Improvement Program
 Attachment One Integration of Performance Measures Into the Bryan/College Station MPO FY 2019 FY 2022 Transportation Improvement Program Introduction Begun as part of the Moving Ahead for Progress in the
the Ministry of Transport is attributed as the source of the material
 Disclaimer All reasonable endeavours are made to ensure the accuracy of the information in this report. However, the information is provided without warranties of any kind including accuracy, completeness,
NACTO Designing Cities 2014 Dongho Chang, City Traffic Engineer October 23, 2014
 NACTO Designing Cities 2014 Dongho Chang, City Traffic Engineer October 23, 2014 Presentation overview Perspective on Safety Changing needs of our cities How Seattle is meeting those needs Challenge for
Report on trends in mode share of vehicles and people crossing the Canal Cordon to 2013
 Report on trends in mode share of vehicles and people crossing the Canal Cordon 2006 to 2013 Dublin City Council, National Transport Authority, Civic Offices, Dun Scèine, Wood Quay, Harcourt Lane, Dublin
APPENDIX D. MTO Warrants for Traffic Signal Control and Left-Turn Storage Lanes
 APPENDIX D MTO Warrants for Traffic Signal Control and Left-Turn Storage Lanes APPENDIX E Collision Data Collision Main Detail Summary OnTRAC Reporting System FROM: 2009/01/01 TO: 2012/01/01 BAYSWATER
2012 TOWN OF CASTLE ROCK MOTOR VEHICLE ACCIDENT FACTS PREPARED BY THE PUBLIC WORKS DEPARTMENT
 ATTACHMENT A 2012 TOWN OF CASTLE ROCK MOTOR VEHICLE ACCIDENT FACTS PREPARED BY THE PUBLIC WORKS DEPARTMENT ACKNOWLEDGEMENTS This report was assembled from data provided by the Castle Rock Police Department
Transportation and Health Tool
 Working together to evolve the Transportation and Health Tool APHA Webinar March 22, 2016 Ann Steedly, PE Overview THT Development Context Development of Indicators Strategies, Interventions & Policies
Transportation Day at the Capitol. Charlie Zelle Commissioner, MnDOT Feb. 16, 2017
 Transportation Day at the Capitol Charlie Zelle Commissioner, MnDOT Feb. 16, 2017 State Transportation System Highways 59.1 billion annual vehicle miles traveled 33.1 billion on trunk highways Bridges
Dear Fellow Nebraskans:
 Dear Fellow Nebraskans: In accordance with the provisions in the Safe, Accountable, Flexible, and Efficient Transportation Equity Act A Legacy for Users (SAFETEA LU), each state is required to develop
the Ministry of Transport is attributed as the source of the material
 Pedestrians 216 Disclaimer All reasonable endeavours are made to ensure the accuracy of the information in this report. However, the information is provided without warranties of any kind including accuracy,
Bike Routes Assessment: 95 Ave, 106 St & 40 Ave. Replace with appropriate image in View > Master.
 Bike Routes Assessment: 95 Ave, 106 St & 40 Ave Replace with appropriate image in View > Master. Transportation Committee October 15, 2014 City Council Direction What we are trying to achieve The Way Ahead:
Lane Area Transportation Safety and Security Plan Vulnerable Users Focus Group
 Lane Area Transportation Safety and Security Plan Vulnerable Users Focus Group Agenda 1. Planning Process Review 2. What are Emphasis Areas? 3. Your Role Today 4. Data Review 5. Small group discussion
Memorandum. Purpose: To update the MPO CTAC on the status of the LRTP scenario evaluation process.
 Charlottesville-Albemarle Metropolitan Planning Organization POB 1505, 401 E. Water St, Charlottesville, VA 22902 www.tjpdc.org (434) 979-7310 phone info@tjpdc.org email Memorandum To: MPO CTAC From: Wood
Traffic Safety Barriers to Walking and Bicycling Analysis of CA Add-On Responses to the 2009 NHTS
 Traffic Safety Barriers to Walking and Bicycling Analysis of CA Add-On Responses to the 2009 NHTS NHTS Users Conference June 2011 Robert Schneider, Swati Pande, & John Bigham, University of California
SPEED MANAGEMENT FOR VISION ZERO
 SPEED MANAGEMENT FOR VISION ZERO LUANN HAMILTON, DEPUTY COMMISSIONER FOR PROJECT DEVELOPMENT CHICAGO DEPARTMENT OF TRANSPORTATION NACTO DESIGNING CITIES 2017 Vision Zero Action Plan Speed management and
Improving Walkability Through Control Strategies at Signalized Intersections
 Improving Walkability Through Control Strategies at Signalized Intersections Edward J. Smaglik, Ph.D., P.E. Associate Professor, Northern Arizona University Senior Engineer, Kittelson & Associates 2014
Designing for Pedestrian Safety in Washington, DC
 Designing for Pedestrian Safety in Washington, DC February 25, 2014 George Branyan Pedestrian Program Coordinator District Department of Transportation DC Journey to work mode split: 2012 Means of Transportation
Aging & Mobility: Stranded Without A Choice
 Aging & Mobility: Stranded Without A Choice Linda Bailey, Policy Analyst This report was created in cooperation with AARP. Why This Study? [Taking away someone s license] really takes away a person s independence
Pedestrian and Bicycle Crashes
 Pedestrian and Bicycle Crashes Pedestrian and Bicycles Overview Pedestrian-related crashes represent 3.6% of the total reported traffic crashes; however, they account for 11.1% of all traffic crash deaths.
Kolkata City Fatal Accident Study (April 2016 March 2017)
") Kolkata City Fatal Accident Study (April 2016 March 2017) Submitted to Deputy Commissioner of Police (Traffic), Kolkata City 18 April, 2017 18 April 2017 Kolkata city fatal accident study 1 Overview JPRI
Kolkata City Fatal Accident Study (April 2016 March 2017) Submitted to Deputy Commissioner of Police (Traffic), Kolkata City 18 April, 2017 18 April 2017 Kolkata city fatal accident study 1 Overview JPRI
2014 QUICK FACTS ILLINOIS CRASH INFORMATION. Illinois Emergency Medical Services for Children February 2016 Edition
 2014 QUICK FACTS ILLINOIS CRASH INFORMATION February 2016 Edition Illinois Emergency Medical Services for Children www.luhs.org/emsc Illinois Emergency Medical Services for Children TABLE OF CONTENTS
2012 QUICK FACTS ILLINOIS CRASH INFORMATION. Illinois Emergency Medical Services for Children September 2014 Edition
 2012 QUICK FACTS ILLINOIS CRASH INFORMATION September 2014 Edition Illinois Emergency Medical Services for Children www.luhs.org/emsc Illinois Emergency Medical Services for Children TABLE OF CONTENTS
DRIVING ZERO FATALITIES TO A REALITY ILLINOIS LOCAL SAFETY INITIATIVE
 DRIVING ZERO FATALITIES TO A REALITY ILLINOIS LOCAL SAFETY INITIATIVE Priscilla Tobias, PE State Safety Engineer Illinois Dept of Transportation Illinois Stats 102 Counties 145,000 Roadway Miles 900+ Fatalities
Road design and Safety philosophy, 1 st Draft
 Head Office SWEDEN www.vv.se Textphone: +46 243-750 90 Roger Johansson International Secretariat roger.johansson@vv.se Direct: +46 243 75880 Mobile: +46 70 6327373 Date: 2006-08-17 Reference: Road design
Strategies for Making Multimodal Environments Safer. Kim Kolody Silverman, CH2M
 Strategies for Making Multimodal Environments Safer Kim Kolody Silverman, CH2M Kim.kolody@ch2m.com 800 Fatalities in Illinois: Rural versus Urban Fatalities 700 600 500 400 300 200 100 0 2004 2005 2006
Factors Leading to Older Drivers Intersection Crashes
 Factors Leading to Older Drivers Intersection Crashes APHA Annual Meeting 2007 Washington, DC November 7, 2007 Keli A. Braitman Bevan B. Kirley Neil K. Chaudhary Projections of population and licensure
Goal 3: Foster an environment of partnerships and collaboration to connect our communities and regions to one another.
 Non-Motorized Transportation Plan (NMTP) Draft Vision, Goal and,, Tri-County Regional Planning Commission (TCRPC) Purpose The purpose of the Tri-County Regional Planning Commission (TCRPC) Non-Motorized
Richmond Area MPO Regional Transportation and Land Use Performance Measures 2013
 Richmond Area MPO Regional Transportation and Land Use Performance Measures 2013 Richmond Area October 2013 REGIONAL PERFORMANCE MEASURES FOR RICHMOND AREA MPO Rows that are shaded are categories of regional
REGIONAL SAFETY ADVISORY COMMITTEE North Central Texas Council of Governments Transportation Council Room Friday, October 26, :00 am AGENDA
 REGIONAL SAFETY ADVISORY COMMITTEE North Central Texas Council of Governments Transportation Council Room Friday, October 26, 2018 10:00 am AGENDA 1. Approval of August 24, 2018 Meeting Summary Matt Hotelling,
Alberta. Traffic Collision Statistics. Office of Traffic Safety Transportation Services Division May 2017
 Traffic Collision Statistics Office of Traffic Safety Transportation Services Division May 217 This page was intentionally left blank. 2 Table of Contents Traffic Collisions... 4 Traffic Collision Rates...
Bicycle and Pedestrian Level of Service Evaluation
 Bicycle and Pedestrian Level of Service Evaluation June 214 Florida Department of Transportation Bicycle and Pedestrian Evaluation Prepared by Sprinkle Consulting Cambridge Systematics For the Florida
Napier City road trauma for Napier City. Road casualties Estimated social cost of crashes* Major road safety issues.
 ISSN 1176-841X July 25 Land Transport New Zealand has prepared this road safety issues report. It is based on reported crash data and trends for the 2 24 period. The intent of the report is to highlight
92% COMMUTING IN THE METRO. Congested Roadways Mode Share. Roadway Congestion & Mode Share
 COMMUTING IN THE METRO Roadway Congestion & Mode Share The majority of major roadways in Greater Des Moines are without congestion and have underutilized capacity. This surplus capacity could be used for
Relative safety of alternative intersection designs
 Urban Transport XII: Urban Transport and the Environment in the 21st Century 379 Relative safety of alternative intersection designs L. C. Wadhwa 1 & M. Thomson 2 1 James Cook University Townsville Queensland
Konstantin Glukhenkiy Economic Affairs Officer
 Konstantin Glukhenkiy Economic Affairs Officer Rapid growth of urban areas Very rapid increase in motorisation Substantial increases in traffic congestion Relative decline of public transport usage and
Community Traffic Safety Awards Program 2017 Application
 EASY APPLICATION Community Traffic Safety Awards Program 2017 Application AAA Community Traffic Safety Awards are presented to communities for their efforts to improve local traffic safety for all modes
Department of Transportation
 Department of Transportation I. Internal Scan The number of older drivers in the United States will double over the next 30 years. By 2030 one in five Americans will be age 65 or older. On a licensed-driver
Walking New Zealand Household Travel Survey September 2015
 Walking New Zealand Household Travel Survey 2011-2014 September 2015 Disclaimer: All reasonable endeavours are made to ensure the accuracy of the information in this report. However, the information is
Transportation Planning Division
 Transportation Planning Division Presentation Outline Study Tasks Recap of Previous Meeting Stakeholder Interviews Data Collection Design Principles Tool Box Recommendations Schedule Moving Forward North
A Review of Roundabout Safety Performance in the United States
 A Review of Roundabout Safety Performance in the United States 1.0 Introduction Aimee Flannery, Ph.D. Lily Elefteriadou, Ph.D. Roundabouts are a new form of at-grade intersection design that have been
Performance Criteria for 2035 Long Range Transportation Plan
 Minimizing Impacts on Natural, Historic, Cultural or Archeological Resources 2035 LRTP Weighting Factor: 7% Objective 1.1: Use appropriate planning and design criteria to protect and enhance the built
Incorporating Health in Regional Transportation Planning
 Mayor Karl Dean, Chairman Incorporating Health in Regional Transportation Planning Leslie A. Meehan, AICP Center TRT Intervention Webinar January 29, 2013 Objectives for Today Background About the Nashville
Transportation Knowledge
 FE REVIEW COURSE SPRING 2017 Transportation Engineering 4/26/2017 Transportation Knowledge 8-12 problems Traffic safety Traffic capacity Traffic flow theory Traffic control devices Transportation planning
BUILDING THE CASE FOR TRAVEL OPTIONS IN WASHING TON COUNTY. Image: Steve Morgan. Image: Steve Morgan
 BUILDING THE CASE FOR TRAVEL OPTIONS IN WASHING TON COUNTY Image: Steve Morgan Image: Steve Morgan Image: TriMet Image: TriMet WHAT ARE TRAVEL OPTIONS PROGRAMS? Travel options programs encourage residents,
TRAFFIC CHARACTERISTICS. Unit I
 TRAFFIC CHARACTERISTICS Unit I Traffic stream Characteristics Overview Overview of Traffic Stream Components To begin to understand the functional and operational aspects of traffic on streets and highways
Understanding Transit Demand. E. Beimborn, University of Wisconsin-Milwaukee
 Understanding Transit Demand E. Beimborn, University of Wisconsin-Milwaukee 1 Purpose To provide a basic understanding of transit ridership and some common misunderstandings. To explain concepts of choice
An Assessment of Potential Greenhouse Gas Emissions Reductions from Proposed On Street Bikeways
 An Assessment of Potential Greenhouse Gas Emissions Reductions from Proposed On Street Bikeways Through the Sustainable Bethlehem Initiative, the Town of Bethlehem has identified both the improvement of