2017 LYNX RIDERSHIP YEAR END REVIEW
|
|
|
- Fay Lucas
- 5 years ago
- Views:
Transcription
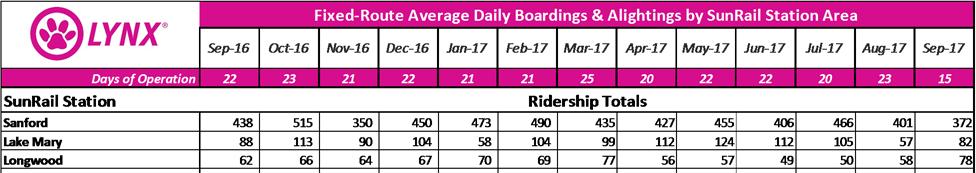
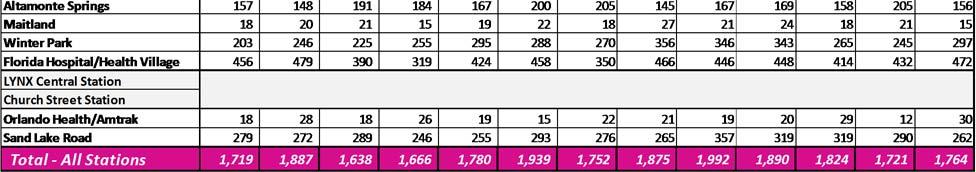
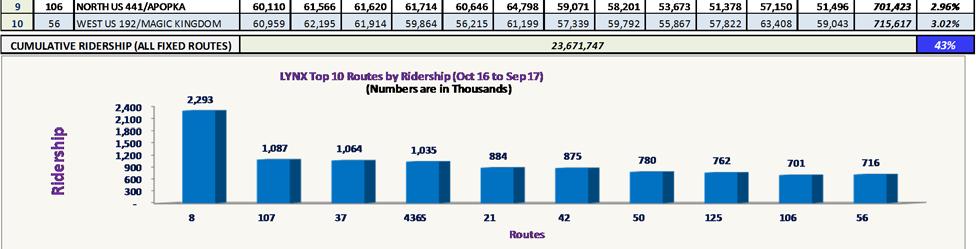
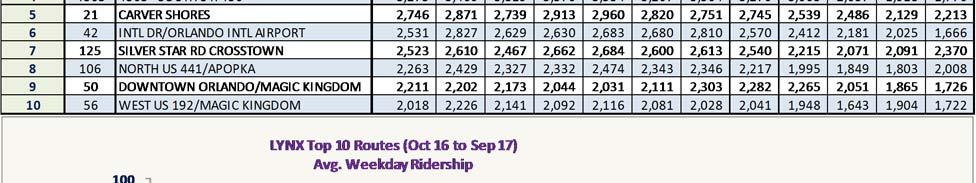
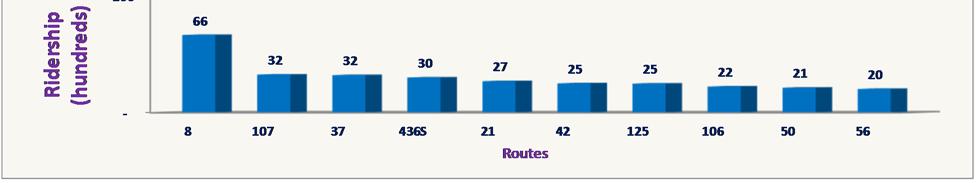
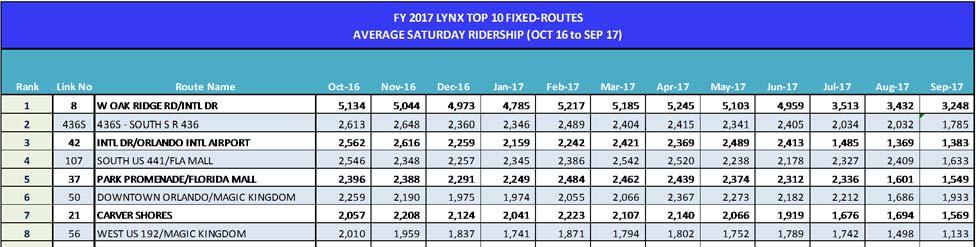
1 2017 LYNX RIDERSHIP YEAR END REVIEW In the last five years, LYNX ridership has declined by more than 5%. Annual system wide ridership in 2011 was 28,023,186. By 2016 the ridership had decreased slightly to 27,378,421 riders per year. SunRail, Central Florida s commuter rail system, started service on May 1, 2014 and its ridership has continued to grow. When the system total ridership of SunRail is combined with the system total ridership of LYNX to examine transit ridership for the region, we can see that regional transit ridership has been relatively consistent between FY 2016 and FY One influencing factor is that a number of LYNX riders switched over to SunRail for at least a portion of their daily commute. Over the last few years, there have been significant changes in the travel patterns of LYNX customers due to the introduction of SunRail, the improved economy, and reduced gas prices. According to the American Public Transit Association, high gasoline prices in recent years helped give public transit agencies across the U.S. their best ridership numbers in half a century. Although the average price per gallon of regular unleaded gasoline has increased 27 cents over the past year, according to the U.S. Energy Information Administration, it is still less than $3 per gallon in much of the nation. This low cost for fuel appears to be encouraging our customers to drive more. Total LYNX system wide ridership for period of October 2016 through September 2017 is 26,011,323. This reduction in ridership was expected both due to the transition of many LYNX customers on Links 102, 103, 7, 11, and 18 to SunRail, and the other economic factors described above. LYNX experienced ridership growth this year in the service it provides through Vanpool and AccessLYNX. However, ridership decreased on LYMMO, NeighborLink, fixed route, and Xpress Link 208 this fiscal year. As LYNX begins a new fiscal year, the October 2017 and November 2017 ridership numbers show the continued influence of reduced gas prices and the improving economy on customer retention. Page 1 of 13
2 YEAR TO DATE (OCTOBER 2016 TO SEPTEMBER 2017) Service Mode Oct-Sep(FY2016) Oct-Sep(FY2017) % Change LYMMO (ORANGE LINE) 733, , % LYMMO (GRAPEFRUIT LINE) 486, , % LYMMO (LIME LINE) 59,371 68, % LYMMO (NORTH QUARTER) 36,378 43, % REGULAR FIXED-ROUTE 24,846,907 23,570, % NEIGHBORLINK 171, , % SUBTOTAL - FIXED, NL, + LYMMO 26,334,864 24,928, % SPECIAL SHUTTLE 86,040 57,945 N/A EXPRESS LINK 208 9,950 7, % ACCESS LYNX 549, , % VANPOOL 397, , % SUBTOTAL - OTHER SERVICES 1,043,557 1,082, % TOTAL ALL SERVICES 27,378,421 26,011, % Other transit agencies in Florida and around the country are experiencing decreases in ridership. For September, factors that influenced ridership include the first full month of schools in session, partnership with Valencia College to provide free rides on LYNX vehicles, and the launching of LYNX s DoubleMap application. LYMMO: Through September 2017, total LYMMO ridership is down by eight (8.17%) percent compared to this time last year. The drop in Orange Line ridership may still be related to riders not yet realizing that the Orange Line has been restored to its original alignment and that the North Quarter is now a separate line. The drop in Grapefruit Line ridership may be related to the long-term closure of Central Blvd. due to sewer replacement, which resulted in a detour of the route. The increase in ridership on the Lime Line may be related to the extension of the route to the new Creative Village in Parramore. The increase in ridership on the North Quarter Line may be related to the extension of the route to LYNX Central Station. NeighborLink: Ridership on the 13 NeighborLink services in September was 10,065. This was 4,024 (12.71%) fewer riders than September VanPool: The number of vanpools in service has increased over the last fiscal year giving LYNX an approximate thirteen (12.76%) percent increase in ridership so far this year. In September 2017 there were 181 vehicles in service compared to 157 vehicles in September Page 2 of 13
3 Fixed-Route: Fixed route ridership continues to fall short of FY 2016 ridership by approximately five (5.14%) percent. The primary reason may be related to a continuance of low fuel costs, increased traffic congestion which leads to decreased on-time performance for the fixed-route system. Other factors may also include an improving economy and a system shut-down for approximately 24 hours due to Hurricane Irma. ACCESS LYNX: Ridership is up by three (3.36%) percent over fiscal year 2016 through September Part of this increase may be attributed to the rollout of the ACCESS LYNX mobile application that was released in August ,000,000 FIXED-ROUTE Cumulative Ridership 25,000,000 20,000,000 24,846,907 23,570,202 15,000,000 10,000,000 5,000,000 - Oct-Sep(FY2016) Oct-Sep(FY2017) Period FY TOTAL Retail Gasoline Prices in Florida Sep-16 Sep-17 Change Oct-Sep(FY2016) 24,846,907 Oct-Sep(FY2017) 23,570,202 Source: U.S. Energy Info Administration $2.33 $ % Change (%) -5.14% Page 3 of 13
4 1,400,000 1,300,000 1,200,000 1,100,000 1,000, , , , , , , , , ,000 0 LYMMO Cumulative Ridership 1,316,516 Oct-Sep(FY2016) 1,208,940 Oct-Sep(FY2017) Service Mode FY 2016 FY 2017 % Change LYMMO (ORANGE - Downtown) 733, , % LYMMO (GRAPEFRUIT) 486, , % LYMMO (LIME) 59,371 68, % LYMMO (N. QUARTER CIRCULATOR) 36,378 43, % TOTAL 1,316,516 1,208, % Page 4 of 13
5 190, , , , , , , , , ,000 90,000 80,000 70,000 60,000 50,000 40,000 30,000 20,000 10,000 0 NEIGHBORLINK Cumulative Ridership 171,441 Oct-Sep(FY2016) 149,657 Oct-Sep(FY2017) Period FY TOTAL Oct-Sep(FY2016) 171,441 Oct-Sep(FY2017) 149,657 Change (%) % Page 5 of 13
6 500,000 VANPOOL Cumulative Ridership 450, , , , , , , ,000 50, ,998 Oct-Sep(FY2016) 448,791 Oct-Sep(FY2017) Period FY TOTAL Vehicles Operated in Maximum Service Sep-16 Sep-17 Change Oct-Sep(FY2016) 397,998 Oct-Sep(FY2017) 448,791 Vehicles Operated % Change (%) 12.76% Page 6 of 13
7 600,000 ACCESS LYNX Cumulative Ridership 500, , , , , , ,000 - Oct-Sep(FY2016) Oct-Sep(FY2017) Period FY TOTAL Dates Oct-Sep(FY2016) 549,569 August 1, 2014 Oct-Sep(FY2017) 568,061 October 1, 2014 Change (%) 3.36% March 1, 2015 Medicaid Policy Changes Medicaid clients living in nursing homes were no longer eligible. All Medicaid recipients were switched to HMO. Only transports Medicaid recipients who are eligible either through the Americans with Disabilities Act (ADA), Transportation Disadvantage (TD), or are 80 years and older. Page 7 of 13
8 30,000,000 REGIONAL TRANSIT RIDERSHIP (LYNX & SunRail) 25,000,000 28,256,034 26,868,822 20,000,000 15,000,000 10,000,000 5,000,000 0 Oct-Sep(FY2016) Oct-Sep(FY2017) Period FY TOTAL Oct-Sep(FY2016) 28,256,034 Oct-Sep(FY2017) 26,868,822 Change (%) -4.91% Page 8 of 13


9 SUNRAIL SUNRAIL FEEDER BUS Page 9 of 13

10 Page 10 of 13

11 Page 11 of 13
12 LYNX Monthly Ridership by Mode Fiscal Year 2017 Service Mode October November December January February March April May June July August September Year to Date LYMMO (ORANGE LINE) 54,643 54,255 56,237 57,004 52,479 53,773 53,289 63,182 65,095 61,807 62,683 47, ,015 LYMMO (GRAPEFRUIT LINE) 31,695 34,840 33,596 34,152 32,790 32,388 31,799 37,572 32,612 33,660 42,295 37, ,149 LYMMO (LIME LINE) 7,849 6,577 6,100 7,403 6,306 6,602 6,357 4,176 4,473 4,061 4,830 4,039 68,773 LYMMO (CIRCULATOR) 3,886 3,470 2,996 3,180 3,426 3,390 3,955 3,353 4,075 4,071 4,257 2,944 43,003 REGULAR FIXED ROUTE 2,018,447 2,028,206 2,008,409 2,026,282 1,942,973 2,081,060 1,952,481 2,002,790 1,850,489 1,828,871 2,065,427 1,764,767 23,570,202 NEIGHBORLINK 13,208 13,330 12,928 13,473 13,036 13,912 12,614 13,291 12,196 9,711 11,893 10, ,657 SUBTOTAL FIXED ROUTE 2,129,728 2,140,678 2,120,266 2,141,494 2,051,010 2,191,125 2,060,495 2,124,364 1,968,940 1,942,181 2,191,385 1,867,133 24,928,799 SPECIAL SHUTTLES 670 5,660 7,725 23,855 1,601 18,434 57,945 EXPRESS LINK ,727 ACCESS LYNX 46,490 47,956 46,737 47,936 46,326 52,682 48,850 51,047 47,846 44,212 49,003 38, ,061 VANPOOL 36,474 36,918 36,120 36,896 36,951 39,276 37,774 38,507 37,999 37,287 37,905 36, ,791 SUBTOTAL OTHER SERVICES 84,238 91,261 91, ,288 83,757 94, ,582 90,375 86,538 82,101 87,676 76,260 1,082,524 TOTAL ALL SERVICES 2,213,966 2,231,939 2,211,644 2,250,782 2,134,767 2,285,195 2,166,077 2,214,739 2,055,478 2,024,282 2,279,061 1,943,393 26,011,323 % Change from Fiscal Year 2016 to Fiscal Year 2017 Service Mode October November December January February March April May June July August September Year to Date LYMMO (ORANGE LINE) 22.88% 12.14% 8.97% 1.90% 2.06% 0.97% 2.30% 12.64% 2.76% 18.20% 5.63% 18.39% 7.07% LYMMO (GRAPEFRUIT LINE) 35.30% 9.34% 1.00% 9.21% 19.62% 17.37% 3.92% 1.02% 22.38% 17.74% 11.69% 19.31% 14.73% LYMMO (LIME LINE) N/A N/A N/A % 23.43% 5.12% 19.73% 54.01% 22.52% 18.86% 47.68% 56.12% 15.84% LYMMO (CIRCULATOR) N/A N/A N/A % 11.63% 11.28% 4.00% 13.49% 15.61% 27.12% 11.39% 36.88% 18.21% REGULAR FIXED ROUTE 11.67% 2.20% 5.98% 1.15% 3.76% 2.11% 4.66% 2.56% 6.74% 7.92% 1.26% 13.40% 5.14% NEIGHBORLINK 20.49% 3.62% 7.93% 0.15% 8.86% 7.12% 13.54% 0.69% 10.84% 15.03% 21.37% 28.56% 12.71% SUBTOTAL FIXED ROUTE 12.06% 2.16% 5.59% 1.37% 3.91% 2.41% 4.69% 2.33% 7.02% 8.59% 1.97% 13.99% 5.34% SPECIAL SHUTTLES N/A N/A N/A N/A N/A N/A N/A N/A N/A N/A N/A N/A N/A EXPRESS LINK % 20.72% 10.66% 16.41% 48.16% 42.97% 28.90% 10.20% 20.25% 9.88% 14.19% 10.71% 22.34% ACCESS LYNX 0.39% 14.39% 10.22% 15.00% 7.79% 14.24% 7.91% 11.90% 8.82% 8.23% 0.43% 19.37% 3.36% VANPOOL 15.26% 23.40% 21.20% 18.15% 13.31% 16.76% 13.94% 16.88% 12.31% 9.31% 1.65% 3.01% 12.76% SUBTOTAL OTHER SERVICES 10.68% 15.65% 19.98% 34.11% 5.93% 7.52% 19.58% 0.93% 3.29% 1.42% 4.84% 20.50% 3.73% TOTAL ALL SERVICES 12.00% 1.53% 4.74% 2.61% 3.55% 2.03% 3.72% 2.20% 6.62% 8.21% 2.08% 14.27% 4.99% Fiscal Year 2016 Service Mode October November December January February March April May June July August September Year to Date LYMMO (ORANGE LINE) 70,859 61,754 61,777 55,949 51,418 54,297 54,541 56,093 66,943 75,557 66,424 58, ,901 LYMMO (GRAPEFRUIT LINE) 48,989 38,431 33,934 37,618 40,794 39,198 33,097 37,191 42,017 40,920 47,893 46, ,866 LYMMO (LIME LINE) 1,091 5,109 6,958 7,920 9,080 5,773 5,005 9,231 9,204 59,371 LYMMO (CIRCULATOR) 1,118 3,877 3,821 3,803 3,876 4,829 5,586 4,804 4,664 36,378 REGULAR FIXED ROUTE 2,285,215 2,073,888 2,136,090 2,003,285 2,018,971 2,125,920 2,047,984 2,055,397 1,984,294 1,986,170 2,091,887 2,037,806 24,846,907 NEIGHBORLINK 16,611 13,830 14,042 13,453 14,303 14,979 14,589 13,384 13,679 13,357 15,125 14, ,441 SUBTOTAL FIXED ROUTE 2,421,674 2,187,903 2,245,843 2,112,514 2,134,472 2,245,173 2,161,934 2,175,021 2,117,535 2,126,595 2,235,364 2,170,836 26,334,864 SPECIAL SHUTTLES 15,382 6,143 2,961 7,649 2,579 6,949 8,969 10,416 5,203 5,542 5,158 9,089 86,040 EXPRESS LINK 208 1, ,950 ACCESS LYNX 46,624 42,616 43,636 43,170 44,519 47,765 46,979 47,313 45,645 44,170 48,795 48, ,569 VANPOOL 31,645 29,917 29,803 31,227 32,610 33,637 33,153 32,945 33,835 34,112 37,290 37, ,998 SUBTOTAL OTHER SERVICES 94,666 79,593 77,291 82,765 80,634 89,247 89,838 91,419 85,552 84,492 92,138 95,922 1,043,557 TOTAL ALL SERVICES 2,516,340 2,267,496 2,323,134 2,195,279 2,215,106 2,334,420 2,251,772 2,266,440 2,203,087 2,211,087 2,327,502 2,266,758 27,378,421 Page 12 of 13
13 September Average Daily Ridership by Mode Service Mode Day September-16 September-17 % Change LYMMO (ORANGE LINE) Weekday 2,295 1, % Saturday 1,316 1, % Sunday % LYMMO (GRAPEFRUIT LINE) Weekday 1,775 1, % Saturday 1, % Sunday 1,051 1, % LYMMO (LIME LINE) Weekday % Saturday % Sunday % LYMMO (NORTH QUARTER) Weekday % Saturday % Sunday % REGULAR FIXED-ROUTE Weekday 77,345 73, % Saturday 55,561 35, % Sunday 33,939 22, % EXPRESS LINK 208 Weekday % Saturday - - N/A Sunday - - N/A ACCESS LYNX Weekday 1,988 1, % Saturday 1, % Sunday % NEIGHBORLINK Weekday % Saturday % VANPOOL Weekday 1,597 1, % Saturday % Sunday % TOTAL Weekday 86,192 81, % LYNX Saturday 59,892 39, % SERVICES Sunday 37,047 25, % *Ridership reporting for weekday and weekend fixed-route service may have been reported on next day due to delay in farebox data retrieval. Page 13 of 13
Capital Metro Monthly Ridership Report September 2017 (Fiscal Year-end 2017)
") Capital Metro Monthly Ridership Report September 2017 (Fiscal Year-end 2017) Page 1 of 6 Ridership Summary This is a summary of Capital Metro system-wide ridership statistics for fiscal year-end and the
Capital Metro Monthly Ridership Report September 2017 (Fiscal Year-end 2017) Page 1 of 6 Ridership Summary This is a summary of Capital Metro system-wide ridership statistics for fiscal year-end and the
Capital Metro Monthly Ridership Report March 2017 (Fiscal Year 2017)
") Capital Metro Monthly Ridership Report March 2017 (Fiscal Year 2017) Page 1 of 5 Ridership Summary This is a summary of Capital Metro system-wide ridership statistics for the month of March 2017 by mode
Capital Metro Monthly Ridership Report March 2017 (Fiscal Year 2017) Page 1 of 5 Ridership Summary This is a summary of Capital Metro system-wide ridership statistics for the month of March 2017 by mode
Capital Metro Monthly Ridership Report November 2016 (Fiscal Year 2017)
") Capital Metro Monthly Ridership Report November 2016 (Fiscal Year 2017) Page 1 of 5 Ridership Summary This is a summary of Capital Metro system-wide ridership statistics for the month of November 2016
Capital Metro Monthly Ridership Report November 2016 (Fiscal Year 2017) Page 1 of 5 Ridership Summary This is a summary of Capital Metro system-wide ridership statistics for the month of November 2016
Capital Metro Monthly Ridership Report December 2016 (Fiscal Year 2017)
") Capital Metro Monthly Ridership Report December 2016 (Fiscal Year 2017) Page 1 of 5 Ridership Summary This is a summary of Capital Metro system-wide ridership statistics for the month of December 2016
Capital Metro Monthly Ridership Report December 2016 (Fiscal Year 2017) Page 1 of 5 Ridership Summary This is a summary of Capital Metro system-wide ridership statistics for the month of December 2016
ORANGE COUNTY TRANSPORTATION AUTHORITY. Metrolink Ridership and Revenue Quarterly Report. Staff Report
 ORANGE COUNTY TRANSPORTATION AUTHORITY Metrolink Ridership and Revenue Quarterly Report Staff Report March 8, 2012 To: From: Subject: Transit Committee Will Kempton, Chief Executive Officer Metrolink Ridership
Title VI Fare Change Equity Analysis
 Title VI Fare Change Equity Analysis Evaluation Report Submitted to Dallas Area Rapid Transit Submitted by TranSystems June 2012 Title VI Fare Change Equity Analysis Introduction DART has proposed a schedule
Ridership in Virginia by System FY2017
 #6C TO: FROM: Chairman McKay and NVTC Commissioners Kate Mattice, Andrew D huyvetter and Nobuhiko Daito DATE: August 30, 2017 SUBJECT: NVTC FY2017 Annual Ridership Report Overall transit ridership in Northern
Members of the Board of Directors. Wendy Knowles, Clerk of the Board. Metrolink Ridership and Revenue Annual Report
 COMMITTEE TRANSMITTAL January 13, 2014 To: From: Subject: Members of the Board of Directors Wendy Knowles, Clerk of the Board Metrolink Ridership and Revenue Annual Report Transit Committee Meeting of
METRO Light Rail: Changing Transit Markets in the Phoenix Metropolitan Area
 METRO Light Rail: Changing Transit Markets in the Phoenix Metropolitan Area Abhishek Dayal, AICP Planner III, METRO Light Rail Phoenix, AZ BACKGROUND Transit in the Phoenix Region Transit services in the
Hampton Roads Transit. Ridership Report for February 2014 Operations & Oversight Committee Meeting
 Hampton Roads Transit Report for February 214 Operations & Oversight Committee Meeting Hampton Roads Transit UPDATED: Wednesday, January 8, 214 Hampton Roads Transit Report for the March 214 Operations
Where We Live and Work Today
 San Diego Forward: The 2019-2050 Regional Plan Network Concepts Transportation Committee Item 4 October 19, 2018 Where We Live and Work Today 2018 2 2019 Regional Plan Transportation Committee Item 4 October
95 Express Annual Operations Report: Fiscal Year
 95 Express Annual Operations Report: Fiscal Year 2014-2015 General The 95 Express Program completed its sixth full Fiscal Year of operations in June 2015. For the FDOT, its Fiscal Year (FY) is from July
Dartmouth College Parking, Traffic, & Pedestrian Circulation. Master Plan 2001
 Dartmouth College Parking, Traffic, & Pedestrian Circulation Master Plan 2001 Goals & Objectives of the Study Identify Existing and Projected Parking Demand & Supply Identify Existing Pedestrian & Traffic
REVENUE & RIDERSHIP REPORT SEPTEMBER 2018
 REVENUE & RIDERSHIP REPORT SEPTEMBER 2018 Year-to-date passenger revenue 1.3% above last year Year-to-date ridership 2.1% below last year 1,500 SEPTA RIDERSHIP PERFORMANCE Average Daily Rides in 000's
Capital Metro Monthly Ridership Report January 2018 (Fiscal Year 2018)
") Capital Metro Monthly Ridership Report January 2018 (Fiscal Year 2018) Page 1 of 5 Ridership Summary This is a summary of Capital Metro system-wide ridership statistics for the month of January 2018 by
Capital Metro Monthly Ridership Report January 2018 (Fiscal Year 2018) Page 1 of 5 Ridership Summary This is a summary of Capital Metro system-wide ridership statistics for the month of January 2018 by
Evan Johnson, Tindale Oliver & Associates. Alan Danaher, P.E., PTOE, AICP, PTP
 To: Copies: From: Evan Johnson, Tindale Oliver & Associates Matt Muller, RTS Jesus Gomez, RTS Alan Danaher, P.E., PTOE, AICP, PTP Date: January 14, 2014 Subject: Ridership Projections Gainesville Streetcar
395 Express Lanes Extension
 395 Express Lanes Extension January 2016 Building a network of Express Lanes Project overview Add capacity on I-395 with addition of a third HOV lane and active traffic management Generate guaranteed transit
Bus Rapid Transit ALTERNATIVES ANALYSIS. Open House
 Bus Rapid Transit ALTERNATIVES ANALYSIS Open House June 23, 2015 Open House Meeting Agenda Agenda Introductions What is BRT? Project Goals Study Tasks Next steps Discussion PVTA Bus Rapid Transit Study
Calgary Transit Route 302 Southeast BRT Year One Review June
 Calgary Transit Route 302 Southeast BRT Year One Review 2011 June Calgary Transit Route 302 Southeast BRT: Year One Review 2011 April Table of Contents 1.0 Executive Summary... 1 2.0 Introduction... 3
Capital Metro Monthly Ridership Report March 2018 (Fiscal Year 2018)
") Capital Metro Monthly Ridership Report March 2018 (Fiscal Year 2018) Page 1 of 5 Ridership Summary This is a summary of Capital Metro system-wide ridership statistics for the month of March 2018 by mode
Capital Metro Monthly Ridership Report March 2018 (Fiscal Year 2018) Page 1 of 5 Ridership Summary This is a summary of Capital Metro system-wide ridership statistics for the month of March 2018 by mode
REVENUE & RIDERSHIP REPORT NOVEMBER 2017
 REVENUE & RIDERSHIP REPORT NOVEMBER 2017 November ridership and revenue 1.9% and 2.2% below budget Depressed ridership last November from a six-day City Transit strike Year-to-date revenue 3.2% and ridership
Transit Ridership - Why the Decline and How to Increase. Hosted by the. Virginia Transit Association
 Transit Ridership - Why the Decline and How to Increase Hosted by the Virginia Transit Association Virginia Transit Association 1108 East Main Street, Suite 1108 Richmond, VA 23219 804.643.1166 www.vatransit.com
Waterford Lakes Small Area Study
 Waterford Lakes Small Area Study Existing Traffic Conditions PREPARED FOR: ORANGE COUNTY PUBLIC WORKS DEPARTMENT TRAFFIC ENGINEERING DIVISION ORLANDO, FLORIDA PREPARED WITH: INWOOD CONSULTING ENGINEERS
1999 On-Board Sacramento Regional Transit District Survey
 SACOG-00-009 1999 On-Board Sacramento Regional Transit District Survey June 2000 Sacramento Area Council of Governments 1999 On-Board Sacramento Regional Transit District Survey June 2000 Table of Contents
Public Consultation Centre For. Transportation Master Plan Update. Information Package
 Public Consultation Centre For Transportation Master Plan Update Information Package Date Location Hours Tuesday, September 12, 2017 Wednesday, September 13, 2017 Tuesday, September 19, 2017 Cambridge
BUILDING THE CASE FOR TRAVEL OPTIONS IN WASHING TON COUNTY. Image: Steve Morgan. Image: Steve Morgan
 BUILDING THE CASE FOR TRAVEL OPTIONS IN WASHING TON COUNTY Image: Steve Morgan Image: Steve Morgan Image: TriMet Image: TriMet WHAT ARE TRAVEL OPTIONS PROGRAMS? Travel options programs encourage residents,
TRB Managed Lanes Conference May 22 24, 2012, Oakland, CA
 HOT LLanes and d TTransit i P f Performance TRB Managed Lanes Conference May 22 24, 2012, Oakland, CA Miami UPA Transit Results (2008 2010 Data) Miami UPA Transit Improvements 2 new routes Dade-Broward
CHAPTER 3. Transportation and Circulation
 CHAPTER 3 Transportation and Circulation 3.0 TRANSPORTATION AND CIRCULATION This chapter evaluates traffic circulation, transit, parking, pedestrian, bicycle, and rail operational conditions in the Project
METRO Now. Transit Leader. One of only four urban. gain bus ridership in Purple and Green Lines. Red Line is one
 Transit Leader Our commuter buses provide 8 million trips each year third most trips of any U.S. transit agency. 1 One of only four urban transit agencies in the country to gain bus ridership in 2016 2
Capital Metro Monthly Ridership Report July 2018 (Fiscal Year 2018)
") Capital Metro Monthly Ridership Report July 2018 (Fiscal Year 2018) Page 1 of 5 Ridership Summary This is a summary of Capital Metro system-wide ridership statistics for the month of July 2018 by mode
Capital Metro Monthly Ridership Report July 2018 (Fiscal Year 2018) Page 1 of 5 Ridership Summary This is a summary of Capital Metro system-wide ridership statistics for the month of July 2018 by mode
Understanding Rail and Bus Ridership
 Finance Committee Information Item III-A October 12, 2017 Understanding Rail and Bus Ridership Washington Metropolitan Area Transit Authority Board Action/Information Summary Action Information MEAD Number:
Passenger Rail in Virginia
 Passenger Rail in Virginia Executive Summary! In 2011, Washington DC-VA-MD ranked 1st in the U.S. per auto commuter in the following categories:1 o Yearly Delay; 67 hours o Excess Fuel; 32 gallons o Congestion
Transportation in Washoe County. Lee Gibson, Executive Director February 15, 2011
 Transportation in Washoe County Lee Gibson, Executive Director February 15, 2011 RTC OF WASHOE COUNTY Metropolitan Planning Organization Meet long term needs Deliver federal funding Program projects in
RTC TRANSIT OPERATING STATISTICS RTC RIDE RTC RAPID RTC INTERCITY SIERRA SPIRIT
 RTC TRANSIT OPERATING STATISTICS RTC RIDE RTC RAPID RTC INTERCITY SIERRA SPIRIT April 2016 RTC TRANSIT OPERATING STATISTICS REPORT TABLE OF CONTENTS RTC Transit Highlights... Page ii RTC Transit Summary...
Preliminary Review of the T-REX Southeast Corridor Highway and Light Rail Transit Project
 Preliminary Review of the T-REX Southeast Corridor Highway and Light Rail Transit Project DRCOG Congestion Mitigation Program White Paper 07-1 (February 16, 2007) On time and under budget! Festivities
TexRail Truth. The real story of pork politics, government waste and taxpayer abuse in Tarrant County. December 10, 2014!
 December 10, 2014! TexRail Truth The real story of pork politics, government waste and taxpayer abuse in Tarrant County Chris Putnam! Colleyville City Council! cputnam@colleyville.com! Liberal Austin Votes
Addressing Bicycle Capacity Issues on Public Transportation
 Addressing Bicycle Capacity Issues on Public Transportation Advanced Transportation Technologies Clean Transportation Solutions SM Whitney Pitkanen Project Manager MISSION STATEMENT CALSTART is dedicated
North Coast Corridor:
 North Coast Corridor: Connecting People, Transportation & Environment Legislative Hearing: 11.8.10 1 North Coast Corridor Region s Lifeline A Regional Strategy Mobility, Economy & Environment North Coast
Service Proposal for the City of Ashland, Oregon
 Rogue Valley Transportation District 3200 Crater Lake Avenue Medford, Oregon 97504-9075 Phone (541) 608-2429 Fax (541) 773-2877 Visit our website at: www.rvtd.org 2009-2011 Service Proposal for the City
Community Transit Solutions for the Suburbs APTA Annual Meeting Steve Fittante, New Jersey Transit Corporation September 30, 2013
 Community Transit Solutions for the Suburbs APTA Annual Meeting Steve Fittante, New Jersey Transit Corporation September 30, 2013 New Suburban Challenges Lower density development patterns Where is the
Measuring the Distribution and Costs of Congestion. Tim Lomax Texas Transportation Institute
 Measuring the Distribution and Costs of Congestion Tim Lomax Texas Transportation Institute http://mobility.tamu.edu The Congestion Measurement Story Travel time, variations, compare to goals WHAT? WHY?
TRANSPORTATION RECYCLING NEW JERSEY RAILROAD RIGHTS OF WAY INTO A PUBLIC RAPID TRANSIT SYSTEM
 TRANSFORMATION THROUGH TRANSPORTATION RECYCLING NEW JERSEY RAILROAD RIGHTS OF WAY INTO A PUBLIC RAPID TRANSIT SYSTEM BY JAMES GRELLER PLANNER FOR THE HUDSON COUNTY IMPROVEMENT AUTHORITY RAILROAD MAP OF
TRANSIT & NON-MOTORIZED PLAN DRAFT FINAL REPORT Butte County Association of Governments
 1 INTRODUCTION Maintaining a high quality of life is the essence of this plan for transit and non-motorized transportation in Butte County. Curbing greenhouse gas emissions (GHG) by reducing congestion,
SETTINGS AND OPPORTUNITIES MOBILITY & ACCESS
 7 mobility & access how do people use el camino what is it like to drive on el camino/to park along el camino what is the pedestrian experience like what is the role of transit along the corridor what
Paratransit Service. ADA Paratransit Service
 Paratransit Service June 8, 2011 ADA Paratransit Service Operating Statistics Redi-Wheels & RediCoast Customer Service Paratransit Eligibility ADA Program Costs Efficiency Measures Summary 2 1 Redi-Wheels
Pocatello Regional Transit Master Transit Plan Draft Recommendations
 Pocatello Regional Transit Master Transit Plan Draft Recommendations Presentation Outline 1. 2. 3. 4. What is the Master Transit Plan? An overview of the study Where Are We Today? Key take-aways from existing
Public Transit Tips on How to Use Transportation Options in Florida
 Public Transit Tips on How to Use Transportation Options in Florida SafeMobilityFL.com Finding Your Mobility Independence Florida has many public transit options but you may have questions about how to
PUBLIC TRANSPORTATION PLAN FOR THE CITY OF GEORGETOWN
 PUBLIC TRANSPORTATION PLAN FOR THE CITY OF GEORGETOWN PRESENTATION TO CITY COUNCIL JANUARY 22, 2008 PUBLIC TRANSIT FOR THE CITY OF GEORGETOWN LOCAL SERVICE For Georgetown residents to Georgetown destinations.
GIVING GEORGIANS A CHOICE TO KEEP MOVING
 GIVING GEORGIANS A CHOICE TO KEEP MOVING I-85 Express Lanes Annual Performance Report FISCAL YEAR 2014 (JULY 1, 2013 JUNE 30, 2014) EEP OVING VISION AND MISSION Enhancing mobility in Georgia by providing
UNC Transportation Fair
 UNC Transportation Fair Sponsored by the Commuter Alternative Program Commuter Alternative Program (CAP) and Transportation & Parking The ReCYCLEry Tar Heel Bikes Carrboro Bicycle Coalition Bicycle Alliance
Richmond Area MPO Regional Transportation and Land Use Performance Measures 2013
 Richmond Area MPO Regional Transportation and Land Use Performance Measures 2013 Richmond Area October 2013 REGIONAL PERFORMANCE MEASURES FOR RICHMOND AREA MPO Rows that are shaded are categories of regional
KING STREET TRANSIT PILOT
 STREET TRANSIT PILOT Update toronto.ca/kingstreetpilot #kingstreetpilot HIGHLIGHTS PREVIOUS HIGHLIGHTS TRANSIT RELIABILITY TRANSIT TRAVEL TIMES 85% of streetcars arriving within 4 minutes westbound during
Welcome. Wilmington Transit Moving Forward Workshop Presentation. October 16, 2013
 Welcome Wilmington Transit Moving Forward Workshop Presentation October 16, 2013 Project Purpose Evaluate recommendations from previous studies Wilmington Downtown Circulation Study (WDCS) 2012 State Smart
David Jickling, Public Transportation Director Regional Transportation Commission, Washoe County
 David Jickling, Public Transportation Director Regional Transportation Commission, Washoe County Virginia Street Resort corridor connecting University of Nevada, Reno Downtown Truckee River Strip Casinos
Appendix T 1: Additional Supporting Data
 Appendix T 1: Additional Supporting Data Project Delivery Delays with the implementation of the 2000 TIP became apparent early in the decade. In response to direction among policy officials, ARC began
Afeasibility study to evaluate bus rapid transit service in the East-West Corridor connecting major employment and activity centers between downtown
 East-West Bus Rapid Transit Feasibility Study Update and Recommended Locally Preferred Alternative (LPA) Summary City of Wauwatosa, Transportation Affairs Committee June 2016 Afeasibility study to evaluate
Technical Report #:5 Transit Element Final Adopted Plan
 2040 Long Range Transportation Plan Technical Report #:5 Transit Element Final Adopted Plan January 2016 250 South Orange Avenue, Suite 200, Orlando, FL 32801 407-481-5672 www.metroplanorlando.com MetroPlan
1/30/2019 DRAFT. January 31, Item #1 CITIZENS PARTICIPATION
 January 31, 2019 Item #1 CITIZENS PARTICIPATION 1 Item #2 APPROVAL OF MINUTES Item #3 TRAC GOALS, FRAMEWORK & AGENDA REVIEW 2 COMMITTEE GOALS Learn about Southern Nevada s mobility challenges, new developments
Transportation-Demand Management Community Presentation
 Transportation-Demand Management Community Presentation American University Office of Risk, Safety and Transportation programs Thursday, June 7, 2018 Program Objectives Improve transportation options for
Transit Operations in the I-95 Express Lanes
 Transit Operations in the I-95 Express Lanes TRB 15 th International Conference on Managed Lanes Miami, Florida Presented by Diane Quigley FDOT Transit Planning Administrator May 5, 2016 FDOT Governance
Previous Transit Studies MTTF MEETING #
 Previous Transit Studies MTTF MEETING #4 2013-03-22 Agenda Project timeline Final transit recommendation (2011) Transit planning and development (2002 2011) Moving forward (2011 2013) 2 Project Timeline
Commuter Credits Pilot Project
 Commuter Credits Pilot Project IBTTA 2015 Washington, DC Briefing -- March 31, 2015 State and Local Innovations in Surface Transportation Funding Christopher Tomlinson Executive Director State Road and
Typical Rush Hour Commute. PennyforTransportation.com
 Typical Rush Hour Commute In the News Overview of the Plan Collaborative plan with projects in every community Prioritizing connectivity and congestion relief Dedicated transportation-specific funding;
Transit Optimization Plan. September 2017
 Transit Optimization Plan September 2017 Contents Introduction...6 Goals and Focus... 6 Study Process... 7 Report Contents... 8 Existing Conditions...9 Market Assessment... 9 Population...9 Employment...9
Factors that Affect Fixed-Route Ridership Frequency Connections and accessibility Travel time Travel cost Service area coverage Reliability
 The transit industry defines ridership as the number of passengers who board public transportation vehicles called unlinked passenger trips. Ridership measures transit utilization at the system, route,
Arlington County 10-Year Transit Development Plan & Premium Transit Network Briefing. May 2016
 Arlington County 10-Year Transit Development Plan & Premium Transit Network Briefing May 2016 Overview 10-Year Transit Development Plan Premium Transit Network Columbia Pike service concept Premium amenities
Progress Report Capital Programs Support
 Progress Report Capital Programs Support June 2017 Prepared by Project Control l Design, Engineering & Construction Management June 2017 Page 135 of 142 This page intentionally left blank. June 2017 Page
Guidelines for Providing Access to Public Transportation Stations APPENDIX C TRANSIT STATION ACCESS PLANNING TOOL INSTRUCTIONS
 APPENDIX C TRANSIT STATION ACCESS PLANNING TOOL INSTRUCTIONS Transit Station Access Planning Tool Instructions Page C-1 Revised Final Report September 2011 TRANSIT STATION ACCESS PLANNING TOOL INSTRUCTIONS
Speaker: Brian Dranzik, Fiscal & Policy Administrator Milwaukee County
 Milwaukee County Speaker: Brian Dranzik, Fiscal & Policy Administrator Milwaukee County Department of Transportation and Public Works Project coordinated by Milwaukee County Transit System and Southeastern
Aurora Corridor to E Line
 Aurora Corridor to E Line Jack Whisner Transit Planner, Service Development King County Metro Transit Seattle, Washington jack.whisner@kingcounty.gov 206-477-5847 King County Metro Transit Part of general
Steve Feigenbaum Service Planning Manager Katharine Eagan, AICP Chief Operating Officer HART Tampa, Florida
 Scheduling Efficiency in the Tampa Area: How We Cut Our Budget and Grew Our Ridership Steve Feigenbaum Service Planning Manager Katharine Eagan, AICP Chief Operating Officer HART Tampa, Florida Who We
MCTC 2018 RTP SCS and Madera County RIFP Multi-Modal Project Eval Criteria GV13.xlsx
 MCTC 8 RTP SCS and Madera County RIFP Multi-Modal Project Eval Criteria GV.xlsx Madera County Transportation Commission Regional Transportation Plan / Sustainable Communities Strategy Multi-Modal Project
Dartmouth College Parking & Commuting June 10, 2009
 Dartmouth College Parking & Commuting June 10, 2009 Transportation Agenda Goals History and Programs Parking Today Data trends Parking by sectors Accounting system 2009 Parking and Commuting Program 2
Purpose and Need. Chapter Introduction. 2.2 Project Purpose and Need Project Purpose Project Need
 Chapter 2 Purpose and Need 2.1 Introduction The El Camino Real Bus Rapid Transit (BRT) Project (Project) would make transit and other transportation improvements along a 17.6-mile segment of the El Camino
SUBJECT: Board Approval: 4/29/04
 1255 Imperial Avenue, Suite 1000 San Diego, CA 92101-7490 619/231-1466 FAX 619/234-3407 Policies and Procedures No. 38 SUBJECT: Board Approval: 4/29/04 OUT-OF-DIRECTION BUS ROUTINGS PURPOSE: To establish
Transportation Trends, Conditions and Issues. Regional Transportation Plan 2030
 Transportation Trends, Conditions and Issues Regional Transportation Plan 2030 23 Regional Transportation Plan 2030 24 Travel Characteristics Why Do People Travel? Over one-half of trips taken in Dane
Proposed. City of Grand Junction Complete Streets Policy. Exhibit 10
 Proposed City of Grand Junction Complete Streets Policy Exhibit 10 1 City of Grand Junction Complete Streets Policy Vision: The Complete Streets Vision is to develop a safe, efficient, and reliable travel
Performance Criteria for 2035 Long Range Transportation Plan
 Minimizing Impacts on Natural, Historic, Cultural or Archeological Resources 2035 LRTP Weighting Factor: 7% Objective 1.1: Use appropriate planning and design criteria to protect and enhance the built
Looking Ahead and Looking Back: An Examination of NJDOT s and NJT s 2014 Capital Program
 Looking Ahead and Looking Back: An Examination of NJDOT s and NJT s 2014 Capital Program The New Jersey Department of Transportation s (NJDOT) and New Jersey TRANSIT s (NJT) Transportation Capital Program
Frequently Asked Questions (FAQ)
") Frequently Asked s (FAQ) Study Process... 2 Rapid Transit Service and Operations... 5 Public Consultation... 8 Business Impacts... 8 Design and Property Impacts... 9 Construction Impacts...12 Traffic,
Frequently Asked s (FAQ) Study Process... 2 Rapid Transit Service and Operations... 5 Public Consultation... 8 Business Impacts... 8 Design and Property Impacts... 9 Construction Impacts...12 Traffic,
Percent. Only one core route, 522, recorded an average weekday ridership increase with 6,939 riders, up 19.0% from November 2016 (5,833 riders).
.") Sent: Friday, December 29, 2017 1:53 PM Subject: VTA November Ridership Information TO: VTA Board of Directors THROUGH: Nuria I. Fernandez General Manager/CEO FROM: Inez Evans Chief Operating Officer DATE:
Sent: Friday, December 29, 2017 1:53 PM Subject: VTA November Ridership Information TO: VTA Board of Directors THROUGH: Nuria I. Fernandez General Manager/CEO FROM: Inez Evans Chief Operating Officer DATE:
Item Description: Presentation and Discussion: Berkeley Rapid Transit Locally Preferred Alternative
 Office of the City Manager Meeting Date: April 29, 2010 Item Number: 1 Item Description: Presentation and Discussion: Berkeley Rapid Transit Locally Preferred Alternative Staff report, resolution, and
FARE IMPACT STUDY. Prepared by the. Pioneer Valley Planning Commission
 FARE IMPACT STUDY Prepared by the Pioneer Valley Planning Commission March 30, 2018 CONTENTS 1. PURPOSE... 3 2. STUDY CONTEXT... 4 3. PVTA S CURRENT FARE PRICES AND POLICIES... 4 4. HISTORY OF PVTA FARE
2011 Countywide Attitudinal and Awareness Survey Results
 2011 Countywide Attitudinal and Awareness Survey Results Purpose of Study Establish baseline for measuring future performance Identify perceptions about transportation system, issues, priorities Assess
San Francisco Mobility Trends Report 2018
 San Francisco Mobility Trends Report 2018 San Francisco Municipal Transportation Agency Jan 28, 2019 San Francisco, California 2 Table of Contents 2 5 6 7 9 11 12 13 Executive Summary Transit Bicycling
RTC TRANSIT OPERATING STATISTICS RTC RIDE RTC RAPID RTC INTERCITY SIERRA SPIRIT
 RTC TRANSIT OPERATING STATISTICS RTC RIDE RTC RAPID RTC INTERCITY SIERRA SPIRIT September 218 RTC TRANSIT OPERATING STATISTICS REPORT TABLE OF CONTENTS RTC Transit Highlights... Page ii RTC Transit Summary...
CARTA East Cooper Transit Service Transportation Committee Town of Mount Pleasant. February 5, 2013
 CARTA East Cooper Transit Service Transportation Committee Town of Mount Pleasant February 5, 2013 Service Overview Study Overview East Cooper Service Analysis Provide additional analysis as a follow up
Integrating Community Development and Transportation Strategies. November 13, 2014
 R-B CORRIDOR 1970 R-B CORRIDOR TODAY Integrating Community Development and Transportation Strategies November 13, 2014 The Community Development Transportation Question Can communities support increased
FY2006 Budget Board Budget Committee request for information. Board Request: Detailed information on bus route 5A DC-Dulless Airport
 Board Request: Detailed information on bus route 5A DC-Dulless Airport Tracking Number: 29 Assigned to Dept/Office: OPER Contact Person: Jim Hughes Metrobus Route 5A was established in December 2000 in
Instances of 1 Minute or Less Between Buses 4 5% 55% 3.9% 3.5% 3.5% 3.5% 2.9% 2.8% Sep- Sep 07 Oct-07 Nov-07 Dec-07 Jan- Jan 08 Feb- Feb 08 Mar-08
 President s Report Monthly Performance Matrix Meeting or exceeding target Within 10% of target Missing target by more than 10% Measure does not have target RIDERSHIP Total Ridership p( (in millions) Rail
Central Florida Commuter Rail Commission Technical Advisory Committee. Meeting Minutes
 DRAFT Central Florida Commuter Rail Commission Technical Advisory Committee Meeting Minutes Date: Wednesday, February 4, 2015 Time: 1:30 p.m. Location: Florida Department of Transportation Orlando Urban
Regional Transportation Needs Within Southeastern Wisconsin
 Regional Transportation Needs Within Southeastern Wisconsin #118274 May 24, 2006 1 Introduction The Southeastern Wisconsin Regional Planning Commission (SEWRPC) is the official areawide planning agency
July 23, Transit Workshop
 Agenda 1. Introductions 2. Presentation: Public Transit in Regina Review of Practices Elsewhere 3. Discussion #1: Transit Today 4. Break 5. Discussion #2: Transit Tomorrow Corridors, Service, and Amenities
Fiscal Year Big Blue Bus Year End Performance Report
 Information Item Date: October 25, 2016 To: From: Subject: Mayor and City Council Edward F. King, Director of Transit Services Fiscal Year 2015-16 Big Blue Bus Year End Performance Report Introduction
Executive Summary. TUCSON TRANSIT ON BOARD ORIGIN AND DESTINATION SURVEY Conducted October City of Tucson Department of Transportation
 Executive Summary TUCSON TRANSIT ON BOARD ORIGIN AND DESTINATION SURVEY Conducted October 2004 Prepared for: City of Tucson Department of Transportation May 2005 TUCSON TRANSIT ON BOARD ORIGIN AND DESTINATION
Sustainable Transportation Plan Draft 4/24/2012
 Sustainable Transportation Plan 2011-2012 Draft 4/24/2012 Contents I. Purpose... 3 II. Background... 3 III. Recent Accomplishments... 6 IV. Anticipated Changes... 8 V. Planning Process... 8 VI. Priorities...
Transportation Infrastructure Systems Needs and Challenges: Progress Report
 Transportation Infrastructure Systems Needs and Challenges: Progress Report Alabama House Speaker Mac McCutcheon Justice Smyth Outreach Director Steven Polunsky TPRC Director Shashi Nambisan Executive
REPORT. RECOMMENDATION: 1. That the report on Pilot Results Free Transit for Seniors, dated October 25, 2012, from Oakville Transit be received.
 REPORT MEETING DATE: NOVEMBER 15, 2012 FROM: Oakville Transit DATE: October 25, 2012 SUBJECT: Pilot Results - Free Transit for Seniors LOCATION: Town Wide WARD: Town wide Page 1 RECOMMENDATION: 1. That
ITS-NY ANNUAL MEETING Bus Rapid Transit in New York City: Bus Lane Operations on One-Way Arterial Streets
 ITS-NY ANNUAL MEETING Bus Rapid Transit in New York City: Bus Lane Operations on One-Way Arterial Streets June 9, 2011 Ted Orosz AICP, Director Long Range Bus Planning MTA New York City Transit 1 Overview
BEAR CREEK PARK AND RIDE
 BEAR CREEK PARK AND RIDE 7760 178th Pl NE, Redmond, WA 98052 700 Average weekday transit boardings 283 Parking spaces Owned by King County Metro Served by Sound Transit and King County Metro Bear Creek