Dear Mr. Tweed: Sincerely, Min Zhou, P.E. Vice President
|
|
|
- Merilyn Owen
- 5 years ago
- Views:
Transcription

1 December 17, 2012 Mr. Steve Tweed City of Long Beach, Department of Public Works Traffic & Transportation Bureau, 10 th Floor City Hall 333 West Ocean Boulevard Long Beach, CA Subject: Broadway and Third Street Protected Bikeway 12-Month Before and After Study in the City of Long Beach Dear Mr. Tweed: KOA Corporation is pleased to present our study of before and after conditions for the protected bikeway demonstration project along Broadway and Third Street in the City of Long Beach. The protected bikeways were constructed as a demonstration project for Federal Highway Administration review. The 12-month Before and After analysis is presented in this report to evaluate Broadway and Third Street traffic conditions before and after implementation of the improvement measures. The attached report presents our findings and analysis. This report is being submitted to you for comment and review. Please contact me if you have any questions concerning the study methodology or analysis. It has been a pleasure to provide this study report to the City of Long Beach. Sincerely, Min Zhou, P.E. Vice President J:\2012\JB23052 LB 12 Mo After Study 3rd & Broadway\Documents\Report\JB23052_LB_Before_After_Study DOC

2 Broadway and Third Street Protected Bikeway Study Before and 12-Month After Conditions City of Long Beach December 2012 Prepared for: City of Long Beach Department of Public Works Traffic & Transportation Bureau 10 th Floor City Hall 333 West Ocean Boulevard Long Beach, CA Prepared by: 2141 West Orangewood Avenue, Suite A, Orange, CA / Phone Job No: JB23052
3 Table of Contents 1. EXECUTIVE SUMMARY EXECUTIVE SUMMARY BACKGROUND DESIGN CONCEPT ADA COMPLIANCE FHWA REVIEW PHYSICAL ROADWAY CONDITIONS BROADWAY ROADWAY CONDITIONS Broadway Before Implementation Broadway After Implementation THIRD STREET ROADWAY CONDITIONS Third Street Before Implementation Third Street After Implementation PEDESTRIAN AND BICYCLE USAGE BROADWAY PEDESTRIAN AND BICYCLE USAGE THIRD STREET PEDESTRIAN AND BICYCLE USAGE VEHICULAR TRAFFIC ANALYSIS ROADWAY SEGMENT TRAFFIC VOLUMES INTERSECTION PEAK HOUR TRAFFIC VOLUMES INTERSECTION OPERATIONS ANALYSIS SPEED AND BEHAVIORAL ANALYSIS TRAVEL TIME DELAY STUDY CRASH HISTORY CRASH HISTORY Broadway Crash History Third Street Crash History CRASH DATA COMPARISON BEFORE AND AFTER IMPLEMENTATION PARKING CONDITIONS PARKING BACKGROUND On-Street Parking Off-Street Parking PARKING ANALYSIS Parking Supply Inventory Parking Demand PARKING CONCLUSION DESIGN CONSIDERATIONS NON-STANDARD INTERSECTIONS Broadway at Alamitos Avenue Third Street at Alamitos Avenue Crossing Light Rail Lines at Pacific Avenue and at Long Beach Boulevard Access to Hydrants PEDESTRIAN IMPEDIMENTS DRAINAGE DRIVEWAY CONFLICTS SUMMARY AND CONCLUSIONS CONDITIONS BEFORE IMPLEMENTATION CONDITIONS AFTER IMPLEMENTATION i
4 List of Figures FIGURE 1.1 CHANGE IN OVERALL USE OF 3RD STREET AND BROADWAY 2 FIGURE 1.2 DECREASES IN BICYCLE AND VEHICLE COLLISIONS AND TH PERCENTILE TRAFFIC SPEEDS... 2 FIGURE 1.3 BICYCLE ACTIVITY ALONG BROADWAY, BEFORE AND AFTER IMPLEMENTATION... 4 FIGURE 1.4 CHANGES IN AM PEAK HOUR VOLUMES AFTER IMPLEMENTATION... 6 FIGURE 1.5 CHANGES IN PM PEAK HOUR VOLUMES AFTER IMPLEMENTATION... 7 FIGURE PROJECT AREA...12 FIGURE PROJECT STREET CROSS-SECTIONS...13 FIGURE 3.1 BROADWAY BEFORE IMPLEMENTATION...15 FIGURE 3.2 BROADWAY AFTER IMPLEMENTATION...15 FIGURE 3.3 PROJECT STREET CROSS-SECTIONS...16 FIGURE 3.4 THIRD STREET BEFORE IMPLEMENTATION...17 FIGURE 3.5 THIRD STREET AFTER IMPLEMENTATION...17 FIGURE 5.1 STUDY AREA INTERSECTION LOCATIONS...24 FIGURE 5.2 AM PEAK HOUR INTERSECTION VOLUMES, BEFORE IMPLEMENTATION...25 FIGURE 5.3 PM PEAK HOUR INTERSECTION VOLUMES, BEFORE IMPLEMENTATION...26 FIGURE 5.4 AM PEAK HOUR INTERSECTION VOLUMES, AFTER IMPLEMENTATION...27 FIGURE 5.5 PM PEAK HOUR INTERSECTION VOLUMES, AFTER IMPLEMENTATION...28 FIGURE 7.1 CRASH HISTORY RELATED TO BICYCLES, (ONE EXAMPLE) AFTER IMPLEMENTATION FIGURE 8.1 PUBLIC PARKING LOT LOCATIONS FIGURE 8.2 PARKING OCCUPANCY BY BLOCK FIGURE 9.1 DESIGN CONSIDERATIONS FOR BROADWAY AT ALAMITOS AVENUE FIGURE 9.2 DESIGN CONSIDERATIONS FOR THIRD STREET AT ALAMITOS AVENUE FIGURE 9.3 DESIGN CONSIDERATIONS FOR BROADWAY AT PACIFIC AVENUE FIGURE 9.4 DESIGN CONSIDERATIONS FOR BROADWAY BETWEEN MAGNOLIA AVENUE AND CHESTNUT AVENUE FIGURE 10.1 BICYCLE AND PEDESTRIAN COUNTS ON BROADWAY, BEFORE AND 12-MONTH AFTER IMPLEMENTATION FIGURE 10.2 BICYCLE AND PEDESTRIAN COUNTS ON THIRD STREET, BEFORE AND 12-MONTH AFTER IMPLEMENTATION ii
5 List of Tables TABLE 1.1 BICYCLE, PEDESTRIAN, AND VEHICLE ACTIVITY... 2 BEFORE AND AFTER IMPLEMENTATION... 2 TABLE 1.2 BICYCLE, PEDESTRIAN, AND VEHICLE ACTIVITY ON BROADWAY, BEFORE AND AFTER IMPLEMENTATION... 3 TABLE 1.3 BICYCLE, PEDESTRIAN, AND VEHICLE ACTIVITY ON THIRD STREET, BEFORE AND AFTER IMPLEMENTATION... 5 TABLE 4.2 PEDESTRIAN AND BICYCLE COUNTS, BROADWAY BETWEEN PACIFIC AVENUE AND PINE AVENUE, BEFORE AND AFTER IMPLEMENTATION...20 TABLE 4.3 PEDESTRIAN AND BICYCLE COUNTS, THIRD STREET BETWEEN LINDEN AVENUE AND ELM AVENUE, BEFORE AND AFTER IMPLEMENTATION...21 TABLE 4.4 PEDESTRIAN AND BICYCLE COUNTS, THIRD STREET BETWEEN PACIFIC AVENUE AND PINE AVENUE, BEFORE AND AFTER IMPLEMENTATION...22 TABLE 5.1 VEHICULAR TRAFFIC COUNTS ON BROADWAY AND THIRD STREET, BEFORE AND AFTER IMPLEMENTATION...23 TABLE 5.2 INTERSECTION OPERATIONS ANALYSIS RESULTS FOR BROADWAY, BEFORE AND AFTER IMPLEMENTATION...29 TABLE 5.3 INTERSECTION OPERATIONS ANALYSIS RESULTS FOR THIRD STREET, BEFORE AND AFTER IMPLEMENTATION...30 TABLE 6.1 TRAVEL TIME DELAY STUDY FOR BICYCLES ON BROADWAY AND THIRD STREET...32 TABLE 6.2 TRAVEL TIME DELAY STUDY FOR VEHICLES ON BROADWAY AND THIRD STREET...33 TABLE 7.1 SUMMARY OF THREE-YEAR VEHICLE, BICYCLE, AND PEDESTRIAN CRASH HISTORY ON BROADWAY AND THIRD STREET. 36 TABLE 7.2 THREE-YEAR CRASH EXPERIENCE ON BROADWAY AND THIRD STREET, BEFORE AND AFTER IMPLEMENTATION TABLE 8.1 PARKING SUPPLY ON BROADWAY TABLE 8.2 PARKING SUPPLY ON THIRD STREET TABLE 10.1 BICYCLE, PEDESTRIAN, AND VEHICLE ACTIVITY ON BROADWAY AND THIRD STREET, BEFORE AND AFTER IMPLEMENTATION Appendices Appendix 4.1 Bicycle Count Data Sheets Appendix 4.2 Pedestrian Count Data Sheets Appendix 5.1 Vehicular Traffic Count Data Sheets Appendix 5.2 Intersection Operations Analysis Worksheets for Conditions Before Project Implementation Appendix 5.3 Intersection Operations Analysis Worksheets for Conditions 12-Months After Project Implementation Appendix 6.1 Speed Survey Data Sheets Appendix 7.1 Crash History Data Sheets iii
6 1. Executive Summary 1. Executive Summary 1.1 Executive Summary In April 2011 the City of Long Beach installed two one-way cycle tracks (aka separated lanes) on Broadway and 3 rd Streets, which transect the heart of the downtown area. The project provides one-way bikeways along the left side of each street, separated from traffic by a parking lane and a raised curb. One traffic lane was removed to accommodate the protected bike lane. Traffic signals were also modified at most intersections to provide bicycle signals and left turn arrows for vehicle traffic. The FHWA requires a 12-month Before and After study to review the effects these changes have had on bicycle, pedestrian, and vehicle conditions along the two streets. This study therefore provides a technically comprehensive report to compare baseline conditions before construction of the cycle tracks with conditions after implementation of the project. The study is intended to not only meet the FHWA 12-month study requirement but also to provide a review of design issues beyond those approved in the Permission to Experiment. The two project streets, Broadway and Third Street between Magnolia Avenue and Alamitos Avenue are both one-way streets each approximately one mile long, with 11 and 12 signalized cross intersections respectively. Before implementing the protected bikeway project, both Broadway and Third Street had three travel lanes with parking on both sides of the street. With implementation of the protected bikeway project in April 2011, both streets now provide a one-way bikeway along the left side of the one-way street, separated from traffic by a parking lane and a raised curb. The protected bikeway project also modified traffic signals at most intersections to provide bicycle signals and to install left turn arrows for motorists turning across the bike lane and across the adjacent pedestrian crosswalk. Implementation of the protected bikeway project on 3rd and Broadway resulted in a 33% overall increase in the number of bicyclists using the two streets. At the same time there has been a nearly 60% decrease in the total number of bike and pedestrian related collisions, and a 30% decrease in the number of bicyclists on the sidewalk. The two streets have also experienced a 13% increase in the number of pedestrians since implementation of the project. While the amount of bicycle and pedestrian activity on the two streets has increased significantly, vehicle traffic volumes and speeds are down since project implementation. Peak hour traffic counts are down by 12%, while 85th percentile traffic speeds have dropped on both streets. On 3rd Street, traffic speeds have dropped from 36 mph to 27 mph, and on Broadway speeds have gone from 30 mph to 26 mph. An additional benefit of the project has been a reduction in collision rates. Prior to implementation, there had been an average of 6 bicycle-related collisions per year on the two streets. In the 1 year post-implementation study period just 3 bicycle-related collisions have occurred. Traffic accidents are also down. Rates for vehicle crashes dropped by nearly 25% after project implementation, from an average of about 70 per year for the previous three years to 53 per year during the one-year study period. Table 1.1 summarizes the changes in bicycle, pedestrian, and vehicle activity on the two streets. 1
7 1. Executive Summary Table 1.1 Bicycle, Pedestrian, and Vehicle Activity Before and After Implementation FIGURE 1.1 CHANGE IN OVERALL USE OF 3RD STREET AND BROADWAY Measure Total Bicycle Volume Total Pedestrian Volume Before Implementation 437 (6 Hours) 3,451 (6 Hours) After Implementation 583 (6 Hours) +33% 3,892 (6 Hours) +13% 7,000 6,000 5,000 4,000 3,451 3,892 6,300 5,550 Total Traffic Volume 6,300 (6 Hours) 5,550 (6 Hours) -12% 3, th Percentile Traffic Speed 36 mph (3 rd Street) 30 mph (Broadway) 27 mph (3 rd Street) 26 mph (Broadway) Bike-Related Collisions 6 Crashes per Year 3 Crashes per Year 2,000 1, Vehicle Crashes 69 per Year 53 per Year Figure 1.1 illustrates the change in overall use of 3 rd Street and Broadway by bicyclists, pedestrians, and vehicles. 0 Total Bicycle Volume (6 hours) Total Pedestrian Volume (6 hours) Before Implementation After Implementation Total Traffic Volume (6 hours) Figure 1.2 shows the decrease in bicycle and vehicle collisions, and the decrease in 85 th percentile traffic speeds. FIGURE 1.2 DECREASES IN BICYCLE AND VEHICLE COLLISIONS AND 85 TH 2
8 1. Executive Summary PERCENTILE TRAFFIC SPEEDS average). This indicates conditions for cyclists are safer with the new configuration Table 1.2 Bicycle, Pedestrian, and Vehicle Activity on Broadway, Before and After Implementation th Percentile Traffic Speed (mph) (3rd Street) th Percentile Traffic Speed (mph) (Broadway) Before Implementation 6 3 Bike-Related Accidents (per year) After Implementation Vehicle Accidents (per year) Table 1.2 summarizes the levels of bicycle, pedestrian, and vehicle activity on Broadway prior to and after implementation. The number of crashes involving bicycles is also documented in this table. As shown in Table 1.2, average daily traffic volume on Broadway has decreased by about 700 per day since implementation. Peak hour traffic volumes have decreased by about 1,000 in six hours. The reason may be the decreased speed caused by the travel lane reduction. Bicycle volumes have increased by about 20%. Pedestrian volumes have also increased, perhaps indicating a public perception of a more pedestrian friendly environment. Three reported bicycle crashes have occurred over the 1- year trial period after implementation, compared with twelve crashes over the 3-year period prior to implementation (approximately four per year on Measure Before Implementation After Implementation Average Daily Traffic Volume 13,100/day (average) 12,400/day (average) Traffic Volume (6 Hours) 6,800 5,800 Bicycle Volume (6 Hours) Pedestrian Volume (6 Hours) 1,946 2,296 Traffic Speed (85 th Percentile) 30 MPH 26 MPH Bicycle Crashes 12 (over 3 years) 3 (in one year) Figure 1.3 illustrates the bicycle volumes and distribution along the street before and after implementation of the project. The bicycle data includes six hours of counts (7am-9am, 11am-1pm, & 4pm-6pm) at two locations along Broadway. As shown in Figure 1.3, the total bicycle volume on Broadway has increased from 239 to 283 after implementation, representing a growth of nearly 20%. More importantly, there are far fewer bicyclists riding on the sidewalk now, 39% comparing to 62% before implementation. Our study data also shows that the majority of the remaining 39% of cyclists riding on the sidewalk are 3

9 1. Executive Summary riding in the opposite direction of traffic, as Broadway is a one way street. The reduction in bicycle volume on the sidewalk results in less conflict and therefore a safer travel environment for both pedestrians and bicyclists. FIGURE 1.3 BICYCLE ACTIVITY ALONG BROADWAY, BEFORE AND AFTER 350 IMPLEMENTATION 300 # of Cyclists in 6 Hour/Day Looking east on Broadway east of The Promenade. A cyclist rides on the protected bikeway Cyclists on Sidewalk Cyclists on Street / Cyclists in Protected Lane Before (239) After (283) Note 1: % on Sidewalk: Before 62%, After 39% Note 2: Data collected in 6 Hours/Day Total Bicycle Volumes along Broadway in 6 Hours/Day Timeline Cyclists on Street / Cyclists in Protected Lane Cyclists on Sidewalk Total Cyclist Percent Cyclist on Sidewalk Before (239) % After (283) % * Both Before & After bicycle data was collected from 7am-9am, 11am-1pm, and 4pm to 6 pm on a Thursday along Broadway between Linden Avenue and Elm Avenue, and between Pacific Avenue and Pine Avenue. 4

10 1. Executive Summary Table 1.3 summarizes the levels of bicycle, pedestrian, and vehicle activity along Third Street prior to and after implementation of the project. Gains in overall bicycle volumes are higher on Third Street than on Broadway after implementation of the project. Table 1.3 Bicycle, Pedestrian, and Vehicle Activity on Third Street, Before and After Implementation Measure Before Implementation After Implementation Average Daily Traffic Volume 9,900/day (average) 9,800/day (average) Traffic Volume (6 Hours) 5,800 5,300 Bicycle Volume (6 Hours) Pedestrian Volume (6 Hours) 1,505 1,596 Traffic Speed (85 th Percentile) 36 MPH 27 MPH Bicycle Crashes 7 (over 3 years) 0 (in one year) As shown in Table 1.3, average daily traffic volume on Third Street has remained about the same since implementation of the project. Peak hour traffic volume has decreased by about 100 per hour. Bicycle volumes have increased by about 50% (102 in 6 hours). Pedestrian volumes have decreased slightly. Bicycle crashes have decreased from seven over a 3-year period (approximately two per year on average), to none over the 1-year trial period. As with Broadway, the crash record for Third Street may indicate conditions for cyclists are safer with the new configuration. Although traffic volumes have decreased or remained about the same on both Broadway and Third Street, volumes are consistently higher on Broadway than on Third Street by about 2,500 to 3,000 per day. Looking east on Third Street at The Promenade Figures 1.4 and 1.5 show the changes in AM and PM peak hour traffic volumes, respectively. 5
11
12
13 1. Executive Summary Figure 1.6 provides an illustration of bicycle volumes and distribution along Third Street before and after implementation of the project. The bicycle data includes 6 hours of counts (7am-9am, 11am-1pm, & 4pm-6pm) at two locations along Third Street. As shown in Figure 1.6, the total bicycle volume on Third Street has increased from 198 to 300 after implementation, representing a 52% growth in bicyclist usage. There are also far fewer bicyclists riding on the sidewalk now than before implementation, 30% now comparing to 69% before. Our study data also shows that the majority of the remaining 30% of cyclists riding on the sidewalk are riding in the opposite direction of traffic, since Third Street is a one way street. Observations were made of bicyclist and motorist compliance with the new street/bikeway configuration on Broadway and Third Street, and its associated controls and regulations, as well as crashes involving bicyclists, pedestrians, and vehicles. No bike-vehicle crashes/conflicts and no crashes related to bicycle/pedestrian signals were recorded in the 48-hour video observations. There were no observed conflicts related to left-turn vehicles/arrows, or bicycle/pedestrian conflicts involving parked vehicles. Vehicle compliance with left turn arrows was 100% during the observation period. Bicyclists were observed to comply with bike signals and most bicycles stayed in the protected lanes while they crossed the intersection. FIGURE 1.6 BICYCLE ACTIVITY ALONG THIRD STREET, BEFORE AND AFTER # of Cyclists in 6 Hour/Day Cyclists on Sidewalk Cyclists on Street / Cyclists in Protected Lane IMPLEMENTATION Total Bicycle Volumes along Third Street in 6 Hours/Day Timeline Cyclists on Street / Cyclists in Protected Lane Cyclists on Sidewalk Total Cyclist Percent Cyclists on Sidewalk Before (198) % 91 Before (198) After (300) Note 1: % on Sidewalk: Before 69%, After 30% Note 2: Data collected in 6 Hours/Day After (300) % * Both Before & After bicycle data was collected from 7am-9am, 11am-1pm, and 4pm to 6 pm on a Thursday along Third Street between Linden Avenue and Elm Avenue, and between Pacific Avenue and Pine Avenue. 8

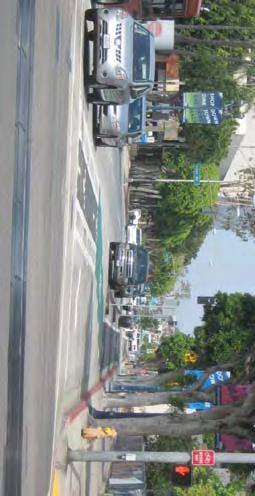
14 1. Executive Summary The 85 th percentile speed of vehicles on Third Street has decreased from 36 mph before implementation of the project to 27 mph after implementation. The appendices of this report contain background materials for this study. These materials include traffic volumes, bicycle volumes, pedestrian counts, observations, and speed survey data. Typical design for the protected bikeway. Bikes and vehicles going through Third & Broadway stop for cross street traffic 9

 s Request to Experiment (RTE) approval to be a demonstration project.")
15 2. Background 2. Background 2.1 Design Concept KOA Corporation (KOA) is evaluating the outcome of implementing protected bikeways adjacent to the inner (left) travel lanes along Broadway and Third Street in the City of Long Beach. In April 2011, the protected lanes were constructed after obtaining the Federal Highway Administration (FHWA) s Request to Experiment (RTE) approval to be a demonstration project. The goal of this experimental project is to test the feasibility of providing protected bikeways on existing streets, and to facilitate and encourage the increased usage of bicycling as a significant mode of transportation throughout the City. Protected bikeways, aka cycle tracks, are on-street exclusive bicycle facilities physically separated from vehicular traffic, parking, and sidewalks. They are generally developed along arterial streets to provide a safe riding environment for bicyclists. Protected bikeways are intended to serve as high-quality bicycle routes for cyclists who are reluctant to ride with the general traffic flow on an arterial roadway. Strong directional and informational signage or signals are generally provided to clearly delineate protected bikeways as an important part of a larger citywide bikeway system. Protected bike lane located on the left side of the roadway in New York City Buffered bike lane located on the right side of the roadway in San Francisco This design concept is new in Southern California; however, protected bikeways already exist in several communities throughout the United States and Europe. New York City, Washington D.C., Portland, Oregon, and San Francisco are among the cities that have recently implemented protected bikeway projects. New York City s Ninth Avenue Bicycle Path and 10
16 2. Background Complete Street project, implemented by NYC DOT in 2007, created the first urban on-street parking- and signal-protected bicycle facility in the United States. Washington, D.C. s 15th Street NW separated bike lanes allow for contra-flow bicycle traffic. Portland now has two cycle tracks, a 1/3 mile facility along Broadway, and a 2/3 mile facility along Cully Boulevard. San Francisco s first parking-protected bikeway is located along John F. Kennedy Drive in Golden Gate Park. Protected bikeways are being considered in other cities in California, but the Broadway/Third Street project is the first to be implemented in Southern California. Requests for additional protected bikeways are expected to follow the initial deployment. 2.2 ADA Compliance According to the FHWA's "Questions and Answers about ADA/Section 504" website, public agencies must provide pedestrian access to the agency's streets and sidewalks for persons with disabilities as part of any construction or alteration of a facility that provides access to pedestrians. The current Public Rights-of-Way Accessibility Guidelines (PROWAG), dated November 1999, acknowledges that the AADAG (ADA Accessibility Guidelines manual) "does not contain technical specifications for accessible parallel parking". Even among informal guidelines, no approved guidelines for parallel parking on the left side of a one-way street are available at the Federal or state level. The Protected Bikeways project effectively relocated the curbside parking on the left side of the roadways to the new curbside location 9 to 12 feet to the right. A disabled passenger transferring to a wheelchair on the right side of a parked vehicle would have the same level of accessibility as is typical with any left hand parallel parking space, consisting of an access route alongside a lane of moving traffic to curb ramps at an intersection. A disabled motorist transferring from a driver's seat on the left side of a parked vehicle to a wheelchair would be doing so on the bikeway shoulder at street pavement level, similar to an action performed with parallel parking on the right side of a roadway. Therefore, the Protected Bikeways project offers accessibility to sidewalks that is comparable to that provided by parallel parking spaces typically provided on either the left or right side of streets. 2.3 FHWA Review FHWA requests one before and two after studies (6-month and 12- month) as part of the experimental approval process. Upon FHWA approval of the demonstration, the City of Long Beach therefore began a comprehensive analysis of bicycle usage of the project area to document the effects of the changes. The 6-month study (Broadway and Third Street Protected Bikeway Study Before and 6-Month After Conditions) was completed in February This report documents the data comparison for the 12-month after study in comparison with the before study submitted in November The Before and After study presents levels of bicycle volume, pedestrian volume, traffic volume, vehicle speed, and specific usage patterns of the new bicycle facilities. The study also documents the safety record of the protected bikeway facility in comparison to pre-project conditions. 11

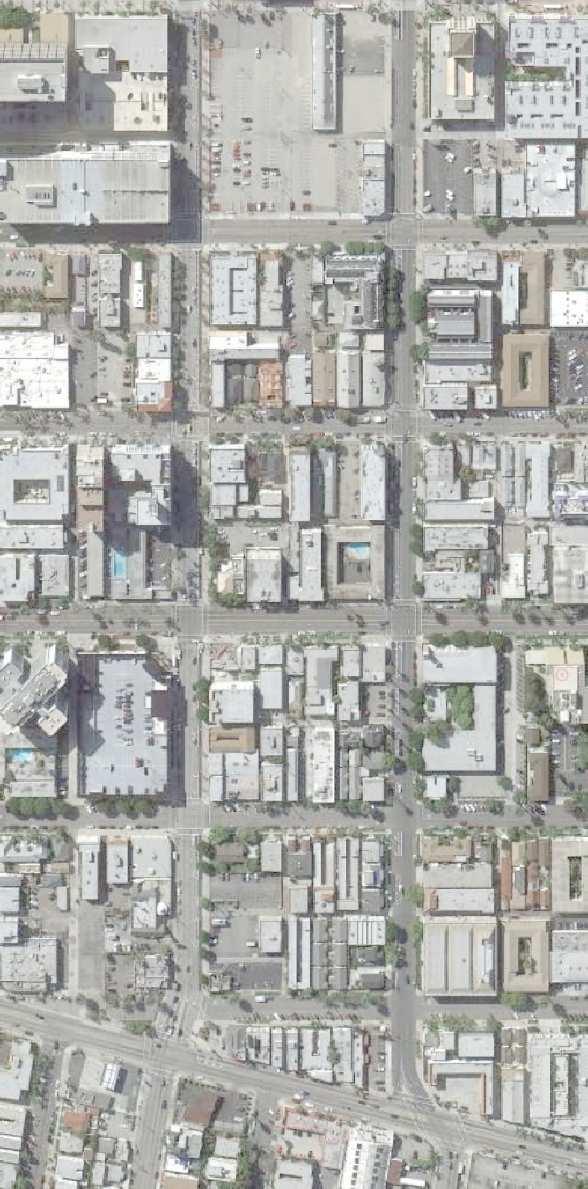
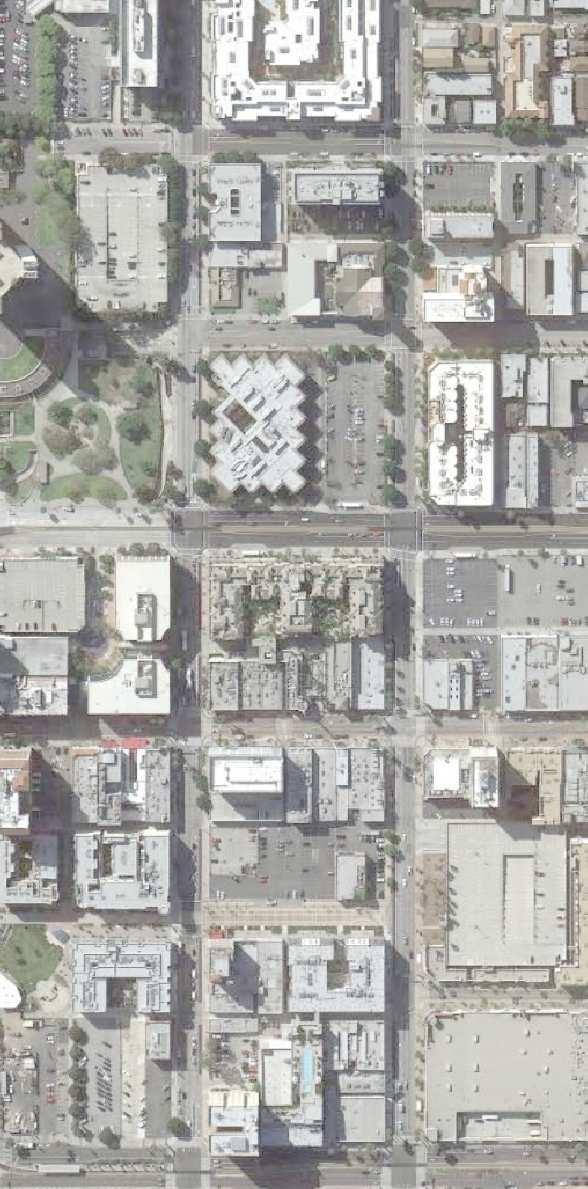
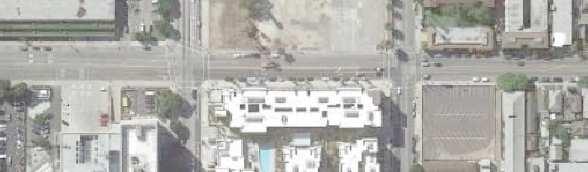
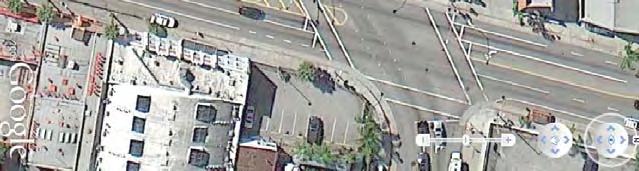
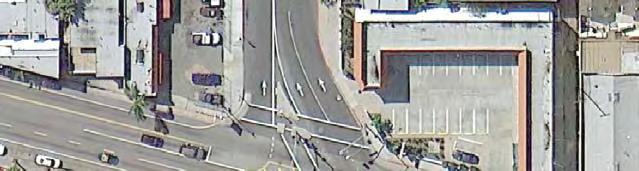
17 2. Background Figure 2.1 shows a map of the project area. FIGURE PROJECT AREA Figure 2.2 provides a typical cross-section drawing of Broadway and Third Street before and after implementation of the project. The typical crosssections show the roadway configuration before and after implementation of the project. As implemented, the project consists of a one-way bicycle lane westbound along Third Street and eastbound along Broadway, separated from the traffic lanes by a raised curb and parking lane. This separation results in an east-west bikeway with minimum exposure to other traffic through downtown Long Beach. Furthermore, treatments to enhance bicyclist safety have been implemented at the intersections along the project corridor. The Broadway/Third Street Before and After study evaluated data on the following street segments of these corridors: Broadway between Magnolia Avenue and Alamitos Avenue Third Street between Magnolia Avenue and Alamitos Avenue This report summarizes the levels of bicycle, pedestrian, and vehicle activity; specific usage patterns; and other factors to evaluate the effectiveness of implementing the protected bikeway project. The study includes an effectiveness evaluation of improving bicycle safety while maintaining adequate traffic flow. 12
18 2. Background FIGURE PROJECT STREET CROSS-SECTIONS 13

19 2. Background Typical design configuration for the protected bikeway; Bikes and vehicles going through Third Street & Broadway have green lights 14
: Pacific Avenue, Long Beach Boulevard, Atlantic Avenue, and Alamitos Avenue.")

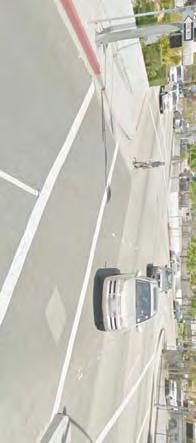
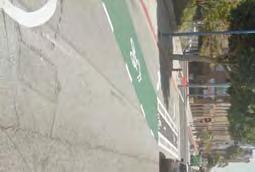
20 3. Physical Roadway Conditions 3. Physical Roadway Conditions 3.1 Broadway Roadway Conditions Broadway is a one-way eastbound arterial street traversing a commercial/business district in the project vicinity. Several major streets cross Broadway in the project area, including (listed west to east): Pacific Avenue, Long Beach Boulevard, Atlantic Avenue, and Alamitos Avenue. The Long Beach Civic Center is located on the south side of Broadway between Magnolia Avenue and Pacific Avenue. There are Metro Blue Line light rail crossings of Broadway at Pacific Avenue and Long Beach Boulevard. The crossings are controlled by traffic signals, not railroad gates. The segment of Broadway included in the protected bikeway project is approximately one mile long. Figures 3.1 and 3.2 present a street-level view of Broadway before and after implementation of the project Broadway Before Implementation Prior to the start of the project, Broadway had a typical width of 52 feet in the project vicinity. The typical cross-section of the street was three eastbound lanes, no bike lane, and sidewalks on both sides of the street. There was no significant curvature or gradient along the street in the project area. Limited 24-minute curb parking was allowed on both sides of the street. No curb extensions, textured paving, or other devices designed to slow traffic or improve pedestrian conditions existed. Traffic signals were present along Broadway at Magnolia, Pacific, Pine, Long Beach Boulevard, Elm, Linden, Atlantic, and Alamitos. These signals used twophase operation along Broadway, without left-turn signal phases. Pedestrian push buttons for north and south crosswalks, ramps, and parallel-bar style crosswalks were present. The street was posted with a speed limit of 30 mph. FIGURE 3.2 BROADWAY AFTER IMPLEMENTATION FIGURE 3.1 BROADWAY BEFORE IMPLEMENTATION Parallel parking along the north side of Broadway at Elm Avenue Cycle track on the north (left) side of Broadway and a modified signal at Elm Avenue 15
21 3. Physical Roadway Conditions Broadway After Implementation The project now provides a one-way bikeway located on the left side of the street, separated from traffic by a parking lane. The design required the elimination of one travel lane in order to provide space for the bicycle lane and the buffer area while maintaining most of the left side parking. Twentyeight out of a total of 180 parking spaces were removed on Broadway as a result of the project. The before and after project configuration of each street is shown in Figure 3.3 below. The cross-section of the street in the project area is now a 9-foot protected bike lane, 5-foot buffer, 8-foot parking lane, two 11-foot eastbound traffic lanes, and an 8-foot parking lane on the right side of the street. Sidewalks on both sides of the street remained unmodified. Traffic at signalized intersections is now controlled by bicycle signals and by left turn arrows for motorists turning across the bike lane and across the adjacent pedestrian crosswalk. The street is posted with a speed limit of 30 mph. FIGURE 3.3 PROJECT STREET CROSS-SECTIONS 16


22 3. Physical Roadway Conditions 3.2 Third Street Roadway Conditions Third Street is a one-way westbound arterial street located one block (approximately 1/10 mile) north of Broadway. The segment of Third Street included in the protected bikeway project is approximately one mile long. Figures 3.4 and 3.5 present a street-level view of Third Street before and after implementation of the project. FIGURE 3.4 THIRD STREET BEFORE IMPLEMENTATION Alamitos, Atlantic, Linden, Elm, Long Beach Boulevard, Pine, Pacific, and Magnolia. These signals used two-phase operation. The posted speed limit on Third Street was 30 mph Third Street After Implementation The project provides a protected bikeway on the left side of the street, separated from traffic by a raised curb and parking lane. One vehicle travel lane was removed. Twenty parking spaces out of a total of 184 were taken out on Third Street. The cross-section of the street and traffic signal control, phasing and protection is now the same as described above for Broadway. The 30 mph speed limit has been retained. FIGURE 3.5 THIRD STREET AFTER IMPLEMENTATION Parallel parking located along the south side of Third Street at Long Beach Boulevard Third Street Before Implementation Third Street had a three-lane cross-section with a typical width of 52 feet. There were sidewalks but no bike lanes. Curb parking was allowed on both sides of the street. Traffic signals were present along Third Street at Protected bikeway on the south (left) side of Third Street at Long Beach Boulevard 17

23 4. Pedestrian and Bicycle Usage 4. Pedestrian and Bicycle Usage This section compares the before conditions prior to implementation of the protected bikeways with the after conditions, twelve months after project completion. The following information is included in the before and after evaluation of bicycle, pedestrian, and traffic conditions along Broadway and Third Street: Bikes on Sidewalk Bikes in Protected Lane Wrong-Way Bikes in Protected Lanes Bikes in Vehicle Lanes Skateboarders on Sidewalk Skateboarders on Street Electric Wheelchairs Pedestrian Volume Vehicle Volume Average Vehicle Speed Crashes or Observable Conflicts Involving Vehicles and Bicycles Pacific and Pine were chosen to represent the more commercial portion. As you will see from the data the more residential areas have higher numbers of bicyclists but lower numbers of pedestrians than the more commercial areas. 48-hour video traffic volume counts and bicycle and pedestrian surveys were conducted along these street segments to determine the levels of bicycle, pedestrian, and vehicle activity and associated conditions along Broadway and Third Street, prior to and subsequent to implementation of the project. Pedestrian and bicycle volumes were documented from the video recordings at mid-block locations along Broadway for the AM, Midday, and PM peak periods. Skateboarders and electric wheelchairs were also included in the peak hour counts. Appendix 4.1 includes the count data sheets for bicycles, and Appendix 4.2 contains the count data sheets for pedestrians. Four street segments were used for the evaluation: Broadway between Elm Avenue and Linden Avenue Broadway between Pacific Avenue and Pine Avenue Third Street between Elm Avenue and Linden Avenue Third Street between Pacific Avenue and Pine Avenue These sections were chosen as representative parts of the bikeway. In general the two streets are more commercial to the west and more residential to the east. The sections between Elm and Linden were chosen to represent the more residential portion whereas the sections between Looking east on Broadway at Promenade; two cyclists ride on the protected bikeway, but one of them rides the wrong way; a skateboarder is on the sidewalk 18


24 4. Pedestrian and Bicycle Usage 4.1 Broadway Pedestrian and Bicycle Usage Table 4.1 summarizes levels of bicycle, pedestrian, and other activities along Broadway between Elm Avenue and Linden Avenue before and after implementation of the project. The total number of bicyclists has increased by 13%, while there has been a 41% decrease in the number of bicyclists riding on the sidewalk and in the street. The number of pedestrians increased by about 35%. Table 4.1 Pedestrian and Bicycle Counts, Broadway between Linden Avenue and Elm Avenue, Before and After Implementation A cyclist rides in the vehicular lane on the opposite side of the protected bikeway on Broadway at Atlantic Avenue Count Date Before Implementation (Thursday, 6/10/2010) After Implementation (Thursday, 6/7/2012) Description 7 AM - 9 AM 11 AM - 1 PM 4 PM - 6 PM 6-Hour 7 AM - 9 AM 11 AM - 1 PM 4 PM - 6 PM 6-Hour Male Female Total Male Female Total Male Female Total Total Male Female Total Male Female Total Male Female Total Total Pedestrians Bikes on Sidewalk Bikes in Protected Lane n/a n/a n/a n/a n/a n/a n/a n/a n/a n/a Wrong-Way Bikes in Protected Lane n/a n/a n/a n/a n/a n/a n/a n/a n/a n/a Bikes on Street in Vehicle Lanes Skateboarders on Sidewalk Skateboarders on Street Electric Wheelchairs Overall Total ,061 Total Cyclists


25 4. Pedestrian and Bicycle Usage Table 4.2 summarizes levels of specific bicycle, pedestrian, and other activities along Broadway between Pacific Avenue and Pine Avenue before and after implementation of the project. The total number of bicyclists has increased by 27%, while the number of pedestrians has increased by about 12%. There has also been a significant decrease in the number of bicyclists riding in the street, apparently preferring to ride in the protected bikeway instead. The number of bicyclists riding on the sidewalk stayed the same. Table 4.2 Pedestrian and Bicycle Counts, Broadway between Pacific Avenue and Pine Avenue, Before and After Implementation Count Date Before Implementation (Monday, 6/14/2010) Cyclists ride on the protected bikeway on Broadway near Linden Avenue After Implementation (Monday, 6/4/2012) Description 7 AM - 9 AM 11 AM - 1 PM 4 PM - 6 PM 6-Hour 7 AM - 9 AM 11 AM - 1 PM 4 PM - 6 PM 6-Hour Male Female Total Male Female Total Male Female Total Total Male Female Total Male Female Total Male Female Total Total Pedestrians , ,449 Bikes on Sidewalk Bikes in Protected Lane n/a n/a n/a n/a n/a n/a n/a n/a n/a n/a Wrong-Way Bikes in Protected Lane n/a n/a n/a n/a n/a n/a n/a n/a n/a n/a Bikes on Street in Vehicle Lanes Skateboarders on Sidewalk Skateboarders on Street Electric Wheelchairs Overall Total , ,580 Total Cyclists

26 4. Pedestrian and Bicycle Usage 4.2 Third Street Pedestrian and Bicycle Usage Table 4.3 summarizes levels of specific bicycle, pedestrian, and other activities along Third Street between Elm Avenue and Linden Avenue before and after implementation of the project. Bicyclists are using the protected bikeway instead of riding on the sidewalk and in the street. The total number of bicyclists has increased by 49% and the number on the sidewalk has decreased by 38%. Table 4.3 Pedestrian and Bicycle Counts, Third Street between Linden Avenue and Elm Avenue, Before and After Implementation A cyclist rides on the protected bikeway on Third Street at The Promenade, and another cyclist rides in the opposite direction on the sidewalk on the other side of the street Count Date Before Implementation (Friday, 6/11/2010) After Implementation (Friday, 6/8/2012) Description 7 AM - 9 AM 11 AM - 1 PM 4 PM - 6 PM 6-Hour 7 AM - 9 AM 11 AM - 1 PM 4 PM - 6 PM 6-Hour Male Female Total Male Female Total Male Female Total Total Male Female Total Male Female Total Male Female Total Total Pedestrians Bikes on Sidewalk Bikes in Protected Lane n/a n/a n/a n/a n/a n/a n/a n/a n/a n/a Wrong-Way Bikes in Protected Lane n/a n/a n/a n/a n/a n/a n/a n/a n/a n/a Bikes on Street in Vehicle Lanes Skateboarders on Sidewalk Skateboarders on Street Electric Wheelchairs Overall Total , Total Cyclists

27 4. Pedestrian and Bicycle Usage Table 4.4 summarizes levels of bicycle, pedestrian, and other activities along Third Street between Pacific Avenue and Pine Avenue before and after implementation of the project. Bicyclists are using the protected bikeway, causing a decrease in the number of cyclists riding on the sidewalk and in the street. The total number of bicyclists has increased by 58%, and the number of pedestrians has increased by about 47%, indicating a more userfriendly environment for both groups. Table 4.4 Pedestrian and Bicycle Counts, Third Street between Pacific Avenue and Pine Avenue, Before and After Implementation A cyclist rides on the protected bikeway on Third Street west of Lime Avenue Count Date Before Implementation (Tuesday, 6/15/2010) After Implementation (Tuesday, 6/5/2012) Description 7 AM - 9 AM 11 AM - 1 PM 4 PM - 6 PM 6-Hour 7 AM - 9 AM 11 AM - 1 PM 4 PM - 6 PM 6-Hour Male Female Total Male Female Total Male Female Total Total Male Female Total Male Female Total Male Female Total Total Pedestrians Bikes on Sidewalk Bikes in Protected Lane n/a n/a n/a n/a n/a n/a n/a n/a n/a n/a Wrong-Way Bikes in Protected Lane n/a n/a n/a n/a n/a n/a n/a n/a n/a n/a Bikes on Street in Vehicle Lanes Skateboarders on Sidewalk Skateboarders on Street Electric Wheelchairs Overall Total ,042 Total Cyclists
28 5. Vehicular Traffic Analysis 5. Vehicular Traffic Analysis This section presents the vehicular traffic volumes before and after implementation of the project. Intersection peak hour operations analysis was conducted for the study area intersections. 5.1 Roadway Segment Traffic Volumes Vehicular traffic counts were conducted before and after implementation of the project along Broadway and Third Street at the following four street segments: Broadway between Elm Avenue and Linden Avenue Broadway between Cedar Avenue and Pacific Avenue Third Street between Elm Avenue and Linden Avenue Third Street between Cedar Avenue and Pacific Avenue For Before Implementation conditions, average daily traffic volume on Broadway was about 11,700 per day (about 1,700 in the peak hour) between Elm Avenue and Linden Avenue, and about 14,350 per day (about 1,400 in the peak hour) between Cedar Avenue and Pacific Avenue. For 12- Month After Implementation conditions, average daily traffic volume on Broadway is now about 11,300 per day (about 1,300 in the peak hour) between Elm Avenue and Linden Avenue and about 13,600 per day (about 1,100 in the peak hour) between Cedar Avenue and Pacific Avenue. The Average Daily Traffic (ADT), AM peak hour, and PM peak hour traffic volumes are summarized in Table 5.1 for Broadway and Third Street. Table 5.1 Vehicular Traffic Counts on Broadway and Third Street, Before and After Implementation Street Segment Location Broadway between Elm Avenue and Linden Avenue Broadway between Cedar Avenue and Pacific Avenue Third Street between Elm Avenue and Linden Avenue Third Street between Cedar Avenue and Pacific Avenue Before Implementation (Thursday, 6/10/2010) AM Peak Hour PM Peak Hour Daily Traffic After Implementation (Thursday, 6/7/2012) AM Peak Hour PM Peak Hour Daily Traffic 533 1,704 11, ,335 11, ,375 14, ,108 13,572 1, ,308 1, ,375 1, ,409 1, ,167 Appendix 5.1 includes the vehicular traffic count data sheets conducted in June,

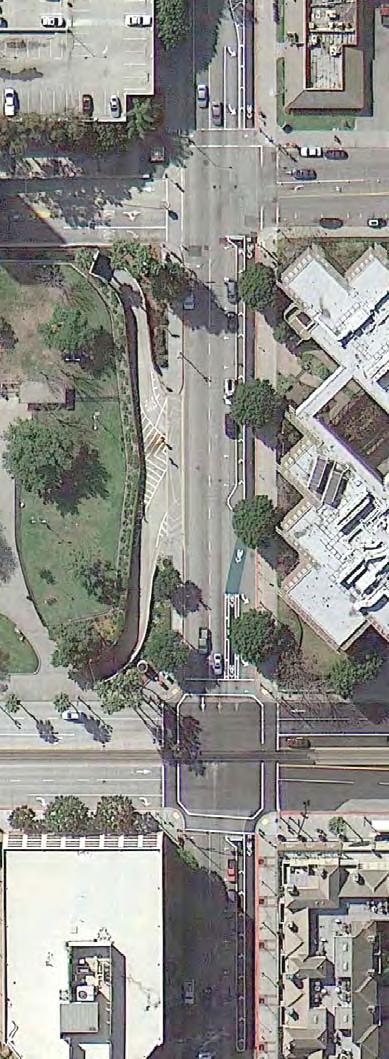
29 5. Vehicular Traffic Analysis 5.2 Intersection Peak Hour Traffic Volumes Vehicular AM and PM peak hour intersection traffic counts were conducted before and after implementation of the project at the following 23 intersections along Broadway and Third Street, as shown on Figure 5.1: Broadway and Magnolia Avenue Broadway and Chestnut Avenue Broadway and Cedar Avenue Broadway and Pacific Avenue Broadway and Pine Avenue Broadway and The Promenade Broadway and Long Beach Boulevard Broadway and Elm Avenue Broadway and Linden Avenue Broadway and Atlantic Avenue Broadway and Lime Avenue Broadway and Alamitos Avenue Third Street and Magnolia Avenue Third Street and Chestnut Avenue Third Street and Cedar Avenue Third Street and Pacific Avenue Third Street and Pine Avenue Third Street and The Promenade Third Street and Long Beach Boulevard Third Street and Elm Avenue Third Street and Linden Avenue Third Street and Atlantic Avenue Third Street and Alamitos Avenue FIGURE 5.1 STUDY AREA INTERSECTION LOCATIONS Figures 5.2 and 5.3 show the AM and PM peak hour intersection traffic counts for conditions before the implementation of the project. Figures 5.4 and 5.3 show the AM and PM peak hour intersection traffic counts for conditions 12 months after implementation of the project. The intersection counts were collected in June, Intersection traffic count data sheets for 2012 conditions are included in Appendix 5.1 of this report. 24
30
31
32
33

34 5. Vehicular Traffic Analysis 5.3 Intersection Operations Analysis Intersection AM and PM peak hour operations analysis was conducted for the study area intersections, for before and after implementation of the project conditions. Tables 5.2 and 5.3 summarize the intersection operations analysis results for study area intersections along Broadway and Third Street, respectively. As shown on Table 5.2, all the study area intersections on Broadway are operating at Level of Service C or better. Appendices 5.2 and 5.3 include the intersection operations analysis worksheets for conditions before and 12 months after implementation of the project, respectively. No Table 5.2 Intersection Operations Analysis Results for Broadway, Before and After Implementation Intersection 1 Broadway and Magnolia Ave 2 Broadway and Chestnut Ave Broadway and Cedar Ave 4 Broadway and Pacific Ave 5 Broadway and Pine Ave 6 Broadway and The Promenade 7 Broadway and Long Beach Blvd 8 Broadway and Elm Ave 9 Broadway and Linden Ave 10 Broadway and Atlantic Ave Broadway and Lime Ave Broadway and Alamitos Ave Peak Before After Hour Delay (Sec) LOS Delay (Sec) LOS AM 12.5 B 13.5 B PM 11.7 B 14.1 B AM 5.3 A 8.0 A PM 8.1 A 8.7 A AM 6.3 A 13.1 B PM 11.4 B 12.7 B AM 5.9 A 7.4 A PM 11.5 B 13.3 B AM 10.0 B 6.2 A PM 13.6 B 11.8 B AM 1.1 A 2.6 A PM 2.4 A 4.5 A AM 5.6 A 6.1 A PM 8.8 A 14.2 B AM 4.0 A 5.8 A PM 8.1 A 9.2 A AM 4.7 A 8.4 A PM 5.5 A 8.1 A AM 13.2 B 17.9 B PM 9.2 A 11.5 B AM 7.3 A 6.1 A PM 4.5 A 4.1 A AM 27.6 C 32.5 C PM 24.3 C 22.9 C Looking east on Broadway at Elm Avenue; the intersection is operating at Level of Service A 29

35 5. Vehicular Traffic Analysis As shown on Table 5.3, all the study area intersections on Third Street are operating at Level of Service B or better. Appendices 5.2 and 5.3 include the intersection operations analysis worksheets for conditions before and 12 months after implementation of the project, respectively. Table 5.3 Intersection Operations Analysis Results for Third Street, Before and After Implementation Looking west on Third Street at the Promenade; the intersection is operating at Level of Service A No. Intersection 13 3rd St and Magnolia Ave 14 3rd St and Chestnut Ave rd St and Cedar Ave 3rd St and Pacific Ave 17 3rd St and Pine Ave 18 3rd St and The Promenade 19 3rd St and Long Beach Blvd 20 3rd St and Elm Ave 21 3rd St and Linden Ave 22 3rd St and Atlantic Ave 23 3rd St and Alamitos Ave Peak Hour Before After Delay (Sec) LOS Delay (Sec) LOS AM 12.1 B 16.8 B PM 16.4 B 23.7 C AM 3.3 A 8.7 A PM 6.4 A 9.8 A AM 4.8 A 8.4 A PM 3.9 A 6.0 A AM 7.8 A 10.8 B PM 8.2 A 10.5 B AM 4.4 A 7.8 A PM 6.0 A 13.1 B AM 2.4 A 2.9 A PM 7.0 A 6.9 A AM 11.3 B 13.8 B PM 11.7 B 11.4 B AM 4.2 A 9.6 A PM 11.5 B 14.8 B AM 3.3 A 5.9 A PM 8.9 A 11.2 B AM 8.8 A 13.8 B PM 8.7 A 11.6 B AM 15.5 B 13.4 B PM 5.3 A 5.5 A 30
36 6. Speed Analysis 6. Speed and Behavioral Analysis This section presents the speed and behavioral analysis for the conditions before and after implementation of the project. Time delay studies for bicycles and motor vehicles are also discussed in this section. Appendix 6.1 includes the speed survey data sheets. 6.1 Conditions Before Implementation Six hours of observations were conducted to record bicyclist and pedestrian behavior along the street before implementation of the project. Some cyclists were observed riding on the street against traffic, which according to recent studies of collision data in Long Beach has been the number one cause of bicycle related crashs over the past 10 years. Between Pine Avenue and Pacific Avenue, over 65% of bicyclists and many skateboarders were observed riding on the sidewalk. There was also considerable pedestrian volume from Long Beach Transit and Metro buses picking up and dropping off riders along this segment of Broadway. The 85 th percentile speed along Broadway in the project vicinity was 30.1 mph before implementation of the project. This means that on Broadway between Linden Avenue and Elm Avenue, approximately 15% of vehicles were traveling above the posted speed limit based on radar surveys. Along Third Street the 85 th percentile speed in the project vicinity was 36 mph before implementation of the project (15% of the vehicles were traveling above 36 mph). Observations of traffic conditions along Third Street between Linden Avenue and Elm Avenue noted frequent vehicle activity in and out of apartment parking lots and alleys. There were restaurants with bike deliveries during the busy lunchtime hour. There were some obstructions along this street segment such as restaurants with gates providing access directly onto the sidewalk for patio seating. Three potential conflicts between pedestrians, bicyclists, skateboarders, and turning vehicles were observed along this street segment. Along Third Street between Pine Avenue and Pacific Avenue, traffic volume was observed as moderate. Approximately 50% of vehicles were observed to be traveling above the posted speed limit based on radar surveys. 6.2 Conditions After Implementation The 85 th percentile speed along Broadway in the project vicinity after project implementation was 26 mph based on the latest speed survey done in June, Few vehicles observed were traveling above the posted speed limit of 30 mph, based on radar surveys. After implementation 53% of bicyclists were observed riding in the protected bikeway on Broadway. Bicyclists riding on the sidewalk on Broadway dropped significantly from over 65% down to 39% of the total bicyclist volume. Only 2% of cyclists were observed riding in the vehicle lanes. The 85 th percentile speed along Third Street in the project vicinity is now 27 mph based on the latest speed survey completed in June, Few vehicles were observed traveling above the posted speed limit of 30 mph, based on radar surveys. Observation indicates that 61% of bicyclists are now riding in the protected bikeway on Third Street. Bicyclists riding on the sidewalk on Third Street are still common, but have dropped by over 50% from almost 70% before 31
37 6. Speed Analysis installation of the protected lanes to just 30% after installation of the lanes. Just 5% of cyclists were observed riding in the vehicle lanes, mainly in the early evening hours. 6.3 Travel Time Delay Study A travel time delay study was used to quantify the amount of time it takes to travel from one end of the project to the other. Results are quantified by measures such as total transit time, level of service (LOS) and average speed. The results of the travel time delay study for bicycles are shown in Table 6.1. As shown, the average travel time for the 1-mile segment of Broadway is approximately 8 minutes regardless of time of day. On Third Street, the average travel time varies from about 7 minutes up to 9 minutes depending on time of day. Average speed is generally between 6 and 7 mph on both streets. Table 6.1 Travel Time Delay Study for Bicycles on Broadway and Third Street Broadway Travel Time Delay Study Magnolia to Alamitos Travel Time (min:sec) AM Peak Period MD Peak Period PM Peak Period Average Number Speed of mph Signals Number Travel of G/R Time Stops (min:sec) Average Number Speed of mph Signals Number Travel Average Number of Stops G/R Time (min:sec) Speed mph of Signals Number of Stops G/R Run 1 08: : : Run 2 07: : : Run 3 08: : : Average 07: : : rd Street Travel Time Delay Study Alamitos to Magnolia Travel Time (min:sec) AM Peak Period MD Peak Period PM Peak Period Average Number Speed of mph Signals Number Travel of G/R Time Stops (min:sec) Average Number Speed of mph Signals Number Travel Average Number Number of Stops G/R Time (min:sec) Speed mph of Signals of Stops G/R Run 1 07: : : Run 2 08: : : Run 3 06: : : Average 07: : :
38 6. Speed Analysis The results of the travel time delay study for vehicles are shown in Table 6.2. As shown, the average travel time for vehicles on Broadway is approximately 3 minutes regardless of time of day. On Third Street, the average vehicle travel time is about 2 ½ minutes. Average speed is generally between 18 and 19 mph on Broadway and 23 to 27 mph on Third Street depending on time of day. Table 6.2 Travel Time Delay Study for Vehicles on Broadway and Third Street Broadway Travel Time Delay Study AM Peak Period MD Peak Period PM Peak Period Magnolia Travel Average Number Number Travel Total Average Number Number Travel Average Number Number to Time Speed of of G/R Time Delay Speed of of G/R Time Speed of of G/R Alamitos (min:sec) mph Signals Stops (min:sec) (sec) mph Signals Stops (min:sec) mph Signals Stops Run 1 02: : : Run 2 02: : : Run 3 03: : : Average 02: : : rd Street Travel Time Delay Study AM Peak Period MD Peak Period PM Peak Period Alamitos Travel Average Number Number Travel Total Average Number Number Travel Average Number Number to Time Speed of of G/R Time Delay Speed of of G/R Time Speed of of G/R Magnolia (min:sec) mph Signals Stops (min:sec) (sec) mph Signals Stops (min:sec) mph Signals Stops Run 1 02: : : Run 2 02: : : Run 3 02: : : Average 02: : :
39 7. Crash History 7. Crash History This section presents the crash history for the conditions before and after implementation of the project. 7.1 Crash History Crash history is based on police crash reports taken and recorded in the City of Long Beach Police Department database. Appendix 7.1 includes the crash history data sheets Broadway Crash History The crash history for Broadway was analyzed for the three years prior to implementation, with the focus on bicycle-related crashes. Analysis of the three previous years found twelve bicycle-related crashes on Broadway. The actual written report for each bicycle-related crash was closely analyzed to help establish a benchmark for the types of bicycle crashes reported. These reports are summarized below (complete reports are included in Appendix 7.1): 4/18/09. 12:00 PM. Broadway/Chestnut Avenue (at intersection): A vehicle traveling eastbound on Broadway and proceeding straight at the intersection with Chestnut Avenue collided with a bicycle traveling westbound (wrong way) and proceeding straight. 7/19/09 22:00. Broadway/Chestnut Avenue (at Intersection): A vehicle traveling eastbound and making a right turn south onto Chestnut Avenue collided with a bicycle traveling southbound on Chestnut Avenue proceeding straight. 9/10/09 18:28. Broadway/Atlantic Avenue (20 feet south of intersection): A vehicle traveling eastbound on Broadway and proceeding straight collided with a bicycle traveling southbound on Atlantic Avenue. 4/6/10 14:32. Broadway/Pacific Avenue (at intersection): A bicycle traveling northbound on Pacific Avenue and proceeding straight collided with a vehicle traveling northbound at Broadway. 6/13/10 19:22. Broadway/Elm Avenue (six feet north of intersection): A vehicle traveling southbound on Elm Avenue and proceeding straight through the intersection with Broadway collided with a bicycle traveling eastbound on Broadway proceeding straight. 6/25/10 18:35. Broadway/Pacific Avenue (at intersection): A vehicle traveling north on Pacific Avenue and proceeding straight through the intersection collided with a bicycle traveling east on Broadway and proceeding straight. 7/30/10 17:50. Broadway/Atlantic Avenue (at intersection): A vehicle traveling westbound on Broadway, proceeding straight collided with a bicycle traveling eastbound on Broadway, making a right turn onto Atlantic Avenue. 9/13/10 10:53. Broadway/Linden Avenue (at intersection): A vehicle traveling eastbound on Broadway making a left turn onto Linden Avenue collided with a bicycle traveling northbound on Linden Avenue. 34
40 7. Crash History 10/14/10 20:41. Broadway/Alamitos Avenue (six feet west of intersection): A vehicle traveling eastbound on Broadway and proceeding straight through the intersection with Alamitos Avenue collided with a bicycle traveling eastbound on Broadway and proceeding straight. 11/15/11 16:47. Broadway/Elm Avenue (60 feet west of Elm Avenue): A vehicle traveling eastbound on Broadway and making a left-turn approximately 60 feet west of Elm Avenue collided with a bicycle traveling eastbound on Broadway and proceeding straight. 5/16/12 07:00. Broadway/Alamitos Avenue: A vehicle traveling eastbound on Broadway made a right-turn and collided with a bike going south and proceeding straight on Alamitos. The primary cause was stated as unknown, however based on the description of the accident it is believed the bicyclist was on the wrong side of the street or coming off of the sidewalk. 10/01/12 11:57. Broadway/Linden Avenue: A vehicle traveling eastbound on Broadway and making a left turn onto Linden collided with a bike traveling northbound and proceeding straight on Linden. The cause was determined to be improper turning by the vehicle. 11/15/12 16:47. Broadway/Elm Avenue: A vehicle traveling eastbound on Broadway and making a left-turn onto Elm Avenue collided with a bike also traveling eastbound on Broadway and proceeding straight. The primary cause was determined to be improper turning by the vehicle. Within one year following project completion just three bicycle-related crashes have been reported on Broadway in the project area. This is a 25% reduction from the number of crashes reported per year in the prior three years Third Street Crash History The crash history for Third Street was analyzed for the three years prior to implementation, with the focus on bicycle-related crashes. Analysis of the three previous years found seven bicycle-related crashes for Third Street. The reports are summarized below (complete reports are included in Appendix 7.1): 3/4/09 11:03. Third Street/Atlantic Avenue (six feet south of intersection): A vehicle traveling westbound on Third Street and making a right turn onto Atlantic Avenue collided with a bicycle traveling northbound and proceeding straight on Atlantic Avenue. 7/4/09 21:32. Third Street/Chestnut Avenue (10 feet west of intersection): A vehicle traveling westbound on Third Street and making a right turn onto Chestnut Avenue collided with a bicycle traveling northbound and proceeding straight on Chestnut Avenue. X2/12/10 13:10. Third Street/Linden Avenue (eight feet south of intersection): A bicycle traveling westbound on Third Street collided with a vehicle proceeding westbound on Third Street. 6/24/10 19:21. Third Street/Elm Avenue (four feet north of intersection): A vehicle traveling west on Third Street and making a right turn onto Elm Avenue collided with a bicycle traveling eastbound on Third Street (wrong way) stopped in the road. 35
41 7. Crash History 9/16/10 19:14. Third Street/Pine Avenue (six feet east of intersection): A vehicle traveling southbound on Pine Avenue and proceeding straight collided with a bicycle proceeding westbound on Third Street making a left-turn onto Pine Avenue. 11/15/10 13:24. Third Street/ Pine Ave (at intersection): A vehicle traveling westbound on Third Street and making a right turn onto Pine Avenue collided with a bicycle traveling northbound on Pine Avenue. Within one year following project completion no bicycle-related crashes have been reported on Third Street in the project area. This is a 100% reduction from the number of crashes reported in the prior three years. Annual crashes involving vehicles, bicycles, and pedestrians are summarized in Table Crash Data Comparison Before and After Implementation Crash experience for all types of vehicles on both streets was compiled for the three years prior to implementation and the year following implementation to determine typical annual experience for the roadway. Non-bicycle crashes were not analyzed in detail, but annual crashes and annual crashes involving bicycles are noted in Table 7.2. Table 7.1 Summary of Three-Year Vehicle, Bicycle, and Pedestrian Crash History on Broadway and Third Street 3rd Street Vehicle Bike Ped Bike+Ped Total April March April March April March April March Broadway Vehicle Bike Ped Bike+Ped Total April March April March April March April March Combined Vehicle Bike Ped Bike+Ped Total April March April March April March April March
 2008-2009 2009-2010 2010-2011")


42 7. Crash History Table 7.2 Three-Year Crash Experience on Broadway and Third Street, Before and After Implementation Project Conditions Before Implementation After Implementation Year (Apr-Apr) Present Total Number of Reported Crashes Number of Crashes Involving Bicycles The vehicle collision rate fell by nearly 25% on Broadway and Third Street after implementation of the separated lanes. On Third Street they fell by nearly 30 percent and on Broadway by 20%. In the three years before implementation, there were a total of 19 bicycleinvolved crashes along Broadway and Third Street, including: Three wrong way bicyclists Two crashes in the parked vehicle door zone Five crashes involving right-turning vehicles Two crashes involving left-turning vehicles Seven other intersection crashes Five of the nineteen crashes were of the type that might be reduced if the protected lanes reduced wrong way cycling or reduced bicycling in the door zone. A truck parked in the protected bikeway forcing the cyclist to use the vehicular lane or sidewalk Since implementation, there have been only three crashes involving bicycles (all on Broadway). These have been attributed to left-turning vehicles (see Figure 7.1 on the next page). 37

43
44 8. Parking Conditions 8. Parking Conditions This section presents parking conditions along Third and Broadway before and after implementation of the protected bikeway project. The analysis documents the available parking supply and demand along both streets in the project area. 8.1 Parking Background Before implementing the protected bikeway project, both Third Street and Broadway had three travel lanes with parking on both sides of the street. With the protected bikeway project the streets now provide a bikeway along the left side of each street, separated from traffic by a parking lane and a raised curb. The parking lane along the left side of the street forms a buffer between the protected bikeway and the vehicle lanes. The protected bikeway project involved removal of one traffic lane on both Broadway and Third Street and installation of protected bikeways on the left side of each street. Parking was retained on both sides of each street, however twenty-eight parking spaces were removed on Broadway and twenty parking spaces were removed on Third Street as a result of the project. Pay parking is now allowed along the right curb, and time limit parking is allowed along the left curb. Parking conditions along Broadway and Third Street were evaluated to determine the after implementation parking demand along each street. The following provides a description of Broadway, Third Street, the adjacent offstreet lots, and the local street network in the study area On-Street Parking Broadway is a one-way eastbound arterial street traversing a commercial/business district in the downtown area of Long Beach. The street has a curb-curb width of 52 feet in the project vicinity. The typical cross-section of the street is now a 9-foot protected bike lane, 5-foot buffer, 8-foot parking lane, two 11-foot eastbound traffic lanes, and an 8- foot parking lane on the right side of the street. There are sidewalks on both sides of the street. The segment of Broadway that includes the protected bikeway is approximately one mile long. Third Street is a one-way westbound arterial street traversing a commercial/business district in downtown Long Beach. The street has a curb-curb width of 52-feet in the project vicinity. The typical cross-section of the street is now a 9-foot protected bike lane, 5-foot buffer, 8-foot parking lane, two 11-foot westbound traffic lanes, and an 8-foot parking lane on the right side of the street. There are sidewalks on both sides of the street. The segment of Third Street included in the protected bikeway project is approximately one mile long. Land use along Broadway is a mix of commercial offices, retail, restaurant, and other commercial businesses, high-density residential, and government offices. Along Third Street land use is dominated by high-density residential, commercial offices, retail, and restaurant businesses. On-street parking along both Broadway and Third Street is currently allowed along the entire length of both streets in the project area, except short segments where red curb exists, generally near intersections and driveways. Approximately 152 on-street parking spaces are provided along the segment of Broadway between Magnolia Avenue and Alamitos Avenue. There are 65 spaces on the left (north) side, 87 spaces on the right (south) side. On 39
 side. 8.1.2 Off-Street Parking There are several available off-street parking lots and structures adjacent to Broadway and Third Street that would be available for any")

45 8. Parking Conditions Third Street, approximately 164 on-street parking spaces are provided along the segment between Magnolia Avenue and Alamitos Avenue with 62 spaces on the left (south) side and 102 spaces on the right (north) side Off-Street Parking There are several available off-street parking lots and structures adjacent to Broadway and Third Street that would be available for any excess parking demand along the two streets. Figure 8.1 illustrates the off-street parking lot locations. These facilities include the following public lots in addition to several lots associated with shopping centers and private businesses along Broadway and Third Street: Public Parking Lot 2 Public Parking Lot 3 Public Parking Lot 6 Public Parking Lot 7 Public Parking Lot 8 FIGURE 8.1 PUBLIC PARKING LOT LOCATIONS 40


46 8. Parking Conditions 8.2 Parking Analysis The following examines the parking supply/demand balance along Broadway and Third Street after implementation of the protected bikeway project Parking Supply Inventory KOA Corporation inventoried the two streets to determine the overall supply of parking spaces. The inventory of available parking was conducted along each street on a block-by block basis within the study area. Table 8.1 summarizes the existing parking supply for Broadway. Table 8.1 Parking Supply on Broadway Street Segment Parking Supply on Broadway North Side South Side Total Spaces Alamitos-Lime Lime-Atlantic Atlantic-Linden Linden-Elm Elm-LBB LBB-Promenade Promenade-Pine Pine-Pacific Pacific-Cedar On-street parallel parking is available on both sides of Third between Chestnut Avenue and Magnolia Avenue Cedar-Chestnut Chestnut-Magnolia Total Spaces
47 8. Parking Conditions Table 8.2 summarizes the existing parking supply for Third Street. Street Segment Table 8.2 Parking Supply on Third Street Parking Supply on Third Street North Side South Side Total Spaces Alamitos-Lime Lime-Atlantic Atlantic-Linden Linden-Elm Elm-Long Beach Long Beach- Promenade Promenade-Pine Pine-Pacific Pacific-Cedar Cedar-Chestnut Chestnut-Magnolia Total Spaces For segments where no parking stalls are marked, the parking supply on Broadway and Third Street was estimated based upon the length of curb available between driveways and the length of a typical vehicle parking space, 20 to 25 feet Parking Demand KOA conducted parking occupancy surveys along the two streets. The parking occupancy surveys include evaluation of parking conditions for both streets on a weekday (Wednesday, May 23, 2012). The surveys were conducted between the hours of 8:00 AM and 6:00 PM. Parking occupancy counts were collected once per hour for the two streets during this time interval. The peak period of parking demand for Broadway occurred from approximately 12:00 PM to 1:00 PM. On-street parking usage was highest on the north (left) side of Broadway, where there was an overall utilization rate of about 85% to 100% along most segments of the street. On the south (right) side, occupancy varied from about 50% up to 100%. There was a peak demand of 130 vehicles parked on Broadway in 152 available parking spaces, for an overall occupancy rate of about 85%. On Third Street, peak parking demand occurred from approximately 5:00 PM to 6:00 PM. On-street parking usage was approximately the same on both sides of the street. There was wide variation by street segment, however, with some segments having just 25% to 50% occupancy, and others having 90% to 100% occupancy. There were a total of 118 vehicles parked on Third Street at the peak hour in 164 available parking spaces, for an overall occupancy rate of about 70%. Additional parking demand information is provided in Appendix 8.1 of this report. 42

48 8. Parking Conditions In conclusion, the parking occupancy survey shows that the overall peak parking demand for Broadway and Third Street is within current capacity, although certain segments are parked at 100% of capacity during the peak hours. If the parking configuration is changed, however, some parking demand could be shifted to other nearby streets and parking lots. Existing weekday curb parking demand along Broadway and Third Street in the study area is summarized by block in Tables 8.3 and 8.4, respectively. Parking on Broadway west of the Promenade Table 8.3 Peak Parking Demand, Broadway North Side North Side South Side South Side Street Segment Curb Parking Supply Curb Parking Demand Curb Parking Supply Curb Parking Demand Magnolia-Chestnut Chestnut-Cedar Cedar-Pacific Pacific-Pine Pine-Promenade Promenade-LBB LBB-Elm Elm-Linden Linden-Atlantic Atlantic-Lime Lime-Alamitos Total Occupancy N/A 92% N/A 89% 43


49 8. Parking Conditions Table 8.4 Peak Parking Demand, Third Street North Side North Side South Side South Side Street Segment Curb Parking Supply Curb Parking Demand Curb Parking Supply Curb Parking Demand Magnolia-Chestnut Chestnut-Cedar Cedar-Pacific Pacific-Pine Pine-Promenade Promenade-LBB LBB-Elm Elm-Linden Linden-Atlantic Atlantic-Lime Lime-Alamitos Total Occupancy N/A 79% N/A 68% 8.3 Parking Conclusion Overall peak parking demand is currently within available capacity along both Broadway and Third Street, however many blocks are at 85% to 100% occupancy during the peak time periods. Parking occupancy varies widely by time of day. If there is a change in the on-street parking supply, some vehicles could be displaced from curb parking to off-street parking. Observation of the off-street parking supply in the project area indicates that any vehicles displaced from curbside parking could be accommodated in the adjacent off-street lots. On Third Street between the Promenade and Long Beach Boulevard, a truck parked in the buffer zone to load furniture 44


50 8. Parking Conditions Figure 8.2 summarizes the peak on-street parking occupancy for Broadway and Third Street by time of day. FIGURE 8.2 PARKING OCCUPANCY BY BLOCK Looking east on Broadway west of Chestnut Avenue; On-street parking spaces are mostly occupied 45
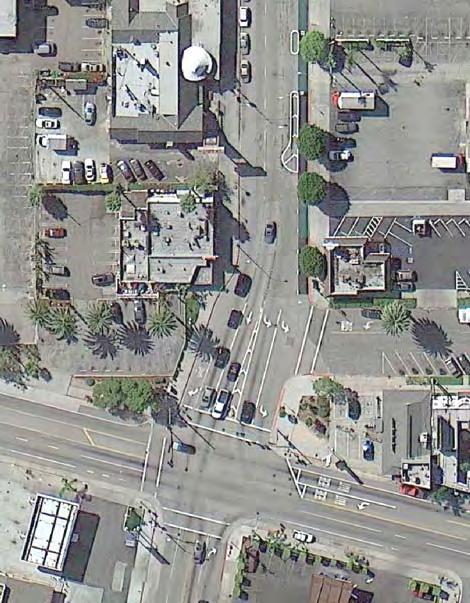
51 9. Design Considerations 9. Design Considerations The protected bike lanes in Long Beach presented several design challenges. This section outlines the key challenges and how they were addressed. Key design challenges and considerations include the following: Non-Standard Intersections o Intersections with light rail crossing o Transition onto and off of separated lanes Pedestrian Impediments Drainage Driveway Conflicts Sight Distance ADA Compliance 9.1 Non-Standard Intersections Most intersections on the bikeway are standard right angle, 4 way intersections. About 50% of these intersections are signalized. The treatment for these intersections has been discussed earlier. However there are two styles of intersections that were considered nonstandard and presented design challenges. The first of these are intersections where a light rail line runs down the center of the cross street. There were four of these intersections. The second is where the separated lanes start and end at the east end of the project area. There are two of these intersections. One at Broadway and Alamitos, where the separated lane on Broadway ends, and the other at 3 rd and Alamitos, where the 3 rd Street separated lane begins. The start and finish of the lanes at the west end of the project area were not problematic as they in effect dead end at a freeway that bounds the western edge of the downtown area Broadway at Alamitos Avenue There is a design consideration with the implementation of the project on the eastbound approach of Broadway at Alamitos Avenue. Figure 9.1 illustrates the design considerations associated with where the eastbound dedicated bike lane on Broadway ends at Olive Avenue prior to Alamitos Avenue. Where the eastbound bike lane ends at Olive Avenue, there is a natural tendency for bicyclists to proceed along the north side of Broadway (the left side of the street) and onto the sidewalk. This is due to the lack of a bike lane on the 102-foot stretch of Broadway between Olive Avenue and Alamitos Avenue. From the sidewalk bicyclists either cross Alamitos at the crosswalk or go north on the sidewalk and cross Alamitos at the crosswalk on the south side of Third Street. When bicyclists cross at the Broadway crosswalk the result is a conflict with motorists who are simultaneously turning left from Broadway onto Alamitos. Right turns from Broadway onto Alamitos Avenue are also difficult. The current configuration of the separated lanes does not provide any guidance for bicyclists who want to make a right turn or to proceed straight on Broadway. There is no warning sign or guide sign prior to the end of the bike lane. As a result bicyclists going right or straight tend to make one of two moves. Either they stay on the left side of the street up to the intersection and then cross Broadway at the crosswalk, or they merge with traffic one to two blocks west of the Alamitos intersection and move to the right side of the street, where they then ride with the flow of traffic. As shown on Figure 9.1, when bicycles are turning right from the left turn lane at the same time with the left-turning motor vehicles, the conflicting 46
52 9. Design Considerations movements may be hazardous especially when the eastbound vehicular traffic volumes on Broadway are quite high Third Street at Alamitos Avenue There is a design consideration with the implementation of the project on Third Street west of Alamitos Avenue. Figure 9.2 illustrates how the design for Third at Alamitos has resulted in a short merge distance for the westbound vehicular lanes. The westbound merge distance is only 200 feet which starts approximately 135 feet west of Alamitos Avenue. Northbound vehicles from Alamitos Avenue merge with westbound through traffic on Third Street during the same phase of the signal. As shown on Figure 9.2, the northbound left turn traffic is 400 vehicles per hour and the westbound through traffic is 730 vehicles per hour. With such high conflicting vehicular traffic, the westbound merge movement will be difficult with a short 200- foot merge distance. Another consideration is the conflicting merge movement between the westbound through motor vehicles and bicycles. On Third Street east of Alamitos Avenue, bicyclists tend to ride on the right side of the street when they share the road with the motor vehicles. On Third Street west of Alamitos Avenue, westbound through bicycles need to merge left to go to the protected bikeway on the left side of the street. The left-merging bicyclist movements potentially conflict with westbound through motor vehicles. Without guide signs, it may be confusing for the bicyclists on how to proceed. The bicyclists may not be aware that they need to merge left until they travel past Alamitos Avenue, and then realize that the protected bikeway is on the left side of the street Crossing Light Rail Lines at Pacific Avenue and at Long Beach Boulevard The separated bike lanes cross light rail lines at four intersections: Broadway and Pacific, Broadway and Long Beach Boulevard, Third and Pacific, and Third and Long Beach Boulevard. Each of these intersections is signalized as are most other intersections along the route, but are more difficult to deal with because of the complexity resulting from dealing with the trains. All other signals along the route have standard phasing and timing, but signals at these four intersections also respond to an approaching train. As a result it is more complicated using bike signals at these four intersections as they would need to synch with both the normal traffic signals as well as the train signals. As a result of the issues associated with the light rail signal timing it was decided not to use signals to control bicycle movements at these four intersections, but instead to use a "weave" to place the bicyclists on the right hand side of left turning vehicles, thus avoiding turning conflicts and potential left hooks. Figure 9.3 shows the design associated with the protected bikeway weave through the eastbound left turn lane at the conflict with the Blue Line at Broadway and Pacific. Green pavement marking is provided to guide bicyclists through the weave to the protected bikeway located on the right side of the eastbound left turn lane. Based on field observations, the eastbound protected bikeway weaving through the eastbound left turn lane appears to function properly. No significant problems have been identified. The green pavement clearly identifies the weaving movement, and the current design seems adequate. 47

53 41


54 42
55 9. Design Considerations Access to Hydrants Fire hydrants are located on the north side of Broadway adjacent to the separated lane. In order to ensure access to the hydrants cuts were made in the curb so that hoses could be run from the fire trucks to the hydrants. The parallel parking configuration on Broadway was revised per Fire Authority s request to provide a fire lane clearance for an existing fire hydrant located on the north side of Broadway. The fire lane clearance required the removal of two parallel parking spaces. With the revised treatment, one parking space remains between the fire lane and the eastbound left turn lane on Broadway at Chestnut Avenue. This one remaining parking space is difficult to use. 9.2 Pedestrian Impediments Round pole foundations are used to support signs in the buffer area between the bike lane and parked cars. The sign pole foundations protrude out of the ground several inches, and they are similar to the color of the pavement, making them difficult to see and thus easier to trip on. The design consideration of the sign pole foundation is a global problem along the protected bikeway not limited to one location. Figure 9.4 illustrates the design consideration associated with the sign pole foundation. 9.4 Driveway Conflicts Motorists crossing the separated lanes to enter a driveway raise the potential for a left hook collision with bicyclists in the protected bikeway. There has been one reported collision between a motorist and a bicyclist at a driveway along the left edge of the two corridors. At locations where curbside parking is allowed close to the driveway, the potential for conflict could increase. The highest potential conflict is NOT between a left-turning motorist and a slow-moving bicyclist, because a parked car immediately upstream of a driveway approach will effectively force motorists to slow for a tight-radius turn. A higher potential conflict exists for a fast-pedaling bicyclist running into a car turning into the driveway. In practice, such a collision has not been recorded in the first 12 months. Possible explanations may be that fast cyclists tend to prefer the vehicle travel lanes to the protected bikeway, or those cyclists that pedal fast in the protected bikeway can see over, through, or between parked cars for incoming left-turning vehicles. Problems are not expected for motorists exiting a driveway and making a left hand turn into the travel lanes as this is the same movement that would be done with or without the separated lanes. 9.3 Drainage Drainage problems have only been observed at two locations after a heavy rain storm. Pooling was observed on the parking side of the curb that runs along the right side of the protected bike lanes. Both locations are in the western half of the Broadway corridor. Pooling of storm water at those two locations appears to be easily remedied by partial removal of the curb. 50

56 44

57 45


58 9. Design Considerations Looking west on Third Street east of Cedar Avenue; There is a driveway opening between the parking spaces and the westbound left turn lane at Cedar Avenue Looking west on Third Street east of Elm Avenue; There is a driveway opening between the parking spaces 53

59 10. Summary and Conclusions 10. Summary and Conclusions The City of Long Beach implemented protected bikeways along Broadway and Third Street between Magnolia Avenue and Alamitos Avenue in downtown Long Beach. The project provided a bikeway along the left side of each of the two one-way streets and separated from traffic by a parking lane. This Before and After study was conducted to provide a baseline of comparison for evaluating the applicability and effectiveness of implementing the protected bikeways. The street segments included in the evaluation are as follows: Broadway between Magnolia Avenue and Alamitos Avenue Third Street between Magnolia Avenue and Alamitos Avenue Traffic volume counts and bicycle and pedestrian surveys were conducted along these street segments to determine the levels of bicycle, pedestrian, and traffic activity and associated conditions along Broadway and Third Street, prior to and subsequent to implementation of the project. This section summarizes the effectiveness of the protected bikeway project by comparing the before conditions prior to implementation to the after conditions, one year after project completion. Typical design configuration for the protected bikeway Typical striping configuration for the protected bikeway and on-street parking. 54
60 10. Summary and Conclusions Table 10.1 summarizes the levels of traffic, bicycle, and pedestrian activity along Broadway and Third Street within the project limits before and after implementation of the project. There has been a modest decrease in peak hour and daily traffic volumes, while bicycle and pedestrian volumes have increased. There has been a marked decrease in bicycle and motor vehicle involved crashes. Figures 10.1 and 10.2 present a summary of vehicle traffic, bicyclists, pedestrians, skateboarders and wheelchairs along Broadway and Third Street, respectively. Based on video observation, approximately 56% of cyclists riding on the sidewalk along Broadway are riding westbound against traffic. Along Third Street, approximately 71% of cyclists riding on the sidewalk are riding eastbound against traffic. Table 10.1 Bicycle, Pedestrian, and Vehicle Activity on Broadway and Third Street, Before and After Implementation Measure Broadway Third Street Before Implementation After Implementation Before Implementation After Implementation Vehicle Daily Volume 11,700 ~ 14,350/day 11,300 ~ 13,600/day 9,300 ~ 10,400/day 8,400 ~ 11,200/day Vehicle Peak Hour Volume 1,400 ~ 1,700/hour 1,100 ~ 1,300/hour 1,300 ~ 1,400/hour 1,100 ~ 1,300/hour Bicycle Peak Hour Volume Pedestrian Peak Hour Volume Vehicle Traffic Speed /6 hours 45 ~ 75/2 hours (23 ~ 38/hour) /6 hours 250 ~ 550/2 hours (125 ~ 275/hour) 30.1 MPH (85th Percentile) /6 hours 50 ~ 100/2 hours (25 ~ 50/hour) /6 hours 390 ~ 590/2 hours (195 ~ 295/hour) 19 ~ 33 MPH (85th Percentile) /6 hours 25 ~ 50/2 hours (13 ~ 25/hour) /6 hours 300 ~ 400/2 hours (150 ~ 200/hour) 36 MPH (85th Percentile) /6 hours 40 ~ 80/2 hours (20 ~ 40/hour) /6 hours2 90 ~ 370/2 hours (145 ~ 185/hour) 21 ~ 32 MPH (85th Percentile) Bicycle Crashes 12 (over 3 years) 3 crashes in prior year 7 (over 3 years) No crashes in prior year 55
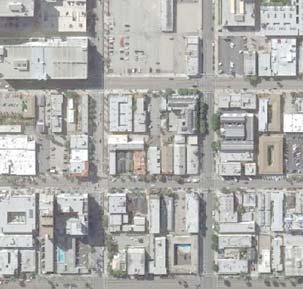
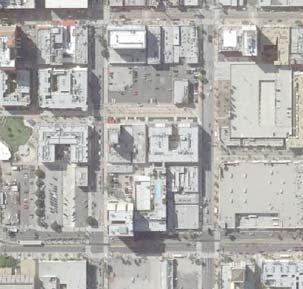
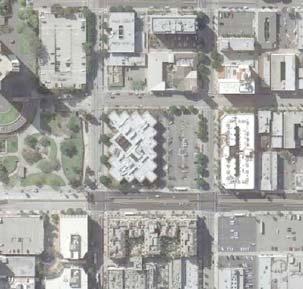
61
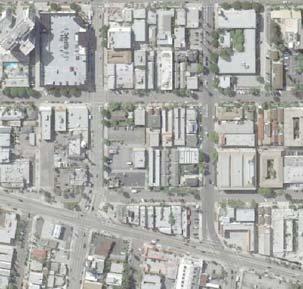
62
Lessons Learned from Cycle Tracks (Class IV Bikeways) Design Practice
 Design Practice") Lessons Learned from Cycle Tracks (Class IV Bikeways) Design Practice By: Min Zhou, P.E., Principal/Vice President KOA Corporation 1 What is a Cycle Track (Class IV) TYPICAL BIKEWAY CLASSIFICATION CLASS
Lessons Learned from Cycle Tracks (Class IV Bikeways) Design Practice By: Min Zhou, P.E., Principal/Vice President KOA Corporation 1 What is a Cycle Track (Class IV) TYPICAL BIKEWAY CLASSIFICATION CLASS
DEPARTMENT OF ENVIRONMENTAL SERVICES. North Harrison Street (Lee Highway to Little Falls Road) Comparative Analysis. Prepared for:
 Comparative Analysis. Prepared for:") DEPARTMENT OF ENVIRONMENTAL SERVICES North Harrison Street (Lee Highway to Little Falls Road) Comparative Analysis Prepared for: Arlington County Department of Environmental Services 2100 Clarendon Boulevard,
DEPARTMENT OF ENVIRONMENTAL SERVICES North Harrison Street (Lee Highway to Little Falls Road) Comparative Analysis Prepared for: Arlington County Department of Environmental Services 2100 Clarendon Boulevard,
Active Transportation Facility Glossary
 Active Transportation Facility Glossary This document defines different active transportation facilities and suggests appropriate corridor types. Click on a facility type to jump to its definition. Bike
FEDERAL HIGHWAY ADMINISTRATION APPLICATION
 FEDERAL HIGHWAY ADMINISTRATION APPLICATION REQUEST FOR PERMISSION TO EXPERIMENT WITH A BICYCLE BOX INTERSECTION TREATMENT Submitted by: City of Columbus Department of Public Service Date: June 26, 2009
J Street and Folsom Boulevard Lane Conversion Project (T ) Before and After Traffic Evaluation
 Before and After Traffic Evaluation") J Street and Folsom Boulevard Lane Conversion Project (T15125400) Before and After Traffic Evaluation Prepared by Transportation Division June 2014 Executive Summary On February 12, 2013, the City of Sacramento
J Street and Folsom Boulevard Lane Conversion Project (T15125400) Before and After Traffic Evaluation Prepared by Transportation Division June 2014 Executive Summary On February 12, 2013, the City of Sacramento
Lincoln Avenue Road Diet Trial
 Lincoln Avenue Road Diet Trial Data Collection Report June 1, 2015 Department of Transportation Table of Contents I. Introduction...... 3 II. Data Collection Methodology & Results...... 5 A. Traffic Volume
Northbound San Jose Avenue & I-280 Off-Ramp Road Diet Pilot Project
 Project Overview Fed by a two-lane Interstate-280 (I-280) off-ramp, high vehicular volumes and speeds are longstanding issues along San Jose Avenue. Residents in the surrounding neighborhoods have expressed
CITY OF LOS ANGELES INTER-DEPARTMENTAL MEMORANDUM
 CITY OF LOS ANGELES INTER-DEPARTMENTAL MEMORANDUM Date: April 1, 219 To: Honorable City Council c/o City Clerk, Room 395, City Hall Attention: Honorable Mike Bonin, Chair, Transportation Committee From:
Cycle Track Design Best Practices Cycle Track Sections
 Design Best Practices Sections It is along street segments where the separation and protection methods of cycle tracks offer more comfort than conventional bicycle lanes, and are more attractive to a wide
CITY OF OAKLAND. 27th Street Bikeway Feasibility and Design. Final Report (v3) March 23, Kimley-Horn and Associates, Inc.
 March 23, Kimley-Horn and Associates, Inc.") CITY OF OAKLAND 27th Street Bikeway Feasibility and Design Final Report (v3) March 23, 2007 PREPARED BY: Kimley-Horn and Associates, Inc. Table of Contents 1. Introduction 3 2. 27 th Street/Bay Place Corridor
CITY OF OAKLAND 27th Street Bikeway Feasibility and Design Final Report (v3) March 23, 2007 PREPARED BY: Kimley-Horn and Associates, Inc. Table of Contents 1. Introduction 3 2. 27 th Street/Bay Place Corridor
Road Diets FDOT Process
 Florida Department of TRANSPORTATION Road Diets FDOT Process Humberto Castillero, PE, PTOE Roadway Design Office Purpose of Guide Develop a statewide lane elimination review process Balance state & local
Complete Street Analysis of a Road Diet: Orange Grove Boulevard, Pasadena, CA
 Complete Street Analysis of a Road Diet: Orange Grove Boulevard, Pasadena, CA Aaron Elias, Bill Cisco Abstract As part of evaluating the feasibility of a road diet on Orange Grove Boulevard in Pasadena,
Bay to Bay Boulevard Complete Streets Project
 Bay to Bay Boulevard Complete Streets Project Dale Mabry Highway to Bayshore Boulevard February 08, 2018 Photo Source: Tampa Bay Times Alessandra Da Pra Meeting Format Introduction Resurfacing Information
Clybourn Ave. Protected Bike Lane Study Halsted St. to Division St.
 Clybourn Ave. Protected Bike Lane Study Halsted St. to Division St. Nathan Roseberry, Senior Engineer Pam Broviak, Project Manager July 24, 2014 Agenda Project Goals Existing Roadway Conditions Traffic
C C C
 C-012-001 Thank you for your support for the creation of new public space and nonmotorized access between downtown and the waterfront through the Overlook Walk, the East-West Connections, and the Promenade.
DOWNTOWN TUPELO MAIN STREET: ROAD DIET STUDY
 DOWNTOWN TUPELO MAIN STREET: ROAD DIET STUDY Since mid-2009, RPM Transportation Consultants (RPM) has worked with the Downtown Tupelo Main Street Association to evaluate traffic conditions and potential
APPENDIX A: Complete Streets Checklist DRAFT NOVEMBER 2016
 APPENDIX A: Complete Streets Checklist DRAFT NOVEMBER 2016 Complete Streets Checklist MetroPlan Orlando s Complete Streets Checklist is an internal planning tool for staff to further implementation of
EUCLID AVENUE PARKING STUDY CITY OF SYRACUSE, ONONDAGA COUNTY, NEW YORK
 EUCLID AVENUE PARKING STUDY CITY OF SYRACUSE, ONONDAGA COUNTY, NEW YORK CITY OF SYRACUSE DEPARTMENT OF PUBLIC WORKS 1200 CANAL STREET EXTENSION SYRACUSE, NEW YORK 13210 DRAFT REPORT DATE: November 13,
DOWNTOWN MIAMI PEDESTRIAN PRIORITY ZONE
 DOWNTOWN MIAMI PEDESTRIAN PRIORITY ZONE AUGUST 6, 2013 DOWNTOWN MIAMI BY THE NUMBERS more than 200,000 people live, work, and play here every day is home to more than 1,000 events each year hosts more
ALLEY 24 TRAFFIC STUDY
 ALLEY 24 TRAFFIC STUDY in City of Frostburg, Maryland January 2013 3566 Teays Valley Road Hurricane, WV Office: (304) 397-5508 www.denniscorporation.com Alley 24 Traffic Study January 2013 Frostburg, Maryland
Multi-Modal Traffic Analysis. Parisi and Associates
 Mill Valley to Corte Madera Bicycle and Pedestrian Corridor Study Appendix D: Multi-Modal Traffic Analysis Prepared by Parisi and Associates August 2009 Appendix D - Multi-Modal Traffic Analysis Table
Public Information Centre
 WELCOME Public Information Centre Father Tobin Road Lougheed Middle School - Library Wednesday November 7, 2012 7:00 p.m.to 9:00 p.m. Please sign in Neighbourhood Traffic Calming Guide Background The City
Dr. M.L. King, Jr. Street North Complete Streets Resurfacing Opportunities HOUSING, LAND USE, AND TRANSPORTATION COMMITTEE MARCH 22, 2018
 Dr. M.L. King, Jr. Street North Complete Streets Resurfacing Opportunities HOUSING, LAND USE, AND TRANSPORTATION COMMITTEE MARCH 22, 2018 What s Happening The City plans to mill and resurface Dr. M.L.
MEMORANDUM. Charlotte Fleetwood, Transportation Planner
 MEMORANDUM Date: Updated August 22, 2017 To: Organization: Charlotte Fleetwood, Transportation Planner Boston Transportation Department From: Jason DeGray, P.E., PTOE, Regional Director of Engineering
CITY OF WEST LAKE HILLS. Forest View Neighborhood Traffic Calming Study
 CITY OF WEST LAKE HILLS 901 South Mopac Expressway Building V, Suite 220 Austin, Texas 78746 Texas P.E. Firm Registration No. F-929 Klotz Associates Final Report Submittal: March 20, 2015 Revised Final
LANCASTER CITY BICYCLE NETWORK
 LANCASTER CITY BICYCLE NETWORK Downtown Merchants Meeting Wednesday, July 19, 2017 http://www.lancasteratp. DOWNTOWN WALKABILITY ANALYSIS What changes can be made, in the least amount of time, and for
Off-road Trails. Guidance
 Off-road Trails Off-road trails are shared use paths located on an independent alignment that provide two-way travel for people walking, bicycling, and other non-motorized users. Trails specifically along
WELCOME Public Information Centre
 WELCOME Public Information Centre Fernforest Drive Brampton Soccer Centre Community Room #2 Tuesday January 19, 2016 6:30 p.m.to 9:00 p.m. Please sign in Neighbourhood Traffic Calming Guide Background
NJDOT Complete Streets Checklist
 Background The New Jersey Department of Transportation s Complete Streets Policy promotes a comprehensive, integrated, connected multi-modal network by providing connections to bicycling and walking trip
Magnolia Place. Traffic Impact Analysis. Prepared for: City of San Mateo. Prepared by: Hexagon Transportation Consultants, Inc.
 Magnolia Place Traffic Impact Analysis Prepared for: City of San Mateo Prepared by: Hexagon Transportation Consultants, Inc. Updated January 4, 2010 Table of Contents 1. Introduction...1 2. Existing Conditions...6
Broad Street Bicycle Boulevard Design Guidelines
 Broad Street Bicycle Boulevard Design Guidelines Building from the strategies introduced in the 2013 Bicycle Transportation Plan and community input received thus far, City Transportation Staff have identified
Ottawa Beach Road Study
 Ottawa Beach Road Study Prepared For: Park Township September 30, 2014 Project No. G140303 OTTAWA BEACH ROAD STUDY PREPARED FOR: PARK TOWNSHIP SEPTEMBER 30, 2014 PROJECT NO. G140303 TABLE OF CONTENTS 1.0
Pedestrian & Bicycle Safety Innovations & Applications
 Pedestrian & Bicycle Safety Innovations & Applications County Engineers Association of Maryland Spring, 2017 Conference May 25, 2017 George Branyan Pedestrian Program Coordinator District Department of
Welcome! San Jose Avenue Open House August 25, 2015
 Welcome! San Jose Avenue Open House August 25, 2015 Vision Zero The City and County of San Francisco adopted Vision Zero San Francisco Vision Zero High Injury Network as a policy in 2014, committing an
Meadow Woods Elementary School
 Drag and drop pic and stretch/crop to the limits of the blue rectangle (delete this text box) Meadow Woods Elementary School Drag and drop pic and stretch/crop to the limits of the blue rectangle (delete
Appendix T CCMP TRAIL TRAFFIC & TRANSPORTATION DESIGN STANDARD
 Appendix T CCMP 3.3.4 TRAIL TRAFFIC & TRANSPORTATION DESIGN STANDARD 3.3.4 Trail Traffic and Transportation Design Multi-use trails have certain design standards, which vary depending on the agency that
CITY OF LOMITA CITY COUNCIL REPORT
 CITY OF LOMITA CITY COUNCIL REPORT TO: FROM: City Council Ryan Smoot, City Manager Item No. SCH 12 PREPARED BY: Mark A. McAvoy, P.E., Public Works Director/City Engineer MEETING DATE: August 1, 2017 SUBJECT:
CURBSIDE ACTIVITY DESIGN
 5 CURBSIDE ACTIVITY DESIGN This chapter provides design guidance for separated bike lanes adjacent to curbside activities including parking, loading and bus stops. Typical configurations are presented
Bikeway action plan. Bicycle Friendly Community Workshop March 5, 2007 Rochester, MN
 Bikeway action plan Summary The was held on March 5, 2007 at the Rochester Mayo Civic Center. The workshop was hosted by Rochester-Olmsted County Planning Department in collaboration with the League of
5. RUNNINGWAY GUIDELINES
 5. RUNNINGWAY GUIDELINES These guidelines should be considered collectively when making runningway decisions. A runningway is the linear component of the transit system that forms the right-of-way reserved
REGIONAL BICYCLE AND PEDESTRIAN DESIGN GUIDELINES
 REGIONAL BICYCLE AND PEDESTRIAN DESIGN GUIDELINES November 16, 2011 Deb Humphreys North Central Texas Council of Governments Bicycle and Pedestrian Advisory Committee Snapshot of the Guide 1. Introduction
City of Albert Lea Policy and Procedure Manual 4.10 ALBERT LEA CROSSWALK POLICY
 4.10 ALBERT LEA CROSSWALK POLICY PURPOSE: Pedestrian crosswalks are an integral part of our transportation infrastructure. To be effective and promote safety, marked crosswalks must be installed after
Orange Center Elementary School
 Drag and drop pic and stretch/crop to the limits of the blue rectangle (delete this text box) Orange Center Elementary School Drag and drop pic and stretch/crop to the limits of the blue rectangle (delete
2018 AASHTO BIKE GUIDE
 2018 AASHTO BIKE GUIDE Your presenter Rob Burchfield, PE NW Regional Engineering Director 35 years of experience in traffic engineering and bicycle facility design Toole Design Group Toole Design Group
122 Avenue: 107 Street to Fort Road
 : 107 Street to Fort Road November 24, 2015 4:30 8:00 p.m. Meeting Purpose Summarize project work completed to date Share results of public input from Phase 1 Share the draft concept plan and proposed
Coquitlam Cross-town Bike Route Improving Bicycle Facilities in a Mature Suburban Environment
 Coquitlam Cross-town Bike Route Improving Bicycle Facilities in a Mature Suburban Environment Sarah Rocchi, Vice-President, Projects, Opus International Consultants (Main Presenter) Catherine Mohoruk,
Overview. Illinois Bike Summit IDOT Complete Streets Policy Presentation. What is a Complete Street? And why build them? And why build them?
 Overview Illinois Bike Summit IDOT Complete Streets Policy Presentation Aren Kriks, P.E. District One Bicycle Coordinator and Bureau of Programming Project Engineer History of Complete Streets IDOT Policy
Development of Arlington County s Marked Crosswalk Guidelines. Jon Lawler, P.E. Design Engineer Arlington County, VA
 Development of Arlington County s Marked Crosswalk Guidelines Jon Lawler, P.E. Design Engineer Arlington County, VA April 13, 2015 Transportation System Users Residents Estimated 215,000 in 2014 Lowest
Date: April 4, Project #: Re: A Street/Binford Street Traffic/Intersection Assessment
 To: Peter Cavanaugh General Electric From: David Bohn, PE Ryan White, PE Date: April 4, 217 Project #: 13421. Re: / Traffic/Intersection Assessment Consistent with the Cooperation Agreement between the
CITY OF OTTAWA ROADWAY MODIFICATION APPROVAL UNDER DELEGATED AUTHORITY
 RMA-2015-ATM-038 CITY OF OTTAWA ROADWAY MODIFICATION APPROVAL UNDER DELEGATED AUTHORITY DATE: April 22, 2015 SUBJECT Approval of Roadway Modifications Recommended through an Area Traffic Management Study
Figure 1: East West Connector Alignment Alternatives Concept Drawing
 Page 2 of 9 Figure 1: East West Connector Alignment Alternatives Concept Drawing The Montebello Drive extension will run north south and connect Wilsonville Road to the Boones Ferry Road to Brown Road
Peer Review of Highlands Neighborhood Traffic and Pedestrian Safety Plan
 FINAL REPORT March 14, 2017 Prepared for: Ada County Highway District Prepared by: SIX MILE ENGINEERING, PA Executive Summary The (Highlands Safety Plan) developed by the Ada County Highway District (ACHD)
25th Avenue Road Diet Project A One Year Evaluation. Transportation Fund for Clean Air Project #05R07
 25th Avenue Road Diet Project A One Year Evaluation Transportation Fund for Clean Air Project #05R07 Submitted by: The San Francisco Municipal Transportation Agency Dan Provence May 22, 2009 EXECUTIVE
Minor Amendments to the Street and Traffic By-law 2849 and Skateboards in Protected Bike Lanes
 ADMINISTRATIVE REPORT Report Date: October 31, 2017 Contact: Lon LaClaire Contact No.: 604.873.7336 RTS No.: 12241 VanRIMS No.: 08-2000-20 Meeting Date: November 15, 2017 TO: FROM: SUBJECT: Standing Committee
Multimodal Through Corridors and Placemaking Corridors
 68 Multimodal Through Corridors and Placemaking Corridors Corridors have different functions in a region. Some corridors are used to get smoothly and rapidly through a region or to get quickly to major
Washington St. Corridor Study
 FIGURE 7.17 Bridge Alternatives - Cross Sections 86 Discarded Alternative: Short-Term Bridge Repair Short-term repairs and west bridge span replacement were considered during analysis. Short-term repairs
East 12 th Street Bikeway Feasibility Study
 Final Report East 12 th Street Bikeway Feasibility Study Prepared for: City of Oakland Public Works Agency Submitted by: 180 Grand Avenue, Suite 250 Oakland, CA 94612 Phone: (510) 839-1742; Fax: (510)
HENDERSON DEVELOPMENT 213, 217, 221, 221 ½, 223 HENDERSON AVENUE and 65 TEMPLETON STREET OTTAWA, ONTARIO TRANSPORTATION OVERVIEW.
 HENDERSON DEVELOPMENT 213, 217, 221, 221 ½, 223 HENDERSON AVENUE and 65 TEMPLETON STREET OTTAWA, ONTARIO TRANSPORTATION OVERVIEW Prepared for: 2294170 Ontario Inc. February 2, 2017 117-652 Report_1.doc
Non-Motorized Transportation 7-1
 Non-Motorized Transportation 7-1 Transportation facilities no longer mean just accommodating a vehicle powered by a combustion engine. Pedestrian and non-motorized facilities are important modes of travel
Simulation Analysis of Intersection Treatments for Cycle Tracks
 Abstract Simulation Analysis of Intersection Treatments for Cycle Tracks The increased use of cycle tracks also known as protected bike lanes has led to investigations of how to accommodate them at intersections.
City of Seattle Edward B. Murray, Mayor
 City of Seattle Edward B. Murray, Mayor Department of Transportation Scott Kubly, Director Eastlake Community Council 117 E Louisa St. #1 Seattle, WA 98102-3278 January 28, 2016 RE: Roosevelt to Downtown
On Road Bikeways Part 1: Bicycle Lane Design
 On Road Bikeways Part 1: Bicycle Lane Design Presentation by: Nick Jackson Bill Schultheiss, P.E. September 04, 2012 FOLLOW THE CONVERSATION ON TWITTER Toole Design Group is live tweeting this webinar
Appendix 3 Roadway and Bike/Ped Design Standards
 Appendix 3 Roadway and Bike/Ped Design Standards OTO Transportation Plan 2040 4/20/2017 Page A3-1 Adopted Standards The adopted OTO Design Standards and Major Thoroughfare Plan are contained herein.
TRANSPORTATION ANALYSIS REPORT US Route 6 Huron, Erie County, Ohio
 TRANSPORTATION ANALYSIS REPORT US Route 6 Huron, Erie County, Ohio December 12, 2012 Prepared for: The City of Huron 417 Main Huron, OH 44839 Providing Practical Experience Technical Excellence and Client
Bicycle Facilities Planning
 Bicycle Facilities Planning Overview Types of Cyclists Purpose for Riding Types of Facilities Bike Lanes Bicycle Boulevards Cycle Tracks Intersections Signals Signing and Marking Discussion Types of Bicyclists
WELCOME. Stakeholder Involvement Group Meeting #2 Round Lake Public Works October 24, 2018
 WELCOME Stakeholder Involvement Group Meeting #2 Round Lake Public Works October 24, 2018 MEETING AGENDA 1. Welcome and Introductions 2. Study Progress Update 3. Problem Statement 4. Technical Analysis
Monterey Road Complete Streets
 Monterey Road Complete Streets Complete Street Objectives Improve livability and economic vitality Enhance pedestrian environment Accommodate bicyclists safely Reduce noise and air pollution Create attractive,
Draft North Industrial Area-Wide Traffic Plan
 Summary of North Industrial and Hudson Bay Industrial Recommended Improvements Table 1. Summary of s Item Location 1 2 3 4 5 6 7 8 9 10 11 12 Millar Ave north of 51st St Super 8 Motel back lane 400 Block
Public Works Committee Meeting Richard E. Mastrangelo Council Chamber November 20, 2017
 Public Works Committee Meeting Richard E. Mastrangelo Council Chamber November 20, 2017 Purpose of Meeting Why are we here? Project Recap/Updates Project Limits/Segments Road Diet Concept Lessons Learned
MEMORANDUM. Sutter Street Bicycle Lanes, Stockton, CA SF
 MEMORANDUM Date: To: From: Subject: PURPOSE Anthony J. Lopes, Siegfried Engineering Christine Carey & Matthew Ridgway, Fehr & Peers Sutter Street Bicycle Lanes, Stockton, CA SF09-0468 The City of Stockton
Protected Bike Lanes in San Francisco Mike Sallaberry SFMTA NACTO Workshop - Chicago IL
 Protected Bike Lanes in San Francisco Mike Sallaberry SFMTA 10 14 2011 NACTO Workshop - Chicago IL San Francisco 2 nd Highest Density in the U.S. 47 square miles Mild Climate Market Population ~810,000
Cycle Tracks: Concept and Design Practices. February 17, 2010
 Cycle Tracks: Concept and Design Practices February 17, 2010 Today s webinar presenters APBP Board Member Host Brett Hondorp, Principal, Alta Planning + Design Guest Moderator Zach Vanderkooy, Bicycling
Improving Cyclist Safety at the Dundas Street West and Sterling Road Intersection
 STAFF REPORT ACTION REQUIRED Improving Cyclist Safety at the Dundas Street West and Sterling Road Intersection Date: August 17, 2012 To: From: Wards: Reference Number: Public Works and Infrastructure Committee
TRAFFIC IMPACT ANALYSIS
 TRAFFIC IMPACT ANALYSIS FOR THE CHAMPAIGN UNIT#4 SCHOOL DISTRICT PROPOSED HIGH SCHOOL (SPALDING PARK SITE) IN THE CITY OF CHAMPAIGN Final Report Champaign Urbana Urbanized Area Transportation Study 6/24/2014
Corpus Christi Metropolitan Transportation Plan Fiscal Year Introduction:
 Introduction: The Safe, Accountable, Flexible, Efficient Transportation Equity Act: A Legacy for Users (SAFETEA-LU) has continued the efforts started through the Intermodal Surface Transportation Efficiency
Color your stress away
 Color your stress away Learn about the Bicycle Master Plan s comfortable, low-stress bicycling network in Montgomery County. Unwind as you color the bicycling scenes. Check out montgomeryplanning.org/bikeplan
Truck Climbing Lane Traffic Justification Report
 ROUTE 7 (HARRY BYRD HIGHWAY) WESTBOUND FROM WEST MARKET STREET TO ROUTE 9 (CHARLES TOWN PIKE) Truck Climbing Lane Traffic Justification Report Project No. 6007-053-133, P 101 Ι UPC No. 58599 Prepared by:
City of Vallejo Traffic Calming Toolbox
 City of Vallejo Traffic Calming Toolbox June 1, 2013 Final Table of Contents Introduction... 1 Non-Physical Devices... 3 High-Visibility Crosswalk... 3 In Pavement Lighted Crosswalk... 4 Rapid Flashing
Chapter 2: Standards for Access, Non-Motorized, and Transit
 Standards for Access, Non-Motorized, and Transit Chapter 2: Standards for Access, Non-Motorized, and Transit The Washtenaw County Access Management Plan was developed based on the analysis of existing
Potential Bicycle Facility on Bayou Street Mobile, Alabama
 Potential Bicycle Facility on Bayou Street Mobile, Alabama By Richard A. Hall, P.E. Prepared For Mobile Downtown Alliance Hall Planning & Engineering, Inc. March 28, 2018 Introduction Review of the February
Chapter 3 DESIGN SPECIFICATIONS
 Brampton PathWays Planning and Design Guidelines 27 Chapter 3 DESIGN SPECIFICATIONS 3.1 CLASS 1 MULTI-USE PATH Off-road multi-use trails are the backbone of the Brampton PathWays Network. They are typically
General Design Factors
 Chapter 3: 3-1.0 Introduction General Design Factors Mn/DOT s goals include encouraging and accommodating safe bicycling. From a design perspective, these goals are achieved by first having an understanding
What Is a Complete Street?
 Session 5 Charleen Zimmer, AICP, Zan Associates May 5-7, 2010 What Is a Complete Street? May 2010 5-1 Not a Complete Street More of a Complete Street May 2010 5-2 Benefits of Complete Streets Safety for
C/CAG. Sunnybrae Elementary School Walking and Bicycling Audit. San Mateo-Foster City School District JUNE 2013
 Sunnybrae Elementary School Walking and Bicycling Audit JUNE 2013 San Mateo-Foster City School District C/CAG City/County Association of Governments of San Mateo County SUNNYBRAE ELEMENTARY SCHOOL WALKING
Multimodal Analysis in the 2010 Highway Capacity Manual
 Multimodal Analysis in the 2010 Highway Capacity Manual It s not just cars anymore! Jamie Parks, AICP HCAT Conference May 9-10, 2011 Multimodal LOS in the 2010 HCM History and background Overview of methods
PEDESTRIAN ACTION PLAN
 ATTACHMENT 2 CITY OF SANTA MONICA PEDESTRIAN ACTION PLAN CITY OF SANTA MONICA PEDESTRIAN ACTION PLAN This page intentionally left blank EXECUTIVE SUMMARY CHAPTER 1 EXECUTIVE SUMMARY Setting the Stage
Arlington Public Schools Thomas Jefferson Site Evaluation Transportation Networks. Thomas Jefferson Working Group Meeting #6 November 10, 2014
 Arlington Public Schools Thomas Jefferson Site Evaluation Transportation Networks Thomas Jefferson Working Group Meeting #6 November 10, 2014 2 3 INTRODUCTION 4 Goal of our work: Identify and assess multi-modal
9/25/2018. Multi-Modal Level of Service (MMLOS) Bianca Popescu, Transportation Planner
 Bianca Popescu, Transportation Planner") Multi-Modal Level of Service (MMLOS) Bianca Popescu, Transportation Planner 1 What is MMLOS? Is this a nice place to walk? Is this a nice place to bike? Is transit convenient? Bottom line - Are there options
Multi-Modal Level of Service (MMLOS) Bianca Popescu, Transportation Planner 1 What is MMLOS? Is this a nice place to walk? Is this a nice place to bike? Is transit convenient? Bottom line - Are there options
RE: City of Portland Request to Experiment with HAWK/Bike signal
 October 4, 2005 Regina S. McElroy, Director Office of Transportation Operations HOTO Room 3401 400 7 th Street, S.W. Washington, D.C. 20590 RE: City of Portland Request to Experiment with HAWK/Bike signal
Metro Bike/Bus Interface Study
 Metro Bike/Bus Interface Study Agenda 1. Background & Process 2. Corridors & Metrics 3. General Findings 4. Training Recommendations 5. Design Guidelines 6. Questions L.A. County Bus Service LA Metro 1,433
Boston Post Road Design Feasibility Study
 Boston Post Road Design Feasibility Study Prepared for the City of Rye Final Report July 18, 2007 Prepared by: Buckhurst Fish & Jacquemart (BFJ) 115 Fifth Avenue New York, NY 10003 www.bfjplanning.com
2018 AASHTO BIKE GUIDE
 2018 AASHTO BIKE GUIDE Your presenters Jessica Fields, PE Denver Office Director Sagar Onta, PE, PTOE Denver Engineering Director 35 years of combined experience street design, transportation planning,
Community Bicycle Planning
 Community Bicycle Planning City of Mentor s Bicycle Facility Plan Allen E. Pennington, P.E. Civil Engineer - Traffic Office of the Mentor City Engineer Why has Mentor participated in bicycle planning?
Transportation Impact Study for Abington Terrace
 Transportation Impact Study for Abington Terrace Abington Township, Montgomery County, PA Sandy A. Koza, P.E., PTOE PA PE License Number PE059911 Prepared by McMahon Associates, Inc. 425 Commerce Drive,
Chapter 4 On-Road Bikeways
 Chapter 4: 4-1.0 Introduction On-Road Bikeways This chapter provides guidelines to help select and design safe on-road bikeways. On-road bikeways include bicycle lanes, shared lanes, shoulders, and wide
SECTION 1 - TRAFFIC PLANNING
 SECTION 1 - TRAFFIC PLANNING 1.1 TRAFFIC OPERATIONS 1.1.1 Roadway Functional Classification The Multnomah County Comprehensive Framework Plan s Policy 34: Trafficways and the Functional Classification
2014/2015 BIKE ROUTE PLAN 83 AVENUE PROTECTED BIKE LANE
 About the Project The City of Edmonton is planning a major bike route on the southside of Edmonton. The Strathcona Bike Route will connect the communities of Strathcona, Garneau and the University area,
Citywide Sidewalk and Crosswalk Programs
 Citywide Sidewalk and Crosswalk Programs Council Meeting October 20, 2015 Presented by Rita Hu and Jamal Mahmoud Program Goals Implement the City s comprehensive plan. Provide pedestrian with safe walking
Comments EXECUTIVE SUMMARY
 Comments 1. Under any Alternatives, MCDOT should provide better at-grade pedestrian crossing of Georgia Avenue and Forest Glen Road, including improved crosswalks with wider medians and adequate signal
FHWA Bikeway Selection Guide
 FHWA Bikeway Selection Guide Tamara Redmon Federal Highway Administration Bill Schultheiss Toole Design Lauren Blackburn VHB March 26, 2019 PBIC Webinar pedbikeinfo.org @pedbikeinfo Housekeeping Problems