City of Novi Non-Motorized Master Plan Prepared by:
|
|
|
- Arlene Miller
- 5 years ago
- Views:
Transcription


1 City of Novi Non-Motorized Master Plan 2011 Prepared by: February 28, 2011
2 Acknowledgements City Council David B. Landry, Mayor Bob Gatt, Mayor Pro Tem Terry Margolis, Council Member Andrew Mutch, Council Member David Staudt, Council Member Justin Fischer, Council Member Wayne Wrobel, Council Member City Administration Clay J. Pearson, City Manager Victor Cardenas, Assistant City Manager Maryanne Cornelius, City Clerk Walkable Novi Committee Andrew Mutch, Chairperson David Baratta Brian Bartlett Linda Blair David Greco Elizabeth Iszler Mark Pehrson Paul Policicchio David Staudt Project Steering Committee P. Mark Spencer, AICP, Planner, Project Manager Barbara McBeth, AICP, Deputy Director Community Development Nancy Cowan, Interim Director, Parks, Recreation and Cultural Services Christopher Blough, GIS Manager Brian Coburn, P.E., Engineering Manager Tracie Ringle, Communications Specialist Consultants The Greenway Collaborative, Inc. Wade Trim Active Transportation Alliance City of Novi Citizens and Community Members All of those who contributed to the Non-Motorized Master Plan development process
3
4
5 Contents Executive Summary... i Why Plan?...i What is in the Plan?...iii How Will the Plan be Implemented?...x 1. Introduction Why Walking and Bicycling are Important Glossary of Terms Inventory and Analysis General Conditions The Pedestrian Environment The Bicycling Environment Projected Energy Savings Proposed Facilities Non-motorized Transportation Network Implementation Plan Specific Area Concept Plans Proposed Policies Complete Streets Policy ADA and Transition Plan Safe Routes to Schools Bike Parking Maintenance of Non-motorized Facilities Sidewalk / Roadside Pathway Completion...111
6 5. Design Guidelines Key Factors for Pedestrians Key Factors for Bicycle Travel Travel Along Road Corridors Developing Complete Street Cross Sections Transitions Between On and Off-Road Bicycle Facilities Modifying Existing Facilities Travel Across the Road Corridor Neighborhood Connectors Bike Route Signs and Wayfinding Bike and Pedestrian Boulevards and Neighborhood Greenways Off-Road Trails Commercial Centers Land Use Planning Outreach and Education Existing Promotional and Marking Activities Opportunities and Assets Public Outreach and Education Strategies Appendix Web Survey Results September 29, 2010 Public Workshop Summary October 26, 2010 Public Workshop Summary Maintenance and Operations Budgets Implementation Budget Figures Evaluating Alternative Scenarios for Travel Along Road Corridors...276

7 Why Plan? Executive Summary Encouraging healthy, active lifestyles through pathway and sidewalk connectivity has been a focus for the City of Novi. The City is a four-time Promoting Active Communities Gold Award winner from the Governor s Council on Physical Fitness, largely due to the over 225 miles of existing and 90 miles of planned public pedestrian and bicycle facilities. The City of Novi is now poised to take its bicycle and pedestrian facilities, policies and programs to the next level. The City of Novi Non-Motorized Master Plan, funded by the Federal Energy Efficiency and Conservation Block Grant Program, lays out a systematic way to support non-motorized transportation. Helping to shape this plan has been a dedicated group of elected officials, appointed officials, public employees and the general public. The input from an on-line survey and two public workshops shaped the proposed non-motorized network as well as setting implementation priorities. When the recommendations of the Non-Motorized Master Plan have been substantively implemented, the result will be a physical and cultural environment that supports and encourages safe, comfortable and convenient ways for pedestrians and bicyclists to travel throughout the city and into surrounding communities. It is anticipated that these physical and cultural changes will result in a greater number of individuals choosing walking and bicycling as their preferred mode of transportation for many local trips. These choices will lead to healthier lifestyles, improved air and water quality, and a more energy efficient and sustainable transportation system. The Community Attitude and Interest Survey conducted in the winter of 2008 / 2009 found that 65% of the households indicated that they have a need for walking and bicycling trails. This was nearly double the need stated for the next highest category.
8 The end result is that with a substantially complete system, Novi could expect to replace over 18,000 miles of automobile trips with bicycle or pedestrian trips every day. This would require on average for each person in the city to replace about a1/3 of a mile trip that is currently done by automobile with a trip by bicycle or walking. The trip, or a combination of trips, could be of any sort a trip to work, the store, to visit with friends, for recreation or to school. The outcome would be 45 fewer barrels of oil being used and 9 tons less of CO2 being released into the environment each day that translates into about 16,200 barrels of oil and 3,300 tons of CO2 per year. The benefits of a comprehensive non-motorized transportation system extend well beyond energy savings, reducing our dependence on fossil fuels and pollution reduction. A well-implemented nonmotorized transportation system will reap rewards by: Providing viable transportation alternatives for individuals who are capable of independent travel yet do not hold a driver s license or have access to a motor vehicle at all times. Improving safety, especially for the young and old who are at most risk due to their dependence on non-motorized facilities and their physical abilities. Improving the economic viability of a community by making it an attractive place to locate a business while simultaneously reducing public and private health care costs associated with inactivity and increasing property values. Encouraging healthy lifestyles by promoting active living. Improving the aesthetics of the roadway and community by adding landscaping and medians that improve the pedestrian environment and safety. Providing more transportation choices that respect an individual s religious beliefs, environmental ethic, and/or uneasiness in operating a vehicle. Creating a stronger social fabric by fostering the personal interaction that takes place while on foot or on bicycle. But the change will not happen overnight. Novi, like many other communities that have mostly been built since World War II, has been profoundly shaped by the automobile. For 70 years the design of everything from homes, neighborhoods, shopping center, schools, workplaces and churches have been centered on the car. This is true not only for the site-specific placement of driveways and parking lots, but also the distribution and mixing of land uses. The pattern of public investment in motor vehicle transportation, above all other modes, has resulted in an overall reduction in transportation options for the average citizen. Many communities like Novi are now weighing the convenience of the automobile against the consequences of its use at current levels and trying to strike a balance. The Non-Motorized Transportation Plan presents the vision of the future transportation system of Novi, defines the necessary support structures and lays out a course for implementation. ii

9 What is in the Plan? The Non-Motorized Master Plan is comprised of four key elements: facilities, policies, design guidelines and outreach and education. When these four elements are employed in concert, they will provide the supportive physical and cultural environment necessary to bring about real change. The facilities are the physical changes that will make walking and bicycling in the City safer, more comfortable and convenient. The policies outline proposed changes to the way the City does business to support non-motorized transportation. The design guidelines show how current best practices may be employed for common scenarios. Outreach and education outline the programs that will encourage additional and safer non-motorized travel. The following provides an overview for each element. Facilities The plan calls for a total of 74 miles of primary pedestrian routes (sidewalks, roadside paths and/or offroad trails on both sides) from the current 33 miles. This would be equal to the number of miles of primary roadway. The plan also calls for a total of 124 miles of primary bicycle routes (bike lanes, onroad bike routes and off-road trails) up from 6 miles that currently exist. iii


10 Proposed Non-Motorized Network The proposed Non-Motorized Network recognizes that pedestrians and bicyclists are a diverse population and that no one solution will apply to all bicyclists or all pedestrians. Thus bike lanes and sidewalks / roadside pathways have been proposed along all the primary roads in the City. Some of these roads are more oriented to bicyclists and pedestrians than others as they carry fewer motor vehicles and will be designed such to keep motor vehicle speeds in the 30 to 35 mph range. Complementing the primary road system will be a network of neighborhood connectors and off-road trails that provide access to key destinations in the City while minimizing exposure to a large volume of high speed motor vehicles. iv


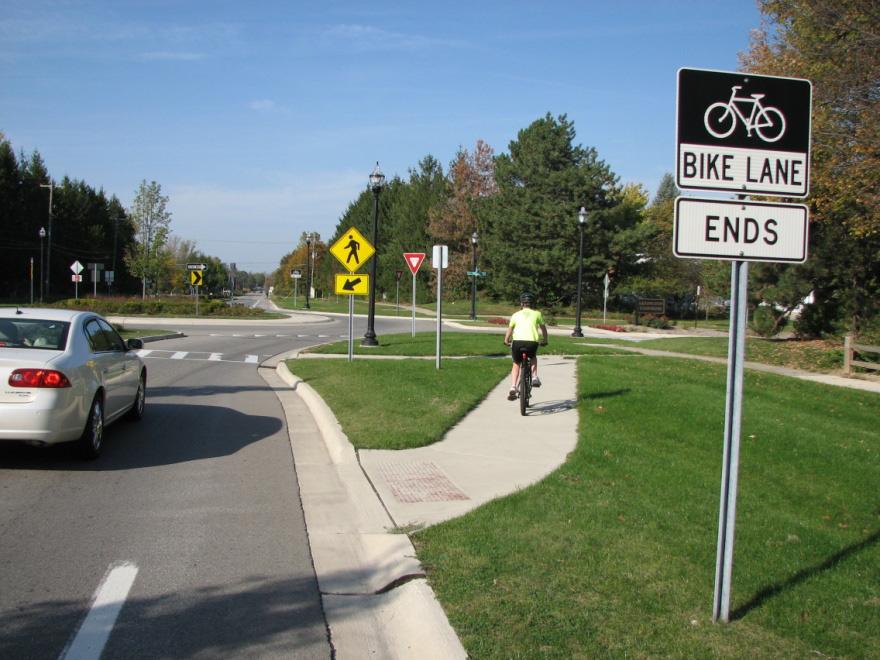
11 Bicycle/Pedestrian Focused Corridors Bicycle/pedestrian focused corridors are roadways where an emphasis will be placed on the needs of the non-motorized user. The roadway will have design elements such as frequent mid-block crossings, miniroundabouts, medians and street trees that will result in motorists naturally driving the roadway at 30 to 35 mph. The result is that the road will be a much more comfortable environment to walk along and many bicyclists will be comfortable using bike lanes on these roads. v


12 Auto Focused Corridors Auto focused corridors recognize that some roads in the City need to carry large volumes of motor vehicles at higher speeds. But even for these roads, bicycle facilities will be provided for non-motorized users commuting to work and enhanced crosswalks will be provided between signals where there is demand. Balanced Corridors Balanced corridors try to balance the needs of both non-motorized and motorized users. vi


13 Neighborhood Connectors and Trails Neighborhood connector routes are primarily located on low speed, low traffic volume local roads and connecting pathways. They link neighborhoods to parks, schools and downtowns. Signs provide wayfinding by noting direction and distance to key destinations. Elements such as traffic calming, public art, rain gardens and historic features can be added to enhance the routes. The local roads in the City of Novi provide great opportunities for neighborhood connector routes, especially for people who prefer to not be along a major arterial or collector road. By incorporating short connecting pathways through schools, parks, and between neighborhoods, a tighter network is produced, making it easier for bicyclists and pedestrians to travel through the city. vii

14 Policies The proposed policies address the day to day operations of the City and its partners. They include the following topics: Complete Streets Policy ADA and Transition Plan Safe Routes to Schools Bicycle parking Maintenance of non-motorized facilities Sidewalk/roadside pathway completion Maintaining the existing facilities These policies provide the institutional support for the non-motorized system. They provide the necessary support system for the proposed physical system. They also provide a framework with which new issues related to non-motorized transportation may be addressed. The City of Novi has already made great strides in this area. The City has adopted a resolution of support for complete streets and is currently in the process of preparing an ADA Transition Plan. By updating the City s codes and implementing the recommended programs, a system will be developed that will be able to support and embrace the physical and cultural changes of non-motorized transportation in the City. Design Guidelines The recommended design guidelines define what context sensitive complete streets should look like in the City of Novi. They are a compilation of national standards and practices that direct the implementation of non-motorized facilities. The design guidelines provide background information on bicycle and pedestrian travel as well as address the following: Travel along the roadway Travel across the road Road cross sections Transitions between facility types Neighborhood connectors Bike routes Neighborhood greenways Off-road trails Land use and site design Guidelines for multi-modal roadway design viii


15 Outreach and Education The proposed outreach and education programs encourage people to safely use both the existing system and inform them of new opportunities. It works to capitalize on existing assets to address: Education Enforcement Encouragement Education and outreach is critical to help people break out of established auto dependent travel patterns. Residents need to be provided information on safe and viable alternatives as well as given the encouragement necessary to precipitate change. To accomplish this, a number of strategies have been provided that look at building on existing assets and creating new partnerships to provide effective communications and exciting events. These include bicycling and walking ambassadors, a third grade bicycle academy, bike to work week/commuter challenges, large scale rides and an improved Novi Bicycle Map. Many elements of the public outreach and education program can begin immediately. Novi, like most communities, has enough infrastructure, programs, partners, and community pride to begin adding to the number of residents willing to try biking and walking right now. Efforts now will prime the City for success as it begins the work of improving its infrastructure for non-motorized transportation. Outreach and education programs will encourage the use of existing facilities A junior bicycle ambassadors program is proposed where teenage youth provide education and examples for elementary age children ix
16 How Will the Plan be Implemented? The proposed improvements fall into five tracks. The first track is Initial Investments, which includes projects that should be done immediately as they complete critical gaps and address safety concerns. Initial Investments Mostly locally funded projects Addresses critical gaps in the system Addresses safety concerns Mostly projects from the Pathway and Sidewalk Prioritization Analysis and Process After the Initial Investments are completed, the following four tracks should be implemented concurrently as opportunities and funding become available. Major Corridor Development Cross-city bike/pedestrian focused corridors most of which have either regional significance or are important to neighboring communities as well High capital investment projects likely supported by federal and state grants Generally involve multiple agencies Neighborhood Connectors Mostly locally funded projects Low capital investment projects Intra-city network oriented Sidewalk Gaps Locally funded projects Prioritized to have the most impact for the investment and to respond to public demand Extension of the city s current sidewalk prioritization process Construction Integration Projects that can be integrated as part of a larger construction project, such as bike lanes when a road is resurfaced Some of the improvements include relatively modest changes such as road conversions and signage and others may take longer based on opportunities and available funding. Each task may take multiple years to implement. The speed of the implementation depends on the amount of money the city dedicates to the implementation along with the success of obtaining outside funding. x


17 Initial Investments As the Non-Motorized Master Plan is in many ways a continuation and expansion of the City s Pathway and Sidewalk Prioritization Analysis and Process, a natural first step for implementation is to address the top priorities from that effort. These top priorities are included in the Initial Investments category. In addition, other key sidewalk gaps, connecting trails and safety concerns are addressed. xi


18 Major Corridor Development The Major Corridors provide a framework comprised of Bicycle and Pedestrian Focused Corridors, Neighborhood Connectors and Off-Road Trails that provide access to the key destinations within the City. The nature of these corridors should appeal to great number of bicyclists and pedestrians. xii


19 Neighborhood Connectors The Neighborhood Connectors provide a finer network than the Major Corridors and feed into the Major Corridor network. As they are primarily comprised of local roadways with short connecting off-road pathways, they are an economical way to provide alternative routes to the busy primary roads. xiii

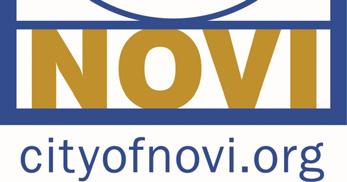
20 Conclusion The City of Novi Non-Motorized Master Plan recognizes the great diversity of bicyclists and pedestrians and the variety of trip types they make. As a result the Plan calls for a multi-faceted non-motorized network that provides both direct routes along the primary roads as well as less direct links, that utilize local roads and trails that minimize the user s exposure to motorized traffic. In addition to the physical network, updated policies combined with outreach and education programs will help to establish a supportive environment for bicyclists and pedestrians. After the completion, it is anticipated that this Plan will result in over 2% of all trips being done by pedestrians and another 2% of trips being done by bicycle. This will result in a significant reduction in the number of vehicle miles traveled in the City with an accompanying reduction in pollution. Perhaps the greatest benefit to the City will be the improvement to the quality of life for the residents. By providing valued amenities, Novi will become an even better place to live, work and play. Residents participating in one of the two public workshops held for the project. xiv
21 1. Introduction Encouraging healthy, active lifestyles through pathway and sidewalk connectivity has been a focus for the City of Novi. The City is a four-time Promoting Active Communities Gold Award winner from the Governor s Council on Physical Fitness, largely due to the over 225 miles of exiting and 90 miles of planned public pedestrian and bicycle facilities. The City of Novi is now poised to take its bicycle and pedestrian facilities, policies and programs to the next level. This document, funded by the Federal Energy Efficiency Block Conservation Grant program, lays out a systematic way to support non-motorized transportation. Helping to shape this plan, has been a dedicated group of elected officials, appointed officials, public employees and the general public. The results of an on-line survey and the input gathered at two public workshops guided the proposed non-motorized network as well as setting implementation priorities. The Non-Motorized Master Plan is comprised of four concurrent implementation tracts that when employed in concert will establish a physical and cultural environment that supports and encourages safe, comfortable and convenient ways for pedestrians and bicyclists to travel throughout the city and into the surrounding communities. It is anticipated that the cultural changes will result in a greater number of individuals choosing walking and bicycling as their preferred mode of transportation for many local trips. These choices will lead to healthier lifestyles, improved air and water quality, and a more energy efficient and sustainable transportation system. The following chart outlines the four implementation tracts in the plan. Each sub-element may move forward independently as resources allow. As the Non-Motorized Master Plan is in many ways a continuation and expansion of the City s sidewalk and pathway program, a natural first step for implementation is to address the top priorities from that effort. These top priorities are included in the Initial Investments category. 1


22 Fig 1a Four Concurrent Implementation Tracts of the Non-Motorized Plan Facilities Initial Investments Major Corridor Develpment Neighborhood Connectors Sidewalk Gaps Policies Complete Streets ADA Safe Routes to School Bike Parking Maintenance Sidewalk & Pathway Completion Design Guidelines Supportive Physical and Cultural Environment that Encourages Non-motorized Transportation Update City Standards Direct the Design of the Facilities Guide Site Development Outreach and Education Education Enforcement Encouragement Partnerships 2
23 1.1 Why Walking and Bicycling Are Important A comprehensive non-motorized transportation system based on best practices is of paramount importance to the health, safety and general welfare of the citizens of Novi. The benefits of a comprehensive non-motorized transportation system extend beyond the direct benefits to the users of the system to the public as a whole. A well-implemented non-motorized transportation system will reap rewards by: Providing viable transportation alternatives for individuals who are capable of independent travel yet do not hold a driver s license or have access to a motor vehicle at all times. Improving safety, especially for the young and old who are at most risk due to their dependence on non-motorized facilities and their physical abilities. Improving access for the 20% of all Americans who have some type of disability and the 10% of all Americans who have a serious disability. 1 Improving the economic viability of a community by making it an attractive place to locate a business while simultaneously reducing public and private health care costs associated with inactivity. Encouraging healthy lifestyles by promoting active living. Reducing the water, air, and noise pollution associated with automobile use by shifting local trips from automobiles to walking or bicycling. Improving the aesthetics of the roadway and community by adding landscaping and medians that improve the pedestrian environment and safety. Providing more transportation choices that respect an individual s religious beliefs, environmental ethic, and/or uneasiness in operating a vehicle. Reducing the need for parking spaces. Creating a stronger social fabric by fostering the personal interaction that takes place while on foot or on bicycle. Reducing dependence on and use of fossil fuel with the resulting positive impact on climate change. Improvements to non-motorized facilities touch all individuals directly, as almost all trips begin and end as a pedestrian. Where We Are Now There is little question that the most significant influence on the design of American communities is the automobile. About eighty percent of America has been built in the last fifty years. 2 During those years, the design of everything from homes, neighborhoods, shopping center, schools, workplaces and churches have been profoundly shaped around the car. This is true not only for the site-specific placement of driveways and parking lots, but also the distribution and mixing of land uses. Accommodations to the automobile came not simply as the logical outgrowth of an additional mode of travel, but often at the expense of bicycling, walking and transit. Increases in automobile volumes and 1 Disability Status: Census 2000 Brief. 2 Jim Kunstler, Geography of Nowhere. 3
24 speeds have made sharing a roadway uncomfortable and often unsafe. Also, the need for additional rights-of-way to accommodate added vehicle lanes has regularly come at the expense of space typically set aside for sidewalks. The pattern of public investment in motor vehicle transportation above all other modes has resulted in an overall reduction in transportation options for the average citizen. Communities are now weighing the convenience of the automobile against the consequences of its use at current levels and trying to strike a balance. The direct and indirect consequences include: Current guidelines for exercise call for one hour of activity daily. Physical inactivity is a primary factor in at least 200,000 deaths annually and 25% of all chronic disease-related deaths. 3 Forty percent of adults do not participate in any leisure time physical activity; 4 of those who do participate in exercise, 66.1% use their local streets. 5 About 40% of all trips are estimated to be less than two miles which is an easy distance for walking or bicycling, provided appropriate facilities are available. In practice, automobiles are used for 76% of all trips under one mile and 91% of all trips between one and two miles. 6 While money for bicycle and pedestrian projects has increased dramatically since 1989 with the passage of federal transportation programs known as ISTEA and TEA-21, in Michigan, only $0.16 per person is spent on pedestrian facilities vs. $58.49 per person on highway projects annually. 7 The nation is experiencing an obesity epidemic; 61% of Michigan s adults are considered overweight, which is the second highest rate in the country. 8 While there may be other significant factors, the increase in obesity nationally over the past fifteen years corresponds with an increase in the number of miles driven and a decrease in the number of trips made by walking and bicycling. This epidemic is estimated to result in $22 billion a year in health care and personal expenses. 9 In southeast Michigan, people spend on average 18.8% of their income on transportation, second only to shelter at 19.1%. 10 The number of children that walk or bike to school has dropped 37% over the last twenty years. 11 The increase in traffic caused by parents taking their children to and from school and other activities has been estimated to be 20 to 25% of morning traffic. Half of the children hit by cars while walking or bicycling to school were hit by parents of other children. 12 Today only about 8% of children walk to school. 3 Ibid. 4 W.C. Wilkinson, et. al. Increasing Physical Activity through Community Design: A Guide for Public Health Practitioners. Washington: National Center for Bicycling and Walking. May Brownson, Dr. Ross, et.al. Environmental and policy determinants of physical activity in the United States, American Journal of Public Health, Dec Chicago Department of Transportation 7 Surface transportation Policy Project, Mean Streets 2000, Michigan Governor s Council on Physical Fitness, Health, and Sports. 9 Ed Pavelka, Can Commuting Help You Lose Weight?, League of American Bicyclists, Summer Surface Transportation Policy Project, Driven to Spend, W.C. Wilkinson, et. al. Increasing Physical Activity through Community Design: A Guide for Public Health Practitioners. Washington: National Center for Bicycling and Walking. May Michigan Governor s Council on Physical Fitness, Health, and Sports. 4
25 The result of automobile emissions on public health is just beginning to be understood. In Atlanta during the 1996 Olympics, there was a 22.5% reduction in automobile use; during the same period of time admissions to hospitals due to asthma decreased by 41.6%. 13 In Michigan, non-motorized trips account for about 7% of all trips, but make up about 12% of all traffic fatalities and severe injuries. Non-motorized modes are not inherently dangerous; communities have been able to significantly increase the non-motorized mode-share while simultaneously decreasing the number of non-motorized crashes. Emerging research is showing the single most important factor for improving bicycle and pedestrian safety is increasing the number of bicyclists and pedestrians. Despite these circumstances, local public demand for improved facilities is significant as made evident by the Community Attitude and Interest Survey conducted in the winter of % of the households indicated that they have a need for walking and bicycling trails. This was nearly double the need stated for the next highest category. The Intention of This Plan The purpose of this plan is to provide a general background on the issues of non-motorized transportation as well as to present a proposal on how to address the issues through policies, programs, and design guidelines for facility improvements. This is not intended to be a replacement for the AASHTO Guide for the Development of Bicycle Facilities, AASHTO Guide for the Planning, Design, and Operation of Pedestrian Facilities, AASHTO Guide for Achieving Flexibility in Highway Design, USDOT s Designing Sidewalks and Trails for Access Part II, Best Practices Design Guide, the pending Guidelines for Accessible Public Rights-of-Way, MUTCD, MMUTCD or any other applicable federal, state, or local guidelines. Rather, it is intended as a synthesis of key aspects of those documents to provide an interpretation on how they may be applied in typical situations in the City of Novi. Given the evolving nature of non-motorized transportation planning, these guidelines should be periodically reevaluated to determine their appropriateness. The specific facility recommendations within this plan represent a Master Plan level evaluation of the suitability of the proposed facilities for the existing conditions. Prior to proceeding with any of the recommendations in this report though, a more detailed corridor level assessment or traffic study should be done in order to fully investigate the appropriateness of the proposed roadway modifications and/or proposed bicycle or pedestrian facilities. 13 Friedman, Michael S., et. al. Impact of Changes in Transportation and Commuting Behaviors During the 1996 Summer Olympic Games in Atlanta on Air Quality and Childhood Asthma, Journal of the American Medical association, February 21,
26 1.2 Glossary of Terms Within this document there are a number of terms that may be unfamiliar to many people. The following is a brief glossary of some of the transportation terms that are found in this document: AASHTO American Association of State Highway & Transportation Officials. Bicycle Quality/Level of Service (Bike Q/LOS) a model for evaluating the perceived safety and comfort of bicycling in a roadway based on conditions within the road (not surrounding land uses) expressed as a letter grade with A being best and F being worst. Bicycle Boulevard - a low-volume and low-speed street that has been optimized for bicycle travel through treatments such as traffic calming and traffic reduction; signage and pavement markings; and intersection crossing treatments. Bike Lane a portion of the roadway designated for bicycle use. Pavement striping and markings sometimes accompanied with signage are used to delineate the lane. Examples can be found on portions of South Lake Drive, East Lake Drive and Taft Road. Bike Route a designation that can be applied to any type of bicycle facility. It is intended as an aid to help bicyclists find their way to a destination where the route is not obvious. Bulb-outs see Curb Extensions. Clear Zones area free of obstructions around roads, Shared-use Paths, and Walkways. Clearance Interval the flashing Don t Walk or flashing Red Hand phase of pedestrian signals. It indicates to pedestrians that they should not begin to cross the street. A correctly timed clearance interval allows a pedestrian who entered the crosswalk during the Walk phase to finish crossing the street at an unhurried pace. Complete Street- streets that are planned, designed, operated and maintained such that all users may safely, comfortably and conveniently move along and across streets throughout a community. Crossing Islands a raised median within a roadway typically set between opposing directions of traffic that permits pedestrians to cross the roadway in two stages. A crossing island may be located at signalized intersections and at unsignalized crosswalks. These are also known as Refuge Islands. Crosswalk the area of a roadway that connects sidewalks on either side at an intersection of roads (whether marked or not marked) and other locations distinctly indicated for pedestrian crossings by pavement markings. Curb Extensions extending the curb further into the intersections in order to minimize pedestrian crossing distance, also known as Bulb-outs. Dispersed Crossing where pedestrians typically cross the road at numerous points along the roadway, rather than at an officially marked crosswalk. E-Bike a bicycle that is propelled by an electric motor and/or peddling. 6
27 Fines finely crushed gravel 3/8 or smaller. The fines may be loosely applied or bound together with a stabilizing agent. Inside Lane the travel lane adjacent to the center of the road or the Center Turn Lane. Ladder Style Crosswalk a special emphasis crosswalk marking where 1 to 2 wide white pavement markings are placed perpendicular to the direction of a crosswalk to clearly identify the crosswalk. Lateral Separation horizontal distance separating one use from another (pedestrians from cars, for example) or motor vehicles from a fixed obstruction such as a tree. Leading Pedestrian Interval a traffic signal phasing approach where the pedestrian Walk phase precedes the green light going in the same direction by generally 4 to 5 seconds. Level of Service (LOS) a measurement of the motor vehicle flow of a roadway expressed by a letter grade with A being best or free flowing and F being worst or forced flow/heavily congested. Also see Bicycle Level of Service and Pedestrian Level of Service. Long-term Plan reflects the vision of the completed non-motorized system. Some improvements may require the reconstruction of existing roadways, the acquisition of new right-of-way, or significant capital investments. Mid-block Crossings locations that have been identified based on land uses, bus stop locations and the difficulty of crossing the street as probable candidates for Mid-block Crosswalks. Additional studies will need to be completed for each location to determine the ultimate suitability as a crosswalk location and appropriate solution to address the demand to cross the road. Mid-block Crosswalk a crosswalk where motorized vehicles are not controlled by a traffic signal or stop sign. At these locations, pedestrians wait for a gap in traffic to cross the street, motorists are required to yield to a pedestrian who is in the crosswalk (but not if the pedestrian is on the side of the road waiting to cross). MMUTCD Michigan Manual of Uniform Traffic Control Devices. This document is based on the National Manual of Uniform Traffic Control Devices (MUTCD). It specifics how signs, pavement markings and traffic signals are to be used. The current version is the 2005 MMUTCD. It was adopted on August 15, 2005 and is based on the 2003 National MUTCD. In 2009 a new National MUTCD was adopted, the state has two years to adopt the national manual. Typically, there are only minor divergences between the two manuals due to specifics in Michigan traffic laws. Mode-share / Mode split the percent of trips for a particular mode of transportation relative to all trips. A mode-share / mode split may be for a particular type of trip such as home-to-work. Mode distinct types of transportation (cars, bicycles and pedestrians are all different modes of travel). MVC Michigan Vehicle Code, a state law addressing the operation of motor vehicles and other modes of transportation. Near-term Opportunities improvements that may generally be done with minimal changes to existing roadway infrastructure. They include road re-striping projects, paved shoulders, new sidewalks and crossing islands. In general, existing curbs and drainage structures are not changed. 7
28 Neighborhood Greenway a route that utilizes residential streets and short connecting pathways that link destinations such as parks, schools and Shared Use Paths. Neighborhood Greenways may contain the characteristics of a Bicycle Boulevard but, in addition, provide accommodations for pedestrians and sustainable design elements such as rain gardens. Out-of-Direction Travel travel in an out-of-the-way, undesirable direction. Outside Lane the travel lane closest to the side of the road. Off-road Trail see Shared Use Path Pedestrian Desire Lines preferred pedestrian direction of travel. Pedestrian Quality/Level of Service (Ped. Q/LOS) a model for evaluating the perceived safety and comfort of the pedestrian experience based on conditions within the road ROW (not surrounding land uses) expressed as a letter grade with A being best and F being worst. Refuge Islands see Crossing Islands. Roundabouts yield-based circular intersections that permit continuous vehicle travel movement. Shared Roadway bicycles and vehicles share the roadway without any portion of the road specifically designated for the bicycle use. Shared Roadways may have certain undesignated accommodations for bicyclists such as wide lanes, paved shoulders, and/or low speeds. These routes may also be signed and include pavement markings such as shared-use arrows. Shared Lane Markings a pavement marking consisting of a bike symbol with a double chevron above, also known as sharrows. These pavement markings are used for on-road bicycle facilities where the right-of-way is too narrow for designated bike lanes. The shared lane markings alerts cars to take caution and allow cyclist to safely travel in these lanes when striping is not possible. They are often used in conjunction with signage. Shared Use Path a wide pathway that is separate from a roadway by an open unpaved space or barrier or located completely away from a roadway. A Shared Use Path is shared by bicyclists and pedestrians. There are numerous sub-types of Shared Use Paths including Sidewalk Bikeways that have unique characteristics and issues. An example of a Shared Use Path would be the I-275 Metro Trail. Shy Distance the distance that pedestrians, bicyclists and motorists naturally keep between themselves and a vertical obstruction such as a wall or curb. Sidepath see Roadside Pathway Roadside Pathway a specific type of Shared Use Path that parallels a roadway generally within the road right-of-way. This is also known as a Sidepath. Signalized Crosswalk a crosswalk where motor vehicle and pedestrian movements are controlled by traffic signals. These are most frequently a part of a signalized roadway intersection but a signal may be installed solely to facilitate pedestrians crossings. 8
29 Speed Table raised area across the road with a flat top to slow traffic. Splitter Islands crossing islands leading up to roundabouts that offer a haven for pedestrians and that guide and slow the flow of traffic. They may also be used at intersections in place of a turning lane. UTC Uniform Traffic Code, is a set of laws that can be adopted by municipalities to become local law that address the operation of motor vehicles and other modes of transportation. The UTC is a complementary set of laws to the MVC. Yield Lines a row of triangle shaped pavement markings placed on a roadway to signal to vehicles the appropriate place to yield right-of-way. This is a new pavement marking that is used in conjunction with the new Yield to Pedestrians Here sign in advance of marked crosswalks. 9
30 10
31 2. Inventory and Analysis The major influences on non-motorized travel may be distilled down to two factors: the physical environment and the social environment. The influence of the physical environment is not limited to the existence of specific facilities such as bike lanes and sidewalks. Just as important as facilities is the underlying urban form. The majority of bicycle and pedestrian trips are for short distances. Even with first-rate facilities, large blocks of homogeneous land uses and spread-out development will inhibit many non-motorized trips. The City of Novi and Oakland County as a whole are at a key juncture. Mainstream media has begun to cover the health and economic implications of our land use and transportation infrastructure decisions. Community leaders and citizen activists are calling for a greater emphasis on non-motorized travel. Yet, there is a tremendous physical and institutional legacy to overcome. Topics: 2.1 General Conditions 2.2 The Pedestrian Environment 2.3 The Bicycling Environment 2.4 Projected Energy Savings 11
32 2.1 General Conditions The City of Novi generally consists of dispersed land uses that for the most part, are scaled towards automobile use. Typical of the region, Novi has a primary road system based on a one mile grid with commercial centers located along the busy roadways frequently crusted at the intersections as well as near freeway interchanges. Bicycle and pedestrian travel outside of neighborhood streets generally follows the primary road system on sidewalks and roadside pathways, although there are some bike lanes in the north and south of town. Opportunities to cross the primary road system are limited with poor bicycle and pedestrian connectivity between neighborhoods that are located on opposite sides of the roadway. Over the past number of years, the City of Novi has systematically been adding sidewalks and pathways along the primary road system. However, there are still numerous gaps remaining in the system which makes many trips challenging. Trips on unfamiliar routes may often result in a dead end without an obvious alternative. The artificial barriers of the railroad, expressways and the four and five-lane arterials also tend to fragment the City from a non-motorized standpoint. The result is a non-motorized environment that is generally not favorable to walking and bicycling for everyday transportation but is capable of providing for more recreational based trips. Many of the city s primary roads though are only two to three lanes wide. These roads may be more easily converted to a more bicycle and pedestrian corridors. The following maps provide a general summary of the existing conditions in the City of Novi: Fig. 2.1A. City Overview Fig. 2.1B. Existing Land Use Fig. 2.1C. Future Lane Use Fig. 2.1D. Population Density Fig. 2.1E. Existing Trails Inventory Fig. 2.1F. Regional Trails Inventory Fig. 2.1G. Existing Sidewalks and Roadside Pathways Fig. 2.1H. Road Jurisdiction Fig. 2.1I. Transportation Improvement Projects Fig. 2.1J. Average Daily Traffic Volumes Fig. 2.2 K. Posted Speed Limit Fig. 2.2 L. Existing Road Cross-Sections Fig. 2.1M. Block Size 12

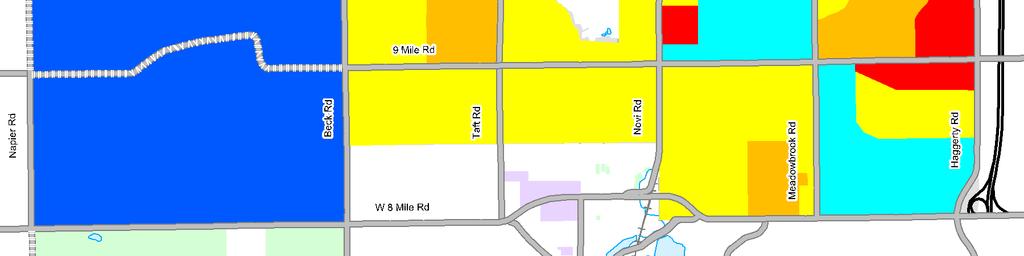
33 Fig. 2.1A. City Overview Population: currently estimated to be 52,231 (city special census, 2007) Size: Over 30 Square Miles 13


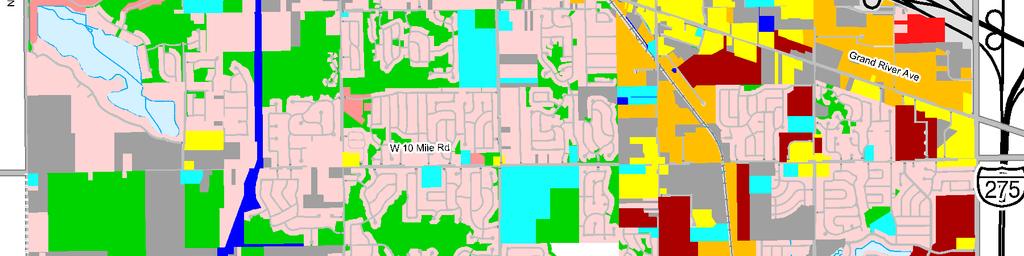


34 Fig. 2.1B. Existing Land Use (As of 2008) 14


 15")

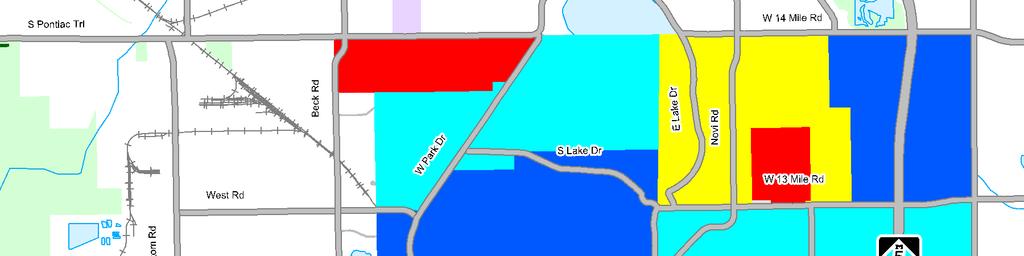
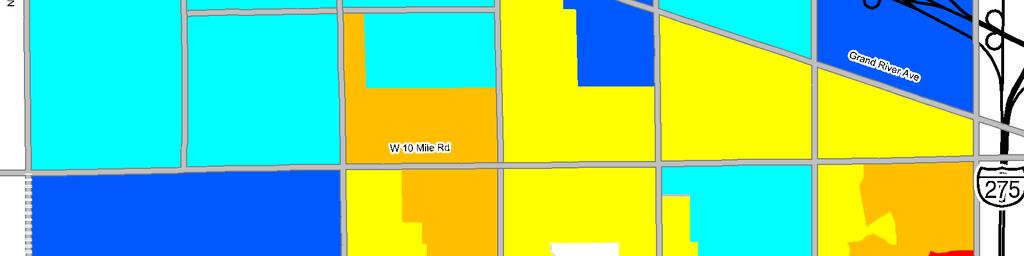
35 Fig. 2.1C. Future Land Use (As of 2010) Suburban (Low Rise) 15

36 Fig. 2.1D. Population Density Based on the 2007 special census. 16


37 Fig. 2.1E. Existing Trails Inventory The I-275 Metro Trail is a 40 mile bikeway that links communities in Wayne, Oakland and Monroe counties. The trail terminates at Meadowbrook Road just south of the I-96 expressway. The M-5 Metro Trail was recently built in 2010 with plans to extend north along M-5. 17


38 Fig. 2.1F. Regional Trails Inventory M-5 Metro Trail The existing I-275 Metro Trail and under development M-5 Metro Trail runs up the eastern border of the city. When completed it will provide a key link between the extensive regional trail system to the south and the proposed cross state trail to the north. The ITC corridor that generally runs north-south between Wixom Road and Beck Road between Maybury State Park and just east of Lyon Oaks County Park has the potential to link key regional parks to the residents. 18


39 Fig. 2.1G. Existing Sidewalks and Roadside Pathways Along major roadways, the city generally has 5 concrete sidewalks on one side of the road and 8 asphalt pathways on the other side of the road. In 2006 the City of Novi Pathway and Sidewalk Prioritization Analysis and Process was approved by the City Council. Since that time the City of Novi has completed around 20,000 feet of pathways and sidewalks and developers completed over 10,000 feet of pathways and sidewalks in the City of Novi. 19


40 Fig. 2.1H. Road Jurisdiction Roads owned by the state and managed by the Michigan Department of Transportation (MDOT) are shown in red. Any modifications to these trunkline roads must be coordinated with and approved by MDOT. Likewise any roads shown in blue are under the jurisdiction of the county road commission and any modifications to these roads must be coordinated with and approved by the county road commission. 20
 is a list of all transportation projects receiving federal funding in Southeast Michigan through 2011.")

41 Fig. 2.1I. Transportation Improvement Projects Short Range FY Transportation Improvements (TIP) is a list of all transportation projects receiving federal funding in Southeast Michigan through The TIP represents the priorities of the cities and transportation agencies for implementing Direction 2035, the region s long range transportation plan. Long Range Direction 2035 is the long-range vision for the proper maintenance and expansion of the transportation infrastructure to meet basic transportation and regional sustainability goals. It serves as a guide for developing a transportation system that is accessible, safe and reliable and contributes to a higher quality of life for the region s citizens. The long-range vision guides implementation of the short-range project in the TIP. Only Projects on federal-aid eligible roads are mapped. 21


42 Fig. 2.1J. Average Daily Traffic Volumes Annual Average Daily Traffic (AADT) is an estimate of traffic volumes. The volumes are based on total two-way traffic over a 24-hour period and may vary by season or day of the week. The volumes are determined from a combination of actual traffic counts and modeling. The map shows 2008 data provided by SEMCOG. The gradations used generally reflect noticeable changes in the comfort level of bicyclists sharing a roadway with motorists, all other factors being equal. 22
43 Fig. 2.1K. Posted Speed Limit As of January 2011 Roadways with high speeds can reduce the comfort level for bicycles and pedestrians traveling along a road corridor, and my even discourage bicycle and pedestrian use all together. Actual running speeds are likely higher than posted speeds. Please note that speed limits along some roads are in the process of changing so some of the speeds listed above may be outdated. 23
44 Fig. 2.1L. Existing Road Cross-section As of September 2010 The majority of the roads in the city are two lane roads, although many of these roads have designated turn lanes and by-pass lanes in places. The widest roads for the most part border the freeway corridors. Generally, roadways with numerous designated turn lanes and by-pass lanes present challenges when trying to incorporate bicycle facilities into the existing road cross-section. 24


45 Fig. 2.1M. Block Size Block size is an excellent measurement of directness of travel and a key indicator in the level of pedestrian activity. A block is defined as an area that a person cannot pass through. These areas usually do not have any sidewalks, roadways or bike paths allowing access between two points. One example is an expressway where you may have to go a mile or more out of your way just to get to the other side. The majority of the city s landmass is in blocks over 100 acres in size. There are no large contiguous areas where the block size is 15 acres or less in size. Finding ways to create more direct pedestrian travel ways will be key to making Novi a more walkable community. 25
46 2.2 The Pedestrian Environment The City of Novi has a partially complete sidewalk system along the major roadways, however there are still significant gaps along major roadways in both the built up and more suburban parts of town. The quality of the pedestrian experience on these sidewalks varies greatly throughout the City. Some sidewalks have little if any buffer such as a row of trees or parked cars, between the sidewalk and the roadway. This lack of a barrier has been shown to have a significant adverse impact on the quality of the walking experience. Other sidewalks and roadside pathways are set well back from the road and have substantial vegetated buffer. Another major issue lies with cross-roadway accommodations. There are significant stretches of the major thoroughfares that provide no means to cross the roadway safely. There are also places where logical crossings are not accommodated. Even where there are marked crosswalks, they are often inadequate. Many times the existing crossings are missing key safety features, making them difficult to cross, especially on high speed multi-lane roadways. The following maps provide a general summary of the existing conditions of pedestrian facilities in the City of Novi: Fig. 2.2 A. Pedestrian Crash Locations Fig. 2.2 B. Pedestrian Crash Data Fig. 2.2 C. Existing Sidewalk Quality Fig. 2.2 D. Existing Crosswalk Spacing Analysis Fig. 2.2 E. Existing Road Crossing Difficulty Assessment 26
47 Fig. 2.2A. Pedestrian Crash Locations The crashes shown are from a five year period, There were 30 pedestrian involved crashes, none were fatal and ten resulted in serious injuries. Drinking or drug use was involved in 3 of the crashes. There was no traffic control at 70% of the crash locations. The Michigan Traffic Crash Fact website was the source of the data and charts. 27


48 Fig. 2.2B. Pedestrian Crash Data Month of Crash Pedestrian crashes occurred in every month except February. Day of Week Crashes took place on every day of the week with the most occurring on a Friday. Time of Day All but one crash took place between 6:00 AM and 10 PM. Half the crashes took place during daylight, 7% took place during dawn and 40% took place in the dark (3% were not coded). 28


49 Road Conditions Wet, Snowy or Icy roads were a factor in about half the crashes. Area of Road at Crash 43% of the crashes are related to an intersection or driveway. Relation to Roadway 70% of the crashes took place on the roadway. 29


50 Sidewalk Quality A key factor to a pedestrians comfort level on a sidewalk is the degree of separation from the roadway. Elements such as lawn buffers and vertical elements tend to make a pedestrian feel more separated from the roadway, increasing the pedestrian s level of comfort when on a sidewalk. The sidewalk quality rating system is designed to help identify a pedestrian s level of comfort when on a sidewalk based on the amount of separation from the roadway. The rating system is broken up into five categories A, B, C, D and E. A sidewalk with a rating of A has the best pedestrian comfort level and a sidewalk with a rating of E has the worst pedestrian comfort level. A - Rating Sidewalk is setback from roadway and contains vertical elements such as closely spaced trees and/or light poles. B - Rating Sidewalk is setback from roadway but contains no vertical elements. C - Rating Sidewalk is directly adjacent to the roadway along the curb and has no buffer space or vertical elements. D - Rating No sidewalk facility is built, but the area is physically passable by foot. E - Rating No sidewalk facility is built and the area is not physically passable by foot. Physical barriers such as streams or expressway overpasses usually contribute to this type of situation. 30


51 Fig. 2.2C. Existing Sidewalk Quality A key factor to a pedestrians comfort on a sidewalk is the degree of separation from the roadway. Buffer (lawn extensions) and vertical elements such as trees and light poles increase the pedestrians comfort level. 31


52 Fig. 2.2D. Existing Crosswalk Spacing Analysis Crosswalk spacing is a key factor in directness of travel. Most pedestrian trips for personal business (like walking to the store) are about ½ mile long. Where there is demand to cross the road and crosswalk spacing is over 1/8 of a mile apart, midblock crossings are likely to occur. There are numerous stretches or roadway on primary streets within the city with over ½ mile between crosswalks. This analysis measures the distance that a pedestrian would have to travel in order to cross the road at a designated crossing. This analysis was based on existing conditions. Signalized intersections without pedestrian crossings were not used in this calculation because they do not provide a safe crossing. However, please note that existing signalized crossings that were used in this analysis may not be up to ADA standards, so even if they have a crossing, they may not be accessible to everyone. 32

53 Fig. 2.2E. Existing Road Crossing Difficulty Assessment Road crossing difficulty is a measurement of how difficult a person would typically find it to cross a road at an unmarked mid-block crosswalk. It is based on the number of lanes, speed and average daily traffic. Overall, it is generally difficult to cross with ADT being the most restrictive factor on primary roads in the city. Grade Lanes Speed ADT A 2 <30 <5,000 B ,000 10,000 C ,000 15,000 D ,000 20,000 E ,000+ Road crossing difficulty is based on the number of lanes, speed limit and daily traffic volumes. For example a road that has 25,000ADT, 4 lanes and a posted speed limit of 40mph with no existing bike lane would get a E rating. A 5 lane with a speed limit of 40mph receives a D rating, however the 25,000ADT makes it a E rating because the most restrictive rating is applied (please refer to the chart above). 33
54 2.3 The Bicycling Environment The approach to handling bicycles in the City is inconsistent and incomplete. Most of the efforts have been put toward the roadside pathways. There are a few short segments of existing bike lanes in the city. There is a one-way bike lane on South Lake Drive and a two-way bike lane on East Lake Drive with a short pathway connecting the two. There is also a bike lane on Taft Road south of 9 Mile Road. Currently the Pathways along the side of the arterial and collector roads function as the main bicycle facilities. However, this system is incomplete and many bicyclists may prefer to ride in the roadway when commuting across town. Even together, the on-road and off-road facilities do not make for a complete system and transfers between on-road and off-road facilities are not logical or convenient. The following maps provide a general summary of the existing conditions in the City of Novi: Fig. 2.3A. Bicycle Crash Locations Fig. 2.3B. Bicycle Crash Data Fig. 2.3C. Roadside Pathway Conflicts Fig. 2.3D. In-Road Bicycling Quality Assessment 34
55 Fig. 2.3A. Bicycle Crash Locations The crashes shown are from a five year period, There were 31 bicycle involved crashes, none were fatal and six resulted in serious injury. Drinking or drug use was involved in 1 of the crashes. There was no traffic control at 38% of the crashes; a signal was present at 43% and a stop sign at 19% of the locations. The Michigan Traffic Crash Fact website was the source of the data and charts. 35


56 Fig. 2.3B. Bicycle Crash Data Month of Crash There were no crashes during the months of December, January, February and March. This is likely due to fewer bicyclists during the winter months and that winter bicyclists are more experienced bicyclists. Day of Week Crashes were evenly distributed throughout the week. Time of Day The crashes took place between 7:00 AM and 10 PM. 81% of the crashes took place in daylight, 5% at dusk and 10% took place when it was dark (9% were not coded). 36


57 Road Conditions The road was dry for 80% of the crashes. Area of Road at Crash 67% of the crashes were related to a driveway or intersection. Relation to Roadway 86% of the crashes took place in the roadway. 37
.")

58 Fig. 2.3C. Roadside Pathway Conflicts A conflict point is a local road or high traffic volume commercial driveway. For this analysis, each segment of sidewalk between two major roadways was given a rating from A to E based on the number of conflict points (see legend). Ten minor/residential driveways or one local road or high volume driveway was considered equal to one conflict point. The AASHTO Guide for the Development of Bicycle Facilities generally considers sidewalks undesirable as shareduse paths. This is due to the inherent conflicts between bicycles and motorists where a pathway intersects with driveways and roads. Suitable sidepath locations are uninterrupted by driveways and roadways for long distances and provide safe and convenient road crossing opportunities to destinations on the other side of the road. 38

59 Fig. 2.3D. In-Road Bicycling Quality Assessment In-road bicycling facilities improve the quality of the bicycling experience on busy roads. Quality of the in-road bike facilities is based on speed limit and daily traffic volumes. A road with an existing bike lane has a higher quality; however, there are few existing bike lanes in the city. Without Bike Lane With Bike Lane ADT Speed Limit A A 0 5, B A 5,000 10, C B 10,000 15, D C 15,000 20, E C 20,000 25, E D Over 25, Quality of the in-road bike facilities is based on speed limit and daily traffic volumes. For example a road that has 12,000ADT and a posted speed limit of 40mph with no existing bike lane would get a D rating. An ADT of 12,000 puts the road in the C range, however the 40mph speed limit makes it a D rating because the most restrictive rating is applied (please refer to the chart above). 39
60 2.4 Projected Energy Savings The desire to expand non-motorized transportation choices is generally driven by two factors. First, is the goal to accommodate non-motorized transportation given the numerous economic, social and public health benefits. The second goal is to reduce the number of Vehicle Miles Traveled (VMT) and the corresponding reduction in Green House Gas (GHG) emissions. This could include shifting trips from single occupancy motor vehicles to bicycling, walking or transit. Regardless of the goal, the question is what change in transportation choices will occur if the environment for walking or bicycling is improved? Answering this question precisely is hampered by limited data, sparse research on the subject, and the nuances that go into any transportation choice. What is likely, though, is that the number of people who walk and bicycle will increase when the environment for bicycling and walking is improved. It should be noted though that these increases in walking and bicycling do not necessarily have a reciprocal increase in bicycle and pedestrian crashes. Rather, with improved facilities and increases in the number of bicyclists and pedestrians, the crash rates typically decrease as motorists become accustomed to the presence of non-motorized traffic. One of the least understood aspects of transportation planning is the notion of self-selection. It has been demonstrated that individuals who move to an area with a better non-motorized environment will indeed walk and bicycle more 1. What is unknown is how much of that increase is the result of the environment alone vs. how much is the result of an individual s choice to live in a place because its environment supports bicycling and walking. Existing Commuter Mode-split To understand Novi s potential to increase the number of people walking and bicycling, it is helpful to look at Novi s current bicycling and walking trends compared to other communities. Then we may be able to gauge approximately how many more people may be enticed to walk and bicycle. The mode-split is the overall proportion of trips made by a particular mode of travel. This information is generally determined by surveys or census data. When looking at how Novi compares to other cities between 40,000 and 60,000 in population, its pedestrian and bicycle commute numbers are the second lowest. The percent that commute by bike, 0.2%, is the third lowest of its peers and well below the peer communities average of 0.4% and the national average of 0.5%. The percent that walk, 0.5%, is the second lowest of its peers and significantly below the peer city average of 3% and the national average of 2.8%. These numbers can likely be attributed to the dispersed land uses in the city which make biking to work a more realistic option than walking to work. It is likely as Novi continues to develop its commercial core into a more pedestrian friendly environment surrounded by higher density residential development, the percentage of non-motorized trips in the City will rise if appropriate non-motorized linkages are established. As noted earlier, the greatest increase in non-motorized trips will likely come from bicyclists given the land use patterns in the City of Novi. 1 Krizek, Kevin J., Residential Relocation and Changes in Urban Travel: Does Neighborhood-Scale Urban Form Matter? Journal of the American Planning Association. Spring, Vol. 69, No. 3, p

61 Table 2.4A Commute to Work Comparison From the US 2000 Census commute to work data as compiled in the online Carfree Census Database found at Bikesatwork.com, compiled by Bikes At Work, Inc., Ames, IA. It should be noted that the inclusion of East Lansing in the table as a peer city is may not be a fair comparison. University towns such as East Lansing have significantly higher rates of non-motorized trips than non-university towns. But in 2000, East Lansing had very few bicycle and pedestrian facilities. In fact none of the peer communities had a significant number of bicycle facilities. Thus, the 3.1% of commuters who bike in East Lansing may not be an unrealistic target when Novi s physical, social and economic environments for walking and bicycling have improved substantially. Probable Mode Shift Due to Environmental Change California Department of Transportation (Caltrans) Air Resources Board has developed guidelines to determine the emission reduction benefits associated with auto trips replaced by bicycle trips. Their research concluded that the key aspect in projecting the percent of trips that may done by bicycle is the ratio of bicycle lane miles to arterial/freeway miles. They concluded that if the ratio is less than 0.35 then a 0.65% bicycle mode share should be projected. If the ratio is greater than 0.35 a 2% mode share should be used (or 6.8% for university towns). While it may seem easy to dismiss these numbers because they are from California, a state with a much milder climate that Michigan, climate is not the factor most people think it is. In fact, the 2000 census commute data show that many of the cities with the highest percentage of bicycle commuters are from northern climates: Boulder, Colorado - 7.4%, Aspen, Colorado - 6.6%, Missoula, Montana -5.9% and Madison, Wisconsin, 3.29%. These percentages are also ten years old. The 2009 National Household Travel Survey found that bicycling and walking has increased by 25% from
City of Novi Non-Motorized Master Plan 2011 Executive Summary
 City of Novi Non-Motorized Master Plan 2011 Executive Summary Prepared by: February 28, 2011 Why Plan? Encouraging healthy, active lifestyles through pathway and sidewalk connectivity has been a focus
Perryville TOD and Greenway Plan
 Perryville TOD and Greenway Plan Greenway Glossary Pathway: A bicycle and pedestrian path separated from motorized vehicular traffic by an open space, barrier or curb. Multi-use paths may be within the
Physical Implications of Complete Streets Policies
 Presentation Overview Physical Implications of Complete Norm Cox, ASLA, LLA Landscape Architect Ann Arbor, Michigan, 10:45 to Noon What Are Complete Streets? What Matters to Bicyclists and Pedestrians
PEDESTRIAN ACTION PLAN
 ATTACHMENT 2 CITY OF SANTA MONICA PEDESTRIAN ACTION PLAN CITY OF SANTA MONICA PEDESTRIAN ACTION PLAN This page intentionally left blank EXECUTIVE SUMMARY CHAPTER 1 EXECUTIVE SUMMARY Setting the Stage
o n - m o t o r i z e d transportation is an overlooked element that can greatly enhance the overall quality of life for the community s residents.
 N o n - m o t o r i z e d transportation is an overlooked element that can greatly enhance the overall quality of life for the community s residents. 84 Transportation CHAPTER 11 INTRODUCTION Transportation
TOWN OF PORTLAND, CONNECTICUT COMPLETE STREETS POLICY
 TOWN OF PORTLAND, CONNECTICUT COMPLETE STREETS POLICY I. VISION, GOALS & PRINCIPLES VISION To improve the streets of Portland making them safer and more accessible for all users including pedestrians,
NM-POLICY 1: Improve service levels, participation, and options for non-motorized transportation modes throughout the County.
 Transportation PRINCE WILLIAM COUNTY 2008 COMPREHENSIVE PLAN NON-MOTORIZED PLAN CONTENTS Goals, Policies, and Action Strategies Table 4 (Bike Facility Classifications and Descriptions) Table 5 (Bike Facility
REGIONAL BICYCLE AND PEDESTRIAN DESIGN GUIDELINES
 REGIONAL BICYCLE AND PEDESTRIAN DESIGN GUIDELINES November 16, 2011 Deb Humphreys North Central Texas Council of Governments Bicycle and Pedestrian Advisory Committee Snapshot of the Guide 1. Introduction
ACTIVE TRANSPORTATION
 ACTIVE TRANSPORTATION Mobility 2040 Supported Goals Improve the availability of transportation options for people and goods. Support travel efficiency measures and system enhancements targeted at congestion
Proposed. City of Grand Junction Complete Streets Policy. Exhibit 10
 Proposed City of Grand Junction Complete Streets Policy Exhibit 10 1 City of Grand Junction Complete Streets Policy Vision: The Complete Streets Vision is to develop a safe, efficient, and reliable travel
CONNECTING PEOPLE TO PLACES
 CONNECTING PEOPLE TO PLACES 82 EAST BENCH MASTER PLAN 07 Introduction The East Bench transportation system is a collection of slow moving, treelined residential streets and major arteries that are the
Living Streets Policy
 Living Streets Policy Introduction Living streets balance the needs of motorists, bicyclists, pedestrians and transit riders in ways that promote safety and convenience, enhance community identity, create
CITY OF BLOOMINGTON COMPLETE STREETS POLICY
 CITY OF BLOOMINGTON COMPLETE STREETS POLICY POLICY OBJECTIVE: The City of Bloomington will enhance safety, mobility, accessibility and convenience for transportation network users of all ages and abilities,
G AT E WAY PLAN. Community BRIEFING KIT GATEWAY BIKE
 G AT E WAY PLAN GATEWAY BIKE Community BRIEFING KIT PLAN August 2016 TABLE OF CONTENTS INTRODUCTION... 1 THE BENEFITS OF A BIKEABLE COMMUNITY... 2 ECONOMY...2 SAFETY...3 HEALTH...3 HOUSEHOLD SPENDING...3
Non-Motorized Transportation 7-1
 Non-Motorized Transportation 7-1 Transportation facilities no longer mean just accommodating a vehicle powered by a combustion engine. Pedestrian and non-motorized facilities are important modes of travel
APPENDIX A: Complete Streets Checklist DRAFT NOVEMBER 2016
 APPENDIX A: Complete Streets Checklist DRAFT NOVEMBER 2016 Complete Streets Checklist MetroPlan Orlando s Complete Streets Checklist is an internal planning tool for staff to further implementation of
CITY OF COCOA BEACH 2025 COMPREHENSIVE PLAN. Section VIII Mobility Element Goals, Objectives, and Policies
 CITY OF COCOA BEACH 2025 COMPREHENSIVE PLAN Section VIII Mobility Element Goals, Objectives, and Policies Adopted August 6, 2015 by Ordinance No. 1591 VIII MOBILITY ELEMENT Table of Contents Page Number
Broad Street Bicycle Boulevard Design Guidelines
 Broad Street Bicycle Boulevard Design Guidelines Building from the strategies introduced in the 2013 Bicycle Transportation Plan and community input received thus far, City Transportation Staff have identified
5. Pedestrian System. Accomplishments Over the Past Five Years
 5. Pedestrian System Accomplishments Over the Past Five Years The Alamo Area Metropolitan Planning Organization (MPO) and its partner agencies recognize the importance of improving pedestrian mobility.
City of Birmingham Draft Multi-modal Transportation Plan
 City of Birmingham Draft Multi-modal Transportation Plan City Commission Public Hearing Monday, November 25, 2013 7:30 pm Norman Cox, PLA, ASLA The Greenway Collaborative, Inc. Ann Arbor, Michigan The
Appendix 3 Roadway and Bike/Ped Design Standards
 Appendix 3 Roadway and Bike/Ped Design Standards OTO Transportation Plan 2040 4/20/2017 Page A3-1 Adopted Standards The adopted OTO Design Standards and Major Thoroughfare Plan are contained herein.
City of East Lansing Non-motorized Transportation Plan
 City of East Lansing Non-motorized Transportation Plan Prepared for: City of East Lansing Prepared by: May 11, 2011 Contents 1. Introduction...1 1.1 Glossary of Terms... 2 2. Existing Conditions...7 2.1
Chapter 2. Bellingham Bicycle Master Plan Chapter 2: Policies and Actions
 Chapter 2 Bellingham Bicycle Master Plan Chapter 2: Policies and Actions Chapter 2: Policies and Actions The Bicycle Master Plan provides a road map for making bicycling in Bellingham a viable transportation
Chapter VISION, MISSION, AND GOALS AND OBJECTIVES. Vision. Mission. Goals and Objectives CONNECTING COMMUNITIES ACROSS THE ST.
 VISION, MISSION, AND GOALS AND OBJECTIVES Chapter 3 The Plan s vision, mission, and goals and objectives were developed through a series of interactive exercises with the Citizens Advisory Committee (CAC)
Chapter 7. Transportation. Transportation Road Network Plan Transit Cyclists Pedestrians Multi-Use and Equestrian Trails
 Chapter 7 Transportation Transportation Road Network Plan Transit Cyclists Pedestrians Multi-Use and Equestrian Trails 7.1 TRANSPORTATION BACKGROUND The District of Maple Ridge faces a number of unique
City of Elizabeth City Neighborhood Traffic Calming Policy and Guidelines
 City of Elizabeth City Neighborhood Traffic Calming Policy and Guidelines I. Purpose: The City of Elizabeth City is committed to ensure the overall safety and livability of residential neighborhoods. One
Solana Beach Comprehensive Active Transportation Strategy (CATS)
") Solana Beach Comprehensive Active Transportation Strategy (CATS) 3.0 Goals & Policies The Solana Beach CATS goals and objectives outlined below were largely drawn from the Solana Beach Circulation Element
Solana Beach Comprehensive Active Transportation Strategy (CATS) 3.0 Goals & Policies The Solana Beach CATS goals and objectives outlined below were largely drawn from the Solana Beach Circulation Element
Chapter 5. Complete Streets and Walkable Communities.
 Chapter 5. Complete Streets and Walkable Communities. 5.1 Description of Complete Streets. Cities throughout the world, and specifically the United States, are coming to embrace a new transportation and
Agenda. Overview PRINCE GEORGE S PLAZA METRO AREA PEDESTRIAN PLAN
 PRINCE GEORGE S PLAZA METRO AREA PEDESTRIAN PLAN May 28, 2008 Agenda Welcome and introductions Project overview and issue identification Planning context and strengths Design challenges and initial recommendations
SANTA CLARA COUNTYWIDE BICYCLE PLAN August 2008
 SANTA CLARA COUNTYWIDE BICYCLE PLAN August 2008 To assist VTA and Member Agencies in the planning, development and programming of bicycle improvements in Santa Clara County. Vision Statement To establish,
Safe Routes to School Action Plan Aberdeen, Idaho
 Background Aberdeen, Idaho is a largely agricultural community of nearly 2,000 people and is located in the southeast portion of the state on the western edge of American Falls Reservoir. The community
The Florida Bicycle and Pedestrian Partnership Council
 The Florida Bicycle and Pedestrian Partnership Council Input to the Update of the Florida Transportation Plan March 2015 This document presents input from the Florida Bicycle and Pedestrian Advisory Council
Exhibit 1 PLANNING COMMISSION AGENDA ITEM
 Exhibit 1 PLANNING COMMISSION AGENDA ITEM Project Name: Grand Junction Circulation Plan Grand Junction Complete Streets Policy Applicant: City of Grand Junction Representative: David Thornton Address:
MASTER BICYCLE AND PEDESTRIAN PLAN
 VILLAGE OF NORTHBROOK MASTER BICYCLE AND PEDESTRIAN PLAN DRAFT PLAN OPEN HOUSE May 2, 2018 AGENDA 1. Community Engagement 2. Vision and Goals 3. General Structure of Plan 4. Recommendations Overview 5.
AMATS Complete Streets Policy
 AMATS Complete Streets Policy Table of Contents: Section 1. Definition of Complete Streets Section 2. Principles of Complete Streets Section 3. Complete Streets Policy Section 4. Consistency Section 5.
NASHUA REGIONAL PLANNING COMMISSION REGIONAL BICYCLE AND PEDESTRIAN PLAN
 NASHUA REGIONAL PLANNING COMMISSION REGIONAL BICYCLE AND PEDESTRIAN PLAN June, 2005 Prepared by the Nashua Regional Planning Commission 2005 NRPC Regional Bicycle and Pedestrian Plan- JUNE 2005 ACKNOWLEDGEMENTS
Goal 3: Foster an environment of partnerships and collaboration to connect our communities and regions to one another.
 Non-Motorized Transportation Plan (NMTP) Draft Vision, Goal and,, Tri-County Regional Planning Commission (TCRPC) Purpose The purpose of the Tri-County Regional Planning Commission (TCRPC) Non-Motorized
NJDOT Complete Streets Checklist
 Background The New Jersey Department of Transportation s Complete Streets Policy promotes a comprehensive, integrated, connected multi-modal network by providing connections to bicycling and walking trip
5/7/2013 VIA . RE: University Village Safeway Expansion (P13-019)
") 5/7/2013 VIA EMAIL David Hung, Associate Planner Community Development Department, Current Planning Division City of Sacramento 300 Richards Boulevard, 3 rd Floor Sacramento, CA 95811 RE: University Village
5/7/2013 VIA EMAIL David Hung, Associate Planner Community Development Department, Current Planning Division City of Sacramento 300 Richards Boulevard, 3 rd Floor Sacramento, CA 95811 RE: University Village
INDOT Complete Streets Guideline & Policy
 INDOT Complete Streets Guideline & Policy INTRODUCTION The Complete Streets guidelines build upon multiple efforts and promote a multimodal transportation system that is integrated and sustains land use
CHAPTER 3: Vision Statement and Goals
 Davidson Walks & Rolls: Active Transportation Master Plan CHAPTER 3 Contents: Overview Vision Statement Measurable Goals Public Outreach CHAPTER 3: Vision Statement and Goals Overview The vision statement
Active Transportation Facility Glossary
 Active Transportation Facility Glossary This document defines different active transportation facilities and suggests appropriate corridor types. Click on a facility type to jump to its definition. Bike
Planning Guidance in the 2012 AASHTO Bike Guide
 Planning Guidance in the 2012 AASHTO Bike Guide Presentation by: RJ Eldridge Peter Lagerwey August 22, 2012 WEBINAR 2: PLANNING GUIDANCE IN THE 2012 AASHTO BIKE GUIDE Today s Webinar Significant Updates
RESOLUTION NO ?? A RESOLUTION OF THE CITY OF NEPTUNE BEACH ADOPTING A COMPLETE STREETS POLICY
 RESOLUTION NO. 2018-?? A RESOLUTION OF THE CITY OF NEPTUNE BEACH ADOPTING A COMPLETE STREETS POLICY WHEREAS, safe, convenient, and accessible transportation for all users is a priority of the City of Neptune
EXECUTIVE SUMMARY. Vision
 Vision Walking and bicycling in Salt Lake City will be safe, convenient, comfortable, and viable transportation options that connect people to places, foster recreational and economic development opportunities,
Bicycle Master Plan Goals, Strategies, and Policies
 Bicycle Master Plan Goals, Strategies, and Policies Mobilizing 5 This chapter outlines the overarching goals, action statements, and action items Long Beach will take in order to achieve its vision of
BIKE PLAN CONTENTS GATEWAY
 CONTENTS Acknowledgments...vii Great Rivers Greenway District Board of Directors... vii Great Rivers Greenway District Staff... vii Project Consultants... vii Committees... viii Citizens Advisory Committee
How to Develop a Pedestrian Safety Action Plan
 How to Develop a Pedestrian Safety Action Plan Course Introduction Presented by: Peter Eun FHWA RC Safety Engineer Ryan Snyder President, Ryan Snyder Associates, LLC Paul Zykofsky Director, Land Use and
Town of Babylon Sustainable Complete Streets Policy
 Town of Babylon Sustainable Complete Streets Policy Steve Bellone, Supervisor Adopted July 14, 2010 1 Table of Contents Vision... 3 Policy Statement... 3 Definition... 3 Road Users... 4 Network... 4 Roads...
General Design Factors
 Chapter 3: 3-1.0 Introduction General Design Factors Mn/DOT s goals include encouraging and accommodating safe bicycling. From a design perspective, these goals are achieved by first having an understanding
Bicycle and Pedestrian Connectivity Study. Old Colony Planning Council
 Bicycle and Pedestrian Connectivity Study Old Colony Planning Council Outline Why consider bike/peds in road designs? Why are measures needed? Connecting Land Use with Transportation Evaluation Tools:
8/31/2016 VIA . RE: Freeport Arco Fuel Station (P16-039)
") 8/31/2016 VIA EMAIL Garrett Norman, Assistant Planner City of Sacramento Community Development Department 300 Richards Boulevard, 3 rd Floor Sacramento, CA 95811 RE: Freeport Arco Fuel Station (P16-039)
8/31/2016 VIA EMAIL Garrett Norman, Assistant Planner City of Sacramento Community Development Department 300 Richards Boulevard, 3 rd Floor Sacramento, CA 95811 RE: Freeport Arco Fuel Station (P16-039)
Omaha s Complete Streets Policy
 Omaha s Complete Streets Policy (Adopted August 2015) VISION To create great places and enhance our quality of life, the City of Omaha will provide safe, accessible streets for all users. Complete Streets
4 Goals, Objectives & Actions
 Chapter4 4 This chapter presents goals, objectives, and recommended actions to support the vision of making Overland Park a safer and easier place to ride a bicycle. 35 4.1 Recommendations Structure The
Bicycle and Pedestrian Chapter TPP Update Overview. TAB September 20, 2017
 Bicycle and Pedestrian Chapter TPP Update Overview TAB September 20, 2017 Bicycling & Walking in the Twin Cities Where are we now? The Bike-Pedestrian system Current trends New developments Where are we
Chapter 2: Standards for Access, Non-Motorized, and Transit
 Standards for Access, Non-Motorized, and Transit Chapter 2: Standards for Access, Non-Motorized, and Transit The Washtenaw County Access Management Plan was developed based on the analysis of existing
Chapter 9: Pedestrians and Bicyclists
 Chapter 9: Pedestrians and Bicyclists Walking and bicycling are essential modes of transportation. These modes allow people to travel without contributing to congestion and air pollution, to access other
Madison Urban Area and Dane County. Bicycle Transportation Plan Summary. September Introduction. Bicycle Plan Scope and Planning Process
 Bicycle Transportation Plan Summary Madison Urban Area and Dane County Introduction September 2000 Bicycling is an important mode of transportation in the Madison urban area and countywide that is available
2.0 Existing Conditions
 20 2.0 Existing Conditions 2.1 Land Use, Future Growth Patterns, Physical Barriers Geographic Overview Sutter County s land use pattern is characterized by extensive agricultural areas, significant natural
5. RUNNINGWAY GUIDELINES
 5. RUNNINGWAY GUIDELINES These guidelines should be considered collectively when making runningway decisions. A runningway is the linear component of the transit system that forms the right-of-way reserved
PRINCE GEORGE S PLAZA METRO AREA PEDESTRIAN PLAN
 PRINCE GEORGE S PLAZA METRO AREA PEDESTRIAN PLAN May 28, 2008 Agenda Welcome and introductions Project overview and issue identification Planning context and strengths Design challenges and initial recommendations
Lee s Summit Road Improvement Study Public Open House June 7, 2007 Summary of Comment Card Responses
 Lee s Summit Road Improvement Study Public Open House June 7, 2007 Summary of Comment Card Responses Introduction At the Lee s Summit Road Improvement Study Public Open House held Thursday, June 7, 2007
MAG Town of Cave Creek Bike Study Task 6 Executive Summary and Regional Significance Report
 Page 1 MAG Town of Cave Creek Bike Study Task 6 Executive Summary and Regional Significance Report August 1, 2012 MAG Project #481 Page 2 Task 6 Executive Summary and Regional Significance Report Introduction
Cyclists and Bikeways: What s your match? A guide to bikeway options for a variety of cyclists
 Cyclists and Bikeways: What s your match? guide to bikeway options for a variety of cyclists The workshop and this resource were made possible by funding from the Province of Ontario via the Ministry of
GRAHAM PEDESTRIAN TRANSPORTATION PLAN
 GRAHAM PEDESTRIAN TRANSPORTATION PLAN Chapter 1 I 1.1 Scope and Purpose n March of 2005, the City of Graham contracted with Greenways Incorporated (GWI) to create a Pedestrian Transportation Plan. The
Bicycle-Pedestrian Master Plan Update
 Bicycle-Pedestrian Master Plan Update Planning & Zoning Commission November 29, 2017 Overview Project Purpose & Scope Project History Plan Vision & Goals Chapter 5: Making Connections-Beyond the Path Next
TRAFFIC CALMING GUIDE FOR TORONTO CITY OF TORONTO TRANSPORTATION SERVICES DIVISION
 TRAFFIC CALMING GUIDE FOR TORONTO CITY OF TORONTO TRANSPORTATION SERVICES DIVISION CITY OF TORONTO TRANSPORTATION SERVICES DIVISION 2016 TRAFFIC CALMING GUIDE FOR TORONTO TABLE OF CONTENTS Introduction
Bicycle and Pedestrian Connectivity Study Phase 2
 Connectivity Study Phase 2 Process PROCESS OUTCOMES Phase Prepared By STEP I Public Participation and Outreach 1. RTP Outreach activities, and development of the Bike and Ped Task Force Phase 1 2011 OCPC
City of Cape Coral Traffic Calming. City Council May 16,
 City of Cape Coral Traffic Calming City Council May 16, 2016 1 In This Presentation Why Traffic Calming? What is Traffic Calming? Examples Traffic Calming in the City of Cape Coral How to develop a Traffic
5 Circulation & Parking
 5 Circulation & Parking Downtown Parking & Circulation Strategy. Downtown Wayne has a somewhat disconnected system of local public streets to connect downtown with the residential neighborhoods, and primary
Corpus Christi Metropolitan Transportation Plan Fiscal Year Introduction:
 Introduction: The Safe, Accountable, Flexible, Efficient Transportation Equity Act: A Legacy for Users (SAFETEA-LU) has continued the efforts started through the Intermodal Surface Transportation Efficiency
Blue Ribbon Commission Report Recommendations on Pedestrian and Bicycle Infrastructure Improvements
 Recommendations on Pedestrian and Bicycle Infrastructure Improvements July 2017 Plan Development: Our committee consisted of seven individuals appointed by the Mayor and Village Board. Those members included:
HARRISON STREET/OAKLAND AVENUE COMMUNITY TRANSPORTATION PLAN
 HARRISON STREET/OAKLAND AVENUE Community Workshop #4: Draft Plan Review December 3, 2009 D E S I G N, C O M M U N I T Y & E N V I R O N M E N T INTRODUCTIONS Key Project Staff: Alisa Shen, Project Manager,
This page intentionally left blank.
 This page intentionally left blank. COMMUNITY Coweta Community Overview Coweta Coweta, a residential community located in Wagoner County, is a suburb of Tulsa situated southeast of the metropolitan area
Transportation Master Plan Advisory Task Force
 Transportation Master Plan Advisory Task Force Network Alternatives & Phasing Strategy February 2016 BACKGROUND Table of Contents BACKGROUND Purpose & Introduction 2 Linking the TMP to Key Council Approved
Thank you for this opportunity to discuss with you how we can work together to make our streets more complete.
 Thank you for this opportunity to discuss with you how we can work together to make our streets more complete. 1 2 3 Thank you for this opportunity to discuss with you how we can work together to make
Bicycle Facilities Planning
 Bicycle Facilities Planning Overview Types of Cyclists Purpose for Riding Types of Facilities Bike Lanes Bicycle Boulevards Cycle Tracks Intersections Signals Signing and Marking Discussion Types of Bicyclists
Bicycle Boulevards and Neighborhood Greenways
 Bicycle Boulevards and Neighborhood Greenways Traffic Safety is Improving for Everyone 90 80 70 60 50 40 30 20 10 0 PORTLAND: TOTAL TRAFFIC FATALITIES 1986-2008 1986 1987 1988 1989 1990 1991 1992 1993
Creating Complete Streets to Accommodate All Users
 Creating Complete Streets to Accommodate All Users Peter Lagerwey, Toole Design Group plagerwey@tooledesign.com Brian Dougherty, Seattle DOT brian.dougherty@seattle.gov International Conference on Urban
What Is a Complete Street?
 Session 5 Charleen Zimmer, AICP, Zan Associates May 5-7, 2010 What Is a Complete Street? May 2010 5-1 Not a Complete Street More of a Complete Street May 2010 5-2 Benefits of Complete Streets Safety for
Roadway Classification Design Standards and Policies. Pueblo, Colorado November, 2004
 Roadway Classification Design Standards and Policies Pueblo, Colorado November, 2004 Table of Contents Page Chapter 1. General Provisions 1.1 Jurisdiction 3 1.2 Purpose and Intent 3 1.3 Modification 3
7 Complete Streets & Roadway Aesthetics
 7 Complete Streets & Roadway Aesthetics 7.1 OVERVIEW Our streets lay the foundation for how we interface with travel needs, physical exercise, social exchanges and access to goods and services. They are
Appendix C. TRAFFIC CALMING PROGRAM TOOLBOX
 Appendix C. TRAFFIC CALMING PROGRAM TOOLBOX PHASE I...2 Do Not Enter Sign...3 One-Way Sign...4 Turn Prohibition...5 Pavement Markings...6 Speed Monitoring Trailer...7 Neighborhood Speed Watch...8 Police
City of Charlottesville Bicycle and Pedestrian Master Plan Update
 City of Charlottesville Bicycle and Pedestrian Master Plan Update September 17, 2014 I. Welcome and meeting overview II. Project status update III. Network overview IV. Break-out groups Pedestrian Network
GIS Based Data Collection / Network Planning On a City Scale. Healthy Communities Active Transportation Workshop, Cleveland, Ohio May 10, 2011
 The Purpose of GIS Based Network Planning GIS Based Data Collection / Network Planning Healthy Communities Active Transportation Conference Tuesday, May 10, 2011 10:00 AM Norman Cox, LLA, ASLA. Ann Arbor,
WHEREAS, the New Jersey Department of Transportation' s Complete Streets
 WHEREAS, the State Department of Transportation adopted a Complete Streets Policy ( Policy No. 703), effective December 3, 2009, for all projects funded through the Department' s Capital Program and strongly
TRANSPORTATION TRAINING TOPICS. April 6, 2010
 TRANSPORTATION TRAINING TOPICS April 6, 2010 Roles of Transportation Providers Context and Policy Makers Division of Transportation and Traffic Other City Operations Other Transportation Operators CMA
Off-road Trails. Guidance
 Off-road Trails Off-road trails are shared use paths located on an independent alignment that provide two-way travel for people walking, bicycling, and other non-motorized users. Trails specifically along
Section 8. Partnerships and Funding
 This section discusses the potential partnership and funding options that the Town should consider in order to assist with the implementation of the recommendations provided in the Plan. Section 8. Partnerships
The best indicator of an individual s and expanding access to parks and open space.
 Health & Wellness Create a Safe and Healthy Built Environment Artist s rendering, 2014 Health is important to Loveland residents, and stakeholders see the many strong connections between quality of life,
Designing for Pedestrian Safety
 Designing for Pedestrian Safety Introduction to Pedestrian Safety Design and Planning Principles Presented by: Craig Allred FHWA Resource Center Technical Specialist and Michael Ronkin Owner, Designing
6/14/2013 VIA . Evan Compton, Associate Planner Community Development Department City of Sacramento 300 Richards Blvd Sacramento, CA 95814
 6/14/2013 VIA EMAIL Evan Compton, Associate Planner Community Development Department City of Sacramento 300 Richards Blvd RE: Sacramento Natural Foods Co-Op (P13-025) Dear Mr. Compton: WALKSacramento appreciates
West Dimond Blvd Upgrade Jodhpur Street to Sand Lake Road
 West Dimond Blvd Jodhpur St to Sand Lake CSS Transportation Project Summary Municipality of Anchorage Project # 05 005 Project Manager: John Smith, P.E. (MOA PM&E) Project Administrator: Julie Makela,
Complete Streets Policy and Practice
 Complete Streets Policy and Practice presented by Leslie Phemister, Nancy Wagner and Kasey Holloway Active Transportation Alliance 1 Learning Objectives Understand the connection between public health
ACTIVE TRANSPORTATION/NONMOTORIZED TRANSPORTATION
 ACTIVE TRANSPORTATION/NONMOTORIZED TRANSPORTATION BACKGROUND Active transportation, also known as nonmotorized transportation, is increasingly recognized as an important consideration when planning and
10/30/2012 VIA
 10/30/2012 VIA EMAIL David Hung, Associate Planner Community Development Department, Current Planning Division City of Sacramento 300 Richards Blvd., 3 rd Floor Sacramento, CA 95811 RE: The Cannery On-Site
2. Context. Existing framework. The context. The challenge. Transport Strategy
 Transport Strategy Providing quality connections Contents 1. Introduction 2. Context 3. Long-term direction 4. Three-year priorities 5. Strategy tree Wellington City Council July 2006 1. Introduction Wellington
About the Active Transportation Alliance
 About the Active Transportation Alliance Chicagoland s voice for better biking, walking and transit Founded 1985 7,000 members, ~33 full time staff Serve Chicago metro region 1 More Cars, More Driving
Complete Streets Policy DAVID CRONIN, P.E., CITY ENGINEER
 Complete Streets Policy DAVID CRONIN, P.E., CITY ENGINEER Complete Streets City Commission adopted a Complete Streets policy in 2012 Complete Streets are road networks that are designed for all users:
Land Use Bicycle Spaces Required Type Residential
 SAMPLE ORDINANCES AND RESOLUTIONS APPENDIX B SAMPLE BICYCLE PARKING ORDINANCE Land Use Bicycle Spaces Required Type Residential Single Family/Two Family N/A N/A Apartment/Townhome 1 per unit plus 6 space