NYC Pedestrian Safety Study & Action Plan. NYTMC Brown Bag Lunch Presentation December 15, 2010
|
|
|
- Mariah King
- 5 years ago
- Views:
Transcription


1 NYC Pedestrian Safety Study & Action Plan NYTMC Brown Bag Lunch Presentation December 15,
 to 137 (2030) NYC Actual & Target Traffic Fatalities 1990-2030")
2 Introduction DOT Safety Goal Strategic Plan: Reduce Fatalities by 50% by 2030 From 274 (2007) to 137 (2030) NYC Actual & Target Traffic Fatalities
 and nearly equal to Amsterdam (3.")
3 NYC is the safest large US city and is growing safer Introduction Traffic fatality rate per 100,000 residents was 3.5 in NYC vs in other 10 largest US Cities, and 12.2 in US in 2008 Fatality rate lower than Copenhagen (3.9) and nearly equal to Amsterdam (3.4) Pedestrian fatality rate per 100,000 residents was 15% less than Peer Cities in 2008 Pedestrian fatality rate decreased 41% to 2.0 ( ) from 3.4 ( ) Pedestrian severe injury rate decreased 40% from the decade of to % Ped 70% Ped New York City Annual Traffic Fatalities 70% Ped 10.5/ 100k pop 16.7/ 100K pop 13.7/100K pop 84% Ped 8.8/100K pop 72% Ped 8.0/100K pop 60% Ped 52% Ped 55% Ped 9.2/ 100K pop 10.0/ 100K pop Annual Pedestrian Fatalities 8.3/100K pop 51% Ped 51% Ped 6.7/100K pop 7.3/ 100K pop 11.7/ 100K pop 9.6/ 100K pop 7.4/ 100K pop 5.8/ 100K pop 5.5/ 100K pop 5.2/ 100K pop 4.6/ 100K pop 3.4/ 100K pop 3 4.0/100K pop 2.0/ 100K pop
4 Introduction The Cost of Crashes Public Health Crashes are a leading cause of potential years lost, similar to stroke, hypertension and pneumonia Economic Crashes cost NYC $4.29 billion annually Equity Seniors comprise 38% of pedestrian fatalities, but only 12% of the population Sustainability Safer streets promote walking, cycling and transit Quality of Life Road safety, like reduced crime rates, is a key factor in attracting and retaining residents to the city 4
5 Study & Action Plan Fulfill Introduction 1. NYCDOT Strategic Plan Goal: 50% reduction in fatalities by NYC Pedestrian Safety Act (LL 11 of 2008) mandate to study pedestrian fatalities and severe injuries and to develop a strategy and schedule for improving pedestrian safety 3. FHWA Focus City Program request for pedestrian safety plan 5
 Pedestrians: 52% of all")

6 Introduction Focus on Vulnerable Road Users (Pedestrians, Bicyclists, Motorcyclists) Vulnerable Road Users: 71% of all fatalities ( ) Pedestrians: 52% of all fatalities ( ) 33% of all severe injuries ( ) Traffic Fatalities 52% Traffic Severe Injuries 33% 6 Proportions may not add to 100% due to rounding


7 Existing Safety Efforts Among Most Comprehensive in North America Introduction 7

8 Findings Findings 8
 Other boroughs have higher KSI totals and higher rates per 100,000 residents and workers 43% of pedestrians killed in Manhattan resided in another borough or outside NYC In Manhattan, Major")
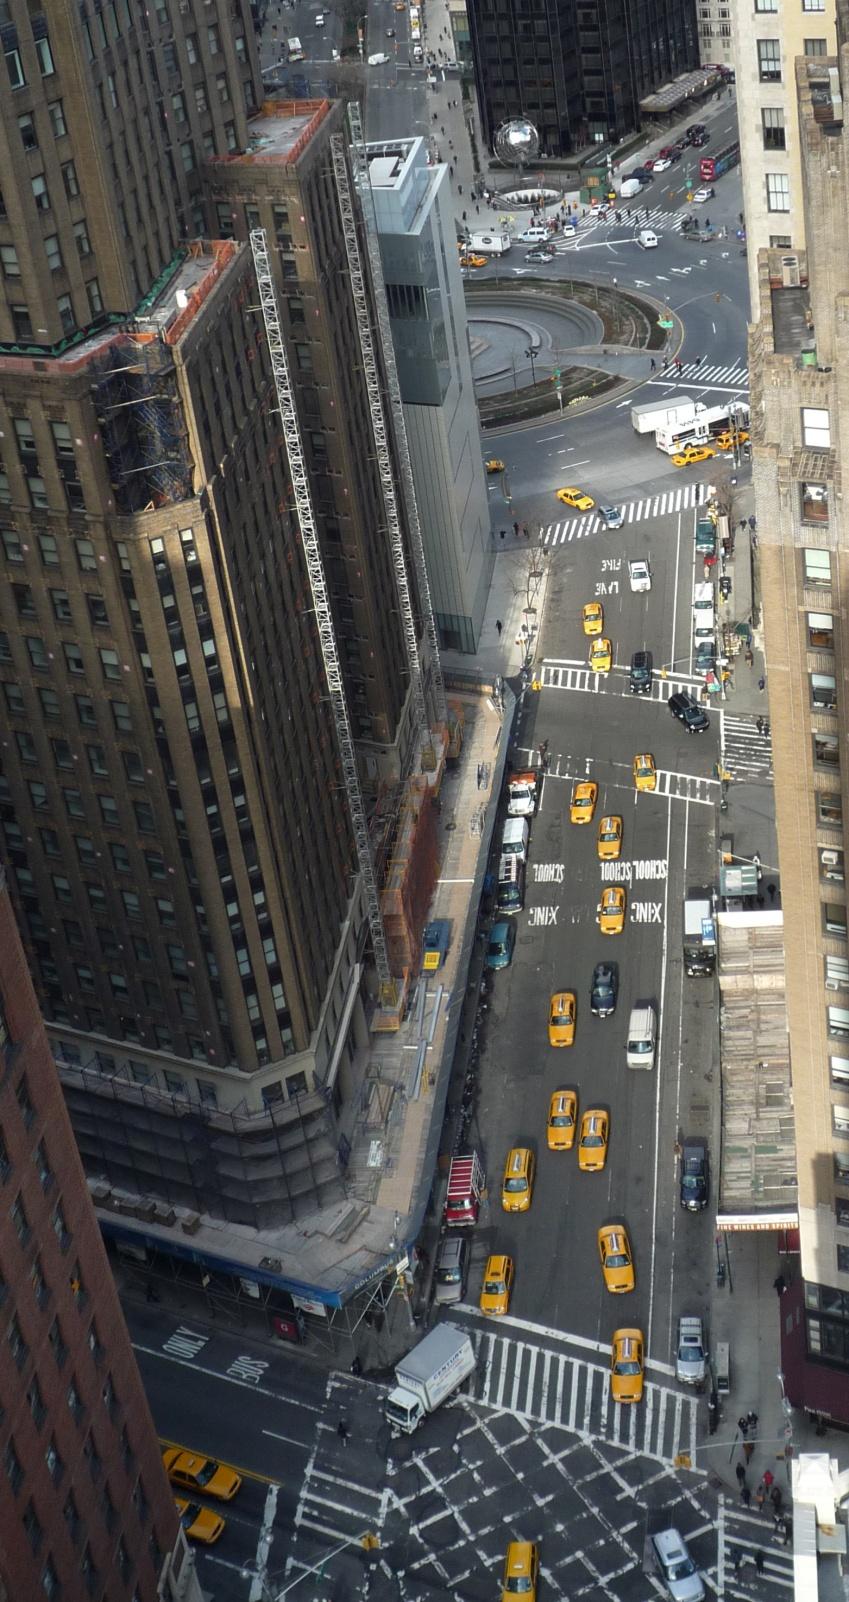
9 Where: Manhattan Highest Crash Density: Four times as many pedestrian KSI (Killed or Severely Injured) in Manhattan per mile of street (.73) as other four boroughs (.18) Other boroughs have higher KSI totals and higher rates per 100,000 residents and workers 43% of pedestrians killed in Manhattan resided in another borough or outside NYC In Manhattan, Major Two-Way Streets account for 47% of pedestrian fatalities but only 12% of the road network Findings Average Annual Pedestrian KSI Borough Bronx Brooklyn Manhattan Queens Staten Island NYC Pedestrian KSI per mile of street Pedestrian KSI Street Miles Pedestrian KSI Rate (per 100,000 residential population) Pedestrian KSI Rate (per 100,000 daytime population)
 74% of pedestrian crashes occur at intersections (2002-2006), but: Crashes are dispersed: the 52 most common crash locations average one pedestrian KSI crash per year, and account for only 3.")
10 Findings Where: (cont.) 74% of pedestrian crashes occur at intersections ( ), but: Crashes are dispersed: the 52 most common crash locations average one pedestrian KSI crash per year, and account for only 3.5% of all pedestrian KSI Arterial streets account for ~60% of pedestrian fatalities but only 15% of the road network Pedestrian KSI crashes on arterial streets are ~2/3 more deadly than crashes on non-arterial streets Controlling for other factors, pedestrian KSI crashes on streets with bike lanes were ~40% less deadly as other streets 10

11 When: 40% of pedestrian KSI crashes occurred in the afternoon/evening (3-9pm) Percent of Total Pedestrian KSI Crashes by Time of Day Findings Late night (3-6am) pedestrian KSI crashes are nearly twice as deadly as other time periods Nearly 20% more Pedestrian KSI crashes occurred per month during the Winter holiday season (Nov. & Dec.) Percent Fatal am pm Pedestrian KSI Crashes by Time of Day: Percent Fatal am pm 11
12 How: Findings Drivers that fail to yield account for 26% of pedestrian KSI Crossing-against-signal pedestrian KSI crashes are 56% more deadly than crossing with the signal Controlling for other factors, pedestrian KSI crashes involving driver inattention are more than twice as deadly as others Pedestrian KSI crashes involving unsafe vehicle speeds are nearly twice as deadly as others Controlling for other factors, lane-changing pedestrian KSI crashes are more than twice as deadly as others Left turning pedestrian KSI crashes outnumber right turning crashes 3 to 1 12
13 Findings Who: Pedestrians Over age 65 12% of population but 28% of severe injuries, 38% of fatalities. Asian Americans over 65 had nearly twice the average fatality rate for seniors (7.8 vs. 4.3 per 100,000) Areas with higher proportions of Hispanic residents or Black residents, experienced higher crashes rates (Controlling for other factors, doubling the share of Black or Hispanic residents increased crashes by ~20%) Males - 58% of pedestrian KSI Rates of Pedestrian Fatalities and Severe Injuries Per 100k Population Pedestrian Fatality Rate by Age & Gender Male Female Pedestrian Fatality Rate by Race/Ethnicity & Age Group Age White Black Asian Hispanic Under to Over Age All Ages < >64 13 Age Cohort (years)
 Residents with high school education only or less: 52% of adult residents but 70% of fatalities among adult residents Foreign-born 36% of")
14 Who: Pedestrians (cont.) Residents with high school education only or less: 52% of adult residents but 70% of fatalities among adult residents Foreign-born 36% of residents but 51% of fatalities among residents Pedestrian Fatalities and Population by Educational Attainment Findings 14
15 Findings Who: Drivers 80% of pedestrian KSI crashes involved male drivers (57% of NYC vehicles are registered to men) Private passenger cars account for 79% of all pedestrian KSI crashes 16% of Manhattan pedestrian KSI crashes involved a taxi or livery car 31% of pedestrian KSI involving trucks resulted from a right turn Number of Crashes Pedestrian KSI by Driver Age & Gender Driver Age (years) Male Female 8% of pedestrian fatalities involved a driver without a license ( ) Vehicle Type % of Pedestrian KSI crashes (minus unknowns) % of registrations (2009) Bus 3% 0.4% Truck 4% 3.6% Taxi/Livery 13% 2.1% Passenger 79% 90% 15

16 Recommendations Recommendations 16

17 Recommendations Engineering Install countdown pedestrian signals at 1,500 intersections. 1.2 Aggressively redesign 20 miles of high-crash corridors Upgrade signals, markings and signage on 40 miles of highcrash corridors 1.3 Re-engineer 20 intersections on major Manhattan two-way streets. 1.4 Launch a pilot program to test the safety performance of neighborhood 20 mph zone. 1.5 Implement pilot program to improve visibility at left turns along avenues in Manhattan. 17

18 Enforcement Recommendations Targeted Enforcement: NYPD and DOT will coordinate a data-driven, citywide campaign against aggressive driving Drivers Without a Valid License: NYPD will continue their efforts to identify and apprehend unlicensed drivers Data Collection & Sharing: NYPD and DOT will coordinate on geographic & crash severity analyses to enhance strategic resource deployment Cellphone/Texting While Driving: NYPD will continue to crack down on drivers using handheld cellphones or texting while driving 18
19 Public Communication Education Recommendations School Programs Target programs near high risk corridors Expand Spanish language education efforts Parents Target low educational attainment populations Focus Safe Kids Coalition outreach to new immigrant groups Expand non-english outreach to include Haitian Creole, Chinese (Mandarin and Cantonese) and Urdu Older Adults Provide Safe Streets for Seniors presentations near high risk corridors Expand multi-language outreach, focusing on older Asian residents Develop comprehensive active transportation program Intergenerational Outreach Utilize children as Safety Deputies to share traffic safety information Work with communities to create pedestrian safety-themed signs and murals Materials Update and create new print materials highlighting dangerous driving behavior Translate additional materials for high-risk non-english speaking populations 19

20 Public Communication Marketing Recommendations 3.16 It s 30 for a Reason Campaign Reinforce 30 mph speed limit TV spots and billboards Link: Use targeted tactics to further raise motorist awareness Work with NYS DMV to deliver materials Introduce materials / messages at motorist education events Use targeted tactics to further raise pedestrian awareness Pedestrian countdown signals / crossing with the light outreach Multi-lingual street teams Focus on areas with high populations of foreign-born residents Introduce materials / messages at youth and senior outreach events 20

21 Policy and Legislation Recommendations 4.19 Expand Red Light Cameras Only 150 permitted in NYC; more needed Introduce Speed Cameras 2007 NHTSA international review: injury crash reductions of 20% to 25% Require Truck Crossover Mirrors Eliminate blind spots at front of trucks; already mandatory on school buses 4.23 Toughen Penalties for Unlicensed Drivers Work with Albany and NYC District Attorneys for tougher legislation and sentences 21
22 Interagency Coordination & Cooperation Recommendations 5.24 Establish NYPD/DOT Road Safety Task Force Coordinate campaigns & projects, share data, develop innovative responses to safety issues 5.25 Expand DOT/DOHMH collaboration on research & prevention activities 5.26 Work with New York State DMV to update Driver s Education Curriculum to incorporate more pedestrian, biking and urban driving information 22
23 Design Treatments 23


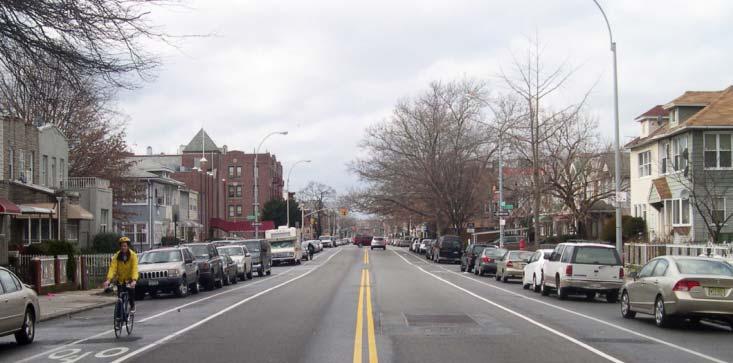
24 Road Diets After Before 24

25 Road Diets After 25 Before


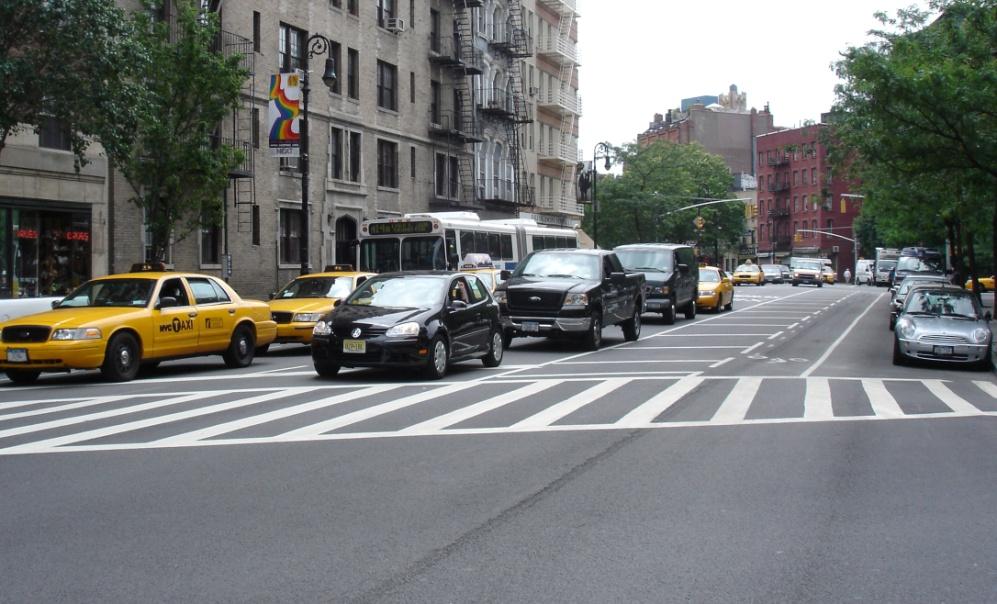
26 Road Narrowing After Before Before 26


27 Elimination of Right-Turn Slips After 27 Before


28 Separated Bike Lanes After Before 28

29 Plazas 29 Before After

30 Plazas After 30 Before


31 Questions? nyc.gov/dot - Visit Current Projects or DOT Library or 31
NYC Pedestrian Safety Study & Action Plan. Research, Implementation & Safety Division of Traffic Operations
 NYC Pedestrian Safety Study & Action Plan Research, Implementation & Safety Division of Traffic Operations 1 Introduction DOT Safety GOAL Strategic Plan: Reduce Fatalities by 50% by 2030 From 274 (2007)
Walking in Traffic Violence. The pervasiveness of motor vehicle crashes with pedestrians in New York City
 Walking in Traffic Violence The pervasiveness of motor vehicle crashes with pedestrians in New York City 2 Walking in Traffic Violence New York City is a walking and public transit city. We are proud of
City of Stamford, Vision Zero Planning Study-Education
 City of Stamford, Vision Zero Planning Study-Education Review of National Best Practices Frank Petise (City of Stamford) Sandeep Aysola (Yale School of Forestry & Environmental Studies/ CDM Smith Inc.)
Transportation Issues Poll for New York City
 2016-17 Transportation Issues Poll for New York City 82% support Vision Zero and reducing traffic deaths 72% on average, support more street space for children to play, protected bike lanes and other safety
SPEED MANAGEMENT FOR VISION ZERO
 SPEED MANAGEMENT FOR VISION ZERO LUANN HAMILTON, DEPUTY COMMISSIONER FOR PROJECT DEVELOPMENT CHICAGO DEPARTMENT OF TRANSPORTATION NACTO DESIGNING CITIES 2017 Vision Zero Action Plan Speed management and
Vision Zero Education Activities across U.S.
 Launch Vision Zero website to gather input from New Yorkers and coordinate information about the City s Vision Zero plans, upcoming events and provide data. Website New York The City s Vision Zero website
VISION ZERO: What will it take?
 1 Through Vision Zero SF we commit to working together to prioritize street safety and eliminate traffic deaths in San Francisco. VISION ZERO: What will it take? Tom Maguire, Director, Sustainable Streets
Film Guide for Educators. Designing for Safety
 Film Guide for Educators Designing for Safety Designing For Safety Key Concepts Speeding While Driving Speeding is the number one cause of injuries and deaths from driving. The main reasons are because
MEMORANDUM. City Constituents. Leilani Schwarcz, Vision Zero Surveillance Epidemiologist, SFDPH
 MEMORANDUM TO: FROM: CC: City Constituents Leilani Schwarcz, Vision Zero Surveillance Epidemiologist, SFDPH Megan Wier, Co-Chair, San Francisco Vision Zero Task Force, SFDPH Commander Ann Mannix, Traffic
Chapter 2. Bellingham Bicycle Master Plan Chapter 2: Policies and Actions
 Chapter 2 Bellingham Bicycle Master Plan Chapter 2: Policies and Actions Chapter 2: Policies and Actions The Bicycle Master Plan provides a road map for making bicycling in Bellingham a viable transportation
Older Pedestrians at Risk And How States Can Make it Safer and Easier for Older Residents to Walk
 Older Pedestrians at Risk And How States Can Make it Safer and Easier for Older Residents to Walk Tri-State Transportation Campaign August 2012 Introduction Key Findings 435 older pedestrians have been
Closing Plenary Session
 TRAFFIC SAFETY CONFERENCE Closing Plenary Session June 9, 2017 Las Colinas, TX Order of Report Out June 9, 2017 Las Colinas, TX Distracted Driving Prioritized Countermeasures Countermeasure 4a Systemically
Toward Zero Deaths. Regional SHSP Road Show Meeting. Virginia Strategic Highway Safety Plan. presented by
 Toward Zero Deaths Regional SHSP Road Show Meeting presented by Virginia Strategic Highway Safety Plan December 1, 2016 1 Welcome & Introductions Purpose of the Meeting Objectives & Key Outcomes Agenda»
PEDESTRIAN ACTION PLAN
 ATTACHMENT 2 CITY OF SANTA MONICA PEDESTRIAN ACTION PLAN CITY OF SANTA MONICA PEDESTRIAN ACTION PLAN This page intentionally left blank EXECUTIVE SUMMARY CHAPTER 1 EXECUTIVE SUMMARY Setting the Stage
SLOW DOWN A STUDY OF SPEEDING ON MCGUINNESS BLVD
 SLOW DOWN A STUDY OF SPEEDING ON MCGUINNESS BLVD ACKNOWLEDGEMENTS This report was prepared by Shawn Macias, in consultation with the McGuinness Boulevard Working Group. This report would not have been
Napier City road trauma for Napier City. Road casualties Estimated social cost of crashes* Major road safety issues.
 ISSN 1176-841X July 25 Land Transport New Zealand has prepared this road safety issues report. It is based on reported crash data and trends for the 2 24 period. The intent of the report is to highlight
CITY AND COUNTY OF SAN FRANCISCO BOARD OF SUPERVISORS BUDGET AND LEGISLATIVE ANALYST
 CITY AND COUNTY OF SAN FRANCISCO BOARD OF SUPERVISORS BUDGET AND LEGISLATIVE ANALYST 1390 Market Street, Suite 1150, San Francisco, CA 94102 (415) 552-9292 FAX (415) 252-0461 Policy Analysis Report To:
4. Transportation Safety
 4. Transportation Safety INTRODUCTION Safety is a key measure of the quality of the region s transportation system. In 2005, the federal legislation Safe, Accountable, Flexible, Efficient Transportation
Don t Cut Corners: Left Turn Pedestrian & Bicyclist Crash Study
 1 2 3 4 5 6 7 8 9 10 11 12 13 14 15 16 17 18 19 20 21 22 23 24 25 Don t Cut Corners: Left Turn Pedestrian & Bicyclist Crash Study Christopher Brunson New York City Department of Transportation 55 Water
VISION ZERO SAN FRANCISCO
 K VISION ZERO SAN FRANCISCO Two-Year Action Strategy 2017 2018 ELIMINATING TRAFFIC DEATHS IN OUR CITY CONTENTS 2 3 4 5 6 8 11 12 13 14 15 Contents and Introduction Message from Mayor Ed Lee Our Two-Year
Most Dangerous Roads for Walking And How States Can Make them Safer. Route 110, Long Island, New York Image by Dougtone
 Most Dangerous Roads for Walking And How States Can Make them Safer Route 110, Long Island, New York Image by Dougtone Tri-State Transportation Campaign February 2013 Introduction Key Findings More than
Final Report 2012 Chicago Department of Transportation 30 N. LaSalle St., Ste 500 Chicago IL Gabe Klein, Commissioner
 Final Report 2012 Chicago Department of Transportation 30 N. LaSalle St., Ste 500 Chicago IL 60602 Gabe Klein, Commissioner 1 Funders Partner Organizations Monetary Contributions In-Kind Donations 2 Executive
Citizen Advocacy. VISION ZERO IN HILLSBOROUGH COUNTY TODAY
 Citizen Advocacy http://www.tampabay.com/news/publicsafety/accidents/car-bus-crash-kills-one/441282 VISION ZERO IN HILLSBOROUGH COUNTY TODAY Does Vision Zero Make Sense Here? Traffic Deaths per 100,000
Mayor s Pedestrian Advisory Council. Wednesday, February 15
 Mayor s Pedestrian Advisory Council Wednesday, February 15 Annual Pedestrian Fatalities 2005-2016 Year-End Pedestrian Fatalities, 2016 (CPD): 44 Year-End Pedestrian Fatalities, 2015 (CPD): 46 Year-End
We believe the following comments and suggestions can help the department meet those goals.
 The Honorable Secretary Anthony Foxx The Secretary of Transportation United States Department of Transportation 1200 New Jersey Avenue, SE Washington, DC 20590 August 30, 2013 Dear Secretary Foxx, Thank
The 2002 Pedestrian Safety Awareness Campaign
 The 2002 Pedestrian Safety Awareness Campaign From the Metropolitan Washington Council of Governments ABOUT THIS REPORT This report describes the 2002 Street Smart Campaign of the Metropolitan Washington
MEET IN THE STREET MOVING TO ZERO
 WE MEET IN THE STREET MOVING TO ZERO Tips for sharing the street Traffic deaths are preventable. We need your help getting the message out. 2 A NEW PLAN A NEW PLAN Philadelphia is proud to adopt Vision
Vision Zero Task Force February 28, Collision Landscape Analysis
 Vision Zero Task Force February 28, 2017 Collision Landscape Analysis Welcome! What happened since our last Task Force meeting: City Council adopted the Vision Zero Resolution Applied for an OTS grant
TASK FORCE UPDATE MARCH 29, 2016
 Through Vision Zero SF we commit to working together to prioritize street safety and eliminate traffic deaths in San Francisco by 2024 MARCH 29, 2016 1 WHY WE RE HERE We never planned on losing our son.
PRESENTATION OVERVIEW
 PRESENTATION OVERVIEW WHAT IS VISION ZERO? DOES IT MAKE SENSE FOR US? IS VISION ZERO WORKING? HOW DO WE GET STARTED? AWARENESS RAISING WHAT IS VISION ZERO? Press Conference (New York, NY) In 2008, Lizi
Rightsizing Streets: The Seattle Experience
 Rightsizing Streets: The Seattle Experience April 30, 2013 Brian Dougherty Seattle Department of Transportation Complete Streets 16% of households do not have a car Seniors Youth Transit riders Safety
City of San Diego Vision Zero Draft Strategic Plan FY 2017
 City of San Diego Vision Zero Draft Strategic Plan FY 2017 Engineering Objective: To develop and implement a strategy that employs best planning, design and engineering practices. Background: Over the
CHAPTER 7.0 IMPLEMENTATION
 CHAPTER 7.0 IMPLEMENTATION Achieving the vision of the Better Streets Plan will rely on the ability to effectively fund, build and maintain improvements, and to sustain improvements over time. CHAPTER
The DC Pedestrian Master Plan
 The DC Pedestrian Master Plan September 28, 2010 George Branyan Pedestrian Program Coordinator District Department of Transportation Presentation Agenda Scope of the Plan Methodology Recommendations Implementation
Toward Zero Deaths: Proactive Steps for Your Community
 Est. Dec. 2014 Toward Zero Deaths: Proactive Steps for Your Community Presented by: Brian Roberts, P.E., National Association of County Engineers Marie Walsh, Ph.D., Louisiana Local Technical Assistance
Transportation and Equity: A 2017 Agenda for Candidates
 In New York, mobility is opportunity. We have succeeded as a global leader in social justice, economic growth and environmental sustainability by investing for more than a century in comprehensive, reliable
Walk Friendly Communities Education and Encouragement Programs
 Walk Friendly Communities Programs Dan Gelinne Walk Friendly Communities Workshop Grandview, MO June 2015 Module Overview Topics Background and purpose What is the role of education and encouragement programs?
2019 ACTION STRATEGY UPDATE. March 19, 2019
 1 REPORT TO THE HEALTH COMMISSION 2019 ACTION STRATEGY UPDATE March 19, 2019 SAN FRANCISCO ADOPTED VISION ZERO IN 2014 2 3 23 TRAFFIC-RELATED DEATHS IN 2018 45 40 35 30 25 20 15 10 5 0 11 2 15 2 14 15
Engineering and Traffic Investigation Providing Justification for Lowering Default Arterial and Non-Arterial Speed Limits
 Engineering and Traffic Investigation Providing Justification for Lowering Default Arterial and Non-Arterial Speed Limits August 2016 Overview Seattle is committed to improving public health and safety
People killed and injured per million hours spent travelling, Motorcyclist Cyclist Driver Car / van passenger
 Cyclists CRASH FACTSHEET 27 CRASH STATISTICS FOR THE YEAR ENDED 31 DEC 26 Prepared by Strategy and Sustainability, Ministry of Transport Cyclists have a number of risk factors that do not affect car drivers.
VISION ZERO UPDATE JUNE 2, 2016
 Through Vision Zero SF we commit to working together to prioritize street safety and eliminate traffic deaths in San Francisco by 2024 VISION ZERO UPDATE JUNE 2, 2016 1 TRAFFIC FATALITIES - 2015 31 people
43 rd Avenue, Skillman Avenue Protected Bike Lanes
 43 rd Avenue, Skillman Avenue Protected Bike Lanes Presented to Queens Community Board 2 Transportation Committee - November 6, 2017 43 rd Avenue, Skillman Avenue: Presentation Overview Background Project
Chicago Pedestrian and Bicycle Safety Initiative Final Report
 1 Chicago Pedestrian and Bicycle Safety Initiative Final Report Chicago Department of Transportation www.chicagocompletestreets.org 312.744.8147 Executive Summary Since 2001, the Chicago Department of
FHWA s Strategic Agenda for Pedestrian and Bicycle Transportation. Purdue Road School March 8, 2017
 FHWA s Strategic Agenda for Pedestrian and Bicycle Transportation Purdue Road School March 8, 2017 1 Strategic Agenda for Pedestrian and Bicycle Transportation Provides a framework for organizing FHWA
Pedestrian Safety Initiatives National Highway Traffic Safety Administration (NHTSA)
") Pedestrian Safety Initiatives National Highway Traffic Safety Administration (NHTSA) Report to the Transportation Research Board Pedestrian Safety Committee January 2010 Leah Walton Safety Countermeasures
Pedestrian Safety Initiatives National Highway Traffic Safety Administration (NHTSA) Report to the Transportation Research Board Pedestrian Safety Committee January 2010 Leah Walton Safety Countermeasures
Tunnel Reconstruction South 5 th Street Association October 16, 2018
 Tunnel Reconstruction South 5 th Street Association October 16, 2018 Reconstructing the Tunnel 2 Service During Tunnel Reconstruction April 2019 through July 2020 3 Projected Cross River Travel Paths of
OLDER PEDESTRIANS AT RISK
 OLDER PEDESTRIANS AT RISK A TEN-YEAR SURVEY AND A LOOK AHEAD August 0 The population of older adults is growing in the U.S. and in the tri-state region. According to AARP, one in three Americans is now
UPDATES, SUCCESSES, AND WHAT S AHEAD ON THE ROAD TO ZERO
 Vol. 1, Issue 1 I Spring 2018 www.planhillsborough.org/vision-zero S A F E S T R E E T S N O W H I L L S B O R O U G H UPDATES, SUCCESSES, AND WHAT S AHEAD ON THE ROAD TO ZERO TRACKING PROGRESS This is
Hillsborough Pedestrian Safety Action Plan 2015 Update. Hillsborough MPO BPAC May 2015
 Hillsborough Pedestrian Safety Action Plan 2015 Update Hillsborough MPO BPAC May 2015 Presentation Overview Pedestrian Safety Action Plan (PSAP) Review Pedestrian Crash Trends Stakeholder Activities Engineering
POLICY AGENDA For Elder Pedestrian Safety
 POLICY AGENDA For Elder Pedestrian Safety Older adults and people with disabilities often have mobility, cognitive, and sensory limitations that affect their behavior as pedestrians and place them at risk
The North Shore Transportation Improvement Strategy and Western Richmond Terrace 1 : The Forgotten Corridor
 Elm Park Civic Association Island Voice Do Me A Faber The North Shore Transportation Improvement Strategy and Western Richmond Terrace 1 : The Forgotten Corridor Introduction Richmond Terrace is the northernmost
Crosswalk event overview (Saint Paul) How to organize a crosswalk event. 1. Choose a date, time and location
 How to organize a crosswalk event. 1. Choose a date, time and location") Crosswalk event overview (Saint Paul) A crosswalk event occurs when an individual or group of individuals promote pedestrian safety by demonstrating the proper use of a crosswalk. During the event, a group
Crosswalk event overview (Saint Paul) A crosswalk event occurs when an individual or group of individuals promote pedestrian safety by demonstrating the proper use of a crosswalk. During the event, a group
TRANSPORTATION IMPROVEMENT STRATEGY
 TRANSPORTATION IMPROVEMENT STRATEGY A Vision for Staten Island North Shore November 2016 1 EXISTING CONDITIONS Transit Conditions MTA Bus Staten Island Railroad Peak Directional Traffic Volume (per hour)**:
Vision Zero & ITE. April 11, Toole Design Group. Jason DeGray, P.E., PTOE. Vision Zero & ITE
 Jason DeGray, P.E., PTOE Toole Design Group April 11, 2017 What is Vision Zero? Traffic deaths and serious injuries are preventable and unacceptable Human life takes priority over mobility Human error
Proposed. City of Grand Junction Complete Streets Policy. Exhibit 10
 Proposed City of Grand Junction Complete Streets Policy Exhibit 10 1 City of Grand Junction Complete Streets Policy Vision: The Complete Streets Vision is to develop a safe, efficient, and reliable travel
CDRT. Child Death Review Team Dallas County. Brief Report Traffic-related Child Deaths OVERVIEW
 Dallas County CDRT Child Death Review Team 2013 Brief Report Traffic-related Child Deaths 2006-2011 OVERVIEW In Dallas County, traffic-related injury death rates among children are typically less than
COMMUNITY SCHOOLS AND TRANSPORTATION
 COMMUNITY SCHOOLS AND TRANSPORTATION Regional Transportation Council Workshop October 8, 2015 Agenda» Existing Conditions and Previous Initiatives (RTC School Policy)» TIGER Grant and the Community Schools
Vulnerable Road Users Safety: What Cities Can Do To Make Things Better?
 Vulnerable Road Users Safety: What Cities Can Do To Make Things Better? Transportation Research Board Webinar September 27, 2016 Robert Hull, Cambridge Systematics, Inc. The Issue Today NHTSA 2015 estimates:
EXECUTIVE SUMMARY. Vision
 Vision Walking and bicycling in Salt Lake City will be safe, convenient, comfortable, and viable transportation options that connect people to places, foster recreational and economic development opportunities,
Occ c u c pa p n a t pro r t O ec e t c i t O i n
 Occupant Protection Occupant Protection Introduction Buckling up or being buckled in is the most effective protection during a car crash. The simple truth is that the great majority of people ejected from
Lisa Quinn Executive Director
 Transforming Injury and Violence Prevention: Innovations in Policy, Practice, and Partnerships Advocating for Prevention: Enacting and Reacting to Legislation Lisa Quinn Executive Director Feet First works
Welcome! San Jose Avenue Open House August 25, 2015
 Welcome! San Jose Avenue Open House August 25, 2015 Vision Zero The City and County of San Francisco adopted Vision Zero San Francisco Vision Zero High Injury Network as a policy in 2014, committing an
M14A/D Select Bus Service
 M14A/D Select Bus Service Manhattan Community Board 6: April 1, 2019 New York City Transit 2 Background M14 Select Bus Service M14 was identified as a critical future SBS corridor in past BRT studies as
Lane Area Transportation Safety and Security Plan Vulnerable Users Focus Group
 Lane Area Transportation Safety and Security Plan Vulnerable Users Focus Group Agenda 1. Planning Process Review 2. What are Emphasis Areas? 3. Your Role Today 4. Data Review 5. Small group discussion
Bringing together community and health. Physical Activity and Nutrition Unit Office of Statewide Health Improvement Initiatives
 Bringing together community and health. Physical Activity and Nutrition Unit Office of Statewide Health Improvement Initiatives Physical Activity and Nutrition Unit Office of Statewide Health Improvement
Pedestrian Safety: A Federal Perspective. Emmett McDevitt Transportation Safety Engineer September 28, 2010
 Pedestrian Safety: A Federal Perspective Emmett McDevitt Transportation Safety Engineer September 28, 2010 Pedestrian Fatalities by Year in US (1997-2009) 6,000 5,000 4,000 3,000 2,000 1,000 0 1997 1998
ROAD SAFETY IN RUSSIA
 ROAD SAFETY IN RUSSIA United Nations Road Safety Collaboration First Deputy Minister of Internal Affairs of the Russian Federation A.V. Gorovoy New York, 12 April 2018 Russia supports the global road safety
Watch for Me Pedestrian and Bicycle Safety Program: From North Carolina to Connecticut
 Watch for Me Pedestrian and Bicycle Safety Program: From North Carolina to Connecticut Watch for Me NC Watch for Me NC The Watch for Me NC program empowers communities to address pedestrian and bicycle
Data Analysis February to March Identified safety needs from reported collisions and existing travel patterns.
 Welcome! Thank you for participating in today s Valencia Bikeway Improvements workshop. Data Analysis February to March Identified safety needs from reported collisions and existing travel patterns. Initial
EMPHASIS AREA 2: SCHOOL CHILDREN
 EMPHASIS AREA 2: SCHOOL CHILDREN A child is seriously injured or killed every 17 weeks on their way to or from school on Toronto s roads. School children are pedestrians and cyclists between the ages of
ITE Northeastern District Meeting
 West Hartford Road Diet and Safety Study ITE Northeastern District Meeting Session 2A Complete Streets May 22, 2018 North Main St. - Classified as a principal arterial But provides high levels of access
For Information Only. Pedestrian Collisions (2011 to 2015) Resolution. Presented: Monday, Apr 18, Report Date Tuesday, Apr 05, 2016
 Resolution. Presented: Monday, Apr 18, Report Date Tuesday, Apr 05, 2016") Presented To: Operations Committee For Information Only Pedestrian Collisions (0 to 0) Presented: Monday, Apr 8, 06 Report Date Tuesday, Apr 0, 06 Type: Correspondence for Information Only Resolution For
Presented To: Operations Committee For Information Only Pedestrian Collisions (0 to 0) Presented: Monday, Apr 8, 06 Report Date Tuesday, Apr 0, 06 Type: Correspondence for Information Only Resolution For
2015 Victorian Road Trauma. Analysis of Fatalities and Serious Injuries. Updated 5 May Page 1 of 28. Commercial in Confidence
 2015 Victorian Road Trauma Analysis of Fatalities and Serious Injuries Updated 5 May 2016 Page 1 of 28 Commercial in Confidence VICROADS_n3445896_2015_Victorian_Trauma_Report_- _updated_may_2016.docx 2015
USDOT Bicycle and Pedestrian Safety Initiative: Safer People and Safer Streets. Barbara McCann, USDOT Office of Policy
 { USDOT Bicycle and Pedestrian Safety Initiative: Safer People and Safer Streets Barbara McCann, USDOT Office of Policy 4 Steps from policy to practice Creating multi-modal streets means: 1. Change Decision-Making
2013 Candidate Questionnaire
 2013 Candidate Questionnaire OVERVIEW For New York City to compete in the global economy and provide the safety and quality of life New Yorkers deserve, our leaders must embrace a 21st Century vision for
Tampa Bay. Pedestrian Safety Skills
 Tampa Bay Pedestrian Safety Skills Today s Presentation After this session, attendees should be able to: Describe the grassroots WalkWise Pedestrian Safety Campaign Understand why pedestrian fatalities
CTDOT Pedestrian and Bicycle Safety Initiatives
 CTDOT Pedestrian and Bicycle Safety Initiatives 2017 Northeast Transportation Safety Conference Mark F. Carlino, P.E. Traffic Engineering Division Chief Bureau of Engineering and Construction Connecticut
CITY OF COCOA BEACH 2025 COMPREHENSIVE PLAN. Section VIII Mobility Element Goals, Objectives, and Policies
 CITY OF COCOA BEACH 2025 COMPREHENSIVE PLAN Section VIII Mobility Element Goals, Objectives, and Policies Adopted August 6, 2015 by Ordinance No. 1591 VIII MOBILITY ELEMENT Table of Contents Page Number
Figure 1. Indiana fatal collisions by young driver involvement,
 INDIANA TRAFFIC SAFETY FACTS YOUNG DRIVERS 2016 MAY 2017 ISSUE 17-C06 IN 2016: In 2016, 13.4 percent of all drivers involved in Indiana collisions were young drivers. Young drivers were involved in 105
Street Smart - Regional Pedestrian Safety Campaign. Hopkins Grand Rounds July 16, 2014
 Street Smart - Regional Pedestrian Safety Campaign Hopkins Grand Rounds July 16, 2014 Baltimore Metropolitan Council (BMC) Who We Are The organization of the Baltimore region s elected executives, representing
Pedestrian Safety Campaign
 Pedestrian Safety Campaign 2017-18 Traffic Safety Plan PART OF THE DRIVE FOCUS LIVE TRAFFIC SAFETY PLAN Table of Contents Background. 1 Pedestrian Collision Stats.... 2-3 Goals.. 4 Objectives.. 5 Implementation
About the Active Transportation Alliance
 About the Active Transportation Alliance Chicagoland s voice for better biking, walking and transit Founded 1985 7,000 members, ~33 full time staff Serve Chicago metro region 1 More Cars, More Driving
TSTC s analysis of federal transportation data reveals that in the three years from 2010 through 2012:
 THE REGION S Tri-State Region KEY FINDINGS TSTC s analysis of federal transportation data reveals that in the three years from through :, pedestrians lost their lives on Connecticut, Jersey and downstate
FHWA Resources for Pedestrian and Bicycle Professionals
 FHWA Resources for Pedestrian and Bicycle Professionals Charlie Zegeer, UNC Highway Safety Research Center/PBIC Libby Thomas, UNC Highway Safety Research Center Dan Nabors, Vanasse Hangen Brustlin (VHB)
EMPHASIS AREA 1: PEDESTRIANS
 EMPHASIS AREA 1: PEDESTRIANS A pedestrian is seriously injured or killed every 3 days on Toronto s roads. Pedestrian collisions involve any person that is not riding in a vehicle or on a bicycle. 26% OF
By: Bill Baranowski, PE TRAFFIC CALMING EXAMPLES IN SUGARHOUSE, DAYBREAK, AND WEST JORDAN CITY
 By: Bill Baranowski, PE TRAFFIC CALMING EXAMPLES IN SUGARHOUSE, DAYBREAK, AND WEST JORDAN CITY 1977 HIGHLAND RUGBY TOUR 1945 WHERE??? What is more contentious than traffic calming? 1951 LOOKING SOUTHEAST
Bikeway action plan. Bicycle Friendly Community Workshop March 5, 2007 Rochester, MN
 Bikeway action plan Summary The was held on March 5, 2007 at the Rochester Mayo Civic Center. The workshop was hosted by Rochester-Olmsted County Planning Department in collaboration with the League of
Doing it Right: Leveraging Data and Evaluation to Develop Pedestrian Safety Projects
 Doing it Right: Leveraging Data and Evaluation to Develop Pedestrian Safety Projects 1 Safe Kids Overview 2 Our Mission We work to keep all kids safe from preventable injuries 3 Why It Matters 4 Where
Street Smart Morristown
 Street Smart Morristown Year II Followup Executive Summary After the success of the 2016 Street Smart pedestrian safety campaign in Morristown, NJ, TransOptions, the Town of Morristown and the Morristown
Why Zone In on Speed Reduction?
 Learn it. Do it. Live it! SPEED REDUCTION IN THE ZONE Why Zone In on Speed Reduction? Speeding is a serious issue that plays a major role in the risk of serious injury and pedestrian fatality in a crash.
Vision Zero REPORT CARD An Evaluation of the Leaders Responsible for Preventing Traffic Fatalities and Injuries on New York City Streets
 B Vision Zero REPORT CARD 2017 An Evaluation of the Leaders Responsible for Preventing Traffic Fatalities and Injuries on New York City Streets PUBLISHED JANUARY 2018 PUBLISHED NOVEMBER 2017 BVision Zero
Safer Cycling: How the City of Vancouver is Proactively Improving Cycling Safety
 Safer Cycling: How the City of Vancouver is Proactively Improving Cycling Safety Brian Patterson, MCIP, RPP Urban Systems 2015 Canadian Association of Road Safety Professionals (CARSP) Conference Session
Speed Limits in the Hoddle Grid
 Speed Limits in the Hoddle Grid Recent History of speed limits March 2013 Docs # 7738485 1 Introduction Muncipalities have power to Erect speed limit signs BUT Municipalities DO NOT have the power to approve
DANGEROUS BY DESIGN WISCONSIN. Solving the Epidemic of Preventable Pedestrian Deaths (And Making Great Neighborhoods)
") DANGEROUS BY DESIGN 2011 WISCONSIN Solving the Epidemic of Preventable Pedestrian Deaths (And Making Great Neighborhoods) DANGEROUS BY DESIGN 2011 Wisconsin T4AMERICA.ORG Dangerous by Design 2011: Wisconsin
DANGEROUS BY DESIGN 2011 WISCONSIN Solving the Epidemic of Preventable Pedestrian Deaths (And Making Great Neighborhoods) DANGEROUS BY DESIGN 2011 Wisconsin T4AMERICA.ORG Dangerous by Design 2011: Wisconsin
road safety issues 2001 road toll for Gisborne district July 2002 Road user casualties Estimated social cost of crashes*
 GISBORNE DISTRICT road safety issues July 22 The Land Transport Safety Authority (LTSA) has prepared this Road Safety Issues Report. It is based on reported crash data and trends for the 1997 21 period.
ITS-NY ANNUAL MEETING Bus Rapid Transit in New York City: Bus Lane Operations on One-Way Arterial Streets
 ITS-NY ANNUAL MEETING Bus Rapid Transit in New York City: Bus Lane Operations on One-Way Arterial Streets June 9, 2011 Ted Orosz AICP, Director Long Range Bus Planning MTA New York City Transit 1 Overview
FLETCHER AVENUE PEDESTRIAN AND BICYCLIST BEHAVIOR CHANGE FORMATIVE RESEARCH PROJECT
 FLETCHER AVENUE PEDESTRIAN AND BICYCLIST BEHAVIOR CHANGE FORMATIVE RESEARCH PROJECT EXTENT OF CHANGES IN PEDESTRIAN AND BICYCLIST ATTITUDES AND BEHAVIORS DIRECTLY AFTER A COMPLETE STREETS PROJECT IN FLORIDA
Frequently asked questions (FAQ) about a borough-wide 20 mph speed limit
 about a borough-wide 20 mph speed limit") Frequently asked questions (FAQ) about a borough-wide 20 mph speed limit February 2013 1. Is it safer to drive at 20 mph? Yes. According the Royal Society for Prevention of Accidents (RoSPA) if a pedestrian
Frequently asked questions (FAQ) about a borough-wide 20 mph speed limit February 2013 1. Is it safer to drive at 20 mph? Yes. According the Royal Society for Prevention of Accidents (RoSPA) if a pedestrian
Department of Transportation
 Department of Transportation I. Internal Scan The number of older drivers in the United States will double over the next 30 years. By 2030 one in five Americans will be age 65 or older. On a licensed-driver
DRAFT MOVING FORWARD RHODE ISLAND BICYCLE MOBILITY PLAN 2018 PREPARED FOR PREPARED BY IN ASSOCIATION WITH
 RHODE ISLAND MOVING FORWARD BICYCLE MOBILITY PLAN 2018 PREPARED FOR PREPARED BY IN ASSOCIATION WITH T AF CHAPTER 1 D R INTRODUCTION CHAPTER 3 ARTICULATES VISION Bicycling is safe, fun and practical in