Route 9 Davidson County Business 85 Service Equity Analysis
|
|
|
- Cecily Lewis
- 5 years ago
- Views:
Transcription


1 Route 9 Davidson County Business 85 Service Equity Analysis Transportation is not an end in and of itself, but a means to providing access to opportunity. Source: LivingCities.org 1 P a g e
2 This analysis was conducted in compliance with Federal Transit Administration (FTA) Circular A which requires that under Title VI of the Civil Rights Acts of 1964, the Piedmont Authority for Regional Transportation herein referred to as PART; shall evaluate significant system-wide service and fare changes and proposed improvements at the planning and programming stages to determine whether those changes have a discriminatory impact on minority and low income populations. In its Title VI Program Submittal to FTA, PART must provide a copy of the equity evaluation of any significant service changes and fare changes implemented since the last submission. Reinforced in the March 8, 2011 FTA Dear Colleague letter PART is subject to the following: Recipients to which this chapter applies shall evaluate significant system-wide service and fare changes and proposed improvements at the planning and programming stages to determine whether those changes have a discriminatory impact. For service changes, this requirement applies to "major service changes" only. The recipient should have established guidelines or thresholds for which it considers a "major" change to be. Often, this is defined as a numerical standard, such as the change that affects 25 percent of service hours of the route." i P a g e
3 Table of Contents Summary ii Existing Conditions Route Analysis Equity Analysis Proposed Route Revisions Methodology Ridership Potential Ridership Projections Transit Propensity Equity Analysis Service Standards Regional Demographics ii P a g e
4 Summary Route 9 - Davidson Business 85 Express has experienced poor ridership since a service reduction occurred in July 2012 due to funding shortages. In the spring of 2015 the PART Planning Department began an analysis of the transit service within the Business 85 Corridor. The conclusions were: Ridership projections and potential indicate great ridership numbers if service could be expanded; Davidson County Transportation System (DCTS) had established successful circulators in Lexington and Thomasville and a connector service between the two cities. These successes support the view that there is a greater need and strong foundation for more transit service in the corridor; and Despite the fact that most of the very limited ridership traveled to Greensboro, the actual Davidson to Guilford County commuting patterns and out of county trips provided by DCTS were to High Point and not Greensboro. After reviewing all the available data the recommendations are to: 1. increase service in the corridor to four morning, two mid-day and four evening trips; 2. revise the route to go to downtown High Point eliminating Route 9 service to Greensboro; and 3. extend service into uptown Lexington and downtown Thomasville. Below is a comparison of the service characteristics of the existing and proposed route: Current Service Service Characteristics: Takes 1 bus to operate miles in length 1,600 revenue hours / annually 4 trips daily (2 N. bound and 2 S. bound) Proposed Service Service Characteristics: Takes 1 bus to operate 50.5 miles in length 2,016revenue hours / annually 10 trips daily (5 N. and 5 S. bound) iii P a g e
5 Demographic Information within ¼ mile of Each Stop Current Service Proposed Service People 22,622 3,525 Jobs 44,761 7,277 Low Income Families 44.20% 60.8% Families in Poverty 28.30% 45.4% Minority Population 48.60% 61.7% Households with no Vehicles 13.00% 17.2% Persons with Limited English 3.70% 4.5% Status Persons 65 years Old or Older 8.95% 12.6% Persons 18 years Old or Younger 16.80% 29.4% Persons with Disabilities 11.75% 17.5% Historical Route 9 Ridership Calendar Year Annual Total Monthly Average , , , ,966 1, ,066 1, , ,012 Based upon current monthly ridership for Route 9 factoring in the increased level of service the projected ridership for the proposed Route 9 is: Projected Monthly Ridership 930 Projected Annual Ridership - 11,160 Based upon all known factors the potential ridership for the proposed Route 9 is: Potential Monthly Ridership 8,268 Potential Annual Ridership 99,218 iv P a g e
6 Existing Conditions Davidson US 52 (Route 8) and Davidson Business 85 (Route 9) began service in June Their design followed the trend established by PART in The routes were designed to provide commuter express service from Lexington and Midway into Winston-Salem and from Lexington, Thomasville, and Archdale into Greensboro. Connections to High Point where made via a transfer at a Hi tran stop on the southern outskirts of High Point. Route 9 ridership averaged 511 trips per month in Currently there are two morning trips (a north and southbound) and two evening trips (again a north and southbound). The route serves several medical and educational institutions before arriving at the Greensboro rail/bus depot. At its peak the route averaged 1,172 trips per month in In July 2012 the route experienced a service reduction. Overall PART s ridership peaked in 2011 with a monthly average of 48,326 and annual total of 579,916. Route changes system-wide caused an overall reduction in ridership. The decrease system wide bottomed out in 2013 and began to rise in 2014, while Route 9 continued to decrease. Route 9 was established using PART s original service goal of providing commuters express bus service from rural/suburban areas into the urban areas. Those urban areas were Winston-Salem and Greensboro. At that time commuter data showed a strong out-commuter from Davidson into Guilford and Forsyth. In the case of Route 9 it was assumed that the majority of the Davidson out-commuters where headed to Greensboro. High Point was served by Route 9 via a transfer point with Hi tran at the edge of their service area. Service schedules were setup to benefit rural county out-commuters and not riders interested in the reverse commute. However, over time Route 9 served more people heading to Davidson County Community College from urban Guilford County than in the opposite direction. In 2010 Davidson County Transportation Services began to operate a circulator system in Thomasville. They added a Lexington to Thomasville route and a Lexington Circulator route. Ridership on all three routes has been strong, exposing the local need for transit service. The strong ridership on the Davidson County local routes and the low ridership on the PART express route prompted PART to conduct a corridor analysis. 1 P a g e


7 Route Analysis From 2002 to 2015, the primary data source for designing PART s routes was county to county commuting data. This was supplemented with zip code data from large employers in Winston-Salem and Greensboro. Service was established along major transportation corridors and Park-n- Ride Lots were constructed at the edge of the service area. As you can see from the map to the right, Davidson County has the greatest out commute into Guilford County with Forsyth second. Out commuting to these two counties is 69% higher than all in commuting to Davidson County. Then in 2006, the Brookings Institute published a report linking the cost of housing and transportation to location affordability. This led to the development of a tool by the Center for Neighborhood Technologies, referred to as H + T, to show that the further you live from an urban area the higher your transportation costs and lower your housing costs are likely to be. And the closer you lived to an urban area the lower your transportation costs, higher your housing costs are likely to be. The data also revealed that, in many parts of the country, families were spending 55% to 65% of their income on housing and transportation costs. Figure 1: 2010 Commuting Patterns The map to the right clearly shows a lower H+T percentage for people living in Lexington, Thomasville and High Point and along the entire I-85 Business Corridor. Figure 2: H + T in the Business I-85 Corridor 2 P a g e

8 Following the 2010 census more data and tools to analyze that data were released. One tool is the Longitudinal Employer-Household Dynamics Program or LEHD data for short. It is a robust tool that allows the user to see where people in a particular geographical area go to work and where people are coming from who work in a particular geographical area. The map below depicts where people who live in Davidson County work. With this refined view of the data we can see that a greater proportion of the 15,722 people who commute from Davidson to Guilford County work in High Point than work in Greensboro. 1 Figure 3: Where LEHD Data Davidson Depicting County where Residents Davidson Work County Residents Work To determine potential ridership, a Catchment Area Process was used. Two catchment areas were defined: a drive radius around park-n-ride lots (at 5- and 10-minute intervals) and a 5- minute walk radius around bus stops. These areas are depicted in the figure below. The analysis uses socio-economic data taken from the Piedmont Triad Regional Travel Demand Model. Data from the analysis is then applied to ridership projection formulas. There is very little empirical research on ridership projections for commute express services. PART designed a methodology through combining its own research in Park-n-Ride catchment areas, knowledge of ridership habits and industry standards for projecting urban fixed route ridership. The formulas are detailed in the Methodology section. 3 P a g e

9 PART forecasts ridership and potential ridership. The ridership projection takes the current ridership and applies a factor based on the increase or decrease in service. The potential ridership projection uses the total number of people and jobs in the catchment area and applies several factors to estimate the number of people who might access the service. The results of the ridership projection calculations are: Based upon current monthly ridership for Route 9 factoring in the increased level of service the projected ridership is: Projected Monthly Ridership 930 Projected Annual Ridership - 11,160 Based upon all known factors the potential ridership for Route 9 is: Potential Monthly Ridership 8,268 Potential Annual Ridership 99,218 The projected ridership is close to twice the current ridership. The potential ridership is in line with the current ridership of PART s Route 3, the High Point Express. Figure 4: Catchment Areas for Route 9 Analysis The final element that is examined is a measure of Transit Propensity. This calculation uses the same socio-economic data as discussed above and projects the level of service that could be supported by a given area or corridor. The formula is detailed under the Methodology section. The Transit Propensity shows areas within Lexington, Thomasville and downtown High Point that could support 60-minute to 30-minute frequencies. Refer to Figure 5. 4 P a g e
10 Table 1: Persons, Jobs and Students within a 5 and 10 minute drive of a Park-n-Ride Lot Socio-economic Data min 1) 10 min 1) 5 min 1) 10 min 1) Population 86, ,512 89, ,311 Highway Retail 5,799 8,268 6,119 8,704 Industry 18,550 33,715 19,291 34,840 Employment 2) Students Retail 11,676 19,218 12,130 19,909 Service 15,533 24,267 17,740 27,454 Office 6,107 7,851 6,327 8,165 School/University 2,704 6,266 2,853 6,564 K12 13,098 35,279 13,356 36,035 College/University 6,102 10,234 6,892 11,559 5 P a g e
11 Employment FINAL / Route 9 Davidson County Business 85 Service Equity Analysis Table 2: Persons, Jobs and students within a 5-minute walk of a bus stop or Park-n-Ride Lot Socio-economic Data South Lexington Depot District Davidson Co. Transportation DCCC Thomasville GTCC High Point Hitran Terminal High Point Regional Hospital Population Hwy. Retail Industry Retail Service Office School/ University Total Students K College/ University ,100 4, ,441 5,017 6 P a g e


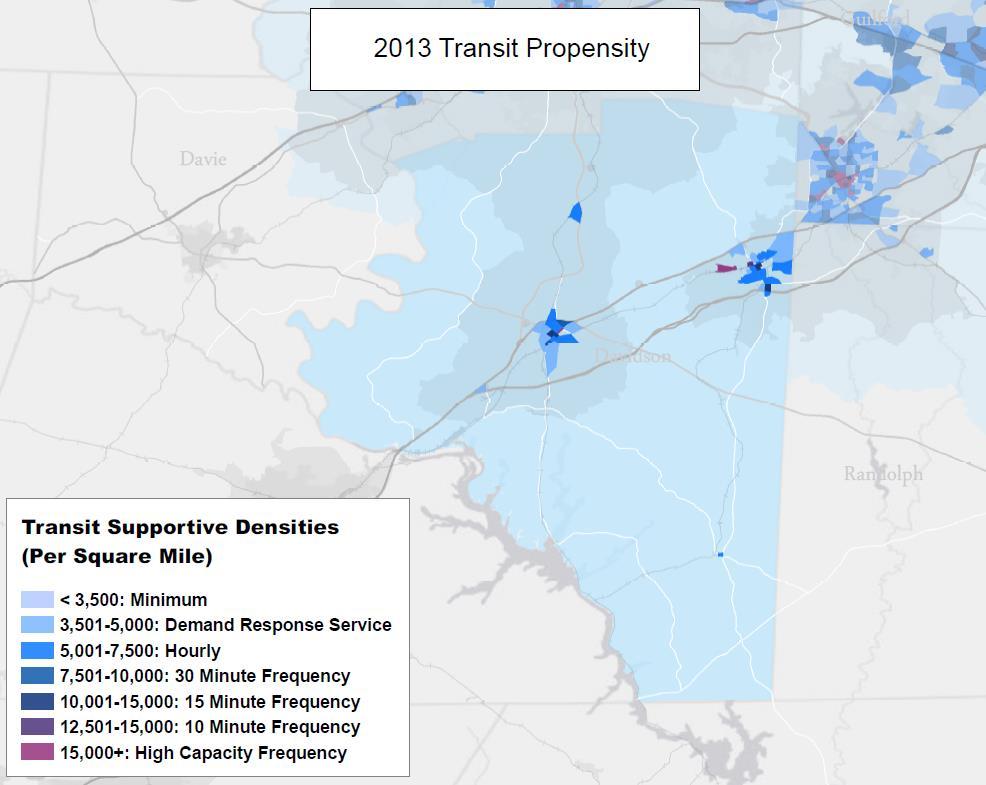
12 Figure 5: Transit Propensity for Route 9 Analysis 7 P a g e
13 Equity Analysis This analysis complies with Title VI of the Civil Rights Acts of 1964 and the Federal Transit Administration (FTA) Circular A which requires transit systems to evaluate significant system-wide service and fare changes and proposed improvements at the planning and programming stages to determine whether those changes have a discriminatory impact. PART uses a tool called Remix for routing planning and title VI analyses. The methodology for the Equity Analysis is found at the end of the report. The results of the analysis are in the table below. Route Population (within 1/4 mi) Low Income Before Minority Trips (Annually) Existing Morning Run 6, % 49.6% 252 Existing Evening Run 6, % 49.6% S. Lex P&R AM Lex to HP Lex to HP Lex to HP S. Lex P&R PM 0 0 All Changes 6, % 49.6% 504 Route Population (within 1/4 mi) Low Income After Minority Trips (Annually) Existing Morning Run 0 0 Existing Evening Run S. Lex P&R AM 3, % 60.8% Lex to HP 2, % 61.7% Lex to HP 2, % 61.7% Lex to HP 2, % 61.7% S. Lex P&R PM 2, % 59.5% 252 All Changes 3, % 60.8% 1,260 Difference People-Trips Route (Population * Trips) Low Income People-Trips Minority People-Trips Change Borne By Low Income Change Borne by Minorities Existing Morning Run -1,701, , , % 49.6% Existing Evening Run -1,701, , , % 49.6% 01 S. Lex P&R AM 859, , , % 60.8% 02 Lex to HP 631, , , % 61.7% 03 Lex to HP 631, , , % 61.7% 04 Lex to HP 631, , , % 61.7% 05 S. Lex P&R PM 722, , , % 59.5% All Changes 74, , , % 582.8% 8 P a g e
14 The route potentially serves fewer people overall, because it does not continue on into Greensboro. However it provides more service at a greater frequency to persons in poverty and persons who have no other means of transportation. Within ¼ mile of each stop there are: Existing Route Proposed Route People 22,622 3,525 Jobs 44,761 7,277 Low Income Families 44.20% 44.23% Families in Poverty 28.30% 44.23% Minority Population 48.60% 61.60% Households with no Vehicles 13.00% 16.50% Persons with Limited English Status 3.70% 4.73% Persons 65 years Old or Older 8.95% 12.60% Persons 18 years Old or Younger 16.80% 29.80% Persons with Disabilities 11.75% 17.37% The tool used to conduct the Title VI analysis also projects ridership based on people within a ¼ mile of a bus stop. The calculation is similar to the one conducted and detailed in this analysis. The difference is that it uses total population, and PART s methodology focuses on people working in the health and education industries and people likely to use transit. 9 P a g e


15 Proposed Route Revisions The data makes it clear that most of the commuters leaving Davidson and heading to Guilford are headed to High Point or farther north to the NC68/Airport area. Ridership potential is greater than current ridership and is capable of supporting hourly service. Through discussions with Davidson County officials and service providers, it was determined that connecting the PART route to transfer points for the existing DCTS circulator and connector services will provide better and less expensive connections to High Point. Therefore the following changes are recommended for Route 9: 1. Increase the number of trips from four to four morning, two mid-day and four evening; 2. Revise the route to go to downtown High Point eliminating the service to Greensboro; and 3. Extend service into uptown Lexington and downtown Thomasville. The proposed route is shown to the left and the schedule is shown below. The revised route will take 400 more revenue hours to operate and provide continuous service throughout the day. The schedule was structured to accommodate persons traveling north to downtown High Point in the mornings and south to Davidson County in the afternoon. This didn t allow optimal timing at transfer points with the circulators and PART Route 3 Express. The average wait time for transferring is 22 minutes. 10 P a g e
16 Methodology Ridership Potential The Ridership Potential Equation was developed by PART. It takes the total number of potential transit riders in a corridor and adjusts for the percentage of people who commute in and out of the county and factors in the regional percentage of people who currently use public transit. From Out-Commute: CA x OC% x RMS = TOCR 78,971 x 9.1% x 0.83% = 63.6 CA = Total Population within a 5-minute drive of a park-n-ride lot OC = Out of County Commuters RMS = Regional Mode Split for Transit Ridership TOCR = Total Riders from Out of County Commuters TOCR + TICR = TPR = TPR = Total Number of Potential Riders From In-Commute: AES x RMS = TICR 6,058 x 0.83% = AES = Total number of employees and students with a 5-minute walk of a park-n-ride lot and stop, includes the entire college or hospital campus RMS = Regional Mode Split for Transit Ridership TICR = Total Riders from Into County Commuters TPR x TpD x DpM = TPM x 2 x 21 = 8,268 TpR = Total Number of Potential Riders TpD = Trips per Day DpM = Days per Month TPM = Trips per Month 11 P a g e
17 Projected Ridership The Projected Ridership Formula takes the existing route ridership and applies an increase or decrease to ridership based upon the increase or decrease in the level of service. For example, the method assumes that an increase in service frequency from every 60 minutes to every 30 minutes would increase the ridership. CR x LOSF = PR 511 x 1.82% = 930 CR = Current Monthly Ridership LOSF = Level of Service Factor (elasticity rate applied based on increase/decrease of headway) PR = Projected Ridership Transit Propensity The Transit Propensity Measure is calculated as follows: Transit Propensity = Population + (2 x Employment) Employment projections are doubled based on guidance from the Transportation Research Board s (TRB) Transit Capacity and Quality of Service Manual. The employment projection is added to the population forecast to estimate the number of people that could support transit service (i.e. transit propensity). The combined employment and population figures were generated for Traffic Analysis Zones (TAZs) within the model area and for U.S. Census block groups outside the model area. The figures were then divided by the number of square miles for each TAZ or block group to generate transit-supportive densities for each county. The transit densities were then grouped into transit service classifications presented in TRB s Transit Capacity and Quality of Service Manual. These classifications, and their associated transit supportive densities, are listed in Figure 5 and illustrated in the graph below. 12 P a g e

18 Equity Analysis Data Sources Graph 1: Transit Supportive Densities and their associated service levels Census data is provided by the US American Community Survey, Population is coded by table B03002, field B Low income status is set at 100%, 150% or 200% of the US poverty level, depending on your individual agency. This is coded by the appropriate fields in table C Minority status is coded by table B03002, by subtracting the white, non-hispanic population (B ) from the total population (B ). Service area is a set of block groups determined by a shapefile your agency provides. Map and routing data is provided by OpenStreetMap, Mapbox, and Valhalla. Methodology 1. Determine the population near a route, including low income and minority %. For each route, build a shape that represents the area within quarter mile of any of its stops. Intersect the catchment area with 2013 ACS Census data. Get a list of block groups and the percentage overlap with each. For each block group, take the percentage of overlap and multiply it by the block group s statistics. Get the population, minority population, and low income population for each group and sum them together. This is the total population a route could serve. 2. Compare the number of people-trips, before and after. Multiply the population near a route times the number of trips it makes (per year) to get people-trips. Repeat for low-income and minority populations to get low income people-trips and minority people trips. 13 P a g e
19 Compare these numbers between the before and after versions of the route, to get a set of people-trip differences. We match before and after using routes that have the same name. 3. Determine the total difference in people-trips across the transit system. Repeat the process above for every route in the transit system. Sum together the difference in people trips. This will return three numbers: total difference in people-trips, total difference in low-income people-trips, and total difference in minority people trips. 4. Calculate the change borne by low-income and minority populations. Divide the total difference in low-income people trips by the total difference in people-trips to get the percentage of change borne by those with low incomes. Repeat for minority people-trips. 5. Compare the percentage change to the average in the service area. Calculate the average percentage of low-income and minority populations across the entire service area. Subtract from the change borne by those populations. Get two final numbers: the delta between the impact this set of transit changes had on low income and minority populations compared to any average change. Additional Raw Data In addition to the methodology outlined above, a set of raw data is attached that includes: A list of Census block groups in the service area with population, low-income, minority information for each. A before and after count of trips in each block group. A service-area-wide average of minority and low-income populations PART s Service Standards from Title VI Plan adopted September 13, 2013 Vehicle Load Standard PART operates regional express bus transportation services throughout a 10-county region. Due to work shifts that vary the Vehicle Load Standard is applied equally between peak and off-peak times. Also, with limited service for Saturday and Sunday PART applies the same standard for weekend service as well. The average of all loads during the peak and off-peak operating periods should not exceed a load factor of 1.4. With the 24 mini-bus this represents 18 seated, 7 standing for a total of 25 passengers. For the 35 low floor bus this represents 31 seated, 12 standing for a total of 43 passengers. For the 40 low floor bus this represents 39 seated, 15 standing for a total of 54 passengers. 14 P a g e
20 Vehicle Type Average Passenger Capacities Seated Standing Total Load Factor 24 mini-bus low floor bus low floor bus Vehicle Headways Weekday PART service operates to and from four primary transportation centers. They include the Winston-Salem Transportation Center, the Greensboro Depot, the High Point Broad Ave. Terminal and the PART Hub near the PTI Airport. On the primary urban routes during peak hours the most frequent service is provided on 30 minute headways. For urban routes during off-peak times frequency is provided every 60 minutes. For the rural areas during peak hours the most frequent service is provided on 36 minute headways. During off-peak time for rural area routes service is provided at various times ranging from 180 minutes to no service during off-peak times. During weekday service PART also provides shuttle service from the PART Hub to businesses in and around the PTI Airport area on 30 minute headways. This service is provided during peak, off-peak and evening hours of operation. Weekend PART service is limited to one route traveling between Winston-Salem and High Point providing service to the Amtrak train station. Three round trips are provided each Saturday and Sunday with frequency every 5 hours. Headways and Periods of Operation Weekdays Peak Off-Peak Evening Urban Express Rural Express Shuttles Peak 6 am 9 am, 3 pm 6 pm, Off-Peak 9 am 3 pm, Evening 6 pm 7 pm, no service. 15 P a g e
21 Headways and Periods of Operation Weekends AM Peak Mid-day PM Peak Amtrak Connector 1 trip 1 trip 1 trip On-Time Performance Standard PART Express routes are to be considered on time if they are no more than 1 minute early and no more than 5 minutes late. The on-time performance goal is set at 95% or greater. PART will continuously monitor the various routes throughout the system to maintain this standard. Service Availability Standard PART Express routes are designed to provide access to routes throughout a 10-county region. Access is made available through the use of Park & Ride Lots and direct stops along a route. Due to the nature of express service stops are limited along the routes due to the vehicles traveling on the highway system in the region. Major employment centers, central business districts, schools, universities and hospitals are target areas for the routes. Strategic corridors for the regions highway system are also used to enhance the efficiency of the service to the region. Regional Demographics From Title VI Plan Adopted September 13, 2013 The Piedmont Authority for Regional Transportation does not supersede, but compliments local transit services in the Piedmont Triad Region of North Carolina. The PART territory includes four metropolitan areas as defined by US Census metropolitan planning statistical areas, and ten counties. The following information is based on 2000 Census, local jurisdiction data, and state data center information compiled and maintained at PART. The PART territorial jurisdiction had a population (2011 American Community Survey 3 year data) of 1,591,511 individuals. The race and ethnic breakout is as follows: Race Total Percentage of Population White/Caucasian 1,160, African American 345, American Indian / Alaskan Native 15, Asian 37, Hawaiian / Pacific Islander Other 64,288 4 Hispanic / Latino 138, Ninety percent of the region s population is White and African American ethnicity. The remaining 10% is broken out by all other recognizable ethnic cultures with the largest portion being Hispanic/Latino cultures; representing nearly 8%. 16 P a g e
22 6.98% of the population in the PART territory is foreign born, with 55% of those entering the region between 1990 and % of the population 5 years of age or older in the PART territory speaks a language other than English at home and of that group 49.6% speak English less than very well. The following information is based on the 2011 American Community Survey 5-year data sets for the PART territory. PART Service Area Population who are: Percentage Spanish speakers 7.5 Spanish speakers who speak English less than very well 54.3 Indo-European language speakers (other than English only speakers) 1.4 Indo-European speakers who speak English less than very well 28.2 Asian & Pacific Island (PI) languages speakers 1.3 Asian & PI language speakers who speak English less than very well 50.1 Speakers of languages not mentioned above 0.4 Other languages speakers who speak English less than very well 38.4 Data retrieved from the various school systems across the PART territory area reflects the highest concentration of Limited English Proficiency households within the urbanized area schools, and are ranked in order of highest to lowest: Spanish Vietnamese Arabic Urdu French Household Language by Linguistic Isolation Linguistic isolation describes a household as one in which no member 14 years and over speaks only English or speaks a non-english language and thereby speaks English very well. In simplistic terms, all members of the household 14 years and over have at least some difficulty with English. The data below is gathered from local human service agencies based on their interaction to communities from their jurisdiction. All households 4.5% Spanish 28.6% Other Indo-European languages 13.8% Asian and Pacific Island languages 17.6% Other languages 19.4% The data available from the sampling conducted for each of the jurisdictions within the PART territorial jurisdiction, 2000 census, 2009 census update and American Survey data combined; shows significant linguistically isolated households primarily in urbanized areas. In utilizing the data available from the sources identified above, PART, County school systems and human service agencies have been able to determine that the greatest non- English language need in the region is Spanish and a lower tier representation of Vietnamese / Asian dialect (Predominantly Korean). 17 P a g e
Title VI Fare Change Equity Analysis
 Title VI Fare Change Equity Analysis Evaluation Report Submitted to Dallas Area Rapid Transit Submitted by TranSystems June 2012 Title VI Fare Change Equity Analysis Introduction DART has proposed a schedule
1999 On-Board Sacramento Regional Transit District Survey
 SACOG-00-009 1999 On-Board Sacramento Regional Transit District Survey June 2000 Sacramento Area Council of Governments 1999 On-Board Sacramento Regional Transit District Survey June 2000 Table of Contents
Travel and Rider Characteristics for Metrobus
 Travel and Rider Characteristics for Metrobus 040829040.15 Travel and Rider Characteristics for Metrobus: 2012-2015 Overview The Miami Dade County Metropolitan Planning Organization (MPO) conducted a series
Guidelines for Providing Access to Public Transportation Stations APPENDIX C TRANSIT STATION ACCESS PLANNING TOOL INSTRUCTIONS
 APPENDIX C TRANSIT STATION ACCESS PLANNING TOOL INSTRUCTIONS Transit Station Access Planning Tool Instructions Page C-1 Revised Final Report September 2011 TRANSIT STATION ACCESS PLANNING TOOL INSTRUCTIONS
. ' motion. APPLtlDK.L - L"iLC_t1GLR 201b APPENDIX 7 TECHNICAL MEMOS
 . ' motion APPLtlDK.L - L"iLC_t1GLR 201b APPENDIX 7 TECHNICAL MEMOS The nmotion program will provide a large number of benefits for Middle Tennessee. This document presents selected benefits and other
TriMet Title VI and Transit Equity Impacts Assessment Recommended Service Changes Line 47 Baseline/Evergreen and 48 Cornell
 TriMet Title VI and Transit Equity Impacts Assessment Recommended Service Changes Line 47 Baseline/Evergreen and 48 Cornell Final Report May 16, 2013 Table of Contents Executive Summary... 3 Title VI and
Midtown Corridor Alternatives Analysis
 Midtown Corridor Alternatives Analysis Ridership Forecast Methodology and Results December 2013 Prepared by the SRF Consulting Group Team for Table of Contents Introduction... 1 Methodology... 1 Assumptions...
Tulsa Metropolitan Area LONG RANGE TRANSPORTATION PLAN
 Tulsa Metropolitan Area LONG RANGE TRANSPORTATION PLAN Indian Nations Council of Governments August 2005 CONTACTING INCOG In developing the Destination 2030 Long Range Transportation Plan, INCOG s Transportation
METRO Light Rail: Changing Transit Markets in the Phoenix Metropolitan Area
 METRO Light Rail: Changing Transit Markets in the Phoenix Metropolitan Area Abhishek Dayal, AICP Planner III, METRO Light Rail Phoenix, AZ BACKGROUND Transit in the Phoenix Region Transit services in the
ADOT Statewide Bicycle and Pedestrian Program Summary of Phase IV Activities APPENDIX B PEDESTRIAN DEMAND INDEX
 ADOT Statewide Bicycle and Pedestrian Program Summary of Activities APPENDIX B PEDESTRIAN DEMAND INDEX May 24, 2009 Pedestrian Demand Index for State Highway Facilities Revised: May 29, 2007 Introduction
Executive Summary. TUCSON TRANSIT ON BOARD ORIGIN AND DESTINATION SURVEY Conducted October City of Tucson Department of Transportation
 Executive Summary TUCSON TRANSIT ON BOARD ORIGIN AND DESTINATION SURVEY Conducted October 2004 Prepared for: City of Tucson Department of Transportation May 2005 TUCSON TRANSIT ON BOARD ORIGIN AND DESTINATION
Pocatello Regional Transit Master Transit Plan Draft Recommendations
 Pocatello Regional Transit Master Transit Plan Draft Recommendations Presentation Outline 1. 2. 3. 4. What is the Master Transit Plan? An overview of the study Where Are We Today? Key take-aways from existing
City of Wayzata Comprehensive Plan 2030 Transportation Chapter: Appendix A
 A1. Functional Classification Table A-1 illustrates the Metropolitan Council s detailed criteria established for the functional classification of roadways within the Twin Cities Metropolitan Area. Table
FARE IMPACT STUDY. Prepared by the. Pioneer Valley Planning Commission
 FARE IMPACT STUDY Prepared by the Pioneer Valley Planning Commission March 30, 2018 CONTENTS 1. PURPOSE... 3 2. STUDY CONTEXT... 4 3. PVTA S CURRENT FARE PRICES AND POLICIES... 4 4. HISTORY OF PVTA FARE
APPENDIX C Arlington Transit On-Board Survey Technical Memorandum
 APPENDIX C Arlington Transit On-Board Survey Technical Memorandum Arlington County Appendix C December 2010 TABLE OF CONTENTS 1.0 Overview of Transit Rider Survey Process... 1 2.0 Responses to Survey Questions...
Potential MBTA Fare Changes in SFY 2017
 Potential MBTA Fare Changes in SFY 2017 Option 1 Impact Analysis A report produced for the Massachusetts Bay Transportation Authority by the Central Transportation Planning Staff Potential MBTA Fare Changes
METHODOLOGY. Signalized Intersection Average Control Delay (sec/veh)
") Chapter 5 Traffic Analysis 5.1 SUMMARY US /West 6 th Street assumes a unique role in the Lawrence Douglas County transportation system. This principal arterial street currently conveys commuter traffic
Chapter 5 Traffic Analysis 5.1 SUMMARY US /West 6 th Street assumes a unique role in the Lawrence Douglas County transportation system. This principal arterial street currently conveys commuter traffic
Potential MBTA Fare Changes in SFY 2017
 Potential MBTA Fare Changes in SFY 2017 Modification to Option 2: Impact Analysis A report produced for the Massachusetts Bay Transportation Authority by the Central Transportation Planning Staff Potential
RIDERSHIP PREDICTION
 RIDERSHIP PREDICTION Outline 1. Introduction: route ridership prediction needs and issues. 2. Alternative approaches to route ridership prediction. Professional judgement Survey-based methods Cross-sectional
AAMPO Regional Transportation Attitude Survey
 AAMPO Regional Transportation Attitude Survey Traditionally Underserved Populations helping organizations make better decisions since 1982 2018 Submitted to the AAMPO By: ETC Institute 725 W. Frontier
Cobb Community Transit
 Cobb Community Transit Ridership Survey January 2014 1 Methodology Paper survey of 315 CCT riders 165 on local routes (margin of sampling error: ± 7.6%) 150 on express routes (margin of sampling error:
PASSENGER SURVEY RESULTS
 ROGUE VALLEY TRANSPORTATION DISTRICT PASSENGER SURVEY RESULTS Date: December 12, 2018 Project #: 21289 To: Paige West, RVTD From: Susan Wright, PE; Molly McCormick; (Kittelson & Associates, Inc.) Subject:
METROPOLITAN TRANSPORTATION PLAN OUTREACH: INTERACTIVE MAP SUMMARY REPORT- 10/03/14
 METROPOLITAN TRANSPORTATION PLAN OUTREACH: INTERACTIVE MAP SUMMARY REPORT- 10/03/14 INTRODUCTION This document summarizes the results of the online interactive mapping exercise implemented by MIG for the
MIDCOAST MAINE TRANSIT STUDY. In Association with: MORRIS COMMUNICATIONS
 MIDCOAST MAINE TRANSIT STUDY In Association with: MORRIS COMMUNICATIONS Public Meetings June, 2013 Project Background Four coastal towns of Knox County have agreed on the importance of a transit study
CITY OF ALPHARETTA DOWNTOWN MASTER PLAN TRAFFIC EVALUATION
 CITY OF ALPHARETTA DOWNTOWN MASTER PLAN TRAFFIC EVALUATION June 2015 CITY OF ALPHARETTA DOWNTOWN MASTER PLAN TRAFFIC EVALUATION Introduction The Alpharetta Downtown Master Plan was developed in the fall
Online Open House Survey Report. December 2016
 December 216 I. OVERVIEW & OUTREACH SUMMARY Introduction Washington County evaluated long-term transportation investments and strategies as part of the Transportation Futures Study. The purpose of the
BUILDING THE CASE FOR TRAVEL OPTIONS IN WASHING TON COUNTY. Image: Steve Morgan. Image: Steve Morgan
 BUILDING THE CASE FOR TRAVEL OPTIONS IN WASHING TON COUNTY Image: Steve Morgan Image: Steve Morgan Image: TriMet Image: TriMet WHAT ARE TRAVEL OPTIONS PROGRAMS? Travel options programs encourage residents,
Rochester Area Bike Sharing Program Study
 roc bike share Rochester Area Bike Sharing Program Study Executive Summary ~ January 2015 JANUARY 2015 8484 Georgia Avenue, Suite 800 Silver Spring, MD 20910 3495 Winton Pl., Bldg E, Suite 110 Rochester,
Purpose and Need. Chapter Introduction. 2.2 Project Purpose and Need Project Purpose Project Need
 Chapter 2 Purpose and Need 2.1 Introduction The El Camino Real Bus Rapid Transit (BRT) Project (Project) would make transit and other transportation improvements along a 17.6-mile segment of the El Camino
Fixed Guideway Transit Outcomes on Rents, Jobs, and People and Housing
 Fixed Guideway Transit Outcomes on Rents, Jobs, and People and Housing Arthur C. Nelson, Ph.D., ASCE, FAICP Professor of Planning and Real Estate Development University of Arizona 1 Changing Transportation
Topics To Be Covered. Summarize Tier 2 Council Direction Discuss Mill and Ash Alternatives Next Steps
 Topics To Be Covered Summarize Tier 2 Council Direction Discuss Mill and Ash Alternatives Next Steps Tier 2 Council Direction Dismiss Bus Rapid Transit along the Union Pacific Railroad Dismiss Bus Rapid
ORANGE COUNTY TRANSPORTATION AUTHORITY. Metrolink Ridership and Revenue Quarterly Report. Staff Report
 ORANGE COUNTY TRANSPORTATION AUTHORITY Metrolink Ridership and Revenue Quarterly Report Staff Report March 8, 2012 To: From: Subject: Transit Committee Will Kempton, Chief Executive Officer Metrolink Ridership
Estimating Ridership of Rural Demand-Response Transit Services for the General Public
 Estimating Ridership of Rural Demand-Response Transit Services for the General Public August 2016 prepared for US DOT prepared by Jeremy Mattson North Dakota State University Upper Great Plains Transportation
Philadelphia Bus Network Choices Report
 Philadelphia Bus Network Choices Report JUNE 2018 SEPTA Table of Contents Executive Summary...7 What if transit gave us more freedom?... 8 What is this report?... 8 The main conclusions... 9 What is happening
Webinar: The Association Between Light Rail Transit, Streetcars and Bus Rapid Transit on Jobs, People and Rents
 Portland State University PDXScholar TREC Webinar Series Transportation Research and Education Center (TREC) 11-15-2016 Webinar: The Association Between Light Rail Transit, Streetcars and Bus Rapid Transit
Nebraska Births Report: A look at births, fertility rates, and natural change
 University of Nebraska Omaha DigitalCommons@UNO Publications since 2000 Center for Public Affairs Research 7-2008 Nebraska Births Report: A look at births, fertility rates, and natural change David J.
Westside Transportation Access Needs Assessment - Short and Long Term Improvements
 ABSTRACT The Los Angeles County Metropolitan Transportation Authority (MTA) adopted the 2001 Long Range Transportation Plan (LRTP), which sets out the County s transportation investments for the next 20-25
Regional Transportation Needs Within Southeastern Wisconsin
 Regional Transportation Needs Within Southeastern Wisconsin #118274 May 24, 2006 1 Introduction The Southeastern Wisconsin Regional Planning Commission (SEWRPC) is the official areawide planning agency
Evan Johnson, Tindale Oliver & Associates. Alan Danaher, P.E., PTOE, AICP, PTP
 To: Copies: From: Evan Johnson, Tindale Oliver & Associates Matt Muller, RTS Jesus Gomez, RTS Alan Danaher, P.E., PTOE, AICP, PTP Date: January 14, 2014 Subject: Ridership Projections Gainesville Streetcar
Gratiot Avenue Transit Study Tech Memo #4: Ridership
 Gratiot Avenue Transit Study Tech Memo #4: Ridership 5/31/2016 Table of Contents 1 INTRODUCTION... 3 PROJECT DESCRIPTION... 3 2 TECH MEMO #4 OVERVIEW... 5 METHODOLOGY... 5 3 THE ALTERNATIVES AND POTENTIAL
IndyGo On-Board Transit Survey DRAFT Report. April 21, Prepared by Lochmueller Group and ETC Institute
 IndyGo On-Board Transit Survey DRAFT Report April 21, 2017 Prepared by Lochmueller Group and ETC Institute (THIS PAGE INTENTIONALLY LEFT BLANK) 2016 IndyGo On-Board Survey IndyGo On-Board Survey TABLE
PUBLIC TRANSPORTATION PLAN FOR THE CITY OF GEORGETOWN
 PUBLIC TRANSPORTATION PLAN FOR THE CITY OF GEORGETOWN PRESENTATION TO CITY COUNCIL JANUARY 22, 2008 PUBLIC TRANSIT FOR THE CITY OF GEORGETOWN LOCAL SERVICE For Georgetown residents to Georgetown destinations.
Aging & Mobility: Stranded Without A Choice
 Aging & Mobility: Stranded Without A Choice Linda Bailey, Policy Analyst This report was created in cooperation with AARP. Why This Study? [Taking away someone s license] really takes away a person s independence
Traffic Impact Study. Westlake Elementary School Westlake, Ohio. TMS Engineers, Inc. June 5, 2017
 TMS Engineers, Inc. Traffic Impact Study Westlake Elementary School Westlake, Ohio June 5, 2017 Prepared for: Westlake City Schools - Board of Education 27200 Hilliard Boulevard Westlake, OH 44145 TRAFFIC
Appendix 3.2 D. Ridership Errata Sheet
 Appendix 3.2 D Ridership Errata Sheet January 14, 2010 Since the release of the Alternatives Description for the South Coast Rail project, the Massachusetts Department of Transportation has identified
Everett Transit Action Plan. Community Open House November 16, 2015
 Everett Transit Action Plan Community Open House Everett has a great location, but getting around the city and into surrounding communities is a problem for all ages Many Voices, One Future: The Everett
Demographic Change in North Carolina
 Demographic Change in North Carolina 5 Trends to Watch North Carolina Aggregates Association June 29, 2017 Rebecca Tippett, PhD Director, Carolina Demography July 1 Population (Millions) North Carolina
Lord Overpass Multi-Modal Boulevard. Nicolas Bosonetto, P.E.
 Lord Overpass Multi-Modal Boulevard Nicolas Bosonetto, P.E. City of Lowell Fourth Largest City in Commonwealth Population of 109,945 Gateway City Diverse 20% Southeast Asian 17% Hispanic 25% Foreign Born
Bike Share Social Equity and Inclusion Target Neighborhoods
 Bike Share Social Equity and Inclusion Target Neighborhoods Target Neighborhoods West End/Visitation Park/Academy/Hamilton Heights Wellsgoodfellow/Kingsway West The Ville/Greater Ville Kingsway East/Fountain
Calgary Transit Route 302 Southeast BRT Year One Review June
 Calgary Transit Route 302 Southeast BRT Year One Review 2011 June Calgary Transit Route 302 Southeast BRT: Year One Review 2011 April Table of Contents 1.0 Executive Summary... 1 2.0 Introduction... 3
APPENDIX W OFF-MODEL ADJUSTMENTS
 APPENDIX W OFF-MODEL ADJUSTMENTS The three-county travel demand model was used to evaluate the land use and transportation project scenarios for the Regional Transportation Plan Update. The model provided
Market Factors and Demand Analysis. World Bank
 Market Factors and Demand Analysis Bank Workshop and Training on Urban Transport Planning and Reform. Baku, April 14-16, 2009 Market Factors The market for Public Transport is affected by a variety of
Moving Ahead. (Community Engagement) Chapter Three
 Chapter Three") 3 Community Chapter Three Moving Ahead (Community Engagement) engagement provided an exciting opportunity to engage Redwood City residents, workers, and business owners people who walk, bike, take transit,
3 Community Chapter Three Moving Ahead (Community Engagement) engagement provided an exciting opportunity to engage Redwood City residents, workers, and business owners people who walk, bike, take transit,
HEALTH INSURANCE COVERAGE STATUS American Community Survey 1-Year Estimates
 S2701 HEALTH INSURANCE COVERAGE STATUS 2014 American Community Survey 1-Year Estimates Supporting documentation on code lists, subject definitions, data accuracy, and statistical testing can be found on
TRAFFIC IMPACT STUDY CRITERIA
 Chapter 6 - TRAFFIC IMPACT STUDY CRITERIA 6.1 GENERAL PROVISIONS 6.1.1. Purpose: The purpose of this document is to outline a standard format for preparing a traffic impact study in the City of Steamboat
Memorandum. Purpose: To update the MPO CTAC on the status of the LRTP scenario evaluation process.
 Charlottesville-Albemarle Metropolitan Planning Organization POB 1505, 401 E. Water St, Charlottesville, VA 22902 www.tjpdc.org (434) 979-7310 phone info@tjpdc.org email Memorandum To: MPO CTAC From: Wood
BEAR CREEK PARK AND RIDE
 BEAR CREEK PARK AND RIDE 7760 178th Pl NE, Redmond, WA 98052 700 Average weekday transit boardings 283 Parking spaces Owned by King County Metro Served by Sound Transit and King County Metro Bear Creek
COLUMBUS AVENUE NEIGHBORHOOD TRANSPORTATION STUDY
 COLUMBUS AVENUE NEIGHBORHOOD TRANSPORTATION STUDY Pedestrian Survey Findings Survey Main Findings: Transit and walking are the main two modes used by both visitors and residents of the area, regardless
4 Ridership Growth Study
 Clause 4 in Report No. 15 of Committee of the Whole was adopted, without amendment, by the Council of The Regional Municipality of York at its meeting held on November 16, 2017. 4 Ridership Growth Study
Understanding Transit Demand. E. Beimborn, University of Wisconsin-Milwaukee
 Understanding Transit Demand E. Beimborn, University of Wisconsin-Milwaukee 1 Purpose To provide a basic understanding of transit ridership and some common misunderstandings. To explain concepts of choice
Ridership in Virginia by System FY2017
 #6C TO: FROM: Chairman McKay and NVTC Commissioners Kate Mattice, Andrew D huyvetter and Nobuhiko Daito DATE: August 30, 2017 SUBJECT: NVTC FY2017 Annual Ridership Report Overall transit ridership in Northern
Highway Transitway Corridor Study
 Highway Transitway Corridor Study CTS Research Conference May 21, 2014 1 2030 Transportation Policy Plan Transitway modes on highways: Highway bus rapid transit (BRT), plan identified 6 total Highway BRT
2016 Capital Bikeshare Member Survey Report
 2016 Capital Bikeshare Member Survey Report Prepared by: LDA Consulting Washington, DC 20015 (202) 548-0205 February 24, 2017 EXECUTIVE SUMMARY Overview This report presents the results of the November
Chapter 5 FUNCTIONAL CLASSIFICATION
 Chapter 5 FUNCTIONAL CLASSIFICATION Functional classification is a system by which streets and roadways may be distinguished by types according to their function within the entire transportation network.
Community Transit Solutions for the Suburbs APTA Annual Meeting Steve Fittante, New Jersey Transit Corporation September 30, 2013
 Community Transit Solutions for the Suburbs APTA Annual Meeting Steve Fittante, New Jersey Transit Corporation September 30, 2013 New Suburban Challenges Lower density development patterns Where is the
Flyaway Bus: GIS Analysis on Current and Potential Ridership, Revenue, and Prospective Stations
 ProfessorBarry Waite & Bonnie Shrewsbury Flyaway Bus: GIS Analysis on Current and Potential Ridership, Revenue, and Prospective Stations 1. Abstract The Flyaway Bus is a long distance non-stop shuttle
U.S. Bicycling Participation Study
 U.S. Bicycling Participation Study Report of findings from the 2016 survey Conducted by Corona Insights Commissioned by PeopleForBikes Released July 2017 Table of Contents Background and Objectives 3 Research
VI. Market Factors and Deamnd Analysis
 VI. Market Factors and Deamnd Analysis Introduction to Public Transport Planning and Reform VI-1 Market Factors The market for Public Transport is affected by a variety of factors No two cities or even
ATTACHMENT 4 - TDM Checklist. TDM Checklist Overview
 ATTACHMENT 4 - TDM Checklist TDM Checklist Overview The proposed checklist rates developments on the degree to which they are TDM and transit supportive. Points are assigned based on the level of transit
Typical Rush Hour Commute. PennyforTransportation.com
 Typical Rush Hour Commute In the News Overview of the Plan Collaborative plan with projects in every community Prioritizing connectivity and congestion relief Dedicated transportation-specific funding;
Hurricane to Zion Canyon Transit Study
 Hurricane to Zion Canyon Transit Study August 2010 Prepared for Five County Association of Governments This Page Intentionally Left Blank TABLE OF CONTENTS TABLE OF CONTENTS... i LIST OF FIGURES... ii
TRANSIT & NON-MOTORIZED PLAN DRAFT FINAL REPORT Butte County Association of Governments
 1 INTRODUCTION Maintaining a high quality of life is the essence of this plan for transit and non-motorized transportation in Butte County. Curbing greenhouse gas emissions (GHG) by reducing congestion,
NC Demographic Trends Through 2035
 NC Demographic Trends Through 2035 House Select Committee on Strategic Transportation Planning and Long Term Funding Solutions February 22, 2016 Rebecca Tippett, University of North Carolina July 1 Population
The North Shore Transportation Improvement Strategy and Western Richmond Terrace 1 : The Forgotten Corridor
 Elm Park Civic Association Island Voice Do Me A Faber The North Shore Transportation Improvement Strategy and Western Richmond Terrace 1 : The Forgotten Corridor Introduction Richmond Terrace is the northernmost
A Selection Approach for BRT Parking Lots Nicolls Road Corridor Parking Study
 A Selection Approach for BRT Parking Lots Nicolls Road Corridor Parking Study Chirantan Kansara, P.E. Engineering Construction Design Planning 2018 ITE Northeastern District Annual Meeting Lake George,
3.0 Future Conditions
 3.0 Future Conditions In order to be able to recommend appropriate improvements to the transportation system of the Town, it is important to first understand the nature and volume of traffic that is expected
Transportation Trends, Conditions and Issues. Regional Transportation Plan 2030
 Transportation Trends, Conditions and Issues Regional Transportation Plan 2030 23 Regional Transportation Plan 2030 24 Travel Characteristics Why Do People Travel? Over one-half of trips taken in Dane
Missing Opportunities: Racial and Ethnic Disparities in the Twin Cities Metro in 2016
 New MetroStats Missing Opportunities: Racial and Ethnic Disparities in the Twin Cities Metro in 2016 10/2/2017 Community Development Committee What s New American Community Survey data released (9/14)
Land Use and Cycling. Søren Underlien Jensen, Project Manager, Danish Road Directorate Niels Juels Gade 13, 1020 Copenhagen K, Denmark
 Land Use and Cycling Søren Underlien Jensen, Project Manager, Danish Road Directorate Niels Juels Gade 13, 1020 Copenhagen K, Denmark suj@vd.dk Summary: Research about correlation between land use and
FY2006 Budget Board Budget Committee request for information. Board Request: Detailed information on bus route 5A DC-Dulless Airport
 Board Request: Detailed information on bus route 5A DC-Dulless Airport Tracking Number: 29 Assigned to Dept/Office: OPER Contact Person: Jim Hughes Metrobus Route 5A was established in December 2000 in
Subject: Solberg Avenue / I-229 Grade Separation: Traffic Analysis
 MEMORANDUM Transportation Bill Troe, AICP Jason Carbee, AICP 12120 Shamrock Plaza Suite 300 Omaha, NE 68154 (402) 334-8181 (402) 334-1984 (Fax) To: Project File Date: Subject: Solberg Avenue / I-229 Grade
Title. Metropolitan Council Transportation Committee December 12, Brad Larson Metro District MnDOT
 Title Metropolitan Council Transportation Committee December 12, 2016 Evaluating the potential for Bus Rapid Transit and MnPASS Express Lanes in the southwest Metro Brad Larson Metro District MnDOT Background
Camosun College Modal Split
 2010 Camosun College Modal Split How Does the College Community Get to Campus? Shannon Craig & Julie Higginson Camosun College 1/21/2011 Contents Introduction... 3 Methodology... 3 Results... 6 Mode Share
2016 Capital Bikeshare Member Survey Report
 2016 Capital Bikeshare Member Survey Report Prepared by: LDA Consulting Washington, DC 20015 (202) 548-0205 February 24, 2017 EXECUTIVE SUMMARY Overview This report presents the results of the November
PEDESTRIAN ACTION PLAN
 ATTACHMENT 2 CITY OF SANTA MONICA PEDESTRIAN ACTION PLAN CITY OF SANTA MONICA PEDESTRIAN ACTION PLAN This page intentionally left blank EXECUTIVE SUMMARY CHAPTER 1 EXECUTIVE SUMMARY Setting the Stage
Bicycle Helmet Use Among Winnipeg Cyclists January 2012
 Bicycle Helmet Use Among Winnipeg Cyclists January 2012 By: IMPACT, the injury prevention program Winnipeg Regional Health Authority 2 nd Floor, 490 Hargrave Street Winnipeg, Manitoba, R3A 0X7 TEL: 204-940-8300
Report Overview Policy versus Performance: Directions for North Carolina s Largest Transit Systems
 For Truth. For Freedom. For the Future of North Carolina Report Overview Policy versus Performance: Directions for North Carolina s Largest Transit Systems By David T. Hartgen Professor of Transportation
Free Ride Transit System 2014 On Board Passenger Survey
 Free Ride Transit System 2014 On Board Passenger Survey March 28, 2014 INTRODUCTION The last on-board passenger survey was conducted by the Breckenridge Free Ride on March 30, 2012. The 2012 survey had
EXECUTIVE SUMMARY OF CALEDON TRANSPORTATION NEEDS STUDY
 EXECUTIVE SUMMARY OF CALEDON TRANSPORTATION NEEDS STUDY The Caledon Transportation Needs Study has been undertaken as a joint project by the Town of Caledon and the Region of Peel to determine the existing
6.0 PEDESTRIAN AND BICYCLE FACILITIES 6.1 INTRODUCTION 6.2 BICYCLE DEMAND AND SUITABILITY Bicycle Demand
 6.0 PEDESTRIAN AND BICYCLE FACILITIES 6.1 INTRODUCTION Bicycle and pedestrian travel along and in the vicinity of the corridor is part of the vision of Somerset and Hunterdon counties and the integrated
Provo City Transportation Master Plan
 Provo City Transportation Master Plan Provo, Utah Adopted: September, 011 UT09-1 1 West Mayflower Way, Ste. Lehi, Utah 80 p. 801/. www.halesengineering.com September, 011 EXECUTIVE SUMMARY Provo City is
Afeasibility study to evaluate bus rapid transit service in the East-West Corridor connecting major employment and activity centers between downtown
 East-West Bus Rapid Transit Feasibility Study Update and Recommended Locally Preferred Alternative (LPA) Summary City of Wauwatosa, Transportation Affairs Committee June 2016 Afeasibility study to evaluate
American River College Student Equity Disproportionate Impact Analyses Fall 2015
 Disproportionate Impact Analyses Fall 2015 This document introduces the set of data ARC s Research Office compiled in Fall 2015. The data reported here were sourced from the California Community College
DON MILLS-EGLINTON Mobility Hub Profile
 Mobility Hub Profile Dundas Don Mills-Eglinton West-Bloor Anchor Hub Gateway Hub N MOBILITY HUBS: Places of connectivity between regional and rapid transit services, where different modes of transportation
Active Travel and Exposure to Air Pollution: Implications for Transportation and Land Use Planning
 Active Travel and Exposure to Air Pollution: Implications for Transportation and Land Use Planning Steve Hankey School of Public and International Affairs, Virginia Tech, 140 Otey Street, Blacksburg, VA
Appendix A-1: Purpose and Need Statement
 Appendix A-1: Purpose and Need Statement PURPOSE AND NEED STATEMENT Western & Ashland Corridors Bus Rapid Transit (BRT) Project Prepared for Chicago Transit Authority 567 West Lake Street Chicago, IL 60661
Agenda. US-1 Corridor Study and HIA Update. Pathway Diagram / Primary Indicators. Research Questions. Linking Multimodal Improvements to Indicators
 Icebreaker Agenda US-1 Corridor Study and HIA Update Pathway Diagram / Primary Indicators Research Questions Linking Multimodal Improvements to Indicators Vulnerable Populations US-1 Corridor Study Vision
Americans in Transit A Profile of Public Transit Passengers
 Americans in Transit A Profile of Public Transit Passengers published by American Public Transit Association December 1992 Louis J. Gambacclnl, Chairman Rod Diridon, Vice Chairman Fred M. Gilliam, Secretary-Treasurer
ROUTES 55 / 42 / 676 BUS RAPID TRANSIT LOCALLY PREFERRED ALTERNATIVE
 ROUTES 55 / 42 / 676 BUS RAPID TRANSIT LOCALLY PREFERRED ALTERNATIVE April, 2012 1 INTRODUCTION The need for transit service improvements in the Routes 42/55/676 corridor was identified during the Southern
Washington Metropolitan Area Transit Authority Board Action/Information Summary. MEAD Number:
 Washington Metropolitan Area Transit Authority Board Action/Information Summary Action Information MEAD Number: 100962 Resolution: Yes No TITLE: Bicycle and Pedestrian Access Improvements Study PURPOSE: