DOT Performance Measurement and Reporting System
|
|
|
- Lester Sherman
- 5 years ago
- Views:
Transcription


1 November 2016
2 DOT Performance Measurement and Reporting System 1
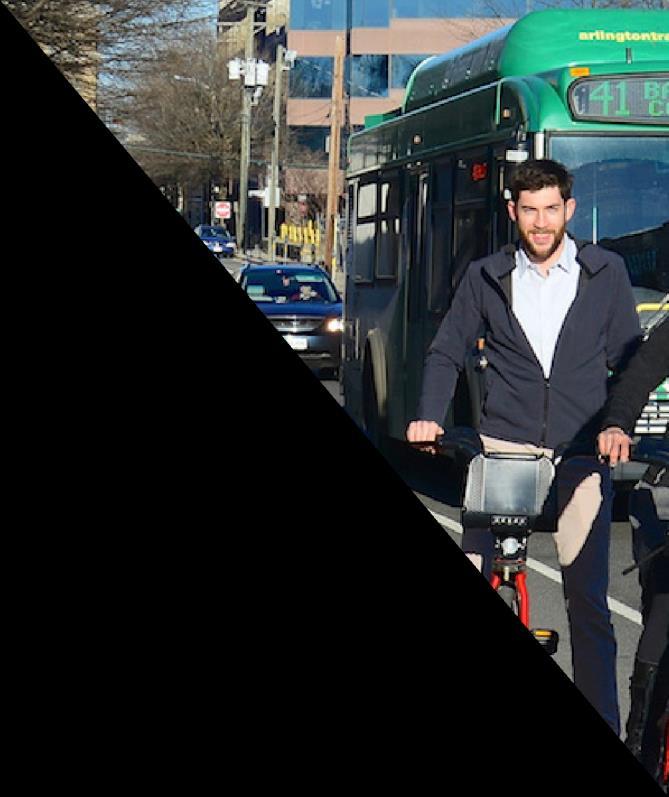
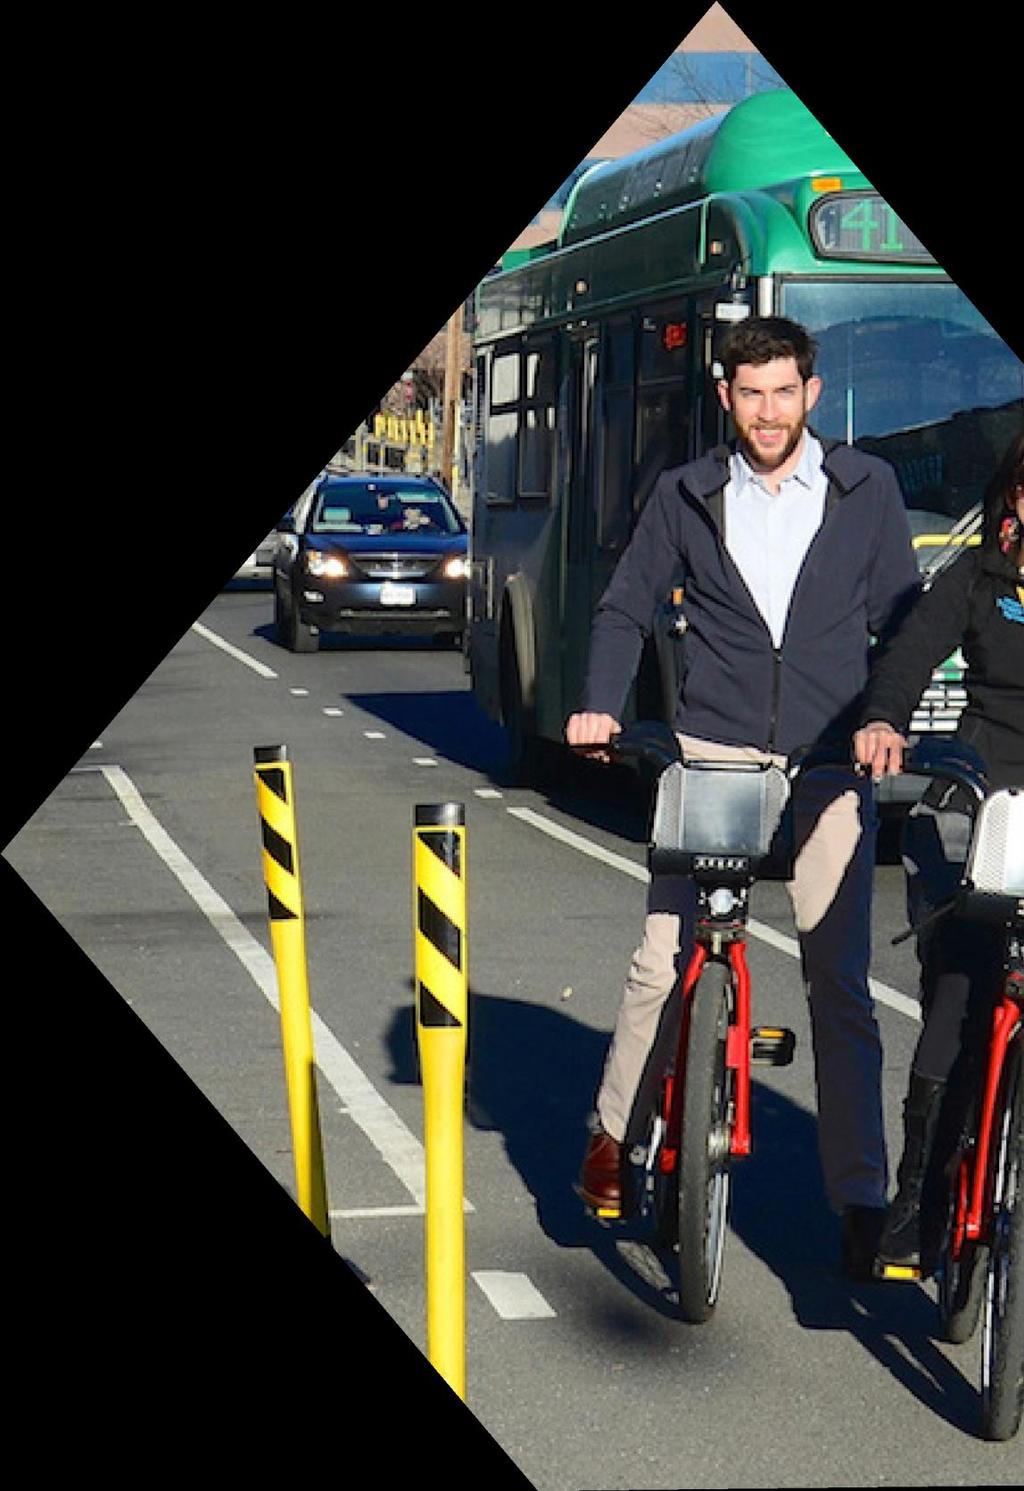
3 2015 Transportation & Development Division Overview Arlington County is a national leader in sustainable transportation and smart growth. Over forty years ago, the community made the far-reaching decision to emphasize growth around transit lines, and embrace multi-modal transportation. Arlington County s Board and government have worked to develop innovative transportation policies and programs that are now widely replicated across the country. The Transportation and Development Division operates within Arlington s Department of Environmental Services. For more than 40 years, the Transportation & Development Division has provided planning, operations, engineering, and transportation support services to the County. The Transportation and Development Division is led by Director Dennis Leach and is comprised of five Bureaus: Transportation Engineering and Operations Transit Transportation Planning Development Services Commuter Services The work of the Transportation & Development Division reflects Arlington s commitment to transit-oriented development (TOD). The division works to provide well-balanced services designed that promoting multi-modal transportation benefits all users, from transit riders and drivers, to cyclists and pedestrians. The infrastructure and services that the Transportation & Development Division provides - roads, sidewalks, parking spaces, bike lanes, Arlington Transit (ART), Capital Bikeshare, The Commuter Stores and more - have made high-density, mixed-use development along our transit corridors possible while preserving residential neighborhoods. The Master Transportation Plan (MTP) - a policy and project guide that was developed with community stakeholders directs the work of the Transportation & Development Division. The plan allows us to concentrate our investments in ways that yield the greatest good not only from a transportation standpoint, but also for overall quality of life of Arlington residents and workers. Arlington s vision for our transportation system supports community efforts to improve the natural environment and achieve better public health and fitness. Decades of planning and investment have made Arlington a community where Metrorail, bus, walking, and bicycling are truly viable and convenient modes of transportation. 2

.")
4 DOT Performance Measurement and Reporting System Meet our Bureaus Transportation Engineering and Operations. Transit The Transit Bureau oversees both transit operations and the transit capital program. Transit operations includes oversight of local Metrorail, Metrobus, and MetroAccess services as well as two Arlington operated services: the County s local bus service, Arlington Transit (ART); and, Arlington s local paratransit program, Specialized Transit for Arlington Residents (STAR). Arlington Transit has grown from a small service providing shuttles from neighborhoods to Metrorail stations into a fleet of 65 buses and 16 routes, operating not only feeder service but also cross-county routes connecting major activity centers. The Capital Programs part of the bureau is responsible for developing new or improved existing transit facilities, such as new Metrorail station entrances, the Crystal City-Potomac Yard Transitway, and bus stops Arlington s streets and related public infrastructure are designed and managed by the Transportation Engineering and Operations bureau (TE&O). The bureau manages 974 lane miles of roads, 180 traffic monitoring cameras, 6,900 County owned and 13,000 Dominion Virginia Power owned streetlights, 5,400 metered parking spaces, intelligent transportation system equipment, and 294 traffic signals. The mission of this bureau is to optimize the use of these assets to safely and efficiently move people/goods on Arlington s streets by all modes of transport. An important tool to achieve this mission is the bureau s Traffic Management Center (TMC), a state of the art transportation control center. The TMC staff utilize signal monitoring and CCTV cameras to adjust traffic signal timing to help achieve the bureau s mission. 3
.")

, aims to change travel behavior by making it easy for residents, employees, and visitors to use all")
5 2015 Transportation Planning The Transportation Planning Bureau develops short and long-range plans for transportation infrastructure and services. The bureau is also responsible for developing, maintaining, and promoting the County Master Transportation Plan (MTP). The bureau reviews developer and County plans to ensure compliance with the MTP; collaborates with other DOT bureaus and County departments to produce street designs that serve transit, bicycles, pedestrians, and auto traffic; manages capital projects for complete streets and bicycle and pedestrian facilities; and manages and coordinates the taxicab industry to ensure compliance with the ordinance. Commuter Services The Commuter Services bureau, or Arlington County Commuter Services (ACCS), aims to change travel behavior by making it easy for residents, employees, and visitors to use all available transportation options, other than driving alone, to meet their travel needs. ACCS varied programs include employer and residential outreach efforts; general travel option marketing; commuter information distribution; operation of commuter stores; provision of guidance and oversight to new development on transportation demand management requirements; BikeArlington; WalkArlington, Capital Bikeshare; and Mobility Lab and research. Development Services The Development Services bureau reviews development projects and negotiates the public transportation and other infrastructure needs associated with private development. Development Services ensures that transportation remains integrated with Arlington s land use and zoning regulations for private development as well as compatibility with its public infrastructure. 4

6 DOT Performance Measurement and Reporting System Arlington County s Master Transportation Plan (MTP) Description The Master Transportation Plan (MTP), a requirement of Virginia s Department of Transportation, is a long range and community-driven vision for Arlington s transportation system through The MTP is one of the core elements of Arlington s Comprehensive Plan, which is the County s highest level planning policy document. The 2007 plan, referenced here, is an update of previous versions of the MTP, which have guided transportation planning and implementation since the 1960s. The MTP description on these two pages is provided in this report as background because of its importance in guiding the Division s Goals The MTP details six goals which guide the document: Goal 1 Provide High Quality Transportation Services. Goal 2 Move More People Without More Traffic. Goal 3 Promote Safety. Goal 4 Establish Equity. Goal 5 Manage Effectively and Efficiently. Goal 6 Advance Environmental Sustainability. work. The 2007 MTP update was developed through an extensive two-year public involvement process. The public s opinions were solicited via community surveys, focus groups, public work-sessions, and through a 24-member MTP Plenary Group that provided input from many different advisory and business groups in the County. The MTP Goals and Policies document was approved by the County Board in November 2007, with all the other MTP elements adopted between 2007 and The overall goals and policies and map elements of the plan are supported by six modal element documents bicycle, transportation demand and system management, parking and curb space management, pedestrian, streets, and transit which provide more detailed guidance. General Policies The MTP policies provide overall concepts that underlay the framework for the plan. A. Integrate Transportation with Land Use B. Support the Design and Operation of Complete Streets C. Manage Travel Demand and Transportation Systems D. Additionally, the plan includes elementspecific policies summarized on the following page. 5

7 2015 Streets Policies: The 13 policies in the Streets Element of the MTP include policies to achieve a greater balance among modes through the introduction of a new street typology, as well as recommendations to improve quality of service, enhance safety, and manage and maintain Arlington s transportation facilities. Transit Policies: Parking and Curb Space Management Policies: The 13 policies in the Parking and Curb Space Element of the MTP provide a comprehensive framework to prioritize and manage uses, minimize the impacts on residential areas, and enhance user convenience while employing equitable, fiscally sound, and environmentally sustainable practices. The 10 policies in the Transit Element of the MTP include policies to institute both a Primary and a Secondary Transit Network that focus transit investment in corridors where much of the tripmaking occurs today and is anticipated in the future. Pedestrian Policies: The 12 polices in the Pedestrian Element of the MTP include policies to provide a walkway network to accommodate pedestrian travel throughout the County. It contains policies to enhance pedestrian safety and security, ensure pedestrian mobility and accessibility for all users, increase walking trips, and maintain and manage pedestrian facilities. Bicycle Policies: The nine polices in the Bicycle Element of the MTP guide development of bikeways and bicycle transportation programs. They aim to complete the bikeway network, encourage bicycling through added amenities and activities, enhance bicycle safety, collect bicycle activity data, and improve management and maintenance. Transportation Demand and System Management Policies: The seven policies in the Demand and System Management Element of the MTP include policies that support behavior change that leads to substantial changes in commuting mode split for Arlington travelers. For example, the projected 2030 mode split shows about half of Arlington commuters driving to work. Transportation System Management policies focus on facility redesign, access management, traffic signal timing and optimization, high occupancy vehicle lanes, incident response plans, targeted traffic enforcement, and intelligent transportation systems. 6
8 DOT Performance Measurement and Reporting System 7
, the Capital Bikeshare Transit Development Plan, and the Transportation Demand Management")
9 2015 Strategic Approach As noted previously, the Master Transportation Plan (MTP) guides the Transportation and Development Division s work. A number of more detailed strategic planning documents, such as Arlington s Transit Development Plan (TDP), the Capital Bikeshare Transit Development Plan, and the Transportation Demand Management (TDM) Strategic Plan, build off of the MTP and guide specific transportation programs. The Transportation and Development Division developed this Strategic Performance Report in order to track the division s progress toward the vision set out in the MTP. The plan helps to promote public transparency by clearly communicating progress to the community, County staff, and elected officials. At the outset of the development of the Division s performance measures, leadership focused on the development of a guiding set of goals and objectives for the plan. While the MTP provides goals and objectives aimed toward a long-range vision for the community, the Transportation & Development Division lacked a unifying set of goals and objectives to which the Division could measure, assess and communicate its ongoing performance. The Transportation and Development Division began the process of creating goals, objectives, and performance measures by compiling a list of goals and objectives from existing plans, and identifying recurring themes. This information was analyzed by the Division s leadership in a series of workshops with representatives from all of the transportation bureaus. During the initial workshops, the working group members used the themes to brainstorm options for a division-wide vision, mission, goals, and objectives. Objective 1.1 Goal 1 Objective 1.2 Vision Mission Goal 2 Goal 3 Objective 1.3 Performance measures often apply to multiple objectives In subsequent workshops the Division s leadership further developed the vision, mission, goals, and objectives to balance the need that they be broad enough to include all of the transportation efforts within the County but specific enough to be tied to performance measures, to which the majority of this report is dedicated. The Transportation and Development Division uses these performance measures to track progress in meeting our strategic goals and objectives. This report is our first update to the 2014 Annual Performance Report; the Division plans to continue to release an updated report at the end of every fiscal year. Clear goals and objectives, smart data collection, and performance measures built around outcomes (what we have accomplished), not just outputs (what we have done), ensure that the Transportation and Development Division can transparently account for its impacts on Arlington County. 8

10 DOT Performance Measurement and Reporting System Vision, Mission& Goals Vision: A thriving sustainable community supported by transportation choices allowing for seamless movement at any time and to any place. Goals: Accessibility: Expand multimodal access and connectivity Mobility: Improve mobility for all users Mission: Provide an accessible, integrated system of transportation choices in coordination with land use and development. Safety and Security: Transportation infrastructure that is safe and secure for all users and all modes of travel Manage Effectively and Efficiently: Construct and manage effectively, efficiently and transparently Environment, Energy, Health and Economy: Enrich the quality of life in Arlington County through sustainable transportation improvements and infrastructure 9


11 2015 The Transportation & Development Division Goals correlate to the MTP Goals. They differ slightly in that mobility and accessibility are identified as two separate goals, and equity, rather than being a goal in and of itself, is an explicit or implicit component of all of the goals. The pages that follow in this Performance Measures Report are organized around the Transportation & Development Division Strategic Goals. Master Transportation Plan Goals 1 Provide High Quality Transportation Services Provide high quality transportation services for all users and modes. 2 Move More People without More Traffic Provide more travel choices and reduce the relative proportion of single occupant vehicle (SOV) travel through Transportation Demand Management (TDM), telecommuting, and travel shifts to other modes including transit, carpooling, walking, and bicycling. 3 Promote Safety Provide transportation system operations that are safe and secure, and enable prompt and effective emergency response. Transportation & Development Division Strategic Goals Accessibility Expand multimodal access and connectivity. Mobility Improve mobility for all users. Safety and Security Create transportation infrastructure that is safe and secure for all users and all modes of travel. Manage Effectively and Efficiently Construct and manage effectively, efficiently, and transparently. Environment, Energy, Health, and Economy Enrich the quality of life in Arlington County through sustainable transportation improvements and infrastructure. 4 Establish Equity Serve the mobility and accessibility needs of all residents regardless of age, income, or ability. 5 Manage Effectively and Efficiently Fund, develop, manage, and maintain transportation facilities and services in an equitable and cost-effective manner. 6 Advance Environmental Sustainability Reduce the impact of travel on community resources, including air and water quality, and increase energy 10


12 DOT Performance Measurement and Reporting System Goals & Objectives Accessibility Goal: Expand multimodal access and connectivity to destinations both within and outside of the County. Objectives: 1. Maximize accessibility for Arlington residents, employees and visitors to regional activity centers and destinations within Arlington. 2. Meet the needs of traditionally underserved populations in transportation planning, operations, maintenance and the provision of infrastructure. Mobility Goal: Improve mobility for all users of the transportation system in Arlington County. Objectives: 1. Provide efficient (cost and time to users) personal mobility balancing all modes of transportation. 2. Maximize use of transportation options while minimizing singleoccupancy vehicle travel. Credit: transporteativo.org.br 11

13 2015 Safety and Security Goal: Provide transportation infrastructure and an integrated transportation network that is safe and secure for all users and all modes of travel. Objectives: 1. Minimize the frequency and severity of injury on all modes of travel. 2. Mitigate transportation related safety and security risks. 3. Build and maintain a premier safety culture within the Transportation & Development Division and the community at large. Manage Effectively and Efficiently Environment, Energy, Health, and Economy Goal: Enrich the quality of life in Arlington County through sustainable transportation improvements and infrastructure. Objectives: 1. Maintain or reduce noise, air and water pollution through Transportation & Development Division Activities. 2. Promote public health through transportation activities. 3. Leverage investments in transportation and guide development of land use and transportation to support economic development. Goal: Construct and manage the transportation system, infrastructure and operations effectively, efficiently and transparently. Objectives: 1. Ensure fiscal stewardship in the funding, development, management, operation and maintenance of transportation systems to maximize community value. 2. Build and sustain meaningful public support in transportation policies and programs. 3. Construct financially sustainable assets and preserve, maintain and improve the condition of the existing transportation system. 12
14 DOT Performance Measurement and Reporting System 13

15 2015 How do we measure success? Performance measures are a quantitative or qualitative characterization of performance and progress toward meeting defined objectives. They quantify the division s efficiency or effectiveness in conducting operations. The performance measures developed for Arlington County s Transportation and Development Division were derived from a multi-step selection process. In the spring and summer of 2014, several workshop sessions were held with staff from all five transportation bureaus to gather input on potential performance measures. The working group considered a list of options, culled from the 101 performance measures in Arlington s Master Transportation Plan (MTP), as well as performance measures from other relevant Transportation & Development Division plans and studies. The performance measures that were developed are linked to the unified Transportation & Development Division goals outlined in this document. The selection of performance measures for each objective was based both on the applicability of the measures to tracking performance toward the goals and objectives as well as the ability of each measure to be tracked with data available through a public data source or through internal Division data. Measures that would strongly track performance toward objectives where data were not yet available were flagged for future consideration. After completing the 2014 report, the working group made recommendations to improve the accuracy of evaluating performance measures. The 2015 report update reflects these methodological changes, and includes updated data for the measures where it was available. 14
16 DOT Performance Measurement and Reporting System Key Performance Measures Arlington County s investment in transportation infrastructure and services illustrates that the community and its leaders care deeply about travel choices to help achieve a sustainable community. Every day, the Transportation & Development Division strives to increase accessibility and maximize options for movement throughout the County and to the rest of the region. By providing a high quality transit system, a robust bicycle and pedestrian network, and effective transportation demand management approaches, the behavior of many users of this system has changed. People are using transit, bicycling, and walking more frequently, while single occupancy vehicle travel and vehicle miles traveled has declined over the last 15 years. The transportation environment is becoming greener and safer through smarter technology and infrastructure investments that reduce energy consumption and collisions. This shift in travel behavior is benefiting Arlington County in a number of ways. Even as our population has grown substantially, congestion has declined in the County. The shift to other modes has reduced pollutants in the air and water, and improved health through increased physical activity. The County s transportation program saves users money and contributes to the local economy. Modes like transit, walking and bicycling provide users an affordable alternative to driving. The reduction in cars on the road reduces congestion and the economic cost of travel delays. Together, all of these things make Arlington a competitive and attractive place to live, work and visit. The Transportation and Development Division has achieved these impressive improvements while reducing its reliance on local taxpayers. PERFORMANCE MEASURE Proximity to Multi-Modal Transportation Vehicle Miles Traveled Approximately 88% of residents and 81% of jobs are within walking distance of the Primary Transit Network.* 100% 90% 80% 70% 60% 50% 40% 30% 20% 10% 0% Percent of Population and Jobs in Close Proximity to Transit, Bike Share, Car Share, Pedestrian and Bicycle Facilities 99% 99% 97% 93% 88% 78% 79%74% 80% 73% 77% 79% 81% 53% 14% 5% 79% 59% 40% 34% *The Primary Transit Network is a subset of the transit network which offers 15 minute service or better for 18 or more hours per day Population 2015 Employment 2015 In 2014, 15 the PTN calculation used a standard buffer around the shapefile for the PTN network. However, it was determined that the shapefile represents the aspirational network, not current service levels. This year's update uses current service levels. In addition, the buffer itself was modified to be ½ mile walking distance from PTN bus stops and ¾ mile from rail stations. Staff believe these distances more accurately reflect willingness to walk to frequent transit service.

17 GOAL 2015 Expand multimodal access and connectivity PERFORMANCE MEASURE Service to Traditionally Underserved Populations 52% of Arlington s lowincome households are within a ¼ mile of a Capital Bikeshare Station Arlington is working to ensure that all County residents, workers, and visitors have equitable access to transportation amenities and services. 33% of Arlington s minority population is within a ¾ mile of a Metro Station 33% of Arlington s entire population is within a ¼ mile of reserved-space car share Traditionally Underserved Populations within 1/4 Mile of ART Bus Stops 100% 90% 80% 70% 60% 50% 40% 30% 20% 10% 0% 74% 79% 74% 80% 65% 52% Minority Populations Low Income Populations Total Population
18 Miles (millions) Miles per Capita GOAL DOT Performance Measurement and Reporting System Improve mobility for all users Drive alone Rideshare Transit Walk/Bike Other Average Number of Trips per Household Per Day in Arlington Households PERFORMANCE MEASURE Average Household Trips per Day This data was not updated in Arlington households made more daily trips than a typical household in the region, but 58% of those trips are made using alternative modes, compared to only 54% for a regional household. Annual and Per Capita Vehicle Miles Traveled (VMT), 2006 to 2014 PERFORMANCE MEASURE Vehicle Miles Traveled This data was updated to 2014; 2015 not yet available. Arlington s population has grown by over 10% since 2006, yet vehicle miles traveled have declined by nearly 6% in the same period. 1,680 1,660 1,640 1,620 1,600 1,580 1,560 1,540 1,520 1,500 1, ,000 8,000 7,000 6,000 5,000 4,000 3,000 2,000 1,000 0 Annual VMT (Arlington County) Annual VMT Per Capita (Arlington County Residents) 17

19 Number of Individual Collisions GOAL 2015 PERFORMANCE MEASURE On an average day, Arlington households make three times as many bike and walk trips than a typical household in the region. Region Arlington Arlington10% Region 20% Zero Car Households 32% 11% 10% Zero to One Car Households This data was not updated in % Arlington residents are able to choose to be car-free or carlight more often than others in the region. One Car Households 37% 47% Provide safe and secure transportation PERFORMANCE MEASURE Vehicular Collisions Annual Collisions in Arlington County, The number of collisions resulting in an injury has declined by 46% since ,500 3,000 2,500 2,000 1,500 1,000 1,838 1,794 1,373 1,261 1,331 1,573 1,654 2,369 2,146 2, Fatal Collisions Non-Injury Collisions Injury Collisions, Non-Fatal Total Collisions (includes non-injury collisions) 18

 NOx (lbs)")
20 GOAL DOT Performance Measurement and Reporting System Enrich Arlington s quality of life PERFORMANCE MEASURE Traffic Volumes PERFORMANCE MEASURE Greenhouse Gas Emissions Reduced by ACCS Traffic at key intersections in the County has been reduced, on average, by 6.8% since 2006, reducing emissions that result from idling. Greenhouse Gas Emission Reductions Attributed to County TDM Programs, FY , , , , , , , , , , , ,000 80,000 60,000 40,000 20,000 79,400 78,800 81,000 72,000 64,000 58,000 91,800 79,800 78,90079,500 77,400 81,400 73,800 77,000 80,000 81,900 - FY2008 FY2009 FY2010 FY2011 FY2012 FY2013 FY2014 FY2015 CO2 (tons) NOx (lbs) VOC (lbs) PERFORMANCE MEASURE Particulate Matter Produced by ART Since 2009, ART s Natural Gas bus fleet saved an estimated 67,975 pounds of smog causing particulate matter from being released into the atmosphere. 19

21 Vehicle Trips Reduced Vehicle Miles Traveled Reduced 2015 PERFORMANCE MEASURE Reduction in SOV Trips 42,890 Daily Trips Avoided Through the implementation of TDM programs and by providing alternatives to SOV travel, the County avoided 42,890 daily vehicle trips and 782,375 vehicle miles in FY2015. Vehicle Trips and Miles Traveled Reduced by ACCS on an Average Weekday 46, , , , , , ,600 44, ,000 44, , ,000 42, , ,000 42,000 41,128 41, ,000 40,000 39,000 39,600 40, ,000 38,000 36,000 38, , , ,000 34,000 FY2008 FY2009 FY2010 FY2011 FY2012 FY2013 FY2014 FY Trips Avoided VMT Avoided 20


22 Development in Square Feet Dollars (in Millions) Percent of Total Budget GOAL DOT Performance Measurement and Reporting System Manage effectively and efficiently PERFORMANCE MEASURE Taxes vs. Expenditure This data was not updated in The Division is continuing to pursue alternative transportation revenues and strives to decrease the use of local tax dollars (General Fund), the latter which made up 28% of the budget in FY2015. $40.0 $35.0 $30.0 $25.0 $20.0 $15.0 $10.0 $5.0 $- Tax Support for Transportation Program 50% $8.7 $9.7 $9.3 $ % $9.8 $ % 20% $22.0 $24.7 $24.2 $26.0 $26.5 $ % 0% FY 2010 FY 2011 FY2012 FY2013 FY2014 FY2015 Funding from General Fund Funding from Revenues % of Transportation Program Funding Provided by Taxes (General Fund) PERFORMANCE Economic Development 1,800,000 1,600,000 1,400,000 1,200,000 1,000,000 Office, Retail and Other Completed Annual Development, in Square Feet, , ,000 1,589, , , , ,575 95, , , , , ,637 76, , ,905 63,482 60,696 38, , , , ,350 46, Development Outside Corridors Development in Corridors (Rosslyn-Ballston, Jefferson Davis, and Columbia Pike) Arlington Transit Columbia Pike Corridor Rosslyn Ballston Jefferson Davis Over the past nine years, the vast majority of all development in the County has taken place in three primary corridors. 21
DOT Performance Measurement and Reporting System All Performance Measures
 DOT Performance Measurement and Reporting System 2015 All Performance Measures Arlington County Transportation & Development Division 2015 23 Table of Contents Table of Contents All Performance Measures...
Arlington s Master Transportation Plan
 Arlington s Master Transportation Plan The Master Transportation Plan (MTP) Adopted in eight parts Goals & Policies element and MTP Map adopted in 2007 Bicycle, Pedestrian and Demand and Systems Management
FY Transportation Capital Improvement Plan Update Arlington Committee for Transportation Choices
 FY 2017-2026 Transportation Capital Improvement Plan Update Arlington Committee for Transportation Choices November 1, 2017 Forecasted Growth Arlington continues to grow with a shift towards multi-family
Integrating Community Development and Transportation Strategies. November 13, 2014
 R-B CORRIDOR 1970 R-B CORRIDOR TODAY Integrating Community Development and Transportation Strategies November 13, 2014 The Community Development Transportation Question Can communities support increased
Bicycle Master Plan Goals, Strategies, and Policies
 Bicycle Master Plan Goals, Strategies, and Policies Mobilizing 5 This chapter outlines the overarching goals, action statements, and action items Long Beach will take in order to achieve its vision of
Transportation. Pages E-3 to E-145 PROPOSED FY CAPITAL IMPROVEMENT PLAN (CIP) CCCRC Presentation Thursday, June 14, 2018
 CCCRC Presentation Thursday, June 14, 2018") PROPOSED FY 2019-2028 CAPITAL IMPROVEMENT PLAN (CIP) Pages E-3 to E-145 CCCRC Presentation Thursday, June 14, 2018 in the CIP Continues Arlington s commitment to a transportation system that expands travel
PROPOSED FY 2019-2028 CAPITAL IMPROVEMENT PLAN (CIP) Pages E-3 to E-145 CCCRC Presentation Thursday, June 14, 2018 in the CIP Continues Arlington s commitment to a transportation system that expands travel
Arlington County 10-Year Transit Development Plan & Premium Transit Network Briefing. May 2016
 Arlington County 10-Year Transit Development Plan & Premium Transit Network Briefing May 2016 Overview 10-Year Transit Development Plan Premium Transit Network Columbia Pike service concept Premium amenities
Transportation Master Plan Advisory Task Force
 Transportation Master Plan Advisory Task Force Network Alternatives & Phasing Strategy February 2016 BACKGROUND Table of Contents BACKGROUND Purpose & Introduction 2 Linking the TMP to Key Council Approved
May 12, 2016 Metro Potential Ballot Measure Issue Brief: Local Return
 Summary: Local return is an important revenue source for cities to maintain their local transportation infrastructure. Most cities use their local return to operate small bus systems and repave streets,
Proposed. City of Grand Junction Complete Streets Policy. Exhibit 10
 Proposed City of Grand Junction Complete Streets Policy Exhibit 10 1 City of Grand Junction Complete Streets Policy Vision: The Complete Streets Vision is to develop a safe, efficient, and reliable travel
PEDESTRIAN ACTION PLAN
 ATTACHMENT 2 CITY OF SANTA MONICA PEDESTRIAN ACTION PLAN CITY OF SANTA MONICA PEDESTRIAN ACTION PLAN This page intentionally left blank EXECUTIVE SUMMARY CHAPTER 1 EXECUTIVE SUMMARY Setting the Stage
WELCOME. City of Greater Sudbury. Transportation Demand Management Plan
 WELCOME City of Greater Sudbury Transportation Demand Management Plan Public Consultation Session St. Andrew s Place, Activity Hall 111 Larch Street Wednesday September 13, 2017 6:00 to 8:00 pm Welcome
Perryville TOD and Greenway Plan
 Perryville TOD and Greenway Plan Greenway Glossary Pathway: A bicycle and pedestrian path separated from motorized vehicular traffic by an open space, barrier or curb. Multi-use paths may be within the
Capital and Strategic Planning Committee. Item III - B. April 12, WMATA s Transit-Oriented Development Objectives
 Capital and Strategic Planning Committee Item III - B April 12, 2018 WMATA s Transit-Oriented Development Objectives Page 24 of 76 Washington Metropolitan Area Transit Authority Board Action/Information
DRAFT MOVING FORWARD RHODE ISLAND BICYCLE MOBILITY PLAN 2018 PREPARED FOR PREPARED BY IN ASSOCIATION WITH
 RHODE ISLAND MOVING FORWARD BICYCLE MOBILITY PLAN 2018 PREPARED FOR PREPARED BY IN ASSOCIATION WITH T AF CHAPTER 1 D R INTRODUCTION CHAPTER 3 ARTICULATES VISION Bicycling is safe, fun and practical in
AMATS Complete Streets Policy
 AMATS Complete Streets Policy Table of Contents: Section 1. Definition of Complete Streets Section 2. Principles of Complete Streets Section 3. Complete Streets Policy Section 4. Consistency Section 5.
Typical Rush Hour Commute. PennyforTransportation.com
 Typical Rush Hour Commute In the News Overview of the Plan Collaborative plan with projects in every community Prioritizing connectivity and congestion relief Dedicated transportation-specific funding;
CITY OF BLOOMINGTON COMPLETE STREETS POLICY
 CITY OF BLOOMINGTON COMPLETE STREETS POLICY POLICY OBJECTIVE: The City of Bloomington will enhance safety, mobility, accessibility and convenience for transportation network users of all ages and abilities,
City of Novi Non-Motorized Master Plan 2011 Executive Summary
 City of Novi Non-Motorized Master Plan 2011 Executive Summary Prepared by: February 28, 2011 Why Plan? Encouraging healthy, active lifestyles through pathway and sidewalk connectivity has been a focus
Purpose and Need. Chapter Introduction. 2.2 Project Purpose and Need Project Purpose Project Need
 Chapter 2 Purpose and Need 2.1 Introduction The El Camino Real Bus Rapid Transit (BRT) Project (Project) would make transit and other transportation improvements along a 17.6-mile segment of the El Camino
WALKNBIKE DRAFT PLAN NASHVILLE, TENNESSEE EXECUTIVE SUMMARY NASHVILLE, TENNESSEE
 NASHVILLE, TENNESSEE EXECUTIVE SUMMARY Executive Summary A world-class multi-modal transportation system is essential to a vibrant city and better quality of life. -Mayor Barry The WalknBike plan aims
Develop a Multi-Modal Transportation Strategy (Theme 6)
") DEVELOP A MULTI-MODAL TRANSPORTATION STRATEGY (THEME 6) WHY IS THIS THEME ADDRESSED? Develop a Multi-Modal Transportation Strategy (Theme 6) Statement of Ideal Reduce resident and visitor reliance on single
DEVELOP A MULTI-MODAL TRANSPORTATION STRATEGY (THEME 6) WHY IS THIS THEME ADDRESSED? Develop a Multi-Modal Transportation Strategy (Theme 6) Statement of Ideal Reduce resident and visitor reliance on single
2045 Long Range Transportation Plan. Summary of Draft
 2045 Long Range Transportation Plan Summary of Draft Fredericksburg Area Metropolitan Planning Organization The George Washington Region includes the City of Fredericksburg and the counties of Caroline,
CONNECTING PEOPLE TO PLACES
 CONNECTING PEOPLE TO PLACES 82 EAST BENCH MASTER PLAN 07 Introduction The East Bench transportation system is a collection of slow moving, treelined residential streets and major arteries that are the
Attachment A: Columbus Area Metropolitan Transportation Plan Objectives, Performance Measures, and Targets
 OBJECTIVE: Reduce the percentage of commuters driving alone, and increase the percentage of commuters riding transit, ing Reducing single occupancy auto commutes and increasing commuters using alternative
Calculating the ROI of TDM for Physical Activity in Arlington, VA. Sonali Soneji, AICP Simple Solutions Planning & Design, LLC
 Calculating the ROI of TDM for Physical Activity in Arlington, VA Sonali Soneji, AICP Simple Solutions Planning & Design, LLC March 12, 2014 Research Question What is the Return on Investment of Arlington
I-105 Corridor Sustainability Study (CSS)
") I-105 Corridor Sustainability Study (CSS) Metro Streets and Freeways Subcommittee March 21, 2019 Gary Hamrick Cambridge Systematics, Inc. I-105 CSS Project History & Background Funded by Caltrans Sustainable
I-105 Corridor Sustainability Study (CSS) Metro Streets and Freeways Subcommittee March 21, 2019 Gary Hamrick Cambridge Systematics, Inc. I-105 CSS Project History & Background Funded by Caltrans Sustainable
MTP BICYCLE ELEMENT UPDATE. November 2017
 MTP BICYCLE ELEMENT UPDATE November 2017 TIME FOR AN UPDATE Bicycle Element adopted in July 2008 Almost 10 years old Many planned facilities have been implemented 10 years more experience in planning,
EXECUTIVE SUMMARY. Vision
 Vision Walking and bicycling in Salt Lake City will be safe, convenient, comfortable, and viable transportation options that connect people to places, foster recreational and economic development opportunities,
Arlington County Commuter Services. Making An Impact. May 2009
 Arlington County Commuter Services Making An Impact May 2009 ACCS Research Studies 2006-2009 MAI Sections 1 Past, Present, Future 1a Life as we know it is changing 1b Where are we heading? Can we maintain
Chapter 2. Bellingham Bicycle Master Plan Chapter 2: Policies and Actions
 Chapter 2 Bellingham Bicycle Master Plan Chapter 2: Policies and Actions Chapter 2: Policies and Actions The Bicycle Master Plan provides a road map for making bicycling in Bellingham a viable transportation
Solana Beach Comprehensive Active Transportation Strategy (CATS)
") Solana Beach Comprehensive Active Transportation Strategy (CATS) 3.0 Goals & Policies The Solana Beach CATS goals and objectives outlined below were largely drawn from the Solana Beach Circulation Element
Solana Beach Comprehensive Active Transportation Strategy (CATS) 3.0 Goals & Policies The Solana Beach CATS goals and objectives outlined below were largely drawn from the Solana Beach Circulation Element
Roanoke Valley TRANSIT VISION PLAN
 Roanoke Valley TRANSIT VISION PLAN Approved September 22, 2016 PART 6: Implementation Strategies and Performance Measures PART 6: Implementation Strategies 2 CONTENTS 1.0 OVERVIEW 4 2.0 TIMELINE 4 3.0
Public Works AGENDA ITEM D-2 STAFF REPORT
 AGENDA ITEM D-2 Public Works STAFF REPORT Transportation Master Plan Oversight and Outreach Committee Meeting Date: 10/30/2017 Staff Report Number: 17-001-TMP Regular Business: Provide feedback on Performance
Prioritizing Transportation Policy and Funding for Active Transportation, Safety, Equity and Health
 Mayor Karl Dean, Chairman Prioritizing Transportation Policy and Funding for Active Transportation, Safety, Equity and Health Leslie A. Meehan, AICP Planning and Implementing the Active Community Webinar
BUILDING THE CASE FOR TRAVEL OPTIONS IN WASHING TON COUNTY. Image: Steve Morgan. Image: Steve Morgan
 BUILDING THE CASE FOR TRAVEL OPTIONS IN WASHING TON COUNTY Image: Steve Morgan Image: Steve Morgan Image: TriMet Image: TriMet WHAT ARE TRAVEL OPTIONS PROGRAMS? Travel options programs encourage residents,
Town of Superior. Superior Trails Plan
 Part 1 Base Information 1. Project Title US 36 Bikeway Extension 2. Project Start/End points or Geographic Area Provide a map with submittal, as appropriate 3. Project Sponsor (entity that will construct/
How To Encourage More Efficient Transportation in Brazilian Cities
 How To Encourage More Efficient Transportation in Brazilian Cities Todd Litman Victoria Transport Policy Institute Presented Seminar on Discouraging The Use Of Cars São Paulo, Brazil 3 September 2013 Creating
BID Strategy Group and Stakeholders Meeting. April 17, 2018
 BID Strategy Group and Stakeholders Meeting April 17, 2018 Agenda Meeting Objectives Background Short-Term Improvements Long-Term Study Goals Data Review Schedule & Next Steps Open House April 17, 2018
Guidelines for Providing Access to Public Transportation Stations APPENDIX C TRANSIT STATION ACCESS PLANNING TOOL INSTRUCTIONS
 APPENDIX C TRANSIT STATION ACCESS PLANNING TOOL INSTRUCTIONS Transit Station Access Planning Tool Instructions Page C-1 Revised Final Report September 2011 TRANSIT STATION ACCESS PLANNING TOOL INSTRUCTIONS
Base Information. 1. Project Title SH7/East Arapahoe Multi-Use Path and Transit Stop Improvements. 2. Project Start/End points or Geographic Area
 Part 1 Base Information 1. Project Title SH7/East Arapahoe Multi-Use Path and Transit Stop Improvements 2. Project Start/End points or Geographic Area 38 th /Marine streets to Cherryvale Road (See attached
Chapter 7. Transportation. Transportation Road Network Plan Transit Cyclists Pedestrians Multi-Use and Equestrian Trails
 Chapter 7 Transportation Transportation Road Network Plan Transit Cyclists Pedestrians Multi-Use and Equestrian Trails 7.1 TRANSPORTATION BACKGROUND The District of Maple Ridge faces a number of unique
City of Jacksonville Mobility Fee Update
 City of Jacksonville Mobility Fee Update 2017 Preliminary Analysis May 3, 2017 Carnival Cruise lines photo credit Presentation Overview Public Outreach Process Pedestrian and Bicycle Master Plan Study
Goals, Objectives, and Policies
 Goals, Objectives, and Policies ADVISORY GROUP INPUT PUBLIC INPUT SNS PREVIOUS STUDIES RBPP Goals Vision Statement Southern Nevada will develop a safe, connected, and convenient walking and bicycling system
Transportation-Demand Management Community Presentation
 Transportation-Demand Management Community Presentation American University Office of Risk, Safety and Transportation programs Thursday, June 7, 2018 Program Objectives Improve transportation options for
Exhibit 1 PLANNING COMMISSION AGENDA ITEM
 Exhibit 1 PLANNING COMMISSION AGENDA ITEM Project Name: Grand Junction Circulation Plan Grand Junction Complete Streets Policy Applicant: City of Grand Junction Representative: David Thornton Address:
Nomination. Halton Region in Context
 Transportation Association of Canada Sustainable Urban Transportation Award Nomination of: Region of Halton Regional Transportation Master Plan Study March 2005 Nominated by: Nomination The TAC Sustainable
Appendix T 1: Additional Supporting Data
 Appendix T 1: Additional Supporting Data Project Delivery Delays with the implementation of the 2000 TIP became apparent early in the decade. In response to direction among policy officials, ARC began
Appendix F: Detailed Modeling Results
 Appendix F: Detailed Modeling Results TransAction Technical Report (This page intentionally left blank) METHODOLOGY FOR CALCULATION OF PERFORMANCE MEASURES F-3 (This page intentionally left blank) Approved
Dear City Council Members,
 From: Bob Kenyon [mailto: ] Sent: Monday, February 08, 2016 10:20 AM To: City Clerk Subject: Please prioritize Caltrain and a complete transit network Thank you for prioritizing bringing BART to San Jose
CITY OF COCOA BEACH 2025 COMPREHENSIVE PLAN. Section VIII Mobility Element Goals, Objectives, and Policies
 CITY OF COCOA BEACH 2025 COMPREHENSIVE PLAN Section VIII Mobility Element Goals, Objectives, and Policies Adopted August 6, 2015 by Ordinance No. 1591 VIII MOBILITY ELEMENT Table of Contents Page Number
WEST AND SOUTH WEST RING ROAD DOWNSTREAM TRAFFIC IMPACTS
 Page 1 of 9 EXECUTIVE SUMMARY Alberta Transportation ( AT ) is preparing to construct the final sections of the Calgary Ring Road. This includes the South West Ring Road ( SWRR ) (from Lott Creek Blvd
Climate Change Action Plan: Transportation Sector Discussion Paper: Cycling
 Climate Change Action Plan: Transportation Sector Discussion Paper: Cycling ontario.ca/climatechange Contents 1. Minister of Transportation s message... 3 2. Introduction... 5 3. Sector Overview and Support
WELCOME TO OPEN HOUSE # 1 June 14, 2017
 Langstaff Road Weston Road to Highway 7 Class Environmental Assessment Study WELCOME TO OPEN HOUSE # 1 June 14, 2017 Please sign in and join our mailing list Purpose of Open House #1 & Study Area York
TRANSIT & NON-MOTORIZED PLAN DRAFT FINAL REPORT Butte County Association of Governments
 1 INTRODUCTION Maintaining a high quality of life is the essence of this plan for transit and non-motorized transportation in Butte County. Curbing greenhouse gas emissions (GHG) by reducing congestion,
Berkeley Strategic Transportation Plan A-76
 Berkeley Strategic Transportation Plan A-76 Appendices 1. A Team Effort 2. Where We ve Been A-11 Berkeley Strategic Transportation Plan Alameda County Transportation Plan Alameda County will be served
University of Victoria Campus Cycling Plan Terms of Reference. 1.0 Project Description
 University of Victoria Campus Cycling Plan Terms of Reference 1.0 Project Description The Campus Cycling Plan, a first for the University, will provide a comprehensive and coordinated approach to support
MOBILITY RESULTS AREA. Budgeting For Outcomes Council Presentation January 12, 2007
 MOBILITY RESULTS AREA Budgeting For Outcomes Council Presentation January 12, 2007 Mobility Results Team Members 2 Hammond Perot, OED, Co-Team Leader Bonnie Meeder, DEV (returning), Co-Team Leader Peer
North Shore Transportation Improvement Strategy
 North Shore Transportation Improvement Strategy Preliminary, Near-term Recommendation 2016 April Transportation Improvement Strategy (TIS) Comprehensive and Analytical A multi-modal transportation strategy
ACTIVE TRANSPORTATION
 ACTIVE TRANSPORTATION Mobility 2040 Supported Goals Improve the availability of transportation options for people and goods. Support travel efficiency measures and system enhancements targeted at congestion
TRAVEL PLAN: CENTRAL EUROPEAN UNIVERSITY CAMPUS REDEVELOPMENT PROJECT TRAVEL PLAN. Central European University Campus Redevelopment Project.
 TRAVEL PLAN Central European University Campus Redevelopment Project Page 1 Table of Contents Introduction... 3 Background... 7 Building Users... 7 Transportation in Community Consultation... 7 Summary
Base Information. 4. Project Contact Person, Title, Phone Number, and
 Part 1 Base Information 1. Project Title 30th Street (SH7/Arapahoe Avenue Boulder Creek) Corridor Improvements 2. Project Start/End points or SH7/Arapahoe Avenue Boulder Creek Geographic Area Provide a
The Florida Bicycle and Pedestrian Partnership Council
 The Florida Bicycle and Pedestrian Partnership Council Input to the Update of the Florida Transportation Plan March 2015 This document presents input from the Florida Bicycle and Pedestrian Advisory Council
5. Pedestrian System. Accomplishments Over the Past Five Years
 5. Pedestrian System Accomplishments Over the Past Five Years The Alamo Area Metropolitan Planning Organization (MPO) and its partner agencies recognize the importance of improving pedestrian mobility.
Public Transportation and Bicycle & Pedestrian Stakeholder Webinar. April 11, :30 PM
 Public Transportation and Bicycle & Pedestrian Stakeholder Webinar April 11, 2013 1:30 PM Public Transportation and Bicycle & Pedestrian Webinar April 11, 2013 1:30 PM MULTIMODAL TRANSPORTATION PLAN Vision,
Crystal City Citizen Review Council Meeting. July 10, 2013
 Crystal City Citizen Review Council Meeting July 10, 2013 Topics to be covered Overview of Crystal City Transportation Projects Capital Program Investments Regional Coordination 9 Program Overview Crystal
Living Streets Policy
 Living Streets Policy Introduction Living streets balance the needs of motorists, bicyclists, pedestrians and transit riders in ways that promote safety and convenience, enhance community identity, create
PEDALING FORWARD. A Glance at the SFMTA s Bike Program for SFMTA.COM
 PEDALING FORWARD A Glance at the SFMTA s Bike Program for 2017-2021 SFMTA.COM INTRODUCTION About This Booklet More people from all walks of life see their bicycle as a more convenient way to get where
Access BART: TOD and Improved Connections. October 29, 2008
 Access BART: TOD and Improved Connections October 29, 2008 1 Access BART Study Goals Evaluate at the system-level land use and access scenarios to optimize ridership Identify station clusters that provide
Washington Metropolitan Area Transit Authority Board Action/Information Summary
 Washington Metropolitan Area Transit Authority Board Action/Information Summary Action Information MEAD Number: 200242 Resolution: Yes No TITLE: MWCOG Strategic Investment Plan & TPB Priorities PRESENTATION
CHAPTER 7.0 IMPLEMENTATION
 CHAPTER 7.0 IMPLEMENTATION Achieving the vision of the Better Streets Plan will rely on the ability to effectively fund, build and maintain improvements, and to sustain improvements over time. CHAPTER
City of Davenport CitiBus Public Transportation Study. April 2015
 City of Davenport CitiBus Public Transportation Study April 2015 Overview Project Background Key Findings CitiBus Service Allocation Policy Discussion 2 Project Background 3 About CitiBus Operates 17 routes
Transportation Assessment
 Transportation Assessment Midtown Open House February 10, 2018 Overview Midtown in Focus Overview & Purpose of Today Transportation Assessment overview Summary of Transportation work to date Review & Analysis
Highway 217 Corridor Study. Phase I Overview Report
 Highway 217 Corridor Study Phase I Overview Report November 3, 24 BACKGROUND AND OVERVIEW Study purpose The Highway 217 Corridor Study is developing multi-modal transportation solutions for traffic problems
Toward Zero Deaths. Regional SHSP Road Show Meeting. Virginia Strategic Highway Safety Plan. presented by
 Toward Zero Deaths Regional SHSP Road Show Meeting presented by Virginia Strategic Highway Safety Plan December 1, 2016 1 Welcome & Introductions Purpose of the Meeting Objectives & Key Outcomes Agenda»
Transit-Driven Complete Streets
 Questions: Type questions into the box at bottom of webinar panel. Panelists for today s webinar: Nimotalai Azeez, Program Associate with the National Complete Streets Coalition Rich Weaver, Director of
Public Consultation Centre For. Transportation Master Plan Update. Information Package
 Public Consultation Centre For Transportation Master Plan Update Information Package Date Location Hours Tuesday, September 12, 2017 Wednesday, September 13, 2017 Tuesday, September 19, 2017 Cambridge
 MEMORANDUM - CITY OF PASADENA Department Of Transportation DATE: OCTOBER 21, 2008 TO: ENVIRONMENTAL ADVISORY COMMISSION FROM: ~ FRED C. DOCK, DIRECTOR OF TRANSPORTATION SUBJECT: UPDATE ON DEPT. OF TRANSPORTATION
CPC Parking Lot Riverside Drive. Transportation Rationale
 CPC Parking Lot Transportation Rationale Prepared By: NOVATECH Suite 200, 240 Michael Cowpland Drive Ottawa, Ontario K2M 1P6 September 2015 Novatech File: 114093 Ref: R-2015-153 Table of Contents 1.0 INTRODUCTION...
Pocatello Regional Transit Master Transit Plan Draft Recommendations
 Pocatello Regional Transit Master Transit Plan Draft Recommendations Presentation Outline 1. 2. 3. 4. What is the Master Transit Plan? An overview of the study Where Are We Today? Key take-aways from existing
Regional Transportation Needs Within Southeastern Wisconsin
 Regional Transportation Needs Within Southeastern Wisconsin #118274 May 24, 2006 1 Introduction The Southeastern Wisconsin Regional Planning Commission (SEWRPC) is the official areawide planning agency
Welcome. Background. Goals. Vision
 Welcome The formal Public Information Centre (PIC) for the Transportation Master Plan How We GO will be held in early 2017. At that time we will present the recommended transportation system for Niagara
PERFORMANCE ANALYSIS of The Draft 2015 CLRP
 Item 9 PERFORMANCE ANALYSIS of The Draft CLRP Presentation to the Transportation Planning Board September 16, CLRP Performance Analysis 1 What is the Long-Range Transportation Plan (CLRP)? The CLRP identifies
Rochester Area Bike Sharing Program Study
 roc bike share Rochester Area Bike Sharing Program Study Executive Summary ~ January 2015 JANUARY 2015 8484 Georgia Avenue, Suite 800 Silver Spring, MD 20910 3495 Winton Pl., Bldg E, Suite 110 Rochester,
Launceston's Transport Futures. Greater travel options for the people of Launceston
 Launceston's Transport Futures Greater travel options for the people of Launceston Final Draft 13 Jan 2014 1 Page Number Executive summary 3 What is Transport Futures? 4 Vision 6 Economy, access and liveability
NOTES FROM JUNIOR COUNCIL ORIENTATION SESSION HELD ON MONDAY, JANUARY 22, 2018, AT 3:30 PM IN COUNCIL CHAMBERS, CITY HALL
 CITY OF KAMLOOPS Junior Council Meeting Agenda March 12, 2018, at 3:30 pm in Council Chambers, 7 Victoria Street West, Kamloops, BC Page 1. APPROVAL OF THE AGENDA 2. MINUTES Attachment Recommendation:
Goal 3: Foster an environment of partnerships and collaboration to connect our communities and regions to one another.
 Non-Motorized Transportation Plan (NMTP) Draft Vision, Goal and,, Tri-County Regional Planning Commission (TCRPC) Purpose The purpose of the Tri-County Regional Planning Commission (TCRPC) Non-Motorized
Performance Criteria for 2035 Long Range Transportation Plan
 Minimizing Impacts on Natural, Historic, Cultural or Archeological Resources 2035 LRTP Weighting Factor: 7% Objective 1.1: Use appropriate planning and design criteria to protect and enhance the built
BIKE PLAN CONTENTS GATEWAY
 CONTENTS Acknowledgments...vii Great Rivers Greenway District Board of Directors... vii Great Rivers Greenway District Staff... vii Project Consultants... vii Committees... viii Citizens Advisory Committee
APPENDIX B. TDM Existing Conditions
 APPENDIX B TDM Existing Conditions SCARBOROUGH CENTRE TMP TRANSPORTATION DEMAND MANAGEMENT INTRODUCTION Scarborough Centre has grown into a mixed-use hub for population, transportation, and employment
Complete Streets 101: The Basics
 Complete Streets 101: The Basics Michigan Municipal League - Capital Conference March 21, 2017 Chip Smith, AICP - Senior Planner - Wade Trim Inc. and City Council member City of Ann Arbor 2017 MML Capital
Moving Cambridge. City of Cambridge Transportation Master Plan Public Consultation Centre. March 7, :00 8:00 PM.
 City of Cambridge Transportation Master Plan Public Consultation Centre March 7, 2018 5:00 8:00 PM Region of Waterloo City of Cambridge Transportation Master Plan Public Consultation Centre March 7, 2018
ROUTES 55 / 42 / 676 BUS RAPID TRANSIT LOCALLY PREFERRED ALTERNATIVE
 ROUTES 55 / 42 / 676 BUS RAPID TRANSIT LOCALLY PREFERRED ALTERNATIVE April, 2012 1 INTRODUCTION The need for transit service improvements in the Routes 42/55/676 corridor was identified during the Southern
First Mile, Last Mile: Plans for all Shapes and Sizes. Hannah Lindelof, Principal Planner San Francisco Bay Area Rapid Transit September 18, 2017
 First Mile, Last Mile: Plans for all Shapes and Sizes Hannah Lindelof, Principal Planner San Francisco Bay Area Rapid Transit September 18, 2017 BART Station Access Policy Goals A. Safer, Healthier, Greener.
Is St. Louis Ready for a Bike Share System? May 14, 2014 Public Open House
 Is St. Louis Ready for a Bike Share System? May 14, 2014 Public Open House PRESENTATION AGENDA 2 BIKE SHARE How does it work? What are the benefits? Who would use it? Will it be safe? Would it work in
T1-A - Service Reduction (Re-sizing)
") Key T1-A Choice A Key T1-B Choice B Key T1-C Choice C Key T1-D Choice D Key T1-E Choice E Key T1-F Choice F Key Choice G T2 T1-A - Service Reduction (Re-sizing) Description This key choice would represent
Key T1-A Choice A Key T1-B Choice B Key T1-C Choice C Key T1-D Choice D Key T1-E Choice E Key T1-F Choice F Key Choice G T2 T1-A - Service Reduction (Re-sizing) Description This key choice would represent
Measuring and Communicating Mobility:
 Measuring and Communicating Mobility: The District Mobility Project Stephanie Dock, District Department of Transportation TRB Transportation Issues in Major Cities Committee May 2, 2017 Deconstructing
Complete Streets Workshop Follow-up. April 27, 2011 Rockledge City Hall
 Complete Streets Workshop Follow-up April 27, 2011 Rockledge City Hall Agenda Complete Streets draft briefing presentation and sample policy language Share your Complete Streets projects and post workshop
Public Consultation Centre
 Region of Waterloo Transportation Master Plan Update Public Consultation Centre See the Information Package on how to contact the Project Team and complete the Comment Sheet www.regionofwaterloo.ca/en/exploring-the-region/transportation-master-plan.aspx
92% COMMUTING IN THE METRO. Congested Roadways Mode Share. Roadway Congestion & Mode Share
 COMMUTING IN THE METRO Roadway Congestion & Mode Share The majority of major roadways in Greater Des Moines are without congestion and have underutilized capacity. This surplus capacity could be used for