APPENDICES: LAND USE
|
|
|
- Posy Burns
- 5 years ago
- Views:
Transcription
1 APPENDICES: LAND USE
2
3 T OWN OF F AIRFAX GENERAL P LAN LAND U SE E LEMENT A PPENDIX APPENDIX LU A REGULATORY AGENCIES INFLUENCING PLAN IMPLEMENTATION Association of Bay Area Governments (ABAG) The Association of Bay Area Governments (ABAG) was established in 1961 to promote local control, plan for the future, and promote cooperation in issues of interest to the nine Bay Area counties. ABAG is the regional representative of the Bay Area, and its members consist of all the cities and towns in those nine counties. ABAG is recognized as the official comprehensive planning agency for the Bay Area by both the state and federal governments. ABAG s Regional Plan includes policies that are intended to provide guidance to the local jurisdictions, including defining the affordable housing goals for Fairfax and the reduction of greenhouse gases. Bay Area Air Quality Management District (BAAQMD) The Bay Area Air Quality Management District (BAAQMD) is responsible for regulating air quality in the BA Area region. Its responsibilities include the preparation, implementation and monitoring air quality regulations and plans that are intended to reduce air pollution. California Department of Fish and Game (CDFG) The California Department of Fish and Game (CDFG) is responsible for the conservation, protection and management of wildlife, native plants, and habitat of the State that are essential to maintain biologically sustainable populations. CDFG acts as an advisor to other permitting agencies and enforces its own regulations. Permits issued for development projects by CDFG include Incidental Take Permits and Streambed Alteration Agreements. CDFG also enforces regulations against discharge into water bodies that might impact aquatic life. California Public Utilities Commission (CPUC) The California Public Utilities Commission (CPUC) is responsible for regulating privately owned electric, telecommunications, and natural gas, water and transportation service providers. ADOPTED APRIL 4,
4 L AND U SE E LEMENT A PPENDIX TOWN OF F AIRFAX GENERAL P LAN Federal Emergency Management Agency (FEMA) The Federal Emergency Management Agency (FEMA) administers the National Flood Insurance Program through the Federal Insurance Administration. FEMA maps are used by the Town to identify parcels that may be subject to flood damage. Local Agency Formation Commission (LAFCO) The Local Agency Formation Commission (LAFCO) was created by the Legislature in 1963 to discourage urban sprawl and encourage the orderly formation and development of local government agencies. LAFCO has four major functions under State law: 1) to review and approve or disapprove proposals for changes in the boundaries or organization of cities and special districts in the county (including annexations or detachments from cities and districts); 2) to establish and periodically update the sphere of influence or planned service area boundary for each city and special district; 3) to initiate and assist in studies of existing local government agencies with the goal of improving the efficiency and reducing the costs of providing urban services; and 4) to provide assistance to other governmental agencies and the public concerning changes in local government organization and boundaries. Marin Municipal Water District (MMWD) Marin Municipal Water District (MMWD) is the public agency that provides high quality drinking water to 190,000 people in a 147 square mile area of Marin County. MMWD manages 21,000 acres in District ownership plus 2,750 acres adjacent to the Nicasio and Soulajule reservoirs. The watershed is held in trust. National Marine Fisheries Service The National Marine Fisheries Service (NMFS) is responsible for regulating impacts to federally-listed endangered species and their habitats. Similar to CDFG, NMFS not only acts as an advisor to other permitting agencies, but also enforces its own regulations, including issuing Incidental Take Permits. NMFS is usually involved in projects requiring the attention of the Corps. Regional Water Quality Control Board (RWQCB) The Regional Water Quality Control Board (RWQCB) is responsible for regulating surface water pollution, including wastewater discharge and storm water runoff, as well as dredging and filling. RWQCB issues permits and requires monitoring for all activities 2 ADOPTED APRIL 4, 2012
5 T OWN OF F AIRFAX GENERAL P LAN LAND U SE E LEMENT A PPENDIX that could impair the beneficial use of receiving waters. The RWQCB assumes a greater responsibility than does the USACE in reviewing projects that impact wetland resources. The Town is covered by the National Pollutant Discharge Elimination System (NPDES) General Permit containing Waste Discharge Requirements for Storm Water Discharges from Small Municipal Separate Storm Sewer Systems (Phase II General Permit). U.S. Army Corps of Engineers (USACE) The U.S. Army Corps of Engineers (USACE) is responsible for enforcing the Clean Water Act. The Corps regulates the dredging or filling of the nation s navigable waters and wetlands. The Corps is the primary federal agency responsible for making wetland determinations and issuing permits for wetland or water fill. The RWQCB s determination may require mitigation activities beyond those imposed by the Corps. U.S. Fish and Wildlife Service (USFWS) The U.S. Fish and Wildlife Service (USFWS) is responsible for regulating impacts to federally-listed endangered species and their habitats. Similar to CDFG, the Service not only acts as an advisor to other permitting agencies, but also enforces its own regulations, including issuing Incidental Take Permits. The Service is usually involved in projects requiring the attention of the Corps. ADOPTED APRIL 4,
6 L AND U SE E LEMENT A PPENDIX TOWN OF F AIRFAX GENERAL P LAN 4 ADOPTED APRIL 4, 2012
7 T OWN OF F AIRFAX GENERAL P LAN LAND U SE E LEMENT A PPENDIX APPENDIX LU B SUMMARY OF ZONING ORDINANCE DEVELOPMENT STANDARDS COMMERCIAL CL (Limited Commercial) Purpose: The purpose of this zone is to provide a location for those uses, mainly service oriented, that may be incompatible with the retail sales uses of the Central Commercial Zone or the Highway Commercial Zone. The permitted uses include restaurants, health care facilities, professional offices, and music and art studios. Minimum Size: The building site requirements are 20,000 square feet, with a minimum width of 75 feet. Height Regulations: The maximum height limit is 28.5 feet and not more than two stories. Parking Requirements: One space per 200 square feet. CH (Highway Commercial) This zoning designation has been eliminated. CC (Central Commercial) Purpose: The purpose for this zone is to allow uses that contribute to the retail commercial heart of the Town. Residential uses are permitted by right on the second floor. Permitted uses include retail businesses and services that are normally found in central core of a small town. This zoning designation applies to the area around the Bolinas Road and Broadway intersection and the area along Sir Francis Drake adjacent to the Parkade. Minimum Size: No building site requirements. Height Regulations: The maximum height is 28.5 feet and not more than two stories. Parking Requirements: One space per 200 square feet. CS (Service Commercial) Purpose: The purpose of this zone is to restrict uses within the zone to lumber yards, home improvement centers, and building materials supply. All structures in this zone are ADOPTED APRIL 4,
8 L AND U SE E LEMENT A PPENDIX TOWN OF F AIRFAX GENERAL P LAN subject to design review. The permitted uses include building and construction supply centers. This zone includes Fairfax Lumber. Minimum size: Twenty thousand square feet, with a minimum width of 100 feet. Height Regulations: The maximum height is 15 feet and not more than one story Parking Requirements: One space per 200 square feet, one off-street loading space per 20,000 square feet. CR (Commercial Recreation) Purpose: This zone provides a location for private, non-public, recreation facilities. The permitted uses are private clubs. The former Marin Town and Country Club site is in this zone. Minimum Size: Ten acres. Height Regulations: The height limit is 28.5 feet and not more than two stories. Parking Requirements: Subject to Design Review. RESIDENTIAL RS (Residential, High Density) Purpose: Single-family dwellings; duplexes (7,000 square feet minimum lot size); boarding houses, not to exceed five guests Minimum Lot Size: 5,500 square feet for a single-family residence; 7,000 square feet for duplex; 60 feet minimum width with slope less than 10 percent; lot size requirement increases with slope increase. Height Regulations: 28.5 feet and not more than two stories, for lots less than 10 percent slope; 35 feet for lots in excess of 10 percent. Parking Requirements: One space for studio units; two spaces for all others, regardless of number of bedrooms. RS 6 (Single Family Residential, High density) Purpose: Single-family dwellings Minimum Lot Size: 6,000 square feet, with a minimum width of 60 feet with slope less than 10 percent, lot size requirement increases with slope percentage. Height Regulations: 28.5 feet and not more than two stories, for lots less than 10 percent slope; 28.5 feet and not more than two stories, for upslope lots in excess of 10 6 ADOPTED APRIL 4, 2012
9 T OWN OF F AIRFAX GENERAL P LAN LAND U SE E LEMENT A PPENDIX percent; 35 feet for downslope lots in excess of 10 percent and to not more than three stories. Parking Requirements: One space for studio units; two spaces for all others, regardless of number of bedrooms. RS 7.5 (Single Family Residential, Medium Density) Purpose: Single-family dwelling on each building site. Minimum Lot Size: Minimum area of 7,500 square feet, minimum width of 75 feet for lots with less than 10 percent slope; site size requirement increases with slope. Height Regulations: 28.5 feet and not more than two stories for lots less than 10 percent slope; 35 feet and not more than three stories for lots in excess of 10 percent. Parking Requirements: One space for studio units; two spaces for all others, regardless of number of bedrooms. RM (Multiple Family Residential) Purpose: Multiple dwellings and apartments at a density of not more than one unit for 4,356 feet (1/10 acre) of land area Minimum Lot Size: Minimum area of 7,500 square feet, minimum width of 60 feet for lots with less than 10 percent slope; site size requirement increases with slope Height Regulations: 28.5 feet and not more than two stories for lots less than 10 percent slope; 35 feet and not more than three stories for lots in excess of 10 percent. Parking Requirements: One space for studio units; two spaces for all others, regardless of number of bedrooms. PDD (Planned Development District) Purpose: The primary purpose for the zoning designation is to allow flexibility in the development process while encouraging high quality design. Minimum Lot Size: None specified. Height Regulations: 28.5 feet and not more than two stories Parking Requirements: One space for studio units; two spaces for all others, regardless of number of bedrooms, plus one guest space per unit. SF RMP (Single Family Residential Master Planned District) Purpose: The primary purpose for this zoning designation is to allow development of single-family detached units without specific yard requirements in areas where the ADOPTED APRIL 4,
10 L AND U SE E LEMENT A PPENDIX TOWN OF F AIRFAX GENERAL P LAN resulting amenities will enhance the environmental quality or benefit the public welfare, and protect development in geologic, hydrologic, or fire hazard areas. Minimum Lot Size: None specified. Height Regulations: 35 feet above natural grade. Parking Requirements: One space for studio units; two spaces for all others, regardless of number of bedrooms, plus one guest space per unit. UR (Upland Residential) Purpose: The primary purpose of this zoning designation is to regulate residential development on the hillsides surrounding the Town. Minimum Lot Size: Seven- to 10-acre minimum parcel size, a single-family dwelling on each building site, minimum width shall be 60 feet, minimum building site area shall be identical to the acreage expressed in the Fairfax General Plan. Height Regulations: 28.5 feet and not more than two stories, except on lots less than 10 percent slope where the primary frontage shall not exceed 35 feet, or if situated on the uphill side of the street, the primary frontage shall not exceed 28.5 feet. Parking Requirements: One space for studio units; two spaces for all others, regardless of number of bedrooms 8 ADOPTED APRIL 4, 2012
11 T OWN OF F AIRFAX GENERAL P LAN LAND U SE E LEMENT A PPENDIX APPENDIX LU C: OPPORTUNITY SITES Major Opportunity Sites Incorporation of Transit Oriented Development Design Principles Christ Lutheran Church site (possible senior housing) 10 Olema Site former Mandarin Gardens Restaurant (possible workforce housing) School Street Plaza ( old school site ) Fairfax Market site (i.e., rezoning from CH to CC; with no Conditional Use Permit (CUP) required for second floor housing) Fair-Anselm (i.e., rezoning from CH to CC; with no CUP for second floor housing) Minor Opportunity Sites Incorporation of Traditional Neighborhood Design Principles Infill lots New second units Amnesty for existing informal second units (e.g., with relaxed sprinkler requirement) Incubator Commercial (may be part of major opportunity sites) Under-utilized public property (e.g., Pavilion parking lot) Adaptive Reuse of existing buildings Pocket parks and creek daylighting ADOPTED APRIL 4,
12 L AND U SE E LEMENT A PPENDIX TOWN OF F AIRFAX GENERAL P LAN 10 ADOPTED APRIL 4, 2012
13 APPENDICES: CIRCULATION
14
15 T OWN OF F AIRFAX GENERAL P LAN C IRCULATION E LEMENT A PPENDIX APPENDIX C A: INVENTORY OF RECREATIONAL TRAILS, PATHS AND RIGHTS OF WAY IN THE FAIRFAX PLANNING AREA Here is a list of historical easements and rights-of-way within the Town of Fairfax, designated by name and by location between the lower elevation and upper elevation ends. Status codes are R - red (impassable), Y - yellow (passable with difficulty), or G - green (passable), and/or B - blue (Private Property). Trail Name Neighborhood Bottom Street Top Street Status Notes 1 Scenic Hill 5 Acacia 40 Bay Y/R Parking blocks top of trail. Garden also established over trail. Bottom neighbor (7 Acacia) very interested in opening trail, with steps and/or funicular as combined access for house. 2 Scenic Hill 20 Berry Trail 211 Tamalpais R Fence blocking trail. Needs steps. 3 Scenic Hill 224 Bolinas 91 Frustuck Y/R Landscaping and fence block bottom. Fence midway. Top is steep but open. Needs steps. 4 Scenic Hill 74 Frustuck 51 Manzanita Court G/Y/R/B Private property at top. Fence at bottom. 5 Scenic Hill 84 Frustuck 53 Manzanita Court Y/R Dead end. Fence at bottom. 6 Scenic Hill 206 Frustuck 66 Manzanita Ave Y/R Fences top and middle. Needs steps. 7 Holly Road Scenic Hill 34 Holly Tamarancho G Leads to Open Space and Tamarancho. 8 Scenic Hill 14 Manzanita Ave 18 Mountain View G/Y Needs steps. 9 Scenic Hill 2 Medway 291 Scenic Y Trail open at bottom. Some steps and slide control installed, needs more steps. Top of trail passes very near renter's window. Needs steps. Old Funicular route. 10 Scenic Hill 36 Midway 140 Tamalpais Y Brush, needs clearing. ADOPTED APRIL 4,
16 C IRCULATION E LEMENT A PPENDIX TOWN OF F AIRFAX GENERAL P LAN Trail Name Neighborhood Bottom Street Top Street Status Notes 11 Scenic Hill 41 Redwood 450 Ridge G/Y Needs steps. 12 Scenic Hill 101 Redwood 540 Scenic G/Y Needs steps. 13 Scenic Hill 200 Redwood/Scenic hairpin Open space/tamarancho 14 Scenic Hill 99 Ridge Open space R Steep 15 Scenic Hill 121 Ridge Open space Y Steep G/B Bottom of trail on private property 16 Ridge Trail Scenic Hill 155 Ridge Tamarancho G Leads to Open Space and Tamarancho 17 Scenic Trail Scenic Hill 176 Scenic 144 Redwood G/Y Creek in trail. Needs steps. 18 Fir Trail Scenic Hill 202 Scenic 126 Redwood G 19 Scenic Hill 96 Tamalpais 207 Scenic, near Fir Trail Y/B Historic trail on private property. Steps leading up from bottom of hill. 20 Scenic Hill 290 Scenic 438 Scenic Y/R Parking blocks bottom of trail. Fence at top of trail. Needs steps. Old Funicular route. 21 Scenic Hill 377 Scenic 90 Ridge R Structure built over right of way. 22 Scenic Hill 377 Scenic 92 Ridge G/B Private property. Available for emergency egress. 23 Scenic Hill 399 Scenic 30 Park Lane G 24 Scenic Hill 429 Scenic 20 Park Lane G 25 Scenic Hill 501 Scenic Ridge Y/B Private property. Leads up creek to ridge trail. Needs clearing, steps. 26 Scenic Hill 89 Spruce 41 Berry Trail R Slide zone. Needs steps. 27 Scenic Hill 101 Spruce 183 Tamalpais R/B Structure built over right of way. Old Funicular route. 28 Scenic Hill 45 Tamalpais 141 Tamalpais G 29 Scenic Hill 140 Tamalpais 267 Scenic G/Y Needs steps. 2 ADOPTED APRIL 4, 2012
17 T OWN OF F AIRFAX GENERAL P LAN C IRCULATION E LEMENT A PPENDIX Trail Name Neighborhood Bottom Street Top Street Status Notes 30 Scenic Hill 64 Valley Road Toyon Fire Road G/Y Brush and broom. Not currently on color map! 31 Scenic Hill 49 Wreden 23 Manzanita Ave Y/R Fence at bottom. Needs steps. 32 Berry Trail Scenic Hill 82 Wreden 191 Tamalpais G/B Private property at Wreden end. Historic use (probable prescriptive easement) 33 Scenic Hill 90 Wreden Undeveloped lot Y Dead end. 34 Willow/Ridgeway 12 Upper Ridgeway Open space R Brush and trees blocking parts of trail. Adjacent trail is used. 35 Willow/Ridgeway 12 Upper Ridgeway Open space G/B Private Property (undeveloped). Active route. 36 Willow/Ridgeway 13 Upper Ridgeway Ridgeway Fire Road G/Y Trail building needed around property 37 Willow/Ridgeway 82 Maple 141 Willow G 38 Willow/Ridgeway 130 Ridgeway Ridgeway Fire Road G Access to open space and Wall property 39 Willow/Ridgeway 55 Maple 29 Chester Y Steep near top, needs steps. Neighbor has expanded play area onto trail 40 Willow/Ridgeway 113 Taylor Town land/open space/wall Property G/Y Brush. Needs trail building, steps 41 Parker Lane Willow Ridgeway 5 Parker Lane Open space R Brush, steep, claimed as Driveway for #5 Parker 42 Willow/Ridgeway 46 Rocca 95 Rocca G/Y Dead end, open at street (#46 Rocca) 43 Willow/Ridgeway 55 Taylor Town lot, Wall Property G Some scotch broom, trail open 44 Willow/Ridgeway 2042 Sir Francis 53 Taylor G Fairfax Grocery to Bennett House Drake 45 Lower Rocca Willow/Ridgeway 4 Rocca 69 Rocca G Steps 46 Willow/Ridgeway 8 Taylor alley G 6 feet short of Rocca at top ADOPTED APRIL 4,
18 C IRCULATION E LEMENT A PPENDIX TOWN OF F AIRFAX GENERAL P LAN Trail Name 47 Upper Rocca steps 48 Various points Neighborhood Bottom Street Top Street Status Notes Willow/Ridgeway 44 Rocca 96 Rocca G/Y Steps at top end rotted, otherwise good. AKA Sady Stairs Willow/Ridgeway 96 Rocca to 113 Taylor Ridgeway R/ B Due to no connecting street between neighborhoods, various owners have historically allowed access through private yards. Changeable. Local knowledge. 49 Willow/Ridgeway 144 Live Oak Upper Rocca steps G/B Access between neighborhoods, private property. Active route. 50 Willow/Ridgeway 134 Live Oak 212 Ridgeway G/B Access between neighborhoods, private property. Active route. 51 Willow/Ridgeway 36 Rocca 135 Live Oak G/B Access between neighborhoods, private property. Active route. 52 Willow/Ridgeway 1790 Sir Francis Drake 53 Willow/Ridgeway 1770 Sir Francis Drake 54 Willow/Ridgeway Sir Francis Drake 55 Downtown (W/R map) 56 School St Bridge Downtown (W/R map) 57 Downtown (W/R map) 58 Playground Bridge Downtown (W/R map) 141 Live Oak Y Stream, brush. Needs steps and trail construction. 99 Live Oak G/B Access between neighborhoods, private property. Active route Live Oak Y Needs steps, people use alternate routes on Private Property 22 Napa 88 Mono Lane G Paved Pathway Women's Cub Ball Field G New Bridge 8 School Pavilion G Around Ball Field 18 Park Road Pavilion R Bridge out 59 Cascades 78.2 Cypress 99 Hickory G 4 ADOPTED APRIL 4, 2012
19 T OWN OF F AIRFAX GENERAL P LAN C IRCULATION E LEMENT A PPENDIX Trail Name Neighborhood Bottom Street Top Street Status Notes 60 Cypress Trail Cascades 130 Cypress 260 Cypress G 61 Cascades 130 Cypress 126 Madrone G 62 Cascades Cypress trail Toyon Trail Y Small slides, brush. Needs steps and trail construction. 63 Toyon Trail Cascades 190 Toyon (East end) Toyon Fire Road, G Tire Swing, Open Space Broom, 64 Toyon Fire Road 65 Crystal Mine trail Cascades 101 Toyon Pam s Blue Ridge, Tamarancho Cascades 91 Toyon (west end) Open Space (crystal mine) G G Fire trail to open space 66 Cascades 280 Cypress 180 Toyon R ends at 180 Toyon (private lot). Blocked 67 Cascades 139 Madrone 285 Cypress Y Steep at bottom. Alternate trail follows slope to connect at bottom. Neighbor has removed trail markers and contests location, has posted no trespassing signs, but says that neighbors using trail are no problem. Worried about "tourists" 68 Cascades 140 Cascade 85 Cypress Y Brush, steep. Needs steps. 69 Cascades 140 Cascade 85 Cypress 70 Cascades 19 Madrone Court 64 Madrone Road G 130 Madrone R Blocked by Swimming pool across right of way (140 Madrone). Alternate location exists for right of way, down slope from pool. 71 Cascades 57 Madrone Road 335 Cypress Y/R Erroneously signed as private at top. Needs steps, brush clearing at bottom. 72 Cascades 338 Cypress 86 Oak G/Y Bottom is steep, adjacent to house access. Top 90% along driveway and very passable. Needs steps at Cypress. ADOPTED APRIL 4,
20 C IRCULATION E LEMENT A PPENDIX TOWN OF F AIRFAX GENERAL P LAN Trail Name Neighborhood Bottom Street Top Street Status Notes 73 Cascades 89 Oak 122 Toyon R Fenced by neighbors top and bottom. 74 Cascades 25 Woodland Court 70 F88Toyon G Open Space Access. Needs steps. 75 Cascades 21 Woodland Court Laurel Ct (fire road) Y Brush. Needs trail construction. 76 Cascades 292 Cascade 81 Laurel Y House on old right of way. Access down slope? 77 Cascades 50 Pine 191 Laurel Y/R Steep, especially at bottom. Needs steps. 78 Cascades 98 Pine 3 Woodland R/Y/G Top is flat and passable. Middle is steep, needs steps. Bottom is very steep. Alternate route over private driveway? Needs steps, trail construction. 79 Cascades 3 Woodland Laurel Court G Trail leading to water tank, then fire road to open space. Partially renovated with switchbacks at bottom. Above this is a lot of brush, but passable. 80 Cascades 144 Pine Laurel Ct (fire road) R Very steep 81 Cascades 200 Pine Laurel R Very steep 82 Pine Trail Cascades 300 Pine 652 Cascade/Fire road to Pam s Blue Ridge open space G Leads from end of Pine 83 Cascades 530 Cascade 201 Pine G/Y Somewhat steep in sections, good trail for end of Pine. Needs trail construction. 84 Cascades 612 Cascade R Dead end at private lot 85 Cascades 652 Cascade Pine trail, Open Space fire road G Barrier at junction with fire road to discourage use by Bicycles. 86 Cascade trail Cascades End of Cascade Open Space G Elliott Nature Preserve, Repack, Cascade Falls, etc 87 Cascades 270 Pine Open space G Trail off of end of Pine, leads to end of Town, Open Space, Fire Road. Needs maintenance. 88 Cascades 205 Canyon Open space G to Elliot Preserve 6 ADOPTED APRIL 4, 2012
21 T OWN OF F AIRFAX GENERAL P LAN C IRCULATION E LEMENT A PPENDIX Trail Name Neighborhood Bottom Street Top Street Status Notes 89 Cascades Canyon Open space Y Steep, leads to end of town limit on steep hill 90 Cascades 446 Cascade 155 Pine G/Y Steep at top. Needs steps. 91 Cascades 123 Canyon Open space Y Steep, leads to end of town limit on steep hill 92 Cascades Near Meadow Way 606 Bolinas R Leads from rear of property line at 64/68 Meadow Way, up to Bolinas Fawn Ridge 93 Town owned lot Cascades/Deer Park San Anselmo Creek 390 Bolinas rd Y Outfall of Wood Lane creek. Alternate fire egress from Cascade Canyon, via creekbed or sewer easement (road) leading from 22 Meadow way. 94 Deer Park/Hillside 134 Wood Lane 0.5 Fawn Ridge G Leads from end of Wood Lane to Fawn Ridge/Bolinas intersection. Needs steps. 95 Deer Park/Hillside 80 Porteous Open space R Steep uphill, blocked 96 Deer Park/Hillside 129 Porteous 178 Meernaa G 97 Deer Park/Hillside 113 Porteous Meernaa G 98 Deer Park/Hillside 105 Meernaa 25 Hillside Y Steep 99 Deer Park/Hillside 10 Spring Lane 90 Spring Lane Y Steep 100 Deer Park/Hillside 30 Spring Lane 70 Spring Lane Y Steep 101 Deer Park/Hillside 21 Deer Park Dr 70 Crest G Steep 102 Deer Park/Hillside 67 Meernaa 57 Hillside R Blocked 103 Deer Park/Hillside 37 Meernaa 61 Hillside G 104 Deer Park/Hillside 389 Forrest 38 Hillside R Blocked 105 Forrest steps Deer Park/Hillside 15 Forrest Terrace 155 Hillside G to Crest, open space 106 Bumpy Alley Deer Park/Hillside 147 Bolinas Dominga G 107 Deer Park/Hillside 101 Dominga 310 Forrest G/B Private Property, with Bridge ADOPTED APRIL 4,
22 C IRCULATION E LEMENT A PPENDIX TOWN OF F AIRFAX GENERAL P LAN Trail Name 108 Creek Footbridge Neighborhood Bottom Street Top Street Status Notes Deer Park/Hillside 10 Bridge Ct 290 Forrest G Bridge and steps 109 Power Lane Deer Park/Hillside 295 Forrest 213 Hillside G/B Bottom has access on Private Driveway. 110 Deer Park/Hillside Marin Town and Country Club 274 Forrest Y Top is used as steps to 276 Forrest only. 111 Deer Park/Hillside 239 Forrest Y Leads to private lot, 233 Hillside 112 Deer Park/Hillside Marin Town and Country Club 113 Deer Park/Hillside Marin Town and Country Club 114 Deer Park/Hillside Marin Town and Country Club 210 Forrest Y Steep 184 Forrest Y Steep 130 Forrest Y 115 Deer Park/Hillside Marin Town and Country Club Marin Town and Country Club Y Runs along bottom of field at MTCC, no outlet except up to Forrest 116 Deer Park/Hillside 157 Forrest 152 Francis, two Town owned lots Y Francis originates in San Anselmo 117 Deer Park/Hillside 141 Forrest R Dead Francis 118 Deer Park/Hillside 107 Forrest R Dead 100 Francis 119 Deer Park/Hillside 235 Hillside 155 Francis, Y/G Gated on Hillside (gate often open) 120 Oak Manor Hawthorne Court Oak Manor Dr/SFDrake Y/B Historic route to Manor School, crossing creek at end of Hawthorne Court. Utility easement. 121 Oak Manor 2390 Sir Francis Drake Manor School/Wall Property G/B Route along creek to school, spur trail leads up hill to Wall Property, open space 8 ADOPTED APRIL 4, 2012
23 T OWN OF F AIRFAX GENERAL P LAN CIRCULATION A PPENDIX APPENDIX C B: PEDESTRIAN AND BICYCLE MASTER PLAN ADOPTED APRIL 4,
24 C IRCULATION E LEMENT A PPENDIX TOWN OF F AIRFAX GENERAL P LAN 10 ADOPTED APRIL 4, 2012


25 Town of Fairfax PEDESTRIAN AND BICYCLE MASTER PLAN February 2008 Update Prepared by Alta Planning + Design
26 FEBRUARY 2008 FINAL PLAN FAIRFAX BICYCLE AND PEDESTRIAN MASTER PLAN
27 ACKNOWLEDGEMENTS Town Council Mayor Mary Ann Maggiore Vice Mayor David Weinsoff Council Member Larry Bragman Council Member Susan Brandborg Council Member Lew Tremaine Town Staff Michael Rock, Town Manager Ian Roth, Finance Director Bicycle/Pedestrian Advisory Committee Hobart Bartshire Stephen Bryne Renee Goddard Chris Lang Steven Plunkett, BPAC Secretary John Reed Tamela Smith Joe Stranzl Bob Trigg Consultants Alta Planning + Design Michael Jones, Principal-in-Charge Eric Anderson, Project Manager Matthew Lasky, Planner Adrian Leung, Planner Alta Planning + Design 707 C Street San Rafael, California (415) phone (415) fax FAIRFAX BICYCLE AND PEDESTRIAN MASTER PLAN FEBRUARY 2008 FINAL PLAN
28 FEBRUARY 2008 FINAL PLAN FAIRFAX BICYCLE AND PEDESTRIAN MASTER PLAN
29 TABLE OF CONTENTS 1. INTRODUCTION COMMUNITY PARTICIATION BICYCLE AND PEDESTRIAN MASTER PLAN GOALS & POLICIES GOALS, OBJECTIVES, AND POLICY ACTIONS PLANNING CONTEXT BTA COMPLIANCE CHECKLIST EXISTING CONDITIONS EXISTING CONDITIONS FOR BICYCLING EXISTING CONDITIONS FOR WALKING DESCRIPTION OF PAST EXPENDITURES SAFETY, EDUCATION AND ENCOURAGEMENT PROGRAMS NEEDS ANALYSIS LAND USE AND DEMAND FOR BICYCLING SETTLEMENT PATTERNS AND DESTINATIONS COMMUTE PATTERNS PROPOSED IMPROVEMENTS BICYCLE FACILITY IMPROVEMENTS PEDESTRIAN FACILITY IMPROVEMENTS RECOMENDED POLICIES AND PROGRAMS PLAN IMPLEMENTATION IMPLEMENTATION PROCESS INFRASTRUCTURE PROJECT PRIORITIZATION COST ESTIMATES MAINTENANCE MARKETING THE BICYCLE AND PEDESTRIAN MASTER PLAN FUNDING OPPORTUNITIES APPENDIX A: BICYCLE LAW AND ETIQUETTE... A-1 APPENDIX B: SUPPLEMENTAL BIKEWAY DESIGN GUIDELINES... B-1 APPENDIX C: SUPPLEMENTAL PEDESTRIAN FACILITY DESIGN GUIDELINES... C-1 APPENDIX D: PEDESTRIAN RIGHTS-OF-WAY... D-1 FAIRFAX BICYCLE AND PEDESTRIAN MASTER PLAN FEBRUARY 2008 FINAL PLAN
30 LIST OF FIGURES AND TABLES FIGURES Figure 3-1 Fairfax Existing Bikeways Figure 4-1 Fairfax General Plan Land Use Map Figure 5-1 Fairfax Proposed Bikeways Map TABLES Table 2-1 Fairfax BTA Compliance Checklist Table 3-1 Existing Bikeways Mileage by Type Table 3-2 Existing Multi-Use Pathways Inventory Table 3-3 Existing Bicycle Lanes Inventory Table 3-4 Existing Bicycle Routes Inventory Table 3-5 Fairfax Past Expenditures Table 3-6 Fairfax Safe Routes to Schools Education and Encouragement Programs Table 4-1 Fairfax Commute Mode Split Compared to the State and Nation Table 4-2 Bicycle Commute and Air Quality Projections Table 5-1 Proposed Class I Facilities Table 5-2 Proposed Class II Facilities Table 5-3 Proposed Class III Facilities Table 6-1 Recommended Bikeway System Cost Estimates All Bikeways Table 6-2 Bicycle Detection Estimated Costs Table 6-3 Bicycle Detection Locations Table 6-4 Bicycle Parking Locations Table 6-5 Information Kiosk Locations Table 6-6 Pedestrian Improvement Cost Estimates FEBRUARY 2008 FINAL PLAN FAIRFAX BICYCLE AND PEDESTRIAN MASTER PLAN
31 1. INTRODUCTION The 2008 Fairfax Bicycle and Pedestrian Master Plan update provides for a town-wide network of bicycle paths, lanes and routes, along with bicycle-related programs and support facilities, intended to ensure bicycling becomes a viable transportation option for people who live, work and recreate in Fairfax. Current bikeway network information was gathered from meetings with the Fairfax Bicycle/Pedestrian Advisory Committee (BPAC) and Town staff, combined with information on proposed routes from the previously adopted Town of Fairfax Bicycle and Pedestrian Master Plan (2001). Relevant bikeway information was also gathered from the Marin County Unincorporated Area Bicycle and Pedestrian Master Plan (2001). The purpose of this Bicycle and Pedestrian Master Plan is to improve bicycle and pedestrian transportation in Fairfax, in part by meeting the requirements of the California Bicycle- Transportation Act, which requirements are contained in Section 890 of the California Streets and Highways Code COMMUNITY PARTICIATION In the Spring of 1999, the Town Council of Fairfax created the first official Fairfax Bicycle and Pedestrian Advisory Committee (BPAC). In 2007 the BPAC was revived for the purpose of updating the Bicycle and Pedestrian Master Plan. The BPAC met four times from June to December of 2007 to discuss and complete updates to the 2001 Fairfax Bicycle and Pedestrian Master Plan. Meetings were noticed by Town Staff through distribution to the interested parties list of the Fairfax Bicycle/Pedestrian Advisory Committee. The meetings were agendized and properly noticed in accordance with the Brown Act and are open to the public. In addition, public input was received at three countywide public meetings, the Central Marin Countywide Bicycle and Pedestrian Master Plan Update Public Workshop (held Monday, November 13, 2006 at the San Rafael Community Center, San Rafael) and two Nonmotorized Transportation Pilot Program Public Workshops (held Thursday November 29, 2006 at the Embassy Suites Hotel, San Rafael and Monday March 12, 2007 at the San Rafael Community Center, San Rafael). 2. BICYCLE AND PEDESTRIAN MASTER PLAN GOALS & POLICIES 2.1. GOALS, OBJECTIVES, AND POLICY ACTIONS GOALS Goals provide the context for the specific objectives and policy actions discussed in the Bicycle and Pedestrian Master Plan. The goals provide the long-term vision and serve as the foundation of the FAIRFAX BICYCLE AND PEDESTRIAN MASTER PLAN 1 FEBRUARY 2008 FINAL PLAN
32 plan. Goals are broad statements of purpose that do not provide specific descriptions of the goal, while policy actions provide a bridge between general policies and actual implementation guidelines, which are provided in Section 5. GOAL 1 INCREASED BICYCLE AND PEDESTRIAN ACCESS Expand bicycle and pedestrian facilities and access in and between neighborhood areas, employment centers, shopping areas, schools, and recreational sites. GOAL 2 BICYCLE TRANSPORTATION Make the bicycle an integral part of daily life in Fairfax by implementing and maintaining a bikeway network, providing end-of-trip facilities, improving bicycle/transit integration, encouraging bicycle use, and making bicycling safer and more convenient. GOAL 3 PEDESTRIAN TRANSPORTATION Encourage walking as a daily form of transportation in Fairfax by completing a pedestrian network that services short trips and transit, improving the quality of the pedestrian environment, improving the health of all citizens, and increasing safety, convenience and access opportunities for all users. OBJECTIVES OBJECTIVE A Implement the Bicycle and Pedestrian Master Plan, which identifies existing and future needs, and provides specific recommendations for facilities and programs. Objective A Policy Actions 1. Update the Plan every five (5) years as required by Caltrans to reflect new policies and/or requirements for bicycle and pedestrian funding. 2. All Safe Routes to Schools travel plans should be reviewed by the Fairfax BPAC for consistency with the Fairfax Bicycle and Pedestrian Master Plan, with the authority to refer concerns to staff and council as necessary. Individual SR2S travel plans (or smaller plans packaged together) which involve a bid higher than $5,000 will be reviewed by the Town Council per current policy. 3. The Town of Fairfax will retain its BPAC to monitor implementation of this Bicycle and Pedestrian Master Plan, review roadway projects for bicycle and pedestrian needs, advise the town on the design of funded projects, ensure consistency with the update of the General Plan, and to assist with education and encouragement programs. The BPAC will also work with the Town on the next revision of the Bicycle and Pedestrian Master Plan which would take place by Maximize coordination between government agencies, schools, and community organizations to address bicycle and pedestrian issues of mutual concern. 5. Seek funding for bikeway and pedestrian projects through current local, regional, state, and federal funding programs and encourage multi-jurisdictional funding applications. FAIRFAX BICYCLE AND PEDESTRIAN MASTER PLAN 2 FEBRUARY 2008 FINAL PLAN
33 OBJECTIVE B Complete a continuous network of bikeways that are feasible, fundable, and that serve bicyclists needs, especially for travel to employment centers, schools, commercial districts, transit stations, and institutions. Objective B Policy Actions 1. Implement high priority projects, such as the Center Boulevard Bicycle Lanes and Safe Routes to Schools improvements. 2. Prioritize closing gaps in the east-west bikeway, such as the Broadway Avenue to Sir Francis Drake Boulevard connection, and others. 3. Require construction of relevant planned bikeways as an integral part of any transportation facility maintenance or construction project. 4. Construct a network that encourages bicycling to and for recreational purposes. 5. Work with adjacent government agencies and local community groups to ensure a complete and continuous network across jurisdictional boundaries. 6. At a minimum, construct all bikeways according to Caltrans Chapter 1000 Design Guidelines. OBJECTIVE C Complete a network of walkways that serves pedestrian needs, especially for short trips to employment centers, schools, commercial districts, transit stations, and institutions. Objective C Policy Actions 1. Complete missing connections to make direct routes for walking, especially connections between residential neighborhoods and the downtown area. 2. Work to build walkways along existing and potential pedestrian rights-of-way. 3. Identify and mitigate impediments and obstacles to walking to school. 4. For new development or redevelopment projects, require construction of planned pedestrian facilities. 5. Work with transit authorities to ensure that pedestrian concerns are addressed in the design of transit stops. 6. Provide opportunities for walking for recreational purposes. OBJECTIVE D Maintain and improve the quality, operation, and integrity of bikeway and walkway network facilities. Objective D Policy Actions: 1. Undertake routine maintenance of bikeway and walkway network facilities, such as sweeping bicycle lanes and sidewalks and removing vegetation which impinges on bicycle or pedestrian rights-of-way and forces them into the vehicle lanes of the roadway. FAIRFAX BICYCLE AND PEDESTRIAN MASTER PLAN 3 FEBRUARY 2008 FINAL PLAN
34 2. Undertake regular periodic maintenance of bicycle and pedestrian facilities such as striping, signing and surface condition to avoid safety issues for users including integrating into the existing Public Works maintenance process a regular inspection of the road, pathway or sidewalk for cracks and potholes that might affect cyclists and pedestrians. 3. Ensure that repair or construction of any transportation facility minimizes disruption to the cycling and walking environment and that safe, direct alternate routes clear of vegetation, debris or other safety hazards are signed for bicycling and walking through or around construction zones for the duration of the project. The alternate route should be clearly signed and communicated prior to start of construction, with signs notifying motorists of the presence of bicycles and/or pedestrians in the area. All projects by outside agencies should be coordinated with the Town to ensure compliance with this policy. 4. Ensure that repair or construction of any transportation facility does not result in the permanent removal of an existing bicycle or pedestrian facility. 5. Ensure that the pedestrian walkway network is accessible to, and usable by, persons with disabilities as technically feasible, in compliance with ADA requirements. 6. Enforce existing Town ordinances to ensure pedestrian walkways are unobstructed by illegally parked cars. OBJECTIVE E Provide short- and long-term bicycle parking and end-of-trip facilities in employment and commercial areas, in multifamily housing, at schools, and at transit facilities. Objective E Policy Actions: 1. Require bicycle parking spaces as part of new development or redevelopment projects. 2. Encourage the installation of short- and long-term bicycle parking in the public right-of-way in the Downtown area. 3. Work with local elementary, middle, and high schools to promote bicycle commuting and to assist in purchasing and siting long- and short-term bicycle parking. 4. Require the provision of bicycle parking at all Town-permitted large events to help ease traffic and parking. 5. Pursue the development of a bicycle station for use by recreational and transportation riders with showers, lockers and secure storage, to encourage visitors to remain in town and patronize local businesses. OBJECTIVE F Develop and implement safety, education and encouragement plans aimed at youth, adult cyclists, pedestrians, and motorists. Objective F Policy Actions 1. Develop and expand adult and youth bicycle and pedestrian education, encouragement and safety programs, particularly Share the Road programs aimed at reducing cyclist-motorist conflicts (see Section Five). 2. Promote the health and environmental benefits of walking and bicycling. FAIRFAX BICYCLE AND PEDESTRIAN MASTER PLAN 4 FEBRUARY 2008 FINAL PLAN
35 2.2. PLANNING CONTEXT The following section provides context for this plan update in terms of past and ongoing planning efforts related to bicycling and walking. Infrastructure projects mentioned here are addressed in more detail in Sections 5 and 6 of this plan. COMPLIANCE WITH LOCAL PLANS The 2007 Fairfax Bicycle and Pedestrian Master Plan is consistent with the 1989 Fairfax General Plan Circulation Element, the 2001 Marin County Unincorporated Bicycle and Pedestrian Master Plan, and the Metropolitan Transportation Commission s (MTC) 2001 Regional Bicycle and Pedestrian Plan for the San Francisco Bay Area. SAFE ROUTES TO SCHOOLS INFRASTRUCTURE PLANS The Town of Fairfax, in partnership with TAM s SR2S Program, the Ross Valley SR2S Task force and local volunteers have secured Measure A Safe Pathways funding and Office of Traffic Safety funds for several school access projects: Glen Drive/Mitchell Drive at Sir Francis Drake Crosswalk Improvements: This project proposes to install high visibility crosswalk and additional school warning lights on Sir Francis Drake Boulevard and provide signage and striping on Glen Drive at Mitchell Drive. Manor Drive Sidewalk: This project will install 125 feet of sidewalk along the east side of Oak Manor Drive beginning at Sir Francis Drake Boulevard, providing a connection to the school campus. Oak Tree Lane Crosswalk and Enhancements: This project proposes to install a new crosswalk on Sir Francis Drake Boulevard at Oak Tree Lane, connecting to the new Manor Bridge. Originally planned to include in-pavement flashing crosswalk lighted, the crosswalk was redesigned to potentially include an actuated overhead flashing signal beacon similar to the crosswalk at St. Rita s School. NONMOTORTORIZED TRANSPORTATION PILOT PROGRAM Marin County is one of four communities nationally that has been selected by Congress to participate in a Nonmotorized Transportation Pilot Program and receive $25 million for improvements for walking and bicycling to demonstrate the impact that walking and bicycling can have on transportation mode share. Several Fairfax projects have been funded by this program, including: Parkade Improvements Study ($25,000): This study proposes to examine the area surrounding the downtown Parkade area in Fairfax in terms of improving bicycle and pedestrian safety and circulation. The Fairfax BPAC has identified the segment of Sir Francis Drake Boulevard between Klaus and Pacheco as an important area for improvements for bicycling and walking. San Rafael-Fairfax Corridor Study ($150,000): This study proposes to examine the corridor between Fairfax and San Rafael, with the goal of identifying improvements for bicycling and walking between the communities of Fairfax, San Anselmo and San Rafael. As a part of the FAIRFAX BICYCLE AND PEDESTRIAN MASTER PLAN 5 FEBRUARY 2008 FINAL PLAN
36 bicycle plan update process, all updated plans along the corridor are being coordinated to set the stage for this study. The current Fairfax bicycle plan update contains a number of preliminary options for the connection to San Anselmo which would need to be examined in more detail through this process. Pastori Avenue Sidewalk Construction ($50,000): This project proposes to build new sidewalk and crosswalk improvements along the segment of Pastori Avenue between Center Boulevard and Sir Francis Drake to provide connections to the bus stop on Sir Francis Drake Boulevard. Sir Francis Drake Sidewalk Construction ($80,000): This project proposes to build new sidewalk along the south side of Sir Francis Drake Boulevard between Claus Drive and Olema Road, connecting to existing sidewalks west of Olema Road recently constructed as part of a Safe Routes to Schools project. STEPS, LANES AND PATHS Steps, Lanes and Paths is a project that a number of Marin communities have undertaken in order to address the need for pedestrian connections in areas that are not easily served by conventional sidewalk networks. Challenges such as limited right of way, steep grades and narrow roads have made it difficult to connect residential neighborhoods to the downtown areas in many Marin cities and towns. Fairfax Volunteers have begun a project to address this challenge by documenting unused existing and potential historic pedestrian rights-of-way in the town. This important project would help the Town achieve one of its pedestrian objectives to connect neighborhoods more directly to the downtown area, but faces significant challenges. Many of the potential rights-of-way were established decades ago at the time of laying out the parcel property lines and were never officially adopted or maintained by the Town. The exact condition and legal status of some of the rights-of-way is not known and many of these rights-of-way may currently be in use by adjacent property owners who are not aware of their history or status. Adoption of these rights-of-way by the Town could constitute a significant maintenance burden and the issue of ADA access would have to be resolved. The Town, in partnership with local volunteers, would need to address these challenges as the project moves forward. Currently, as these rights-of-way connection both to the downtown area as well as to open space, they are bring treated as recreational trails and not as transportation facilities. The Town hopes to resolve both ADA and liability issues through this recreational trail classification. Please see Appendix D for an inventory of these rights-of-way. CENTER BOULEVARD PROJECT The Town of Fairfax has received funding to rehabilitate the segment of Center Boulevard between Pastori Avenue and Pacheco Avenue. The project proposes a number of bicycle and pedestrian improvements such as new and wider sidewalks, curb extensions, new and improved crosswalks, driveway consolidation, repaving the roadway surface, bicycle lanes, intersection treatments for bicycle safety such as carrying the bicycle lane through the intersection and improved lighting BTA COMPLIANCE CHECKLIST In order to meet the California Bicycle-Transportation Act requirements, the 2007 Fairfax Bicycle and Pedestrian Master Plan must include the following provisions: FAIRFAX BICYCLE AND PEDESTRIAN MASTER PLAN 6 FEBRUARY 2008 FINAL PLAN
37 BTA (a) (b) Table 2-1 Fairfax BTA Compliance Checklist Required Plan Elements The estimated number of existing bicycle commuters in the plan area and the estimated increase in the number of bicycle commuters resulting from implementation of the plan. A map and description of existing and proposed land use and settlement patterns which shall include, but not be limited to, locations of residential neighborhoods, schools, shopping centers, Location Within the Plan Table 4-1; page 22. Table 4-2; page 23. Figure 4-1; page 21. public buildings, and major employment centers. (c) A map and description of existing and proposed bikeways. Figure 3-1; page 9. Figure 5-1; page 33. Tables 3-1 through 3-4 pages 11 and 12. Tables 5-1, through 5-4; pages Text, pages 7-13, 29 and 30. (d) (e) (f) (g) (h) (i) (j) (k) A map and description of existing and proposed end-of-trip bicycle parking facilities. These shall include, but not be limited to, parking at schools, shopping centers, public buildings, and major employment centers. A map and description of existing and proposed bicycle transport and parking facilities for connections with and use of other transportation modes. These shall include, but not be limited to, parking facilities at transit stops, rail and transit terminals. A map and description of existing and proposed facilities for changing and storing clothes and equipment. These shall include, but not be limited to, locker, restroom, and shower facilities near bicycle parking facilities. A description of bicycle safety and education programs conducted in the area included within the plan, efforts by the law enforcement agency having primary traffic law enforcement responsibility in the area to enforce provisions of the Vehicle Code. A description of the extent of citizen and community involvement in development of the plan. A description of how the bicycle transportation plan has been coordinated and is consistent with other local or regional transportation, air quality, or energy conservation plans. A description of the projects proposed in the plan and a listing of their priorities for implementation. A description of past expenditures for bicycle facilities and future financial needs for projects that improve safety and convenience for bicycle commuters in the plan area. 3. EXISTING CONDITIONS Figure 3-1, page 9. Figure 5-1, page 33. Table 6-4, page 53. Text, pages 13 and 29 and 30. Figure 3-1, page 9. Figure 5-1, page 33. Table 6-4, page 53. Text, pages 13 and 29. Figure 3-1, page 9. Figure 5-1, page 33. Text, pages 13, and 30. Text, pages Text, page 1. Text, pages 4-7. Text, pages Table 3-5, page 15. Tables 6-1 through 6-5, pages In the years since the adoption of the 2001 Fairfax Bicycle and Pedestrian Master Plan, significant progress has been made in improving conditions for bicycling and walking. This section of the plan describes the existing conditions in Fairfax in terms of bikeways, bicycle parking and pedestrian facilities as well as education, encouragement and enforcement activities. The bicycle map which accompanies this Plan designates Fairfax s bicycle facilities and those in adjacent unincorporated areas by Class I, II, or III in accordance with Chapter 1000 of the FAIRFAX BICYCLE AND PEDESTRIAN MASTER PLAN 7 FEBRUARY 2008 FINAL PLAN
38 California Department of Transportation, Highway Design Manual Bikeway Planning and Design. Class I Bikeways serve the exclusive use of bicycles and pedestrians. Class II Bikeways serve as a designated space for bicycles to operate on established lanes on paved streets. Class III Bikeways serve bicycles on streets which serve as routes connecting Class I or Class II bikeways or where bicycle lanes or paths are not feasible EXISTING CONDITIONS FOR BICYCLING DEFINITION OF BIKEWAYS The three types of bikeways identified by Caltrans in Chapter 1000 of the Highway Design Manual are as follows. Class I Bikeway. Typically called a bike path, a Class I bikeway provides bicycle travel on a paved right-of-way completely separated from any street or highway. Class II Bikeway. Often referred to as a bike lane, a Class II bikeway provides a striped and stenciled lane for one-way travel on a street or highway. Class III Bikeway. Generally referred to as a bike route, a Class III bikeway provides for shared use with motor vehicle traffic and is identified only by signing. Optional Shared Roadway Bicycle Marking pavement stencils are also available for use on Class III bikeways. It is important to note that bicycles are permitted on all roads in the State of California and in Fairfax (with the exception of access-controlled freeways). As such, Fairfax s entire street network is effectively the Town s bicycle network, regardless of whether or not a bikeway stripe, stencil, or sign is present on a given street. The designation of certain roads as Class II or III bicycle facilities is not intended to imply that these are the only roadways intended for bicycle use. Rather, the designation of a network of Class II and III on-street bikeways recognizes that certain roadways are optimal bicycle routes, for reasons such as directness or access to significant destinations, and allows the Town of Fairfax to then focus resources on building out this primary network. Fairfax s existing network of designated bikeways is shown in Figure 3-1. Specific facility segments are discussed in more detail below. EXISTING BIKEWAY FACILITIES The town s existing bikeway system is composed of approximately 3.5 miles of Class I Multi-use Pathways, Class II Bicycle Lanes and Class III Bicycle Routes. The primary bicycling corridor serves the east-west route from the border with San Anselmo through downtown to the unincorporated area at the base of White s Hill. Table 3-1 provides a summary of existing bikeways. FAIRFAX BICYCLE AND PEDESTRIAN MASTER PLAN 8 FEBRUARY 2008 FINAL PLAN
39
40 Table 3-1 Existing Bikeway Mileage by Type Fairfax Existing Bicycle Facilities Class Bikeway Type Total Mileage I Multi-Use Path 0.18 II Striped Bicycle Lanes 1.38 III Signed Bicycle Routes 1.90 All Bikeways 3.42 There are three existing segments of Class I Pathway. A short segment of pathway traverses the Manor Bridge connecting Sir Francis Drake Boulevard to Bothin Road. Another short pathway serves as a cut-through connection between Mono Lane and Napa Avenue in downtown. The longest pathway connects Olema Road to Broadway Boulevard parallel to Sir Francis Drake Boulevard in front of the Fairfax Library. Table 3-2 Existing Pathways Inventory Existing Class 1 Bikeways - Multi-Use Paths (Off-Street) Segment Name Begin End Class Length Fairfax Library Pathway Olema Rd. Broadway Blvd. I 0.13 Manor Bridge Bothin Rd. Sir Francis Drake Blvd. I 0.03 Mono-Dominga Connector Mono Ln. Napa Ave. I The only existing Class II bicycle lanes are on Sir Francis Drake Boulevard between Claus Drive and Shadow Creek Court, with a short gap in the eastbound direction between Olema Road and Claus Drive. The relatively small number of streets with Class II bicycle lanes is explained by narrow roadway widths with a lack of opportunity for widening combined with overall heavy use of onstreet parking. Table 3-3 Existing Bicycle Lanes Inventory Existing Class 2 Bikeways - Striped Bicycle Lanes (On-Street) Segment Name Begin End Class Length Sir Francis Drake Blvd.* Claus Dr. Shadow Creek Ct. II *Westbound only from Claus to Manor. The majority of the Town s bikeways are signed Class III Bicycle Routes, which take advantage of direct routes along busier arterial or collector roadways. These routes were signed as a part of the County of Marin s Bicycle Route Guide Signage project to mark the countywide east-west route. Most local routes such as Bolinas Road and neighborhood streets which serve as de facto feeders into this countywide east-west route are currently unmarked. West of Claus Drive an alternate route FAIRFAX BICYCLE AND PEDESTRIAN MASTER PLAN 11 FEBRUARY 2008 FINAL PLAN
41 composed of signed Class III Bike Routes on residential streets was signed by the Town. This alternate route is commonly used by school children bicycling to school and recreational cyclists traveling through Fairfax to West Marin in addition to using existing Class II lanes on Sir Francis Drake Boulevard. Further, a commonly used route exists immediately outside the Fairfax town limit, connecting Kent Avenue to San Anselmo Schools along Butterfield via Sir Frances Drake and other neighborhood routes north of SFD. Table 3-4 Existing Bicycle Routes Inventory Existing Class 3 Bikeways - Signed Bicycle Routes (On-Street) Segment Name Begin End Class Length Azalea Ave. Scenic Rd. Broadway Blvd. III 0.02 Broadway Blvd. Sir Francis Drake Blvd. Pacheco Ave. III 0.40 Center Blvd. Pastori Ave. Pacheco Ave. III 0.26 Lansdale Ave. Fairfax Town Limit Center Boulevard III 0.16 Manor Rd. Olema Rd. Scenic Rd. III 0.13 Olema Rd. Sir Francis Drake Blvd. Sir Francis Drake Blvd. III 0.72 Scenic Rd. Manor Rd. Azalea Ave. III BIKEWAY SIGNAGE The County of Marin received $189,000 in grant funding to design and implement a Countywide Bicycle Route Guide Signage project in partnership with local jurisdictions. The goal of the project is to encourage commuting by bicycle through Marin and make recreational biking more attractive to the public. The signage provides cyclists with directions and destinations at key intersections, so that residents and visitors will be able to navigate more easily. The Marin Public Works Directors Association selected a uniform sign for the County which has a logo of Mount Tamalpais in the background. The guide signage is intended to complement the County's Share the Road signage program. The Town is committed to developing a link in the east-west bikeway route through Marin County, connecting Fairfax to San Anselmo and countywide destinations such as West Marin, Ross and San Rafael. Signs have been installed throughout the town along the primary countywide east-west route and overlay the local Class II and Class III facilities described above. These signs augment the existing system of green and white Caltrans D11-1 Bicycle Route signs already found along Broadway Avenue, Scenic Road, Manor Road and Olema Road. BICYCLE SUPPORT FACILITIES Bicycle support facilities include bicycle parking racks, lockers and changing facilities. Any facility that assists commuting or recreational cyclists to complete their journey is also considered a support facility. Within the Town of Fairfax bicycle parking is located throughout the downtown area along Broadway Avenue and at specific locations along Bolinas Road such as Town Hall and the Mono Parking Lot. Of the four schools located in town, both Manor Elementary and White Hill Middle School are known to have bicycle parking. See Figure 3-1 for bike parking locations. FAIRFAX BICYCLE AND PEDESTRIAN MASTER PLAN 12 FEBRUARY 2008 FINAL PLAN
42 On-street bicycle parking has been tested on Bolinas Road in front of the Book Beat Café for the weekends of May 19 and May 26, 2007 in place of existing on-street automobile parking. The trial was carried out on weekends and received favorable responses from residents and no known complaints to the Town. Temporary bicycle parking has been in use at the Wednesday Fairfax Farmers Market during the market season, using a moveable rack transported by volunteers. The Marin County Bicycle Coalition has loaned the town a temporary bicycle parking rack, used for both of these efforts. Currently there are no publicly accessible change or shower facilities, although such facilities may exist in private buildings. BICYCLE ACCESS TO TRANSIT Providing bicycle access to transit allows bicyclists to extend the distance they are able to travel, enabling cycling as a regional mode of travel. Fairfax residents have access to two transit services, Golden Gate Transit, serving San Francisco, Sonoma County, Southern, Central and Northern Marin (as well as Marin County Ferry Terminals) and the West Marin Stage which operates limited service to most West Marin communities and the San Anselmo hub and the San Rafael Transit Center. All local transit service in Marin County is operated under contract with the Marin County Transit District (MCTD). Most bus stops within the Town of Fairfax do not have bicycle racks located at the stops. The Parkade bus stop has bicycle racks with capacity for approximately 6 bicycles. In addition, up to two bicycles can fit on racks mounted to the front of all Golden Gate Transit buses less than 60 ft. long. GGBHTD has received funding to install new 3-bike capacity racks on the front of their buses. MCI type buses longer than 60 ft. were recently outfitted with luggage bay racks that allow two bicycles to ride in the underfloor luggage area. In addition, the MTCD has included an element in their long-range transit plan to upgrade all bus-mounted front bicycle racks from two to three capacity fixtures. BICYCLE LOOP DETECTORS Bicycle Loop Detectors (BLD) involve the installation or calibration of in-pavement induction loops so that they are sensitive to bicycles. BLDs use a unique Caltrans standard stencil to identify the best location for cyclists to position themselves to actuate a traffic signal. The Town of Fairfax has not installed bicycle loop detectors at any signalized intersections within the town. State legislation was passed in 2007 that will require the town to install such loop detectors if any new signals are installed or existing signals are improved. SHARE THE ROAD SIGNS The Town of Fairfax has yellow Share the Road bicycle warning signs posted at several locations throughout town, including on Bolinas Road at the start of the climb up to Pine Mountain and Center Boulevard at the eastern town limit. These signs are intended to increase motorist and cyclist awareness of the need to share narrow roadways with limited sightlines or potential safety concerns. FAIRFAX BICYCLE AND PEDESTRIAN MASTER PLAN 13 FEBRUARY 2008 FINAL PLAN
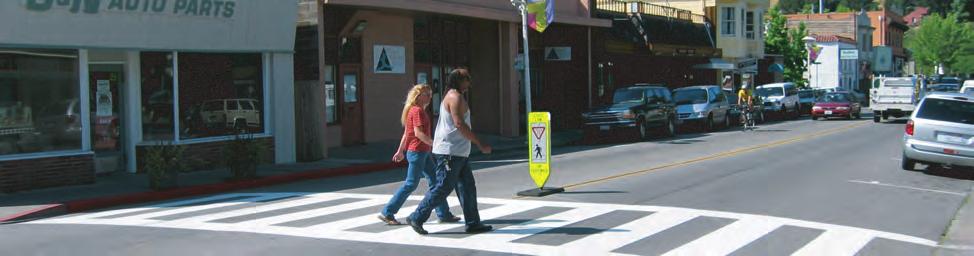
43 3.2. EXISTING CONDITIONS FOR WALKING DEFINITION OF PEDESTRIAN FACILITIES Generally, there are two types of pedestrian facilities, those intended for exclusive use by pedestrians, such as sidewalks, and those shared with other users (i.e. Class I Multi-use Pathways). In addition, in California sidewalks can be legally used by cyclists under the age of 12 unless otherwise signed or locally regulated. Pedestrian facilities at intersections can include crosswalks, pedestrian crosswalk signals, warning signage, curb ramps and other treatments to promote safety and accessibility for disabled users. The California Vehicle Code Section 275 defines a crosswalk as either: That portion of a roadway included within the prolongation or connection of the boundary lines of sidewalks at intersections where the intersecting roadways meet at approximately right angles, except the prolongation of such lines from an alley across a street. Any portion of a roadway distinctly indicated for pedestrian crossing by lines or other markings on the surface. At intersections, a crosswalk is effectively a legal extension of the sidewalk across the roadway. Crosswalks are present at all intersections, whether marked or unmarked, unless the pedestrian crossing is specifically prohibited by the local jurisdiction. At mid-block locations, crosswalks only exist if they are marked. Traffic control devices must follow the procedures set forth in the California version of the Manual of Uniform Traffic Control Devices (CAMUTCD), while elements such as sidewalks and curb cuts must comply with guidelines for implementing the federal Americans with Disabilities Act (ADA). EXISTING WALKWAYS Sidewalks are found on at least one side of the street throughout the downtown business district and on many adjacent residential streets. With the exception of most sidewalks within the Downtown area, many of these walkways do not meet ADA requirements for width, obstructions, tripping hazards or curb ramps. Sidewalks are generally lacking in the hillside neighborhood areas and along some of the smaller residential streets in the neighborhoods surrounding downtown. In addition, the Bicycle and Pedestrian Advisory Committee has identified a lack of direct pedestrian connections between residential neighborhood streets along potential property line rights-of-way that would allow more direct walking routes. The Town recently constructed new sidewalks along Sir Francis Drake Boulevard between Manor Road and Olema Road as part of a Safe Routes to Schools (SR2S) project. Two multi-use path segments serve pedestrians near the downtown area. The Mono-Dominga connector is a short cut-through that allows pedestrians to travel from downtown businesses along Broadway Avenue directly to Dominga Avenue residential area. The Library Pathway connects FAIRFAX BICYCLE AND PEDESTRIAN MASTER PLAN 14 FEBRUARY 2008 FINAL PLAN
44 the sidewalk along the south side of Sir Francis Drake Boulevard at Olema to existing sidewalks along Broadway Avenue and the crossing of Drake at St. Rita School. EXISTING CROSSWALK AND OTHER FACILITIES Pedestrian exposure at intersections directly affects safety, especially for older persons and children who may not be able to cross streets quickly or discern (or be seen by) on-coming traffic. Generally intersections in and around the downtown area have all crosswalks marked with either high-visibility ladder style crosswalks or traditional parallel stripes augmented by colored pavement treatments. In addition, a number of mid-block crossings are similarly marked along Broadway Avenue and Sir Francis Drake Boulevard. In-roadway pedestrian warning paddle signs are found at mid-block crossings of Broadway Avenue and one crossing on Bolinas Road. In addition to intersection conditions in the downtown area, a number of spot improvements have been implemented with the goal of improving pedestrian safety. The Manor Bridge SR2S project was installed as an alternate to the existing narrow bridge to provide a dedicated pedestrian connection to Sir Francis Drake Boulevard and the new sidewalk. At several locations throughout the residential areas curbs at intersections have been painted red to improve visibility through these corners DESCRIPTION OF PAST EXPENDITURES The following is a summary of bicycle and pedestrian facility projects constructed since the 2001 Bicycle and Pedestrian Master Plan. Table 3-5 Fairfax Past Expenditures Facility Description Cost Installation of a pedestrian and bicycle bridge and Manor Circle Bridge and Sir Francis Drake $637,537 sidewalks on south side of Sir Francis Drake Sidewalk (Manor Circle to Olema Road) Boulevard between new bridge and Olema Road. Sir Francis Drake Boulevard Sidewalk Improvements (Oak Manor to June Court) Sir Francis Drake Library/St. Rita Crosswalk Sir Francis Drake at Oak Manor Drive Crosswalk Sir Francis Drake at Robin Hood Apartments Crosswalk In-roadway Pedestrian Paddle Signs Downtown Bicycle Racks Phase I fed. grant; Phase II local Supervisorial grant This project was designed to install new sidewalks on Sir Francis Drake Boulevard (SFDB) from Oak Manor to June Court to eliminate gaps in the sidewalk network along SFDB Installation of high-visibility crosswalk and pushbutton-actuated, audible overhead flashing pedestrian crossing beacons 1998 Installation of high-visibility crosswalk and pushbutton-actuated, audible overhead flashing pedestrian crossing beacons 1998 Installation of high-visibility crosswalk and pushbutton-actuated, audible overhead flashing pedestrian crossing beacons Installation of pedestrian crosswalk warning signs in center of roadway at marked crosswalk locations Installation of inverted U style bicycle racks at specific locations along Broadway Avenue, Bolinas Road and in the Fairfax Parkade $198,685 $43,333 $43,333 $43,333 $800 $10,000 $ 2,000 FAIRFAX BICYCLE AND PEDESTRIAN MASTER PLAN 15 FEBRUARY 2008 FINAL PLAN
45 Share the Road Signage Installation of safety warning signs on Bolinas Road and Manor Road $ SAFETY, EDUCATION AND ENCOURAGEMENT PROGRAMS FAIRFAX POLICE DEPARTMENT The Fairfax Police Department conducts regular enforcement of bicycle violations of the vehicle code, particularly along the designated bike route on Broadway Boulevard and Lansdale Avenue. Since 2005 the Fairfax Police Department has partnered with the Marin County Bicycle Coalition to conduct Share the Road Checkpoints on an annual basis at selected locations in Fairfax. More information on the Share the Road program is below. SAFE ROUTES TO SCHOOLS The original Safe Routes to Schools program began in Fairfax as a pilot program in 2000 as an effort to reduce congestion and encourage healthy exercise and transportation habits among school aged children in Marin County. The program has since expanded to its current level, with 45 schools and over 18,470 students participating countywide. Since then, this program has been expanded to the national level. Each year, the program has successfully decreased the percentage of drive-alone students at participating schools through innovative classroom activities, contests and events, and initiation of engineering improvements. The program consists of five key components education, engineering, encouragement, enforcement, and evaluation which are described below. Education - Classroom lessons teach children the skills necessary to navigate through busy streets and show them how to be active participants in the program. Table 3-5 shows education programs completed in Fairfax Schools. Engineering - The Program s licensed traffic engineer works with schools and the Town in developing a plan to provide a safer environment for children to walk and bike to school. The focus is on creating physical improvements to the infrastructure surrounding the school, reducing speeds and establishing improved crosswalks and pathways. Encouragement - Events, contests and promotional materials are incentives that encourage children and parents to try walking and biking. Table 3-5 shows encouragement programs completed in Fairfax Schools. Enforcement Police officers, crossing guards and law enforcement officials participate throughout the Safe Routes process to encourage safer travel through the community. Targeted enforcement of speed limits and other traffic laws around schools make the trip to school more predictable for students. This plan also includes enforcement enhancements and outreach to drivers through driver safety campaigns. Evaluation Program participation is regularly monitored to determine the growth in student and parent participation. As detailed in Table 3-6 Manor Elementary, White Hill Middle and St. Rita Schools have participated in the program. A Safe Routes to Schools Task Force has been formed for the Ross Valley School District to create Safe Routes to Schools Travel Plans which include engineering FAIRFAX BICYCLE AND PEDESTRIAN MASTER PLAN 16 FEBRUARY 2008 FINAL PLAN
46 recommendations, enforcement, driver education programs and encouragement programs. Chapter 5 includes proposals for growing participation in the Safe Routes to Schools Program in Fairfax. SR2S infrastructure projects completed in Fairfax include the Manor Bridge and sidewalks on the south side of Sir Francis Drake Boulevard as well as the crossing of Sir Francis Drake Boulevard at St. Rita s School. Funded SR2S infrastructure plans include pedestrian and bicycle improvements at Sir Francis Drake Boulevard and Glen Drive near White Hill School and new sidewalk on the east side of Oak Manor Drive accessing Manor School. Funded improvements at Oak Tree Lane include a new crosswalk and the installation of an actuated overhead flashing beacon in early Other unfunded SR2S infrastructure plans include a proposal to build a multi-use pathway along the former railroad right-of-way west of White Hill School. Table 3-6 provides details about specific schools participation in Education and Encouragement components of the TAM SR2S program. OTHER SAFETY PROGRAMS The Fairfax Police Department participates in the Marin County Bicycle Coalition s Share the Road Campaign. The campaign includes three components: checkpoints, basic street skills classes, and public presentations. At checkpoints, uniformed police, highway patrol officers and volunteers from the bicycle coalition stop vehicles, cyclists and pedestrians and provide them with share the road flyers. Flyers contain California Vehicle Code information, codes of conduct for bicyclists and motorists, and additional safety tips to prevent road rage. Fairfax hosted checkpoints in 2005 and Basic Street Skills Classes are provided free of charge by the Marin County Bicycle Coalition. Classes provide information on how to avoid collisions and citations, how to ride safely, improve visibility and the legal rights of cyclists. Cyclists who have received a bicycle violation may attend this class to reduce their fine to $50. The Marin County Bicycle Coalition also provides a Share the Road presentation for the public. The presentation is available by request, and includes information on the rights and responsibilities of cyclists and drivers and focuses on ways each group can behave courteously to avoid collisions. OTHER PROMOTIONAL AND ENCOURAGEMENT EFFORTS Residents of the Town of Fairfax have undertaken a variety of past promotion and encouragement efforts. Velo Club Fairfax and the Fairfax Chamber of Commerce have created Biketoberfest at the Fair Anselm Plaza, with the assistance of the Marin County Bicycle Coalition (MCBC) and Safe Routes to Schools. This event has been superseded by the Fairfax Fat Tire Festival in Peri Park, followed by a mountain bike race at Camp Tamarancho the next day. This event takes place in May. Film Night in the Park has held two shows in conjunction with the old location of the Fairfax Fat Tire Fest at the Fairfax ball field. The MCBC provided its first valet bike parking at the Fairfax Brewfest (held annually in March) and currently serves the Fairfax Festival for its two days in June. MCBC has supported the effort to bring bicycle parking to the Fairfax Farmers Market by providing a temporary rack for use in the park at this event. The White Hill Parent Club has hosted the Lion of Fairfax Cyclocross at White Hill School in September and a group of parents have plans to create a bicycle facility, including a BMX track, at the school. As of this writing, the Fairfax Documentary Film Festival currently has plans to show the film Klunkers about the pioneers of mountain biking who staged the first race called FAIRFAX BICYCLE AND PEDESTRIAN MASTER PLAN 17 FEBRUARY 2008 FINAL PLAN
47 Repack in Fairfax, the cradle of mountain biking. Fairfax hosted the start and finish of a road race as well as a downtown criterium in past years, called the Tour of Marin, which could be resurrected with sufficient funding and sponsorship. Saturday mornings at 9 am see the Java Hut riders leave town for rides to West Marin as well as a variety of formal and informal cycling clubs and teams host road and mountain bike rides departing from various locations in Fairfax, also primarily on weekend days. FAIRFAX BICYCLE AND PEDESTRIAN MASTER PLAN 18 FEBRUARY 2008 FINAL PLAN
48 Table 3-5 Fairfax Safe Routes to School Education and Encouragement Programs Education Encouragement Participants CT FT CT CT FT FT TM CT CT CT CT EV TM SP CN CN WK Grades Enroll. SL& L WB HS JEO P Rode o OTB Clubs S.Art Yikes Earth Fam M IWA LK W2S D SP W&B A FRM WA TF Ross Valley Manor K X X X X X X X X X X X X White Hill 8-Jun 625 X X X X Private St. Rita K X X X X X X X Key: X - Completed This Month X- Previously Completed Education: SL&L - Stop Look and Listen; WB - Walk Around the Block; HS - Helmet Safety; Jeop - Jeopardy; Rodeo - Bicycle Rodeo; OTB - On the Bike (Middle School), Clubs - EcoVelocity Clubs; S. Art - Safety Art; Yikes - Assembly; W2SD - Parade Prep; Earth - Earth Day Classes; Fam M - Family Management; NR - Neighborhood Rides Encouragement: Iwalk - International Walk to School Day, W2SD - Walk to School Days; SP - SchoolPool; W&BA - Walk and Bike Across America; FRM - Frequent Rider Miles Contest Notes: On the bike can only be offered to 2-3 schools this year. Family Maintenance Clinics and Neighborhood Rides are new, so it is difficult to gauge who will use them this year. FAIRFAX BICYCLE AND PEDESTRIAN MASTER PLAN FEBRUARY 2008 FINAL PLAN 19
49 4. NEEDS ANALYSIS 4.1. LAND USE AND DEMAND FOR BICYCLING The demand for bicycle facilities can be difficult to predict. Unlike automobile use, where historical trip generation studies and traffic counts allow one to estimate future demand for travel, bicycle trip generation methods are less advanced and standardized. Land use patterns can help predict demand and are important to bikeways planning because changes in land use (and particularly employment areas) will affect average commute distance, which in turn affects the attractiveness of bicycling as a commute mode. Figure 4-1, the land use map from the Fairfax General Plan, is included on the next page. The Fairfax bikeways network will connect the neighborhoods where people live to the places they work, shop, engage in recreation, or go to school. An emphasis will be placed on regional bikeways and transit connections centered on the major activity centers in Fairfax, including: Downtown commercial district Civic buildings such as the Town Hall and Library Schools The Parkade bus stops Neighborhood parks and regional recreational areas Shopping centers Employment centers Regional recreation areas (e.g. Mt. Tamalpais, Camp Tamarancho) 4.2. SETTLEMENT PATTERNS AND DESTINATIONS Fairfax s development has been determined in large part by the history of rail transport in the Ross Valley. The Northwestern Pacific Railway lines which formerly connected the Hub in San Anselmo to downtown Fairfax and West Marin encouraged neighborhoods within walking distance of the former train station in downtown. When the train tracks were removed in the 1940 s, new roads were placed on the train beds, creating the existing arterial road system including Center Boulevard. After WWII with the expansion of the private automobile, Fairfax grew away from its original dense settlement pattern around the downtown area, creating a variety of neighborhoods in the hilly areas of town which were less accessible by walking or bicycling. The people of Fairfax commute to three major employment centers: San Francisco, San Rafael and businesses within Fairfax. Most get to their Marin County jobs by car and some by bus or bicycle. Fairfax area and Ross Valley school destinations include Oak Manor, Whites Hill, St. Rita, the College of Marin in nearby Kentfield, and Dominican University in San Rafael. FAIRFAX BICYCLE AND PEDESTRIAN MASTER PLAN 20 FEBRUARY 2008 FINAL PLAN

50 Figure 4-1 DRAFT Fairfax General Plan Land Use Map FAIRFAX BICYCLE AND PEDESTRIAN MASTER PLAN 21 FEBRUARY 2008 FINAL PLAN
51 4.3. COMMUTE PATTERNS A central focus of presenting commute information is to identify the current mode split of people that travel in Fairfax. Mode split refers to the choice of transportation a person selects to reach their destinations, be it walking, bicycling, taking a bus, or driving. One major objective of any bicycle facility improvement is to increase the percentage of people who choose to bike rather than drive or be driven. Every saved vehicle trip or vehicle mile represents quantifiable reductions in air pollution and can help in lessening automobile traffic congestion. Journey to work and travel time to work data were obtained from the 2000 US Census for Fairfax, Marin County, California, and the United States. Primary mode of journey to work data is shown in Table 4-1. Table 4-1 Fairfax Commute Mode Split Compared to the State and Nation Mode Nationwide Statewide Marin County Fairfax Bicycle 0.4% 0.9% 1.1% 2.6% Walk 3.0% 3.0% 3.3% 1.5% Public Transit 4.9% 5.3% 11.1% 9.6% Drove Alone 78.2% 74.7% 71.8% 73.9% Carpool 12.6% 15.1% 11.8% 11.9% Other 0.5% 1.1% 0.6% 0.4% Data from US Census 2000 As shown, about 2.6% of all employed Fairfax residents commute primarily by bicycle. Census data do not include the number of people who bicycle for recreation or for utilitarian purposes, students who bicycle to school, and bicycle commuters who travel from outside Fairfax, and are therefore likely to undercount true cycling rates. Recreational cycling is especially popular in Fairfax, with its easy access to popular recreational routes in West Marin and other areas. Comparatively, Fairfax s rate of commute cycling is high over twice that of Marin County as a whole and there are many possibilities for improving it. Statistics from the recent County Pilot Program counts indicate that the growth in bicycling in Fairfax was one of the highest in all of Marin County. Broadway Avenue at Bolinas Road showed a 298% increase in weekend day peak hour bicycling between 1999 and 2007 (from 42 to 167 bicyclists), possibly due to the increasing popularity of mountain biking in the area. Fairfax was one of the top places in Marin County with the highest volume of combined bicycle and pedestrian activity (Broadway/Bolinas, 700 people). Fairfax has a very high percentage of commuters who take public transit to work 9.6%, compared with 5.3% for the state. Systemwide, two percent of Golden Gate Transit riders arrive at bus stops by bicycle. 1 If bicycle connections to Golden Gate Transit stops are improved, and especially if these connections are coupled with improved bicycle storage and expanded service, it would be possible to shift some vehicle trips to the bus stops into bicycle trips. 1 Marin County Transit District. Marin County Transit Short Range Transit Plan. March FAIRFAX BICYCLE AND PEDESTRIAN MASTER PLAN 22 FEBRUARY 2008 FINAL PLAN
52 POTENTIAL FUTURE AIR QUALITY IMPROVEMENTS Fairfax lies within the San Francisco Bay Area Basin, which is regulated by the Bay Area Air Quality Management District (BAAQMD). According to the California Air Resources Board, as of July 2005, the air quality in the San Francisco Bay Area Basin did not meet the minimum State healthbased standards for one-hour concentrations ground-level ozone and the State standards for Particulate Matter (PM10) and Fine Particulate Matter (PM2.5). 2 Currently, the Basin is classified as marginal non-attainment area for the Federal 8-hour ozone standard. According to the BAAQMD, motor vehicles are responsible for approximately 75 percent of the smog in the Bay Area. Reducing vehicle miles traveled (VMTs) is a key goal of the BAAQMD, and fully implementing Fairfax s bicycle network may help achieve this goal by providing residents improved options for getting to work, school, or shopping without relying on motor vehicles. Based on data from the 2000 Census and estimates of bicycle mode share for students, the current number of daily bicycle commuters (adjusted to include travel to work, to school and to transit trips) in Fairfax is estimated to be 258 riders, making 516 daily trips and saving an estimated 1,114 VMTs per weekday. Table 4-2 quantifies the estimated reduction in VMTs in Fairfax following an increase in the adjusted bicycle mode share to 5.2%, and the estimated reduction in air pollutants based on the best available local and national data. It is conservatively estimated that the total number of work and school commuters could increase from the current estimate of 258 to 268. This would result in an estimated decrease of 5 kg/day of HC, 38 kg/day of CO, 3 kg/day of NOX and 198,070 kg/day of CO2. This improvement in air quality could be greater if improving conditions for bicyclists attracts bicyclists to the Town whose trips originate outside of Fairfax. Fairfax s mild climate and rising fuel costs will also encourage additional cycling as more attractive routes and gap closures are accomplished. Table 4-2 Bicycle Commute and Air Quality Projections Current Commuting Statistics Source Fairfax Population 7, US Census Number of Commuters 3, US Census (Employed persons minus those working at home) Number of Bicycle-to-Work US Census Commuters Bicycle-to-Work Mode Share 2.57% Mode share percentage of Bicycle to Work Commuters School Children Grades K US Census, population ages 5-14 Estimated School Bicycle Commuters Number of College Students US Census Estimated College Bicycle Commuters 100 Ross Valley SR2S Task Force school bicycle commuter counts at White Hill and Manor Schools. 22 National Bicycling & Walking Study, FHWA, Case Study No. 1, Review of bicycle commute share in seven university communities (5%) 2 BAAQMD. Ambient Air Quality Standards & Bay Area Attainment Status. Last updated July 15, < FAIRFAX BICYCLE AND PEDESTRIAN MASTER PLAN 23 FEBRUARY 2008 FINAL PLAN
53 Average Weekday Golden Gate Ridership Estimated Number of Daily Bike- Golden Gate Transit Users Estimated Total Number of Bicycle Commuters and Utilitarian Riders 1,845 Average of weekday system wide Golden Gate Transit boardings on Bus Routes serving Fairfax (Routes:)Marin Transit Data Request 37 GGT Existing Conditions System Levels Analysis Report 2005, Page Total of bike-to-work, transit, school, college and utilitarian bicycle commuters Does not include recreation. Estimated Adjusted Mode Share 5.2% Estimated Bicycle Commuters divided by work and school travelers Estimated Current Bicycle Trips Total Daily Bicycle Trips 516 Total bicycle commuters x 2 (for round trips) plus total number of utilitarian bicycle trips Reduced Vehicle Trips per Weekday 337 Assumes 73% of bicycle trips replace vehicle trips for adults/college students and 53% for school children Reduced Vehicle Miles per Weekday 1,114 Assumes average one-way trip travel length of 4.6 miles for adults/college students and 0.5 mile for schoolchildren Potential Future Bicycle Commuters Number of workers with commutes nine minutes or less 256 US Census 2000 Number of workers who already bicycle or walk to work Number of potential bicycle commuters 158 US Census Calculated by subtracting number of workers who already bicycle or walk from the number of workers who have commutes 9 minutes or less Future number of new bicycle 10 Based on capture rate goal of 10% of potential bicycle riders commuters Total Future Daily Bicycle 268 Current daily bicycle commuters plus future bicycle commuters Commuters Future Total Daily Bicycle Trips 536 Total bicycle commuters x 2 (for round trips) Future Reduced Vehicle Trips per 391 Assumes 73% of bicycle trips replace vehicle trips Weekday Future Reduced Vehicle Miles per Weekday 1,799 Assumes average one-way trip travel length of 4.6 miles for adults. Assumes 12 mph average bicycle speed; 23 minute average travel time. Travel time data from NHTS 2001 Trends, Table 26. Future Reduced Vehicle Miles per Year Future Air Quality Benefits 476, weekdays per year Reduced HC (kg/weekday) 5 ( kg/mile) Reduced CO (kg/weekday) 38 ( kg/mile) Reduced NOX (kg/weekday) 3 ( kg/mile) Reduced CO2 (kg/weekday) 198,070 (.4155 kg/mile) Reduced HC (metric tons/year) kg per metric ton; 256 weekdays/year Reduced CO (metric tons/year) kg per metric ton; 256 weekdays/year Reduced NOX (metric tons/year) kg per metric ton; 256 weekdays/year Reduced CO2 (metric tons/year) 50, kg per metric ton; 256 weekdays/year Emissions rates from EPA report 420-F "Emission Facts: Average Annual Emissions and Fuel Consumption for Passenger Cars and Light Trucks." FAIRFAX BICYCLE AND PEDESTRIAN MASTER PLAN 24 FEBRUARY 2008 FINAL PLAN
54 5. PROPOSED IMPROVEMENTS This section provides information about the proposed improvements for bicycling and walking in the Town of Fairfax including both physical improvements (bike paths, lanes, routes, bike parking, walkways, crossing improvements) and education, enforcement and encouragement programs (e.g. Safe Routes to Schools). As shown in the preceding Existing Conditions chapter, Fairfax s current walkway and bikeway system provides opportunities for nonmotorized travel through a network of sidewalks and on-street Class II bicycle lanes and III bicycle routes. However, significant gaps remain in the bikeway system which are critical to providing good connectivity for cyclists riding both within the Town of Fairfax and attempting to travel to neighboring communities. The connections from residential areas to schools and from the town to West Marin and San Anselmo still present significant obstacles to cyclists. Improvements in pedestrian circulation are also needed to increase access from neighborhood areas to downtown and schools as well as encourage safe walking throughout the town. As described in the 2001 Bicycle and Pedestrian Master Plan, the vision for Fairfax is the construction of bikeways and walkways suitable for all users, connecting to commercial, residential, recreational and school destinations. The short-term vision for bicycling includes completing and improving existing bicycle routes and lanes, signing and stenciling proposed routes, installing parking and implementing programs. For pedestrians, the short-term vision is to maintain and improve existing walkways and crosswalks. The long-term vision for bicycling and walking in the town calls for completing the east-west bikeway and implementing a series of traffic-calmed neighborhood streets which will prioritize safety for all roadway users and improve conditions for both pedestrians and bicyclists. Detailed priorities for implementation are listed in Chapter 6. Table 5-1 Summary of Proposed Bikeways Fairfax Proposed Bicycle Facilities Class Bikeway Type Total Mileage I Multi-Use Path 0.18 II Striped Bicycle Lanes 0.89 III Signed Bicycle Routes 6.17 All Bikeways BICYCLE FACILITY IMPROVEMENTS PROPOSED CLASS I MULTI-USE PATHWAY As noted in the Existing Conditions, Fairfax s current bikeway system is composed primarily of Class II and III bicycle routes. The current update proposes one new Class I Pathway at the east end of town, parallel to Center Boulevard. This path segment is proposed as a part of a long-term option for connecting San Anselmo and Fairfax which was originally part of the 2001 San Anselmo Bicycle FAIRFAX BICYCLE AND PEDESTRIAN MASTER PLAN 25 FEBRUARY 2008 FINAL PLAN
55 Master Plan. Due to significant construction challenges, this pathway is included in the plan primarily as an option for further study as a part of the San Rafael-Fairfax Corridor study. In addition to this pathway, a bicycle and pedestrian bridge is proposed connecting Hawthorne Court and Sir Francis Drake Boulevard to provide a connection to Manor School. This bridge would be similar in design to the recently installed Manor Circle Bridge. The small number of proposed pathways should be understood in terms of the lack of public rightof-way for such projects. Segment details can be found in Table 5-2. Table 5-2 Proposed Class I Facilities Class I Facilities - Multi-Use Paths (Off-Street) Segment Name End Class Length Center Blvd. Sidepath Pastori Ave. Fairfax Town Limit I 0.16 Hawthorne Ct. Bridge Hawthorne Ct. Sir Francis Drake Blvd. I (bridge) PROPOSED CLASS II STRIPED BICYCLE LANES Proposed bicycle lanes in Fairfax are intended primarily to complete gaps in the east-west bikeway as well as improving local access to businesses and promoting shop-by-bike and access to transit at the Parkade. Center Boulevard (Town limit to Pastori): This bicycle lane segment is proposed as a part of a long-term option for connecting San Anselmo and Fairfax which was originally part of the 2001 San Anselmo Bicycle Master Plan. Due to significant construction challenges, this bike lane is included in the plan primarily as an option for further study as a part of the San Rafael-Fairfax Corridor study. Center Boulevard (Pastori to Pacheco): Bicycle lanes proposed as a part of the current Center Boulevard Reconstruction Project, including bicycle lane treatments through intersections at Center/Pastori and Center/Pacheco. Broadway Avenue (Pacheco to Claus): Bicycle lanes are proposed to close the gap through the main downtown area. On-street parking can be retained, although two travel lanes will need to be reduced to 11 in width. It is recommended that the westbound curb lane be maintained at 12 to accommodate bus traffic. Sir Francis Drake Boulevard (eastbound only, Claus to Olema): This challenging segment proposes to complete the Sir Francis Drake Bicycle Lanes in both directions west of Claus Drive. Due to the narrow roadway in this area, road widening and additional paved shoulders will be necessary. The needs of bicycles and pedestrians will need to be balanced in this area as the Town has already received Nonmotorized Transportation Pilot Program funding for a sidewalk parallel to this segment. As with Class I Pathways, the small number of proposed bicycle lanes throughout the Town should be understood in terms of the lack of public right-of-way for road widening and the challenge of removing on-street parking in heavily used areas. Segment details can be found in Table 5-3. FAIRFAX BICYCLE AND PEDESTRIAN MASTER PLAN 26 FEBRUARY 2008 FINAL PLAN
56 Table 5-3 Proposed Class II Facilities Class II Facilities - Striped Bicycle Lanes (On Street) Segment Name End Class Length Center Blvd. Fairfax Town Limit Pastori Ave. II 0.17 Center Blvd. Pastori Ave. Pacheco Ave. II 0.26 Broadway Ave. Pacheco Ave. Claus Dr. II 0.13 Sir Francis Drake Blvd. (eastbound) Olema Rd. Claus Dr. II PROPOSED CLASS III SIGNED BICYCLE ROUTES Proposed bicycle routes in Fairfax are intended to expand the existing east-west bikeway system, creating direct connections to and through neighborhoods and to schools, parks and other destinations, providing alternate routes to busier streets and adding alternate connections to neighboring communities. The minimum treatment for these routes would be standard Bicycle Route signage. Segment details for Class III Signed Bicycle Routes can be found in Table 5-4. NEIGHBORHOOD AND SCHOOL ACCESS ROUTES In other Bay Area communities the idea of Bicycle Boulevards has been advanced as a way to designate certain routes as priority streets for bicycling. The viability of bicycle boulevards depends on a number of factors. One key factor is the availability of multiple duplicative parallel routes which in most cases allow drivers to reach their destinations while avoiding the Bicycle Boulevard. Due to its lack of a multiple parallel streets on a grid system, Fairfax is not really a candidate for a conventional Bicycle Boulevard treatment. However, the Town does have an excellent system of connected collector and neighborhood streets surrounding the downtown area that provide access to commercial and school destinations, serve as a downtown detour and in some cases parallel the main arterial routes. It is recommended that some of these neighborhood and school access routes be designated for additional safety improvements that would give priority to bicycle and pedestrian users. For all segments, existing bicycle route signage would be retained. Potential improvements for these segments include: Shared Roadway Bicycle Markings Curb Extensions or Bulbouts Share the Road signs Other safety signage Stop sign removal Speed humps Additional traffic controls FAIRFAX BICYCLE AND PEDESTRIAN MASTER PLAN 27 FEBRUARY 2008 FINAL PLAN
57 In addition to changes to the roadway geometry traffic control strategies, such as restricting turns are a potential strategy for improving pedestrian and bicycle safety during peak hours. The BPAC has identified a no right turn restriction between 7 a.m. and 9 a.m. Monday-Friday from Sir Francis Drake Boulevard onto both Azalea Avenue and Broadway Avenue as an example of this treatment. Table 5-4 provides more information about which specific segments are recommended for additional treatments. Further study of all segments would be necessary before deciding on specific traffic calming devices. Additional design guidance for traffic calmed streets is provided in Appendices A and B. A prioritized, phased approach to these improvements is detailed in Section 6. Table 5-4 Proposed Class III Facilities Class III Facilities - Signed Bicycle Routes (On-Street) Segment Name Begin End Class Length Belmont Ave. Kent Ave. Pastori Ave. III 0.06 Blackberry Ln. Creek Rd. Forrest Ave. III 0.04 Bolinas Rd. Broadway Blvd. Porteous Ave. III - Sharrows 0.48 Cascade Dr. Bolinas Rd. Canyon Rd. III - Shar/TrafCalm 0.94 Cascade Dr. Canyon Rd. Cascade Fire Road III - Sharrows 0.50 Claus Dr. Sir Francis Drake Blvd. Broadway Blvd. III - Sharrows 0.02 Creek Rd. Porteous Ave. Dominga Ave. III - Shar/TrafCalm 0.20 Dominga Ave. Creek Rd. Napa Ave. III - Shar/TrafCalm 0.25 Forrest Ave. Meernaa Ave. Fairfax Town Limit III 0.80 Glen Dr. Sir Francis Drake Fairfax Town Blvd. Limit III 0.46 Hill Ave. Ramona Ave. Kent Ave. III 0.11 Kent Ave. Belmont Ave. Sir Francis Drake Blvd.. III 0.09 Lansdale Ave. Center Blvd. Fairfax Town Limit III - Shar/TrafCalm 0.16 Manor Rd. Olema Rd. Olema Rd. III - Shar/TrafCalm 0.19 Manor Rd.* Olema Rd. Scenic Rd. III - Shar/TrafCalm 0.13 Napa Ave. Dominga Ave. Pacheco Ave. III - Shar/TrafCalm 0.06 Oak Manor Dr. Sir Francis Drake Manor Elem. Blvd. Sch. III 0.19 Pacheco Ave. Napa Ave. Center Blvd. III - Shar/TrafCalm 0.05 Park Rd. Spruce Rd. Bolinas Rd. III - Shar/TrafCalm 0.23 Pastori Ave. Sir Francis Drake Blvd. Center Blvd. III 0.05 Porteous Ave. Bolinas Rd. Meernaa Ave. III - Shar/TrafCalm 0.41 Rockridge Rd. Iron Springs Rd. Manor Rd. III 0.13 Scenic Rd.* Manor Rd. Azalea Ave. III - Shar/TrafCalm 0.20 Sequoia Rd. Scenic Rd. Spruce Rd. III - Shar/TrafCalm 0.19 Sherman St. Bolinas Rd. Dominga Ave. III 0.05 Spruce Ave. Sequoia Rd. Azalea Ave. III Shar/TrafCalm *Existing Class III signed bicycle route FAIRFAX BICYCLE AND PEDESTRIAN MASTER PLAN 28 FEBRUARY 2008 FINAL PLAN
58 BICYCLE PARKING AND END-OF-TRIP FACILITIES Bicycle parking includes standard bike racks, weather-protected bicycle parking, enclosed lockers, and secure corrals. In addition, due to lack of sidewalk space for bicycle rack placement the BPAC has recommended a trial installation of on-street bicycle parking areas which would take the place of unused red curb zone areas in the downtown area. Other end-of-trip facilities include showers and changing facilities. RECOMMENDATIONS Increase Public Bicycle Parking Facilities and Encourage Provision of Shower and Changing Facilities The Town should seek to continue to provide bike racks at public destinations, including major bus stops, community centers, libraries, parks, schools and commercial areas. All bicycle parking should be in a secure area, if possible. Employers should be encouraged to provide secure indoor parking, covered bicycle parking, or bicycle lockers. The following are potential new or improved locations for inverted-u or equivalent secure bicycle parking racks as determined through the BPAC process: North side of Sir Francis Drake Boulevard Businesses: Café Lotus Quality Liquors Peri s Deli Barefoot Cafe Fairfax Cyclery/IGA (locate on sidewalk between tree planters) Fairfax Theater Bev s Hair Design Fairfax Lumber 4 additional racks at other locations along Broadway Avenue In addition to the locations proposed above, the BPAC also requested racks on the sidewalk of the Fair-Anselm Shopping Plaza. However, because this location is on private property, it has been deferred pending discussion with the property owner. The following are proposed trial locations for inverted-u bicycle parking racks as determined through the BPAC process. Locations would use a free-standing rack with approximately a 12-bike capacity and would be separated from the adjacent parking spaces and travel lane by flexible plastic bollards mounted to the pavement. Grilly s (rack in red curb zone on Bolinas Road) Fairfax Scoop (rack adjacent to curb in unused area near diagonal parking) In addition to these two locations, the BPAC requested on-street parking in the red zone in front of Szechuan Chef and in the yellow loading zone in front of Ghiringhelli s Pizza. The former location was considered but noted that the red zone may exist to facilitate turns into Mono Lane from FAIRFAX BICYCLE AND PEDESTRIAN MASTER PLAN 29 FEBRUARY 2008 FINAL PLAN
59 Bolinas Road, which has narrow travel lanes. The latter location is actively used by evening pizza delivery drivers. Additional bike parking is recommended along Bolinas Avenue but because redesign of this section of downtown is currently being undertaken as a part of the General Plan Update specific recommendations are not given in this document. Provide Valet Bike Parking at Public Events As described in the policy recommendations in Chapter 2, a formal program to provide closed-in secure bicycle corrals at all large public permitted events to encourage residents and visitors to bicycle rather than drive should be instituted. In the past valet parking has been provided by the Marin County Bicycle Coalition and others at special events held in downtown such as the Fairfax Festival. Volunteers are critical to the success of such a program as they are typically used to staff the corral during the events. Examples of events which could benefit from such a program include the weekly Farmer s Market, where temporary bicycle parking is desired as an alternative to permanent racks which would require paving a large concrete pad in the park in order to be able to accommodate the larger number of weekly riders. Create a Bike Center Fairfax is an ideal staging point for some of the best recreational road cycling and mountain biking in Marin County and the Bay Area region. In addition, Fairfax has the highest level bike commuters to work and school. The many riders who visit Fairfax constitute an underutilized resource for local businesses which could benefit from their patronage. For this reason the Town, in partnership with the Chamber of Commerce, should pursue development of a Bicycle Center, potentially with the involvement of an existing gym or bicycle shop, which would allow cyclists to store their bikes and change and shower before dining, seeing a movie or meeting up with friends at a local café or bar. The Center could offer optional services such as bike maintenance, cleaning and laundry. The facility could be funded through a combination of these optional services, sales of energy bars and sport drinks, memberships, and/or per-use fees. Improve and Increase Bicycle Parking Facilities at Fairfax Schools Currently both of the public schools, Manor and White Hill, have bicycle parking, as does Cascade Canyon, a private elementary. All indications are that bicycle parking needs will increase, given the increasing numbers of school bicycle commuters and ongoing promotion, education and encouragement efforts of the Ross Valley SR2S Task Force. At this time SR2S parents and Town staff have identified a need for more bicycle racks. Manor Elementary School currently has capacity to accommodate 120 bikes on the field area, in addition to small racks for 4 bikes in front of the office. There is need for one more rack with space for 7-10 bikes to place at the kindergarten area. White Hill Middle School currently has a bike corral adjacent to the exiting curb of the parking lot. The corral is approximately 25 x 55, and has wire fencing and wooden posts with a locking gate. There are racks to accommodate 70 bikes. The floor of the corral is uneven dirt and crushed gravel. Ingress and egress is problematic as cyclists have to either cross the paths of pedestrians or exiting cars. The corral also lacks any cover from inclement weather. An additional 30 spaces would accommodate future capacity needs. This parking FAIRFAX BICYCLE AND PEDESTRIAN MASTER PLAN 30 FEBRUARY 2008 FINAL PLAN
60 area should be redesigned and relocated to address circulation safety issues with accessing the parking area, improve the cage, paving the parking area, add sheltered parking and improve and reorganize the racks within the cage. Cascade Canyon Elementary School has a rack with capacity for 12 bikes that is by the office and meets the needs of the school's bicycling community at this time. BICYCLE SIGNAL DETECTION As described in Chapter 3, the Town of Fairfax has no official policy regarding bicycle signal detection. The following recommendations are intended to expand the town s existing signal detection efforts to include bicycles along all designated lanes/routes and at key intersections. RECOMMENDATONS Calibrate Loop Detectors and Video Detection Devices While detector loops and video detection facilitate faster and more convenient motorist trips, if they aren t calibrated properly or stop functioning, they can frustrate cyclists waiting for signals to change, unaware that their bicycle is not being detected. Where appropriate, the Town should ensure that all existing loops and video detection devices are calibrated and operable for bicycle users. Develop Policy of Installing Bicycle-Calibrated Loop Detectors or Video Detection with Bicycle Zones at Signalized Intersections The Town should develop a policy of installing bicycle-calibrated loop detectors at intersections along designated bike routes as they are repaved. For new installations it is recommended that the Town use Type D for lead loops in all regular travel lanes shared with bicycles. Within bike lanes it is recommended that the Town install Bicycle Loop Detectors (BLDs) using narrow Type C loops. Where video detection is currently or planned to be in use, it is recommended that the Town continue and expand its practice of incorporating additional detection zones for bicycles, especially for intersections with sidepath, wide curb lane or Class II bicycle lane facilities. Video image detection should sense bicycles in all approach lanes and also on the left side of right-turn channelization islands. Some video systems can estimate approach speed, and this capability could be used to extend the green time for slow objects assumed to be bicycles. Apply Pavement Stenciling to Indicate Detection Areas Since most cyclists, as well as motorists, do not know how loop detectors or video detection work, all detector loops and video detection areas expected to be used by cyclists should be marked by a pavement stencil such as the Caltrans Standard Plan A24C bicycle detection marking that shows cyclists where to stop to activate the loop or video detection. Educational materials distributed by the Town should describe how to activate bicycle detectors. Stencils should be repainted as needed along with other roadway markings. Potential Locations for Bicycle Detection The following signalized intersections are potential locations for improved bicycle detection, subject to further feasibility analysis and traffic studies: Sir Francis Drake Boulevard and: FAIRFAX BICYCLE AND PEDESTRIAN MASTER PLAN 31 FEBRUARY 2008 FINAL PLAN
61 SHARE THE ROAD SIGNS Oak Manor Drive Claus Drive Pastori Avenue Kent Avenue Any future traffic signal locations As described in Chapter 3, the Town of Fairfax has yellow Share the Road bicycle warning signs posted at several locations throughout town, intended to increase motorist and cyclist awareness of the need to share narrow roadways with limited sightlines or other potential safety issues. RECOMMENDATON The Fairfax BPAC should make recommendations for where future Share the Road signs should be installed, keeping in mind the goal of minimizing sign pollution. Share the Road signs are intended for installation on Class III bike routes and in other locations where there may be fast moving traffic and narrow right-of-way, limited sightlines or other potential safety concerns. The Share the Road signs are intended to compliment that County Bicycle Route Guide Sign System. FAIRFAX BICYCLE AND PEDESTRIAN MASTER PLAN 32 FEBRUARY 2008 FINAL PLAN
62
63 5.2. PEDESTRIAN FACILITY IMPROVEMENTS This section discusses capital project recommendations for Fairfax s pedestrian network. These infrastructure improvements are intended to enhance pedestrian access and circulation as well as help pedestrians feel more comfortable when walking in Fairfax. A number of recommendations are made for infrastructure projects that should be implemented on a broad Townwide basis. These projects were divided into several categories of improvements: Sidewalk Gaps, Curb Ramps, Signalized Intersections, Signal Timing, Unsignalized Intersections. Following the Townwide project recommendations, a number of example project recommendations are identified. These projects seek to improve specific intersections, corridors, or other locations that were identified through the existing conditions and public input process as needed improvement areas. More details about specific improvement types are provided in the Design Guidelines appendix. INFILL OF WALKWAY GAPS Walk gaps are areas in Fairfax where there is no walkway, or the walkway ends abruptly, resulting in a discontinuous network. Areas without walkways may force pedestrians to walk along the edge of the roadway, or may cause pedestrians to cross at undesignated crossing locations. Where feasible, providing a continuous pedestrian sidewalk along both sides of all of Fairfax s roadways is recommended. RECOMMENDATION: A complete Townwide inventory of walkway gaps was not within the scope of this plan update. The Town should conduct additional a comprehensive sidewalk and pathway inventory in order to develop a detailed electronic inventory of sidewalk gaps needing to be installed and develop a process for prioritizing and filling these gaps. In addition, the town should continue to work to establish walkways along the existing and proposed pedestrian rights-of-way identified by the Fairfax Volunteers, as feasible. REDUCTION OF CURB RADII Historically roadway design standards called for wide curb radii at intersections to promote intersection capacity for motor vehicles. As a result, many of Fairfax s intersections have corners that force pedestrians to walk further to cross the street than at intersections with small or medium turning radii. This design also allows vehicles to make right-turns at relatively high speeds compared to smaller intersections. This should be studied on a case-by-case basis. RECOMMENDATION: As a Townwide policy, Fairfax should reduce corner curb radii when repaving streets and installing curb ramps where it increases safety of bikes and pedestrians. Fairfax should also consider, where necessary, retrofitting curb radii at all arterial and collector intersections in the downtown area. CURB RAMP IMPROVEMENTS CURB RAMPS An inventory of curb ramps was not conducted for the Plan update. As a part of a curb ramp inventory, data on the slope, side slope, landing dimensions, and other attributes of the curb ramp FAIRFAX BICYCLE AND PEDESTRIAN MASTER PLAN 35 FEBRUARY 2008 FINAL PLAN

64 are measured in the field. An analysis of this data considers compliance with current ADA regulations for slope, lip height and presence of tactile warnings ( truncated domes ). Retrofitting the cities non-compliant curb ramps is generally something the Town will accomplish as part of roadway re-paving projects (ADA requires that curb ramps be installed or brought up to compliance during street overlays). RECOMMENDATION: Fairfax should install curb ramps at all locations in the downtown and surrounding neighborhood areas where they currently do not exist. Fairfax should conduct a detailed curb ramp inventory throughout the Town to determine other locations that lack curb ramps. Priority locations for additional inventory would include schools, neighborhood parks, and community centers. As part of normal street re-paving projects, the Town should continue to install curb ramps if none currently exist, and to upgrade existing ramps to current standards. TRUNCATED DOMES Truncated domes provide a cue to visually-impaired pedestrians that they are entering a street or intersection. Since 2002, ADA Guidelines have called for truncated domes on curb ramps. Although it is not required for Fairfax to install truncated domes at existing curb ramps that were built prior to 2002, it is recommended that the Town continue installing these devices A curb ramp with truncated domes at high priority pedestrian locations and when re-paving and upgrading existing curb ramps to meet ADA guidelines. Truncated domes are a very visible improvement, and they are relatively inexpensive to install. RECOMMENDATION: Fairfax should install truncated domes at all arterial and collector intersections in the downtown and along streets that provide access to the commercial areas. Fairfax should also install truncated domes when re-paving streets and improving existing curb ramps and elsewhere to be in compliance with ADA requirements. PERPENDICULAR CURB RAMPS Perpendicular curb ramps are designed so two ramps are included at intersection corners. Perpendicular ramps allow pedestrians and people in wheelchairs to access the sidewalk perpendicular to stopped traffic, and to enter into the crosswalk directly in their line of travel. Perpendicular ramps are not required by ADA or any other standard. However, perpendicular ramps are the preferred curb ramp style from a pedestrian standpoint since they provide the most direct access into the crosswalk. Perpendicular ramps do require more space to install than a single diagonal ramp, are more costly, and sometimes cannot be accommodated due to utilities or other obstructions at the corner. However, especially at major intersections in high pedestrian zones, it is recommended that they be installed where feasible. RECOMMENDATION: Fairfax should install perpendicular curb ramps in the downtown area and on adjacent streets and throughout the town as needed. FAIRFAX BICYCLE AND PEDESTRIAN MASTER PLAN 36 FEBRUARY 2008 FINAL PLAN
65 SIGNALIZED INTERSECTION IMPROVEMENTS There are a variety of engineering improvements that can improve pedestrians walking experience when crossing signalized intersections. All of these improvements are discussed in detail in Appendix A - Design Guidelines. An improvement that is recommended for some of Fairfax s signalized intersections is signal retiming. This improvement is described below. SIGNAL TIMING Signal timing is the amount of time each phase of a signal is allotted for vehicles to pass through or pedestrians to cross the street. Per the MUTCD, standard traffic engineering design assumes that pedestrians travel at 4.0-feet per second, which is used to determine the amount of time to assign to the pedestrian clearance interval. For slower pedestrians, such as the elderly and children, this assumed walking speed may result in them not being able to fully cross the street before the light changes. By adjusting the signal timing to a slower walking rate, slower pedestrian will have more time to cross the street. RECOMMENDATION: Fairfax should consider adjusting signal timing at the three signals within the Town to allow for a pedestrian pace of 2.8-feet per second. This slower walking speed is consistent with MUTCD recommendations for walking rates for slower pedestrians. Consideration of signal operation and signal coordination by the County of Marin is necessary for this recommendation, since all three signals are along Sir Francis Drake Boulevard. AUDIBLE SIGNALS Audible signals provide a cue to visually-impaired pedestrians that there is a Walk signal. Audible signals are usually chirping sounds and can also be the name of the street to cross. Sounds are activated by the pedestrian push-button. The MUTCD states that installation of audible signals should be based on an engineering study that considers: Potential demand for accessible pedestrian signals A request for accessible pedestrian signals Traffic volumes during times when pedestrians might be present; including periods of low traffic volumes or high turn-on-red volumes. The complexity of traffic signal phasing. The complexity of intersection geometry." RECOMMENDATION: Fairfax should consider installing audible signals at signalized intersections. UNCONTROLLED CROSSWALK IMPROVEMENTS Infrastructure improvements at uncontrolled crosswalk locations can help increase the visibility of pedestrians to motorists and improve the pedestrians walking experience. These improvements are for both unmarked and marked crosswalks at intersections. FAIRFAX BICYCLE AND PEDESTRIAN MASTER PLAN 37 FEBRUARY 2008 FINAL PLAN
66 HIGH-VISIBILITY CROSSWALK MARKINGS There are a variety of different striping styles for crosswalks. The Town of Fairfax utilizes two different marking styles for pedestrian crosswalks: the standard transverse style, consisting of two parallel lines; and the ladder style consisting of the two parallel lines with perpendicular ladder bars striped across the width of the crosswalk. Ladder style crosswalks are used in locations where heightened pedestrian visibility is important, such as around school areas. However, the Town does not currently have a consistent policy to guide the application of ladder crosswalks. RECOMMENDATION: As a Townwide policy, Fairfax should install ladder crosswalk markings at all uncontrolled crosswalk locations where there are existing tranverse style markings. The Town should also continue its policy of installing high-visibility ladder crosswalk markings at uncontrolled crosswalks on local streets adjacent to schools and at other locations, on a case-by-case basis. RAISED CROSSWALKS As described in the MUTCD, raised crosswalks are a combination of speed hump or speed table and crosswalk, which raises a conventional crosswalk, with the goal of increasing visibility of the crosswalk and encouraging frequent users to get in the habit of slowing for the pedestrian crossing. RECOMMENDATION: Fairfax should consider the use of raised crosswalks at uncontrolled crosswalk locations where there is an existing marked crosswalk and a history of poor motorist awareness of and yielding at the existing crosswalk. Raised crosswalks are appropriate for roadways with lower traffic volumes and are not typically used on high-volume arterial streets. As a form of traffic calming, raised crosswalks should be installed in consultation with police and fire to ensure prompt access for emergency vehicles. IN-STREET YIELD TO PEDESTRIAN SIGNS In-Street Yield to Pedestrian Signs are flexible plastic paddle signs installed in the center of a roadway to enhance a crosswalk at uncontrolled crossing locations. Currently these signs are in use throughout the downtown area on Broadway Avenue and Bolinas Road and at selected school crosswalk locations such as Oak Manor Drive. RECOMMENDATION: Fairfax should continue the use of paddle crosswalk signs along downtown commercial streets and at selected school locations by installing new signs as needed and maintaining existing sign locations. IN-PAVEMENT CROSSWALK LIGHTS This push-button activated device is designed to improve pedestrian safety by increasing motorist awareness of pedestrians at midblock crosswalk locations. When pedestrians push the button, lights imbedded in the pavement on either side of the crosswalk illuminate in a flashing pattern. Inpavement lights have been used at the Marin County Civic Center where they have been sucessfully at improving motorist yielding to pedestrians in the crosswalk. It has been the policy of the Fairfax members of the Safe Routes to Schools Task Force to not recommend these for use in the crosswalks on Sir Francis Drake Boulevard, because of lessened visibility for drivers other than those immediately adjacent to the crosswalk. In addition, The Town of San Anselmo has experienced some unexpected maintenance cost where they have been used along Drake. Since there are several overhead mast type crossing signals already along Drake within Fairfax, this policy was adopted for consistency as well as the above safety and maintenance reasons. FAIRFAX BICYCLE AND PEDESTRIAN MASTER PLAN 38 FEBRUARY 2008 FINAL PLAN
67 The exception to this policy is that mid block crosswalks in downtown may be good locations for in pavement lights, especially where overhead masts would conflict with trees, utilities and the character of downtown streets. RECOMMENDATION: Fairfax should consider installation of in-pavement flashing lights at mid-block crosswalk locations such as those along Broadway Avenue, Center Boulevard and Sir Francis Drake Boulevard (east of Claus Drive in the downtown area). CURB EXTENSIONS Curb extensions, also called bulbouts to describe their shape, are engineering improvements intended to reduce pedestrian crossing distance and increase visibility. In addition to shortening the crosswalk distance, curb extensions serve to increase pedestrian visibility by allowing pedestrians to safely step out to the edge of the parking lane where they can see into the street, also making them more visible to oncoming drivers. Curb extensions can also improve safety by visually narrowing the roadway, cueing drivers to reduce their speed. Despite their advantages, curb extensions can require major re-engineering of the street, can be extremely costly, and are not appropriate for all situations. RECOMMENDATION: Fairfax should consider the feasibility of installing curb extensions at crosswalk locations where appropriate. EXAMPLE PEDESTRIAN PROJECTS The following list of pedestrian projects was developed based on past public input and the input from Staff and the BPAC. A number of these projects are already developed and funded. Note that all new crosswalk locations assume installation of curb ramps to meet ADA requirements. Oak Manor Sidewalk project funded SR2S project which proposes to close a sidewalk gap. As suggested by the BPAC, future projects for this area could include traffic calming. Center Boulevard Project funded street rehabilitation project which proposes to install new and improved sidewalk segments as well as new crosswalks, curb extensions and lighting. If not already included, project should include use of crosswalk paddle signs, similar to existing practice on Broadway Avenue and Bolinas Road. Pastori Sidewalk Project funded NTPP project which proposes to install new sidewalks and crosswalks. If not already included, project should include use of crosswalk paddle signs, similar to existing practice on Broadway Avenue and Bolinas Road. Glen Drive Improvements funded SR2S project which proposes new sidewalks and improved crosswalks on Glen Drive and Sir Francis Drake Boulevard near White Hill School. If not already included in the current project, future improvements could include use of crosswalk paddle signs, similar to existing practice on Oak Manor Drive at Manor School and speed humps or other traffic calming devices. Sir Frances Drake Sidewalk Project funded NTPP project which proposes to install sidewalks on the west side of SFD between Olema Road and Claus Drive. FAIRFAX BICYCLE AND PEDESTRIAN MASTER PLAN 39 FEBRUARY 2008 FINAL PLAN
68 Cascade Drive Improvements ongoing project currently being studied, which includes potential improvements as appropriate for various segments, such as: o Walkway on at least one side of the street. Volunteer Joe Breeze has developed a proposal for a walkway with a pervious surface along Cascade Drive that takes advantage of existing public right-of-way. The project would require retaining walls in several areas and may need to be studied further for ADA compliance o Crosswalks at intersection locations as needed o Pedestrian safety signage including paddle signs o Traffic Calming such as curb extensions Porteous Road Project conceptual project which includes the following potential improvements, to be developed through a process in partnership with local residents: o Walkway with context-sensitive surface such as crushed granite has been proposed by residents, compliant with Town goals of maintaining water pervious surfaces especially in creek areas. o Crosswalks at intersection locations as needed o Traffic calming such as curb extensions at identified problem locations such as the intersection of Porteous and Creek o Speed limit reduction to create Neighborhood Zone or Village Speed Limit Downtown pedestrian improvements (Broadway and Bolinas) conceptual improvement project to improve conditions for pedestrians in the downtown business district, including the following potential improvements: o Sidewalk surface maintenance o Improved crosswalks at intersection and mid-block locations as needed o Curb extensions/traffic calming at intersection and mid-block locations as needed o Maintenance and reinstallation of existing paddle crosswalk sign locations o New crosswalk of Sherman at Bolinas Road o New crosswalk of Bolinas Road at Mono Way o New crosswalk of Broadway Avenue near School Street; would require high visibility treatment and advance warning signs/beacons due to line of sight topography issues; thorough study recommended before implementing a new crosswalk in this area o Potential speed limit reduction if warranted by traffic study Sir Frances Drake crossing improvements conceptual project that proposes improved crosswalks at intersection and mid-block locations, including the following potential improvements: o High-visibility crosswalks o Improved warning signage o In-pavement flashing crosswalk lights o Overhead flashing beacons Elsie/Mono/Bank sidewalk and streetscape project this conceptual project has been discussed by both the General Plan Advisory Committee as well as the BPAC. The project is proposed for an area with an undeveloped streetscape. The project includes the following potential improvements: FAIRFAX BICYCLE AND PEDESTRIAN MASTER PLAN 40 FEBRUARY 2008 FINAL PLAN
69 o Continuous sidewalks on both sides of the street o Addition of curb and gutter, landscaping and traffic calming o Potential or partial closure of Mono o Crosswalks at intersection and mid-block locations as needed Pacheco/Dominga/Creek this corridor has been identified as a key pedestrian connection to and from the downtown warranting the following potential improvements: o Filling sidewalk gaps o Improving crosswalks at intersection locations o Traffic calming such as curb extensions at intersections o Speed limit reduction to create Neighborhood Zone or Village Speed Limit Park/Sequoia/Spruce/Scenic/Manor this corridor has been identified by both the BPAC and the SR2S task force as a key pedestrian connection to and from the downtown and to schools, warranting the following potential improvements: o Filling sidewalk gaps o Improving crosswalks at intersection locations o Installing new crosswalks as needed o Traffic calming such as curb extensions and speed humps o Speed limit reduction to create Neighborhood Zone or Village Speed Limit Hawthorne Bike/Ped Bridge similar to the new Manor Bridge, a bridge at this location would connect Hawthorne Court to the intersection of Sir Francis Drake Boulevard and Oak Manor Drive, creating a direct pedestrian route from the neighborhood to Oak Manor School. Lansdale Walkway this conceptual project would add a walkway alongside Lansdale Avenue to fill a pedestrian connection gap in an area where there is currently no separated walkway leading to existing sidewalks in San Anselmo. This project is likely to be extremely challenging due to the need to remove either parking or vegetation and do significant grading and construction of retaining walls. This project would be an option instead of the long-term alternative for the connection between Fairfax and San Anselmo. A third option for this area would involve creation of a low-speed traffic-calmed Living Street where cars would travel at the same speed at bicycles and pedestrians and all users would share the same right of way. This design is not typical in the United States but has been implemented in many areas of Europe RECOMENDED POLICIES AND PROGRAMS Support policies programs are an important component of a bicycle and pedestrian transportation system. Bikeway and walkway facilities alone are not sufficient to increase cycling. Programs such as bikeway and sidewalk management and maintenance, and promotional and educational programs may contribute to improved convenience and safety for pedestrians and cyclists, and help create the cultural shift that is necessary to increase walking and bicycling as a mode of transportation. The following section includes both general and specific recommendations for programs. FAIRFAX BICYCLE AND PEDESTRIAN MASTER PLAN 41 FEBRUARY 2008 FINAL PLAN
70 DEVELOPMENT AND CAPITAL PROJECTS One of the critical challenges of providing pedestrian and bikeway improvements is funding their construction. Private projects such as new or redevelopment and public projects such as planning Capital Improvements Projects (CIP) provide excellent opportunities for cost-effective implementation of bikeways. RECOMMENDATION - DEVELOPMENT AND REDEVELOPMENT A policy should be developed requiring bikeway and pedestrian improvements as a condition of private redevelopment or new construction. Based on specific criteria, construction of bikeways and walkways as a part of such projects could be required for development permits. Bicycle and pedestrian facilities can also be incorporated into the town s traffic mitigation strategies as an option for developers. Bikeways and walkways to be constructed should be from the adopted Town of Fairfax Bicycle and Pedestrian Master Plan and be reviewed by staff with the involvement of the BPAC. End of trip facilities such as secure, indoor bicycle parking, showers and lockers should be integrated according to national best practices, as needed. RECOMMENDATION TRANSPORTATION CAPITAL PROJECTS A policy should be developed to integrate bikeway and pedestrian facility construction into the Town s Capital Improvements Projects program and other larger roadway projects. To achieve costsavings projects such as striping bicycle lanes and high visibility crosswalks can be added to roadway construction, reconstruction and resurfacing at much lower cost proportionally to a stand-alone bikeway or pedestrian project. MAINTENANCE Maintenance is often identified as one of the chief obstacles in the implementation of local bike and pedestrian plans in Marin County. Fairfax s bikeways and walkways should be well-maintained. Some tasks, such as repairing damaged and potholed roadway surfaces, clearing plant overgrowth and regular sweeping are associated with routine roadway maintenance. Additional care and attention should be taken to ensure bikeways are included in the maintenance. For example, street sweeping activities should include the bike lane and not transfer debris out of the roadway and into the bicycle lane. Other maintenance activities are bikeway specific, and could include restriping lanes, repainting stencils and replacing signs. Clearing storm debris, repairing cracks in the sidewalk and fixing tripand-fall hazards are all typical routine sidewalk maintenance to ensure continued ADA accessibility. Roadway and other capital improvement construction projects present unique challenges for maintaining bikeways and pedestrian facilities. RECOMMENDATION - ROUTINE MAINTENANCE Bikeways and walkways are an integral part of Fairfax s transportation network, and maintenance of the bikeway network should be part of the ongoing maintenance program for all Town transportation facilities. RECOMMENDATION ROADWAY AND CONSTRUCTION PROJECTS Bikeways and walkways should be maintained and preserved during roadway and construction projects that impact their use. Bikeways and sidewalks should be kept free of construction debris. In FAIRFAX BICYCLE AND PEDESTRIAN MASTER PLAN 42 FEBRUARY 2008 FINAL PLAN
71 the case that bicycle or pedestrian facilities must be obstructed for the purposes of construction an appropriate, clearly-signed route should be signed through or around the construction area that does not increase users exposure to safety hazards. RECOMMENDATION SPOT IMPROVEMENT MAINTENANCE The Town should ensure that a mechanism exists to alleviate potential hazards for bicyclists and pedestrians at specific locations. Training should be provided if necessary to ensure that public works maintenance employees recognize recurring bicycle and pedestrian issues such as: Improperly designed or placed drainage grates Cracks or seams in the pavement or sidewalk Overhanging tree limbs or encroaching vegetation located along bikeways and walkways Areas where debris accumulates in bike lanes and on sidewalks and pathways RECOMMENDATION INTEGRATE MAINTENANCE INTO DPW PROCESS All printed and online bicycle education materials and maps should include the Department of Public Works maintenance request website and phone number. PROTECT NONMOTORIZED FACILITIES FROM REMOVAL RECOMMENDATON The Town should implement a practice that existing bikeway and pedestrian facilities will not be removed. For example, Class II bike lane facilities should not be removed at a future date to increase motor vehicle capacity without a thorough study analyzing the alternatives and unless the bicycle accommodation is replaced by another facility of equal or greater utility to cyclists. MULTI-MODAL CONNECTIONS RECOMMENDATON The Town of Fairfax should work with the Marin County Transit District and Golden Gate Transit to continue to expand bicycle access to buses. Bicycle travel to transit stops and stations should be enhanced in order to make the transfer between bicycle and transit travel as convenient as possible. Key components to enhancing transit-bike connections include: providing bicycle parking at transit stops, including bike racks at key bus stops and transfer points; providing educational materials regarding transit and bikes-on-transit, including maps to and from stations and stops. Improvements to bicycle rack capacity on buses will benefit Fairfax cyclists who take buses to the wide variety of destinations. TRAFFIC CALMING Traffic calming programs are beneficial for all roadway users, especially if programs succeed in reducing the speed differential between automobile and cyclist travel speeds. However, if not appropriately designed, some physical traffic calming devices can present hazards for cyclists. For FAIRFAX BICYCLE AND PEDESTRIAN MASTER PLAN 43 FEBRUARY 2008 FINAL PLAN
72 example, chokers or traffic islands can narrow the space between bicycles and cars and, depending the context, may compromise a cyclist s safety if not properly designed. RECOMMENDATION All physical traffic calming solutions should take into account cyclists needs; incorporate design features and signage that ensure that cyclists and motorists have enough room to share the lane; and clearly establish right-of-way priorities. In cases where cyclists operating space is reduced, case should be taken to clearly indicate cyclists proper roadway positioning using stencils and/or signage as well as other means to increase visibility of cyclists to motorists. EDUCATION AND ENFORCEMENT PROGRAMS Statewide trends show that the lack of education for bicyclists, especially younger students, continues to be a leading cause of accidents and traffic violations by cyclists. For example, the most common type of bicycle accident reported in California involves a younger person (between 8 and 16 years of age) riding on the wrong side of the road in the evening hours. Studies of accident locations around California consistently show the greatest concentration of accidents is directly adjacent to elementary, middle, and high schools. Most education and enforcement programs and activities will likely be cooperative efforts between the Town of Fairfax, the Fairfax Police Department, the Marin County Sheriff s office, the County of Marin, the Transportation Authority of Marin, SR2S and local bicycle groups such as the Marin County Bicycle Coalition. RECOMMENDATIONS Continue and Expand Existing Education and Enforcement Programs Existing school education programs should be continued. With the passage of Measure A funding for Safe Routes to Schools, the program will continue to be available to Fairfax schools and can be expanded to include non-participating schools. Measure A funding also provides Safe Pathways funding, which provides an incentive for Safe Routes programs to develop infrastructure improvement concepts. More information is found under the separate Safe Routes to Schools section below. For adult education, the Town should work with law enforcement and the Marin County Bicycle Coalition to publicize local adult bicycle education and safety programs, including Share the Road and Street Skills classes. Fairfax should continue to offer bicycle traffic school in the form of Street Skills classes in lieu of fines and should sponsor adult cycling skills classes to prevent future traffic violations and unsafe behavior. In terms of enforcement, the Fairfax Police Department should continue its enforcement efforts of cycling traffic violations and officers should provide Share the Road literature with every citation made of a cyclist. The Police Department should also begin bicycle sting and pedestrian sting operations in which motorists are cited for failing to yield the right of way to other road users. Additionally, police should begin enforcing the ordinance for no parking on the sidewalks that creates potentially dangerous conditions for pedestrians when cars block the public right of way. The Town should continue and expand Share the Road Checkpoints with advocacy groups and offer Share the Road safety presentations to community groups and at events. Outreach FAIRFAX BICYCLE AND PEDESTRIAN MASTER PLAN 44 FEBRUARY 2008 FINAL PLAN
73 opportunities such as a Bike-In Film Night at the baseball field with a Share the Road presentation prior to presentation of bicycle-themed movies could reach a large number of cyclists and noncyclists alike. ENCOURAGEMENT PROGRAMS Encouragement programs are vital to the success of the Bicycle and Pedestrian Plan. Encouragement programs work to get more people out of their cars and onto bicycles or walking, which will help to reduce traffic congestion and air pollution, as well as improve the quality of life in Fairfax. In addition to government efforts, involvement by the private sector in raising awareness of the benefits of bicycling and walking is important and can range from small incremental activities by local citizens, to larger coordinated efforts by established non-profit groups. Specific programs are described below. RECOMMENDATIONS Facilitate the Development of Employer Incentive Programs Facilitate the development of employer incentive programs to encourage employees to try bicycling or walking to work, or to transit as a part of their commute. The Town may offer incentives to employers to institute these improvements through lowered auto parking requirements, reduced traffic mitigation fees, or other means. Other efforts could include: Developing, promoting and publicizing bicycle commuter services, such as bike shops selling commute gear, bike-on-transit policies, and regular escorted commute rides. Creating an annual commuter challenge for area businesses, including both walking and biking. Utilitarian and Recreational Trip Incentive Programs The Town may develop and implement encouragement programs for utilitarian and recreational purposes. Local businesses such as movie theaters and cafes should be involved to encourage customers to use a bicycle or walk for their trips. Such efforts may include: Creating events such as Shop by Bike days, when cyclists get vouchers for, or coupons off items in the store, or bicycle to the movies days, when cyclists receive free popcorn or a discount on a movie or refreshments. Holding a community event to encourage residents to replace one car trip a week with a bicycle or walking trip. Supporting the planning and implementation of an annual bicycle ride in Fairfax to attract new riders, showcase the town, and demonstrate the benefits of bicycling. Develop and implement a public education campaign to encourage bicycling and walking. Bike Fairs and Races Hosting bike fairs and races in Fairfax can raise the profile of bicycling in the area and provide entertainment for all ages at the same time. Bike fairs and races, similar to bike-to-work day events and bike rodeos currently hosted in the Town provide an opportunity to educate and encourage current and potential bicyclists. These events can also bring visitors to Fairfax that may contribute to the local economy. FAIRFAX BICYCLE AND PEDESTRIAN MASTER PLAN 45 FEBRUARY 2008 FINAL PLAN
74 Walking Tours and Events Walking tours and events are an excellent way to publicize walking for recreation and transportation. Tours can showcase the Town s history and geography and take advantage of the many scenic walks in the area as well as raising awareness of the need for pedestrian improvements. Fairfax Bicycle Route Map and Kiosks Providing a bicycle route map is the primary tool for showing bicyclists all the designated bikeways in Fairfax and is a high priority for the BPAC. Such a map could be displayed at bike shops and kiosks. A Bicycle Route Map of Fairfax should clearly show the type of facility (path, lane, or route) as well as include basic safety information, significant destinations, the location of bicycle parking facilities, public bathrooms, water fountains, transit stops and bicycle facilities in the neighboring communities. The map should clearly communicate traffic laws relevant to bicycles and the fact that Fairfax takes enforcement of those laws seriously. Posting points for the map include: Town Hall, the library, the community center, local schools, bike shops and existing and proposed kiosks located: Sir Francis Drake Boulevard/Olema Road (existing) The Parkade (proposed) The Java Hut parking lot (proposed) Lansdale Avenue/Center Boulevard (existing) Bike-to-Work and Bike-to-School/Walk-to-Work and Walk-to-School Days The Town of Fairfax should continue to participate in the annual Bike-to-Work day in May, in conjunction with the California and Marin County bike-to-work week activities. Town staff should be present at energizer stations along the route. The Town should also encourage continued participation by local schools in Walk and Bike to School Day and may also consider implementing Walk-to-Work or Walk-to-Transit days. SAFE ROUTES TO SCHOOLS Identifying and improving routes for children to walk or bicycle to school is an effective means of reducing morning traffic congestion and addressing potential safety concerns around schools. Most effective school commute programs are joint efforts of the school district and Town or County, with parent organizations adding an important element. The traffic calming, route maps and infrastructure improvements that result from an extensive Safe Routes to School plan benefit not only students walking and biking to school, but also other cyclists and pedestrians that are using routes near schools. As the Safe Routes to School s Task Force develops capital recommendations, they should be presented to the BPAC for review. Consistent with the policies in Section 2, when appropriate, SR2S capital projects should be forwarded to the Town Council for approval through the existing capital projects bid process. RECOMMENDATIONS The Town of Fairfax should continue its support of the Safe Routes to Schools program within the Ross Valley School District and private schools. Safe Routes infrastructure improvements at local schools should be coordinated with town-wide bicycle infrastructure improvements to create a seamless network by which school-aged children can travel by bicycle and on foot. FAIRFAX BICYCLE AND PEDESTRIAN MASTER PLAN 46 FEBRUARY 2008 FINAL PLAN
75 The following five recommendations are incorporated from the Transportation Authority of Marin s SR2S Program Evaluation for : Expand to Other Schools Utilize the Measure A Safe Pathways Capital Funding Program Sustain and Increase Participation, Enthusiasm, and Continuity Continue to Remove Barriers to Alternative Modes Increase Transit Availability More details are available on the TAM website: 6. PLAN IMPLEMENTATION This chapter identifies steps towards implementation of the proposed facilities and programs of this plan, the estimated costs for the proposed improvements and maintenance, and strategies on funding and financing IMPLEMENTATION PROCESS The steps between the network improvements and concepts identified in this Plan and the final completion of the improvements will vary from project to project, but typically include: 1. Adoption of the 2008 Fairfax Bicycle and Pedestrian Master Plan Update by the Fairfax Town Council. 2. Preparation of a Feasibility Study involving a conceptual design (with consideration of possible alternatives and environmental issues) and cost estimate for individual projects as needed. 3. Secure, as necessary, outside funding and any applicable environmental approvals. 4. Consider the parking needs of businesses and residents in the development of new bicycle lanes through a thorough community engagement process 5. Approval of the project by the Town Council, including the commitment by the latter to provide for any unfunded portions of project costs. 6. Completion of final plans, specifications and estimates, advertising for bids, receipt of bids and award of contract(s). 7. Construction of Project INFRASTRUCTURE PROJECT PRIORITIZATION Once a bikeway system has been identified, the greatest challenge is to identify the top priority projects that will offer the greatest benefit to bicyclists if implemented. The project prioritization in the following section was developed through a qualitative analysis based on stated priorities of the FAIRFAX BICYCLE AND PEDESTRIAN MASTER PLAN 47 FEBRUARY 2008 FINAL PLAN
76 BPAC and Town staff, priorities communicated by the public in public meetings and workshops, priorities from the 2001 Fairfax Bicycle and Pedestrian Master Plan and the criteria detailed below. Continuity Does the project provide new or significantly improved connectivity on established corridors or between major activity areas that does not currently exist or is not currently usable by the general public? Gap Closure Does the project provide a new connection between major activity centers or on a major corridor that currently either does not exist or has convenience/safety issues? Demand Patterns Does the project serve a significant existing or potential demand, as evidenced by (a) counts or observed activity, (b) comments from the public, (c) connectivity and proximity to major generators, and/or (d) projections from an acceptable demand model? Safety Does the project address a significant safety concern in a community as evidenced by collision data, field observations, and/or public perception and comments? Project Readiness Are the key feasibility issues of the project (right-of-way, environmental impacts, engineering issues, cost issues, neighborhood support) understood and not expected to negatively affect or delay the project? Has any formal feasibility study, engineering or design been conducted? Multi-Modal Integration Does the project provide enhanced connectivity to existing transit services? Cost/Benefit analysis Will the project provide the greatest benefit to cyclists for the amount invested to build it? It is important to remember that the lists of bikeway projects and programs are flexible concepts that serve as guidelines to those responsible for implementation. The project priorities, and perhaps even the overall system and segments themselves, may change over time as a result of changing bicycling patterns and implementation constraints and opportunities. Project prioritization is not meant as an absolute value, rather as an indication of projects relative importance only. These priorities should be considered a living document. The Fairfax BPAC and Town staff should review the project priorities on an annual basis to ensure that it reflects the most current priorities, needs, and opportunities for implementing the bikeway network in a logical and efficient manner., and that in particular the list takes advantage of all available funding opportunities and grant cycles. As projects are implemented and taken off the list, new projects should be moved up in status. BICYCLE PROJECT PRIORITIZATION AND PHASING: Prioritization and phasing is presented as a guideline for the Town, and additional circumstances including available funding and implementation of roadway and transit capital projects, or development projects, could result in changes to the priorities to maximize opportunities. NEAR-TERM: Downtown and school bicycle parking Center Boulevard Class II Bicycle Lanes/Intersection Treatments (Pastori Avenue to Pacheco Avenue) FAIRFAX BICYCLE AND PEDESTRIAN MASTER PLAN 48 FEBRUARY 2008 FINAL PLAN
77 MID-TERM: Bolinas Road Class III Signage and Shared Roadway Bicycle Markings (Sharrows) Pacheco/Napa/Dominga/Creek/Porteous Class III Signage and Sharrows Park/Sequoia/Spruce/Scenic/Manor Class III Signage and Sharrows Cascade Drive Class III Signage and Sharrows (Bolinas Road to Canyon Road) Rock Ridge Road, Forrest Avenue, Cascade Drive (Canyon Road to Elliot Nature Preserve Open Space) Recreational Access Class III signage only Cascade Drive Class III and Traffic Calming (Bolinas Road to Canyon Road, as feasible) All remaining Class III signage Maintain all existing signs, striping and stencils Broadway Class II Bicycle Lanes (Center Boulevard to Claus Drive) Pacheco/Napa/Dominga/Creek/Porteous Traffic Calming Park/Sequoia/Spruce/Scenic/Manor Traffic Calming Cascade Class III Sharrows and Traffic Calming (Canyon Road to Open Space, as feasible) Sir Frances Drake Class II (eastbound) LONG-TERM: Hawthorne Bike/Ped Bridge Implementation of recommendations from San Rafael-Fairfax Corridor Study for connection to San Anselmo: Class I Pathway between Center Boulevard and Lansdale Class II Bicycle Lanes on Center Boulevard (Pastori to Town Limits) Class III Bicycle Route with Sharrows and Traffic Calming PEDESTRIAN PROJECT PRIORITIZATION AND PHASING: NEAR-TERM: Oak Manor Sidewalk project Center Boulevard Project Pastori Sidewalk Project Glen Drive Improvements Oak Manor Drive/Sir Francis Drake Boulevard Crosswalk and Pedestrian Beacon Cascade Drive Improvements: Crosswalks at intersection locations as needed for existing sidewalks Pedestrian safety signage including paddle signs Traffic Calming such as curb extensions for existing sidewalk areas Pedestrian rights-of-way improvements at 200 block below Laurel at curve Downtown pedestrian improvements (Broadway and Bolinas): Sidewalk surface maintenance Improved crosswalks at intersection and mid-block locations as needed Maintenance and reinstallation of existing paddle crosswalk sign locations New crosswalk of Bolinas Road at Mono Way New crosswalk of Bolinas Road at Sherman Avenue New crosswalk of Broadway Avenue at School Street (pending safety study) Sir Frances Drake crossing improvements: High-visibility crosswalks FAIRFAX BICYCLE AND PEDESTRIAN MASTER PLAN 49 FEBRUARY 2008 FINAL PLAN
78 Improved warning signage Pacheco/Napa/Dominga/Creek: Improving existing crosswalks at intersection locations Installing new crosswalks as needed Potential speed limit reduction Park/Sequoia/Spruce/Manor: Improving existing crosswalks at intersection locations Installing new crosswalks as needed Potential speed limit reduction MID-TERM: Sir Frances Drake Sidewalk Project Downtown pedestrian improvements (Broadway and Bolinas): Curb extensions/traffic calming at intersection and mid-block locations as needed Sir Frances Drake crossing improvements: In-pavement flashing crosswalk lights (east of Claus Drive) Pacheco/Napa/Dominga/Creek: Filling sidewalk gaps Traffic calming such as curb extensions at intersections Park/Sequoia/Spruce/Manor: Filling sidewalk gaps Traffic calming such as curb extensions and speed humps Cascade Drive Improvements: Walkway on at least one side of the street (Bolinas Road to Canyon Road) Traffic Calming such as curb extensions (Bolinas Road to Canyon Road) LONG-TERM: Porteous Road Project: Walkway with context-sensitive surface such as soft-surface with pine resin binder, colored asphalt pathway, and/or crushed granite Crosswalks at intersection locations as needed Traffic calming such as curb extensions at identified problem locations such as the intersection of Porteous and Creek Elsie/Mono/Bank sidewalk and streetscape project: Continuous sidewalks on both sides of the street Addition of curb and gutter, landscaping and traffic calming Potential or partial closure of Mono or Elsie Crosswalks at intersection and mid-block locations as needed Hawthorne Bike/Ped Bridge Lansdale Sidewalk 6.3. COST ESTIMATES A breakdown of conceptual cost estimates for the recommended bicycle and pedestrian network detailed in this plan is presented in Tables 6-1 through 6-6 below. The final construction cost the bicycle and pedestrian network may be less than the sum of these options, since in some cases one option will be chosen above another. It is important to note the three following assumptions about the cost estimates. First, all cost estimates are highly conceptual, since there is no feasibility or preliminary design completed, and second, the design and administration costs included in these FAIRFAX BICYCLE AND PEDESTRIAN MASTER PLAN 50 FEBRUARY 2008 FINAL PLAN
79 estimates may not be sufficient to fund environmental clearance studies. In particular, pedestrian project cost estimates provided here would need to be further refined through project development because in most cases specific existing conditions (e.g. exact length of sidewalk gaps, presence or absence of curb ramps) are not known as of this writing. Due to their complexity, costs for the Class I Pathways proposed here would need to be reexamined as a part of future planning and design studies, and are presented as a rough starting point only. Finally, cost estimates are a moving target over time as construction costs escalate quickly. All the projects are recommended to be implemented on near-term, mid-term or long-term timelines, or as funding is available. The more expensive and complex projects may take longer to implement. In addition, many funding sources are highly competitive, and therefore impossible to determine exactly which projects will be funded by which funding sources. Timing of projects is also something difficult to pinpoint exactly, due to the dependence on competitive funding sources, timing of roadway and development, and the overall economy. The projects listed may be funded through various sources and some have already secured full or partial funding as noted in Chapter 5. The funding section in this chapter outlines some of the local, regional, State and federal funding methods and resources for non-motorized transportation projects. Table 6-1 Bikeway System Cost Estimates Class I Facilities - Multi-Use Paths (Off-Street) Segment Name Begin End Class Length Near-term Mid-term Long-term Center Blvd. Sidepath Pastori Ave. Fairfax Town Limit I 0.16 $0 $0 $225,000 Hawthorne Ct. Hawthorne Sir Francis Drake Bridge Ct. Blvd. I (bridge) 0.02 $0 $0 $450, $0 $0 $675,000 Total Class I Bicycle Pathways $675,000 Base cost for installation of a typical Class I Shared Use Pathway is $641,400/mi; additional costs are based on the need for excavation, retaining walls and undergrounding drainage. Class II Facilities - Striped Bicycle Lanes (On-Street) Segment Name Begin End Class Length Near-term Mid-term Long-term Center Blvd. Fairfax Town Limit Pastori Ave. II 0.17 $0 $0 $29,400 Sir Francis Drake Blvd. (eastbound) Olema Rd. Claus Dr. II 0.33 $0 $0 $28,600 Center Blvd. Pastori Ave. Pacheco Ave. II 0.26 $4,600 $0 $0 Broadway Ave. Pacheco Ave. Claus Dr. II 0.13 $0 $5, $4,600 $5,900 $58,000 Total Class II Bicycle Lanes $68,500 Base cost for installation of a typical Class II Bicycle Lane is $17,600/mi; additional costs based on roadway widening and grading. Class III Facilities - Signed Bicycle Routes (On-Street) Segment Name Begin End Class Length Near-term Mid-term Long-term Belmont Ave. Kent Ave. Pastori Ave. III 0.06 $100 $0 $0 Blackberry Ln. Creek Rd. Forrest Ave. III 0.04 $100 $0 $0 Bolinas Rd. Broadway Blvd. Porteous Ave. III - Sharrows 0.48 $2,400 $0 $0 FAIRFAX BICYCLE AND PEDESTRIAN MASTER PLAN 51 FEBRUARY 2008 FINAL PLAN
80 Segment Name Begin End Class Length Near-term Mid-term Long-term Cascade Dr. Bolinas Rd. Canyon Rd. III - Shar/ TrafCalm 0.94 $2,800 $169,200 $0 Cascade Dr. Canyon Rd. Cascade Fire Road III - Shar/ TrafCalm 0.50 $1,000 $0 $91,500 Claus Dr. Sir Francis III - Broadway Blvd. Drake Blvd. Sharrows 0.02 $400 $0 $0 Creek Rd. Porteous Ave. Dominga Ave. III - Shar/ TrafCalm 0.20 $1,000 $36,500 $0 Dominga Ave. Creek Rd. Napa Ave. III - Shar/ TrafCalm 0.25 $1,200 $44,900 $0 Forrest Ave. Meernaa Ave. Fairfax Town Limit III 0.80 $1,600 $0 $0 Glen Dr. Sir Francis Drake Blvd. Fairfax Town Limit III 0.46 $900 $0 $0 Hill Ave. Ramona Ave. Kent Ave. III 0.11 $200 $0 $0 Segment Name Begin End Class Length Near-term Mid-term Long-term Kent Ave. Belmont Ave. Sir Francis Drake Blvd. III 0.09 $200 $0 $0 Lansdale Ave. Center Blvd. Fairfax Town Limit III - Shar/ TrafCalm 0.16 $500 $0 $28,800 Manor Rd. Olema Rd. Olema Rd. III - Shar/ TrafCalm 0.19 $1,000 $34,200 $0 Manor Rd.* Olema Rd. Scenic Rd. III - Shar/ TrafCalm 0.13 $400 $23,600 $0 Napa Ave. Dominga III - Shar/ Pacheco Ave. Ave. TrafCalm 0.06 $300 $11,000 $0 Oak Manor Dr. Sir Francis Drake Blvd. Manor Elem. Sch. III 0.19 $400 $0 $0 Pacheco Ave. Napa Ave. Center Blvd. III - Shar/ TrafCalm 0.05 $200 $8,500 $0 Park Rd. Spruce Rd. Bolinas Rd. III - Shar/ TrafCalm 0.23 $1,200 $41,600 $0 Pastori Ave. Sir Francis Drake Blvd. Porteous Ave. Bolinas Rd. Meernaa Ave. Rockridge Rd. Iron Springs Rd. Center Blvd. III 0.05 $100 $0 $0 III - Shar/ TrafCalm 0.41 $2,100 $74,300 $0 Manor Rd. III 0.13 $300 $0 $0 Scenic Rd.* Manor Rd. Azalea Ave. III - Shar/ TrafCalm 0.20 $600 $36,400 $0 Sequoia Rd. Scenic Rd. Spruce Rd. III - Shar/ TrafCalm 0.19 $1,000 $34,700 $0 Sherman St. Bolinas Rd. Dominga Ave. III 0.05 $100 $0 $0 III - Shar/ Spruce Ave. Sequoia Rd. Azalea Ave. TrafCalm 0.17 $900 $30,600 $ $21,000 $545,500 $120,300 Total Class III Bicycle Routes $686,800 Base cost for installation of a typical Class III Signed Bicycle Route is $2,000/mi; additional costs based on shared lane and school bike route stencils and traffic calming. Total cost of improvements by phase (Near/Mid/Long-Term) $25,500 $551,400 $853,300 Total cost of bikeway network (complete buildout) $1,430,200 FAIRFAX BICYCLE AND PEDESTRIAN MASTER PLAN 52 FEBRUARY 2008 FINAL PLAN
81 Table 6-2 Bicycle Detection Estimated Costs* Approximate Cost Per Leg of Item Intersection Calibrate existing loops $300 Calibrate or re-zone existing video detection $150 Install new detection loops $3,000 Install new zoned video detection $5,000 Install stencils $100 * Costs based on US DOT information available as of April Intersections SFD at Oak Manor Dr SFD at Claus Dr SFD at Pastori Ave SFD at Kent Ave Table 6-3 Bicycle Detection Locations Number of Legs of Intersection Total number locations 15 Exact cost estimates cannot be provided for these projects because existing conditions at the candidate intersections were not known as of this writing. However, based on 4 candidate on-street bikeway signalized intersections with a total of 15 potential locations for bicycle detection and assuming that 50% of the locations have functional loop detectors that can be recalibrated to detect bicycles, the total cost estimate for this project is approximately $24,900. It should be noted that this cost estimate is speculative at best. Real costs cannot be identified until a further survey of existing conditions is completed and bicycle detection improvements may also be implemented as part of other intersection improvements. Table 6-4 Bicycle Parking Locations Location Recommended Number Additional Racks Cost Per Location On Sidewalk* Fairfax Theater 2 $500 Bev s Hair Design 1 $250 Fairfax Lumber 1 $250 IGA/Fairfax Cyclery 2 $500 Peri s Deli 1 $250 Lotus Café 1 $250 Quality Liquors 1 $250 Barefoot Cafe 1 $250 On-Street** Grilly s 1 $1,600 Fairfax Scoop 1 $1,600 School Locations*** FAIRFAX BICYCLE AND PEDESTRIAN MASTER PLAN 53 FEBRUARY 2008 FINAL PLAN
82 Location Recommended Number Additional Racks Cost Per Location White Hill School 5 $1250 Manor School 15 $14,000*** Total $21,000 *Costs are based on inverted-u style racks with two-bike capacity; costs may be higher if alternate rack design is used **Costs are based on free-standing multiple-element rack with 12-bike capacity and flexible plastic posts. ***Cost includes adding 15 new inverted-u style racks, paving entire existing parking area and weather-protecting shelter for 50% of racks (assuming fewer riders in inclement weather) Table 6-5 Informational Kiosk Locations Location Notes Cost Per Location Java Hut Parking Lot New $1,200 Parkade at Transit Stop New $1,200 Sir Francis Drake Replace/relocate $1,200 Boulevard/Lansdale Avenue Sir Francis Drake Boulevard/Olema Road Replace/relocate $1,200 Totals $4,800 Table 6-6 Example Pedestrian Improvements Cost Estimates by Segment* Segment Name Begin End Length Near-term Mid-term Long-term Bolinas Rd. Broadway Blvd. Porteous Ave $2,200 $40,000 $0 Broadway Ave. Pacheco Ave. Claus Dr $2,200 $60,000 $0 Cascade Dr. Bolinas Rd. Canyon Rd $13,800 $40,000 $525,000 Cascade Dr. Canyon Rd. Cascade Fire Road 0.50 $0 $0 $0 Center Blvd. Pastori Ave. Pacheco Ave $1,085,350 $0 $0 Creek Rd. Porteous Ave. Dominga Ave $0 $53,500 $0 Dominga Ave. Creek Rd. Napa Ave $11,000 $0 $0 Elsie/Mono/Bank Project Broadway Ave. Bolinas Rd $0 $0 $175,000 Glen Dr. Sir Francis Drake Blvd. Fairfax Town Limit 0.46 $48,000 $0 $0 Lansdale Ave. Center Blvd. Fairfax Town Limit 0.16 $0 $0 $120,000 Manor Rd. Olema Rd. Olema Rd $10,400 $0 $0 Napa Ave. Dominga Ave. Pacheco Ave $9,200 $0 $0 Oak Manor Dr. Sidewalk Oak Manor Drive/Sir Francis Drake Boulevard Crosswalk and Pedestrian Beacon Sir Francis Drake Blvd. Oak Manor Drive/Sir Francis Drake Boulevard Manor Elem. Sch $54,500 $0 $0 Oak Manor Drive/Sir Francis Drake Boulevard 0.00 $147,000 $0 $0 Pacheco Ave. Napa Ave. Center Blvd $11,000 $0 $0 Park Rd. Spruce Rd. Bolinas Rd $9,200 $0 $0 Pastori Ave. Sir Francis Drake Blvd. Center Blvd $50,000 $0 $0 Porteous Ave. Bolinas Rd. Meernaa Ave $0 $0 $138,000 FAIRFAX BICYCLE AND PEDESTRIAN MASTER PLAN 54 FEBRUARY 2008 FINAL PLAN
83 Segment Name Begin End Length Near-term Mid-term Long-term Scenic Rd. Manor Rd. Azalea Ave $9,200 $0 $0 Sequoia Rd. Scenic Rd. Spruce Rd $9,200 $0 $0 Sir Francis Drake Blvd. Crosswalk Improvements Sir Francis Drake Blvd. Sidewalk Project Pacheco Ave. Claus Dr $2,200 $294,000 $0 Olema Rd. Claus Dr $0 $80,000 $0 Spruce Ave. Sequoia Rd. Azalea Ave $9,200 $44,900 $ $1,483,650 $612,400 $958,000 Total Pedestrian Improvements $3,054,050 *Costs such as traffic calming and the Hawthorne Ct. Bridge included in the bicycle facilities estimates are not duplicated here; concept-level cost estimates for curb ramps are included for segments outside the downtown area; an ADA compliance field review is needed to refine these cost estimates MAINTENANCE Additional maintenance costs for the bikeway and pedestrian network should be relatively low due to the limited number of new Class I pathway and sidewalk facilities. The recommended bikeway network is predominately made up of on-street bike lanes and routes that will be treated as part of the normal roadway maintenance program. As part of routine maintenance, extra emphasis should be put on keeping the bike lanes and roadway shoulders clear of debris and keeping vegetation overgrowth from blocking visibility, creeping into the roadway or obstructing sidewalks MARKETING THE BICYCLE AND PEDESTRIAN MASTER PLAN The success of the Fairfax Bicycle and Pedestrian Master Plan depends largely on the community s acceptance and promotion of the Plan s contents. Town departments and commissions should incorporate the policies, objectives and spirit of the Bicycle and Pedestrian Master Plan into their respective projects and responsibilities. The following steps will help ensure the plan becomes a living document, helping shape Fairfax s future. Distribute copies of the Plan to members of the Planning Commission Distribute copies of the Plan to Town of Fairfax s Engineering, Parks and Recreation, Planning, Police, and Public Works Departments. Provide copies of the Town of Fairfax bicycle facilities map to local schools, bicycle and recreational groups, transit agencies, bicycle shops and major employers. Post the plan on the Town s website. Publish a press release about the creation of the plan. Provide a copy of Fairfax Bicycle and Pedestrian Master Plan to the public library. FAIRFAX BICYCLE AND PEDESTRIAN MASTER PLAN 55 FEBRUARY 2008 FINAL PLAN
84 6.6. FUNDING OPPORTUNITIES FEDERAL FUNDING SOURCES The primary federal source of surface transportation funding including bicycle and pedestrian facilities is SAFETEA-LU, the Safe, Accountable, Flexible, Efficient Transportation Equity Act: A Legacy for Users. SAFETEA-LU is the fourth iteration of the transportation vision established by Congress in 1991 with the Intermodal Surface Transportation Efficiency Act (ISTEA) and renewed in 1998 and 2003 through the Transportation Equity Act for the 21st Century (TEA-21) and the Safe, Accountable, Flexible, and Efficient Transportation Equity Act of 2003 (SAFETEA). Also known as the federal transportation bill, the $286.5 billion SAFETEA-LU bill was passed in 2005 and authorizes Federal surface transportation programs for the five-year period between 2005 and SAFETEA-LU funding is administered through the State (Caltrans and the State Resources Agency) and regional planning agencies. Most, but not all, of these funding programs are oriented toward transportation versus recreation, with an emphasis on reducing auto trips and providing inter-modal connections. SAFETEA-LU programs require a local match of 11.47%. SAFETEALU funding is intended for capital improvements and safety and education programs and projects must relate to the surface transportation system. Specific funding programs under SAFETEA-LU include: Congestion Mitigation and Air Quality (CMAQ) Funds projects that are likely to contribute to the attainment of national ambient air quality standards Recreational Trails Program $370 million nationally through 2009 for non-motorized trail projects Safe Routes to School Program $612 million nationally through 2009 Transportation, Community and System Preservation Program $270 million nationally over five years Federal Lands Highway Funds Approximately $1 billion dollars are available nationally through 2009 FEDERAL LANDS HIGHWAY FUNDS Federal Lands Highway Funds may be used to build bicycle and pedestrian facilities in conjunction with roads and parkways at the discretion of the department charged with administration of the funds. The projects must be transportation-related and tied to a plan adopted by the State and MPO. Federal Lands Highway Funds may be used for planning and construction. FUNDING GLOSSARY CTC California Transportation Commission FHWA Federal Highway Administration MPO Metropolitan Planning Organization RTIP Regional Transportation Improvement Program RTP Regional Transportation Plan RTPA Regional Transportation Planning Agency SAFETEA-LU Safe, Accountable, Flexible, Efficient Transportation Equity Act: A Legacy for Users TRANSPORTATION, COMMUNITY AND SYSTEM PRESERVATION PROGRAM The Transportation, Community and System Preservation (TCSP) STIP State Transportation Improvement Program FAIRFAX BICYCLE AND PEDESTRIAN MASTER PLAN 56 FEBRUARY 2008 FINAL PLAN
85 Program provides federal funding for transit oriented development, traffic calming and other projects that improve the efficiency of the transportation system, reduce the impact on the environment, and provide efficient access to jobs, services and trade centers. The program is intended to provide communities with the resources to explore the integration of their transportation system with community preservation and environmental activities. TCSP Program funds require a 20% match. REGIONAL SURFACE TRANSPORTATION PROGRAM The Regional Surface Transportation Program (RSTP) is a block grant program which provides funding for bicycle and pedestrian projects, among many other transportation projects. Under the RSTP, Metropolitan Planning Organizations, such as MTC, prioritize and approve projects which will receive RSTP funds. TAMC distributes the RSTP funds to local jurisdictions. Metropolitan planning organizations can transfer funding from other federal transportation sources to the RSTP program in order to gain more flexibility in the way the monies are allocated. In California, 62.5% of RSTP funds are allocated according to population. The remaining 37.5% is available statewide. REGIONAL TRANSPORTATION IMPROVEMENT PROGRAM The Regional Transportation Improvement Program (RTIP) is a derivative of the STIP program and identifies projects which are needed to improve regional transportation. Such projects may include bicycle and pedestrian facilities, safety projects and grade separation, among many others. RTIP project planning, programming and monitoring may be funded up to.5% of total RTIP funds in urbanized regions and 2% of total RTIP funds in non-urbanized regions. Each RTPA prepares a RTIP, consisting of projects to be funded through STIP. The RTPA s Regional Transportation Plan helps prioritize projects for the RTIP. RTIPs must be approved by the CTC. Projects to be funded by RTIP funds must be identified in the current or next Regional Transportation Plan. RECREATIONAL TRAILS PROGRAM The Recreational Trails Program of SAFETEA-LU provides funds to states to develop and maintain recreational trails and trail-related facilities for both non-motorized and motorized recreational trail uses. Examples of trail uses include hiking, bicycling, in-line skating, equestrian use, and other nonmotorized as well as motorized uses. In California, the funds are administered by the California Department of Parks and Recreation. RTP projects must be ADA compliant. Recreational Trails Program funds may be used for: Maintenance and restoration of existing trails; Purchase and lease of trail construction and maintenance equipment; Construction of new trails; including unpaved trails; Acquisition of easements or property for trails; State administrative costs related to this program (limited to seven percent of a State's funds); and Operation of educational programs to promote safety and environmental protection related to trails (limited to five percent of a State's funds). FAIRFAX BICYCLE AND PEDESTRIAN MASTER PLAN 57 FEBRUARY 2008 FINAL PLAN
86 LAND AND WATER CONSERVATION FUND Land and Water Conservation Fund is a federally funded program that provides grants for planning and acquiring outdoor recreation areas and facilities, including trails. The Fund is administered by the National Parks Service and the California Department of Parks and Recreation and has been reauthorized until Cities, counties and districts authorized to acquire, develop, operate and maintain park and recreation facilities are eligible to apply. Applicants must fund the entire project, and will be reimbursed for 50% of costs. Property acquired or developed under the program must be retained in perpetuity for public recreational use. The grant process for local agencies is competitive, and 40% of grants are reserved for Northern California. In 2006, approximately $480,000 was available for projects in Northern California. RIVERS, TRAILS AND CONSERVATION ASSISTANCE PROGRAM The Rivers, Trails and Conservation Assistance Program (RTCA) is a National Parks Service program which provides technical assistance via direct staff involvement, to establish and restore greenways, rivers, trails, watersheds and open space. The RTCA program provides only for planning assistance there are no implementation monies available. Projects are prioritized for assistance based upon criteria which include conserving significant community resources, fostering cooperation between agencies, serving a large number of users, encouraging public involvement in planning and implementation and focusing on lasting accomplishments. STATEWIDE FUNDING SOURCES The State of California uses both federal sources and its own budget to fund the following bicycle and pedestrian projects and programs. BICYCLE TRANSPORTATION ACCOUNT The Bicycle Transportation Account (BTA) provides state funding for local projects that improve the safety and convenience of bicycling for transportation. Because of its focus on transportation, BTA projects, including trail, must provide a transportation link. Funds are available for both planning and construction. BTA funding is administered by Caltrans and cities and counties must have an adopted Bicycle Transportation Plan in order to be eligible. Town Bicycle Transportation Plans must be approved by the local MPO prior to Caltrans approval. Out of $5 million available statewide, the maximum amount available for individual projects is $1.2 million. WILDLIFE CONSERVATION BOARD PUBLIC ACCESS PROGRAM Funding for the acquisition of lands or improvements that preserve wildlife habitat or provide recreational access for hunting, fishing or other wildlife-oriented activities. Up to $250,000 dollars available per project, applications accepted quarterly. Projects eligible for funding include interpretive trails, river access, and trailhead parking areas. The State of California must have a proprietary interest in the project. Local agencies are generally responsible for the planning and engineering phases of each project. CALIFORNIA CONSERVATION CORPS The California Conservation Corps (CCC) is a public service program which occasionally provides assistance on construction projects. The CCC may be written into grant applications as a project FAIRFAX BICYCLE AND PEDESTRIAN MASTER PLAN 58 FEBRUARY 2008 FINAL PLAN
87 partner. In order to utilize CCC labor, project sites must be public land or be publicly accessible. CCC labor cannot be used to perform regular maintenance, however, they will perform annual maintenance, such as the opening of trails in the spring. SAFE ROUTES TO SCHOOL (SR2S) In September 2004, with the passage of SB 1087 (Soto), the State extended Safe Routes to School legislation for three additional years. The bill is scheduled to sunset on January 1, This program is meant to improve the safety of walking and cycling to school and encourage students to walk and bicycle to school through identification of existing and new routes to school and construction of pedestrian and bicycle safety and traffic calming projects. Caltrans is currently evaluating California s SR2S funding, in light of the new federal SR2S Program. Recent SAFETEA- LU legislation which requires each state s Department of Transportation to designate a SR2S Coordinator, also contains a SR2S program, but as of this writing, whether or not these programs will be combined in California or will remain autonomous has not yet been determined. ENVIRONMENTAL JUSTICE: CONTEXT SENSITIVE PLANNING GRANTS The Caltrans-administered Environmental Justice: Context Sensitive Planning Grants promotes context sensitive planning in diverse communities and funds planning activities that assist lowincome, minority and Native American communities to become active participants in transportation planning and project development. Grants are available to transit districts, cities, counties and tribal governments. This grant is funded by the State Highway Account at $1.5 million annually state-wide. Grants are capped at $250,000. OFFICE OF TRAFFIC SAFETY (OTS) GRANTS The California Office of Traffic Safety distributes federal funding apportioned to California under the National Highway Safety Act and SAFETEA-LU. Grants are used to establish new traffic safety programs, expand ongoing programs or address deficiencies in current programs. Bicycle and pedestrian safety are included in the list of traffic safety priority areas. Eligible grantees are: governmental agencies, state colleges, and state universities, local Town and County government agencies, school districts, fire departments and public emergency services providers. Grant funding cannot replace existing program expenditures, nor can traffic safety funds be used for program maintenance, research, rehabilitation or construction. Grants are awarded on a competitive basis, and priority is given to agencies with the greatest need. Evaluation criteria to assess need include: potential traffic safety impact, collision statistics and rankings, seriousness of problems, and performance on previous OTS grants. OTS expects to have $56 million in funding available statewide for FY 2006/07. COMMUNITY BASED TRANSPORTATION PLANNING DEMONSTRATION GRANT PROGRAM This fund, administered by Caltrans, provides funding for projects that exemplify livable community concepts including bicycle and pedestrian improvement projects. Eligible applicants include local governments, MPO s and RPTA s. A 20% local match is required and projects must demonstrate a transportation component or objective. There are $3 million dollars available annually statewide. COASTAL CONSERVANCY NON-PROFIT GRANTS PROGRAM The Coastal Conservancy provides grants to non-profit organizations for projects which provide access to the California coast and preserve coastal lands, including the construction of trails, public piers, urban waterfronts, and other public access facilities. FAIRFAX BICYCLE AND PEDESTRIAN MASTER PLAN 59 FEBRUARY 2008 FINAL PLAN
88 REGIONAL FUNDING SOURCES Regional bicycle and pedestrian grant programs come from a variety of sources, including SAFETEA-LU, the State budget and vehicle registration fees. AB 2766 MOTOR VEHICLE EMISSION REDUCTION GRANT PROGRAM The Bay Area Air Quality Management District provides a grant program in accordance with Assembly Bill 2766 which authorized air districts in California to impose a two to four dollar motor vehicle registration fee to be used for the purpose of reducing motor vehicle emissions in order for air districts to meet their responsibilities under the California Clean Air Act. Projects include bicycle facility improvements, safety and enforcement. Proposals must demonstrate the relationship between reduced motor vehicle emissions and improved air quality. TRANSPORTATION FOR LIVABLE COMMUNITIES PROGRAM The Transportation for Livable Communities Program (TLC) provides grant monies to public agencies to encourage land use decisions that support compact, pedestrian and bicycle friendly development near transit hubs. MTC administers the TLC program with funds from the Regional Surface Transportation Project. TLC grants are capped at $400,000 and are competitive. TRANSPORTATION ENHANCEMENT PROGRAM The Transportation Enhancement Program provides funds for the construction of projects, beyond the scope of typical transportation projects, which enhance the transportation system. Transportation Enhancement Projects may include landscaping, bicycle facilities and streetscape improvements. Transportation Enhancement projects are programmed as part of the STIP. Annual apportionment averages around $800,000. TRANSPORTATION FUND FOR CLEAN AIR PROGRAM (TFCA) TFCA funds are generated by a four dollar surcharge on automobile registration fees in the ninecounty Bay Area. Approximately $20 million is collected annually which funds two programs: 60 percent of the TFCA monies go to the Regional Fund and 40 percent go to the County Program Manager Fund. The Regional Fund is administered by the Bay Area Air Quality Management District (BAAQMD). Pedestrian infrastructure improvements are eligible for TFCA funds through the Smart Growth funding category. BAAQMD, TFCA Program: REGIONAL BICYCLE AND PEDESTRIAN PROGRAM (RBPP) The RBPP was created in 2003 as part of the long range Transportation 2030 Plan developed by the Bay Area Metropolitan Transportation Commission. The program currently funded with Congestion Mitigation and Air Quality funds funds regionally significant pedestrian and bicycle projects, and bicycle and pedestrian projects serving schools or transit. $200 million dollars are committed to this program over the 25-year period. Seventy five percent of the total funds are allocated to the county congestion management agencies based on population. The remaining 25 percent of funds are regionally competitive, with the county CMAs recommending the projects to be submitted to MTC for funding consideration. Metropolitan Transportation Commission, RBPP Program FAIRFAX BICYCLE AND PEDESTRIAN MASTER PLAN 60 FEBRUARY 2008 FINAL PLAN
89 SAFE ROUTES TO TRANSIT (SR2T) Regional Measure 2 (RM2), approved in March 2004, raised the toll on seven state-owned Bay Area bridges by one dollar for 20 years. This fee increase funds various operational improvements and capital projects which reduce congestion or improve travel in the toll bridge corridors. Twenty million dollars of RM2 funding is allocated to the Safe Routes to Transit Program, which provides competitive grant funding for capital and planning projects that improve bicycle and pedestrian access to transit facilities. Eligible projects must be shown to reduce congestion on one or more of the Bay Area s toll bridges. The competitive grant process is administered by the Transportation and Land Use Coalition and the East Bay Bicycle Coalition. Competitive funding is awarded in five $4 million grant cycles. The first round of funding was awarded in December Future funding cycles will be in 2007, 2009, 2011 and Transportation and Land Use Coalition, SR2T Program: THE BAY TRAIL PROJECT The Bay Trail Grant program offers competitive grants to local governments, special districts and qualified nonprofit groups to build or design new Bay Trail segments. The program is structured to: speed Bay Trail construction by targeting high-priority, ready to build sections and closing critical gaps; leverage state dollars with significant matching funds and in-kind contributions; foster partnership by encouraging cooperative partnerships and creative design solutions; and employ the California Conservation Corps for construction, landscaping and maintenance where possible. The amount of available funding varies, depending on State bonds and grants to the Bay Trail Project. Beginning Fall 2007 the Bay Trail has a new funding program that will distribute $2.5 million in Proposition 84 funds for the planning and construction of Bay Trail spine segments in the 9-county area. Another $2.5 million grant program is anticipated in Bay Trail Project Grant Program: LOCAL FUNDING SOURCES TDA ARTICLE 3 Transportation Development Act (TDA) Article 3 funds are state block grants awarded annually to local jurisdictions for transit, bicycle and pedestrian projects in California. Funds for pedestrian projects originate from the Local Transportation Fund (LTF), which is derived from a ¼ cent of the general state sales tax. LTF funds are returned to each county based on sales tax revenues. Eligible pedestrian and bicycle projects include: construction and engineering for capital projects; maintenance of bikeways; bicycle safety education programs (up to 5% of funds); and development of comprehensive bicycle or pedestrian facilities plans. A Town or county is allowed to apply for funding for bicycle or pedestrian plans not more than once every five years. These funds may be used to meet local match requirements for federal funding sources. 2% of the total TDA apportionment is available for bicycle and pedestrian funding. FAIRFAX BICYCLE AND PEDESTRIAN MASTER PLAN 61 FEBRUARY 2008 FINAL PLAN
90 MEASURE A LOCAL ROADS The funds (approximately $43.9 M) will be distributed on an annual basis to each city, town, and Marin County based on a combination of miles of roads to be maintained and population. Each project will be required to consider the needs of all roadway users. Where feasible, locally defined bicycle and pedestrian projects may be implemented at the time a roadway is improved, or can be implemented as a stand-alone project. Improvements could include striping and signing for bicycle lanes and bikeways, sidewalk improvements, curb ramps, and other accessibility and safety improvements. MEASURE A SAFE PATHWAYS FUNDING Safe Pathways to School is the capital improvement element of the Transportation Authority of Marin s Safe Routes to Schools program. Where the Safe Routes program identifies circulation improvements needed for safe access to schools, the Safe Pathways program will provide funding for the engineering, environmental clearance, and construction of pathway and sidewalk improvements in all Marin County communities, including safety improvements at street crossings. Safe Pathway projects are expected to attract matching funds from other sources and may be used in combination with road funds to accelerate pathway improvements in school areas. Safe Pathways Projects are selected based on performance criteria that focus on improving safety throughout the County. All projects will come from approved Safe Routes plans, supported by parents, school officials, and the local jurisdiction. Relieves an identified safety or congestion problem along a major school route Completes a "gap" in the bicycle and pedestrian system along a major school route Maximizes daily uses by students and others Attracts matching funds Respects geographic equity MARIN NONMOTORIZED TRANSPORTATION PILOT PROGRAM Marin County is one of four communities nationally that has been selected by Congress to participate in a Nonmotorized Transportation Pilot Program under Section 1807 of the 2005 federal transportation bill, SAFETEA-LU. Section 1807 provides for $20 million to each of the four communities for fiscal years 2006 through The legislation states that "The Secretary shall establish and carry out nonmotorized transportation pilot program to construct, in the following four communities selected by the Secretary, a network of nonmotorized transportation infrastructure facilities, including sidewalks, bicycle lanes, and pedestrian and bicycle trails, that connect directly with transit stations, schools, residences, businesses, recreation areas, and other community activity centers: 1. Columbia, Missouri 2. Marin County, California 3. Minneapolis-St. Paul, Minnesota 4. Sheboygan County, Wisconsin FAIRFAX BICYCLE AND PEDESTRIAN MASTER PLAN 62 FEBRUARY 2008 FINAL PLAN
91 The purpose of the program shall be to demonstrate the extent to which bicycling and walking can carry a significant part of the transportation load, and represent a major portion of the transportation solution, within selected communities." As of this writing Marin County is determining the process by which funding will be distributed and local agencies will apply or submit projects for consideration. FAIRFAX MEASURE F Measure F is a dwelling unit parcel tax created as self-help funding intended to provide $425,000 per year for each of five years to fund police, fire and other essential Town services. The funding can be used for Public Works projects such as bicycle, pedestrian and Safe Routes to Schools as well as for matching funds to leverage regional, state and federal funding sources. NON-TRADITIONAL FUNDING SOURCES AMERICAN GREENWAYS PROGRAM Administered by The Conservation Fund, the American Greenways Program provides funding for the planning and design of greenways. Applications for funds can be made by local regional or state-wide non-profit organizations and public agencies. The maximum award is $2,500, but most range from $500 to $1,500. American Greenways Program monies may be used to fund unpaved trail development. CALIFORNIA CENTER FOR PHYSICAL ACTIVITY GRANT PROGRAM The California Center for Physical Activity runs several programs related to walking and offers small grants to public health departments. Grants are in the amount of $4,999 dollars or less and are offered intermittently. REQUIREMENTS FOR NEW DEVELOPMENTS With the increasing support for routine accommodation and complete streets, requirements for new development, road widening and new commercial development provide opportunities to efficiently construct pedestrian facilities. IMPACT FEES One potential local source of funding is developer impact fees, typically tied to trip generation rates and traffic impacts produced by a proposed project. A developer may attempt to reduce the number of trips (and hence impacts and cost) by paying for on- and off-site pedestrian improvements designed to encourage residents, employees and visitors to the new development to walk rather than drive. Establishing a clear nexus or connection between the impact fee and the project s impacts is critical to ensure legal soundness. MELLO-ROOS COMMUNITY FACILITIES ACT The Mello-Roos Community Facilities Act was passed by the Legislature in 1982 in response to reduced funding opportunities brought about by the passage of Proposition 13. The Mello-Roos Act allows any county, Town, special district, school district or joint powers of authority to establish a Community Facility Districts (CFD) for the purpose of selling tax-exempt bonds to fund public improvements within that district. CFDs must be approved by a two-thirds margin of qualified FAIRFAX BICYCLE AND PEDESTRIAN MASTER PLAN 63 FEBRUARY 2008 FINAL PLAN
92 voters in the district. Property owners within the district are responsible for paying back the bonds. Pedestrian facilities are eligible for funding under CFD bonds. VOLUNTEER AND PUBLIC-PRIVATE PARTNERSHIPS Volunteer programs may substantially reduce the cost of implementing some of the proposed pathways. Use of groups such as the California Conservation Corp (who offers low cost assistance) will be effective at reducing project costs. Local schools or community groups may use the bikeway or pedestrian project as a project for the year, possibly working with a local designer or engineer. Work parties may be formed to help clear the right of way where needed. A local construction company may donate or discount services. A challenge grant program with local businesses may be a good source of local funding, where corporations adopt a bikeway and help construct and maintain the facility. Other opportunities for implementation will appear over time that may be used to implement the system. FAIRFAX BICYCLE AND PEDESTRIAN MASTER PLAN 64 FEBRUARY 2008 FINAL PLAN
93 APPENDICES: HOUSING
94
95 T OWN OF F AIRFAX GENERAL P LAN HOUSING E LEMENT A PPENDIX APPENDIX H A: DEFINITIONS Accessible Housing: Units accessible and adaptable to the needs of the physically handicapped. Accessory Dwelling Unit (ADU): Small additions to a larger residential unit that can provide housing opportunities for elderly family members, grown children or unrelated renters. Flexible space that can be used for a home office. The unit must be under the same ownership as the principal building. One additional parking space is required. The basic amenities include a bedroom, a bath, and a small kitchen. Also known as granny flats, mother-in-law units, garage apartments, and ancillary units. Housing Affordability: The generally accepted measure for determining whether a person can afford housing means spending no more than 30 percent of one s gross household income on housing costs, including principal, interest, property taxes and insurance. For example, a middle school teacher earning $70,493 per year should be able to afford $1,552 per month for housing, either for rent or mortgage financing. A postal clerk earning $45,676 should be able to afford monthly payments up to $1,442. Households paying more than 30 percent of their income on housing are considered overpaying households by the U.S. Census. Income Limits: Income limits are updated annually by the U.S. Department of Housing and Urban Development (HUD) for Marin County. For many State and local programs, the State Department of Housing and Community Development (HCD) income eligibility limits are used. HCD income limits regulations are similar to those used by HUD. The most recent HCD income limits can be assessed on-line at Income limits as defined by California Housing Element law are: Extremely Low Income Housing: Households earning less than 30 percent of the median household income-or less than $33,950 in 2008 for a four person household. Low (Lower) Income Household: Households earning less than 80 percent of the median household income or a family of four earning $90,500 in Moderate Income Household: Households earning percent of the median income for a family of four or a household of four earning between $90,500 and $114,000 in Above Moderate Income Households: Households earning over 120 percent of the median household income or a family of four earning $114,000 in ADOPTED APRIL 4,
96 H OUSING E LEMENT A PPENDIX TOWN OF F AIRFAX GENERAL P LAN Median Household Income: The middle point at which half of the Town s households earn more and half earn less. The current median income for a family of four in Marin County is $86,100 per year. Persons per Households: Average number of persons in an individual household. Senior Housing: Defined by California Housing Element law as projects developed for, and put to use as, housing for the Town s senior citizens. Senior citizens are defined as persons 65 years of age, and older. Sustainable Development: Development that maintains or enhances equity, economic opportunity, and community well being while protecting and restoring the natural environment upon which people and economies depend. Sustainable development meets the needs of the present without compromising the ability of future generations to meet their own needs. 2 ADOPTED APRIL 4, 2012
97 T OWN OF F AIRFAX GENERAL P LAN HOUSING E LEMENT A PPENDIX APPENDIX H B: BACKGROUND ANALYSIS Population and Employment Trends This section of the Housing Element describes existing housing and the status of affordable housing programs in Marin County, as a whole, and the Town of Fairfax, in particular. The majority of this data has been taken from Baird & Driskell s 2009 Marin Housing Workbook. Additional data were taken from the Department of Finance, Demographic Research, ABAG, the Town of Fairfax 2006 Housing Element, and Town or locally kept statistics. Marin County Profile and the Town on Fairfax Marin County has many unique qualities. The people who live and work in Marin County have long appreciated the county s exceptional quality of life - its small towns, rolling hills and bay vistas, cultural events, quality schools, creativity, and diversity of thought. Nevertheless, Marin s quality of life faces serious challenges. While quality of life issues in the past focused largely on environmental concerns and personal health and safety, the range of concerns has grown to embrace far more. Quality of life issues now include a vibrant economy, manageable traffic, affordable housing, appreciation of diverse cultures and outlooks, accessible recreational and cultural opportunities and broad community dialogue. Compared to other Bay Area counties, Marin experienced a slow growth in population from 1980 to 1990, adding 7,500 persons (a 3.4 percent increase). Between 1990 and 2000, the County s population increases at 8.8 percent, the more than doubled the rate for the previous decade. Nevertheless, Marin remained the slowest growing area in the Bay Area region. Currently, Marin had a population of 257,406 in Over the next 20 years, between 2010 and 2020, the California Department of Finance projects that Marin County, as a whole, will grow at an average annual rate of about 1,514 people per year. The projected population for the county in the year 2010 is 270,600. The median age has increased significantly from 33.3 years in 1980, to 41.6 years in By the year 2020, Marin is expected to have the oldest population in the State, with a median age of 47.7 years almost 10 years older than the projected statewide median age of 38.1 years. The greatest increases in population age groups over the next 40 years are expected to be elderly and young adult households, which tend to have the lowest income levels. According to the California Department of Finance, the elderly population is ADOPTED APRIL 4,
98 H OUSING E LEMENT A PPENDIX TOWN OF F AIRFAX GENERAL P LAN expected to comprise 26 percent of the population increase in Marin over the next 40 years, with the greatest percentage increase in those elderly over 75 years of age. The Marin Commission on Aging (MCA) predicts even greater increases in Marin s elderly population. By the year 2020, according to MCA, one out of every three Marin residents will be 60 years of age or older. MCA predicts this age group will nearly double in size from 40,000 to 74,000 persons by Three out of four individuals of the oldest old, 85 years of age or greater, are expected to be women. Important Findings of the Needs Analysis Many communities in Marin have a mix of housing, but more affordable rental housing, especially multi-family housing, is needed. According to data provided by Claritas, their owners occupy 66 percent of the dwellings in Marin. With few exceptions, renters occupy the remainder. Approximately 82.5 percent of the housing stock in Marin County is single-family units, with the remaining 17.5 percent being multi-family units or mobile homes. In Fairfax, 61 percent are owner occupied, and 39 percent are renter occupied. Table B-1 indicates the occupancy trend between 1990 and The vacancy rate in Fairfax has been steady at 3.3 percent between 200 and TABLE B 1 HOUSEHOLDS BY TENURE Number Percent Number Percent Number Percent Owner 1,842 60% 2,031 61% 1,991 61% Renter 1,250 40% 1,275 39% 1,277 39% Source: US Census, 1990 and 2000; Claritas, Market rate housing is generally not affordable to extremely low, very low, and low income households. Current estimates indicate that 35 percent of Marin County households are found in the extremely low, very low and low income categories, earning less than 80 percent of the median income. An even greater proportion of very low and low income household are renters. In 2000, an estimated 53 percent of all renters in Marin County were in the extremely low, very low and low income categories, earning less than $64,100 for a four person household. In Fairfax, 24 percent of the population earns less than $35,000, 39 percent earn less than $50,000. New construction for extremely low, 4 ADOPTED APRIL 4, 2012
99 T OWN OF F AIRFAX GENERAL P LAN HOUSING E LEMENT A PPENDIX very low and low income households usually requires some type of project-based or occupant-based subsidy. The affordable housing crisis is especially severe for our highest growing household types younger households (under 44), senior households (65+), and special need populations. Young households and senior household comprise about 72 percent and 10 percent of all households in Fairfax, respectively. According to the State of the Cities Comprehensive Affordability Strategy, 65.6 percent of Extremely Low Income households in Fairfax have housing problems; 77.6 percent of Very Low Income households have housing problems; and 59 percent of Low Income households have housing problems. In addition, 65 percent of Low Income renters and 59 percent of Low Income owners in Fairfax are overpaying (see Tables B2 and B3). Single-family homes are only affordable to above moderate-income households. Due to high prices, the above moderate income housing need should be met by market rate construction of single-family homes. The median priced conventional single-family in Fairfax sold for $749,000 in the first quarter of An income of above $150,000 would be needed to purchase a typical single-family home. T The median priced condominium or townhouse in Fairfax sold for $531,000 in the first quarter of An income significantly above $72,420 per year (the 2008 median income for a Fairfax household) would be needed to purchase a median-priced condominium or townhouse in Fairfax. Relationship of Population, Jobs and Housing The substantial increase in employment in the Bay Area has drawn people to the region. This trend is expected to continue while increasing the demand for housing at all income levels. Nevertheless, according to the State Department of Housing and Community Development (HCD), about 70 percent of the future population growth in California (16 million people by the year 2020) will be due to natural increases in the current population (births over deaths), and only 30 percent is expected to be due to people moving into California from elsewhere. Marin County is projected to have about 16,500 fewer jobs than employed residents in the year Tables B-4 and B-5 below shows the projections for population, households and jobs in Fairfax. ADOPTED APRIL 4,
100 H OUSING E LEMENT A PPENDIX TOWN OF F AIRFAX GENERAL P LAN TABLE B 2 HOUSING PROBLEMS Total Renters Total Owners Total Households Extremely Low Income Percent with any housing problems Percent Cost Burden >30% Percent Cost Burden >50% Very low income Percent with any housing problems Percent Cost Burden >30% Low Income Percent with any housing problems Percent Cost Burden >30% Source: State of the Cities Comprehensive Affordability Strategy (CHAS). TABLE B 3 PERCENT OF LOW INCOME HOUSEHOLDS OVERPAYING Number of households Total Number Overpaying for Housing Percent Overpaying for Housing Renters % Owners % Source: State of the Cities Comprehensive Affordability Strategy (CHAS). The Bay Area s economy has grown significantly since the mid-1990s, becoming one of the most dynamic and innovative regional economies in the world. This economic growth has provided opportunities for many Bay Area residents and resulted in a variety of other benefits for the region. However, as regional economic growth, despite the 2008 economic slump, housing growth has not. While many new jobs were created in the region since 1990, not as many new housing units were built. With demand outpacing supply, the competition for housing has sent rents and sale prices upward. 6 ADOPTED APRIL 4, 2012
101 T OWN OF F AIRFAX GENERAL P LAN HOUSING E LEMENT A PPENDIX TABLE B 4 TOTAL POPULATION FAIRFAX Year Population ,931 Numerical Change Percent Change Average Annual Growth Rate , % 0.5% , % 0.1% , % 0.3% , % 0.0% , % 0.5% , % 0.0% , % 0.0% , % 0.3% Source: ABAG Projections, 2007; US Census, TABLE B 5 PROJECTED JOBS FAIRFAX AND MARIN COUNTY Fairfax Jobs to Housing Ratio Total Population ,319 7,300 7,400 7,400 7,600 7,600 7,600 7,700 Households 3,306 3,310 3,330 3,380 3,440 3,490 3,530 3,570 Total Jobs 1,780 1,820 1,910 1,960 2,030 2,100 2,170 2,240 Marin Jobs to Housing Ratio Total Population , , , , , , , ,100 Households 100, , , , , , , ,800 Total Jobs 134, , , , , , , ,180 Source: ABAG Projections, ADOPTED APRIL 4,
102 H OUSING E LEMENT A PPENDIX TOWN OF F AIRFAX GENERAL P LAN Even with the recent economic downturn, the gap in wages for workers in highly skilled positions and in the retail and personal services sector has grown, and lower wageworkers still have significant difficulty securing affordable housing. Already the mismatch between the location of jobs and housing is straining the region's roadways and environment. As the cost for housing near employment centers has risen, workers have sought more affordable housing in communities farther and farther away from their jobs, compounding traffic congestion. This trend is common in many of the booming regions in California. In 2000, the public employees union (MAPE/SEIU) conducted a survey of over 1,500 of its members working for 14 different agencies, including the County of Marin. The survey focused on housing and found the following: Almost 23 percent of those returning the survey failed to identify themselves as eligible for some sort of housing subsidy or support when indeed they would be eligible. Over 52 percent owned a residence. More than half the renters considered owning a home as their top priority, with Marin down payments and monthly mortgage payments being roughly equal obstacles preventing employees from living close to work. Of the respondents, 74 percent were eligible for a subsidized housing program of some sort according to the income levels established by HUD. By examining County income levels for Union members with a family of one, the Union determined that 94 percent of those employees qualify for assistance, with 57 percent qualifying for Section 8 rental subsidies. The difference between 74 percent and 94 percent may represent the added benefits of spousal income, something the survey could not track. The most frequently reported income was $35,000 per year, which would qualify for a Section 8 subsidy. Over half the respondents had incomes of less than $45,700, which for a family of two also makes them qualified for Section 8 subsidies. Commutes averaged from 34 to 37 minutes and ranged from 5 minutes to 3 hours. Given that this figure represents one direction, members reported spending over an hour per day commuting, slightly above federal statistics from the census for Northern California. 8 ADOPTED APRIL 4, 2012
103 T OWN OF F AIRFAX GENERAL P LAN HOUSING E LEMENT A PPENDIX Fairfax, like Marin County as a whole, is a desirable place to live. The natural beauty of Marin County is complimented by its proximity to the cultural center of the Bay Area, San Francisco. Development in the Town has preserved important physical features such as ridgelines, hillsides, and natural areas, and provided a pleasant living environment. Fairfax is unique in Marin County due to its proximity to the urban corridor yet it has not experienced the growth typical throughout the County. This fact has helped the Town of Fairfax preserve its economic diversity as well as its rich natural setting. In general, Fairfax will experience slight growth in the next 10 to 15 years and the job market will also increase slightly. Between 2010 and 2020, Fairfax, as projected by ABAG, is expected to gain approximately 200 new residents and about 120 new jobs. The Need for Workforce Affordable Housing Matched to Jobs Workforce housing is a critical need throughout Marin as housing costs are relatively high compared to salaries for many local jobs. In the past decade, the supply of jobs has been growing faster than the number of employed residents, indicating that there is a net in-migration of workers. For the next two decades, the Association of Bay Area Governments projects that the majority of new jobs will be in relatively low paying retail sales and service jobs. Statistics from the U.S. Commerce Department s Bureau of Economic Analysis indicate that the average wage of workers in Marin County is only 88 percent of the Bay Area average wage, while housing in the County is relatively expensive compared to some of the salaries these jobs pay. The lack of availability of affordable housing contributes to traffic congestion. Our lack of affordable housing pushes people farther and farther away, commuting within, to and through Marin for job destinations. Very little growth in either population or employment is projected for Marin County over the next 20 years. Congestion is growing about two times the rate of either population or employment growth in the County, but the increase in congestion has very little to do with growth in Marin County. Providing affordable housing and improving the jobs/housing balance can reduce the need for commuting. Creating transit-oriented development (TOD) focused on transit modes is also beneficial, as is creating mixed-use developments that reduce the need for many midday trips." This not only has implications for traffic, but also for the people employed, businesses and services available in the community. ADOPTED APRIL 4,
104 H OUSING E LEMENT A PPENDIX TOWN OF F AIRFAX GENERAL P LAN The lack of affordable housing will impact available services and businesses. The economic impacts of inadequate workforce housing on businesses include: (1) The cost of recruitment and retention of employees; (2) loss of experienced personnel; (3) lost investment in staff training; and (4) money earned locally being spent elsewhere. The economic vitality of smaller businesses and very low wage jobs may also be disproportionately impacted. Public agencies, school districts, social services, and child and elder care givers will continue to have a difficult time attracting people to work in Marin as affordable housing becomes more difficult to attain. There are also safety issues when a large percentage of police, fire and other public safety personnel live out of the area. The GPAC identified the Town s service and emergency personnel as the most important group that should be able to find attainable housing in the community. The projections for Marin County jurisdictions for jobs, households and employed residents indicate that affordable housing is likely to remain a major regional issue for many years, with long-term economic repercussions and significant impacts on the quality of life in the Bay Area and Marin County. There are different ways to examine the balance between jobs and housing in the county. One way is to define it as the ratio resulting from the absolute numbers of jobs divided by the absolute numbers of housing. However, since many households are comprised of two working adults, a jobs/housing ratio of 1.0 does not necessarily connote a balance between housing and jobs. Another way to view jobs/housing balance is to compare total employment (i.e., the number of jobs that exist in Marin County, or a specific jurisdiction) with the number of employed residents (whether their jobs are here or elsewhere). This helps to account for the numerous two wage-earner households that exist. When total employment equals resident employment, with a jobs/employed resident ratio of 1.0, a more accurate measure of balance results than when the comparison is between the number of jobs and the number of houses, because it accounts for the numerous two wage-earner households in existence throughout Marin County. There are many benefits from a balance between jobs and employed residents of 1.0, including improved air quality, less congested freeways, reduced fuel consumption, reduced expenditures on major transportation projects, a labor supply more closely matched to local employment needs, and savings in travel time for both businesses and individuals. However, a 1.0 ratio between jobs and employed residents does not guarantee a re- 10 ADOPTED APRIL 4, 2012
105 T OWN OF F AIRFAX GENERAL P LAN HOUSING E LEMENT A PPENDIX duction in commute trips. Although Marin County, as a whole, has expanded its jobs base, many residents still commute elsewhere to work, while many of the people who work in Marin are living in other communities due to high housing costs and availability, or other lifestyle choices. The analysis of jobs and housing presented above does not address the issue of matching housing costs and types to the needs and incomes of the community s workforce; so, even with a 1:1 ratio of jobs to housing, cities or counties can continue to exchange workers regardless of a correlation of employed residents to total jobs. Over 57 percent of the jobs expected over the next 20 years in Marin County will be in the relatively low-paying services sector. The construction, manufacturing and wholesale sector will comprise 14 percent of the new jobs, retail will be 14 percent, and the remaining 15 percent will include a variety of professional and other jobs. The lack of housing, particularly affordable housing, consistent with the projected lower paid jobs in the services sector, will continue to exacerbate the mismatch of job salaries and housing costs. Relationship of Population and Jobs to Transportation There is projected to be a continuing increase in regional travel activity in the Bay Area as a result of an expanding exurban population and the continuing predominance of the automobile as the primary commute mode. Projections for the Bay Area as a whole show that there will be longer commute travel times. Recommendations currently being considered by the County s Congestion Management Agency conclude that while there is clearly a need for improvements in all modes, and a rational transportation plan for Marin County must emphasize solutions to the problems as they exist today. While population and employment growth in Marin is expected to be lower than any county in the Bay region, except San Francisco, congestion is projected to continue to increase at about two times the rate of either population or jobs growth in the county. It is apparent that the increase in congestion has very little to do with growth in Marin County. Not all solutions to the transportation problems relate to improvements in modes of transportation. These include: Improving the jobs/housing balance in the County to reduce the need for commuting; Creating TOD focused on transit modes; and ADOPTED APRIL 4,
106 H OUSING E LEMENT A PPENDIX TOWN OF F AIRFAX GENERAL P LAN Creating mixed-use developments that avoid the need for many midday trips including targeted placement of day care, convenience retail and other services colocated with employment centers. The number of jobs in a community has implications for the number of houses needed in the area. If there is an inadequate supply of affordable housing, persons working locally will tend to commute from less expensive outlying areas. This problem is manifest in Marin. Although housing has been built, job growth has still outpaced the growth in the housing supply. Furthermore, while Marin housing costs are among the highest in the Bay Area, the payroll from Marin jobs is among the lowest in the region. This imbalance contributes to severe traffic congestion on Highway 101 (the main link between Marin and Sonoma County where housing costs are lower). Facts About Traffic Conditions (Marin County Public Works) What Factors Contribute to Congestion? Each person in Marin County and in the Bay Area is taking more trips per day. More local trips are being made, creating more congestion on arterials and collector routes, as well as adding more short trips on Highway 101. School trips account for 21 percent of the County s morning peak period congestion. Peak periods are spreading, creating longer periods of congestion throughout the day and during critical periods on weekend. The lack of attainable housing pushes people farther and farther away, commuting to and through Marin for job destinations. Congestion is a Local Problem with a Regional Component 77 percent of trips destined for Marin begin in Marin. Marin County residents fill over 50 percent of all jobs in Marin. About 28 percent of Marin County residents are destined for jobs in San Francisco. At the morning peak hour, about half of the trips made from the north via Highway 101 at the Marin/Sonoma County line are destined for jobs in Marin, 24 percent go through Marin en route to San Francisco, and about 20 percent go to the East Bay. 12 ADOPTED APRIL 4, 2012
107 T OWN OF F AIRFAX GENERAL P LAN HOUSING E LEMENT A PPENDIX The proportion of trips destined to Marin and San Francisco from Sonoma is expected to decrease as Sonoma County further develops its own job base. The number of long distance trips to Marin from Solano, Napa and other counties will continue to increase as Marin is still a major destination due to the lack of attainable housing. Solutions Must Focus on the Problem Provide local transit (school bus, local, and express bus, and rail) that brings people from neighborhoods to destinations in Marin. Provide local gap filler and targeted improvements on intersections and arterials that are not operating effectively. Implement transportation demand management programs focused towards employers to encourage carpools and HOV commuting. Provide for Safe Routes to Schools, including bicycles and pedestrian programs and school busing that will encourage parents to stop driving their children to school. Housing Conditions Housing Types and Production in Marin County and Fairfax A variety of housing types are needed to provide shelter for local residents and employees. A housing mix and supply that does not meet the needs of residents can have significant impacts on the cost of housing, whether owner-or renter-occupied. When housing is not added commensurate with job growth, housing costs can increase dramatically over what would occur with normal inflationary increases in value. Marin has experienced this firsthand, especially related to detached single-family dwellings and rental units. Detached single-family homes are the majority of residential units, comprising about 60 percent of the total housing stock in Marin and 68 percent in Fairfax in Apartments are the next most common housing types, with about 29 percent of the total units, while condominiums and town homes provide 9 percent in Marin County. In Fairfax, apartments made up 25 percent of the housing stock in Nationwide, there was a sharp drop in multi-family housing construction during the 1990's that contributed to low vacancy rates and rising rents. According to a study conducted by University of Southern California demographer and planner Dowell Myers, the ADOPTED APRIL 4,
108 H OUSING E LEMENT A PPENDIX TOWN OF F AIRFAX GENERAL P LAN reason for the drop was due to the loss of federal tax credits, local resistance to apartment construction, litigation and liability issues, and population changes. Until the 1990s, single-family and multi-family permits were fairly evenly matched in California. Fairfax issued 23 single-family housing permits between 1996 and 2007, and only two permits for attached units during the same time period. Age and Condition of the Housing Stock Sixty-four percent of the existing homes in Marin County were built more than 30 years ago. 42 percent were built more than 40 years ago. These estimates are based on the 1990 breakdown of housing units by age contained in the U.S. Census, updated with construction data for , and year 2000 census data on total units and occupancy status. 79 percent of the housing stock in Fairfax was constructed before In general, the condition of the housing stock in Marin County is good. Windshield surveys conducted over the past 15 years by various jurisdictions indicate a high level of maintenance and renovation, which is consistent with the high value of housing in the County. Still, there are areas where housing condition is an issue, especially where rental units have deteriorated due to age and lack of maintenance. The Community Development Block Grant Rehabilitation Loan Program provides the greatest amount of funding for rehabilitation. Specific programs include single-family home repair loans, emergency repair and accessibility grants, exterior enhancement rebates, weatherization and home security grants for seniors, and a multi-family rehabilitation loan program. In 2000, 533 Residential Rehabilitation Loans were made to lowincome homeowners in Marin. There are also mandatory multi-family inspection programs to ensure code enforcement and fire safety in multi-family developments. Rehabilitation and Replacement Fairfax is one of the oldest communities in Marin and consequently has a high number of older housing units. At least one-third of the Town s housing units are over 40 years of age and these tend to be concentrated around the downtown. Of the 3,092 occupied housing units, approximately 750 are substandard, and, of the substandard units, it is estimated that 100 should be demolished, according to the Town s Building Official. 14 ADOPTED APRIL 4, 2012
109 T OWN OF F AIRFAX GENERAL P LAN HOUSING E LEMENT A PPENDIX Existing Affordable Housing Stock and Units At Risk Government Code Section requires each city and county to adopt analysis and programs for preserving assisted housing developments. The analysis is required to identify any low-income units that are at risk of losing subsidies over the next 10 years. Based on a study in 2001 conducted by Barbara Collins, Marin County Housing Strategist, there are 3,226 deed restricted affordable housing units currently in Marin County. There are an additional 1,597 proposed units in various stages of the development process. Of those, 943 are planned for the City of Novato, with most of those units as part of the Hamilton Reuse Plan. For planning purposes, deed restrictions for 33.1 percent of the established affordable housing stock will expire in the next 15 years. Developments, which are at risk of expiring through to the year 2006 contain 825 units eligible to convert to market rate units based on funding restrictions, with some exceptions. Of the 825 units, 58 units are designated in the Below Market Rate (BMR) program managed by Marin Housing Authority, and are generally restricted permanently with a slight cost increase to cover resale or legal expenses. Beginning in the year 2007 through 2012 there will be 266 units at risk of converting to market rate. Of these, 91 are BMR units subject to resale controls. Household Characteristics Household Types and Size The Bureau of the Census defines a household as all persons who occupy a housing unit, including families, single people, or unrelated persons. Persons living in retirement or convalescent homes, dormitories, or other group living situations are not considered households. The number of households in Marin County increased from 27,406 in 2000 to in 2008, which is a 1.9 percent increase. During the same time period, Fairfax s household number increased from 3,306 in 2000 to 3,268 in As shown by Table B-7, the average family household size in Fairfax in 2008 was slightly less than that of the county. There were 3,268 households in Fairfax in 2008, of which about 54 percent were families and 45 percent non-family households. Slightly less than one-third (31 percent) were people living alone (with approximately 24 percent of those being individuals age 65, representing about 7 percent of all households). ADOPTED APRIL 4,
110 H OUSING E LEMENT A PPENDIX TOWN OF F AIRFAX GENERAL P LAN TABLE B 6 HOUSEHOLD GROWTH TRENDS (1990 CURRENT) Year Households ,101 Numerical Change Annual Percent Change , % , % Source: US Census 1990 and 2000; Department of Finance E5 Report. TABLE B 7 AVERAGE SIZE OF HOUSEHOLDS Town of Fairfax Marin County xx Source: US Census 1990 and 2000, Department of Finance E5 Report. Households with children comprised 27 percent of all households (1,398 of 3,306) in Sixteen percent of the town s total households consist of individuals age 65 or over (compared to 10 percent for the County average). The average household size in Marin was 2.35 persons per household in The average household size dipped to 2.33 in 1990, but increased to 2.40 in It is expected to increase to 2.41 by 2005 before declining to 2.39 by 2020 (see Table B-8). Compared to the rest of the Bay Area, Marin County s average household size is significantly lower, averaging 0.3 fewer persons per household. With a lower average rate of occupancy, more residential units will be required to accommodate any given increases in population. However, small households generate less impact on a per unit basis than larger households. High housing prices can force people to share living accommodations, thereby increasing household size. However, Marin s aging population, discussed earlier, also reduces the occupancy rate as children move out and mortality increases. On average, renter households in Marin (2.21 persons per household in 2000) are slightly smaller than owner households (2.42 persons per household in 2000) (see Table B-9). The 1990 Fairfax Housing Element predicted that the average household size would decrease by Current predictions indicate that the average household size will slightly increase and will also remain relatively close to the County average. 16 ADOPTED APRIL 4, 2012
111 T OWN OF F AIRFAX GENERAL P LAN HOUSING E LEMENT A PPENDIX TABLE B 8 HOUSEHOLD TYPE FAIRFAX Category Number Percent Family without kids % Family with kids % Single person 1,029 31% Non family multi person household % Source: US Census TABLE B 9 AGE SUMMARY (AS OF 2008) Number Percent Fairfax Marin County State Average Under 18 1,309 18% Under 18 18% 20% 27% Between 18 and 65 5,002 70% Between 18 and 65 70% 66% 62% Over % Over 65 12% 14% 11% Median 41.6 xx Median Source: US Census 2000, Claritas Housing Tenure (Ownership and Rental Housing) According to the 2000 census, there were 2,031 owner-occupied units in Fairfax (61 percent of all units) and 1,275 renter-occupied units (39 percent of the total) in This is a slight increase in the percentage of owner-occupied units in comparison to 1990 (when 60 percent were owner-occupied and 40 percent were rented), which also reflects a higher proportion of single-family homes being built as compared to multi-family units. The same percentages held for 2008 (see Table B-10 below). TABLE B 10 HOUSEHOLDS BY TENURE FAIRFAX Number Percent Number Percent Number Percent Owner 1,842 60% 2,031 61% 1,991 61% Renter 1,250 40% 1,275 39% 1,277 39% Source: US Census, 1990 and 2000; Claritas, ADOPTED APRIL 4,
112 H OUSING E LEMENT A PPENDIX TOWN OF F AIRFAX GENERAL P LAN Vacancy Rate Trends The vacancy rates for housing in Fairfax, as indicated by the Department of Finance are shown in Table B-11 below. Vacancy rates have remained constant between 2000 and The 3.3 percent figure is indicative of a very tight rental housing market in which demand for units exceeds the available supply. Based on rent level surveys, the rental vacancy rate is most likely much tighter for units affordable to very low, low and even moderate-income households. Fairfax is a desirable place to live and has a vacancy rate lower than that of the County. The vacancy rate in Fairfax will most probably decrease over the next ten years. TABLE B 11 VACANCY RATES Change (in Percentage Points) Vacancy Rate 3.3% 3.3% 0.0 Source: Department of Finance E5 Report. In general, a higher vacancy rate is considered necessary by housing experts to assure adequate choice in the marketplace and to temper the rise in home prices. According to the Bay Area Council and Association of Bay Area Governments, a five percent rental vacancy rate is considered necessary to permit ordinary rental mobility. In a housing market with a lower vacancy rate, tenants will have difficulty locating appropriate units and strong market pressure will inflate rents. Thus, the 1990s have seen a significant tightening in the local housing market, a phenomenon that has been experienced in many Bay Area communities. With increased demand, the costs for land and buildings, and rents, will increase proportionally, keeping rents high. Even in an economic downturn, such as the one that began in 2008, it is not expected that rents will go much lower than they are currently. The low and very low-income residents are most dramatically impacted. As stated earlier, the market is generally not providing an adequate supply of multi-family rental housing, especially those attainable at the lower income levels. Conclusions of this analysis underscore the importance of affordable housing to our economy and to the quality of life experienced in Marin and in the Bay Area. In the absence of efforts to increase the supply of affordable housing, higher paid workers will continue to move into the area, displacing lower income workers. Lower income workers will double up in overcrowded conditions, 18 ADOPTED APRIL 4, 2012
113 T OWN OF F AIRFAX GENERAL P LAN HOUSING E LEMENT A PPENDIX commute long distances and will be required to pay more than they can afford for housing. Employers will have increasing difficulty finding workers to fill lower paid positions. Overcrowding The US Census defines overcrowded housing as units with more than one inhabitant per room, excluding kitchen and bathrooms. According to 2000 census data, there are six people with overcrowded conditions in Fairfax. There are no owner occupied or renter occupied units that are severely overcrowded in the Town. TABLE B 12 OVERCROWDING People Percent Not Overcrowded (<1 person per room) 3, Overcrowded (1.5 people per room) Very overcrowded (1.5+ people per room) 0 0 Source: US Census, The census data information indicates that the overall level of overcrowding in the Town has decreased since However, it is likely that census counts of overcrowding underestimate the actual occurrence, as households living in overcrowded situations are unlikely to provide accurate data on other household members who might be living in the unit illegally or in violation of their rental agreement. It is also likely that the incidence of overcrowding has increased over the 1990 levels, given the increase in housing prices relative to local incomes, the increase in the average household and family size, and the very low vacancy rates reported in the census statistics. An increase in overcrowding has been identified as an issue by staff working in inspection programs in various cities. Addressing the issue of overcrowding will require the construction of new units and rehabilitation of existing units to meet the needs of larger families, a correction in the local balance between supply and demand so that the market returns to a more functional vacancy rate level, and addressing the gap between local incomes and housing prices. The recent softening of the housing market being experienced in the Bay Area due to the economic slowdown both regionally and nationally will address some of these issues, but ADOPTED APRIL 4,
114 H OUSING E LEMENT A PPENDIX TOWN OF F AIRFAX GENERAL P LAN continued policy direction in promoting housing development to meet the needs of lower income households and larger families as well as encouraging the development and rehabilitation of more units to meet demand will also help alleviate the issue of overcrowding. Condominium Conversions Fairfax has sought to ensure the retention of affordable rental units for decades. One of the methods the Town has implemented to retain existing rental housing is a prohibition on condominium conversions, enacted in The Town of Fairfax was one of the 1 st communities in California to pass such a law. Housing Costs, Household Income, and the Ability to Pay for Housing Housing Affordability A Bay Area Perspective The housing crisis in the Bay Area has been an evolving phenomenon over several decades as demand has continually exceeded supply. Housing affordability in the Bay Area is now at an all-time low. Current estimates indicate that 35 percent of all Marin County households are in the extremely low, very low, and low income categories, earning less than 80 percent of the median income. There is an even greater proportion of very low and low income households among renters. A 2000 estimate suggested that 53 percent of all renters in Marin County were in the extremely low, very low, and low income categories, earning less than $64,100 for a family of four. Although current data are not available for the proportion of owner or renter households within each of the income categories, the low income threshold has increased to $77,450 for a family of four. The shortage of local housing at affordable prices means that many employees who work in Marin County must live elsewhere. This requires additional personal and societal costs, as the price of commuting is not just the actual expenses for car and gas; but also includes the commute time, the environmental impact on air quality, the costs of extended day care, and the toll on peoples lives. When housing affordability erodes, many residents are affected. Those on fixed incomes are not able to keep up with rising rents; local employers experience difficulty in attracting and retaining qualified employees; local employees move further away from their jobs in search of affordable housing in other communities because they cannot find adequate housing in the local area that they can affords; and many households postpone home improvements and new investments, and /or devote an increasing proportion of 20 ADOPTED APRIL 4, 2012
115 T OWN OF F AIRFAX GENERAL P LAN HOUSING E LEMENT A PPENDIX their monthly budget to meeting housing costs. Overcrowding also increases as people turn to sharing homes and apartments to reduce monthly costs. An adequate supply of affordable housing, including rental and owned housing, is essential to satisfying the housing needs of all economic segments of Marin s existing and projected population. The analysis of housing affordability requires consideration of trends in household income in comparison to trends in housing prices and rents, trying to quantify as best as possible the incidence of overpayment for housing costs, or what might be termed the affordability gap between the structure of local wages and salaries and the costs of local housing. Some of the Key Findings of Marin Profile 2001 A Survey of Economic, Social, and Environmental Indicators (Marin Economic Commission) Marin Grows, But Steady Marin Getting Older Overall, Senior Population and Children Increasing Racial Diversity Lacking But Increasing as Marin Grows Marin Residents Becoming More Educated Crime Rates Remain Low Marin Residents Politically Active Marin Per Capita Income Highest in Bay Area and California Marin Household Income Increasing Household Occupancy to Remain Relatively Constant Over the Long Term New Residential Units Added Slowly High Percentage of Incomes Spent on Rent, New Unit Construction Falls Behind Rental rates Climb Need for Housing Assistance Continues Home Sales Prices Jump Dramatically But Overall Sales Decline Per Capita, Total Vehicle Miles Traveled Increasing Rapidly In and Out of County Commute Patterns Shifting Energy Consumption Rates Increasing Vast Majority of Land Area in Agriculture, Parks, and Protected Open Space Household Income Income is defined as wages, salaries, pensions, social security benefits, and other forms of cash received by a household. Non-cash items, such as Medicare and other medical ADOPTED APRIL 4,
116 H OUSING E LEMENT A PPENDIX TOWN OF F AIRFAX GENERAL P LAN insurance benefits, are not included as income. It is generally expected that people can afford to pay about a third of their income on housing. It is therefore critical to understand the relationship between household incomes and housing costs to determine how affordable or unaffordable housing really is. Information on household income by household size is maintained by the U.S. Department of Housing and Urban Development (HUD) for each county. The current income levels by jurisdiction are shown in Tables B-13 and B-14 below. Income categories are defined as a percentage of Marin County Median Household Income for four person households: Extremely-Low Income: Below 30 percent of median income Very-Low Income: Below 50 percent of median income Low Income: percent of Marin County median income Moderate Income: percent of Marin County median income Above-Moderate Income: 120 percent and above of Marin County median income Table B 13 ESTIMATED DISTRIBUTION OF HOUSEHOLDS BY INCOME CATEGORY (2000) Jurisdiction Extremely Low Income Very Low Income Very Low Subtotal Low Income Moderate Income Above Moderate Total Fairfax Marin 13,911 8,624 22,536 17,681 20,103 40, ,649 County Total Source: Baird + Driskell/Community Planning; 2000 U.S. Census; Claritas, Inc. TABLE B 14 PERCENTAGE ESTIMATED DISTRIBUTION OF HOUSEHOLDS BY INCOME CATEGORY (2000) Jurisdiction Extremely Low Income Very Low Income Very Low Subtotal Low Income Moderate Income Above Moderate Fairfax 17.6% 12.1% 29.7% 22.4% 24.6% 23.3% Marin County 13.5% 8.4% 21.9% 17.4% 19.9% 40.8% Total Source: Baird + Driskell/Community Planning; Claritas, Inc. Although the average household income in Marin has been increasing, the number of households that fall into the low and very low-income categories has also increased. It is 22 ADOPTED APRIL 4, 2012
117 T OWN OF F AIRFAX GENERAL P LAN HOUSING E LEMENT A PPENDIX currently estimated that 39.3 percent of all Marin households fall in the very low and low-income category. There are even a greater proportion of very low and low income households among renters. It is estimated in 2000 that 55.9 percent of all renters fall in the very low and low-income category, earning less than $64,100 for a family of four. The household income of Fairfax residents is substantially less than that of the County average. It is estimated that over 52 percent of Fairfax households fall in the low and very-low income category. Sales Prices and Rents The Bay Area's phenomenal growth has led to unprecedented economic prosperity for many of those who live here. However, the region's desirability has made it increasingly expensive. This is particularly true in Marin County because of its beautiful setting, convenient location and quality of life. From 1993 to 2000 the median home sales price, for both attached and detached products, increased from $314,250 to $523,000. The median price for a single-family detached home price in Marin County in 2000 was $599,000, requiring an income over $150,000 per year to qualify for a mortgage. The market prices are out of reach for many people who work in Marin County, and even for those who currently reside in the County. The median price for a single-family detached home in Marin County in 2008 was $914,000, requiring an income over $216,000 per year to qualify for a mortgage. The cost of multi-family homes has also increased, but to a lesser degree. The median price of a townhome or condominium rose from$315,000 in 2000 to $415,000 in The required income to afford the median townhome or condominium rose from $84,000 to over $90,000. According to data from Real Facts, Inc., which surveys all rental complexes with 50 or more units quarterly, the average rents in Marin County in 2007 were: $1,372 for a onebedroom apartment, requiring an annual income of $54,880; $1,662 for a two-bedroom apartment, requiring a $66,480 annual income. Rent surveys show that average rents countywide for one-bedroom apartments have increased from $733 per month in 1992 to $1,206 in 2000 and $1,372 in Two-bedroom apartments have increased from $922 per month in 1992 to $1,662 in A review of data from Real Facts in the first quarter of 2010 showed no apartments for rent in Fairfax, according to their listings. In the last quarter of 2001, the rents for one-bedroom apartments in Fairfax increased by 5 percent, while the rents for two-bedroom units increased by 4 percent. According to ADOPTED APRIL 4,
118 H OUSING E LEMENT A PPENDIX TOWN OF F AIRFAX GENERAL P LAN local realtors, the rent pattern for one-bedroom unfurnished apartments in Fairfax ranges between approximately $1,200 to $1,600 per month. The Ability to Pay for Housing Housing that costs 30 percent of a household s income is referred to as affordable housing. Because household incomes and sizes vary, the price that is considered affordable for each household also varies. For example, a large family with a single low income would afford a different type of housing than a double-income household with no children. Households overpay for their housing when they must pay more than 30 percent of their income on housing. Estimates of current overpayment in Fairfax are based on data supplied by the State of the Cities Comprehensive Affordability Strategy (CHAS). As shown by Table B-15, approximately 65 percent of renters in Fairfax were estimated to be overpaying for housing (i.e., paying greater than 10 percent of their income on housing) in 2008, while approximately 59 percent of owners were overpaying for housing. Given the household income trends and housing cost trends discussed previously, it is reasonable to conclude that the incidence of overpayment for very low, low and moderate-income households may increase in the future. TABLE B 15 PERCENT OF LOW INCOME HOUSEHOLDS OVERPAYING Number of Households Total Number Overpaying for Housing Percent Overpaying for Housing Renters % Owners % Source: State of the Cities Comprehensive Affordability Strategy (CHAS). The median home sale prices in Fairfax are lower than most similar prices in the Marin County communities. But, like the rest of Marin, the median prices have increased since 1998 from $387,000 to a high of $779,350 in While the median sale prices retreated during the economic slowdown in the latter part of the decade, dropping to $709,500 in the first part of 2008, many are still priced out of the Fairfax housing market. Table B-16 illustrates the median sale prices for the Marin County communities. 24 ADOPTED APRIL 4, 2012
119 T OWN OF F AIRFAX GENERAL P LAN HOUSING E LEMENT A PPENDIX What Various Jobs Paid (2008) for a Single Person Household Examples of Very Low Income Jobs Dishwasher $20,134 Retail Salesperson $24,523 Childcare Worker $27,269 Truck Driver, Delivery $37,024 Examples of Low Income Jobs Social Worker $41,205 Construction Laborer $49,546 Fire, Police, and Ambulance Dispatcher $55,973 Civil Engineering Technician $61,630 Examples of Moderate Income Jobs Carpenters $63,752 Medical and Public Health Social Workers $67,475 Correctional Officer, Jailer $73,278 Loan Officer $77,584 Special Housing Needs Overview In addition to overall housing needs, cities and the county must plan for the special housing needs of certain groups, such as homeless people, seniors, people with disabilities, large families, female-headed households, and farm worker households. Some communities may not have all these needs, while others may have additional special housing needs, such as people with HIV, people with substance abuse problems, or people with mental health issues. To meet the community s housing needs (including the needs of the local workforce, seniors, people living with disabilities, farm workers, the homeless, people with HIV/AIDS and other illnesses, people in need of mental health care, single parent families, single with no children, and large households), jurisdictions in Marin must be ADOPTED APRIL 4,
120 H OUSING E LEMENT A PPENDIX TOWN OF F AIRFAX GENERAL P LAN TABLE B 16 REGIONAL MEDIAN HOME SALE PRICES (EXPANDED) City Belvedere Tiburon $870,750 $1,151,255 $1,325,325 $1,517,250 $1,308,938 $1,437,500 $1,553,750 $1,907,500 $1,784,738 $1,595,000 $1,825,000 Bolinas $528,900 $517,525 $707,250 $529,550 $608,400 $635,950 $762,750 $839,300 $1,168,125 $902,500 $691,000 Corte Madera $509,550 $554,038 $650,670 $669,375 $756,990 $750,375 $835,070 $999,803 $960,750 $905,000 $1,010,000 Dillon Beach $316,050 $336,233 $369,000 $493,850 $427,050 $603,750 $893,830 $792,975 $918,750 $807,000 $690,000 Fairfax $387,000 $456,565 $492,000 $561,680 $585,000 $617,263 $708,510 $779,350 $763,350 $711,000 $709,500 Forest Knolls $287,025 $348,615 $371,460 $428,400 $493,740 $552,000 $652,575 $738,475 $630,000 $730,000 $0 Greenbrae $644,355 $699,453 $802,575 $838,950 $965,250 $977,500 $1,013,893 $1,308,000 $1,205,925 $1,249,500 $1,230,000 Inverness $407,963 $528,955 $541,200 $679,490 $819,878 $684,250 $807,950 $858,375 $1,207,500 $930,000 $530,000 Lagunitas $341,850 $405,765 $324,413 $511,700 $561,600 $515,200 $475,730 $761,910 $859,950 $775,000 $724,000 Larkspur $638,550 $641,350 $873,300 $808,605 $895,050 $977,500 $1,018,130 $1,297,100 $1,207,500 $1,150,000 $1,230,000 Marshall $459,240 $862,965 $539,970 $988,593 $570,375 $828,000 $716,703 $893,255 $955,500 $575,000 $0 Mill Valley $580,500 $679,450 $817,335 $850,850 $854,100 $902,750 $959,935 $1,073,650 $1,102,500 $1,169,000 $1,195,000 Nicasio $445,050 $879,475 $1,007,985 $891,310 $1,035,450 $1,081,000 $992,988 $1,580,500 $1,923,338 $1,500,000 $1,800,000 Novato $354,750 $419,100 $490,770 $502,180 $544,050 $615,250 $689,300 $764,090 $729,750 $691,000 $580,000 Point Reyes Station $412,800 $534,670 $510,450 $647,360 $783,900 $615,250 $282,500 $645,280 $881,475 $682,500 $0 Ross $1,144,875 $1,079,500 $1,820,400 $1,398,250 $2,275,065 $1,551,350 $1,997,275 $2,806,750 $1,837,500 $1,940,000 $2,300,000 San Anselmo $485,685 $571,500 $651,900 $696,150 $731,250 $773,375 $858,800 $953,750 $913,500 $895,000 $965,000 San Geronimo $481,170 $508,000 $768,750 $273,700 $650,945 $676,200 $788,175 $713,950 $800,625 $765,000 $1,093,000 San Quentin $0 $127,000 $562,725 $547,400 $0 $488,750 $904,000 $844,750 $987,000 $0 $0 San Rafael $432,150 $493,057 $589,170 $624,750 $647,010 $667,000 $744,388 $817,500 $786,450 $770,000 $720,000 Sausalito $383,130 $494,665 $633,450 $612,850 $634,725 $664,125 $740,150 $795,700 $971,250 $900,000 $980,000 Stinson Beach $516,000 $698,500 $1,076,250 $615,825 $739,440 $1,190,250 $1,073,500 $1,428,990 $1,026,375 $1,705,000 $1,900,000 Tomales $338,625 $304,800 $669,120 $392,700 $868,725 $644,000 $565,000 $615,850 $840,000 $520,000 $829,000 Woodacre $335,400 $482,600 $574,718 $440,300 $688,758 $575,000 $751,168 $761,910 $798,000 $615,000 $800,000 Source: Dataquick. 26 ADOPTED APRIL 4, 2012
121 T OWN OF F AIRFAX GENERAL P LAN HOUSING E LEMENT A PPENDIX creative and look to new ways of increasing the supply, diversity and affordability of the housing stock. Other special need groups may include public employees, who can also have special housing needs in communities with particularly high housing costs. Although they may be able to commute from other places in the region, a city or the County or school districts may want to define its employees as a group with special housing needs, developing appropriate policies and programs to address those needs. Students may have a difficult time finding affordable housing in communities with universities or colleges. Shared housing and public or private dormitories may meet some or all of students housing needs. Finally, the task of finding an affordable home, meeting down payment and closing costs, and qualifying for a mortgage may create a special category of housing need. The term below-market-rate (BMR) housing is used to describe units offered at rents or sales prices below that which they could command on the open market. In the past, BMR units were almost exclusively produced with direct federal subsidies. Following drastic cuts in these programs, local governments continue to search for new ways to increase the supply of affordable housing to low and moderate income households. In Marin County, the problem is magnified by the limited amount of land available for development and the correspondingly high housing costs. Seniors Elderly households can be defined, in part, by the age distribution and demographic projections of a community s population. This identifies the maximum need for elderly housing. Particular needs include smaller and more efficient housing, barrier-free and accessible housing, and a wide variety of housing with health care and/or personal services. Fairfax has a slightly younger population than Marin County, with-12 percent of the population over 65 years of age, as compared to the county s 14 percent. With the overall aging of society, the senior population (persons over 65 years of age) will increase in most communities. Consequently, the need for affordable and specialized housing for older residents will grow. Typical housing types used to meet the needs of seniors include smaller attached or detached housing for independent living (both market rate and BMR); second units; shared housing; age-restricted below-market-rate rental developments; congregate care facilities; residential care homes licensed by the state; and skilled nursing homes. ADOPTED APRIL 4,
122 H OUSING E LEMENT A PPENDIX TOWN OF F AIRFAX GENERAL P LAN Many supportive housing developments for the elderly have been built using HUD s Section 202 and 202/8 programs, which provide direct loan financing. Non-profit organizations have been instrumental in marshaling the resources to construct and operate the developments, but housing authorities and for-profit developers are also potential development project sponsors. Elderly households can be defined, in part, by the age distribution and demographic projections of a community s population. This identifies the maximum need for elderly housing. Particular needs, such as the need for smaller and more efficient housing, for barrier-free and accessible housing, and for a wide variety of housing with health care and/or personal services should be addressed, as should providing a continuum of care as elderly households become less self-reliant. The increasing longevity of people and the increasing number of seniors in the population in Marin County will create additional need for affordable housing and specialized housing for older residents. This has the following implications: Marin has a limited supply of vacant land that is suitable for residential development. Senior projects would compete with non-age-restricted housing for this land. Additional housing for area workers and families is an important need. Senior households on fixed incomes have limited resources for home improvements to maintain or rehabilitate older housing. The neighborhoods adjacent to Downtown 28 ADOPTED APRIL 4, 2012
123 T OWN OF F AIRFAX GENERAL P LAN HOUSING E LEMENT A PPENDIX Fairfax are specific areas where this may be a problem given the age of the housing and the high proportion senior residents. In the future, other neighborhoods may be facing these same issues as well. Despite Prop 13 protection, many seniors can become trapped in large houses, due to the size and upkeep required for a large, older structure, as well as the increased house payments and taxes that would result from moving into newer residential unit. People with Physical and Mental Disabilities People with disabilities represent a wide range of different housing needs, depending on the type and severity of their disability as well as personal preference and lifestyle. Barrier-free design housing, accessibility modifications, proximity to services and transit, and group living opportunities represent some of the types of considerations and accommodations that are important in serving this need group. Incorporating barrier-free design in all new multi-family housing is especially important to provide the widest range of choice. The California and Federal Fair Housing laws also require doing so. Special consideration should also be given to the issue of income and affordability, as many people with disabilities may be in fixed income situations. As the proportion of seniors in the county s population increases, handicapped accessible housing will become even more needed. Consideration can be given to handicapped dwelling conversion (or adaptability) and site design in new or renovated construction. Buckelew, Allegria, MARC, and the Marin Center for Independent Living operate facilities in Marin for people with disabilities. The Marin Center for Independent Living, for example, serves approximately 4,000 people a year throughout Marin County. Most of their clients live under the poverty level. Tables B-17 and B-18 illustrate the data available from the 2000 Census. At that time, there were 1,599 individuals residing in Fairfax that were known to have some form of disability, 29 percent were seniors over the age of 65. Single Parent and Female Headed Households Female-headed households need affordable housing with day care and recreation programs on-site or nearby, in proximity to schools and with access to services. Single elderly women also have special needs. ADOPTED APRIL 4,
124 H OUSING E LEMENT A PPENDIX TOWN OF F AIRFAX GENERAL P LAN TABLE B 17 DISABILITIES Number Unable to work because of disability (ages 16 64) 455 Able to work, but with disability (ages 16 64) 672 Persons age 65 plus with a disability 458 Total Persons with a Disability 1,599 Source: US Census, TABLE B 18 PERSONS WITH DISABILITIES BY DISABILITY TYPE Number Total Disabilities 1,599 Total Disabilities for Ages ,141 Sensory disability 47 Physical disability 281 Mental disability 169 Self care disability 49 Go outside home disability 140 Employment disability 455 Total disabilities for Ages 65 and Over 458 Sensory disability 85 Physical disability 181 Mental disability 52 Self care disability 58 Go outside home disability 82 Source: Census Bureau (2000 Census SF 3: P41). Households with female heads, like large households, may have difficulty in finding appropriate-sized housing. Despite fair housing laws and programs, discrimination against children may make it more difficult for this group to find adequate housing. 30 ADOPTED APRIL 4, 2012
125 T OWN OF F AIRFAX GENERAL P LAN HOUSING E LEMENT A PPENDIX Women in the housing market, especially the elderly, low and moderate income and single-parents, face significant difficulties finding housing, and both ownership and rental units are extremely expensive relative to the incomes of many people in this population category. Data from the 2000 census indicates that, of the 3,238 total household in Fairfax, 330, or 11 percent, were headed by females with no children. Of the 79 families under the poverty level, 18, or 23 percent, were female headed households (see Table B-19). TABLE B 19 FEMALE HEADED HOUSEHOLDS Householder Type Number Total Households 3,238 Total Female Headed Householders (no husband) 330 Female Heads with Children under Total Families Under the Poverty Level 79 Female Headed Households Under the Poverty Level 18 Source: Census Bureau (2000 Census SF 3: P10 and P90). Large Families Large families, defined by the U.S. Census Bureau as households with five or more persons, have special housing needs. Large households tend to have difficulties purchasing housing because large housing units are rarely affordable and rental units with three or more bedrooms may not be common in many communities. According to the 2000 census, 2 percent of the renter households and 4 percent of the owner households in Fairfax were large families, and that 66 percent of the large families occupied rental units. Table B-20, below, provides a comparison between large families and the other households in Fairfax. TABLE B 20 HOUSEHOLD SIZE BY TENURE 1 4 Persons 5+ Persons Total Number Percent Number Percent Number Percent Owner 1,934 96% 91 4% 2,025 0% Renter 1,230 98% 21 2% 1,251 0% TOTAL 3,164 xx 112 xx 3,276 0 Source: Census Bureau (2000 Census SF 3: H17). ADOPTED APRIL 4,
126 H OUSING E LEMENT A PPENDIX TOWN OF F AIRFAX GENERAL P LAN Table B-21 indicates that the shortage of large family units is primarily in the rental category, with 13 percent being three-bedroom, and 1 percent each being 4- and 5-plus bedrooms. TABLE B 21 NUMBER OF BEDROOMS BY TENURE Owner Households Renter Households All Households Bedroom Type Number Percent Number Percent Number Percent 0 BR 8 0% 43 3% 51 2% 1 BR 81 4% % % 2 BR % % 1,327 41% 3 BR % % 1,060 32% 4 BR % 9 1% 293 9% 5+ BR 35 2% 8 1% 43 1% TOTAL 2, , % 3, % Source: 2000 Census (2000 Census SF 3: H42). The Marin Housing Authority maintains a waiting list for the Section 8 Housing Choice Voucher Program (opened in Spring, 2000) with the following results: (1) 2,486 households submitted applications; (2) 775 or 32 percent do not live or work in Marin County; (3) of the 1,715 Marin County residents, 775 (46 percent) were from San Rafael; (4) in Marin County, half of the applications were from families, one-quarter from disabled/handicapped, one-tenth from elderly households, and one-ninth from single person households; (5) 60 percent of the applications were from non-hispanic / Caucasian families, 26 percent from African American families, 14 percent from Hispanic families, 9 percent from Asian families, and 1 percent from American Indian families. Individuals and Families Who Are Homeless Homeless individuals and families have perhaps the most immediate housing need of any group. They also have one of the most difficult sets of housing needs to meet, due to both the diversity and complexity of the factors that lead to homelessness, and to community opposition to the development of facilities that serve homeless clients. Homeless people face the ultimate housing deprivation. The homeless population in California is estimated at approximately 1 percent of the State s total population. About a 32 ADOPTED APRIL 4, 2012
127 T OWN OF F AIRFAX GENERAL P LAN HOUSING E LEMENT A PPENDIX third of the homeless consist of homeless families. Homeless people s circumstances vary considerably some are employed but many have been unemployed for some time. Homeless people need permanent supportive housing, emergency shelter, or transitional housing. To the extent this housing or shelter is being provided, it is provided by a combination of local governments, religious organizations, and not-for-profit organizations. Locating facilities that serve homeless people can be a challenging task. Community education is essential to building community acceptance, helping local residents to question their stereotypes about homeless people and understand the real issues of homelessness in their community. Also, State law is very clear about the need for local communities to provide adequate sites for emergency shelters and transitional housing facilities that serve homeless individuals and families. Homelessness and near-homelessness is an important countywide concern. The key findings of the Marin County 2009 Point in Time Count of Homeless Persons, there are 1,770 persons in the county who meet the Marin County Health and Human Services definition of homeless. A total of 1,077 individuals meet the HUD definition of unsheltered and in immediate need of housing, an unspecified number of whom are in Fairfax. ADOPTED APRIL 4,
128 H OUSING E LEMENT A PPENDIX TOWN OF F AIRFAX GENERAL P LAN 34 ADOPTED APRIL 4, 2012
129 APPENDICES: TOWN CENTER
130
131 T OWN OF F AIRFAX GENERAL P LAN TOWN C ENTER E LEMENT A PPENDIX APPENDIX TC-A: ELSIE-BANK ROADWAY IMPROVEMENT The following appendix presents issues, concerns and suggestions regarding the Fairfax Town Center, incorporating work done by Crane Transportation Group. A brief discussion of alternative solutions and planning assumptions for the Town Center is provided, as well as a sequence of roadway improvements to implement the Fairfax Town Center Plan. EXISTING CIRCULATION PROBLEMS IN THE TOWN CENTER Elements of the existing Sir Francis Drake Boulevard / Claus Drive / Broadway / Bank Street roadway network are awkward for pedestrian, bicycle and vehicle circulation. There is opportunity to improve vehicular flow especially in the mornings; to reduce noise and pollution in the town center by eliminating the multiple queuing areas in the present intersection; to create opportunities to improve the Bolinas Road area for pedestrian and bicycle use; and to draw business down Bolinas Road by making it more inviting and interesting. Pedestrian and bicycle circulation is subordinate to vehicle flow in the Town Center. A major focus and goal of The Town Center Plan is to separate areas of vehicle/pedestrian interface in the Town Center (especially along Bolinas Road). A sight line hazard exists for eastbound Sir Francis Drake vehicles turning right to proceed south on Claus Drive and westbound vehicles turning left to proceed south on Claus Drive, versus eastbound Broadway vehicles turning left to proceed north on Claus Drive. A sign is posted prohibiting the Broadway eastbound left turn during weekday AM and PM peak hours, but the prohibition is frequently ignored. Queuing space is severely limited on Claus Drive between Sir Francis Drake Boulevard and Broadway. Study was given to the possibility of the Sir Francis Drake Boulevard/ Broadway/ Claus Drive intersection functioning as a single mega intersection, but analysis reveals that the variety of vehicle through and turning movements that must be accommodated, along with pedestrian crossing time, makes this initial concept unworkable (too many separate signal phases). Additionally, it is unlikely that ADOPTED APRIL 4,
132 T OWN C ENTER E LEMENT A PPENDIX TOWN OF F AIRFAX GENERAL P LAN Caltrans would cooperate with this goal due to the effect of further slowing Sir Francis Drake east-west through traffic. Broadway west of Bank does not provide viable east-west access due to variable roadway widths, with some sections narrowing to essentially one lane. Broadway west of Bank Street does not provide access to a viable north-south alternative connector to Sir Francis Drake Boulevard (i.e., alternative to Claus Drive). The next available connector west of Claus Drive (Azalea Drive) has a steep south-to-north grade and inferior sight lines at the Azalea Drive/Sir Francis Drake Boulevard intersection. It is the opinion of the consulting traffic engineer that the Town Center circulation system would benefit from simplifying elements of the Sir Francis Drake Boulevard/ Claus Drive/ Broadway roadway network. Claus Drive has relatively low demand as currently configured, but complicates operation of the signal; residents would likely object to losing turning movements on this approach to Sir Francis Drake Boulevard. PRELIMINARY CIRCULATION ALTERNATIVES A range of circulation alternatives was presented to the GPAC for the purpose of addressing pedestrian, bicycle and vehicle circulation in the Fairfax Town Center. Each alternative was tested for intersection level of service operation at three key intersections: Broadway/Bank Street, Bank Street/ Sir Francis Drake Boulevard, and Sir Francis Drake Boulevard/Claus Drive. With existing (2007) conditions, as well as with all roadway alternatives tested, vehicle queues exceed available roadway lane capacity on one or more approaches to these intersections. Residents of Fairfax are well aware of lengthy queues at these intersections during commute peak periods. The focus of the circulation alternatives tested was to consider both major and minor roadway changes to reduce vehicle congestion and dominance in the Town Center, and to a greater degree than occurs today, balance bicycle, pedestrian and vehicular activity in the Town Center, specifically along Bolinas between Elsie Drive and Broadway and along Broadway near Claus Drive and along the Parkade. It is a given that Sir Francis Drake Boulevard will be the major east-west vehicular corridor and is outside the direct jurisdiction of the Town of Fairfax; decisions for changes to this roadway will depend upon Caltrans cooperation. However, this roadway is a major element of the Town Center; a planning goal is to connect land uses on the north side of Sir Francis Drake 2 ADOPTED APRIL 4, 2012
133 T OWN OF F AIRFAX GENERAL P LAN TOWN C ENTER E LEMENT A PPENDIX Boulevard with those south of the Boulevard. The Parkade is the key to this connection, providing opportunities for pedestrian paths and landscape themes followed on the south side to be carried through on the north side of the Town Center. Assumptions must be made about the roadway network in order to test the alternatives and variations. For all alternatives, and as a fixed assumption, Bolinas Road is always fully open to emergency vehicle access. PLANNING ASSUMPTIONS Pursuant to the outcome of the public visioning process associated with the Town Center Plan, the concept being explored is to shift most or all of the vehicular traffic from the portion of Bolinas Road between Elsie and Broadway, to the existing Elsie- Bank roadway with a connection to Broadway and Sir Francis Drake, thus providing traffic flow where it is currently the most difficult while creating an improved pedestrian area where pedestrians currently congregate. Bolinas Road would always be designed and maintained to allow emergency vehicle access. Pedestrian access would be emphasized with high visibility crosswalks throughout the Town Center area. Mono Avenue has one-way eastbound traffic flow, with Mono Avenue parking lot spaces west of Bolinas Road re-striped to enable vehicles to make u-turns within the lot to return to Elsie Drive, or cross Bolinas Road to proceed eastbound on Mono Avenue. The Elsie Drive - Bank Street corridor would be improved, and Bank Street would have a separate northbound left turn lane in addition to a through-right lane. On-street parking would be eliminated on Bank Street near the Broadway intersection to allow provision of a new northbound left turn lane The Creek-Sherman-Dominga-Napa-Pacheco corridor roadway network would be unchanged, other than minor improvements for parking and safety. It is anticipated that if the Elsie Drive Bank Street corridor is improved prior to any changes to Bolinas Road (i.e., closure or limited to one-way northbound traffic flow), commute traffic on the Creek-Sherman-Dominga-Pacheco corridor will not increase during morning and evening commute hours. Existing (2007) weekday AM peak hour traffic volumes have been chosen as the subject of preliminary test runs for traffic operation, as volumes at this time are ADOPTED APRIL 4,
134 T OWN C ENTER E LEMENT A PPENDIX TOWN OF F AIRFAX GENERAL P LAN higher than weekday PM peak hour volumes in the Town Center area and on Sir Francis Drake Boulevard. PROPOSED TOWN CENTER ROADWAY CHANGES This plan would provide a new two-direction (north-south) roadway connection between Broadway and Sir Francis Drake Boulevard, as shown on Figure TC-3, Connect Broadway/Bank. It would help to shift downtown vehicular traffic from Bolinas Road/Broadway to the Bank Street-Elsie Drive corridor. This alternative is consistent with the conceptual design of the Town Center Plan, and incorporates a westward extension of the Parkade as a landscaped area with pedestrian paths in the Town Center. North-south pedestrian access would be emphasized with high visibility crosswalks on Sir Francis Drake and Broadway connecting to the Parkade extension pathways. Broadway / Bank Street would initially be stop sign controlled, and later signalized. Sir Francis Drake Boulevard/Bank Street and the existing signal at Sir Francis Drake Boulevard/Claus Drive would initially form a coordinated system of signalized intersections, with coordination carried through at the Broadway Boulevard/Bank Street intersection when signalized. Claus Drive southbound through traffic would be blocked by an extension of the Parkade, thus forcing all southbound Claus Drive traffic to turn left or right to access Broadway via Pacheco Avenue or via the new segment of Bank Street. Major Advantages: Downtown traffic flow is improved while providing a better balance of pedestrian, bicycle and vehicle access in the downtown. Visibility and access to the Pavilion is increased. A visual gateway and major new pedestrian-oriented, landscaped area (Parkade expansion) adjacent the Town s busiest corridor, Sir Francis Drake Boulevard is provided. This alternative would have the following additional advantages: Vehicle dominance and congestion at the Bolinas/Broadway intersection is reduced Eliminating the existing sight line conflict in the downtown area for concurrent turns from Sir Francis Drake Boulevard and Broadway (described above); specifically, Sir Francis Drake eastbound right and westbound left turns to Claus Drive can conflict 4 ADOPTED APRIL 4, 2012
135 T OWN OF F AIRFAX GENERAL P LAN TOWN C ENTER E LEMENT A PPENDIX with concurrent eastbound left and westbound through vehicle movements from Broadway at Claus Drive. The severely limited queuing space on Claus Drive between Sir Francis Drake Boulevard and Broadway is eliminated. The pedestrian and vehicle concentrations in the downtown are separated major vehicular activity hub (Bank Street/Broadway) would be shifted west of the major downtown pedestrian hub (Bolinas corridor and Broadway from Pacheco Avenue to Claus Drive). Access from Claus Drive (north of Sir Francis Drake Boulevard) to Broadway via a nearby (Bank Street) connection is maintained, instead of directing this traffic to Azalea or Pacheco to reach Broadway, as other alternatives have envisioned. Existing inadequate queuing space between Sir Francis Drake Boulevard and Broadway is eliminated. If the northernmost segment of Bolinas Road were restricted from having southbound traffic, then a left turn lane could be eliminated from Broadway, which might create space for a bicycle lane to be added on Broadway. This plan would have the following disadvantages: At the new intersection traveling from Bank onto Sir Francis Drake, there will still be queuing during rush hour; however, signalization and simplification will greatly improve this over the present travel from Bolinas to Drake. Southbound through traffic from Claus Drive north of Sir Francis Drake Boulevard would experience a less direct route to Broadway. Disruption of the existing gas station on Sir Francis Drake just north of Bank Street. SEQUENCE OF ELSIE BANK CORRIDOR IMPROVEMENTS a) Determine the Elsie-Bank corridor right-of-way boundaries and ownerships of all adjacent properties, including needed portions of the Fairfax Gas Station property and rights of way along Sir Francis Drake Boulevard. b) Determine options for reconfiguration of the Elsie-Bank corridor, including reconfiguring the s-curve in Elsie Lane westward to loop through the existing parking lot on the west side of Elsie Lane near the Pavilion. The parking spaces displaced ADOPTED APRIL 4,


136 T OWN C ENTER E LEMENT A PPENDIX TOWN OF F AIRFAX GENERAL P LAN Fairfax Parkade Mono Parking Area Connection to Elsie Lane 6 ADOPTED APRIL 4, 2012

137 T OWN OF F AIRFAX GENERAL P LAN TOWN C ENTER E LEMENT A PPENDIX ADOPTED APRIL 4,
138 T OWN C ENTER E LEMENT A PPENDIX TOWN OF F AIRFAX GENERAL P LAN could be moved to occupy the existing property occupied by Elsie Lane, and could be combined with the adjacent Mono Avenue parking lot. The resulting expanded Mono Avenue parking lot could be re-striped for head-to-head parking to maximize parking space and allow eastbound u-turns in the lot. This would allow westbound vehicles to exit onto Elsie-Bank (an alternative to proceeding eastbound on Mono Avenue). c) Obtain needed property and construct the extension of Bank Street to Sir Francis Drake Boulevard. Initially, stop sign control the Sir Francis Drake Boulevard/Bank Street intersection. Install a stop sign as an interim control at the Bank Street southbound approach to Broadway. d) Extend the Parkade westward (per Figure TC-3, Connect Broadway/Bank), blocking Claus Drive at Sir Francis Drake Boulevard. Remove the westbound Sir Francis Drake left turn lane at Claus Drive and reconfigure (re-stripe) the segment of Sir Francis Drake Boulevard between the Bank Street and Claus Drive intersections to provide for a left turn onto Bank Street. e) Signalize the newly-created Bank Street/Sir Francis Drake Boulevard and Bank Street/Broadway intersections, and provide crosswalks, Parkade pathways and landscaping, as indicated (per Figure TC-3, Connect Broadway/Bank). Coordinate the Sir Francis Drake Boulevard/Claus Drive, Sir Francis Drake Boulevard/Bank Street, and Bank Street/ Broadway signalized intersections. f) Once the Elsie-Bank corridor can support the traffic flow, begin experimenting with closure or partial closure of the section of Bolinas Road from Elsie to Broadway, as described below as the Test Phase. ELSIE BANK CORRIDOR IMPROVEMENTS WOULD ADDRESS DISADVANTAGES RAISED BY THE TOWN CENTER ROADWAY CHANGES The disadvantages raised by the Town Center roadway changes would be addressed as follows: Queuing space south of Sir Francis Drake Boulevard could be slightly increased by the altered Elsie-Bank alignment (this would be influenced by locations of driveway cuts); and 8 ADOPTED APRIL 4, 2012
139 T OWN OF F AIRFAX GENERAL P LAN TOWN C ENTER E LEMENT A PPENDIX Operation of the existing Sir Francis Drake gas station on a smaller parcel should be formally explored with the owners and operators of the station. It is possible that total loss of this business could be avoided. BOLINAS ROAD CHANGES TEST PHASE After completion of the Elsie-Bank corridor improvements, including fully-functioning Bank Street intersections with Sir Francis Drake Boulevard and Broadway: a) Test two-way closure of the two-block segment of Bolinas Road from Elsie Lane to Broadway: place traffic cones or bollards to prevent through traffic on Bolinas north of Elsie Lane. Place signs on Bolinas Road directing northbound traffic to Elsie Lane. Place signs on Broadway at Claus Drive directing southbound leftturning traffic to turn right to proceed to the Bank Street intersection. Place signs on westbound Broadway at Bolinas directing westbound left turns to proceed through to Bank Street. Count volumes at the affected intersections with and without the closure. Include Bolinas Drive/Sherman Avenue as one of the count locations. Sign the project at both ends of the system and ask commuters to call in to provide comments. b) Test one-way (southbound) closure of the two-block segment of Bolinas Road from Elsie Lane to Broadway while allowing one-way northbound traffic through this segment: Place traffic cones or bollards to prevent southbound traffic on Bolinas from Broadway. Place signs on Bolinas Road directing northbound traffic to turn right (only) to proceed east on Broadway. Place signs on Broadway at Claus Drive directing southbound left-turning traffic to turn right to proceed to the Bank Street intersection. Place signs on westbound Broadway at Bolinas directing westbound left turns to proceed through to Bank Street. Count volumes at the affected intersections with and without the closure. Include Bolinas Drive/Sherman Avenue as one of the count locations. Sign the project at both ends of the system and ask commuters to call in to provide comments. c) Talk with or otherwise survey townspeople, including owners of properties and businesses adjacent to Bolinas Road the Elsie-Bank corridor, to determine the effect of the closures on businesses or uses of properties, if any. Based on this, determine the configuration of Bolinas Road, e.g. as one-way in the mornings and closed to automobile traffic otherwise. ADOPTED APRIL 4,
.")
140 T OWN C ENTER E LEMENT A PPENDIX TOWN OF F AIRFAX GENERAL P LAN d) Compile data into a report contrasting the numeric and feedback results of the test closures. Discuss in GPAC forum. Consider additional changes (detailed below). RELATED OPPORTUNITIES TO ENHANCE THE TOWN CENTER Whether it is determined that Bolinas Road will be restricted to one-way northbound (or no traffic) for specified hours of the day, consider permanently prohibiting westbound left turns from Broadway to Bolinas Road, and instead direct westbound Broadway traffic to the Bank Street intersection. Use the resulting added room on Broadway (due to no longer needing the existing westbound left turn lane) to provide a bicycle lane and/or extra width to sidewalks on Broadway east of Bolinas Road as well as other improvements detailed in the Town Center Plan. Broadway / Bolinas Intersection 10 ADOPTED APRIL 4, 2012
Corpus Christi Metropolitan Transportation Plan Fiscal Year Introduction:
 Introduction: The Safe, Accountable, Flexible, Efficient Transportation Equity Act: A Legacy for Users (SAFETEA-LU) has continued the efforts started through the Intermodal Surface Transportation Efficiency
Living Streets Policy
 Living Streets Policy Introduction Living streets balance the needs of motorists, bicyclists, pedestrians and transit riders in ways that promote safety and convenience, enhance community identity, create
Solana Beach Comprehensive Active Transportation Strategy (CATS)
") Solana Beach Comprehensive Active Transportation Strategy (CATS) 3.0 Goals & Policies The Solana Beach CATS goals and objectives outlined below were largely drawn from the Solana Beach Circulation Element
Solana Beach Comprehensive Active Transportation Strategy (CATS) 3.0 Goals & Policies The Solana Beach CATS goals and objectives outlined below were largely drawn from the Solana Beach Circulation Element
RESOLUTION NO ?? A RESOLUTION OF THE CITY OF NEPTUNE BEACH ADOPTING A COMPLETE STREETS POLICY
 RESOLUTION NO. 2018-?? A RESOLUTION OF THE CITY OF NEPTUNE BEACH ADOPTING A COMPLETE STREETS POLICY WHEREAS, safe, convenient, and accessible transportation for all users is a priority of the City of Neptune
West Dimond Blvd Upgrade Jodhpur Street to Sand Lake Road
 West Dimond Blvd Jodhpur St to Sand Lake CSS Transportation Project Summary Municipality of Anchorage Project # 05 005 Project Manager: John Smith, P.E. (MOA PM&E) Project Administrator: Julie Makela,
NM-POLICY 1: Improve service levels, participation, and options for non-motorized transportation modes throughout the County.
 Transportation PRINCE WILLIAM COUNTY 2008 COMPREHENSIVE PLAN NON-MOTORIZED PLAN CONTENTS Goals, Policies, and Action Strategies Table 4 (Bike Facility Classifications and Descriptions) Table 5 (Bike Facility
Agenda. Overview PRINCE GEORGE S PLAZA METRO AREA PEDESTRIAN PLAN
 PRINCE GEORGE S PLAZA METRO AREA PEDESTRIAN PLAN May 28, 2008 Agenda Welcome and introductions Project overview and issue identification Planning context and strengths Design challenges and initial recommendations
Proposed. City of Grand Junction Complete Streets Policy. Exhibit 10
 Proposed City of Grand Junction Complete Streets Policy Exhibit 10 1 City of Grand Junction Complete Streets Policy Vision: The Complete Streets Vision is to develop a safe, efficient, and reliable travel
Bicycle Master Plan Goals, Strategies, and Policies
 Bicycle Master Plan Goals, Strategies, and Policies Mobilizing 5 This chapter outlines the overarching goals, action statements, and action items Long Beach will take in order to achieve its vision of
Madison Urban Area and Dane County. Bicycle Transportation Plan Summary. September Introduction. Bicycle Plan Scope and Planning Process
 Bicycle Transportation Plan Summary Madison Urban Area and Dane County Introduction September 2000 Bicycling is an important mode of transportation in the Madison urban area and countywide that is available
Chapter 7. Transportation. Transportation Road Network Plan Transit Cyclists Pedestrians Multi-Use and Equestrian Trails
 Chapter 7 Transportation Transportation Road Network Plan Transit Cyclists Pedestrians Multi-Use and Equestrian Trails 7.1 TRANSPORTATION BACKGROUND The District of Maple Ridge faces a number of unique
Non-Motorized Transportation 7-1
 Non-Motorized Transportation 7-1 Transportation facilities no longer mean just accommodating a vehicle powered by a combustion engine. Pedestrian and non-motorized facilities are important modes of travel
CITY OF COCOA BEACH 2025 COMPREHENSIVE PLAN. Section VIII Mobility Element Goals, Objectives, and Policies
 CITY OF COCOA BEACH 2025 COMPREHENSIVE PLAN Section VIII Mobility Element Goals, Objectives, and Policies Adopted August 6, 2015 by Ordinance No. 1591 VIII MOBILITY ELEMENT Table of Contents Page Number
Exhibit 1 PLANNING COMMISSION AGENDA ITEM
 Exhibit 1 PLANNING COMMISSION AGENDA ITEM Project Name: Grand Junction Circulation Plan Grand Junction Complete Streets Policy Applicant: City of Grand Junction Representative: David Thornton Address:
CITY OF BLOOMINGTON COMPLETE STREETS POLICY
 CITY OF BLOOMINGTON COMPLETE STREETS POLICY POLICY OBJECTIVE: The City of Bloomington will enhance safety, mobility, accessibility and convenience for transportation network users of all ages and abilities,
Roadway Classification Design Standards and Policies. Pueblo, Colorado November, 2004
 Roadway Classification Design Standards and Policies Pueblo, Colorado November, 2004 Table of Contents Page Chapter 1. General Provisions 1.1 Jurisdiction 3 1.2 Purpose and Intent 3 1.3 Modification 3
SR-203 Sidewalks and Town-Wide Mobility Improvements. Town Council Presentation September 7, 2016
 SR-203 Sidewalks and Town-Wide Mobility Improvements Town Council Presentation September 7, 2016 SR-203 Sidewalks and Town- Wide Mobility Improvements SR-203 Sidewalks and Appurtenances Town-Wide Mobility
Bikeway action plan. Bicycle Friendly Community Workshop March 5, 2007 Rochester, MN
 Bikeway action plan Summary The was held on March 5, 2007 at the Rochester Mayo Civic Center. The workshop was hosted by Rochester-Olmsted County Planning Department in collaboration with the League of
APPROVE A RESOLUTION ADOPTING A COMPLETE STREETS POLICY
 STAFF REPORT MEETING DATE: September 13, 2016 TO: FROM: City Council Bob Brown, Community Development Director Russ Thompson, Public Works Director Patrick Filipelli, Management Analyst 922 Machin Avenue
CONNECTING PEOPLE TO PLACES
 CONNECTING PEOPLE TO PLACES 82 EAST BENCH MASTER PLAN 07 Introduction The East Bench transportation system is a collection of slow moving, treelined residential streets and major arteries that are the
APPENDIX A: Complete Streets Checklist DRAFT NOVEMBER 2016
 APPENDIX A: Complete Streets Checklist DRAFT NOVEMBER 2016 Complete Streets Checklist MetroPlan Orlando s Complete Streets Checklist is an internal planning tool for staff to further implementation of
Project Status Update
 Project Status Update : Novato Boulevard, 4th & 3rd Streets, Sir Francis Drake Boulevard (3), and Miller Avenue Major roads projects target the most heavily traveled roads in Marin County for repairs,
TABLE OF CONTENTS. Executive Summary
 Executive Summary Background... ES-1 Pedestrian Network... ES-2 Bikeway Network... ES-2 Collision History... ES-2 Public Input... ES-4 Conclusions and Recommendations... ES-4 1. Introduction and Setting
PRINCE GEORGE S PLAZA METRO AREA PEDESTRIAN PLAN
 PRINCE GEORGE S PLAZA METRO AREA PEDESTRIAN PLAN May 28, 2008 Agenda Welcome and introductions Project overview and issue identification Planning context and strengths Design challenges and initial recommendations
REGIONAL BICYCLE AND PEDESTRIAN DESIGN GUIDELINES
 REGIONAL BICYCLE AND PEDESTRIAN DESIGN GUIDELINES November 16, 2011 Deb Humphreys North Central Texas Council of Governments Bicycle and Pedestrian Advisory Committee Snapshot of the Guide 1. Introduction
7/23/2017 VIA . Michael Hanebutt City of Sacramento Community Development Department 300 Richards Boulevard, 3 rd Floor Sacramento, CA 95811
 7/23/2017 VIA EMAIL Michael Hanebutt City of Sacramento Community Development Department 300 Richards Boulevard, 3 rd Floor Sacramento, CA 95811 RE: 65 th Street Apartments (DR17-220) Dear Mr. Hanebutt:
Clackamas County Comprehensive Plan
 ROADWAYS The County s road system permits the movement of goods and people between communities and regions, using any of a variety of modes of travel. Roads provide access to virtually all property. They
Arlington s Master Transportation Plan
 Arlington s Master Transportation Plan The Master Transportation Plan (MTP) Adopted in eight parts Goals & Policies element and MTP Map adopted in 2007 Bicycle, Pedestrian and Demand and Systems Management
Chapter 2. Bellingham Bicycle Master Plan Chapter 2: Policies and Actions
 Chapter 2 Bellingham Bicycle Master Plan Chapter 2: Policies and Actions Chapter 2: Policies and Actions The Bicycle Master Plan provides a road map for making bicycling in Bellingham a viable transportation
Berkeley Strategic Transportation Plan A-76
 Berkeley Strategic Transportation Plan A-76 Appendices 1. A Team Effort 2. Where We ve Been A-11 Berkeley Strategic Transportation Plan Alameda County Transportation Plan Alameda County will be served
Land Use Bicycle Spaces Required Type Residential
 SAMPLE ORDINANCES AND RESOLUTIONS APPENDIX B SAMPLE BICYCLE PARKING ORDINANCE Land Use Bicycle Spaces Required Type Residential Single Family/Two Family N/A N/A Apartment/Townhome 1 per unit plus 6 space
WELCOME. Thank you for joining us at the Second Public Workshop for the Carlsbad Pedestrian Master Plan. We look forward to receiving your feedback.
 City of Carlsbad Pedestrian Master Plan: WELCOME WELCOME Please Sign In Provide Input at Flip Charts Review Boards Presentation of Draft Plan Thank you for joining us at the Second Public Workshop for
ACTIVE TRANSPORTATION
 ACTIVE TRANSPORTATION Mobility 2040 Supported Goals Improve the availability of transportation options for people and goods. Support travel efficiency measures and system enhancements targeted at congestion
SANTA CLARA COUNTYWIDE BICYCLE PLAN August 2008
 SANTA CLARA COUNTYWIDE BICYCLE PLAN August 2008 To assist VTA and Member Agencies in the planning, development and programming of bicycle improvements in Santa Clara County. Vision Statement To establish,
SUMMARY OF TRANSPORTATION INVESTMENTS
 Santa Cruz County 2016 Measure D: Transportation Improvement Expenditure Plan - Approved by over 2/3 of Santa Cruz County voters on November 8, 2016 - Overview Measure D, the 2016 Transportation Improvement
TRAVEL PLAN: CENTRAL EUROPEAN UNIVERSITY CAMPUS REDEVELOPMENT PROJECT TRAVEL PLAN. Central European University Campus Redevelopment Project.
 TRAVEL PLAN Central European University Campus Redevelopment Project Page 1 Table of Contents Introduction... 3 Background... 7 Building Users... 7 Transportation in Community Consultation... 7 Summary
Bike San Mateo County San Mateo County Bicycle Plan Recommendations August 30, 2010
 Policy and Procedures Develop and Implement a Complete Streets Policy to comply with DD-64-R1 and AB1358 Commencing January 1, 2011, AB1358 requires that the legislative body of a city or county, upon
2.0 Existing Conditions
 20 2.0 Existing Conditions 2.1 Land Use, Future Growth Patterns, Physical Barriers Geographic Overview Sutter County s land use pattern is characterized by extensive agricultural areas, significant natural
University of Victoria Campus Cycling Plan Terms of Reference. 1.0 Project Description
 University of Victoria Campus Cycling Plan Terms of Reference 1.0 Project Description The Campus Cycling Plan, a first for the University, will provide a comprehensive and coordinated approach to support
TRANSPORTATION COMMISSION Agenda Staff Report
 TRANSPORTATION COMMISSION Agenda Staff Report Agenda Item No. 5.a DATE: JULY 31, 2014 TO: FROM: SUBJECT: TRANSPORTATION COMMISSION COMMUNITY DEVELOPMENT DEPARTMENT - PLANNING DRAFT OLYMPIC CORRIDOR PREFERRED
Americans with Disabilities Act Transition Plan for Public Right-of-Way Improvements
 Americans with Disabilities Act Transition Plan for Public Right-of-Way Improvements Prepared by: Public Works Department Engineering Division October 2015 Table of Contents Section I Introduction.. 3
TOWN OF PORTLAND, CONNECTICUT COMPLETE STREETS POLICY
 TOWN OF PORTLAND, CONNECTICUT COMPLETE STREETS POLICY I. VISION, GOALS & PRINCIPLES VISION To improve the streets of Portland making them safer and more accessible for all users including pedestrians,
CHAPTER 7.0 IMPLEMENTATION
 CHAPTER 7.0 IMPLEMENTATION Achieving the vision of the Better Streets Plan will rely on the ability to effectively fund, build and maintain improvements, and to sustain improvements over time. CHAPTER
PEDESTRIAN ACTION PLAN
 ATTACHMENT 2 CITY OF SANTA MONICA PEDESTRIAN ACTION PLAN CITY OF SANTA MONICA PEDESTRIAN ACTION PLAN This page intentionally left blank EXECUTIVE SUMMARY CHAPTER 1 EXECUTIVE SUMMARY Setting the Stage
Broad Street Bicycle Boulevard Design Guidelines
 Broad Street Bicycle Boulevard Design Guidelines Building from the strategies introduced in the 2013 Bicycle Transportation Plan and community input received thus far, City Transportation Staff have identified
Goal 3: Foster an environment of partnerships and collaboration to connect our communities and regions to one another.
 Non-Motorized Transportation Plan (NMTP) Draft Vision, Goal and,, Tri-County Regional Planning Commission (TCRPC) Purpose The purpose of the Tri-County Regional Planning Commission (TCRPC) Non-Motorized
See Figure 38, Existing Nonmotorized Connections.
 Nonmotorized Connections Existing Nonmotorized Connections Pedestrian, vehicle and bike traffic access and movements are confined primarily to Penny Drive on campus. Due to the steep slope along the length
EXECUTIVE SUMMARY. Vision
 Vision Walking and bicycling in Salt Lake City will be safe, convenient, comfortable, and viable transportation options that connect people to places, foster recreational and economic development opportunities,
Chapter 9: Pedestrians and Bicyclists
 Chapter 9: Pedestrians and Bicyclists Walking and bicycling are essential modes of transportation. These modes allow people to travel without contributing to congestion and air pollution, to access other
City of Novi Non-Motorized Master Plan 2011 Executive Summary
 City of Novi Non-Motorized Master Plan 2011 Executive Summary Prepared by: February 28, 2011 Why Plan? Encouraging healthy, active lifestyles through pathway and sidewalk connectivity has been a focus
ACTIVE TRANSPORTATION/NONMOTORIZED TRANSPORTATION
 ACTIVE TRANSPORTATION/NONMOTORIZED TRANSPORTATION BACKGROUND Active transportation, also known as nonmotorized transportation, is increasingly recognized as an important consideration when planning and
AGENDA ITEM NO. 5b HCAOG TAC meeting of May 8, 2014
 Humboldt County Association of Governments Eureka, CA, 95501 AGENDA ITEM NO. 5b HCAOG TAC meeting of May 8, 2014 DATE: May 1, 2014 TO: HCAOG Technical Advisory Committee (TAC) FROM:, SUBJECT: Letters of
RESOLUTION NO A RESOLUTION OF THE CITY COUNCIL OF THE CITY OF MENLO PARK ADOPTING A COMPLETE STREETS POLICY
 RESOLUTION NO. 6123 A RESOLUTION OF THE CITY COUNCIL OF THE CITY OF MENLO PARK ADOPTING A COMPLETE STREETS POLICY WHEREAS, the term Complete Streets describes a comprehensive, integrated transportation
ADA Transition Plan. City of Gainesville FY19-FY28. Date: November 5, Prepared by: City Of Gainesville Department of Mobility
 ADA Transition Plan FY19-FY28 Date: November 5, 2018 Prepared by: City Of Gainesville Department of Mobility 1.0 INTRODUCTION 1.1 BACKGROUND The federal statute known as the Americans with Disabilities
CITY MANUALS AND STANDARDS REVIEW
 GEORGETOWN SIDEWALK MASTER PLAN CITY MANUALS AND STANDARDS REVIEW RESOURCES AND STANDARDS As part of the Master Plan process, a review and evaluation of current City documents and policies relevant to
East Burke Transportation, Safety and Capacity Improvements
 East Burke Transportation, Safety and Capacity Improvements The purpose of this project is to increase mobility and improve safety for pedestrians, cyclists, and motor vehicles along VT Route 114 in the
General Plan Circulation Element Update Scoping Meeting April 16, 2014 Santa Ana Senior Center, 424 W. 3rd Street, Santa Ana, CA 92701
 General Plan Circulation Element Update Scoping Meeting April 16, 2014 Santa Ana Senior Center, 424 W. 3rd Street, Santa Ana, CA 92701 Meeting Agenda 1. Purpose of Scoping Meeting 2. Project Overview 3.
5 CIRCULATION AND STREET DESIGN
 5 CIRCULATION AND STREET DESIGN This chapter describes circulation and streetscape improvements proposed for the Northwest Chico Specific Plan Area. It includes detailed design specifications for existing
BIKE PLAN CONTENTS GATEWAY
 CONTENTS Acknowledgments...vii Great Rivers Greenway District Board of Directors... vii Great Rivers Greenway District Staff... vii Project Consultants... vii Committees... viii Citizens Advisory Committee
Chapter 2: Standards for Access, Non-Motorized, and Transit
 Standards for Access, Non-Motorized, and Transit Chapter 2: Standards for Access, Non-Motorized, and Transit The Washtenaw County Access Management Plan was developed based on the analysis of existing
5/7/2013 VIA . RE: University Village Safeway Expansion (P13-019)
") 5/7/2013 VIA EMAIL David Hung, Associate Planner Community Development Department, Current Planning Division City of Sacramento 300 Richards Boulevard, 3 rd Floor Sacramento, CA 95811 RE: University Village
5/7/2013 VIA EMAIL David Hung, Associate Planner Community Development Department, Current Planning Division City of Sacramento 300 Richards Boulevard, 3 rd Floor Sacramento, CA 95811 RE: University Village
5. RUNNINGWAY GUIDELINES
 5. RUNNINGWAY GUIDELINES These guidelines should be considered collectively when making runningway decisions. A runningway is the linear component of the transit system that forms the right-of-way reserved
Tonight is for you. Learn everything you can. Share all your ideas.
 Strathcona Neighbourhood Renewal Draft Concept Design Tonight is for you. Learn everything you can. Share all your ideas. What is Neighbourhood Renewal? Creating a design with you for your neighbourhood.
TRANSPORTATION & MOBILITY
 TRANSPORTATION & MOBILITY ROADWAY SYSTEM There are approximately 40 miles of roadways in Manitou Springs. For planning purposes, roadways are typically assigned a functional classification which defines
New Measure A Expenditure Categories DEFINITIONS OF ELIGIBLE EXPENDITURES Adopted March 8, 2007
 New Measure A Expenditure Categories DEFINITIONS OF ELIGIBLE EXPENDITURES Adopted March 8, 2007 City Street and County Road Maintenance Program The preservation and keeping of public street and road rights-of-way
MAG Town of Cave Creek Bike Study Task 6 Executive Summary and Regional Significance Report
 Page 1 MAG Town of Cave Creek Bike Study Task 6 Executive Summary and Regional Significance Report August 1, 2012 MAG Project #481 Page 2 Task 6 Executive Summary and Regional Significance Report Introduction
o n - m o t o r i z e d transportation is an overlooked element that can greatly enhance the overall quality of life for the community s residents.
 N o n - m o t o r i z e d transportation is an overlooked element that can greatly enhance the overall quality of life for the community s residents. 84 Transportation CHAPTER 11 INTRODUCTION Transportation
ADA TRANSITION PLAN 2013
 ADA TRANSITION PLAN 2013 TABLE OF CONTENTS Contents Introduction 1 Purpose 2 Identified Obstacles to the Public Right of Way 3 Criteria for Determining Impediments at Village Facilities 4 Removing Barriers
Develop a Multi-Modal Transportation Strategy (Theme 6)
") DEVELOP A MULTI-MODAL TRANSPORTATION STRATEGY (THEME 6) WHY IS THIS THEME ADDRESSED? Develop a Multi-Modal Transportation Strategy (Theme 6) Statement of Ideal Reduce resident and visitor reliance on single
DEVELOP A MULTI-MODAL TRANSPORTATION STRATEGY (THEME 6) WHY IS THIS THEME ADDRESSED? Develop a Multi-Modal Transportation Strategy (Theme 6) Statement of Ideal Reduce resident and visitor reliance on single
AMATS Complete Streets Policy
 AMATS Complete Streets Policy Table of Contents: Section 1. Definition of Complete Streets Section 2. Principles of Complete Streets Section 3. Complete Streets Policy Section 4. Consistency Section 5.
August 3, Bay Trail Connection With The Community
 Ms. Lina Velasco, Senior Planner City of Richmond Planning Division P.O. Box 4046 Richmond, CA 94804 Dear Ms. Velasco: August 3, 2009 73 Belvedere Ave. Richmond, CA 94801 Phone/Fax: 510-235-2835 Email:tracbaytrail@earthlink.net
Street Paving and Sidewalk Policy
 City Commission Policy 600 Street Paving and Sidewalk Policy DEPARTMENT: Public Works DATE ADOPTED: June 7, 1995 DATE OF LAST REVISION: December 10, 2014 Policy No. 600.01 AUTHORITY: PASS City of Tallahassee-Leon
NJDOT Complete Streets Checklist
 Background The New Jersey Department of Transportation s Complete Streets Policy promotes a comprehensive, integrated, connected multi-modal network by providing connections to bicycling and walking trip
San Mateo County Comprehensive Bicycle and Pedestrian Plan Open House
 San Mateo County Comprehensive Bicycle and Pedestrian Plan Open House October 28, 2010 Presented to San Mateo County residents and interested parties by Lauren Ledbetter, Alta Planning + Design Matt Haynes,
Chapter 5. Complete Streets and Walkable Communities.
 Chapter 5. Complete Streets and Walkable Communities. 5.1 Description of Complete Streets. Cities throughout the world, and specifically the United States, are coming to embrace a new transportation and
Michael Parmer, Management Aide, City Manager's Office
 P139 STAFF REPORT f CITY NL- NAGER' S OFFICE RANCHO Date: C;UCAMONGA To: From: Subject: Mayor and Members of the City Council John R. Gillison, City Manager Michael Parmer, Management Aide, City Manager's
GIS Based Data Collection / Network Planning On a City Scale. Healthy Communities Active Transportation Workshop, Cleveland, Ohio May 10, 2011
 The Purpose of GIS Based Network Planning GIS Based Data Collection / Network Planning Healthy Communities Active Transportation Conference Tuesday, May 10, 2011 10:00 AM Norman Cox, LLA, ASLA. Ann Arbor,
Item to be Addressed Checklist Consideration YES NO N/A Required Description Complete Streets Guidelines
 Passaic County Complete Streets Checklist - Concept Development Project Name Item to be Addressed Checklist Consideration YES NO N/A Required Description Complete Streets Guidelines Existing Plans Have
General Design Factors
 Chapter 3: 3-1.0 Introduction General Design Factors Mn/DOT s goals include encouraging and accommodating safe bicycling. From a design perspective, these goals are achieved by first having an understanding
6/14/2013 VIA . Evan Compton, Associate Planner Community Development Department City of Sacramento 300 Richards Blvd Sacramento, CA 95814
 6/14/2013 VIA EMAIL Evan Compton, Associate Planner Community Development Department City of Sacramento 300 Richards Blvd RE: Sacramento Natural Foods Co-Op (P13-025) Dear Mr. Compton: WALKSacramento appreciates
11/3/2014 VIA . WALKSacramento has reviewed the Stockton and T Mixed-Use project at 3675 T Street in the
 11/3/2014 VIA EMAIL Antonio Ablog Planning Department City of Sacramento 300 Richards Boulevard Sacramento, CA 95811 RE: Design Review for Stockton and T Mixed-Use (P14-042) Dear Mr. Ablog: WALKSacramento
WALKNBIKE DRAFT PLAN NASHVILLE, TENNESSEE EXECUTIVE SUMMARY NASHVILLE, TENNESSEE
 NASHVILLE, TENNESSEE EXECUTIVE SUMMARY Executive Summary A world-class multi-modal transportation system is essential to a vibrant city and better quality of life. -Mayor Barry The WalknBike plan aims
Appendix T CCMP TRAIL TRAFFIC & TRANSPORTATION DESIGN STANDARD
 Appendix T CCMP 3.3.4 TRAIL TRAFFIC & TRANSPORTATION DESIGN STANDARD 3.3.4 Trail Traffic and Transportation Design Multi-use trails have certain design standards, which vary depending on the agency that
Caltrans Sloat Boulevard Pedestrian Safety Project Response to Community Questions, Comments & Concerns
 Caltrans Sloat Boulevard Pedestrian Safety Project Response to Community Questions, Comments & Concerns Revised: May 10, 2016 The California Department of Transportation (Caltrans) is planning various
Active Transportation Facility Glossary
 Active Transportation Facility Glossary This document defines different active transportation facilities and suggests appropriate corridor types. Click on a facility type to jump to its definition. Bike
Ocean Park Boulevard Green Street Project Alternatives & Trade Offs
 Planning Commission March 4, 2009 Ocean Park Boulevard Green Street Project Alternatives & Trade Offs Purpose of Tonight s Meeting Review concept plans and options Provide input on alternatives and trade-offs
Hennepin County Pedestrian Plan Public Comment Report
 Hennepin County Pedestrian Plan Public Comment Report On May 31, 2013, the draft Hennepin County Pedestrian Plan was released for a 45-day public comment period ending July 15, 2013. The county received
Bicycle and Pedestrian Facilities Toolbox (Excerpt from Figure 3.1)
") Appendix B Neighborhood Connections Summaries This Appendix is a supplement to the information presented in Chapter 3 Connect People. The Appendix includes a summary or profile for each of the proposed
Appendix B Neighborhood Connections Summaries This Appendix is a supplement to the information presented in Chapter 3 Connect People. The Appendix includes a summary or profile for each of the proposed
This page intentionally left blank.
 This page intentionally left blank. COMMUNITY Coweta Community Overview Coweta Coweta, a residential community located in Wagoner County, is a suburb of Tulsa situated southeast of the metropolitan area
ATTACHMENT 4 - TDM Checklist. TDM Checklist Overview
 ATTACHMENT 4 - TDM Checklist TDM Checklist Overview The proposed checklist rates developments on the degree to which they are TDM and transit supportive. Points are assigned based on the level of transit
IMPLEMENTATION STRATEGIES
 GEORGETOWN SIDEWALK MASTER PLAN 34% of funding is dedicated to Downtown Overlay District sidewalks 28% of funding is recommended within 1/4 mile of Southwestern University 26% of funding is recommended
Active Transportation Infrastructure Investment A Business Case
 Active Transportation Infrastructure Investment A Business Case In 2016, the Real Estate Foundation awarded the Capital Regional District a $50,000 grant for Shifting Gears: Land Use Change through Active
Chapter 5 Future Transportation
 Chapter 5 Future Transportation The Future Land Use Plan identifies the desired land use designations. The land uses desired for Crozet depend, in large part, on the success of the transportation system,
Chapter 13 ORANGE COVE
 Chapter 13 ORANGE COVE This chapter describes the current status and future plans for biking and walking in the City of Orange Cove. RELATIONSHIP TO CITY PLANS AND POLICIES The Orange Cove General Plan
CHAPTER 16 PEDESTRIAN FACILITIES DESIGN AND TECHNICAL CRITERIA TABLE OF CONTENTS
 CHAPTER 16 PEDESTRIAN FACILITIES DESIGN AND TECHNICAL CRITERIA TABLE OF CONTENTS Section Title Page 16.1 General... 16-1 16.1.1 AASHTO Reference... 16-1 16.1.2 ADA Requirements... 16-1 16.2 Sidewalks...
Chapter 14 PARLIER RELATIONSHIP TO CITY PLANS AND POLICIES. Recommendations to Improve Pedestrian Safety in the City of Parlier (2014)
") Chapter 14 PARLIER This chapter describes the current status and future plans for biking and walking in the City of Parlier. RELATIONSHIP TO CITY PLANS AND POLICIES The Parlier General Plan is the primary
Chapter 14 PARLIER This chapter describes the current status and future plans for biking and walking in the City of Parlier. RELATIONSHIP TO CITY PLANS AND POLICIES The Parlier General Plan is the primary
Executive Summary Route 30 Corridor Master Plan
 Route Corridor Master Plan Project Overview The Route Corridor Master Plan is a coordinated multimodal transportation and land use plan for the entire stretch of Route through East Whiteland Township,
City of Sammamish. Welcome. Issaquah-Fall City Road Improvements Project Phase I Design: 242nd Avenue SE to Klahanie Drive SE
 Welcome Welcome to the third community meeting for the Issaquah-Fall City Road Improvements Project. AGENDA 6:00 p.m. Welcome and sign-in 6:10 p.m. Presentation 6:50 p.m. Open house Learn about the roadway
12/4/2016 VIA . RE: Grocery Outlet Del Paso (DR16-328)
") 12/4/2016 VIA EMAIL Ethan Meltzer, Assistant Planner City of Sacramento Community Development Department 300 Richards Blvd, 3 rd Floor Sacramento, CA 95811 RE: Grocery Outlet Del Paso (DR16-328) Dear Mr.
12/4/2016 VIA EMAIL Ethan Meltzer, Assistant Planner City of Sacramento Community Development Department 300 Richards Blvd, 3 rd Floor Sacramento, CA 95811 RE: Grocery Outlet Del Paso (DR16-328) Dear Mr.
Perryville TOD and Greenway Plan
 Perryville TOD and Greenway Plan Greenway Glossary Pathway: A bicycle and pedestrian path separated from motorized vehicular traffic by an open space, barrier or curb. Multi-use paths may be within the