Walmart (Store # ) 60 th Street North and Marion Road Sioux Falls, South Dakota
|
|
|
- Wilfred Marshall
- 5 years ago
- Views:
Transcription

1 Walmart (Store # ) 60 th Street North and Marion Road Sioux Falls, South Dakota Prepared for: Wal-Mart Stores, Inc. Bentonville, Arkansas Prepared by: Kimley-Horn and Associates, Inc. ã2013 Kimley-Horn and Associates, Inc. July
2

3 Walmart (Store # ) 60 th Street North and Marion Road Sioux Falls, South Dakota Prepared for: Wal-Mart Stores, Inc. Bentonville, Arkansas Prepared by: Kimley-Horn and Associates, Inc. I hereby certify that this report was prepared by me or under my direct supervision, and that I am a duly Licensed Professional Engineer under the laws of the State of South Dakota. By: Brandon Bourdon, P.E. License No Date: July 31, 2013
4
5 TABLE OF CONTENTS Page 1 EXECUTIVE SUMMARY INTRODUCTION Background and Purpose of Study Project Location Study Area Data Collection and Study Methodology Existing and Proposed Roadway Conditions SITE IMPACT ANALYSES Background Traffic Project Traffic Level of Service Analysis ADDITIONAL SITE IMPACT CONSIDERATIONS Site Access Multi-Modal Access Truck Volumes Crash Data Traffic Signal Warrant Analysis ACCESS ALTERNATIVE RECOMMENDATIONS APPENDIX A: APPENDIX B: APPENDIX C: Background Traffic, Trip Generation, and Future Traffic Volume Forecasts Capacity Analysis Worksheets Traffic Signal Warrant Analysis Page - i
6 LIST OF FIGURES Page Figure 1 Project Location Map... 8 Figure 2 Site Plan... 9 Figure 3A-3B Existing Lane Geometry Figure 4A-4B Existing Traffic Volumes Figure 5A-5B 2014 Site Distribution and Assignment Figure 6A-6B 2035 Site Distribution and Assignment Figure 7A-7B 2014 AM Peak Hour Traffic Volumes Figure 8A-8B 2014 PM Peak Hour Traffic Volumes Figure Project Daily Traffic Volumes Figure 10A-10B 2035 AM Peak Hour Traffic Volumes Figure 11A-11B 2035 PM Peak Hour Traffic Volumes Figure Project Daily Traffic Volumes Figure Recommended Improvements Figure No Build Lane Geometry Figure No Build Lane Geometry with Needed Infrastructure Improvements Figure 16 Proposed 60 th Street NorthTurn Lanes Figure 19 Sioux Falls Bicycle Trails Figure 20 Proposed Truck Routing for South Dockock Page - ii
7 LIST OF TABLES Page Table 1 Planned Capacity Enhancement Projects within the Study Area Table 2 Trip Generation for Full Build-Out (2035) Table 3 Trip Generation for Opening Day (2014) Table Internal Capture Determination Table 5 LOS Control Delay Thresholds Table 6 Existing AM and PM Peak Hour LOS Table 7 Existing AM and PM Peak Hour Queue Lengths Table No Build AM and PM Peak Hour LOS Table No Build AM and PM Peak Hour Queue Lengths Table Build AM and PM Peak Hour LOS Table Build AM and PM Peak Hour Queue Lengths Table Build for AM and PM Peak Hour with Recommended Improvements Table Build with Recommendations AM and PM Peak Hour Queue Lengths Table No Build for AM and PM Peak Hour LOS Table No Build AM and PM Peak Hour Queue Lengths Table No Build with Needed Improvements for AM and PM Peak Hour LOS Table No Build with Needed Improvements AM and PM Peak Hour Queue Lengths.. 61 Table Build for AM and PM Peak Hour with Needed Improvements LOS Table Build with Needed Improvements AM and PM Peak Hour Queue Lengths Table 20 Study Area Crash Data Table 21 Summary of Warrant Analysis Table 22 Summary of Recommended Infrastructure Improvements 76 Page - iii
8 Page - iv
9 1 EXECUTIVE SUMMARY Wal-Mart Stores, Inc. is proposing the construction of a new store, number , in the northeast quadrant of the intersection of 60 th Street North and Marion Road in Sioux Falls, South Dakota. The store is anticipated to be open in The purpose of the Sioux Falls Walmart (TIA) is to determine the potential traffic impact of the proposed development on the roadways adjacent to the proposed site and to identify potential solutions to mitigate those impacts. The TIA documents the existing traffic conditions in the vicinity of the site, the traffic anticipated to be generated by the project, the distribution and assignment of these trips to the adjacent roadway system, and the evaluation of the traffic operations at key intersections near the site and those providing access to and from the site. Additional consideration was given to the site accesses, multi-modal access, truck volumes, and crash history. Signal warrants were analyzed at the two accesses on 60 th Street North and Marion Road. The existing year (2013), opening year (2014), and future year (2035) are the project horizon years required for evaluation by the City of Sioux Falls. Traffic conditions were evaluated for each of these years and the results of the analysis are provided in the study. This study includes analyses of existing traffic conditions, estimating the traffic impacts of the proposed site development, and development of recommendations for improvements to the existing roadways affected by the development. The study was prepared consistent with the Institute of Transportation Engineers criteria for conducting a traffic impact analysis, the analyses criteria of the most current version (2010) of the Transportation Research Board (TRB) publication Highway Capacity Manual (HCM), and local requirements. The proposed development will include a Walmart store, up to 190,000 square feet, and out-lots retained by the seller for future development. The proposed site is currently vacant agriculture land and is zoned C-4 Planned Commercial District. A Walmart store would require a conditional use permit under the existing C-4 zoning. For the 2014 analyses, the Walmart store was assumed to be open and 25 percent of the out-lots were assumed to be open. For the 2035 horizon year analysis the project site was assumed to be fully developed. Future traffic Page - 5
10 distribution and traffic volumes for the existing and future roadways were determined using the Sioux Falls 2035 Regional Travel Demand Model and existing turning movement counts. Capacity enhancement projects were determined from the Long-Range Transportation Plan (LRTP). Based on the analysis, the following roadway improvements are recommended for implementation by opening day: 60th Street North at Annika Avenue o Signalized intersection o Add westbound right turn lane (330 feet of storage, 95 feet of taper) o Add southbound left turn lane (full length of link) 61 st Street North at Annika Avenue o Add northbound left turn lane (full length of link) Marion Road at North SDDOT Driveway/62 nd Street o Add westbound left turn lane (200 feet of storage, 60 feet of taper) Note that the northbound left turn lane on Annika Avenue at 61 st Street North is not needed for satisfactory operations on opening day, and the southbound approach at 60 th Street North can operate satisfactorily with a 200 foot left turn lane on opening day. However, a northbound left turn lane is recommended for 2035, and the southbound turn lane will need to be the full length of the link by This will require the roadway to be widened in order to fit both a southbound and northbound left turn lane between 60 th Street North and 61 st Street North. To reduce future disruption to the roadway network and the site, it is recommended that the full length turn lanes be installed for opening day. In the long term, growth in the area should continue to be monitored. If the study area develops as indicated in the region s long range plan, several unsignalized intersections may need to be considered for future signalization and turn lanes will need to be added to accommodate the increases in background traffic. Page - 6
11 2 INTRODUCTION 2.1 BACKGROUND AND PURPOSE OF STUDY Wal-Mart Stores, Inc. is proposing the construction of a new store, number , in the northeast quadrant of the intersection of 60 th Street North and Marion Road in Sioux Falls, South Dakota. The store is anticipated to be open in The purpose of the Sioux Falls Walmart (TIA) is to determine the potential traffic impact of the proposed development on the roadways adjacent to the proposed site and to identify potential solutions to mitigate those impacts. This TIA documents the existing traffic conditions in the vicinity of the site, the traffic anticipated to be generated by the project, the distribution and assignment of these trips to the adjacent roadway system, and the evaluation of the traffic operations at key intersections near the site and those providing access to and from the site. The existing year (2013), opening year (2014), and future year (2035) are the project horizon years required for evaluation by the City of Sioux Falls. Traffic conditions were evaluated for each of these years and the results of the analysis are provided in this study. 2.2 PROJECT LOCATION The project site is located north of 60 th Street North and east of Marion Road. The project location is shown on the vicinity map in Figure 1. The proposed site plan is shown in Figure 2. Page - 7

12 Figure 1 Project Location Map Page - 8


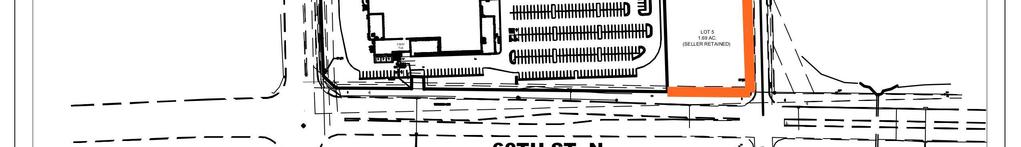
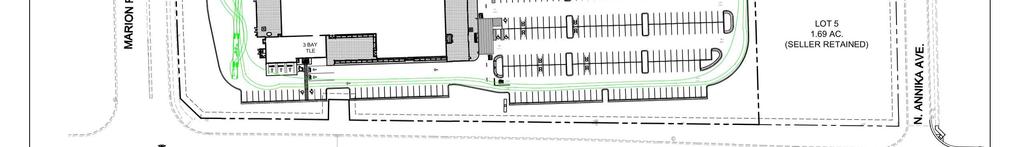
13 Figure 2 Site Plan Page - 9
14 2.3 STUDY AREA The project site is bounded by 60 th Street North to the south and Marion Road on the west. The proposed development will include a Walmart store, up to 190,000 square feet, and out-lots retained by the seller for future development. The proposed site is currently vacant agriculture land and is zoned C-4 Planned Commercial District, which is described in City zoning code as intended to provide for well-designed commercial areas primarily in developing areas along major arterials. The site is located in the region s Growth Area, as denoted by the Sioux Falls Metropolitan Planning Organization s (MPO) 2035 Long Range Transportation Plan (LRTP). Surrounding land uses include a mix of light industrial, institutional, agricultural, and residential. A Walmart store would require a conditional use permit under the existing C-4 zoning. The following existing intersections were analyzed as part of this traffic impact analysis and define the boundary of the study area: Existing Intersections 60th Street North at Marion Road (signalized) 60th Street North at La Mesa Drive/470 th Avenue (two-way stopped controlled on La Mesa Drive) 60th Street North at Annika Avenue (two-way stopped controlled on Annika Avenue) 60th Street North at Career Avenue (two-way stopped controlled on Career Avenue) 60th Street North at the west I-29 Ramp (signalized) 60th Street North at the east I-29 Ramp (signalized) Benson Road at Marion Road (two-way stopped controlled on Benson Road) Benson Road at Career Avenue (signalized) Marion Road at south SDDOT Driveway (right-in/right-out on) Marion Road at north SDDOT Driveway/62 nd Street (two-way stopped controlled on north SDDOT Driveway) Marion Road at south I-90 Ramp (two-way stopped controlled on south I-90 Ramp) Marion Road at north I-90 Ramp (two-way stopped controlled on north I-90 Ramp) Annika Avenue at 61 st Street North (two-way stopped controlled on 61 st Street North) Annika Avenue at 62 nd Street North (two-way stopped controlled on 62 nd Street North) Page - 10
15 Future intersections within the study area that will provide additional site access are listed below. Future Intersections 62 nd Street North at Walmart Driveway (unsignalized) Access to the site will be limited to two full movement accesses on Annika Avenue and 62 nd Street North, which connect to 60 th Street North and Marion Road, respectively. Access to the outlots are not determined, but would not be permitted along 60 th Street North or Marion Road. Other sections where outlot access would not be recommended are shown in Figure DATA COLLECTION AND STUDY METHODOLOGY This study includes analyses of existing traffic conditions, estimating the traffic impacts of the proposed site development, and development of recommendations for improvements to the existing roadways affected by the development. The study was prepared consistent with the Institute of Transportation Engineers criteria for conducting a traffic impact analysis, the analyses criteria of the most current version (2010) of the Transportation Research Board (TRB) publication Highway Capacity Manual (HCM), and local requirements. Intersection turning movement count (TMC) data was provided for the following intersections by the City of Sioux Falls. These counts were conducted in 2012 and th Street North at Marion Road (5/29/2012) 60th Street North at Career Avenue (5/29/2012) 60th Street North at the west I-29 Ramp (5/31/2012) 60th Street North at the east I-29 Ramp (5/31/2012) Benson Road at Marion Road (6/6/2012) Benson Road at Career Avenue (6/6/2012) Marion Road at south I-90 Ramp (3/12/2013) Marion Road at north I-90 Ramp (3/12/2013) Page - 11
16 TMCs were conducted in March 2013 at the following intersections: 60th Street North at La Mesa Drive/470 th Avenue (3/13/2013) 60th Street North at Annika Avenue (3/13/2013) Marion Road at south SDDOT Driveway (3/13/2013) Marion Road at north SDDOT Driveway/62 nd Street North (3/13/2013) Annika Avenue at 61 st Street North (3/13/2013) All above mentioned traffic counts are provided in the Appendix A. Analyses were conducted to determine the traffic impact of the development on the roadway network and the study area intersections. The methodology for these analyses included determining the number of trips expected to be generated by the development, estimating the directional distribution of these trips, assigning trips to the adjacent roadways, and estimating the future traffic conditions on the adjacent roadways with and without the proposed development. For the 2014 analyses, the Walmart store was assumed to be open and 25 percent of the out-lots were assumed to be open. For the 2035 horizon year analysis the project site was assumed to be fully developed. Future traffic distribution and traffic volumes for the existing and future roadways were determined using the Sioux Falls 2035 Regional Travel Demand Model. Capacity enhancement projects were determined from the LRTP. All capacity and level of service analyses were conducted in accordance with the methods and procedures outlined in the 2010 HCM. 2.5 EXISTING AND PROPOSED ROADWAY CONDITIONS The existing lane geometry and traffic control for the study area intersections are shown in Figure 3. The existing AM and PM peak hour volumes are illustrated in Figure 4. In addition, averages of the 2008 to 2012 average annual daily traffic (AADT) volumes for the study area roadways are shown in Figure 4. The AADTs were provided by the City of Sioux Falls Traffic Volume Counts for the City of Sioux Falls Page - 12
17 Below is a description of the roadways located in the study area. The two primary roadways within the study area are Marion Road and 60th Street North. Marion Road is a divided four-lane road between I-90 and 60th Street North and is a two-lane road north of I-90 and south of 60th Street North. Marion Road provides access to both eastbound and westbound I-90. Marion Road is classified as a priority 1 principal arterial. 60th Street North is a divided four-lane road to the east of Marion Road and becomes a two-lane road approximately 1800 feet west of Marion Road. 60th Street North provides access to both northbound and southbound I th Street North is classified as a priority 1 principal arterial. La Mesa Drive is a two-lane road north of 60th Street North and is an unpaved two-lane road south of 60th Street North. Benson Road is a divided four-lane road to the east of Career Avenue and becomes a two-lane road to the west of Career Avenue. Benson Road from Career Avenue to Marion Road is currently under construction for the full urban build out of four lanes. The project is scheduled for completion in summer of La Mesa Drive and Benson Road are both classified as minor arterials. Career Avenue is a two-lane road and is classified as a major collector. 62nd Street is a two-lane road and is classified as a major collector. Annika Avenue is a two-lane road that intersects with 60th Street North east of the proposed Walmart site. Annika Avenue is classified as a major collector. Page - 13
18 Figure 3A-3B Existing Lane Geometry Page - 14
19 Page - 15
20 Figure 4A-4B Existing Traffic Volumes Page - 16
21 Page - 17
22 2.5.1 Planned and Committed Projects The capacity enhancement projects listed in Table 1 were identified in the Sioux Falls MPO s Transportation Improvements Program (TIP) and 2035 LRTP. These projects would impact the roadway network within the study area and were assumed to be constructed prior to the 2035 horizon year. Table 1 Planned Capacity Enhancement Projects within the Study Area Route Location of Project Type of Improvement Source Marion Road Madison Street to 60th Street North Widen to 4 lanes 2035 LRTP 60th Street North La Mesa Drive to Marion Road Widen to 4 lanes 2035 LRTP 62 nd Street North Marion Road to Annika Avenue New 2 lane road 2035 TDM Sources: Direction 2035 Sioux Falls MPO Long-Range Transportation Plan, Adopted November 18, 2010 Note that the connection of 62 nd Street North between Marion Road and Annika Avenue would be constructed as development requires. With the proposed development, the segment of 62 nd Street North between Marion Road and the Walmart Driveway would be constructed before opening day. 3 SITE IMPACT ANALYSES Analyses were conducted to estimate the impact of the proposed development on the adjacent street network. 3.1 BACKGROUND TRAFFIC Traffic volumes for the horizon years were developed based on existing count data, the Sioux Falls Regional Travel Demand Model, and input from the City of Sioux Falls. The proposed Walmart site is expected to open in Background traffic volumes were obtained by Page - 18
23 increasing the existing traffic volumes by an amount that represents potential growth in the study area. Traffic volume projections from the 2035 Sioux Falls Regional Travel Demand Model were used to develop a growth rate for the study area roadways. A weighted average of the projected growth rate for the roadway segments within the study area yielded a growth rate of 4%. This growth rate was used to project background traffic volumes to the 2014 horizon year. Applying this growth rate to existing traffic volumes resulted in 2035 volumes that were inconsistent with the Travel Demand Model. For 2035 background traffic volumes, turning movement volumes were developed from the directional forecast link volumes for each peak period, a review of existing turning movement patterns, and engineering judgment. 3.2 PROJECT TRAFFIC Project traffic is the number of vehicle trips expected to be generated by the proposed Walmart site. These traffic volumes were estimated and assigned to the study roadway network for the future build conditions as detailed below. In addition to the proposed Walmart store, there are several out-lots available for development on the site. It is important to understand the impact of the trips generated by these out-lots in addition to the proposed Walmart trips. It is expected that additional site traffic from some of these out-lots will be generated in addition to the Walmart traffic during the 2014 horizon year. However, the proposed uses for these out-lots are currently unknown at the time of this study. Therefore, land use types for these out-lots were selected based on aggressive trip generation rates and discussions with the City staff Trip Generation The Institute of Transportation Engineers (ITE) Trip Generation Manual (9th Edition) was used to estimate the number of trips to be generated by the assumed land use types for the various outlots on the site. Trips generation rates used for the Walmart store were based on a study conducted by the South Dakota Department of Transportation (SDDOT), Verify Certain ITE Trip Generation Rate Applications in South Dakota (Study F). These trip generation Page - 19
24 rates were based on a review of an existing Walmart store located in east Sioux Falls. It should be noted that the proposed Walmart trip generation rates from the SDDOT study are higher than what is contained in the ITE Trip Generation Manual. It is expected that with the development of additional Walmart stores in Sioux Falls, the number of trips generated by the existing store located in east Sioux Falls would decrease due to the presence of additional stores. Therefore, the number of trips generated by a new Walmart store will potentially be less than what is presented in the SDDOT study and this TIA. Full Build-Out Project Traffic (2035) The daily, AM peak hour, and PM peak hour traffic expected to be generated by the proposed full build out of the development is shown in Table 2. Existing non-vehicular travel was examined and determined to be negligible; therefore, no reductions were made for transit use or pedestrian travel. Supporting documentation including trip generation calculations and peak hour project trips are provided in the Appendix A. Table 2 Trip Generation for Full Build-Out (2035) Land Use Intensity Daily Trips AM Peak Hour Trips PM Peak Hour Trips Code Land Use Type Intensity Unit Total In Out Total In Out Total In Out Wal-Mart 813* Free-Standing Discount Superstore 190,000 s.f. 12,567 6,284 6, , Outlots (Full Buildout) 932 High-Turnover (Sit-Down) Restaurant 6,000 s.f Fast Food Restaurant with Drive-Through 4,000 s.f. 1, Speciality Retail Center 40,000 s.f. 1, Speciality Retail Center 104,000 s.f. 4,609 2,305 2, Entire Development Outlot Subtotal Entire Development Subtotal Internal Capture Trip Reduction (Total) Pass By Trip Reduction (Total) Total Site Traffic 9,129 4,566 4, ,696 10,850 10, , ,890-3,445-3, N/A N/A N/A ,806 7,405 7, , Sources: * Verify Certain ITE Trip Generation Rate Applications in South Dakota, SDDOT Study F Institute of Transportation Engineers, Trip Generation, 9 th Edition Total site traffic was calculated by applying the appropriate internal capture and pass-by trips based on the ITE Trip Generation Handbook. Page - 20
25 Internal capture trips are trips that stay within the development and travel between the land uses. Similar land use types were combined together to calculate the internal capture, as shown in the internal capture matrices provided in Appendix A. The internal capture trip reduction was determined to be approximately 32% and 18% for the Daily and PM peak period trips, respectively. No internal capture reduction was applied to the AM peak hour. Additionally, trips already on the adjacent roadway network that access the development as they pass-by the site were calculated based on the Trip Generation Handbook. Projected new traffic on the roadways was reduced by the number of pass-by trips, as they represent drivers making an intermediate stop on the way from an origin to their trip destination. The City of Sioux Falls requires that the pass-by trip reduction not be greater than 25% of the adjacent street traffic. The pass-by trip reduction was determined to be approximately 18% and 20% for the AM and PM peak periods, respectively. Opening Day Project Traffic (2014) For the purpose of this study, it was assumed for the 2014 horizon year that the Walmart would be 100 percent built out and approximately 25% of the out-lots would be built out. Proposed site generated traffic for the 2014 horizon year is shown in Table 3. Table 3 Trip Generation for Opening Day (2014) Land Use Daily Trips AM Peak Hour Trips PM Peak Hour Trips Code Land Use Type Intensity Intensity Unit Total In Out Total In Out Total In Out 813* Free-Standing Discount 190,000 s.f. 12,567 6,284 6, , N/A 25% of Full Build Out Outlot Trips N/A N/A 2,282 1,142 1, Subtotal 14,849 7,426 7, , Internal Capture -1, Pass By Reduction (25% of Adjacent Street Peak Hour Volume) N/A N/A N/A Total Site Traffic 13,364 6,683 6, Sources: Verify Certain ITE Trip Generation Rate Applications in South Dakota, SDDOT Study F Institute of Transportation Engineers, Trip Generation, 9 th Edition Total site traffic was calculated by taking 25% of the full build out out-lot trips, adding the trips generated by the Walmart, and applying the appropriate internal capture and pass-by trip reductions. Page - 21
26 For the 2014 horizon year, the site is not expected to generate the same amount of internal capture and pass-by trip reductions as for the 2035 horizon year, because less of the site will be developed in Since the ITE method for calculating internal capture could not be used to calculate internal capture for the 2014 development scenario, 10% internal capture was used for the daily trips, based on discussions with the City. The 2014 PM peak hour internal capture was determined by taking the ratio of the 2035 PM peak hour out-lot internal capture to the 2035 total out-lot trips and applying that ratio to the 2014 total out-lot trips, as shown in the Table 4. This results in a PM peak hour internal capture rate of approximately 7%. The pass-by trip reduction was calculated to be greater than 25% of adjacent street traffic. Therefore, to keep the pass-by trip reduction percentage to less than 25% of the volume of traffic on the adjacent streets, the pass-by trip reduction rate was determined to be 14% of the total number of trips generated during the PM peak period. No internal capture or pass-by trip reduction was applied to the AM peak hour. Table Internal Capture Determination 2035 Outlot Trips 580 trips 2035 Outlot Internal Capture Trips 308 trips 2035 Internal Capture Ratio: 53% 2014 Outlot Trips 145 trips Calculated 2014 Outlot Internal Capture Trips (53% x 145) 77 trips Trip Distribution and Assignment The distribution of trips generated from the proposed development was estimated based on the existing traffic counts, existing land use and development of the surrounding area, local population densities, and the Sioux Falls Regional Travel Demand Model. Two different site distributions were created for this study: one for 2014 and another for The 2014 site distribution was based primarily on existing traffic data, because site traffic in 2014 is generally expected to follow existing traffic patterns. However, traffic patterns in 2035 would be expected to change due to new growth and development in the region. Therefore, the 2035 site distribution Page - 22
27 was based primarily on the 2035 Sioux Falls Regional Travel Demand Model, which accounts for future growth and changes in the roadway network. The directional distributions of trips generated by the proposed development for 2014 and 2035 are shown in Figure 5 and Figure 6, respectively. Using this directional distribution, traffic generated by the site was assigned to the roadway network and added to the background traffic to obtain the AM and PM peak hour total traffic volumes. The AM and PM peak hour total volumes for the 2014 horizon year are shown in Figure 7 and Figure 8, respectively. The projected 2014 daily traffic volumes showing background and site are illustrated Figure 9. The AM and PM peak hour total volumes for the 2035 horizon year are shown in Figure 10 and Figure 11, respectively. The daily traffic volumes with the projected 2035 background and site traffic are shown in Figure 12. These figures show the background traffic, assigned site generated traffic, pass-by trips, and the total peak hour volumes for the proposed site. Page - 23
28 Figure 5A-5B 2014 Site Distribution and Assignment Page - 24
29 Page - 25
30 Figure 6A-6B 2035 Site Distribution and Assignment Page - 26
31 Page - 27
32 Figure 7A-7B 2014 AM Peak Hour Traffic Volumes Page - 28
33 Page - 29
34 Figure 8A-8B 2014 PM Peak Hour Traffic Volumes Page - 30
35 Page - 31
36 Figure Project Daily Traffic Volumes Page - 32
37 Figure 10A-10B 2035 AM Peak Hour Traffic Volumes Page - 33
38 Page - 34
39 Figure 11A-11B 2035 PM Peak Hour Traffic Volumes Page - 35
40 Page - 36
41 Figure Project Daily Traffic Volumes Page - 37
42 3.3 LEVEL OF SERVICE ANALYSIS Capacity is defined as the maximum number of vehicles that can pass a particular point within a fixed time duration. Capacity is combined with Level-of-Service (LOS) to describe the operating characteristics of an intersection or roadway. LOS is a qualitative measure that describes operational conditions and motorist perceptions within a traffic stream. The Highway Capacity Manual (HCM) defines six levels of service, LOS A through LOS F, with A representing the shortest average delays and F representing the longest average delays. Table 5 shows the LOS control delay thresholds published in the HCM for signalized and unsignalized intersections with corresponding definitions used as guidelines to determine the LOS. Table 5 LOS Control Delay Thresholds LOS A B C D E F Signalized Intersections Average Control Delay Per Vehicle [sec/veh] Unsignalized Intersections Average Control Delay [sec/veh] Free-flow traffic operations at average travel speeds. Vehicles completely unimpeded in ability to maneuver. Minimal delay at signalized intersections. > > Reasonably unimpeded traffic operations at average travel speeds. Vehicle maneuverability slightly restricted. Low traffic delays. > > Stable traffic operations. Lane changes becoming more restricted. Travel speeds reduced to half of average free flow travel speeds. Longer intersection delays. >35 55 > Small increases in traffic flow can cause increased delays. Delays likely attributable to increase traffic, reduced signal progression and adverse timing. >55 80 > Significant delays. Travel speeds reduced to one third of average free flow travel speed. > 80 > 50 Extremely low speeds. Intersection congestion. Long delays. Extensive traffic queues at intersections. Source: Highway Capacity Manual, Transportation Research Board, Washington, D.C., 2010 Relative Delay Short Delays Moderate Delays Long Delays Page - 38
43 The existing and future traffic volumes were analyzed to determine the anticipated level of service (LOS) for each of the intersections within the study area using the analysis methodology found in the HCM and Trafficware s Synchro/SimTraffic version 8. Each intersection was analyzed for AM and PM peak hours for the following scenarios: 2013 Existing Conditions 2014 No Build (without project trips) Conditions 2014 Build (Opening Day) Conditions 2014 Build (Opening Day) Conditions with Recommended Improvements 2035 No Build (without project trips) Conditions 2035 No Build (without project trips) Conditions with Needed Improvements 2035 Build (Full Build-Out) Conditions with Needed Improvements 2035 Build (Full Build-Out) Conditions with Additional Improvements Supporting HCM reports from Synchro and SimTraffic are included in Appendix B. For each scenario, five one-hour simulations were conducted in SimTraffic. In addition to the LOS analysis, a queuing analysis was conducted using SimTraffic. Detailed queuing reports are included in Appendix B. It should be noted that by using the HCM methodology, vehicles turning right on red (RTOR) are not accounted for unless the numbers of such vehicles are entered directly as an input. This sometimes results in heavier than expected delays calculated for right turn movements that would not necessarily reflect real life conditions. The following methodology was used to help approximate the number of RTOR movements at appropriate intersections. It was assumed that the majority of RTOR movements would occur during the protected left turn phase of the cross street. Based on an estimated average time of approximately five seconds per vehicle for a driver to stop, recognize the cross street left turn phase is active, and determine it is acceptable to make a right turn on red, the length of the cross street protected left turn phase was divided by five to estimate the number of vehicles that could make a right turn after stopping Page - 39
44 during that protected left turn phase. In addition, if the volume of the conflicting through movements were found to be low, additional right turn on red movements were calculated. Generally, this reduction was only applied at intersections with only one exclusive right-turn lane. Page - 40
45 Existing Conditions A capacity analysis was conducted on the study area intersections using the peak hour TMCs that were collected. The resulting LOS for the existing AM and PM peak periods are shown in Table 6. Table 6 Existing AM and PM Peak Hour LOS Intersection Marion Rd at 60th St Annika Ave at 61st St Annika Ave at 60th St I-90 South Ramp at Marion Rd I-90 North Ramp at Marion Rd Career Ave at Benson Rd Marion Rd at SDDOT North Driveway Marion Rd at SDDOT South Driveway Control I-29 NB Ramp at 60th St Signal Le Mesa Dr at 60th St Marion Rd at Benson Rd Annika Ave at 62nd St Career Ave at 60th St Signal I-29 SB Ramp at 60th St Signal AWSC Signal Existing AM Existing PM Approach Approach Operations EB WB NB SB Overall EB WB NB SB Overall Delay (sec/veh) LOS B B C B B B B C C B Delay (sec/veh) LOS A A - A A A A A A A Delay (sec/veh) LOS A B D - B B B D - B Delay (sec/veh) LOS B B D - C A A D - B Delay (sec/veh) LOS A A B B A A A A B A Delay (sec/veh) LOS A A A A A A A A A A Delay (sec/veh) LOS A A A B A A A B B A Delay (sec/veh) LOS A - A A A A - A A A Delay (sec/veh) LOS A - A A A A - A A A Delay (sec/veh) LOS - A A A A - A A A A Delay (sec/veh) LOS A A B - A A A B - A Delay (sec/veh) LOS A A C D A A A C D B Delay (sec/veh) LOS A - A A A A - A A A Delay (sec/veh) LOS A - A A A A - A A A As shown in Table 6, all of the study area intersections operate at acceptable LOS. Queuing and Blocking The existing AM and PM peak hour 95 th percentile queue lengths for the exclusive turn lanes are shown in Table 7. There are two instances of where turn lane blocking can occur: (1) When the volume in the exclusive turn lane exceeds the available storage and spills back into the adjacent travel lane; or (2) the volume in the adjacent lane blocks vehicles from entering the exclusive turn lane. Generally, the occasional blocking can occur during the peak hour without seriously Page - 41
46 impacting the overall operation of the intersection. Values highlighted represent conditions where the turn lane queue extended beyond the storage length or the adjacent lane queue extended beyond the left turn storage length, resulting in a significant percent of blockage during the model simulation. Table 7 Existing AM and PM Peak Hour Queue Lengths Intersection Marion Rd at 60th St Control Signal I-29 SB Ramp at 60th St Signal I-29 NB Ramp at 60th St Signal Marion Rd at Benson Rd Annika Ave at 60th St I-90 South Ramp at Marion Rd AWSC Exclusive Turn Lanes Storage Length* (ft) Existing AM 95th Queue Length (ft) Adjacent Turn Lane Through Lane Existing PM 95th Queue Length (ft) Adjacent Turn Lane Through Lane EBL EBR WBL NBL SBL SBR N/A EBR WBL NBL N/A NBR EBL NBL NBL SBL EBL NBL EBL N/A EBR NBL I-90 North Ramp at Marion Rd NBL WBL Career Ave at 60th St NBL N/A NBR N/A EBL WBL Career Ave at Benson Rd Signal NBL NBR SBL Marion Rd at SDDOT EBL North Driveway NBL Marion Rd at SDDOT South Driveway EBR N/A Note: * Storage length includes 25 feet for storage that occurs in the taper. Under existing conditions, there are no instances of queues extending past the available storage or blocking of exclusive turning lanes by adjacent through lane vehicles. Page - 42
47 Horizon Year The 2014 horizon year analysis for both No Build and Build conditions assumes the roadway network, lane geometry, and signal timings are unchanged from the existing conditions. This allows the capacity analysis to be compared with different scenarios No Build Conditions The summary of the 2014 No Build capacity analysis using the projected background traffic volumes is shown in Table 8. Table No Build AM and PM Peak Hour LOS 2014 No Build AM 2014 No Build PM Approach Approach Intersection Control Operations EB WB NB SB Overall EB WB NB SB Overall Marion Rd at 60th St Signal Delay (sec/veh) LOS B B C B B B B C C B Annika Ave at 61st St Delay (sec/veh) LOS - A A A A - A A A A I-29 SB Ramp at 60th St Signal Delay (sec/veh) LOS A B D - B B B D - B I-29 NB Ramp at 60th St Signal Delay (sec/veh) LOS B B D - C A A D - B La Mesa Dr at 60th St Delay (sec/veh) LOS A A B B A A A A B A Marion Rd at Benson Rd AWSC Delay (sec/veh) LOS A A A A A A A A A A Annika Ave at 60th St Delay (sec/veh) LOS A A B B A A A B C A I-90 South Ramp at Marion Delay (sec/veh) Rd LOS A - A A A A - A A A I-90 North Ramp at Marion Delay (sec/veh) Rd LOS A - A A A A - A A A Annika Ave at 62nd St Delay (sec/veh) LOS - A A A A - A A A A Career Ave at 60th St Delay (sec/veh) LOS A A B - A A A B - A Career Ave at Benson Rd Signal Delay (sec/veh) LOS A A C D A A A C D B Marion Rd at SDDOT Delay (sec/veh) North Driveway LOS A - A A A A - A A A Marion Rd at SDDOT Delay (sec/veh) South Driveway LOS A - A A A A - A A A For 2014 No Build conditions, the study area intersections are expected to have minor increases in vehicular delay. All intersections and approaches are expected to operate at acceptable LOS. Page - 43
48 Queuing and Blocking The summary of the projected 95 th percentile queue lengths for the 2014 No Build conditions during the AM and PM peak hours are shown in Table 9. Table No Build AM and PM Peak Hour Queue Lengths Intersection Marion Rd at 60th St I-90 North Ramp at Marion Rd Marion Rd at SDDOT South Driveway Control I-29 NB Ramp at 60th St Signal Marion Rd at Benson Rd Annika Ave at 60th St I-90 South Ramp at Marion Rd Career Ave at 60th St Career Ave at Benson Rd Marion Rd at SDDOT North Driveway Signal I-29 SB Ramp at 60th St Signal AWSC Exclusive Turn Storage Length* 2014 No Build AM 95th Queue Length (ft) Adjacent Through Lane Adjacent Through Lane Lanes (ft) Turn Lane Turn Lane EBL EBR WBL NBL SBL SBR N/A EBR WBL NBL N/A NBR EBL NBL NBL SBL EBL NBL EBL N/A EBR NBL NBL Signal 2014 No Build PM 95th Queue Length (ft) WBL NBL N/A NBR N/A EBL WBL NBL NBR SBL EBL EBR N/A NBL EBR N/A Note: * Storage length includes 25 feet for storage that occurs in the taper. As with existing conditions, there are no instances of queues extending past the available storage or blocking of exclusive turning lanes by adjacent through lane vehicles. Although traffic in Page - 44
49 2014 was grown 4% per year from existing conditions, some queues are slightly shorter than modeled in the existing conditions due to the random generation in the traffic modeling Build Conditions The summary of the 2014 Build capacity analysis using the projected background plus site traffic volumes with the existing lane geometry and traffic control is shown in Table 10. Table Build AM and PM Peak Hour LOS 2014 Build AM 2014 Build PM Approach Approach Intersection Control Operations EB WB NB SB Overall EB WB NB SB Overall Marion Rd at 60th St Signal Delay (sec/veh) LOS B B C B B B B C C B Annika Ave at 61st St Delay (sec/veh) LOS A B A A A B F A A C I-29 SB Ramp at 60th St Signal Delay (sec/veh) LOS A B D - B B B D - B I-29 NB Ramp at 60th St Signal Delay (sec/veh) LOS B B D - C A B D - B La Mesa Dr at 60th St Delay (sec/veh) LOS A A B C A A A A C A Marion Rd at Benson Rd AWSC Delay (sec/veh) LOS A A A A A A A A A A Annika Ave at 60th St Delay (sec/veh) LOS A A C C A A A C F F I-90 South Ramp at Marion Delay (sec/veh) Rd LOS A - A A A A - A A A I-90 North Ramp at Marion Delay (sec/veh) Rd LOS A - A A A A - A A A Annika Ave at 62nd St Delay (sec/veh) LOS - A A A A - A A A A Career Ave at 60th St Delay (sec/veh) LOS A A C - A A A C - A Career Ave at Benson Rd Signal Delay (sec/veh) LOS A A D D B A A C D C Marion Rd at SDDOT Delay (sec/veh) North Driveway LOS B A A A A B B A A A Marion Rd at SDDOT Delay (sec/veh) South Driveway LOS A - A A A A - A A A With the additional site traffic, Annika Avenue at 60th Street North and Annika Avenue at 61 st Street North are expected to be significantly impacted. These intersections are expected to operate at unacceptable LOS during the PM peak hours. The intersection of Annika Avenue at 60th Street North currently operates with stop control on Annika Avenue. This method of traffic control is not sufficient to handle the increase in demand resulting in Annika Avenue experiencing significant delays. The signalization of this intersection may be required to allow for the additional site traffic. Page - 45
50 Queuing and Blocking Queue lengths for the study area intersections with the additional site traffic are shown in Table 11. Table Build AM and PM Peak Hour Queue Lengths Intersection Marion Rd at 60th St I-90 North Ramp at Marion Rd Signal I-29 SB Ramp at 60th St Signal I-29 NB Ramp at 60th St Signal Marion Rd at Benson Rd Annika Ave at 60th St I-90 South Ramp at Marion Rd Career Ave at 60th St Career Ave at Benson Rd Marion Rd at SDDOT North Driveway Control AWSC 2014 Build AM 95th Queue Length (ft) Adjacent Turn Lane Through Lane 2014 Build PM 95th Queue Length (ft) Adjacent Turn Lane Through Lane Lanes (ft) EBL EBR WBL NBL SBL SBR N/A EBR WBL NBL N/A NBR EBL NBL NBL SBL EBL NBL EBL N/A EBR NBL NBL Signal Exclusive Turn Storage Length* WBL NBL N/A NBR N/A EBL WBL NBL NBR SBL EBL WBL NBL NBR SBL Marion Rd at SDDOT EBR N/A South Driveway Note: * Storage length includes 25 feet for storage that occurs in the taper. There are no instances of queues extending past the available storage or blocking of exclusive turning lanes by adjacent through lane vehicles. Page - 46
51 2014 Build Conditions with Recommended Improvements Based on the above analysis, the following improvements, shown in Figure 13, were analyzed to address the traffic issues. 60th Street North at Annika Avenue o Signalized intersection o Add westbound right turn lane (330 feet of storage, 95 feet of taper) o Add southbound left turn lane (150 feet of storage, 60 feet of taper) Marion Road at North SDDOT Driveway/62 nd Street North o Add westbound left turn lane (200 feet of storage, 60 feet of taper) The westbound right turn on 60th Street North at Annika Avenue is not expected to operate poorly based on the analysis, but the turn lane is included to remove decelerating turning vehicles from the mainline through lanes. The intersection of Marion Road at North SDDOT Driveway/62 nd Street North has already been constructed, with approximately 60 feet of roadway width on 62 nd Street North. The westbound left turn lane is included to better tie into the constructed curbs, while also providing for improved operations at Marion Road. Page - 47
52 Figure Recommended Improvements Page - 48
53 These recommended improvements are expected to improve the LOS for the study area intersections such that the expected delay will be similar to the No Build conditions. The summary of the 2014 Build capacity analysis with the recommended improvements is shown in Table 12. Table Build for AM and PM Peak Hour with Recommended Improvements 2014 Build with Re comme ndations AM 2014 Build with Recommendations PM Approach Approach Intersection Control Operations EB WB NB SB Overall EB WB NB SB Overall Marion Rd at 60th St Signal Delay (sec/veh) LOS B B C B B B B C C B Annika Ave at 61st St Delay (sec/veh) LOS A B A A A B F A A C I-29 SB Ramp at 60th St Signal Delay (sec/veh) LOS A B D - B B B D - B I-29 NB Ramp at 60th St Signal Delay (sec/veh) LOS B B D - C A B D - B La Mesa Dr at 60th St Delay (sec/veh) LOS A A B C A A A A C A Marion Rd at Benson Rd AWSC Delay (sec/veh) LOS A A A A A A A A A A Annika Ave at 60th St Signal Delay (sec/veh) LOS A A B A A B B C B B I-90 South Ramp at Marion Delay (sec/veh) Rd LOS A - A A A A - A A A I-90 North Ramp at Marion Delay (sec/veh) Rd LOS A - A A A A - A A A Annika Ave at 62nd St Delay (sec/veh) LOS - A A A A - A A A A Career Ave at 60th St Delay (sec/veh) LOS A A C - A A A C - A Career Ave at Benson Rd Signal Delay (sec/veh) LOS A A D D B A A C D C Marion Rd at SDDOT Delay (sec/veh) North Driveway LOS B A A A A B B A A A Marion Rd at SDDOT Delay (sec/veh) South Driveway LOS A - A A A A - A A A With the recommended signalization of 60th Street North at Annika Avenue, the intersection now operates at acceptable LOS. The westbound approach to Annika Avenue from 61 st Street North operates at LOS F. However, simulation results from SimTraffic, which takes into account interactions between intersections, show only 11.1 seconds of delay per vehicle. The addition of the signal at 60 th Street North is expected to provide gaps for the 28 westbound vehicles at 61 st Street North. No changes are recommended in 2014 at 61 st Street North. The remaining study area intersections continue to operate at an LOS that is consistent with 2014 No Build conditions. Page - 49
54 Queuing and Blocking Queue lengths for the study area intersections with the proposed improvements are shown in Table 13. With the additional 2014 site traffic and the recommended improvements, only the southbound left turn queue at Annika Avenue and 60 th Street North extends beyond the storage. The change in traffic control at the intersection increases queue lengths for the southbound left turn movement, with a 95 th percentile queue of 190 feet. A 200-foot left turn lane would better accommodate opening day queues. There are no instances of through lane queues blocking access to adjacent exclusive turning lanes. Page - 50
55 Table Build with Recommendations AM and PM Peak Hour Queue Lengths Intersection Marion Rd at 60th St I-90 North Ramp at Marion Rd Marion Rd at SDDOT North Driveway Marion Rd at SDDOT South Driveway Control I-29 NB Ramp at 60th St Signal Marion Rd at Benson Rd Annika Ave at 60th St I-90 South Ramp at Marion Rd Career Ave at 60th St Career Ave at Benson Rd Signal I-29 SB Ramp at 60th St Signal AWSC Signal Adjacent Through Lane Adjacent Through Lane Lanes (ft) Turn Lane Turn Lane EBL EBR WBL NBL SBL SBR N/A EBR WBL NBL N/A NBR EBL NBL NBL SBL EBL WBR NBL SBL EBL N/A EBR NBL NBL Signal Exclusive Turn Storage Length* 2014 Build with Recommendations AM 95th Queue Length (ft) 2014 Build with Recommendations PM 95th Queue Length (ft) WBL NBL N/A NBR N/A EBL WBL NBL NBR SBL EBL WBL NBL NBR SBL EBR N/A Note: * Storage length includes 25 feet for storage that occurs in the taper. Page - 51
56 Horizon Year This traffic impact analysis reviews the future conditions of the study area in 2035 to coincide with the region s long-range planning efforts. It should be noted that the anticipated full build out of the site will occur prior to During this analysis, it was observed that the majority of the impact to the roadway network was due to the projected 2035 background volumes from the regional travel demand model. Prior traffic analyses completed in this portion of the City have been generally limited to regional travel demand modeling and general planning level analyses. This is the first traffic impact analysis that has been completed that has included considerable turning movement traffic projections. Since this is an area where growth is anticipated, it will be important that those completing other traffic analyses continue to collect traffic data to validate actual growth patterns. It is important that appropriate adjustments are made to turning movement projections based on actual growth patterns and changes in traffic patterns as a part of other analyses. Additional studies are recommended as growth continues in the area. For the 2035 horizon year analysis, the roadway network was updated to include the long-range capacity enhancing projects listed in Table 1. The 2035 Build scenario analyses assume full build out of the site as shown in Table No Build Conditions For 2035 No Build conditions, it is assumed that no development has occurred on the project site but that the other properties in the region have developed in accordance with the long range plan. It was also assumed that the following modifications to the roadway network would have been included with the long-range projects identified earlier: North SDDOT Driveway at Marion Road Add 62 nd Street North east of Marion Road Add Westbound left turn lane Add Westbound shared thru-right lane 60th Street North at Marion Road Add Northbound and Southbound through lane Page - 52
57 Add Northbound right turn lane Add Westbound right turn lane 62 nd Street North at Annika Avenue Complete 62 nd Street North between Marion Road and Annika Avenue Two-way stop controlled on North/South approaches Benson Road at Marion Road Add Northbound and Southbound through lane 60th Street North at La Mesa Drive Add Westbound through lane Add Westbound left turn lane 60th Street North at Career Avenue Add Southbound left turn lane Add Southbound right turn lane Add Southbound through lane Add Eastbound left turn lane A summary of all the improvements implemented are listed below and in Figure 14. Table 14 provides a summary of the results of the 2035 No Build analyses. Page - 53
58 Figure No Build Lane Geometry Page - 54
59 Table No Build for AM and PM Peak Hour LOS 2035 No Build AM 2035 No Build PM Approach Approach Intersection Control Operations EB WB NB SB Overall EB WB NB SB Overall Marion Rd at 60th St Signal Delay (sec/veh) LOS C C C B C C C C C C Annika Ave at 61st St Delay (sec/veh) LOS - A A A A - B A A A I-29 SB Ramp at 60th St Signal Delay (sec/veh) LOS A B D - B B B C - B I-29 NB Ramp at 60th St Signal Delay (sec/veh) LOS B B C - B A B E - C Le Mesa Dr at 60th St Delay (sec/veh) LOS A A B C A A A F F B Marion Rd at Benson Rd AWSC Delay (sec/veh) LOS B B F C E B D E F E Annika Ave at 60th St Delay (sec/veh) LOS A A B C A A A C F D I-90 South Ramp at Marion Delay (sec/veh) Rd LOS B - A A A F - A A A I-90 North Ramp at Marion Delay (sec/veh) Rd LOS C - A A B D - A A B Annika Ave at 62nd St Delay (sec/veh) LOS A A B A A A A B A A Career Ave at 60th St Delay (sec/veh) LOS A A F F F A A F F F Career Ave at Benson Rd Signal Delay (sec/veh) LOS A A D D B A A D D B Marion Rd at SDDOT Delay (sec/veh) North Driveway LOS B C A A A C D A A A Marion Rd at SDDOT Delay (sec/veh) South Driveway LOS B - A A A B - A A A The growth in background traffic results in poor operating conditions at many of the study area intersection, including: I-29 NB Ramp at 60th Street North La Mesa Drive at 60th Street North Marion Road at Benson Road Annika Avenue at 60th Street North I-90 South Ramp at Marion Road Career Avenue at 60th Street North Many of the unsignalized intersections are expected to operate at an unacceptable LOS with the projected growth in background traffic and would require signalization to operate acceptably. In addition to the installation of traffic signals at these intersections, some intersections may also require additional turn lanes, signal phasing modifications, and signal coordination to operate at Page - 55
60 an acceptable LOS. Queuing and Blocking With the projected growth in the background traffic, some queuing and blocking issues are expected to occur, as shown in Table 15. Generally, the PM peak hour is expected to experience increased queue lengths and some issues with blocking at the following intersections: Marion Road at 60th Street North o Northbound left turn queues will exceed the available storage during the PM peak hour. o Northbound through movement will block access to the left turn lane during the PM peak hour. I-29 Northbound Ramp at 60th Street North o Northbound through movement will block access to the left turn lane during the PM peak hour. I-90 South Ramp at Marion Road o Northbound through movement will block access to the left turn lane during the PM peak hour. Marion Road at Benson Road o Northbound through movement will block access to the left turn lane during the AM peak hour. Career Avenue at 60th Street North o Northbound through movement will block access to the left turn lane during the PM peak hour. o Southbound through movement will block access to the left turn lane during the PM peak hour. o Southbound through movement will block access to the right turn lane during the PM peak hour. Page - 56
61 Table No Build AM and PM Peak Hour Queue Lengths Intersection Marion Rd at 60th St 2035 No Build AM 95th Queue Length (ft) Adjacent Turn Lane Through Lane 2035 No Build PM 95th Queue Length (ft) Adjacent Turn Lane Through Lane Lanes (ft) EBL EBR WBL WBR NBL NBR SBL SBR EBR WBL NBL N/A NBR EBL NBL LeMesa Dr at 60th St WBL I-90 North Ramp at Marion Rd Marion Rd at SDDOT South Driveway Signal I-29 SB Ramp at 60th St Signal I-29 NB Ramp at 60th St Signal Marion Rd at Benson Rd Annika Ave at 60th St I-90 South Ramp at Marion Rd Career Ave at 60th St Career Ave at Benson Rd Marion Rd at SDDOT North Driveway Control AWSC NBL SBL EBL NBL EBL N/A EBR NBL SBR NBL Signal Exclusive Turn Storage Length* EBL WBL NBL N/A SBL SBR EBL WBL NBL NBR SBL EBL WBL NBL NBR SBL SBR EBR N/A Note: * Storage length includes 25 feet for storage that occurs in the taper. Page - 57
62 2035 No Build Conditions with Needed Improvements As seen with the 2035 No Build conditions capacity analysis, there is a need to provide additional improvements to accommodate the 2035 background traffic volumes. Therefore, a capacity analysis was conducted using the additional roadway improvements required to address the 2035 background traffic volumes. The following roadway improvements, also shown in Figure 15, were identified and included in the analysis to address the congestion identified by the 2035 No Build conditions: La Mesa Drive at 60th Street North o Signalized intersection o Provide permissive/protected phasing for westbound left Marion Road at Benson Road o Signalized intersection o Provide permissive/protected phasing for southbound left Annika Avenue at 60th Street North o Signalized intersection I-90 North Ramp at Marion Road o Added eastbound left turn lane I-90 South Ramp at Marion Road o Signalized intersection o Provide permissive/protected phasing for northbound left Career Avenue at 60th Street North o Signalized intersection o Provide permissive/protected phasing for eastbound and westbound lefts Page - 58
63 Figure No Build Lane Geometry with Needed Infrastructure Improvements Page - 59
64 The summary of the capacity analysis with the improvements listed above is shown in Table 16. Table No Build with Needed Improvements for AM and PM Peak Hour LOS 2035 No Build with Needed Improvements AM 2035 No Build with Needed Improvements PM Approach Approach Intersection Control Operations EB WB NB SB Overall EB WB NB SB Overall Marion Rd at 60th St Signal Delay (sec/veh) LOS C C C B C C C C C C Annika Ave at 61st St Delay (sec/veh) LOS - A A A A - B A A A I-29 SB Ramp at 60th St Signal Delay (sec/veh) LOS A B D - B B B D - C I-29 NB Ramp at 60th St Signal Delay (sec/veh) LOS B B C - B A B D - B Le Mesa Dr at 60th St Signal Delay (sec/veh) LOS B A C C B B A C C A Marion Rd at Benson Rd Signal Delay (sec/veh) LOS C C B A B B C B A B Annika Ave at 60th St Signal Delay (sec/veh) LOS A A C C A A A B C A I-90 South Ramp at Marion Delay (sec/veh) Signal Rd LOS C - A A A C - A B B I-90 North Ramp at Marion Delay (sec/veh) Rd LOS C - A A A B - A A A Annika Ave at 62nd St Delay (sec/veh) LOS A A B A A A A B A A Career Ave at 60th St Signal Delay (sec/veh) LOS A B B C B A C B B B Career Ave at Benson Rd Signal Delay (sec/veh) LOS A A C C B B B C D B Marion Rd at SDDOT Delay (sec/veh) Signal North Driveway LOS C C A A A B C A A A Marion Rd at SDDOT Delay (sec/veh) South Driveway LOS B - A A A B - A A A With the recommended infrastructure improvements discussed above, the roadway network is expected to operate at acceptable LOS. Queuing and Blocking The summary of the queuing analysis for the 2035 No Build with Needed Improvements is shown in Table 17. Page - 60
65 Table No Build with Needed Improvements AM and PM Peak Hour Queue Lengths Intersection Control Marion Rd at 60th St Signal I-29 SB Ramp at 60th St Signal I-29 NB Ramp at 60th St Signal Exclusive Turn Storage Length* 2035 No Build with Needed Improvements AM 95th Queue Length (ft) Adjacent Turn Lane Through Lane 2035 No Build with Needed Improvements PM 95th Queue Length (ft) Adjacent Turn Lane Through Lane Lanes (ft) EBL EBR WBL WBR NBL NBR SBL SBR EBR WBL NBL N/A NBR EBL NBL La Mesa Dr at 60th St Signal WBL Marion Rd at Benson Rd Annika Ave at 60th St I-90 South Ramp at Marion Rd I-90 North Ramp at Marion Rd Career Ave at 60th St Career Ave at Benson Rd Marion Rd at SDDOT North Driveway Marion Rd at SDDOT South Driveway Signal Signal Signal Signal Signal Signal NBL SBL EBL NBL EBL N/A EBR NBL SBR EBL N/A EBR NBL EBL WBL NBL N/A SBL SBR EBL WBL NBL NBR SBL EBL WBL NBL NBR SBL SBR EBR N/A Note: * Storage length includes 25 feet for storage that occurs in the taper. Page - 61
66 With the improvements to the 2035 No Build roadway network recommended above, the study area intersections are expected to operate without significant queuing and blocking issues. Although the southbound through lane traffic is anticipated to queue beyond the entrance to the left turn lane at Marion Road and Benson Road, this can be mitigated through signal timing adjustments since there is adequate capacity at this intersection Build Conditions with Needed Improvements The additional site traffic for the full build out was added to the No Build conditions with the needed infrastructure improvements discussed previously. Also included is a northbound left turn lane on Annika Avenue at 61 st Street North, to accommodate the vehicles turning into the site. The summary of the capacity analysis is shown in Table 18. Page - 62
67 Table Build for AM and PM Peak Hour with Needed Improvements LOS 2035 Build with Needed Improvements AM 2035 Build with Needed Improvements PM Approach Approach Intersection Control Operations EB WB NB SB Overall EB WB NB SB Overall Marion Rd at 60th St Signal Delay (sec/veh) LOS C C C B C C C C D C Annika Ave at 61st St Delay (sec/veh) LOS A B A A A C F A A B I-29 SB Ramp at 60th St Signal Delay (sec/veh) LOS A B D - B B B D - B I-29 NB Ramp at 60th St Signal Delay (sec/veh) LOS B B C - B A C D - C La Mesa Dr at 60th St Signal Delay (sec/veh) LOS B A C C B B A C C B Marion Rd at Benson Rd Signal Delay (sec/veh) LOS C C C A B B C C B B Annika Ave at 60th St Signal Delay (sec/veh) LOS A A C C A B C D C C I-90 South Ramp at Marion Delay (sec/veh) Signal Rd LOS C - A A A C - B B B I-90 North Ramp at Marion Delay (sec/veh) Rd LOS C - A A A C - A A A Annika Ave at 62nd St Delay (sec/veh) LOS A A A A A A A C A A Career Ave at 60th St Signal Delay (sec/veh) LOS B B B C B B C B C C Career Ave at Benson Rd Signal Delay (sec/veh) LOS A A D D B A A C D B Marion Rd at SDDOT Delay (sec/veh) Signal North Driveway LOS B C A A A C C C B C Marion Rd at SDDOT Delay (sec/veh) South Driveway LOS B - A A A B - A A A 62nd St at Walmart North Delay (sec/veh) Driveway LOS A A B - A A A F - D With the additional site traffic, all intersections are still expected to operate acceptably. Two approaches, westbound 61 st Street North at Annika Avenue and northbound on the Walmart North Driveway at 62 nd Street North appear to operate at LOS F based on HCM methodology. However, in the SimTraffic simulations, all of these movements are expected to operate with average delay of 25 seconds or less per vehicle so no additional improvements are recommended to address these delays. Queuing and Blocking With the projected growth in the background traffic, some queuing and blocking issues are expected to occur, as shown in Table 19. The blocking issues and recommendations are summarized below: Page - 63
68 Marion Road at Benson Road o Northbound through movement will block access to the left turn lane during the AM and PM peak hours. o The northbound left turn lane needs to be extended to provide 200 feet of storage (increase from 100 feet of storage). o Southbound left turn queues will exceed the available storage during the PM peak hour. o Southbound through movement will block access to the left turn lane during the PM peak hour. o The southbound left turn lane needs to be extended to provide 175 feet of storage (increase from 100 feet of storage). Annika Avenue at 60th Street North o Southbound left turn queues will exceed the available storage during the PM peak hour. o Southbound through movement will block access to the left turn lane during the PM peak hour. o The southbound left turn lane needs to be extended to provide 350 feet of storage (increase from 175 feet of storage). This is approximately the full length of the link between 60 th Street North and 61 st Street North. This length of storage cannot be provided without removing the turn lane for the northbound left turn on Annika Avenue at 61 st Street North, or providing a full length turn lane for both left turns. Based on this analysis, a full length southbound left turn lane and northbound left turn lane will be necessary on Annika Avenue between 60 th Street North and 61 st Street North to accommodate 2035 volumes. Page - 64
69 Table Build with Needed Improvements AM and PM Peak Hour Queue Lengths Intersection Marion Rd at 60th St 2035 Build with Needed Improvements AM 95th Queue Length (ft) Adjacent Through Turn Lane Lane 2035 Build with Needed Improvements PM 95th Queue Length (ft) Adjacent Through Lane Lanes (ft) Turn Lane EBL EBR WBL WBR NBL NBR SBL SBR Annika Ave at 61st St NBL EBR WBL I-29 SB Ramp at 60th St Signal NBL N/A NBR EBL I-29 NB Ramp at 60th St Signal NBL La Mesa Dr at 60th St Signal WBL Marion Rd at Benson Rd Annika Ave at 60th St I-90 South Ramp at Marion Rd I-90 North Ramp at Marion Rd Career Ave at 60th St Career Ave at Benson Rd Marion Rd at SDDOT North Driveway Control Signal Signal Signal Signal Signal Signal Signal Exclusive Turn Storage Length* NBL SBL EBL WBR NBL SBL EBL N/A EBR NBL SBR EBL N/A EBR NBL EBL WBL NBL N/A SBL SBR EBL WBL NBL NBR SBL EBL WBL NBL NBR SBL SBR Marion Rd at SDDOT EBR N/A South Driveway Note: * Storage length includes 25 feet for storage that occurs in the taper. Page - 65
70 4 ADDITIONAL SITE IMPACT CONSIDERATIONS The following sections address additional site impacts that the proposed site may have on the community. These items include site access, truck volumes and routing, crash history and traffic signal warrant analyses. 4.1 SITE ACCESS The proposed site plan for the Walmart store includes two access points. Both provide full access onto local roads Annika Avenue and 62 nd Street North which intersect at 60th Street North and Marion Road, respectively. This section will review the layout of these access points by using local design standards to determine if there are any potential conflicts with the proposed turn lanes th Street North and Annika Avenue The recommended westbound right-turn lane on 60th Street North at Annika Avenue, illustrated in Figure 16, is based on the results of the capacity and queue analysis. The turn lane shown in Figure 16 provides the necessary storage and taper lengths for opening day (2014) as well as 2035 based on the City of Sioux Falls Engineering Design Standards, with signal control at the intersection. Page - 66
71 Figure 16 Proposed 60 th Street NorthTurn Lanes Page - 67
72 4.2 MULTI-MODAL ACCESS Transit Currently, transit service does not serve the area, as illustrated in Figure 17.As the area around the proposed site continues to grow and development increases in density, consideration should be given to extending the Sioux Area Metro (SAM) transit service to the study area. Extending transit could help improve congestion on the arterial roadways in the future if transit can be provided to the area that successfully attracts ridership. Bicycles and Pedestrians With the site s proximity to the University Center, residential land uses, and industrial land uses, this area has great potential for bicycle and pedestrian use. The Sioux Falls MPO Bicycle Plan is shown in Figure 18. Currently, there are no bicycle trails in this area. The Sioux Falls MPO Bicycle Plan has designated the portion of 60th Street North in the study area as a future primary bicycle route. Primary routes are the best transportation bicycle route from one community to another. As shown in Figure 16, the westbound right turn lane is recommended to be constructed 16 feet wide so that in the future a 4-foot bike lane can be added. Pedestrian facilities in the area are also being upgraded with development and roadway projects in the area. Sidewalk was installed along both sides of Marion Road with the construction of the I-90 interchange and the City will program the installation of sidewalk along 60 th Street North between Marion Road and Career Avenue. Sidewalks will also be installed along the west side of Annika Avenue, both sides of 62 nd Street North, and through the site, to provide sidewalk connectivity for pedestrians. Page - 68

73 Source: Figure 17 Sioux Area Metro Fixed Route Service Page - 69
74 Sioux Falls Walmart ( ) Figure 18 Sioux Falls Bicycle Trails Page - 70
75 4.3 TRUCK VOLUMES The number of trucks generated by a Walmart store varies based on store performance and overall operations. Based on performance expectations for the proposed store, approximately 3-4 semi-trailer trucks and 5 vendor delivery trucks (typically smaller step vans and short tractor/trailers) are anticipated per day. Delivery times vary, with the majority of deliveries occurring throughout the day. These deliveries are not expected to impact traffic operations due to the small number of trucks these deliveries represent. Proposed access points are designed to accommodate entering and exiting truck traffic. Figure 19 and Figure 20 shows the proposed routing of trucks through the site. Page - 71


76 Figure 19 Proposed Truck Routing for South Dockock Page - 72

")


77 Sioux Falls Walmart ( ) Figure 20 Proposed Truck Routing for North Dock Page - 73
Traffic Impact Analysis Chatham County Grocery Chatham County, NC
 Chatham County Grocery Chatham County, NC TABLE OF CONTENTS 1. INTRODUCTION... 1 1.1. Location and Study Area... 1 1.2. Proposed Land Use and Access... 2 1.3. Adjacent Land Uses... 2 1.4. Existing ways...
Traffic Impact Study WestBranch Residential Development Davidson, NC March 2016
 Traffic Impact Study WestBranch Residential Development Davidson, NC March 216 TRAFFIC IMPACT STUDY FOR THE WestBranch Residential Development LOCATED IN DAVIDSON, NC Prepared For: Lennar Carolinas, LLC
5858 N COLLEGE, LLC N College Avenue Traffic Impact Study
 5858 N COLLEGE, LLC nue Traffic Impact Study August 22, 2016 Contents Traffic Impact Study Page Preparer Qualifications... 1 Introduction... 2 Existing Roadway Conditions... 5 Existing Traffic Conditions...
9 Leeming Drive Redevelopment Ottawa, ON Transportation Brief. Prepared By: Stantec Consulting Ltd.
 9 Leeming Drive Redevelopment Ottawa, ON Transportation Brief Prepared By: Stantec Consulting Ltd. TIA GUIDELINES CHECKLIST Report Context Municipal Address Comment: Section 1.1 Location relative to major
Henderson Avenue Mixed-Use Development
 Zoning Case: Z145-3 Traffic Impact Analysis Henderson Avenue Mixed-Use Development Dallas, TX October 26 th, 216 Kimley-Horn and Associates, Inc. Dallas, Texas Project #644827 Registered Firm F-928 Traffic
REDEVELOPMENT TRAFFIC IMPACT STUDY
 REDEVELOPMENT TRAFFIC IMPACT STUDY For Wendy s Parker, Colorado January 215 Prepared for: Sterling Design Associates, LLC 29 W. Littleton Boulevard #3 Littleton, Colorado 812 Prepared by: 1233 Airport
6060 North Central Expressway Mixed-Use Site Dallas, Texas
 Volume 1 Traffic Impact Analysis 6060 North Central Expressway Mixed-Use Site Dallas, Texas April 30, 2018 Kimley-Horn and Associates, Inc. Dallas, Texas Project #063238300 Registered Firm F-928 Traffic
Traffic Impact Analysis Walton Acres at Riverwood Athletic Club Clayton, NC
 Traffic Impact Analysis Walton Acres at Riverwood Athletic Club Clayton, NC 1. TABLE OF CONTENTS INTRODUCTION...1 1.1. Site Location and Study Area...1 1.2. Proposed Land Use and Site Access...2 1.3.
EXECUTIVE SUMMARY. Page 1 of 6
 EXECUTIVE SUMMARY The purpose of this report is to identify conformance with the original traffic impact study for the proposed retail development on Lot 5 of Riverdale Retail Filing No. 1 located on the
Traffic Impact Study Little Egypt Road Development Denver, North Carolina June 2017
 Traffic Impact Study Little Egypt Road Development Denver, North arolina June 2017 N. Little Egypt Road DQ\ QDQFLQJ VDOHV RU RWKHU SHUIRUPDQFH EDVHG FULWHULD Proposed Site Driveways Site Driveway 1 TRAFFI
TRAFFIC STUDY GUIDELINES Clarksville Street Department
 TRAFFIC STUDY GUIDELINES Clarksville Street Department 9/1/2009 Introduction Traffic studies are used to help the city determine potential impacts to the operation of the surrounding roadway network. Two
Shockoe Bottom Preliminary Traffic and Parking Analysis
 Shockoe Bottom Preliminary Traffic and Parking Analysis Richmond, Virginia August 14, 2013 Prepared For City of Richmond Department of Public Works Prepared By 1001 Boulders Pkwy Suite 300, Richmond, VA
TRAFFIC IMPACT ANALYSIS
 TRAFFIC IMPACT ANALYSIS FOR THE CHAMPAIGN UNIT#4 SCHOOL DISTRICT PROPOSED HIGH SCHOOL (SPALDING PARK SITE) IN THE CITY OF CHAMPAIGN Final Report Champaign Urbana Urbanized Area Transportation Study 6/24/2014
Traffic Circulation Study for Neighborhood Southwest of Mockingbird Lane and Airline Road, Highland Park, Texas
 ARIZONA TEXAS NEW MEXICO OKLAHOMA February 13, 2015 Mr. Meran Dadgostar P.E., R.S. Town of Highland Park 4700 Drexel Dr. Highland Park, Texas 75205 Re: Traffic Circulation Study for Neighborhood Southwest
Chapter 4 Traffic Analysis
 Chapter 4 Traffic Analysis PURPOSE The traffic analysis component of the K-68 Corridor Management Plan incorporates information on the existing transportation network, such as traffic volumes and intersection
Technical Memorandum TRAFFIC IMPACT STUDY. RIDLEY ROAD CONVENIENCE STORE Southampton County, VA. Prepared for: Mr. David Williams.
 Technical Memorandum TRFFIC IMPCT STUDY RIDLEY ROD CONVENIENCE STORE Southampton County, V Prepared for: Mr. David Williams By: Charles Smith, P.E., PTOE EPR Charlottesville, V July 2014 1 TBLE OF CONTENTS
THIS PAGE LEFT BLANK INTENTIONALLY
 GA SR 25 Spur at Canal Road Transportation Impact Analysis PREPARED FOR GLYNN COUNTY, GEORGIA 1725 Reynolds Street, Suite 300 Brunswick, Georgia 31520 PREPARED BY 217 Arrowhead Boulevard Suite 26 Jonesboro,
NO BUILD TRAFFIC OPERATIONS
 3. 23 NO BUILD TRAFFIC OPERATIONS This section addresses the operations of the transportation system and details how it would be expected to function under year 23 No Build conditions with the projected
TRANSPORTATION ANALYSIS REPORT US Route 6 Huron, Erie County, Ohio
 TRANSPORTATION ANALYSIS REPORT US Route 6 Huron, Erie County, Ohio December 12, 2012 Prepared for: The City of Huron 417 Main Huron, OH 44839 Providing Practical Experience Technical Excellence and Client
Bistro 6. City of Barrie. Traffic Impact Study for Pratt Hansen Group Inc. Type of Document: Final Report. Project Number: JDE 1748
 City of Barrie Traffic Impact Study for Pratt Hansen Group Inc. Type of Document: Final Report Project Number: JDE 1748 Date Submitted: June 12 th, 2017 06/12/17 John Northcote, P.Eng. Professional License
Highway 111 Corridor Study
 Highway 111 Corridor Study June, 2009 LINCOLN CO. HWY 111 CORRIDOR STUDY Draft Study Tea, South Dakota Prepared for City of Tea Sioux Falls Metropolitan Planning Organization Prepared by HDR Engineering,
Subject: Solberg Avenue / I-229 Grade Separation: Traffic Analysis
 MEMORANDUM Transportation Bill Troe, AICP Jason Carbee, AICP 12120 Shamrock Plaza Suite 300 Omaha, NE 68154 (402) 334-8181 (402) 334-1984 (Fax) To: Project File Date: Subject: Solberg Avenue / I-229 Grade
TRAFFIC IMPACT STUDY COMPREHENSIVE UPDATE TOWN OF THOMPSON S STATION, TENNESSEE PREPARED FOR: THE TOWN OF THOMPSON S STATION
 TRAFFIC IMPACT STUDY COMPREHENSIVE UPDATE TOWN OF THOMPSON S STATION, TENNESSEE PREPARED FOR: THE TOWN OF THOMPSON S STATION Transportation Consultants, LLC 1101 17 TH AVENUE SOUTH NASHVILLE, TN 37212
List of Attachments. Location Map... Site Plan... City of Lake Elsinore Circulation Element... City of Lake Elsinore Roadway Cross-Sections...
 List of Attachments Exhibits Location Map... Site Plan... City of Lake Elsinore Circulation Element... City of Lake Elsinore Roadway Cross-Sections... Existing Lane Geometry and Traffic Controls... Existing
DRAFT Davidson Elementary School Expansion Transportation Impact Analysis
 DRAFT Davidson Elementary School Expansion Transportation Impact Analysis Prepared for: Town of Davidson 216 S. Main Street Davidson, NC 28036 Prepared by: Stantec Consulting Services Inc. 2127 Ayrsley
Volume 1 Traffic Impact Analysis. Texas Odyssey TIA Dallas, Texas. Kimley-Horn and Associates, Inc. Dallas, Texas. May 23, 2018
 Volume 1 Traffic Impact Analysis Texas Odyssey TIA Dallas, Texas May 23, 2018 Kimley-Horn and Associates, Inc. Dallas, Texas Project #064529800 Registered Firm F-928 Traffic Impact Analysis Texas Odyssey
Abrams Associates. Transportation Impact Analysis. City of Rocklin. Prepared for: David Mohlenbrok City of Rocklin 4081 Alvis Court Rocklin, CA 95677
 Transportation Impact Analysis Sierra College Boulevard Commercial Project City of Rocklin Prepared for: David Mohlenbrok City of Rocklin 081 Alvis Court Rocklin, CA 95677 Prepared by: 1875 Olympic Boulevard,
FINAL Albertville Business Park AUAR Update Traffic Study
 FINAL Albertville Business Park AUAR Update Traffic Study Prepared for City of Albertville, MN July 20, 2017 SRF No. 10060.00 Table of Contents Introduction... 1 Existing Conditions... 1 Data Collection...
Traffic Impact Statement
 Traffic Impact Statement Mixed Use Development, US 41 and Old Trail Drive aka Tide-Starbucks 4900 9 th Street North General Development Site Plan (GDSP) Collier County, FL 10/6/2015 Prepared for: Prepared
PRELIMINARY DRAFT WADDLE ROAD / I-99 INTERCHANGE PROJECT ALTERNATIVE ANALYSIS FINAL TRAFFIC SUMMARY REPORT
 PRELIMINARY DRAFT WADDLE ROAD / I-99 INTERCHANGE PROJECT ALTERNATIVE ANALYSIS FINAL TRAFFIC SUMMARY REPORT Prepared by: In Association with: November 2013 EXECUTIVE SUMMARY Patton Township, in partnership
Waterford Lakes Small Area Study
 Waterford Lakes Small Area Study Existing Traffic Conditions PREPARED FOR: ORANGE COUNTY PUBLIC WORKS DEPARTMENT TRAFFIC ENGINEERING DIVISION ORLANDO, FLORIDA PREPARED WITH: INWOOD CONSULTING ENGINEERS
Traffic Impact Study. Westlake Elementary School Westlake, Ohio. TMS Engineers, Inc. June 5, 2017
 TMS Engineers, Inc. Traffic Impact Study Westlake Elementary School Westlake, Ohio June 5, 2017 Prepared for: Westlake City Schools - Board of Education 27200 Hilliard Boulevard Westlake, OH 44145 TRAFFIC
Transportation Impact Study for Abington Terrace
 Transportation Impact Study for Abington Terrace Abington Township, Montgomery County, PA Sandy A. Koza, P.E., PTOE PA PE License Number PE059911 Prepared by McMahon Associates, Inc. 425 Commerce Drive,
FRONT RANGE CROSSINGS TRAFFIC IMPACT STUDY
 FRONT RANGE CROSSINGS TRAFFIC IMPACT STUDY Prepared for: City of Thornton And Colorado Department of Transportation Prepared by: 11 Blake Street, Suite 2 Denver, Colorado 822 Contact: Brian Bern, PE, PTOE
APPENDIXB. Traffic Operations Technical Memorandum
 APPENDIXB Traffic Operations Technical Memorandum Environmental Assessment - Lincoln County, SD 85 th Street: Sundowner Avenue to Louise Avenue November 2017 MEMORANDUM Transportation Jim Kollbaum, PE
TRAFFIC IMPACT STUDY And A TRAFFIC SIGNAL WARRANT ANALYSIS FOR A SENIOR LIVING AND APARTMENT DEVELOPMENT
 TRAFFIC IMPACT STUDY And A TRAFFIC SIGNAL WARRANT ANALYSIS FOR A SENIOR LIVING AND APARTMENT DEVELOPMENT DEERFIELD TOWNSHIP, WARREN COUNTY, OHIO Nantucket Circle and Montgomery Road () Prepared for: ODLE
Glenn Avenue Corridor Traffic Operational Evaluation
 Glenn Avenue Corridor Traffic Operational Evaluation PREPARED FOR: THE CITY OF AUBURN PREPARED BY: DECEMBER 2007 Glenn Avenue Corridor Study--Auburn, Alabama TABLE OF CONTENTS Introduction... 1 Background
Donahue Drive Corridor Traffic Operational Evaluation
 Donahue Drive Corridor Traffic Operational Evaluation PREPARED FOR: THE CITY OF AUBURN PREPARED BY: JANUARY 2007 Donahue Drive Corridor Study--Auburn, Alabama TABLE OF CONTENTS Introduction... 1 Background
Draft Report. Traffic Impact Study. Superstore, Wal-Mart, and Kent Development. Yarmouth, Nova Scotia. Prepared for
 oad & Traffic Management Road & Traffic Management R Atlantic Traffic Engineering Specialists Draft Report Traffic Impact Study Superstore, Wal-Mart, and Kent Development Yarmouth, Nova Scotia Prepared
Project Report. South Kirkwood Road Traffic Study. Meadows Place, TX October 9, 2015
 Meadows Place, TX October 9, 2015 Contents 1 Introduction... 1 2 Data Collection... 1 3 Existing Roadway Network... 2 4 Traffic Volume Development... 2 5 Warrant Analysis... 3 6 Traffic Control Alternative
ALLEY 24 TRAFFIC STUDY
 ALLEY 24 TRAFFIC STUDY in City of Frostburg, Maryland January 2013 3566 Teays Valley Road Hurricane, WV Office: (304) 397-5508 www.denniscorporation.com Alley 24 Traffic Study January 2013 Frostburg, Maryland
Place Vanier 250 Montreal Road Transportation Impact Study Addendum. Prepared for Broccolini Construction September 20 th, 2012
 Update for the May 31 st, 2012 Traffic Impact Study Prepared for Broccolini Construction 111-23596-00 September 20 th, 2012 2611 Queensview Drive, Suite 300, Ottawa, Ontario CANADA K2B 8K2 Telephone: 613-829-2800
March 11, Lynnfield Board of Selectmen Town of Lynnfield 55 Summer Street Lynnfield, MA Walnut Street Traffic Assessment
 March 11, 2015 Lynnfield Board of Selectmen Town of Lynnfield 55 Summer Street Lynnfield, MA 01940 Re: Walnut Street Traffic Assessment Dear Board of Selectmen Members: As requested, BETA Group, Inc. (BETA)
Road Conversion Study Plumas Street
 Plumas Street Phase I Submitted to The Regional Transportation Commission of Washoe County Submitted by Zong Tian, Ph.D., P.E. Saeedeh Farivar Haiyuan Li, Ph.D. Center for Advanced Transportation Education
The proposed development is located within 800m of an existing Transit Station where infill developments and intensification are encouraged.
 Stantec Consulting Ltd. 1331 Clyde Avenue, Suite 4 Ottawa ON K2C 3G4 Tel: (613) 722-442 Fax: (613) 722-2799 May 14, 213 File: 1638823 Robinson Park Development Corp. 5699 Power Road Ottawa, ON, K1G 3N4
TRAFFIC IMPACT STUDY CRITERIA
 Chapter 6 - TRAFFIC IMPACT STUDY CRITERIA 6.1 GENERAL PROVISIONS 6.1.1. Purpose: The purpose of this document is to outline a standard format for preparing a traffic impact study in the City of Steamboat
TRAFFIC OPERATIONS ANALYSIS REPORT. Pacheco Boulevard Alignment Study and Alternatives Analysis
 TRAFFIC OPERATIONS ANALYSIS REPORT Pacheco Boulevard Alignment Study and Alternatives Analysis PREPARED FOR: CITY OF MARTINEZ AND CONTRA COSTA COUNTY OCTOBER 2016 FINAL REPORT Prepared By: under contract
OFFICE/RETAIL DEVELOPMENT 1625 BANK STREET OTTAWA, ONTARIO TRANSPORTATION BRIEF. Prepared for: Canada Inc.
 OFFICE/RETAIL DEVELOPMENT 1625 BANK STREET OTTAWA, ONTARIO TRANSPORTATION BRIEF Prepared for: 9402209 Canada Inc. December 15, 2015 115-625 Report_2.doc D. J. Halpenny & Associates Ltd. Consulting Transportation
Traffic Impact Study. Crestline Piggly Wiggly Mountain Brook, Alabama. Goodwyn, Mills and Cawood, Inc. Birmingham, Alabama.
 Traffic Impact Study Crestline Piggly Wiggly Mountain Brook, Alabama Prepared for: Goodwyn, Mills and Cawood, Inc. Birmingham, Alabama September 214 Revision 1 October 214 Crestline Piggly Wiggly Mountain
OTTAWA TRAIN YARDS PHASE 3 DEVELOPMENT CITY OF OTTAWA TRANSPORTATION IMPACT STUDY. Prepared for:
 OTTAWA TRAIN YARDS PHASE 3 DEVELOPMENT CITY OF OTTAWA TRANSPORTATION IMPACT STUDY Prepared for: The Ottawa Train Yards Inc. 223 Colonnade Road South, Suite 212 Nepean, Ontario K2E 7K3 January 17, 2012
Grant Avenue Streetscape
 REPORT TYPE GOES HERE Grant Avenue Streetscape PREPARED FOR City of Manassas 9027 Center Street Manassas, VA 20110 PREPARED BY 8300 Boone Boulevard Suite 700 Vienna, Virginia 22182 571.389.8121 July 31,
TRANSPORTATION IMPACT STUDY PROPOSED RIVERFRONT 47 MIXED USE DEVELOPMENT
 November 2016 TRANSPORTATION IMPACT STUDY PROPOSED RIVERFRONT 47 MIXED USE DEVELOPMENT & Aspinwall Borough, Sharpsburg Borough & O Hara Township, Allegheny County, Pennsylvania Prepared for: Riverfront
METHODOLOGY. Signalized Intersection Average Control Delay (sec/veh)
") Chapter 5 Traffic Analysis 5.1 SUMMARY US /West 6 th Street assumes a unique role in the Lawrence Douglas County transportation system. This principal arterial street currently conveys commuter traffic
Chapter 5 Traffic Analysis 5.1 SUMMARY US /West 6 th Street assumes a unique role in the Lawrence Douglas County transportation system. This principal arterial street currently conveys commuter traffic
MEMO DRAFT VIA . Mr. Terry Bailey Foremost Development Company. To: Michael J. Labadie, PE Steven J. Russo, E.I.T. Fleis & VandenBrink.
 MEMO DRAFT VIA EMAIL To: From: Mr. Terry Bailey Foremost Development Company Michael J. Labadie, PE Steven J. Russo, E.I.T. Fleis & VandenBrink Date: August 29, 214 Re: Proposed Apartments City of Walled
TRAFFIC IMPACT STUDY. Creekside Thornton, Colorado. For. August 2015 November 2015 Revised: August Prepared for:
 TRAFFIC IMPACT STUDY For Creekside Thornton, Colorado August 215 November 215 Revised: August 216 Prepared for: Jansen Strawn Consulting Engineers 45 West 2 nd Avenue Denver, Colorado 8223 Prepared by:
Table of Contents FIGURES TABLES APPENDICES. Traffic Impact Study Hudson Street Parking Garage MC Project No.: A Table of Contents
 Traffic Impact Study Hudson Street Parking Garage MC Project No.: 151714A Table of Contents Table of Contents I. INTRODUCTION... 2 II. EXISTING CONDITIONS... 5 III. 215 EXISTING TRAFFIC CONDITIONS... 6
FINAL DESIGN TRAFFIC TECHNICAL MEMORANDUM
 FINAL DESIGN TRAFFIC TECHNICAL MEMORANDUM July 2014 FINAL (SR 43) Project Development and Environment Study From State Road 60 (Adamo Drive) to I-4 (SR 400) Hillsborough County, Florida Work Program Item
DUNBOW ROAD FUNCTIONAL PLANNING
 DUNBOW ROAD FUNCTIONAL PLANNING Final Report August 3, 216 #31, 316 5th Avenue NE Calgary, AB T2A 6K4 Phone: 43.273.91 Fax: 43.273.344 wattconsultinggroup.com Dunbow Road Functional Planning Final Report
Harrah s Station Square Casino
 Transportation Analysis Harrah s Station Square Casino Pittsburgh, Pennsylvania Submitted To: City of Pittsburgh and Pennsylvania Gaming Control Board Prepared By: DKS Associates GAI Consultants December
Highway 49, Highway 351 and Highway 91 Improvements Feasibility Study Craighead County
 Highway 49, Highway 351 and Highway 91 Improvements Feasibility Study Craighead County Executive Summary March 2015 Highway 49, Highway 351 and Highway 91 Improvements Feasibility Study Craighead County
Gateway Transportation Study
 Gateway Transportation Study Amherst, Massachusetts SUBMITTED TO University of Massachusetts Amherst Town of Amherst SUBMITTED BY Vanasse Hangen Brustlin, Inc. Watertown, Massachusetts March 213 Back of
Troutbeck Farm Development
 Troutbeck Farm Development Willistown Township, Chester County PA For Submission To: Willistown Township Last Revised: October, 4 TPD# INLM.A. 5 E. High Street Suite 65 Pottstown, PA 9464 6.36.3 TPD@TrafficPD.com
City of Wayzata Comprehensive Plan 2030 Transportation Chapter: Appendix A
 A1. Functional Classification Table A-1 illustrates the Metropolitan Council s detailed criteria established for the functional classification of roadways within the Twin Cities Metropolitan Area. Table
PINESTONE TRAFFIC IMPACT STUDY Travelers Rest, South Carolina
 PINESTONE TRAFFIC IMPACT STUDY Travelers Rest, South Carolina Prepared for Longbranch Development Prepared by January 13, 219 ii Table of Contents Subject Page Signature Page... i Table of Contents...
Traffic Impact Study. Roderick Place Columbia Pike Thompson s Station, TN. Transportation Group, LLC Traffic Engineering and Planning
 F i s c h b a c h Transportation Group, LLC Traffic Engineering and Planning Traffic Impact Study Roderick Place Columbia Pike Thompson s Station, TN Prepared March 2016 Ms. Gillian L. Fischbach, P.E.,
NEW YORK CENTRAL PARK SUBDIVISION BLAIS STREET/ST-PIERRE STREET EMBRUN, ONTARIO TRAFFIC IMPACT STUDY. Prepared for:
 NEW YORK CENTRAL PARK SUBDIVISION BLAIS STREET/ST-PIERRE STREET EMBRUN, ONTARIO TRAFFIC IMPACT STUDY Prepared for: Solidex Holdings Limited & Investissement Maurice Lemieux Investments Attn: Mr. Anthony
Appendix B: Forecasting and Traffic Operations Analysis Framework Document
 Existing Conditions Report - Appendix Appendix B: Forecasting and Traffic Operations Analysis Framework Document This document defines the methodology and assumptions that will be used in the traffic forecasting
CarMax Auto Superstore/ Reconditioning Center #6002 Murrieta, California
 CarMax Auto Superstore/ Reconditioning Center #6002 Murrieta, California TUSTIN 17782 17th Street Suite 200 Tustin, CA 92780-1947 714.665.4500 Fax: 714.665.4501 LOS ANGELES 145 S. Spring Street Suite 120
Marina Loft (DRC 51-R-12)
") Marina Loft (DRC 51-R-12) traffic study prepared for: Cymbal Development OCtober 2012 Traf Tech October 1, 2012 Mr. Asi Cymbal - President Cymbal Development 3470 North Miami Avenue Upper Suite Miami,
Marina Loft (DRC 51-R-12) traffic study prepared for: Cymbal Development OCtober 2012 Traf Tech October 1, 2012 Mr. Asi Cymbal - President Cymbal Development 3470 North Miami Avenue Upper Suite Miami,
TABLE TRAFFIC ANALYSIS SCENARIOS
 4.11 TRANSPORTATION The potential traffic impacts of the proposed project are evaluated in the Buena Park Beach/Orangethorpe Mixed Use Project Traffic Analysis (Traffic Analysis) by Austin-Foust Associates
Student Housing Development
 Traffic Impact Study for the proposed Student Housing Development City of Oneonta Otsego County, New York Project No. 3259 December 212 Revised February 13, 212 Prepared For: Newman Development Group,
Traffic Impact Analysis (TIA) Process and Procedures Manual. September 2017
 Process and Procedures Manual. September 2017") Traffic Impact Analysis (TIA) Process and Procedures Manual Post Office Box 664 101 Huntersville-Concord Road Huntersville, NC 28070 Phone 704-766-2220 Fax 704-992-5528 www.huntersville.org (c) 2017, Town
Traffic Impact Analysis (TIA) Process and Procedures Manual Post Office Box 664 101 Huntersville-Concord Road Huntersville, NC 28070 Phone 704-766-2220 Fax 704-992-5528 www.huntersville.org (c) 2017, Town
Appendices. Appendix J: Traffic Study
 Appendices Appendix J: Traffic Study The Platinum Triangle Subsequent EIR The Planning Center Appendices This page intentionally left blank. The Platinum Triangle Subsequent EIR The Planning Center TRAFFIC
Traffic Study of Fuller Street, Cady Street, West Street and West Avenue. Final Report
 Traffic Study of Fuller Street, Cady Street, West Street and West Avenue Final Report July 2005 Prepared for: Town of Ludlow Prepared by: Pioneer Valley Planning Commission 26 Central Street West Springfield,
James M. Moore, Director of Planning & Building Services, Town of Fairfax. Victory Village Senior Housing Development Traffic Study
 Traffic Study To: From: James M. Moore, Director of Planning & Building Services, Town of Fairfax David Parisi, PE, TE, Parisi Transportation Consulting Date: October 14, 216 Subject: Victory Village Senior
Evaluation of M-99 (Broad Street) Road Diet and Intersection Operational Investigation
 Road Diet and Intersection Operational Investigation") Evaluation of M-99 (Broad Street) Road Diet and Intersection Operational Investigation City of Hillsdale, Hillsdale County, Michigan June 16, 2016 Final Report Prepared for City of Hillsdale 97 North Broad
Evaluation of M-99 (Broad Street) Road Diet and Intersection Operational Investigation City of Hillsdale, Hillsdale County, Michigan June 16, 2016 Final Report Prepared for City of Hillsdale 97 North Broad
Atlanta Braves Stadium and Mixed- Use Development
 Transportation Analysis Atlanta Braves Stadium and Mixed- Use Development DRI #2381 Cobb County, Georgia Prepared for: BRED Co., LLC Prepared by: Kimley-Horn and Associates, Inc. 817 West Peachtree Street
TRAFFIC ASSESSMENT River Edge Colorado
 TRAFFIC ASSESSMENT River Edge Colorado Submitted by: Fehr & Peers 621 17th Street, Ste. 231 Denver, CO 8293 (33) 296-43 December, 21 App. M-2 Traffic Assessment River Edge Colorado December 21 TABLE OF
DIMARCO CANANDAIGUA PROPERTIES HOUSING PROJECT CANANDAIGUA, ONTARIO COUNTY, NEW YORK
 TRAFFIC IMPACT STUDY FOR THE DIMARCO CANANDAIGUA PROPERTIES HOUSING PROJECT CANANDAIGUA, ONTARIO COUNTY, NEW YORK MARCH 14, 2017 PREPARED FOR: 1950 Brighton Henrietta Town Line Rd Rochester, NY 14623 PREPARED
MEMORANDUM. Our project study area included the following locations:
 MEMORANDUM Date: To: From: Subject: Najib O. Habesch Nick M. Fomenko, PE, PTOE Bushnell Park North Traffic Assessment BETA Project #: 4461 As part of our contract to undertake the design of the Bushnell
STILLWATER AVENUE CORRIDOR STUDY Old Town, Maine
 Draft Study STILLWATER AVENUE CORRIDOR STUDY Old Town, Maine SUBMITTED TO: BANGOR AREA COMPREHENSIVE TRANSPORTATION SYSTEM SUBMITTED BY: I MAY 23, 2017 DRAFT STILLWATER AVENUE STUDY FINAL REPORT Table
MEMORANDUM. Matt Folden, AICP, MNCPPC Rebecca Torma, MCDOT. Nancy Randall, AICP, PTP Barbara Mosier, P.E., PTOE Kevin Berger
 To: From: Matt Folden, AICP, MNCPPC Rebecca Torma, MCDOT Nancy Randall, AICP, PTP Barbara Mosier, P.E., PTOE Kevin Berger 1110 Bonifant Street Suite 210, Silver Spring, MD 20910 301-448-1333 WellsandAssociates.com
VIVA RETIREMENT COMMUNITIES OAKVILLE TRAFFIC IMPACT STUDY
 VIVA RETIREMENT COMMUNITIES OAKVILLE TRAFFIC IMPACT STUDY VIVA RETIREMENT COMMUNITIES OAKVILLE TRAFFIC IMPACT STUDY DECEMBER 2012 READ, VOORHEES & ASSOCIATES TORONTO, ONTARIO Read, Voorhees & Associates
Traffic Impact and Access Study PROPOSED DURKEE FARM ESTATES. Foster Street Littleton, Massachusetts. Prepared for: Grimes Road, LLC.
 Traffic Impact and Access Study PROPOSED DURKEE FARM ESTATES Foster Street Littleton, Massachusetts Prepared for: Grimes Road, LLC. Westford, MA Prepared by: MDM Transportation Consultants, Inc. 28 Lord
FORM A PASCO COUNTY ACCESS CONNECTION PERMIT APPLICATION
 FORM 901.3.A PASCO COUNTY ACCESS CONNECTION PERMIT APPLICATION The following information is required from all applicants directly or indirectly accessing any collector or arterial road or as otherwise
T$- RIB Endineering, ac
 T$- RIB Endineering, ac..' Transportation Endineerimg Solutions Transportation Impact Study Vineyard-Goldelm Fort Collins, Colorado February 2016 Vineyard-Goldelm Transportation Impact Study Fort Collins,
DRAFT. Corridor study. Honeysuckle Road. October Prepared for the City of Dothan, AL. Prepared by Gresham, Smith and Partners
 DRAFT Corridor study Honeysuckle Road October 2017 Prepared for the City of Dothan, AL Prepared by TABLE OF CONTENTS SECTION I... 1 STUDY SUMMARY... 1 INTRODUCTION... 1 CONCLUSIONS... 5 SECTION II... 7
FAIRFIELD - RYAN S CORNER TRAFFIC IMPACT ANALYSIS LOUDOUN COUNTY, VIRGINIA
 FAIRFIELD - RYAN S CORNER TRAFFIC IMPACT ANALYSIS LOUDOUN COUNTY, VIRGINIA Submitted on behalf of: Fairfield Residential Prepared by: Wells + Associates, Inc. 1420 Spring Hill Road, Suite 00 McLean, Virginia
#!! "$% ##! &! # '#! % $ #!
 Executive Summary US Highway 16 (US 16) is the primary corridor connecting Rapid City to the Black Hills region. It serves a growing population of commercial and residential traffic, as well as seasonal
Traffic Impact Study for Rolling Ridge Redevelopment
 Traffic Impact Study for Rolling Ridge Redevelopment Webster Groves, Missouri October 19, 2018 Prepared For: Gershman Commercial Real Estate 150 North Meramec Avenue Suite 500 St. Louis, Missouri 63105
List of Exhibits...ii
 One Brickell Traffic Study TABLE OF CONTENTS List of Exhibits...ii EXECUTIVE SUMMARY...1 1. INTRODUCTION...2 1.1 Study Area...2 1.2 Study Objective...5 2. EXISTING TRAFFIC CONDITIONS...6 2.1 Data Collection...6
Traffic Study North Shore School District 112
 Traffic Study North Shore School District 112 Proposed Expansion of Northwood Junior High School Prepared By: May 1, 2015 1. Introduction Kenig, Lindgren, O Hara, Aboona, Inc. (KLOA, Inc.) has been retained
TABLE OF CONTENTS TABLE OF CONTENTS... I APPENDICES... III LIST OF EXHIBITS... V LIST OF TABLES... VII LIST OF ABBREVIATED TERMS...
 TABLE OF CONTENTS TABLE OF CONTENTS... I APPENDICES... III LIST OF EXHIBITS... V LIST OF TABLES... VII LIST OF ABBREVIATED TERMS... IX 1 INTRODUCTION... 1 1.1 Project Overview... 1 1.2 Analysis Scenarios...
February 24, 2017 Project #: 20076
 February 24, 217 Project #: 276 Jinde Zhu Washington County Department of Land Use and Transportation 14 SW Walnut Street MS 17 Hillsboro, Oregon 97213 RE: Sunset Ridge Phase 2 Access Report and Zone Change
D.13 Transportation and Traffic
 This section addresses transportation and traffic issues and impacts related to the Proposed Project. Section D.13.1 provides a description of the affected environment for the Proposed Project. Applicable
ENKA INTERMEDIATE SCHOOL
 TRANSPORTATION IMPACT ANALYSIS Prepared for Buncombe County Schools ENKA INTERMEDIATE SCHOOL Asheville, NC Project Number: 13-71 8/1/13 www.davenportworld.com DAVENlORT Transportation Impact Analysis Enka
1609 E. FRANKLIN STREET HOTEL TRAFFIC IMPACT STUDY EXECUTIVE SUMMARY
 1609 E. FRANKLIN STREET HOTEL TRAFFIC IMPACT STUDY EXECUTIVE SUMMARY Prepared for: The Town of Chapel Hill Public Works Department Traffic Engineering Division Prepared by: HNTB North Carolina, PC 343
Northwest Corridor Project Interchange Modification, Interchange Justification and System Analysis Report Reassessment (Phase I)
") Northwest Corridor Project Interchange Modification, Interchange Justification and System Analysis Report Reassessment (Phase I) Introduction The Georgia Department of Transportation (GDOT) prepared a
Northwest Corridor Project Interchange Modification, Interchange Justification and System Analysis Report Reassessment (Phase I) Introduction The Georgia Department of Transportation (GDOT) prepared a
Clay Street Realignment Project Traffic Study
 Final Clay Street Realignment Project Traffic Study November 24, 2009 Prepared for: City of Placerville RS07-2466 2990 Lava Ridge Court, Suite 200 Roseville, CA 95661 (916) 773-1900 Fax (916) 773-2015
CITY OF OAKLAND. 27th Street Bikeway Feasibility and Design. Final Report (v3) March 23, Kimley-Horn and Associates, Inc.
 March 23, Kimley-Horn and Associates, Inc.") CITY OF OAKLAND 27th Street Bikeway Feasibility and Design Final Report (v3) March 23, 2007 PREPARED BY: Kimley-Horn and Associates, Inc. Table of Contents 1. Introduction 3 2. 27 th Street/Bay Place Corridor
CITY OF OAKLAND 27th Street Bikeway Feasibility and Design Final Report (v3) March 23, 2007 PREPARED BY: Kimley-Horn and Associates, Inc. Table of Contents 1. Introduction 3 2. 27 th Street/Bay Place Corridor