Exploring the relationship between Strava cyclists and all cyclists*.
|
|
|
- Isabel Chandler
- 5 years ago
- Views:
Transcription

1 Exploring the relationship between Strava cyclists and all cyclists*. Dr. David McArthur, Dr. Jinhyun Hong, Dr. Mark Livingston, Kirstie English *This presentation contains preliminary results which are subject to change. Please do not cite.

2 Active travel Walking and cycling can generate large benefits Reduced congestion Reduced emissions Improve health Time savings Transport Scotland wants 10% of journeys to be made by bicycle by 2020; with cities responsible for achieving this

3 Do interventions work? Evaluating the effectiveness of interventions is difficult due to the lack of data Manual counts take place on specific links/points, but these are expensive and hence infrequent Automatic counters can be used but these are also expensive and tend to be sparsely located Maintenance and calibration is required to keep them working properly
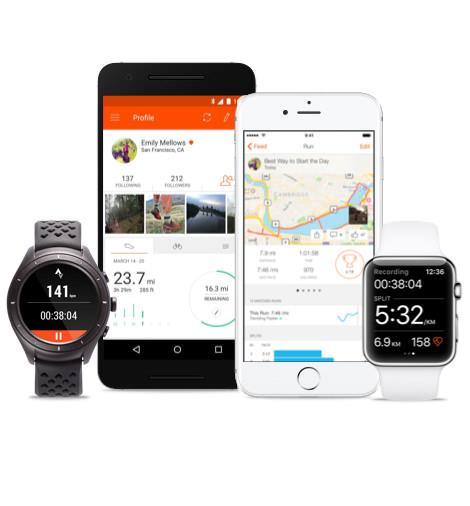
4 New data Activity tracking apps are used by many people and provide valuable new data about activities The Strava cycling app uses GPS to track cyclists journeys This offers the possibility of having data at a fine spatial and temporal scale for a large number of people The data are already being collected all over the world

5 The name is taken from the Swedish word sträva, meaning to strive It can be used to track running and cycling activities Users can track their activities over time and compare to the activities of their friends or the user community Users can also compete in competitions The app comes in a free and premium version. The premium version offers extra features and costs 5.99 a month or per year
6
7 Users have to start and stop the tracking They can tag whether or not their trip is a commute or not Strava also gather some demographic information about their users

8 Data The movement data collected by the app is raw GPS trajectories represented as a triple (latitude, longitude, timestamp)
9 Data The GPS trajectories are not made available to researchers The data is aggregated and provided to researchers/planners through Strava Metro Data are provided as: Origins and destinations with route information (at output area level) Minute-by-minute link counts of cycling flows Information about waiting times at junctions Aggregate demographic information
10
11
12
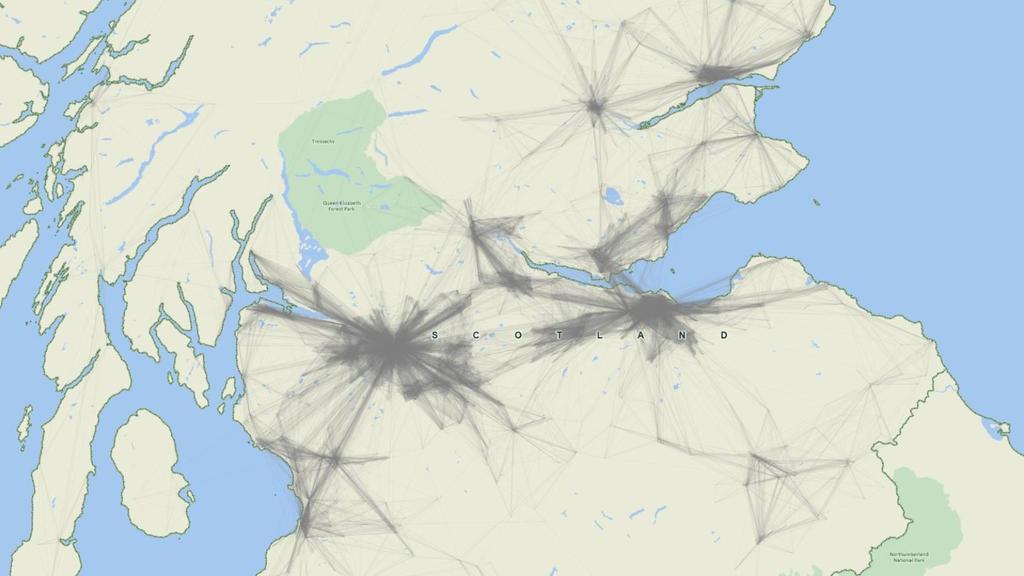
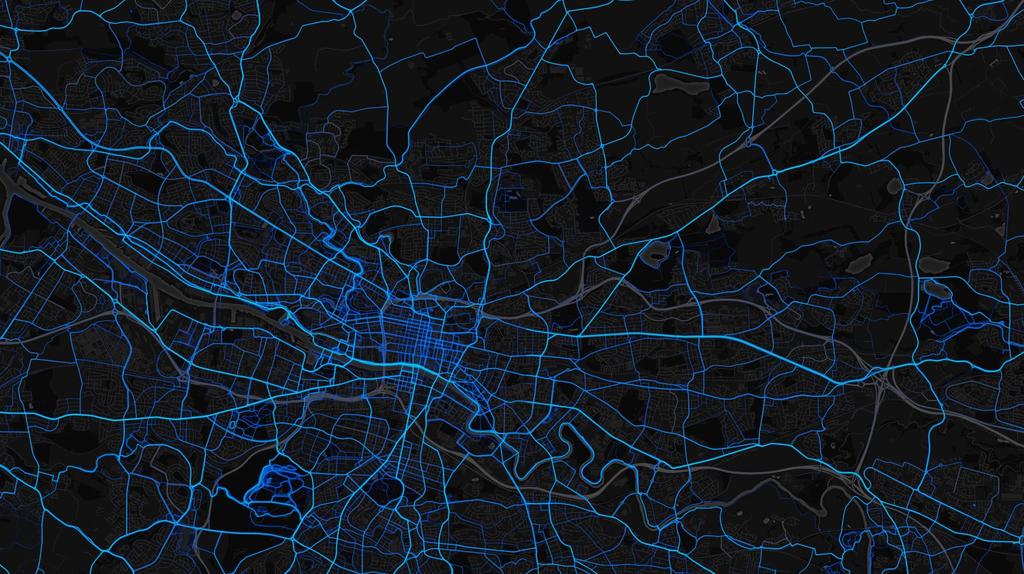
13 Problems We know not all cyclists use the app for every journey It is unlikely that a random sample of cyclists use the Strava app In Glasgow in 2015 there were 13,684 athletes who recorded 287,833 activities The median distance was 14.9 km Of this sample 11,216 were male (1,698 female) Can the sample tell us anything useful?
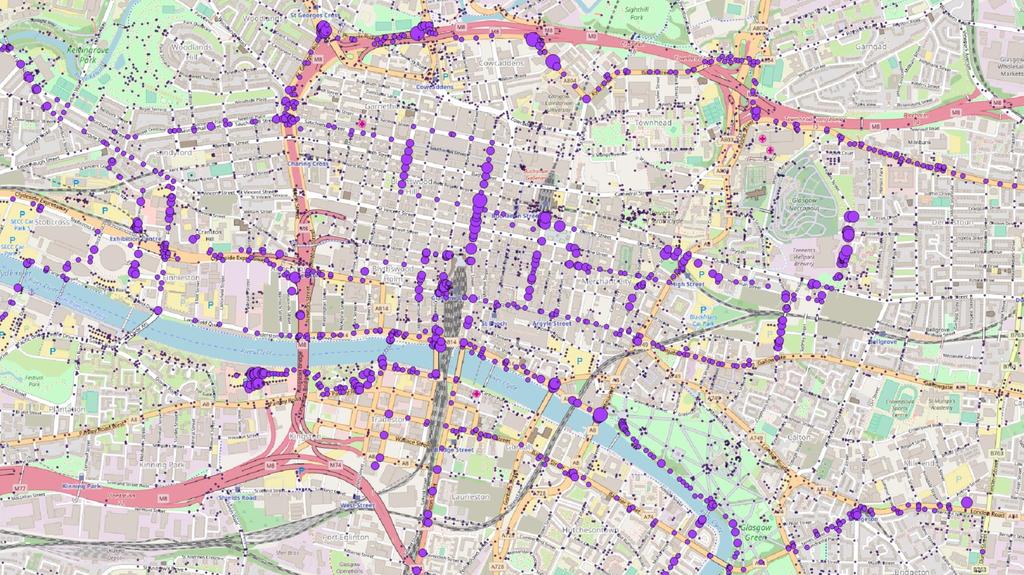
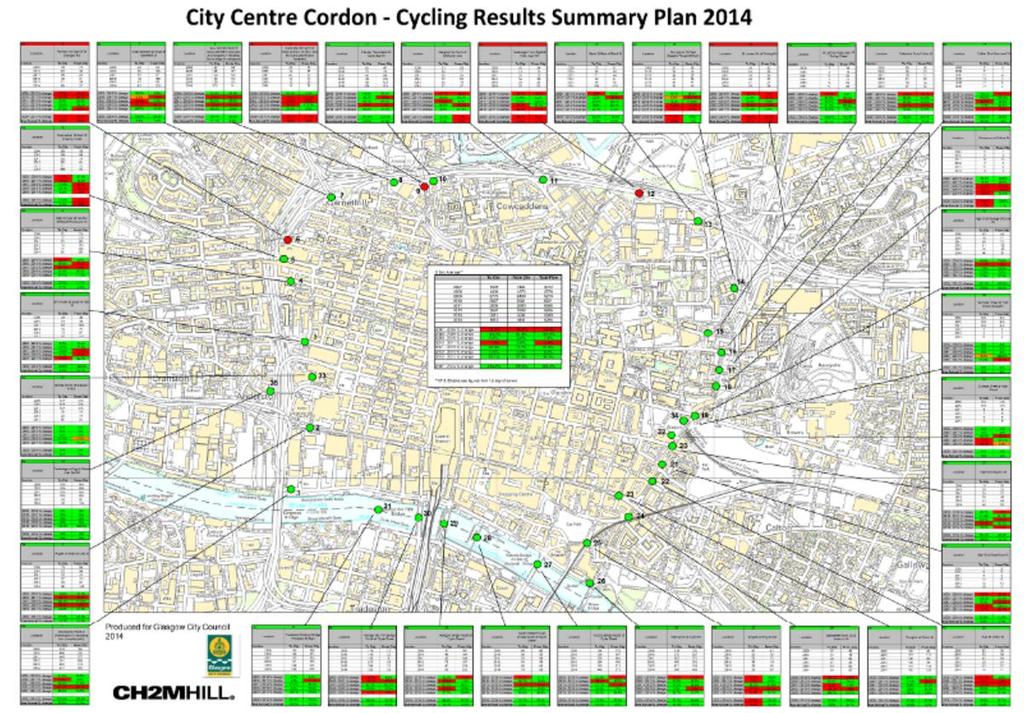
14 Our approach Firstly, we can visualise the data and do a basic sanity check; the patterns look like what we would expect given our knowledge of Glasgow We can compare it to other sources of data We use the annual two-day cordon counts which are conducted in Glasgow city centre We match the links where the counts take place to the same link in the Strava data
15
16 Cordon Count (CC) Cycle trips are counted in blocks of 30 minutes for 14 hours over two days in September each year We use data from 2013, 2014 and 2015 We aggregate both the CC and the Strava data into four different temporal scales, specifically by: Hour Commuting time (peak hours versus non-peak) Day Two-day (i.e. annual)

17 Correlations Sample size Correlation Hourly Peak Vs Non-peak One day Two days

18 Further work We have some additional hypothesis about how these correlations my vary: Does Strava have a higher market share in rich areas e.g. the West End of Glasgow? Is the market share of Strava changing over time? Does the weather affect the percentage of cyclists using Strava? Does the time of day affect the share of cyclists using Strava?

19 Models We have experimented with negative binomial regression models The number of total cyclists is modelled as a function of, among other things, the number of Strava cyclists This allows us to explore the factors influencing the link between the cycling flows It also allows us to adjust the Strava flows to an estimate of total flows across the network
20 Independent Model 1 Model 2 Model 3 Model 4 Coeffecient P= Coeffecient P= Coeffecient P= Coeffecient P= Strava *** *** *** *** Commuting (ref non-commuting) AM *** *** *** PM *** *** *** *** Year (ref:2013) Year (2014) Year (2015) 0.046* Region (ref:east) North South *** ** West *** *** *** Interactions Strava*am *** Strava*pm *** Strava* Strava* * Strava*North ** Strava*South Strava*West *** Intercept (con) *** *** Dispersion

21 Conclusions Strava shows good correlation with observed cycle counts Your body text should be min font size 16 and we recommend that you use the images we have provided The correlation is higher the more we aggregate the observations These correlations change depending on different factors We recommend that you use headings or bullet points This seems to correspond with what has been found in Your audience want to hear and see you present not read from a the literature slide.

22 Thank you for your attention. The data used are available from the Urban Big Data
Bike Counter Correlation
 Bike Counter Correlation A Story of Synergy: Bike Counts and Strava Metro For decades, transportation planners have used manual and automatic bicycle counters to collect hard data on where and when people
Using smartphones for cycle planning Authors: Norman, G. and Kesha, N January 2015
 Using smartphones for cycle planning Authors: Norman, G. and Kesha, N January 2015 Abstract There has been an inherent lack of information available to transport and urban planners when looking at cycle
 Siła-Nowicka, K. (2018) Analysis of Actual Versus Permitted Driving Speed: a Case Study from Glasgow, Scotland. In: 26th Annual GIScience Research UK Conference (GISRUK 2018), Leicester, UK, 17-20 Apr
Active Travel and Exposure to Air Pollution: Implications for Transportation and Land Use Planning
 Active Travel and Exposure to Air Pollution: Implications for Transportation and Land Use Planning Steve Hankey School of Public and International Affairs, Virginia Tech, 140 Otey Street, Blacksburg, VA
Determining bicycle infrastructure preferences A case study of Dublin
 *Manuscript Click here to view linked References 1 Determining bicycle infrastructure preferences A case study of Dublin Brian Caulfield 1, Elaine Brick 2, Orla Thérèse McCarthy 1 1 Department of Civil,
Neighborhood Influences on Use of Urban Trails
 Neighborhood Influences on Use of Urban Trails Greg Lindsey, Yuling Han, Jeff Wilson Center for Urban Policy and the Environment Indiana University Purdue University Indianapolis Objectives Present new
BICYCLE INFRASTRUCTURE PREFERENCES A CASE STUDY OF DUBLIN
 Proceedings 31st August 1st ITRN2011 University College Cork Brick, McCarty and Caulfield: Bicycle infrastructure preferences A case study of Dublin BICYCLE INFRASTRUCTURE PREFERENCES A CASE STUDY OF DUBLIN
Purpose and Need. For the. Strava Bicycle Data Project
 Purpose and Need For the Strava Bicycle Data Project April 2014 ODOT Strava Workgroup Margi Bradway*, Active Transportation Section Alex Bettenardi*, Transportation Planning Analysis Unit Phil Smith*,
Temporal and Spatial Variation in Non-motorized Traffic in Minneapolis: Some Preliminary Analyses
 Temporal and Spatial Variation in Non-motorized Traffic in Minneapolis: Some Preliminary Analyses Spencer Agnew, Jason Borah, Steve Hankey, Kristopher Hoff, Brad Utecht, Zhiyi Xu, Greg Lindsey Thanks to:
National Bicycle and Pedestrian Documentation Project INSTRUCTIONS
 National Bicycle and Pedestrian Documentation Project INSTRUCTIONS The National Documentation Project (NBPD) is an annual bicycle and pedestrian count and survey effort sponsored by the Institute of Transportation
Exploring potential of crowdsourced geographic information in studies of active travel and health: Strava data and cycling behaviour
 Exploring potential of crowdsourced geographic information in studies of active travel and health: Strava data and cycling behaviour Yeran Sun* Urban Big Data Centre, University of Glasgow, 7 Lilybank
Satisfaction with getting to work 56% 15% 6% 6% Total distance travelled. miles per week
 Page/... Headlines Emersons Green Travel to Work Survey March 0 Number of respondents Main modes of travel (%) 0% Satisfaction with getting to work % % Satisfaction with getting % % % (driver with others/
Using Farecard Data to Suggest Cycling Policies in Singapore. Ashwani Kumar Viet Anh Nguyen Kwong Meng Teo Amedeo Odoni
 Using Farecard Data to Suggest Cycling Policies in Singapore Ashwani Kumar Viet Anh Nguyen Kwong Meng Teo Amedeo Odoni Based on our paper published in the journal Annals of Operations Research in April
Visual Traffic Jam Analysis Based on Trajectory Data
 Visual Traffic Jam Analysis Based on Trajectory Data Zuchao Wang, Min Lu, Xiaoru Yuan, Peking University Junping Zhang, Fudan University Huub van de Wetering, Technische Universiteit Eindhoven Introduction
INVESTIGATING THE POTENTIAL OF ACTIVITY TRACKING APP DATA TO ESTIMATE CYCLE FLOWS IN URBAN AREAS
 INVESTIGATING THE POTENTIAL OF ACTIVITY TRACKING APP DATA TO ESTIMATE CYCLE FLOWS IN URBAN AREAS J. Haworth a, * a SpaceTimeLab, University College London, Gower Street, London, WC1E 6BT UK j.haworth@ucl.ac.uk
Gdynia s bicycle model
 Gdynia s bicycle model Problems related to cycling network and demand modelling Michał Miszewski, city of Gdynia Development of tool for transport analysis - MST Statistical data (baseline and forecasts)
IMPACT OF BICYCLE INFRASTRUCTURE IMPROVEMENTS IN NEW ORLEANS, LOUISIANA. Kathryn M. Parker MPH, Janet Rice PhD, Jeanette Gustat PhD
 IMPACT OF BICYCLE INFRASTRUCTURE IMPROVEMENTS IN NEW ORLEANS, LOUISIANA Kathryn M. Parker MPH, Janet Rice PhD, Jeanette Gustat PhD Background A comparison of both self-reported and objectively measured
Cycle journeys on the South-West City Way: a descriptive analysis. Karen McPherson. Glasgow Centre for Population Health
 Cycle journeys on the South-West City Way: a descriptive analysis Karen McPherson Glasgow Centre for Population Health March 2017 Key points: There were 107,000 journeys made using the route during the
The Infrastructure Impact Tool
 1 The Infrastructure Impact Tool Guidance notes Delivered by Sustrans in partnership with: 2 About Sustrans Sustrans is the charity making it easier for people to walk and cycle. We are engineers and educators,
The Wind-Speed Dose-Response of Tree-Falls Impacting the Transmission Grid of Southwest British Columbia
 The Wind-Speed Dose-Response of Tree-Falls Impacting the Transmission Grid of Southwest British Columbia Wolf Read PhD Candidate Forest Science University of British Columbia Introduction Talk Outline:
The case study was drafted by Rachel Aldred on behalf of the PCT team.
 Rotherhithe Case Study: Propensity to Cycle Tool This case study has been written to use the Propensity to Cycle Tool (PCT: www.pct.bike) to consider the impact of a bridge in South-East London between
Cycle journeys on the Anderston-Argyle Street footbridge: a descriptive analysis. Karen McPherson. Glasgow Centre for Population Health
 Cycle journeys on the Anderston-Argyle Street footbridge: a descriptive analysis Karen McPherson Glasgow Centre for Population Health March 2017 Key points: There were 116,334 cycle journeys made using
AS91430: Cycleways Waiopehu College Year 13 Geography Matt Reeves
 AS91430: Cycleways Waiopehu College Year 13 Geography Matt Reeves December 2017 AS91430: Cycleways Cycling is an activity that a large proportion of our national population decides to enjoy and participate
Will the New Low Emission Zone Reduce the Amount of Motor Vehicles in London?
 Will the New Low Emission Zone Reduce the Amount of Motor Vehicles in London? Philip Osborne I. INTRODUCTION An initiative of the 2016 London Mayor s election campaign was to improve engagement with Londoners
Outcomes of the Cycling City and Towns programme: monitoring project report
 Outcomes of the Cycling City and Towns programme: monitoring project report Individual town results: Blackpool April 217 Report authors: Andy Cope, Research and Monitoring Unit, Sustrans Angela Kennedy,
Developing a Safer Cycling Strategy for the ACT ACRS Conference August 2012
 Developing a Safer Cycling Strategy for the ACT ACRS Conference 2012 Peter Strang Canberra Manager Sarah Court Transport Consultant 10 August 2012 Presentation Outline Background Data Analysis (Stage 1)
Sustrans Scotland: walking and cycling outcomes
 Sustrans Scotland: walking and cycling outcomes Sustrans' Scottish Government Grant 2012 2015: First Interim Report September 2013 About Sustrans Sustrans makes smarter travel choices possible, desirable
Position and displacement
 /1/14 Position and displacement Objectives Describe motion in 1D using position, distance, and displacement. Analyze motion in 1D using position, distance, and displacement. Correctly use and interpret
Mapping Cyclist Activity and Injury Risk in a Network Combining Smartphone GPS Data and Bicycle Counts
 Mapping Cyclist Activity and Injury Risk in a Network Combining Smartphone GPS Data and Bicycle Counts PhD Candidate: Jillian Strauss Supervisors: Luis Miranda-Moreno & Patrick Morency 25th CARSP Conference,
Telling Data Stories
 Data Science Concepts Paul Hewson texhewson@gmail.com 15th November 2016 Data Science Concepts Personal transport dis-benefits: injury, lack of exercise, pollution... Data Science Concepts Statistical
MODELING THE ACTIVITY BASED TRAVEL PATTERN OF WORKERS OF AN INDIAN METROPOLITAN CITY: CASE STUDY OF KOLKATA
 MODELING THE ACTIVITY BASED TRAVEL PATTERN OF WORKERS OF AN INDIAN METROPOLITAN CITY: CASE STUDY OF KOLKATA WORK ARITRA CHATTERJEE HOME SHOPPING PROF. DR. P.K. SARKAR SCHOOL OF PLANNING AND ARCHITECTURE,
National Bicycle and Pedestrian Documentation Project INSTRUCTIONS
 National Bicycle and Pedestrian Documentation Project INSTRUCTIONS The National Documentation Project (NBPD) is an annual bicycle and pedestrian count and survey effort sponsored by the Institute of Transportation
Satisfaction with getting to work 54% 14% 6% 5% Total distance travelled. miles per week
 Page/... Travel to Work Survey March 0 Headlines South Gloucestershire LA Area Number of respondents Main modes of travel (%) Satisfaction with getting to work % Satisfaction with getting % (driver with
STRAVA - DATA ACCESS AND USES. March 9, 2016 Shaun Davis + Dewayne Carver Florida Dept. of Transportation
 STRAVA - DATA ACCESS AND USES March 9, 2016 Shaun Davis + Dewayne Carver Florida Dept. of Transportation AGENDA Training Accessing the Data Data Characteristics Potential Uses Question and Answer WHAT
Can Ljubljana become bicycle friendly city?
 Can Ljubljana become bicycle friendly city? Ljubljana basic data Geographical position: Latitude: 46 03'20'' Longitude:14 30'30'' Altitude: 298 m Topography: predominately flat area Meteorological data:
SUSTAINABLE MOBILITY AND WEALTHY CITIES
 SUSTAINABLE MOBILITY AND WEALTHY CITIES CIVITAS Summer Course: Sustainable mobility for a better life 7 10 June 2016 Malaga, Spain Table of contents Theoretical section Introduction: sustainable mobility
Integrated Regional Traffic Management. Michael Aherne Technical Director POLIS Conference 2009
 Integrated Regional Traffic Management Michael Aherne Technical Director POLIS Conference 2009 M50 finish Public Transport and Pedestrians College Green The Spatial Perspective What Could has
Land Use and Cycling. Søren Underlien Jensen, Project Manager, Danish Road Directorate Niels Juels Gade 13, 1020 Copenhagen K, Denmark
 Land Use and Cycling Søren Underlien Jensen, Project Manager, Danish Road Directorate Niels Juels Gade 13, 1020 Copenhagen K, Denmark suj@vd.dk Summary: Research about correlation between land use and
Assessment of socio economic benefits of non-motorized transport (NMT) integration with public transit (PT)
 integration with public transit (PT)") Assessment of socio economic benefits of non-motorized transport (NMT) integration with public transit (PT) Case study of Bike share (BS) system in Pune, India Parvesh Kumar Sharawat Department of Policy
Assessment of socio economic benefits of non-motorized transport (NMT) integration with public transit (PT) Case study of Bike share (BS) system in Pune, India Parvesh Kumar Sharawat Department of Policy
Oakville, Ontario Case Study
 Oakville, Ontario Case Study 1 Background The Town of Oakville, a suburb of Toronto, is located on the shore of Lake Ontario and has a population of about 185,000. Oakville created its first Active Transportation
Satisfaction with getting to work 55% 17% 8% 7% Total distance travelled. miles per week
 Page/... Headlines North Bristol Suscom Travel to Work Survey March 0 Number of respondents 0 Main modes of travel (%) % Satisfaction with getting to work % % % % Satisfaction with getting % % (driver
Erfurt, April
 Erfurt, 12.-13. April 2012 www.bicy.it www.bicy.it OVERALL GOAL: Increase & improve cycling in Central Europe Scope: Seven countries, 16 areas (14 cities), 3 years Diverse Strategy: Media, Resources, Events,
Life Transitions and Travel Behaviour Study. Job changes and home moves disrupt established commuting patterns
 Life Transitions and Travel Behaviour Study Evidence Summary 2 Drivers of change to commuting mode Job changes and home moves disrupt established commuting patterns This leaflet summarises new analysis
For Information Only. Pedestrian Collisions (2011 to 2015) Resolution. Presented: Monday, Apr 18, Report Date Tuesday, Apr 05, 2016
 Resolution. Presented: Monday, Apr 18, Report Date Tuesday, Apr 05, 2016") Presented To: Operations Committee For Information Only Pedestrian Collisions (0 to 0) Presented: Monday, Apr 8, 06 Report Date Tuesday, Apr 0, 06 Type: Correspondence for Information Only Resolution For
Presented To: Operations Committee For Information Only Pedestrian Collisions (0 to 0) Presented: Monday, Apr 8, 06 Report Date Tuesday, Apr 0, 06 Type: Correspondence for Information Only Resolution For
CITI BIKE S NETWORK, ACCESSIBILITY AND PROSPECTS FOR EXPANSION. Is New York City s Premier Bike Sharing Program Accesssible to All?
 CITI BIKE S NETWORK, ACCESSIBILITY AND PROSPECTS FOR EXPANSION Is New York City s Premier Bike Sharing Program Accesssible to All? How accessible is Citi Bike s network in New York City? Who benefits from
Can PRT overcome the conflicts between public transport and cycling?
 Can PRT overcome the conflicts between public transport and cycling? J. Meggs, F. Rupi, J. Schweizer Università di Bologna - DICAM Abstract Personal Rapid Transit (PRT) offers exceptional service characteristics,
Counting Pedestrians and. and Other Facilities
 Counting Pedestrians and Cyclists on Multiuse Trails and Other Facilities Trail Counting Workshop How many are researchers? How many are policy-makers, public managers, or advocates? How many are now counting
BETHEL ROAD AND SEDGWICK ROAD CORRIDOR STUDY
 DRAFT PLAN City Council Meeting August 14, 2017 STUDY AREA Sedgwick Corridor State Route 160, principal arterial with Class 3 access management designation, commuter and freight route, connection to SR
Thursday 18 th January Cambridgeshire Travel Survey Presentation to the Greater Cambridge Partnership Joint Assembly
 Thursday 18 th January 2018 Cambridgeshire Travel Survey Presentation to the Greater Cambridge Partnership Joint Assembly Contents 1. Study Background 2. Methodology 3. Key Findings An opportunity for
TYPES OF CYCLING. Figure 1: Types of Cycling by Gender (Actual) Figure 2: Types of Cycling by Gender (%) 65% Chi-squared significance test results 65%
 Figure 2: Types of Cycling by Gender (%) 65% Chi-squared significance test results 65%") TYPES OF CYCLING 1,980 responses were received to this question (multiple answers were allowed), 727 female (41%) and 1,242 (71%) from male respondents. The most common responses for both genders were
TYPES OF CYCLING 1,980 responses were received to this question (multiple answers were allowed), 727 female (41%) and 1,242 (71%) from male respondents. The most common responses for both genders were
Cascade Bicycle Club Strategic Plan
 The Greater Context Bicycling has become fundamentally important as large-scale currents of change threaten the health, economy and livability of communities throughout the United States and the world
Congestion Reduction in Europe: Advancing Transport Efficiency. MG Tackling urban road congestion D3.4
 Congestion Reduction in Europe: Advancing Transport Efficiency MG-5.3-2014 Tackling urban road congestion D3.4 Patterns of congestion in European cities Multiple-indicator analysis using real-time GPS
Qualitative research into motivations and barriers to cycling Russell Greig Department of Transport, Western Australia.
 Qualitative research into motivations and barriers to cycling Russell Greig Department of Transport, Western Australia. Abstract In 2010 the Department of Transport s (DoT) Bikewest branch commissioned
Kevin Manaugh Department of Geography McGill School of Environment
 Kevin Manaugh Department of Geography McGill School of Environment Outline Why do people use active modes? Physical (Built environment) Factors Psychological Factors Empirical Work Neighbourhood Walkability
Transport Poverty in Scotland. August 2016
 Transport Poverty in Scotland August 2016 About Sustrans Sustrans makes smarter travel choices possible, desirable and inevitable. We re a leading UK charity enabling people to travel by foot, bike or
Road safety and bicycle usage impacts of unbundling vehicular and cycle traffic in Dutch urban networks
 Road safety and bicycle usage impacts of unbundling vehicular and cycle traffic in Dutch urban networks Paul Schepers Ministry of Infrastructure and the Environment SWOV Institute for Road Safety Research
Measuring and Assessing Traffic Congestion: a Case Study
 AITPM 2014 National Conference Adelaide, 12-15 August 2014 Measuring and Assessing Traffic Congestion: a Case Study Cennet Yumlu, Sara Moridpour and Rahmi Akçelik Presenter: Rahmi Akçelik sidrasolutions.com
London s Cycling Revolution Berlin
 London s Cycling Revolution Berlin May 2009 Contents How far have we come? How have we achieve the recent growth? What is our future target? What potential have we identified? What solutions have we identified?
4/27/2016. Introduction
 EVALUATING THE SAFETY EFFECTS OF INTERSECTION SAFETY DEVICES AND MOBILE PHOTO ENFORCEMENT AT THE CITY OF EDMONTON Karim El Basyouny PhD., Laura Contini M.Sc. & Ran Li, M.Sc. City of Edmonton Office of
Designing a Bicycle and Pedestrian Count Program in Blacksburg, VA
 Designing a Bicycle and Pedestrian Count Program in Blacksburg, VA Steve Hankey (Virginia Tech) Andrew Mondschein (U or Virginia) Ralph Buehler (Virginia Tech) Issue/objective Issue No systematic traffic
Summary of NWA Trail Usage Report November 2, 2015
 Summary of NWA Trail Usage Report November 2, 2015 Summary Findings: The study showed that Northwest Arkansas (NWA) had relatively high cyclist user counts per capita aggregated across the top three usage
Contents. West Sussex PCT case study. Rachel Aldred, on behalf of the PCT team
 West Sussex PCT case study Rachel Aldred, on behalf of the PCT team Contents Introduction... 2 About the PCT... 2 Limitations... 2 Why cycling matters... 2 About West Sussex... 3 The scenarios... 4 E-bikes...
Transport Poverty in Scotland. August 2016
 Transport Poverty in Scotland August 2016 About Sustrans Sustrans is the charity making it easier for people to walk and cycle. We connect people and places, create liveable neighbourhoods, transform the
Where do People Bicycle? The Role of Infrastructure in Determining Bicycle Behavior
 Portland State University PDXScholar Urban Studies and Planning Faculty Publications and Presentations Nohad A. Toulan School of Urban Studies and Planning 4-11-2008 Where do People Bicycle? The Role of
Mobility Constraints of Children in Bangladesh: A Study on Travel to School in Dhaka City
 Mobility Constraints of Children in Bangladesh: A Study on Travel to School in Dhaka City Noor Ali Shah & Prof. Dr M. Shafiq-Ur Rahman Department of Urban and Regional Planning Jahangirnagar University
RE-CYCLING A CITY: EXAMINING THE GROWTH OF CYCLING IN DUBLIN
 Proceedings ITRN2013 5-6th September, Caulfield: Re-cycling a city: Examining the growth of cycling in Dublin RE-CYCLING A CITY: EXAMINING THE GROWTH OF CYCLING IN DUBLIN Brian Caulfield Abstract In the
Winter Steelhead Redd to Fish conversions, Spawning Ground Survey Data
 Winter Steelhead Redd to Fish conversions, Spawning Ground Survey Data Oregon Department of Fish and Wildlife (ODFW); Corvallis Research Office Oregon Adult Salmonid Inventory and Sampling Project (June
Pedestrian Behaviour Modelling
 Pedestrian Behaviour Modelling An Application to Retail Movements using Genetic Algorithm Contents Requirements of pedestrian behaviour models Framework of a new model Test of shortest-path model Urban
Brian Caulfield Department of Civil, Structural and Environmental Engineering, Trinity College Dublin, Dublin 2, Ireland
 *Manuscript Click here to view linked References Re-cycling a city examining the growth of cycling in Dublin Brian Caulfield Department of Civil, Structural and Environmental Engineering, Trinity College
Modelling Cycling: Potential Cycling & Potential Benefits. James Woodcock 1, Alvaro Ullrich 1, Robin Lovelace 2
 Modelling Cycling: Potential Cycling & Potential Benefits James Woodcock 1, Alvaro Ullrich 1, Robin Lovelace 2 1 CEDAR MRC Epidemiology Unit, 2 University of Leeds Summary of talk James Introducing CEDAR
Spatial and Temporal Patterns of Pedestrian Crashes Along The Urbanization Gradient
 Spatial and Temporal Patterns of Pedestrian Crashes Along The Urbanization Gradient Tram Truong, GISP GIS-T Conference Raleigh, NC April 4-7, 2016 Acknowledgement Trung Tran, PhD, GISP Northern Kentucky
21/02/2018. How Far is it Acceptable to Walk? Introduction. How Far is it Acceptable to Walk?
 21/2/218 Introduction Walking is an important mode of travel. How far people walk is factor in: Accessibility/ Sustainability. Allocating land in Local Plans. Determining planning applications. Previous
2017 Cycling Survey Report
 Contents Introduction & background... 2 Aims & objectives... 2 Methodology... 3 Analysis & results... 3 Key Findings... 6 Conclusions... 15 Appendix 1- Dataset... 16 Appendix 2 - Survey design: List of
Walking and Cycling Action Plan Summary. A Catalyst for Change The Regional Transport Strategy for the west of Scotland
 Walking and Cycling Action Plan Summary A Catalyst for Change The Regional Transport Strategy for the west of Scotland 2007-2021 Strathclyde Partnership for Transport Contents Purpose...2 Issues, Constraints
Rerouting Mode Choice Models: How Including Realistic Route Options Can Help Us Understand Decisions to Walk or Bike
 Portland State University PDXScholar TREC Friday Seminar Series Transportation Research and Education Center (TREC) 4-1-2016 Rerouting Mode Choice Models: How Including Realistic Route Options Can Help
TomTom South African Congestion Index
 TomTom South African Congestion Index Disclaimer All copyrights, commercial rights, design rights, trademarks and other elements considered intellectual property that are published in this report are reserved
VGI for mapping change in bike ridership
 VGI for mapping change in bike ridership D. Boss 1, T.A. Nelson* 2 and M. Winters 3 1 Unviersity of Victoria, Victoria, Canada 2 Arizona State University, Arizona, USA 3 Simon Frasier University, Vancouver,
If drivers and cyclists can be alerted of potential incidents ahead of time the roads will be safer for all users.
 Cyclists in Brisbane are involved in far too many incidents, both when cycling on roads and when cycling n dedicated bikeways. 46 cyclists have died on Australian roads since 2015. But it isn t just vehicles
phoenix regional bike share program sponsorship
 phoenix regional bike share program sponsorship High visibility opportunities to promote a healthy lifestyle and sustainable transportation in the Phoenix area what is bike share? Bike share programs are
Cabrillo College Transportation Study
 Cabrillo College Transportation Study Planning and Research Office Terrence Willett, Research Analyst, Principle Author Jing Luan, Director of Planning and Research Judy Cassada, Research Specialist Shirley
City of Hamilton s Transportation Master Plan (TMP) Public Consultation 3 December 2015
 Public Consultation 3 December 2015") City of Hamilton s Transportation Master Plan (TMP) Public Consultation 3 December 2015 McPhail Transportation Planning Services Ltd. AGENDA 6:00 7:00 pm Viewing Boards / Q & A with the Team 7:00 7:50
City of Hamilton s Transportation Master Plan (TMP) Public Consultation 3 December 2015 McPhail Transportation Planning Services Ltd. AGENDA 6:00 7:00 pm Viewing Boards / Q & A with the Team 7:00 7:50
2011 Origin-Destination Survey Bicycle Profile
 TRANS Committee 2011 Origin-Destination Survey National Capital Region December 2012 TRANS Committee Members: City of Ottawa, including OC Transpo Ville de Gatineau Société de transport de l Outaouais
Introduction 4/28/ th International Conference on Urban Traffic Safety April 25-28, 2016 EDMONTON, ALBERTA, CANADA
 4/28/2016 EVALUATING THE SAFETY EFFECTS OF INTERSECTION SAFETY DEVICES AND MOBILE PHOTO ENFORCEMENT AT THE CITY OF EDMONTON Karim El Basyouny PhD., Laura Contini M.Sc. & Ran Li, M.Sc. City of Edmonton
Rationale. Previous research. Social Network Theory. Main gap 4/13/2011. Main approaches (in offline studies)
") Boots are Made for Walking: The Spatiality of Social Networks in a Pedestrian, Phone-Free Society Patterns of social interaction in regions without: Implications Rationale Annual Meeting of the Association
Boots are Made for Walking: The Spatiality of Social Networks in a Pedestrian, Phone-Free Society Patterns of social interaction in regions without: Implications Rationale Annual Meeting of the Association
Travel to Work Survey March % 58% 32% 9% 7% 5% 16% 20% 12% Headlines - Bristol LA Area. Main modes of travel (%)
") Headlines Bristol LA Area Page/... Travel to Work Survey March 0 Number of respondents Satisfaction with getting to work Satisfaction with getting % Main modes of travel (%) % % % % (driver with others/
Headlines Bristol LA Area Page/... Travel to Work Survey March 0 Number of respondents Satisfaction with getting to work Satisfaction with getting % Main modes of travel (%) % % % % (driver with others/
HSIS. Association of Selected Intersection Factors With Red-Light-Running Crashes. State Databases Used SUMMARY REPORT
 HSIS HIGHWAY SAFETY INFORMATION SYSTEM The Highway Safety Information Systems (HSIS) is a multi-state safety data base that contains accident, roadway inventory, and traffic volume data for a select group
National Bicycle and Pedestrian Documentation Project Conducting Counts
 National Bicycle and Pedestrian Documentation Project Conducting Counts Alta Planning + Design What is the NBPD? Annual bicycle and pedestrian count and survey effort A cooperative effort between Alta
Regional Cycle Programme Update
 Agenda Item 10 (ii) Regional Cycle Programme Update Glossary Auckland Council Auckland Transport Cycle Action Auckland New Zealand Transport Agency Regional Cycle Network (AC) (AT) (CAA) (NZTA) (RCN) Executive
Source: Transit App. D.C. Dockless Bikeshare: A First Look
 Source: Transit App D.C. Dockless Bikeshare: A First Look Virginia Tech Spring 2018 Executive Summary A studio class at Virginia Tech ( VT ) conducted a study of the five dockless bikeshare systems that
Palythoa Abundance and Coverage in Relation to Depth
 Palythoa Abundance and Coverage in Relation to Depth Foisy, Mia 02//208 Foisy, Mia Masternaut Project 02//208 Palythoa Abundance and Coverage in Relation to Depth Abstract: Palythoa abundance and coverage
Attitude towards Walk/Bike Environments and its Influence on Students Travel Behavior: Evidence from NHTS, 2009
 Attitude towards Walk/Bike Environments and its Influence on Students Travel Behavior: Evidence from NHTS, 2009 Dr. Mintesnot Woldeamanuel California State University Northridge The 9 th Active Living
Evaluation. Monitoring and 8.0
 8.0 Monitoring and Evaluation 8.1 Introduction The Cycling Strategy is a dynamic document that will evolve over the 10 year timeframe in line with the changing land-use and transport environment in Lake
Roadway Bicycle Compatibility, Livability, and Environmental Justice Performance Measures
 Roadway Bicycle Compatibility, Livability, and Environmental Justice Performance Measures Conference on Performance Measures for Transportation and Livable Communities September 7-8, 2011, Austin, Texas
Outcomes of the Cycling City and Towns programme: monitoring project report
 Outcomes of the Cycling City and Towns programme: monitoring project report Individual town results: Leighton Linslade April 2017 Report authors: Andy Cope, Research and Monitoring Unit, Sustrans Angela
OXFORDSHIRE & OXFORD CITY CONGESTION MONITORING 2015
 OXFORDSHIRE & OXFORD CITY CONGESTION MONITORING 2015 Introduction Congestion to most people means a motionless or slow moving line of vehicles. Congestion has many negative social, environmental and economic
Webinar: Exploring Pedestrian Responsive Traffic Signal Timing Strategies in Urban Areas
 Portland State University PDXScholar TREC Webinar Series Transportation Research and Education Center (TREC) 1-29-2015 Webinar: Exploring Pedestrian Responsive Traffic Signal Timing Strategies in Urban
Factors Associated with the Bicycle Commute Use of Newcomers: An analysis of the 70 largest U.S. Cities
 : An analysis of the 70 largest U.S. Cities Ryan J. Dann PhD Student, Urban Studies Portland State University May 2014 Newcomers and Bicycles Photo Credit: Daveena Tauber 2 Presentation Outline Introduction
Slimming the Streets: Best Practices for Designing Road Diet Evaluations
 San Jose State University From the SelectedWorks of Asha W. Agrawal March, 2018 Slimming the Streets: Best Practices for Designing Road Diet Evaluations Hilary Nixon, San Jose State University Asha W.
Sandra Nutter, MPH James Sallis, PhD Gregory J Norman, PhD Sherry Ryan, PhD Kevin Patrick, MD, MS
 Objectively Measured Environmental Correlates of Adolescent Physical Activity Sandra Nutter, MPH James Sallis, PhD Gregory J Norman, PhD Sherry Ryan, PhD Kevin Patrick, MD, MS San Diego State University
A N E X P L O R AT I O N W I T H N E W Y O R K C I T Y TA X I D ATA S E T
 A N E X P L O R AT I O N W I T H N E W Y O R K C I T Y TA X I D ATA S E T GAO, Zheng 26 May 2016 Abstract The data analysis is two-part: an exploratory data analysis, and an attempt to answer an inferential