Proportion (%) of Total UK Adult Population (16+)s. Participating in any Watersports Activity
|
|
|
- Oliver Thompson
- 6 years ago
- Views:
Transcription
1
2 Proportion (%) of Total UK Adult Population (16+)s Participating in any Watersports Activity Headlines Participation in any activities up 2.1% point 14.3m UK adults participating Highest volume recorded since survey start Participation in any boating activity up 0.2% points 3.5m UK adults took part in a boating activity in Total UK Adult Population (16+) Any watersports activity Any boating activity Linear (Any watersports activity) Linear (Any boating activity) Any watersports activity 26.3% 28.0% 29.6% 23.0% 26.3% 25.0% 22.7% 28.8% 26.8% 25.2% 27.3% Volume (000's) 12,580 13,506 14,400 11,294 12,893 12,589 11,153 14,124 13,127 12,364 14,300 Any boating activity 8.2% 7.2% 8.1% 6.8% 7.3% 7.8% 6.2% 7.2% 5.6% 5.9% 5.8% 7.1% 7.1% 6.5% 6.7% Volume (000's) 3,819 3,222 3,740 3,276 3,494 3,811 3,040 3,534 2,752 2,996 2,837 3,491 3,459 3,176 3,494 2
3 Participation Summary % The most popular = less need for any training or equipment Spending leisure time at the beach Coastal walking Outdoor swimming 1.5m UK adult residents taking part in canoeing 8.0m UK adults spent general leisure time at the beach 3 Volume (000s) Any watersports activity 27% 14,300 14,300 Any boating activity 7% 3,494 3,494 Small sailboat racing 0% Small sailboat activities 1% Yacht racing 0% Yacht cruising 1% Power boating 1% Motor boating 1% Canal boating 1% Canoeing 3% 1,512 1,512 Rowing 1% Windsurfing 0% Water skiing 0% Using personal watercraft 0% Surf body paddle 2% 1,227 1,227 Stand up surfing 1% Bodyboarding 1% Paddleboarding 1% Kitesurfing 0% Angling (Any) 2% 1,120 1,120 Freshwater angling 1% Sea angling 2% Sea angling from a kayak 0% Sea angling from a rental boat 0% Sea angling from a charter boat 0% Sea angling from the shore 1% Recreational sea fishing 0% Cliff climbing 1% Coastal walking 12% 6,123 6,123 Leisure time beach 15% 7,959 7,959 Outdoor swimming 10% 5,100 5,100 Leisure subaqua diving 1% Coasteering 0% Adult Population (000's) 52,443 52,443 52,443 Sample size 12,625 12,625 12,625
4 Participation Summary % Any activity up by 2.1% points. Volume terms = increase of 2m people Major volume increases: spending leisure time at the beach coastal walking Stand up paddle boarding is growing in popularity with a 0.3% point increase Motorised sports are indicating a tougher time with a year on year drop in power boating, canal boating, water-skiing and leisure sub aqua diving Volume Volume (000's) % (000's) % point change Any watersports activity 25.2% 12, % 14, Any boating activity 6.5% 3, % 3, Small sailboat racing 0.2% % Small sailboat activities 0.9% % Yacht racing 0.2% % Yacht cruising 0.5% % Power boating 0.6% % Motor boating 0.9% % Canal boating 0.8% % Canoeing 2.9% 1, % 1, Rowing 0.7% % Windsurfing 0.2% % Water skiing 0.6% % Using personal watercraft 0.3% % Surf body paddle 2.0% % 1, Stand up surfing 0.9% % Bodyboarding 1.1% % Paddleboarding 0.4% % Kitesurfing 0.1% % Angling (Any) 2.0% % 1, Freshwater angling 0.7% % Sea angling 1.4% % Sea angling from a kayak 0.1% % Sea angling from a rental boat 0.5% % Sea angling from a charter boat 0.1% % Sea angling from the shore 1.0% % Recreational sea fishing 0.2% % Cliff climbing 0.8% % Coastal walking 9.5% 4, % 6, Leisure time beach 13.0% 6, % 7, Outdoor swimming 8.7% 4, % 5, Leisure subaqua diving 0.7% % Coasteering 0.2% % Adult Population (000's) 49,051 52,443 Sample size 12,739 12,625
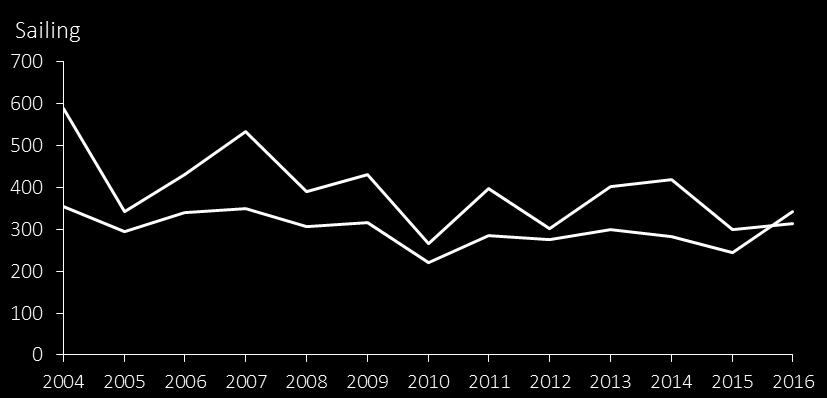
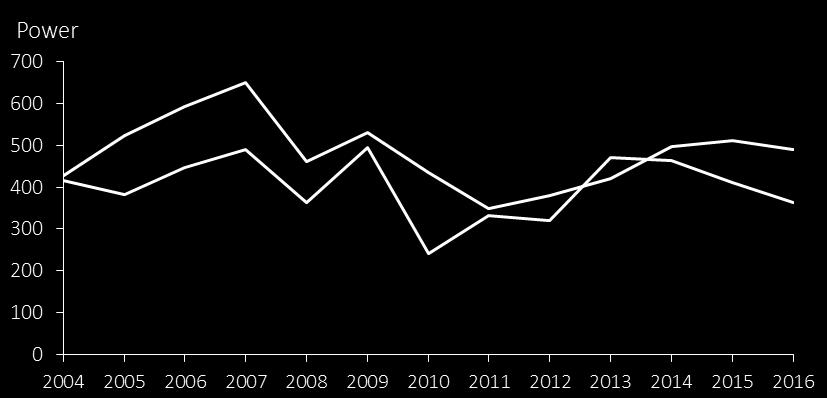
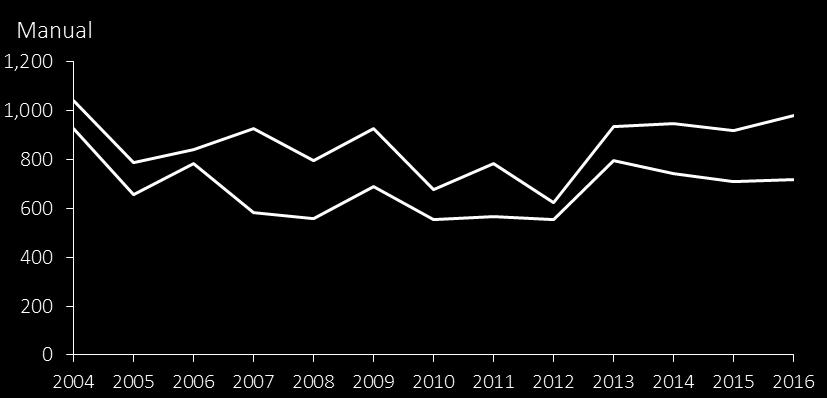
5 Long Term Trends by Activity % Comparing the data in the long term, in this case, looking at the participation rates from The participation in both any activity and any boating activity have seen a decrease. Only canoeing within the any boating activity has seen an increase in % terms over the 10 year period. This chart mirrors the declining trend line as shown in the earlier slides Volume Volume (000's) % (000's) % point change Any watersports activity 28.0% 13, % 14, Any boating activity 7.3% 3, % 3, Small sailboat racing 0.4% % Small sailboat activities 1.1% % Yacht racing 0.2% % Yacht cruising 0.7% % Power boating 0.7% % Motor boating 1.2% % Canal boating 0.8% % Canoeing 2.2% 1, % 1, Rowing 0.9% % Windsurfing 0.5% % Water skiing 0.7% % Using personal watercraft 0.6% % Surf body paddle 1.3% % 1, Stand up surfing % 544 Bodyboarding % 608 Paddleboarding % 386 Kitesurfing 0.1% % Angling (Any) % 1,120 Freshwater angling % 352 Sea angling % 874 Sea angling from a kayak % 70 Sea angling from a rental boat % 258 Sea angling from a charter boat % 106 Sea angling from the shore % 646 Recreational sea fishing % 131 Cliff climbing 0.9% % Coastal walking 12.2% 5, % 6, Leisure time beach 12.5% 6, % 7, Outdoor swimming 12.3% 5, % 5, Leisure subaqua diving 0.8% % Coasteering % 188 Adult Population (000's) 48,184 52,443 Sample size 12,203 12,625
6 Annual sunshine hours % participation among UK adults Annual sunshine hours % participation among UK adults Importance of the weather? 1, , ,600 1,400 1, ,600 1,400 1, , , Annual Sunshine hours Any watersports activity Annual Sunshine hours Any boating activity Data taken from the met office records:
7 Average temp % participation among UK adults Average temp % participation among UK adults Sunshine hours Sunshine and Temperature 1,800 1,600 Although the average sunshine hours in summer was slightly under average, the summer temperature was high Any watersport activity is tied strongly with the temperature when it gets hotter lots of people head to the beach and coast 1,400 1,200 1, Summer sunshine hours Annual Sunshine hours Avg Annual Avg Summer Summer temp Annual temp Any watersports activity Summer temp Annual temp Any boating activity 7 Weather source: the met office
8 Rainfall (mm) % participation among UK adults Rainfall (mm) % participation among UK adults Rainfall 1, , ,400 1,200 1, ,400 1,200 1, Annual Summer Any watersports activity Annual Summer Any boating activity The summer rainfall has been largely similar over the past 3 years but an increase in the annual rainfall indicates wetter weather outside the peak watersport activity time. This years results suggest that the temperature may have the greatest impact in terms of people participating in watersports This is more likely to affect the casual participant and regular participants are less likely to be put off by wetter or colder weather 8 Data taken from the met office records:
9 Importance of holidays? Number of trips (000s) 80,000 70,000 60,000 50,000 40,000 30,000 20,000 10, Holiday (abroad) VFR (abroad) Holidays (Domestic) VFR (Domestic) Holiday taking abroad has been on the increase since 2012 while holidaying in the UK remains relatively steady From other research that we undertake in the tourism industry, we know that people are being more active on holidays not necessary physical activities, but wanting to fill their time The impact of the Brexit vote has not fed through to the tourism statistics yet to know what the impact will be 9 Data taken from Visit Britain (Great Britain Tourism Survey):
10 CC Index % participation rate CC Index % participation rate Consumer Confidence Consumer confidence index and any activity participation Consumer confidence index and any boating activity participation CC Index Any watersport activity CC Index Any boating activity The consumer confidence index is based on households plans for major purchases and their economic situation, both currently their expectations for the immediate future. Basically measuring how optimistic or pessimistic consumers are. The idea is that if the consumers are optimistic they will tend to purchase more goods and services. Looking at the long term trends however show some correlation, especially when looking at boating participation. The bad news is that consumer confidence is dropping at the end of 2016 with major events causing uncertainty (Brexit, US Election). 10 Data taken from the Organisation for Economic Cooperation and Development
11 Household spend per week ( ) Recreational and Culture Spend In the last few years spend on recreation and culture has risen but watersports participation rates have fallen. Linked to consumer confidence, spending confidence is at a high for the study period and this is reflected in spend on recreation and culture Clothing and footwear Recreation and culture Restaurants and hotels The chart does not show as much shift as the consumer confidence index but there is a levelling out around the time of the recession, with the increase in the last few years showing the confidence coming back to consumers. 11 Data taken from the Office of National Statistics:
12 The Aging Population We have known that the population is getting older as people live longer The chart shows the peaks and troughs of the population profile by age The peaks are getting smaller each time There is currently a trough between the age of 10 and 15 meaning there are fewer children to get into watersports than 10 years ago This could have implications for participation years down the line Population (000's) Females Males 12 Data taken from the Office of National Statistics:


13 Proportion of Boating Participants by Frequency The proportion of casual and enthusiastic boaters has stayed fairly consistent this year. The volume of enthusiasts has remained fairly consistent whereas the volume of casual participants fluctuates much more. 13

14 Trends in Casual Boating Participation Once 2-5 times All graphs show participation in 000s 14


15 Trends in Boating Participation by Frequency times 13+ times All graphs show participation in 000s


16 Participation by Gender Any Boating The table and graph show trends in any boating activity for both genders. After a decrease in male participation last year, 2016 has seen a slight increase. The long term gap between male and female participation continues to show a narrowing trend, with the number of females participating increasing and the number of males decreasing. 16
17 Frequency by Gender Males Females Once 2-5 times 6-12 times 13+ times Sample Once 2-5 times 6-12 times 13+ times Sample % 42.3% 14.4% 12.3% % 34.8% 10.3% 10.5% % 49.4% 21.1% 13.4% % 54.6% 8.1% 9.8% % 44.3% 9.6% 13.1% % 50.8% 6.7% 8.6% % 38.7% 9.2% 14.9% % 40.4% 13.9% 10.2% % 42.5% 8.9% 12.9% % 41.0% 8.0% 6.7% % 42.6% 11.5% 17.6% % 42.6% 8.3% 6.7% % 42.5% 12.8% 12.3% % 39.2% 7.4% 10.4% % 41.9% 12.4% 15.4% % 39.3% 8.5% 10.0% % 38.0% 13.3% 16.4% % 33.9% 8.6% 11.2% % 42.8% 13.1% 17.7% % 40.1% 9.4% 10.7% % 39.5% 15.0% 12.3% % 34.9% 10.4% 11.3% % 45.9% 11.8% 10.0% % 43.5% 7.6% 4.9% % 41.9% 15.3% 12.4% % 45.1% 7.6% 8.5% % 45.3% 11.2% 13.0% % 40.5% 7.0% 8.9% % 40.8% 14.3% 15.5% % 42.5% 7.1% 8.2% % 29.8% 84.6% 15.3% Males 60% 50% 40% 30% 20% 10% 0% Once 2-5 times 6-12 times 13+ times Females 60% Males are more likely to be enthusiasts compared to females with 30% of males participating more than 6 times compared to 15% for females. The percentage of male enthusiasts has increased since last year. The number of both males participating 13+ times has also increased but for females has decreased slightly. 50% 40% 30% 20% 10% 0% Once 2-5 times 6-12 times 13+ times 17


18 Participation by Age Any Boating Participation in any boating activity amongst those over 55 has been steadily increasing since Following last years drop, 2016 has shown an increase in over 55s participation. For the other 2 age groups, the 2016 figures remain very similar to those shown in 2014 and Historically it is the younger age groups that show the most fluctuations but the last few years have stayed fairly consistent. 18

19 Distribution of Participation Any activity distribution of events Boating activity distribution of events For any activity, events occur all around the UK but with a higher distribution on the coast. Inland areas which appear to have a higher frequency are London, Peak District and around Birmingham South East 22% South East 23% London 2% London 4% South West 26% South West 19% North East 5% North East 3% North West 6% North West 11% Yorkshire 4% Yorkshire 5% West Midlands 1% West Midlands 2% East Midlands 4% East Midlands 4% East 9% East 7% Scotland 10% Scotland 10% Wales 9% Wales 9% N Ireland 2% N Ireland 2% 19 For any boating activity the pattern is very similar with the south coast dominating participation. London, Birmingham and the Peak District remain popular but the Lake District and Merseyside area appear more popular as well as the North East coastal region.
20 Seasonal Trends All Activities Spring Summer Autumn Winter March - May June - August September - October December - February All activities Boating activities 24% 25% Boating Activities 8% 53% 8% 51% 16% 16% Good weather in the earlier part of the year means that more activities were recorded in Spring compared to previous years 20 Summer participation still accounts for more than half of all recorded activity
21 Coastal Trends All activities Largely driven by coastal walking and spending leisure time at the beach, the trend for all activities is very much geared towards coastal activity. Boating activities For all boating activities the split continues to fluctuate around 50% inland and coastal. 21
22 Boat Ownership Trends Boat ownership has taken a small decline in Consumer confidence has been declining over the past 3 years, which is likely to impact boat ownership. Canoes and Kayaks remain the most widely owned of all the craft types, which is unsurprising given the lower cost of entry and easier storage options Any boat 2.7% 2.5% 2.7% 2.8% 2.7% 2.7% 2.6% 2.5% Small sailing boat 0.6% 0.5% 0.6% 0.7% 0.6% 0.6% 0.6% 0.5% Sailing yacht 0.3% 0.2% 0.2% 0.2% 0.2% 0.2% 0.2% 0.2% Power boat 0.2% 0.2% 0.2% 0.2% 0.2% 0.2% 0.2% 0.2% Motor boat 0.4% 0.4% 0.4% 0.3% 0.2% 0.3% 0.3% 0.2% Canal boat 0.1% 0.1% 0.1% 0.2% 0.1% 0.1% 0.1% 0.1% Canoe/kayak 0.9% 0.9% 1.0% 1.1% 1.1% 1.2% 1.2% 1.2% Rowing boat 0.1% 0.1% 0.1% 0.2% 0.1% 0.1% 0.1% 0.1% RIBs/Inflatables or sportsboats 0.2% 0.1% 0.3% 0.2% 0.2% 0.1% 0.1% 0.1% Windsurfer 0.3% 0.3% 0.3% 0.2% 0.2% 0.2% 0.2% 0.2% Personal Watercraft 0.1% 0.1% 0.1% 0.2% 0.1% 0.1% 0.1% 0.1%
23 Boat Ownership Trends - Detailed Number of boats owned by households Number of boat owning households % kept in the UK Number of boats owned by households Number of boat owning households % kept in the UK Number of boats owned by households Number of boat owning households % kept in the UK Number of boats owned by households Number of boat owning households % kept in the UK Any boat 1,163, ,176 92% 1,214, ,530 95% 1,130, ,644 95% 1,147, ,268 95% Small sailing boat 201, ,866 92% 204, ,431 95% 178, ,017 93% 171, ,821 95% Sailing yacht 66,510 61,211 95% 54,246 50,540 95% 58,110 55,227 92% 52,266 49,607 93% Power boat 52,788 45,390 77% 46,550 44,903 86% 44,540 44,540 92% 45,193 41,243 84% Motor boat 68,066 65,324 93% 82,799 78,573 95% 80,249 72,502 92% 83,798 73,863 88% Canal boat 37,607 36,423 90% 28,814 28,814 97% 33,056 30, % 27,917 25,780 97% Canoe/kayak 512, ,823 94% 573, ,717 96% 530, ,320 97% 547, ,163 98% Rowing boat 42,366 36,834 87% 41,450 33,868 91% 42,542 33,942 94% 45,330 37,469 94% RIBs/Inflatables or sportsboats 54,285 45,483 94% 47,086 39,187 92% 37,069 31,988 98% 34,962 29,549 93% Windsurfer 86,180 54,245 91% 100,917 54,953 93% 90,619 46,430 91% 104,381 46,847 96% Personal Watercraft 42,070 30,989 83% 34,008 24,357 89% 35,006 23,081 93% 34,633 25,901 91% There continues a trend of the falling number of households owning a boat. However, the number of boats owned per household has remained relatively consistent over previous years. 1,147,265 boats were recorded per year on average for the years 2014 to An increase of approximately 17,000 on the earlier 3 year period. Canoes and kayak continue to be the most popular of the boats, making up 48% of ownership (roughly the same figure for and ). 23
24 Boat Ownership by Activity Myself Family/ Friends Charter/ Hire Club/ Training/ Corporate owned Small sail boat racing 44% 48% 3% 5% 190 Small sail boat activities 32% 45% 8% 15% 372 Yacht racing 32% 49% 10% 8% 150 Yacht cruising 32% 44% 21% 3% 266 Power boating 27% 49% 8% 15% 282 Motor Boating 23% 56% 13% 8% 457 Canal boating 21% 45% 28% 6% 528 Canoeing/Kayaking 37% 36% 13% 15% 679 Rowing/Sculling 15% 39% 10% 36% 288 Windsurfing 39% 37% 4% 20% 217 Water Skiing/ Wakeboarding 16% 57% 6% 20% 250 Personal Watercraft 32% 50% 13% 6% 259 Base For almost all of the activities, going on a friend or family member s boat was most popular. However, for canoeing/ kayaking and windsurfing they were more likely to have done the activity on their own boat. Rowing/ sculling was the activity most likely to be carried out using a club/ training or corporate owned boat. 60% Myself Family/ Friends Charter/ Hire Club/ Training/ Corporate owned 50% 40% 30% 20% 10% 0% Small sail boat racing Small sail boat activities Yacht racing Yacht cruising Power boating Motor Boating Canal boating Canoeing/Kayaking Rowing/Sculling Windsurfing Water Skiing/ Wakeboarding Personal Watercraft 24


25 Proportion of Training After a steady decline in training for any activity since 2013, this year has seen an increase, with 60% of people having some sort of training. Over previous years the activities that have been included in this question have changed which may explain the fluctuation. The 12 core boating activities though have been asked consistently since These proportions show a much more level trend with around 65% of people having done some sort of training has seen an increase in the number of boaters with training, but a slight drop in the percentage of people who have had more than 2 days training since last year. 25


26 Proportion of Participants with Training Training continues to differ among activities, with between 43% and 90% of people having had some form of training across different activities. Racing activities, diving and windsurfing had the highest percentage of trained participants. Windsurfers were likely to have received less than 1 day of training, the others were more likely to have received training of more than 2 days. 26


27 Awareness of Public Safety Messages When asked about public safety messages, 20% said they recalled seeing some sort of message, with a further 17% not sure. Of the messages collected the main component was around the use of lifejackets, as shown by the word cloud above. This accounted for over 10% of all messages people could remember. Over half of people who remembered a message said that they heard it (or thought they had heard it) from the RNLI. The Coast Guard and Life Guards were also a common source of safety messages 27


28 Proportion using Lifejackets whilst Boating When taking part in any activity 73% wear a lifejacket at least some of the time. This figure is up on 2015, where 69% wore a lifejacket. In terms of any boating activity the figure stands at 86%. The general trend for lifejacket usage whilst boating has been in slight decline since Although the overall proportion has only fallen slightly (down 3% points). This year has seen an increase in the proportion of people wearing a life jacket all the time. 28

29 Proportion using Lifejackets whilst Participating As with 2015, we can see that lifejackets are used most often for sailing and power boating activities. This is especially true during racing events 92% of people using personal watercrafts will also wear lifejackets. When participating in surfing and angling activities people are least likely to wear a life jacket For the majority of activities, participants who are wearing lifejackets are wearing them all the time. However when freshwater angling, coasteering, canal boating and yacht cruising if people are wearing lifejackets this is likely to only be for some of the time. 29
30 Other Activities - Overview Swimming (indoor) Hill Walking/ Rambling 54% 61% 68% 66% As in previous years, the list of most common other sports participated in remains consistent Cycling Gym Jogging/ Running Raquet Sports Team Sports Mountaineering/ Climbing Golf Snowsports 21% 19% 15% 13% 18% 12% 31% 31% 31% 27% 43% 41% 53% 55% 51% 64% Indoor Swimming is the most common pursuit undertaken by anybody participating in a watersports activity and those participating in any boating activity Besides swimming the 4 other popular activities are also the same as last year: hill walking, cycling, going to the gym and jogging Horse Riding Orienteering Triathlon 9% 5% 7% 2% 13% 13% All of these extra activities are taken part in more by those who participate in any boating activity 30 0% 10% 20% 30% 40% 50% 60% 70% Any Boating Activity Any Watersports Activity
31 When Most Common Other Activities are Participated In Cycling Swimming (indoor) Hill Walking/ Rambling Small Sail Boat Racing 46.9% 56.9% 41.0% 17.5% 22.2% 51.3% 33.2% 28.2% 42.0% 58.8% 36.1% 14.8% Small Sail Boat Activities 47.5% 55.4% 31.8% 15.9% 56.2% 53.9% 40.4% 32.3% 48.0% 48.3% 29.5% 15.5% Yacht Racing / Yacht Cruising 44.6% 46.4% 31.8% 16.9% 42.8% 36.5% 30.6% 24.1% 40.4% 50.5% 23.0% 13.5% Power Boating 39.6% 50.8% 26.4% 11.7% 46.1% 44.2% 33.5% 24.5% 27.5% 33.0% 18.2% 11.7% Motor Boating 38.7% 46.6% 23.2% 10.6% 43.6% 47.0% 31.5% 26.9% 39.3% 48.0% 24.4% 12.1% Canal Boating 44.0% 55.9% 31.5% 18.2% 47.9% 53.4% 35.0% 27.7% 41.0% 51.7% 25.5% 9.1% Rowing 56.0% 57.8% 34.0% 17.9% 47.6% 46.3% 32.4% 28.0% 49.9% 50.3% 29.1% 16.2% Canoeing 55.7% 65.3% 39.8% 22.8% 50.0% 52.1% 33.6% 30.2% 49.2% 54.1% 31.5% 17.1% Windsurfing / Kitesurfing 51.1% 61.1% 35.8% 21.2% 36.8% 33.9% 26.8% 23.5% 38.3% 40.9% 26.8% 12.9% Water Skiing / Personal Watercraft 60.3% 60.1% 32.7% 17.6% 48.8% 52.4% 36.5% 32.9% 40.5% 35.5% 24.9% 12.6% Surfing / Body Boarding / Paddle Boarding 51.7% 59.1% 31.4% 7.9% 34.9% 43.4% 19.0% 21.7% 47.9% 54.6% 36.5% 20.5% Freshwater Angling 34.3% 40.6% 21.5% 15.3% 41.7% 44.8% 25.8% 21.7% 34.0% 46.5% 26.2% 6.4% Recreational Seafishing / Sea Angling 39.6% 37.7% 26.3% 21.3% 37.0% 41.6% 18.8% 13.9% 22.0% 24.0% 12.5% 8.6% Cliff Climbing / Coasteering 38.3% 65.6% 19.4% 6.0% 45.9% 59.1% 44.9% 31.7% 48.5% 55.6% 24.7% 11.5% Coastal Walking 40.1% 41.4% 26.6% 16.7% 43.0% 48.6% 30.9% 27.0% 45.5% 52.5% 30.8% 16.0% Leisure Time at the Beach 30.7% 35.6% 17.4% 11.0% 41.8% 40.3% 27.0% 20.3% 26.4% 34.9% 17.4% 10.5% Leisure Sub-aqua Diving 36.8% 38.0% 17.3% 1.9% 36.8% 55.8% 38.3% 20.1% 43.1% 24.4% 33.6% 12.5% 31 Outdoor Swimming 40.0% 46.5% 24.5% 13.2% 44.5% 51.6% 35.0% 30.3% 34.1% 38.5% 17.7% 9.7%


32 This years report has been funded by: Royal Yachting Association British Marine Royal National Lifeboat Institution British Canoeing Maritime and Coastguard Agency Centre for Environment Fisheries and Aquaculture Science 32
Watersports Participation Survey 2015 Executive Summary
 Watersports Participation Survey 2015 Executive Summary Introduction The research has been continuously conducted by Arkenford since 2002 with BMF and RYA our original partners, MCA and RNLI joining in
Watersports and Leisure Participation Survey 2006 BMF, MCA, RNLI and RYA, sponsored by Sunsail
 Watersports and Leisure Participation Survey 2006 Page 1 of 37 Watersports and Leisure Participation Survey 2006 BMF, MCA, RNLI and RYA, sponsored by Sunsail The Old Coach House Wharf Road Guildford Surrey
Watersports and Leisure Participation Report 2009 Page 1 of 64
 Watersports and Leisure Participation Survey 2009 Brought to you by: Sponsored by: Watersports and Leisure Participation Report 2009 Page 1 of 64 Foreword By Paul Bayliss, RYA In this the eighth year of
Welcome to Scotland's Marine Tourism and Recreation Survey
 Welcome to Scotland's Marine Tourism and Recreation Survey The way Scotland's seas and coasts are managed is changing. Marine Scotland, the Scottish Government body with responsibility for managing Scotland's
2014 Life Jacket Wear Rate Observation Study featuring National Wear Rate Data from 1999 to 2014
 2014 Life Jacket Wear Rate Observation Study featuring National Wear Rate Data from 1999 to 2014 Produced under a grant from the Sport Fish Restoration and Boating Trust Fund, administered by the U.S.
National Survey for Wales Key Facts for Policy and Practice
 National Survey for Wales 2016-17 Key Facts for Policy and Practice Outdoor Recreation This bulletin describes the main findings of the Outdoor Recreation section of the 2016-2017 National Survey for Wales.
BASKETBALL. Sport & Active Recreation Profile FINDINGS FROM THE 2013/14 ACTIVE NEW ZEALAND SURVEY ACTIVE NEW ZEALAND SURVEY SERIES.
 ACTIVE NEW ZEALAND SURVEY SERIES Te Rangahau Korikori o Aotearoa Sport & Active Recreation Profile BASKETBALL FINDINGS FROM THE 2013/14 ACTIVE NEW ZEALAND SURVEY www.sportnz.org.nz Introduction Content
Recreation. Participation. Topline Report
 Outdoor Recreation Participation Topline Report 2011 Ages 6 + 2010 Outdoor Participation 10.1 Billion Outdoor Outings 73 Average Outings Per Participant Participation in outdoor recreation in 2010 remained
Appendix 21 Sea angling from the shore
 Appendix 21 Sea angling from the shore LUC SMRTS2015 Final Report 342 March 2016 Appendix 21 Sea angling from the shore Table A21.1: Summary of sample confidence levels Responses Spatial data Questionnaire
The British Marine Industry
 The British Marine Industry Howard Pridding Chief Executive British Marine Federation What I will cover BMF Breadth & diversity of sector State of the industry & trends Increasing participation Surviving
Sports Participation in Scotland 2007 Research Digest no. 108
 Sports Participation in Scotland 2007 Research Digest no. 108 Published by: sportscotland Caledonia House, South Gyle Edinburgh, EH12 9DQ Tel: 0131 317 7200 www.sportscotland.org.uk ISBN 1 85060 546 1
Irish Water Safety Consumer Research Survey. March 2017
 Irish Water Safety Consumer Research Survey March 2017 Irish Water Safety Survey EXECUTIVE SUMMARY OVERVIEW The majority of survey respondents (68%) appreciate highly the necessity of swimming as a life
Domestic Energy Fact File (2006): Owner occupied, Local authority, Private rented and Registered social landlord homes
: Owner occupied, Local authority, Private rented and Registered social landlord homes") Domestic Energy Fact File (2006): Owner occupied, Local authority, Private rented and Registered social landlord homes Domestic Energy Fact File (2006): Owner occupied, Local authority, Private rented
Domestic Energy Fact File (2006): Owner occupied, Local authority, Private rented and Registered social landlord homes Domestic Energy Fact File (2006): Owner occupied, Local authority, Private rented
INTRODUCING GOLF TOURISM TRENDS IN GOLF TOURISM. How much do international golf tourists spend on their trip in New Zealand?
 Tourists INTRODUCING GOLF TOURISM This report provides an overview of golf tourism in New Zealand including trends and characteristics of international golf tourists. is a popular tourist activity. New
Appendix 22 Sea angling from a private or chartered boat
 Appendix 22 Sea angling from a private or chartered boat LUC SMRTS2015 Final Report 359 March 2016 Appendix 22 Sea angling from a private or chartered boat Table A22.1: Summary of sample confidence levels
Appendix 13 Rowing and sculling in the sea
 Appendix 13 Rowing and sculling in the sea Steve Thompson SMRTS2015 Final Report 251 March 2016 Appendix 13 Rowing and sculling in the sea Table A13.1: Summary of sample confidence levels Responses Spatial
Appendix 9 SCUBA diving in the sea
 Appendix 9 SCUBA diving in the sea Firth of Clyde Forum SMRTS2015 Final Report 195 March 2016 Appendix 9 SCUBA diving in the sea Table A9.1: Summary of sample confidence levels Responses Spatial data Questionnaire
Participation: Once a week for 30 minutes at moderate intensity
 Participation: Once a week for 30 minutes at moderate intensity Pivotal to Sport England's 2008-11 strategy is the funding and delivery of national governing bodies of sport (NGBs). NGBs contribute to
CYCLING & MOUNTAIN BIKING FINDINGS FROM THE 2013/14 ACTIVE NEW ZEALAND SURVEY. Sport & Active Recreation Profile ACTIVE NEW ZEALAND SURVEY SERIES
 ACTIVE NEW ZEALAND SURVEY SERIES Te Rangahau Korikori o Aotearoa Sport & Active Recreation Profile CYCLING & MOUNTAIN BIKING FINDINGS FROM THE 2013/14 ACTIVE NEW ZEALAND SURVEY www.sportnz.org.nz Introduction
Adventurous Activity Permit Scheme - Approved Assessors
 Adventurous Activity Permit Scheme - Approved Assessors S Item Code FS120104 Jun/08 Edition no 2 0845 300 1818 Introduction This factsheet provides a guide to those wishing to become an Approved Assessor
Once a week participation in individual (funded) sports
 sports") Once a week participation in individual (funded) sports Sport England monitors the level of participation in individual sports. As well as overall strategy and insight, this information also underpins
Once a week participation in individual (funded) sports Sport England monitors the level of participation in individual sports. As well as overall strategy and insight, this information also underpins
Evaluation of Swim Safe
 Evaluation of Swim Safe Sponsor: RNLI Community Safety Team and Swim England (previously known as the Amateur Swimming Association) Department: RNLI Operations Research Unit Date started: June 216 Date
Participation Topline Report 2012
 outdoor recreation Participation Topline Report 2012 Ages 6 + 2011 Outdoor Participation 11.6 Billion Outdoor Outings 81.9 Average Outings Per Participant In 2011, outdoor recreation among Americans reached
OUTDOOR RECREATION PARTICIPATION REPORT TOPLINE 2013
 OUTDOOR RECREATION PARTICIPATION REPORT TOPLINE 2013 Ages 6+ OUTDOOR PARTICIPATION 12.4 Outdoor Outings 87.4 Average Outings Per Participant More Americans participated in outdoor recreation in than in
INDUSTRY STATISTICS & RESEARCH RECREATIONAL BOATING. Statistical Abstract $950
 INDUSTRY STATISTICS & RESEARCH 2010 RECREATIONAL BOATING Statistical Abstract $950 2010 RECREATIONAL BOATING Statistical Abstract 2011 NATIONAL MARINE MANUFACTURERS ASSOCIATION The entire content of this
Paddlesports Kayaking Canoeing. A Partnership Project of:
 A Special Report on Paddlesports 2009 Kayaking Canoeing Rafting A Partnership Project of: PADDLESPORTS Paddlesports Paddlesports offer some of the most diverse outdoor experiences of any nature-based activity
Sport & Active Recreation Profile JOGGING & RUNNING FINDINGS FROM THE 2013/14 ACTIVE NEW ZEALAND SURVEY ACTIVE NEW ZEALAND SURVEY SERIES
 ACTIVE NEW ZEALAND SURVEY SERIES Te Rangahau Korikori o Aotearoa Sport & Active Recreation Profile JOGGING & RUNNING FINDINGS FROM THE 2013/14 ACTIVE NEW ZEALAND SURVEY www.sportnz.org.nz Introduction
Figure 39. Yearly Trend in Death Rates for Drowning: NSW, Year
 10.0 DROWNING 10.1 Deaths due to Drowning: The drowning death rate showed a statistically significant decrease between 199 and 1999 (Figure 39). Between 199 and 1999, 46 people died from drowning, at a
Canoeing and kayaking audience profiling
 RNLI Research Project ID: 12-13b Canoeing and kayaking audience profiling Sponsor: RNLI Coastal Safety Department: RNLI Operations Research Unit Date started: September 2013 Date completed: October 2013
COMMUNITY LIFESAVING PLAN
 COMMUNITY LIFESAVING PLAN OUR AIM Whilst this may sound clichéd, our overall aim is to end the loss of life and to reduce the number incidents in the Cowes area. We will do this by working with the community
Briefing Paper #1. An Overview of Regional Demand and Mode Share
 2011 Metro Vancouver Regional Trip Diary Survey Briefing Paper #1 An Overview of Regional Demand and Mode Share Introduction The 2011 Metro Vancouver Regional Trip Diary Survey is the latest survey conducted
BRC/Springboard Footfall Monitor September 2014 Covering the five weeks 31 August October 2014
 Strictly Embargoed until 00.01 hrs Monday 20 October 2014 OUT-OF-TOWN FOOTFALL CONTINUES POSITIVE TREND UK Total Retail Footfall* % change year-on-year High Street Out-of- Town Shopping Centre Summary
UK water related fatalities 2011
 UK water related fatalities 0 Water Incident Database Report December 0 UK water related fatalities 0 WAID FATALITIES REPORT 0 This report is the first release of WAID fatality information for 0 and it
How to Generate Enthusiasm for Boating!
 How to Generate Enthusiasm for Boating! Profile of a Boating Enthusiast Emmanuel Allot: nearly 60 years old Started sailing with family as a child Professional skipper for 10 years: Turkey, Greece Crossed
TYPES OF CYCLING. Figure 1: Types of Cycling by Gender (Actual) Figure 2: Types of Cycling by Gender (%) 65% Chi-squared significance test results 65%
 Figure 2: Types of Cycling by Gender (%) 65% Chi-squared significance test results 65%") TYPES OF CYCLING 1,980 responses were received to this question (multiple answers were allowed), 727 female (41%) and 1,242 (71%) from male respondents. The most common responses for both genders were
TYPES OF CYCLING 1,980 responses were received to this question (multiple answers were allowed), 727 female (41%) and 1,242 (71%) from male respondents. The most common responses for both genders were
Boating Activity-Specific Plan
 Boating Activity-Specific Plan Camp Name: Prepared By: Phone number: Signature: Date: Enter a date. Title: Email: Complete the following plan for each boating activity that campers participate in. Use
Affiliated Club Membership Survey 2014 Insights (England)
") Affiliated Club Membership Survey 2014 Insights (England) Version 1.0 April 2015 1 Introduction RYA Affiliated Club Membership Insight Pack Within the RYA Sport Development team we are passionate about
Affiliated Club Membership Survey 2014 Insights (England) Version 1.0 April 2015 1 Introduction RYA Affiliated Club Membership Insight Pack Within the RYA Sport Development team we are passionate about
Golfers in Colorado: The Role of Golf in Recreational and Tourism Lifestyles and Expenditures
 Golfers in Colorado: The Role of Golf in Recreational and Tourism Lifestyles and Expenditures by Josh Wilson, Phil Watson, Dawn Thilmany and Steve Davies Graduate Research Assistants, Associate Professor
Waterways for Everyone the Government s strategy for the inland waterways of England and Wales
 Inland Waterways Team Department for Environment, Food and Rural Affairs Zone 2D, Ergon House 17 Smith Square London SW1P 3JR RYA House Ensign Way, Hamble Southampton SO31 4YA United Kingdom Tel +44 (0)23
WALKING. Sport & Active Recreation Profile FINDINGS FROM THE 2013/14 ACTIVE NEW ZEALAND SURVEY ACTIVE NEW ZEALAND SURVEY SERIES.
 ACTIVE NEW ZEALAND SURVEY SERIES Te Rangahau Korikori o Aotearoa Sport & Active Recreation Profile WALKING FINDINGS FROM THE 213/14 ACTIVE NEW ZEALAND SURVEY www.sportnz.org.nz Introduction Content This
Executive Summary of Recreational Boating Participation Research
 Executive Summary of Recreational Boating Participation Research May 2017 Table of Contents Table of Contents... 2 Introduction... 3 Background... 3 Conclusions and Recommendations... 4 Increasing Lifejacket
RIVER ACCESS STRATEGY RIVER USAGE AND ATTITUDES BASELINE ONLINE SURVEY SUMMARY REPORT
 RIVER ACCESS STRATEGY RIVER USAGE AND ATTITUDES BASELINE ONLINE SURVEY JUNE 2014 RIVER ACCESS STRATEGY RIVER USAGE AND ATTITUDES SURVEY BACKGROUND The North Saskatchewan River Valley is one of North America
Memorandum. To: City Council. cc: Tony Piasecki, City Manager Date: 3/3/2016. Introduction
 I Memorandum 211 To: City Council From: Joe Dusenbury, Harbormaster cc: Tony Piasecki, City Manager Date: 3/3/2016 Re: City Government 101 -The Marina Introduction Staff is presenting this material as
MARKET SEGMENTATION PROFILE EXECUTIVE SUMMARY
 MARKET SEGMENTATION PROFILE EXECUTIVE SUMMARY February 18, 2011 Research Objectives 2 Achieving significant gains in fishing and boating participation is going to require reaching new audiences with new
Surfing Tourism Destination Feasibility Study, Kincardine, Ontario
 Surfing Tourism Destination Feasibility Study, Kincardine, Ontario Prepared for: Regional Tourism Organization 7 and the February 24, 2014 EXECUTIVE SUMMARY With support from the Regional Tourism Organization
SPECIAL REPORT ON FISHING AND BOATING. A partnership. project of:
 A partnership project of: SPECIAL REPORT ON FISHING AND BOATING 2013 CONTENTS Executive Summary.... 1 Fishing.... 3 Freshwater Fishing.... 17 Saltwater Fishing.... 21 Fly Fishing.... 25 Youth, A Focused
North Kitsap Trails Association: String of Pearls Trails Survey Results July 13, 2010
 North Kitsap Trails Association: String of Pearls Trails Survey Results July 13, 2010 Who Responded to the Survey and Where Do They Live? The NKTA String of Pearls Trails Survey was completed online using
Satisfaction with the quality of the sporting experience survey (SQSE 4) Drop out survey report. October 2012
 Drop out survey report. October 2012") Satisfaction with the quality of the sporting experience survey (SQSE 4) Drop out survey report October 2012 Creating sporting opportunities in every community Survey information 2 This report covers the
Satisfaction with the quality of the sporting experience survey (SQSE 4) Drop out survey report October 2012 Creating sporting opportunities in every community Survey information 2 This report covers the
Twin Cities Life-Jacket Wear-Rate Observational Study, 2007
 Twin Cities Life-Jacket Wear-Rate Observational Study, 2007 Minnesota Department of Natural Resources July 2008 Twin Cities Life-Jacket Wear-Rate Observational Study, 2007 Twin Cities Metro Lake Region
The Value of the Watersports Economy in North Devon
 The Value of the Watersports Economy in North Devon July 2009 Acknowledgements This study would not have been possible without the help of watersports businesses, watersports clubs and local agencies who
CENTER OF KNOWLEDGE RECREATIONAL BOATING. Statistical Abstract $1,500
 CENTER OF KNOWLEDGE 2013 RECREATIONAL BOATING Statistical Abstract $1,500 2013 RECREATIONAL BOATING Statistical Abstract 2014 NATIONAL MARINE MANUFACTURERS ASSOCIATION The entire content of this report
A RE-CAP. Scottish Golf Roadshow
 A RE-CAP Scottish Golf Roadshow A seminar to explore what the future holds for your golf club Introductions Iain Evans John Kemp Claire Middleton - SG Development Officer (East) - SG Development Officer
Sport & Active Recreation Regional Profile NORTHLAND REGION FINDINGS FROM THE 2013/14 ACTIVE NEW ZEALAND SURVEY
 Sport & Active Recreation Regional Profile NORTHLAND REGION FINDINGS FROM THE 2013/14 ACTIVE NEW ZEALAND SURVEY Citation Sport New Zealand. (2015). Sport and Active Recreation Regional Profile: Northland
Drownings in Hawaii, A review of death certificates by the Injury Prevention and Control Program, Hawaii DOH
 Drownings in Hawaii, 99-97. A review of death certificates by the Injury Prevention and Control Program, Hawaii DOH There were 6 drownings in the state over the 5-year period, with no apparent trend over
INTERNATIONAL GOLF TRAVEL MARKET 2017
 INTERNATIONAL GOLF TRAVEL MARKET 2017 EUROPEAN GOLF TOURISM TRENDS & SPOTLIGHT ON FRANCE ORGANISED BY REED TRAVEL EXHIBITIONS 15/3/1815/3/18 IGTM 2017 EUROPEAN GOLFER SURVEY Background: With the partnership
Merseyside Road Safety Partnership s Annual Road Traffic Casualties Report 2015
 Merseyside Road Safety Partnership s Annual Road Traffic Casualties Report 2015 Contents 1. Overview of KSI s 2 2. Cyclists 4 3. Motorcyclists 8 4. Senior Road Users 10 5. Pedestrians 14 6. Car Drivers
May Canal Cordon Report 2017
 May 2018 Canal Cordon Report 2017 Report on trends in mode share of vehicles and people crossing the Canal Cordon to 2017 2 Analysis of trends in mode share of people crossing the canal cordon - 2017 Contents
Regional Spread of Inbound Tourism
 Regional Spread of Inbound Tourism Foresight issue 157 VisitBritain Research 1 Contents Introduction Summary Key metrics by UK area Analysis by UK area Summary of growth by UK area Scotland Wales North
Marine fishing tourism in Norway. Structure and economic effects
 Marine fishing tourism in Norway Structure and economic effects 29.09.2015 1 Icelandic friends Claudia master thesis «Warm» friendships 29.09.2015 5 Coastal tourism in Norway Marine tourism in Norway
2002 National Recreational Boating Survey Report
 2002 National Recreational Boating Survey Report November 30, 2003 995 Goodale Blvd. Columbus, OH 43212 Voice: (614) 220-8860 Fax: (614) 220-8845 Toll-Free Number: (800) 341-3660 Website: www.strategicresearchgroup.com
Leisure activities. Leisure Activities
 Leisure Activities Martinhal Beach Resort & Hotel is the natural family friendly escape for those who want the very best in beachside accommodation alongside an almost endless array of sports and activities.
Water Safety (Incorporating Life Jackets and Buoyancy Aids)
") Water Safety (Incorporating Life Jackets and Buoyancy Aids) s Item Code FS120603 Mar/11 Edition no 8 (103914) 0845 300 1818 Introduction This factsheet provides the requirements for buoyancy aids and lifejackets
Water Safety (Incorporating Life Jackets and Buoyancy Aids) s Item Code FS120603 Mar/11 Edition no 8 (103914) 0845 300 1818 Introduction This factsheet provides the requirements for buoyancy aids and lifejackets
2017 Drowning Prevention Report (Provisional)
") 2017 Drowning Prevention Report (Provisional) Introduction 12 January 2017 Drowning is the respiratory impairment of lungs due to submersion / immersion in liquid. It can be fatal (mortality), or non-fatal
2017 Drowning Prevention Report (Provisional) Introduction 12 January 2017 Drowning is the respiratory impairment of lungs due to submersion / immersion in liquid. It can be fatal (mortality), or non-fatal
The Role of the Canal & River Trust Fisheries & Angling Team
 The Role of the Canal & River Trust Fisheries & Angling Team Britain s Canals Arteries of the world s first Industrial Revolution Most built 1770-1850 up to 4,000 miles at their peak Shaped British society,
The 2001 Economic Benefits of Hunting, Fishing and Wildlife Watching in MISSOURI. Prepared by:
 The 2001 Economic Benefits of Hunting, Fishing and Wildlife Watching in MISSOURI Prepared by: Southwick Associates, Inc. PO Box 6435 Fernandina Beach, FL 32035 Ph (904) 277-9765 Fax (904) 261-1145 Email:
Sport & Active Recreation Regional Profile WELLINGTON REGION FINDINGS FROM THE 2013/14 ACTIVE NEW ZEALAND SURVEY
 Sport & Active Recreation Regional Profile WELLINGTON REGION FINDINGS FROM THE 2013/14 ACTIVE NEW ZEALAND SURVEY Citation Sport New Zealand. (2015). Sport and Active Recreation Regional Profile: Wellington
European Golf Statistics 2017
 European Golf Statistics 2017 Leading the Business of Golf Photo by Aidan Bradley Distribution of registered golfers over the last year: Male golfers: 66% Female golfers: 25% Junior golfers: 9% Total number
Football factsheet Football is the most popular team sport for women October 2012
 Football factsheet Football is the most popular team sport for women October 2012 The number of women who take part at least once a month 252,000 Just 5.6 % of all club members are women % of women who
Population & Demographics
 Population & Demographics Conditions and Trends When looking at trends in the total number of people living in Windham (population) and at the characteristics of the people who live here by factors such
The Role of the Canal & River Trust Fisheries & Angling Team
 The Role of the Canal & River Trust Fisheries & Angling Team Britain s Canals Arteries of the world s first Industrial Revolution Most built 1770-1850 up to 4,000 miles at their peak Shaped British society,
TOUR DE FRANCE GRAND DÉPART YORKSHIRE
 TOUR DE FRANCE GRAND DÉPART YORKSHIRE Economic Impact Assessment Report for Calderdale Metropolitan Borough Council New Economy www.neweconomymanchester.com 28 September 2012 New Economy 1 1 Introduction
Adventure Activities - sources of written good practice information
 Adventure Activities - sources of written good practice information This table is designed to help inform people of sources of written good practice information. It may be updated from time to time. If
Coastal and marine recreation in New England is ingrained in the region s economic and
 RECREATION Coastal and marine recreation in New England is ingrained in the region s economic and social fabric. Recreation on the ocean and coast includes many of New Englanders most time-honored and
Angling in Manitoba Survey of Recreational Angling
 Angling in Manitoba 2005 Survey of Recreational Angling TABLE OF CONTENTS Page Introduction 1 Angler Profile 2 Angling Effort 6 Catch and Harvest 9 Angling Expenditures 11 Bait Use 14 Canadian and Nonresident
A Threatened Bay: Challenges to the Future of the Penobscot Bay Region and its Communities
 A Threatened Bay: Challenges to the Future of the Penobscot Bay Region and its Communities 1 A A Threatened Bay: Challenges to the Future of the Penobscot Bay Region and its Communities In 1996 the Island
YOUR GUIDE TO A SOUTH BETHANY, DELAWARE VACATION Shhhhhhhh... the quietest beach resort
 YOUR GUIDE TO A SOUTH BETHANY, DELAWARE VACATION Shhhhhhhh.... the quietest beach resort South Bethany is a great place to spend your summer vacation, long holiday weekends, or anytime throughout the year!
The Outdoor Foundation 4909 Pearl East Circle, Suite 200, Boulder, CO
 Outdoor Recreation Participation 2009 Topline Report The Outdoor Foundation 4909 Pearl East Circle, Suite 200, Boulder, CO 80301 303.444.3353 www.outdoorfoundation.org Methodology During January 2009/early
WHAT CAN WE LEARN FROM COMPETITION ANALYSIS AT THE 1999 PAN PACIFIC SWIMMING CHAMPIONSHIPS?
 WHAT CAN WE LEARN FROM COMPETITION ANALYSIS AT THE 1999 PAN PACIFIC SWIMMING CHAMPIONSHIPS? Bruce Mason and Jodi Cossor Biomechanics Department, Australian Institute of Sport, Canberra, Australia An analysis
Fast Facts: Recreational Scuba Diving and Snorkeling
 Fast Facts: Recreational Scuba Diving and Snorkeling There are between 2.7 to 3.5 million active scuba divers in the US with as many as 6 million active scuba divers worldwide (Source: Sports and Fitness
Appendix H Recreation and Tourism (Chapter 8) Contents. List of Tables
 Contents. List of Tables") Appendix H Recreation and Tourism (Chapter 8) Contents Trends Data... H-2 CA DMV records... H-2 CA DFG Hunting/Fishing Licenses... H-2 USDA Agricultural Tourism... H-4 United States Forest Service... H-6
Appendix H Recreation and Tourism (Chapter 8) Contents Trends Data... H-2 CA DMV records... H-2 CA DFG Hunting/Fishing Licenses... H-2 USDA Agricultural Tourism... H-4 United States Forest Service... H-6
Outdoor Participation Report 2013
 Outdoor Participation Report 2013 2013 Outdoor Recreation Participation Introduction... 4 Outdoor Participation... 7 Active Lifestyles... 25 Youth... 33 Diversity... 45 A Detailed Look... 55 Acknowledgements...
Recreational Boating Feasibility and Capacity Study
 TOURISTICS + Shoreplan Engineering Limited were retained by: Town of Oakville; City of Burlington; and Regional Municipality of Halton. Note: Throughout the presentation boat lengths are identified in
Research. 20mph survey. Drivers opinions of 20mph speed limits
 Research 20mph survey Drivers opinions of 20mph speed limits About the IAM The IAM (Institute of Advanced Motorists) is the UK s largest independent road safety charity, dedicated to improving standards
2015 Victorian Road Trauma. Analysis of Fatalities and Serious Injuries. Updated 5 May Page 1 of 28. Commercial in Confidence
 2015 Victorian Road Trauma Analysis of Fatalities and Serious Injuries Updated 5 May 2016 Page 1 of 28 Commercial in Confidence VICROADS_n3445896_2015_Victorian_Trauma_Report_- _updated_may_2016.docx 2015
A Snapshot of the Canoeing & Kayaking Travel Market in North America
 A Snapshot of the Canoeing & Kayaking Travel Market in North America Prepared for the: Canadian Tourism Commission By: Judy Rogers Research Resolutions & Consulting Ltd. Ottawa June, 2003 A Snapshot of
Boat Owners Survey April 2016
 Boat Owners Survey 2016 April 2016 Introduction and methodology Background Objective is to refresh the Canal & River Trust s understanding of the experiences, opinion, behaviours and preferences of licenced
Maine Office of Tourism Visitor Tracking Research 2012 Calendar Year Annual Report Regional Insights: Kennebec & Moose River Valley
 Maine Office of Tourism Visitor Tracking Research 2012 Calendar Year Annual Report Regional Insights: Prepared by April 2013 1 1 Introduction and Methodology 2 The Maine Office of Tourism has commissioned
IT S OLYMPIC YEAR! OF SPORT
 IT S OLYMPIC YEAR! SUMMER OF SPORT MULTI SPORT SWIMMING AQUA ACTIVITIES WATERSPORTS GYMNASTICS TRAMPOLINING ARTS & CRAFTS ACTIVITIES FOR BOYS AND GIRLS OF ALL ABILITIES AGED 3-16 salfordcommunityleisure.co.uk/sport
DRAGON. Palmer Johnson Yachts 41.50m / Guests.
 Palmer Johnson Yachts 41.50m / 136 2 2007 12 Guests. SPECIFICATIONS Length: 41.50m / 136 2 Beam: 8.4m / 27 7 Draft: 1.8m / 5 10 Built: 2007 Builder: Palmer Johnson Yachts ACCOMODATION Number of Cabins:
Paddlesports. Kayaking Canoeing Rafting Stand up paddling. A Partnership Project of:
 2014 Special Report on Paddlesports Kayaking Canoeing Rafting Stand up paddling A Partnership Project of: PADDLESPORTS Paddlesports A record number of Americans enjoyed paddlesports in 2013. Whether kayaking
Angling in Manitoba (2000)
") Angling in Manitoba (2000) TABLE OF CONTENTS Page Introduction 1 Angler Profile 2 Angling Effort 7 Catch and Harvest 10 Angling Expenditures 13 Bait Use 16 Nonresident Trip Characteristics 18 Angling in
Angling in Manitoba (2000) TABLE OF CONTENTS Page Introduction 1 Angler Profile 2 Angling Effort 7 Catch and Harvest 10 Angling Expenditures 13 Bait Use 16 Nonresident Trip Characteristics 18 Angling in
Nightriders why extending your opening hours could unlock new profit potential
 Nightriders why extending your opening hours could unlock new profit potential NIGHTRIDERS Why extending your opening hours could unlock new profit potential The UK is turning into a nation of night owls
Recreational Saltwater Fishing Industry Trends and Economic Impact January 2007
 Document was created exclusively for RISAA and the information contained herein is not to be disclosed without their expressed permission Recreational Saltwater Fishing Industry Trends and Economic Impact
Topics covered. File location/file Name (including version)/author Initials/Support Initials/Date
/author Initials/Support Initials/Date") Boat Owners Survey Topics covered Key performance measures General upkeep and performance Customer service (including licence renewal) Use of boats Boater demographics and views Mooring (home and residential)
Boat Owners Survey Topics covered Key performance measures General upkeep and performance Customer service (including licence renewal) Use of boats Boater demographics and views Mooring (home and residential)
Parks Canada + Boating = A Beautiful Thing! Darlene Upton Parks Canada
 Parks Canada + Boating = A Beautiful Thing! Darlene Upton Parks Canada 1 5 NATIONAL PARKS 2 37 NATIONAL HISTORIC SITES 1 WORLD HERITAGE SITE NATIONAL URBAN PARK 2 3 The Parks Canada Boating Offer 4 Partners
Community perceptions of the sustainability of the fishing industry in Australia
 Community perceptions of the sustainability of the fishing industry in Australia October 2013 Prepared for: Peter Horvat Communications Manager Fisheries Research and Development Corporation Prepared by:
Introduction. Background
 Strategic Plan April 2013 ch 2017 Introduction The Royal Yachting Association (RYA) is the UK governing body for sail and powerboat racing and the UK national authority for all forms of recreational and
COMHAIRLE CHONTAE SHLIGIGH SLIGO COUNTY COUNCIL
 COMHAIRLE CHONTAE SHLIGIGH SLIGO COUNTY COUNCIL - SLIGO COUNTY COUNCIL - - BEACH BYE-LAWS 2007 BYE-LAWS GOVERNING THE BEACH AT STRANDHILL, CO. SLIGO. These Bye-Laws were made by Sligo County Council at
CASUALTY REVIEW
 SOMERSET HEADINGROAD SAFETY PARTNERSHIP CASUALTY REVIEW 22-27 IMPROVING ROAD SAFETY WORKING TOGETHER TO REDUCE CASUALTIES HEADING HEADING CONTENTS 3 1. EXECUTIVE SUMMARY........................................
Baseline Survey of New Zealanders' Attitudes and Behaviours towards Cycling in Urban Settings
 Baseline Survey of New Zealanders' Attitudes and Behaviours towards Cycling in Urban Settings Highlights 67% of urban New Zealanders, 18 years of age or more own or have access to a bicycle that is in