Rio Grande County Births and Deaths 2015
|
|
|
- Arlene Crawford
- 6 years ago
- Views:
Transcription
1 Rio Grande County Births and Deaths 2015 Selected birth characteristics: County residents, Selected birth characteristics by age group of mother: County residents, Selected birth characteristics by race/ethnicity of mother: County residents, Selected birth characteristics by area-based poverty status of mother's residence: County residents, Live births and fertility rates by age group of mother: County residents, Vital statistics summary: County residents, 2005, Deaths, crude death rates and age-adjusted death rates from selected causes: County residents, Deaths and age-specific death rates from selected causes: County residents, Deaths from selected causes by race/ethnicity: County residents, Deaths from selected causes by area-based poverty status of decedent's residence: County residents, Deaths and age-specific death rates: County residents, Notes Regarding Colorado Revised Certificate of Live Birth Notes Regarding Colorado Area-Based Poverty Estimates For more information about these tables, please contact the Vital Statistics Program at the Colorado Department of Public Health and Environment by telephone at (303) or by at cdphe.healthstatistics@state.co.us.
2 Selected birth characteristics: Rio Grande County residents, 2015 Characteristic Number Percent Total Live Births Age of Mother Low Weight Births (<2,500 Grams) Very Low Weight Births (<1,500 Grams) * * Prenatal Care Later than 1st Trimester/No Care No Prenatal Care Preterm Births (<37 Weeks) Education of Mother <High School Diploma/GED Live Births to Unmarried Women Smoking During Pregnancy "Education of Mother," "Births to Unmarried Women," and "Smoking During Pregnancy" are among items collected starting in 2007, using the revised birth certificate, that are not directly comparable to data collected before See "Notes Regarding Colorado Revised Certificate of Live Birth" at end of report for details. Sums may not add to total due to cases with age of mother unknown. Percentages are of total births, excluding cases with specific characteristics unknown.
3 Selected birth characteristics by age group of mother: Rio Grande County residents, 2015 Characteristic All Ages Number Percent Number Percent Number Percent Number Percent Number Percent Total Live Births Race/Ethnicity of Mother 1E E E E E White, Non-Hispanic White, Hispanic * * Black * * * * Asian American/Pacific Islander * * * * American Indian/Native Alaskan Other Unknown Low Weight Births (<2,500 Grams) * * * * Very Low Weight Births (<1,500 Grams) * * * * Prenatal Care Later than 1st Trimester/No Care * * No Prenatal Care Preterm Births (<37 Weeks) * * Education of Mother <High School Diploma/GED Live Births to Unmarried Women Smoking During Pregnancy * * "Education of Mother," "Births to Unmarried Women," and "Smoking During Pregnancy" are among items collected starting in 2007, using the revised birth certificate, that are not directly comparable to data collected before See "Notes Regarding Colorado Revised Certificate of Live Birth" at end of report for details. Sums may not add to total due to cases with age of mother unknown. Percentages are of total births, excluding cases with specific characteristics unknown. Percentage not computed for cells shaded in light gray.
4 Selected birth characteristics by race/ethnicity of mother: Rio Grande County residents, 2015 Characteristic White Non-Hispanic White Hispanic Black Asian American/Pacific Islander American Indian/Native Alaskan Number Percent Number Percent Number Percent Number Percent Number Percent Total Live Births * * Age of Mother 1E E E E E * * * * * * * * Low Weight Births (<2,500 Grams) Very Low Weight Births (<1,500 Grams) * * Prenatal Care Later than 1st Trimester/No Care No Prenatal Care Preterm Births (<37 Weeks) Education of Mother <High School Diploma/GED * * * * * * Live Births to Unmarried Women * * * * Smoking During Pregnancy * * * * "Education of Mother," "Births to Unmarried Women," and "Smoking During Pregnancy" are among items collected starting in 2007, using the revised birth certificate, that are not directly comparable to data collected before See "Notes Regarding Colorado Revised Certificate of Live Birth" at end of report for details. Sums may not add to total due to cases with age or race/ethnicity of mother unknown. Percentages are of total births, excluding cases with specific characteristics unknown.
5 Selected birth characteristics by area-based poverty status of mother's residence: Rio Grande County residents, 2015 Characteristic <10% % % 30%+ Unknown Number Percent Number Percent Number Percent Number Percent Number Percent Total Live Births Race/Ethnicity of Mother 1E E E E E White, Non-Hispanic White, Hispanic * * Black * * Asian American/Pacific Islander American Indian/Native Alaskan * * Other Unknown Low Weight Births (<2,500 Grams) Very Low Weight Births (<1,500 Grams) * * Prenatal Care Later than 1st Trimester/No Care * * No Prenatal Care Preterm Births (<37 Weeks) Education of Mother <High School Diploma/GED * * * * Live Births to Unmarried Women * * Smoking During Pregnancy * * Area-based poverty status represents the percentage of population in the census tract of maternal residence living at or below the federal poverty level, based on the Year American Community Survey. Census tracts of maternal residence were determined by linking the maternal residence address at the time of infant birth to its respective census tract as defined by the 2010 U.S. census-designated boundaries. See "Notes Regarding Colorado Area-Based Poverty Estimates" at end of report for details. "Education of Mother," "Births to Unmarried Women," and "Smoking During Pregnancy" are among items collected starting in 2007, using the revised birth certificate, that are not directly comparable to data collected before See "Notes Regarding Colorado Revised Certificate of Live Birth" at end of report for details. Sums may not add to total due to cases with age of mother unknown. Percentages are of total births, excluding cases with specific characteristics unknown. Percentage not computed for cells shaded in light gray.
6 Live births and fertility rates with 95% confidence limits by age group of mother: Rio Grande County residents, 2015 Age Group Births Population Fertility Rate Lower Limit Upper Limit All Ages 129 1, Teen Age Groups ,999, All Age Groups ,999, Sums may not add to total due to cases with age of mother unknown. Rates are live births per 1,000 female population in each age group. Lower and upper limits represent the 95% confidence interval of the fertility rate. Population data for 'all ages' are females ages
7 Vital statistics summary: Rio Grande County residents, 2005, Annual Average Total Population 12,696 11,911 11,877 11,721 11,580 11,475 * 11,713 Total Births * * * * * * * * Number Birth Rate General Fertility Rate Age of Mother * * * * * * * * Number * Percent of Total Births * Fertility Rate * Low Weight Births (<2,500 Grams) * * * * * * * * Number Percent Prenatal Care Later Than 1st Trimester/No Care * * * * * * * * Number Percent Births to Unmarried Women * * * * * * * * Number Percent Mother's Education <12 Years * * * * * * * * Number Percent Infant Deaths * * * * * * * * Number * * 0 * * * 0 * Rate * * 0.0 * * * 0.0 * Neonatal Deaths * * * * * * * * Number * * 0 * * Rate * * 0.0 * * Total Deaths * * * * * * * * Number Crude Rate Age-Adjusted Rate Cardiovascular Disease * * * * * * * * Number Age-Adjusted Rate Heart Disease * * * * * * * * Number (Continued) HIGHLIGHTED ROWS: Denotes data items collected starting in 2007, using the revised birth certificate, that are not directly comparable to data collected before Due to this incomparability, comparisons of values from 2007-forward to pre-2007 values should be made with caution. See "Notes Regarding Colorado Revised Certificate of Live Birth" at end of report for details. Birth rates are per 1,000 total population. General fertility rates are births per 1,000 females ages Fertility rates for mothers ages are births per 1,000 females of this age group. Infant and neonatal mortality rates are per 1,000 live births. Other death rates are per 100,000 population. Age-adjusted rates are adjusted to the 2000 U.S. population using the direct method applied to 10-year age groups.
8 Vital statistics summary: Rio Grande County residents, 2005, Annual Average Age-Adjusted Rate Cerebrovascular Disease * * * * * * * * Number Age-Adjusted Rate Malignant Neoplasms * * * * * * * * Number Age-Adjusted Rate Lung Cancer * * * * * * * * Number 4 * * 0 * Age-Adjusted Rate 27.9 * * 0.0 * Breast Cancer * * * * * * * * Number * 3 * * * * 0 * Age-Adjusted Rate * 18.8 * * * * 0.0 * Total Unintentional Injuries * * * * * * * * Number Age-Adjusted Rate Motor Vehicle * * * * * * * * Number 0 3 * * * Age-Adjusted Rate * * * Other Unintentional Injuries * * * * * * * * Number Age-Adjusted Rate Chronic Lower Respiratory Diseases * * * * * * * * Number Age-Adjusted Rate Suicide * * * * * * * * Number * * * 0 * Age-Adjusted Rate * * * 0.0 * Homicide and Legal Intervention * * * * * * * * Number 0 0 * 0 * * 0 * Age-Adjusted Rate * 0.0 * * 0.0 * Work-Related Injury * * * * * * * * Number 0 * * Age-Adjusted Rate 0.0 * * HIGHLIGHTED ROWS: Denotes data items collected starting in 2007, using the revised birth certificate, that are not directly comparable to data collected before Due to this incomparability, comparisons of values from 2007-forward to pre-2007 values should be made with caution. See "Notes Regarding Colorado Revised Certificate of Live Birth" at end of report for details. Birth rates are per 1,000 total population. General fertility rates are births per 1,000 females ages Fertility rates for mothers ages are births per 1,000 females of this age group. Infant and neonatal mortality rates are per 1,000 live births. Other death rates are per 100,000 population. Age-adjusted rates are adjusted to the 2000 U.S. population using the direct method applied to 10-year age groups.
9 Deaths, crude death rates and age-adjusted death rates with 95% confidence limits from selected causes: Rio Grande County residents, 2015 Cause of Death N Crude Rate Age-Adjusted Rate Lower Limit Upper Limit All Causes 125 1, Cardiovascular Disease Heart Disease Cerebrovascular Disease Atherosclerosis Malignant Neoplasms Lung Cancer * * * * * Breast Cancer * * * * * Chronic Lower Respiratory Diseases Unintentional Injuries Motor Vehicle Other Unintentional Injuries Pneumonia and Influenza Suicide * * * * * Diabetes Mellitus HIV Infection Chronic Liver Disease and Cirrhosis Alzheimer's Disease * * * * * Nephritis, Nephrosis, Nephrotic Syndrome Homicide and Legal Intervention * * * * * Septicemia * * * * * Congenital Anomalies Perinatal Period Conditions * * * * * All Other Injury by Firearm * * * * * Drug-Induced Deaths * * * * * Alcohol-Induced Deaths Work-Related Injury (Y/N Check Death Certificate) Rates are deaths per 100,000 population. Crude death rates are calculated without age-adjustment. Age-adjusted rates are adjusted to the 2000 U.S. standard population using the direct method applied to 10-year age groups. Age-adjusted rates provide a better basis for comparison among different geographical areas or time periods. Lower and upper limits represent the 95% confidence interval of the age-adjusted rate.
10 Deaths and age-specific death rates from selected causes: Rio Grande County residents, 2015 Cause of Death < N Rate N Rate N Rate N Rate N Rate N Rate All Causes * * * * Cardiovascular Disease * * Heart Disease * * Cerebrovascular Disease Atherosclerosis Malignant Neoplasms Lung Cancer * * Breast Cancer * * Chronic Lower Respiratory Diseases Unintentional Injuries * * * * * * * * Motor Vehicle * * * * * * Other Unintentional Injuries * * * * Pneumonia and Influenza * * Suicide * * Diabetes Mellitus * * * * HIV Infection Chronic Liver Disease and Cirrhosis * * * * Alzheimer's Disease * * Nephritis, Nephrosis, Nephrotic Syndrome * * Homicide and Legal Intervention * * Septicemia * * Congenital Anomalies Perinatal Period Conditions * * All Other , , , , , , Injury by Firearm * * * * Drug-Induced Deaths * * * * Alcohol-Induced Deaths * * * * * * Work-Related Injury (Y/N Check Death Certificate) Infant (<1 year) mortality rates are per 1,000 live births. Other rates are deaths per 1,000 population of the age group.
11 Deaths from selected causes by race/ethnicity: Rio Grande County residents, 2015 Cause of Death All Races White Non-Hispanic White Hispanic Black Asian American/Pacific Islander American Indian/Native Alaskan N % N % N % N % N % N % Total Cardiovascular Disease Heart Disease Cerebrovascular Disease Atherosclerosis Malignant Neoplasms Lung Cancer * * * * Breast Cancer * * * * Chronic Lower Respiratory Disease Unintentional Injuries * * Motor Vehicle Other Unintentional Injuries * * * * Pneumonia and Influenza * * Suicide * * * * Diabetes Mellitus * * * * HIV Infection Chronic Liver Disease and Cirrhosis * * Alzheimer's Disease * * * * Nephritis, Nephrosis, Nephrotic Syndrome Homicide and Legal Intervention * * * * Septicemia * * * * Congenital Anomalies Perinatal Period Conditions * * * * All Other E7 1E7 1E7 1E7 1E7 1E7 1E7 1E7 1E7 1E7 1E7 1E7 Injury by Firearm * * * * Drug-Induced Deaths * * * * * * Alcohol-Induced Deaths * * * * Work-Related Injury (Y/N Check Death Certificate) Percentages are of total deaths of each race/ethnicity category.
12 Deaths from selected causes by area-based poverty status of decedent's residence: Rio Grande County residents, 2015 <10% % % 30%+ Unknown Cause of Death N % N % N % N % N % Total Cardiovascular Disease * * Heart Disease * * Cerebrovascular Disease Atherosclerosis Malignant Neoplasms * * * * Lung Cancer * * Breast Cancer * * * * Chronic Lower Respiratory Disease Unintentional Injuries * * Motor Vehicle * * * * Other Unintentional Injuries Pneumonia and Influenza * * Suicide * * Diabetes Mellitus HIV Infection Chronic Liver Disease and Cirrhosis * * Alzheimer's Disease * * Nephritis, Nephrosis, Nephrotic Syndrome * * * * Homicide and Legal Intervention * * Septicemia * * * * Congenital Anomalies Perinatal Period Conditions * * All Other E7 1E7 1E7 1E7 1E7 1E7 1E7 1E7 1E7 1E7 Injury by Firearm * * Drug-Induced Deaths * * Alcohol-Induced Deaths * * Work-Related Injury (Y/N Check Death Certificate) Area-based poverty status represents the percentage of population in the census tract of decedent's residence living at or below the federal poverty level, based on the Year American Community Survey. Census tracts of decedent residence were determined by linking the decedent residence address at the time of death to its respective census tract as defined by the 2010 U.S. census-designated boundaries. See "Notes Regarding Colorado Area-Based Poverty Estimates" at end of report for details. Percentages are of total deaths of each race/ethnicity category.
13 Deaths and age-specific death rates: Rio Grande County residents, 2015 Age Group Deaths Population Age-Specific Death Rate All Ages , ,999,999 9,999, Infant * 129 * Neonatal * 613 * * 535 * * 563 * * 629 * * 658 * ,999,999 9,999, , * 1,311 * , , Infant death is death in the first year of life. Neonatal death is death occurring prior to the 28th day of life. Infant and neonatal mortality rates are per 1,000 live births. Other death rates are per 1,000 population of the age group. Population figures for infant and neonatal groups are live births.
14 Notes Regarding Colorado s Revised Certificate of Live Birth These tables contain Colorado birth data that were collected using the 1989 Revision of the U.S. Standard Certificate of Live Birth (unrevised) and the 2003 Revision of the U.S. Standard Certificate of Live Birth (revised) 1,2,3. Colorado s birth registration system used the unrevised certificate for births through calendar year 2006; while births in 2007 through the present were registered using the revised certificate. Among the differences in the revised birth certificate are changes to the following data items: Mother s and father s race, captures multiple race identification instead of single race identification Mother s and father s education, captures highest degree attained instead of total years of education Mother s marital status at time of birth, captures never married, married, widowed, separated, and divorced instead of just married or unmarried Cigarette smoking before and during pregnancy, captures levels of smoking in each trimester instead of just smoking any time during pregnancy And the addition of the following data items: Method of delivery includes fetal presentation and trial of labor prior to cesarean delivery Pre-pregnancy weight, weight at delivery and height, used to calculate Body Mass Index Congenital anomalies, certain conditions have been added or removed Fertility therapy Did mother get WIC food for herself during this pregnancy Infections during pregnancy Maternal morbidity Breast feeding Principal source of payment for the delivery Data items noted above that were collected using both the unrevised certificate and the revised certificate are not directly comparable. Analyses of birth data for time periods that include both revised and unrevised data should be performed with caution. To facilitate analyses of births by race, the multiple race identification in revised certificates has been bridged back to a single race using a system developed by the National Center for Health Statistics at the Centers for Disease Control and Prevention 4. Please note, however, that there has been an increase in the number of births reported with other or unknown maternal and paternal race and/or Hispanic ethnicity beginning in 2007 compared to previous years. This is likely attributable to the change to the revised certificate. The Health Statistics and Evaluation Branch at the Colorado Department of Public Health and Environment is available to assist with further analyses of these data, as well as to answer questions one might have regarding the revised certificate and the affected data items. For further information or assistance, please contact the Health Statistics and Evaluation Branch at (303) or by at cdphe.healthstatistics@state.co.us. References: 1 National Center for Health Statistics revision of the U.S. Standard Certificate of Live Birth Available from: gov/nchs/vital_certs_rev.htm. 2 National Center for Health Statistics. Report of the Panel to Evaluate the U.S. Standard Certificates and Reports. National Center for Health Statistics Available from: panelreport_acc.pdf. 3 Martin JA, Hamilton BE, Sutton PD, et al. Births: Final data for National vital statistics reports; vol 55 no 1. Hyattsville, MD: National Center for Health Statistics NCHS Procedures for Multiple-Race and Hispanic Origin Data: Collection, Coding, Editing, and Transmitting. Division of Vital Statistics, National Center for Health Statistics, Centers for Disease Control and Prevention, May 7, Available from:
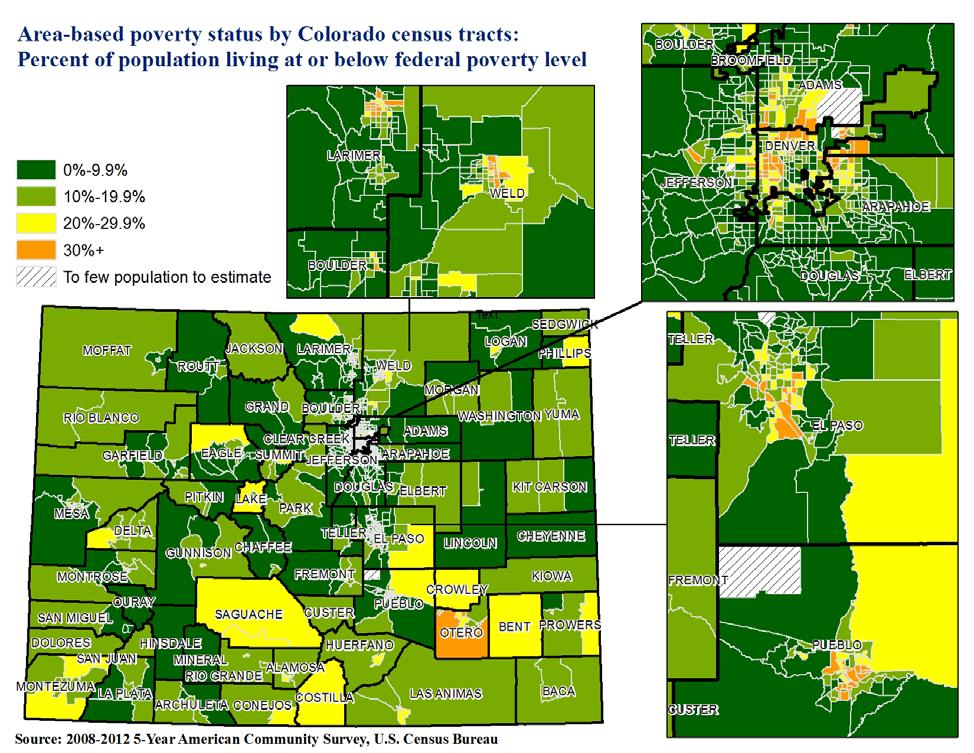
15 Notes Regarding Colorado s Area-Based Poverty Estimates Poverty continues to be an important factor that increases the risk of adverse birth outcomes, disease, and mortality across all ages. The relationships between poverty and such outcomes are unsurprising given the socioeconomic differences in health behaviors, familial and other risk factors, access to appropriate prenatal and preventive health care and treatment for illness and disease. Consequently, considering poverty when exploring changes in the health status of Colorado s communities and the persistence of health disparities by poverty status are increasingly important 1,2,3. These summary tables now contain counts and proportions of births and deaths by area-based poverty status of place of residence. Area-based poverty status represents the percentage of the population in the census tract of residence living at or below the federal poverty level. Place of residence is based on the maternal self-reported residence address at the time of an infant s birth for birth statistics, and the residence address of decedent at the time of death, collected from next of kin, for death statistics. Census tracts of residence are determined by linking these addresses to their respective census tracts as defined by the 2010 U.S. Census-designated boundaries. The percentage of the population in a census tract living at or below the federal poverty level of census tracts is ascertained from the most current 5-Year American Community Survey estimates made available by the U.S. Census Bureau. Colorado consists of 1,249 unique census tracts, which are formal sub-county geographic areas defined by the U.S. Census Bureau, confined by county boundaries, and typically represent between 1,200 and 8,000 people. Counties with large populations, such as in the state s large metropolitan areas, contain many census tracts; while counties with smaller populations, such as in the state s rural and mountain regions, may have only a couple of census tracts 4. Area-based poverty status is measured by calculating the percent of the population in each census tract that is living at or below the federal poverty level. Whether one is living at or below the federal poverty level is determined using a set of money income thresholds that vary by family size, age and composition 5. Categories used for these reports include 0-9.9%, %, % and 30% of the population or greater living at or below the federal poverty level. The map on the following page depicts census tract boundaries for Colorado and its largest metropolitan areas and each census tract s poverty status. Note that for some less populous counties with few census tracts, a single area-based poverty status category may represent most or all of the county. The Health Statistics and Evaluation Branch at the Colorado Department of Public Health and Environment is available to assist with further analyses of these data, as well as to answer questions one might have regarding these novel vital statistics measures. For further information or assistance, please contact the Health Statistics and Evaluation Branch at (303) or by at cdphe.healthstatistics@state.co.us. References: 1 Krieger N, Chen JT, Ebel G. Can we monitor socioeconomic inequalities in health? A survey of U.S. health departments data collection and reporting practices. Public Health Reports Nov-Dec; 112(6): Subramanian SV, Chen JT, Rehkopf DH, Waterman PD, Krieger N. Comparing individual- and areabased socioeconomic measures for the surveillance of health disparities: A multilevel analysis of Massachusetts births, American Journal of Epidemiology Nov 1; 164(9): Colorado Comprehensive Cancer Program. Cancer & Poverty in Colorado: Denver, CO: Colorado Department of Public Health and Environment. Available from: 4 Geographic Terms and Concepts Census Tract. United States Census Bureau. Available from: 5 How the Census Bureau Measures Poverty. United States Census Bureau. Available from:
16
Georgia Annual Health Status Measures 2018
 Georgia Annual Health Status Measures 2018 with comparisons to the U.S. and Healthy People 2000, 2010 & 2020 objectives Prepared by the Office of Health Indicators for Planning (OHIP), Georgia Department
Community Outreach Resource Center
 Community Outreach Resource Center Tier 1 Report: Gillespie County Child & Adolescent Health Child Abuse Rates in Gillespie County 23 7 Gillespie County Children Living in Poverty 23 7 Rate per 1, 14.
Leading Causes of Death in Hawaii
 Leading Causes of Death in Hawaii Death Counts, Age-Adjusted Mortality Rates, and Years of Potential Life Lost for the State of Hawaii (Residents Only), by Cause of Death, by This report displays the average
Leading Causes of Death in Hawaii
 Leading Causes of Death in Hawaii Death Counts, Age-Adjusted Mortality Rates, and Years of Potential Life Lost for the State of Hawaii (Residents Only), by Cause of Death, by This report displays the average
Le Sueur Waseca Community Health Board Community Health Assessment Report
 Community Health Assessment Report Le Sueur Waseca Community Health Board Community Health Assessment Report Le Sueur County Public Health Cindy Shaughnessy, Public Health Director 88 South Park Ave Le
Recent Mortality Trends and Prospects: Hong Kong and Taiwan
 Recent Mortality Trends and Prospects: Hong Kong and Taiwan Edward Jow-ching Tu Wang Jian-Ping Division of Social Science HKUST, HKSAR, China soejctu@ust.hk Introduction Current mortality in Hong Kong
Post-neonatal mortality (28 days to 1 year)
") Figure A1: Infant, neonatal and post-neonatal mortality rate (per 1000 live births), 1979 2003 14 12 10 Deaths per 1000 live births 8 6 4! N ZHIS CYMRC # 2 0 1979 1980 1981 1982 1983 1984 1985 1986 1987
Figure A1: Infant, neonatal and post-neonatal mortality rate (per 1000 live births), 1979 2003 14 12 10 Deaths per 1000 live births 8 6 4! N ZHIS CYMRC # 2 0 1979 1980 1981 1982 1983 1984 1985 1986 1987
Nebraska Births Report: A look at births, fertility rates, and natural change
 University of Nebraska Omaha DigitalCommons@UNO Publications since 2000 Center for Public Affairs Research 7-2008 Nebraska Births Report: A look at births, fertility rates, and natural change David J.
State Level Firearm Ownership and Storage Information Informs Risk, Benefit and Public Health and Public Safety Programming
 State Level Firearm Ownership and Storage Information Informs Risk, Benefit and Public Health and Public Safety Programming Why More States Should Consider This on the 2017 Behavioral Risk Factor Surveillance
2007 Quad Cities Community Vitality Scan
 2007 Quad Cities Community Vitality Scan SPONSORED BY Amy Helpenstell Foundation Community Foundation of the Great River Bend Moline Foundation Quad City Health Initiative United Way of the Quad Cities
Deaths in Hawaii Due to Colon Cancer
 in Hawaii Due to Colon Cancer Death Counts, Age-Adjusted Mortality Rates, and Years of Potential Life Lost for Colon Cancer for the State of Hawaii (Residents Only), by State, County of Residence, Gender,
Complete Streets Basics and Benefits
 Complete Streets Basics and Benefits November 14, 2017 Complete Streets Workshop Ann Ogoreuc, AICP, Allegheny County Economic Development Hannah E. Hardy, Allegheny County Health Department Benefits of
HEALTH INSURANCE COVERAGE STATUS American Community Survey 1-Year Estimates
 S2701 HEALTH INSURANCE COVERAGE STATUS 2014 American Community Survey 1-Year Estimates Supporting documentation on code lists, subject definitions, data accuracy, and statistical testing can be found on
Hospital Admissions in the Northern Territory
 Hospital Admissions in the Northern Territory 1976-28 www.healthynt.nt.gov.au Hospital Admissions in the Northern Territory, 1976 to 28 Shu Qin Li Sabine Pircher Steve Guthridge John Condon Jo Wright Acknowledgements
Community Health Status Assessment KANKAKEE COUNTY 2018
 Community Health Status Assessment KANKAKEE COUNTY 2018 Table of Contents CHSA Kankakee County 2018 1 Acknowledgements 3 Executive Summary 4 Introduction 6 Healthy People 2020 7 Demographic Characteristics
Missing Opportunities: Racial and Ethnic Disparities in the Twin Cities Metro in 2016
 New MetroStats Missing Opportunities: Racial and Ethnic Disparities in the Twin Cities Metro in 2016 10/2/2017 Community Development Committee What s New American Community Survey data released (9/14)
OC Healthy Communities Forum. The proportion of the population that live within a half mile of a major transit access point.
 OC Healthy Communities Forum Transit Access The proportion of the population that live within a half mile of a major transit access point. Use of public transit can result in decreased greenhouse gas emissions
WHERE ARE ARIZONA DEMOGRAPHICS TAKING US? HOW GROWING SLOWER, OLDER AND MORE DIVERSE AFFECTS REAL ESTATE
 WHERE ARE ARIZONA DEMOGRAPHICS TAKING US? HOW GROWING SLOWER, OLDER AND MORE DIVERSE AFFECTS REAL ESTATE March 2017 Tom Rex Office of the University Economist and Center for Competitiveness and Prosperity
Deaths in Hawaii Due to Congestive Heart Failure
 in Hawaii Due to Congestive Heart Failure Death Counts, Age-Adjusted Mortality Rates, and Years of Potential Life Lost for Congestive Heart Failure for the State of Hawaii (Residents Only), by State, County
3 Introductory text and technical notes 53
 Vital Statistics 3 Introductory text and technical notes 53 Table 3.1 Live births, deaths and marriages, and rates per 1,000 population 57 Graph Birth, death and marriage rates per 1,000 population 57
Plan B Supporting Data for Chapter 7
 Plan B 4.0 - Supporting Data for Chapter 7 World Population, 1950-2008 GRAPH: World Population, 1950-2008 World Population, 1950-2008, with Projections to 2050 GRAPH: World Population, 1950-2008, with
GOV ER N ME NT OF BE RMUDA Cabinet Office Department of Statistics BERMUDA DIGEST OF STATISTICS
 GOV ER N ME NT OF BE RMUDA Cabinet Office Department of Statistics 017 BERMUDA DIGEST OF STATISTICS BERMUDA DIGEST OF STATISTICS 2017 No. 40 (figures up to and including 2016 when available) Cedar Park
Strengthening Fragile Families
 1 Strengthening Fragile Families Ron Haskins The Brookings Institution October 27, 2010 2 The Problem: Too Many Children in Fragile Families Parents with low education Single-parent child rearing Poverty
Health and Transportation: Integrated Transport and Health Impact Model in the Nashville Region. Leslie Meehan, AICP June 2015
 THE HONORABLE Mayor KEN WILBER, Karl Dean, CHAIRMAN Chairman Health and Transportation: Integrated Transport and Health Impact Model in the Nashville Region Leslie Meehan, AICP June 2015 Metropolitan Planning
U n i t 1. Magnitude and impact of road traffic injuries
 U n i t 1 Magnitude and impact of road traffic injuries 1 WHO, 2007 Objectives Objectives By the end of this unit, the trainee should be able to: describe the global magnitude and trends of road traffic
Injury Mortality in Ireland, Northern Ireland and Britain
 Injury Mortality in Ireland, Northern Ireland and Britain INIsPHO Lunchtime Seminar December 2007 Steve Barron Research Analyst INIsPHO@IPH Injury mortality in Ireland, Northern Ireland and Britain Method
California TB Update
 California TB Update Pennan Barry, MD, MPH Chief, Surveillance and Epidemiology Section California TB Controllers Association March 8, 2017 pennan.barry@cdph.ca.gov 1 Acknowledgments Local TB Programs
TR NEWS. Public Health and Transportation. Innovation, Intervention, and Improvements NUMBER 299 SEPTEMBER OCTOBER 2015
 TR NEWS NUMBER 299 SEPTEMBER OCTOBER 2015 Public Health and Transportation Innovation, Intervention, and Improvements Public Health and Transportation Measuring the Health Benefits of Walking and Bicycling
CDC priorities to promote physical activity policy, system, and environmental (PSE) approaches: Plan4Health
 approaches: Plan4Health") CDC priorities to promote physical activity policy, system, and environmental (PSE) approaches: Plan4Health Claire Heiser, MS, RD Public Health Advisor Program Development and Evaluation Branch Division
CDC priorities to promote physical activity policy, system, and environmental (PSE) approaches: Plan4Health Claire Heiser, MS, RD Public Health Advisor Program Development and Evaluation Branch Division
Maternal Health and Fertility
 Maternal Health and Fertility Claudia Olivetti, Boston University and NBER Three Perspectives on Technology and Childbirth in America Boston University, September 3 2009 Research Agenda Progress in medical
INVASIVE BACTERIAL DISEASE SURVEILLANCE REPORT, 2016
 INVASIVE BACTERIAL DISEASE SURVEILLANCE REPORT, 26 Emerging Infections Program Active Bacterial Core Surveillance (ABCs) Minnesota Department of Health Diseases Included Group A Streptococcus page 5 Group
South Carolina Communities That Care (SC CTC) Survey
 Survey") South Carolina Communities That Care (SC CTC) Survey South Carolina 2014 Results INTRODUCTION This report presents statewide results of the South Carolina Communities That Care (SC CTC) Survey. The SC
South Carolina Communities That Care (SC CTC) Survey South Carolina 2014 Results INTRODUCTION This report presents statewide results of the South Carolina Communities That Care (SC CTC) Survey. The SC
Community of Practice on Traumatic Brain Injury
 Community of Practice on Traumatic Brain Injury Second Meeting October 15, 2013, 3:00-4:00 PM ET For audio, please call 866-835-7973. Your phone line is currently muted. Today s Agenda Overview of TBI
Demographic Characteristics and Trends of Bexar County and San Antonio, TX
 Demographic Characteristics and Trends of Bexar County and San Antonio, TX Leadership San Antonio Understand Infrastructure. Prepare for Growth. May 2, 2012 San Antonio, TX Select Growing States, 2000-2010
2020 K Street NW, Suite 410 Washington, DC (202)
") 2020 K Street NW, Suite 410 Washington, DC 20006 (202) 463-7300 Interview dates: October 24 25, 2013 Interviews: 1,008 adults CONDUCTED BY IPSOS PUBLIC AFFAIRS These are findings of an Ipsos online poll
2020 K Street NW, Suite 410 Washington, DC 20006 (202) 463-7300 Interview dates: October 24 25, 2013 Interviews: 1,008 adults CONDUCTED BY IPSOS PUBLIC AFFAIRS These are findings of an Ipsos online poll
Bicycle Helmet Use Among Winnipeg Cyclists January 2012
 Bicycle Helmet Use Among Winnipeg Cyclists January 2012 By: IMPACT, the injury prevention program Winnipeg Regional Health Authority 2 nd Floor, 490 Hargrave Street Winnipeg, Manitoba, R3A 0X7 TEL: 204-940-8300
State Health Assessment: Findings from the Ohio Medicaid Assessment Survey
 State Health Assessment: Findings from the Ohio Medicaid Assessment Survey County Commissioners Association of Ohio October 23, 2013 Presented by The Ohio Colleges of Medicine Government Resource Center
The Demographics of US Drowning & Data on Guarded Pool Deaths Julie Gilchrist, M.D.
 The Demographics of US Drowning & Data on Guarded Pool Deaths Julie Gilchrist, M.D. Dr. Julie Gilchrist is a Pediatrician and Medical Epidemiologist with the National Center for Injury Prevention and Control
A history of life and death in Australasia and Pacific: What is life expectancy?
 1 A history of life and death in Australasia and Pacific: What is life expectancy? Tony Blakely AEA Masterclass Burden of Disease Epidemiology, Equity and Cost-Effectiveness Programme Consider New Zealand
INVASIVE BACTERIAL DISEASE SURVEILLANCE REPORT, 2010
 INVASIVE BACTERIAL DISEASE SURVEILLANCE REPORT, Emerging Infections Program Active Bacterial Core Surveillance (ABCs) Minnesota Department of Health Diseases included Group A Streptococcus page 5 Group
University Of Maryland
 2000 Census Census Data 200 Census Change 2000 to 200 SUBJECT Number Percent SUBJECT Number Percent Number Percent TOTAL POPULATION 437 TOTAL POPULATION 246-9 -43.7 White 283 64.8 White 65 67. -8-4.7 Black
Integrating Public Health Objectives in Transportation Decision-Making
 Victoria Transportation Policy Institute 1250 Rudlin Street, Victoria, BC, V8V 3R7, CANADA www.vtpi.org info@vtpi.org Phone & Fax 250-360-1560 Efficiency - Equity - Clarity Integrating Public Health Objectives
Report to the Benjamin Hair-Just Swim For Life Foundation on JACS4 The Jefferson Area Community Survey
 Report to the Benjamin Hair-Just Swim For Life Foundation on JACS4 The Jefferson Area Community Survey Prepared by: Kara Fitzgibbon, M.A. Research Analyst Matthew Braswell, M.A. Research Analyst Yuliya
2017 North Texas Regional Bicycle Opinion Survey
 2017 North Texas Regional Bicycle Opinion Survey Sustainable Development Program Kevin Kokes, AICP Public Meetings April, 2018 North Central Texas Council of Governments MPO for the Dallas-Fort Worth Region
Invasive Bacterial Disease Surveillance Report Emerging Infections Program Minnesota Department of Health
 Invasive Bacterial Disease Surveillance Report 2009 Emerging Infections Program Minnesota Department of Health Surveillance Methods Cases include Minnesota residents with invasive infections due to Group
Demographic, Social and Health Indicators for Countries of the Eastern Mediterranean
 Demographic, Social and Health Indicators for Countries of the Eastern Mediterranean 2013 WHO-EM/HST/213/E Overall functionality of health information systems in the Region Satisfactory Functional but
Improving the Accuracy and Reliability of ACS Estimates for Non-Standard Geographies Used in Local Decision Making
 Improving the Accuracy and Reliability of ACS Estimates for Non-Standard Geographies Used in Local Decision Making Warren Brown, Joe Francis, Xiaoling Li, and Jonnell Robinson Cornell University Outline
Joint Strategic Needs Assessment (JSNA) Picture of Lewisham 2018
 Picture of Lewisham 2018") Joint Strategic Needs Assessment (JSNA) Picture of Lewisham 2018 Lewisham s Population Lewisham is the 13 th largest borough in London by population size and the 5 th largest in Southwark Inner London
Joint Strategic Needs Assessment (JSNA) Picture of Lewisham 2018 Lewisham s Population Lewisham is the 13 th largest borough in London by population size and the 5 th largest in Southwark Inner London
A Comparative Look at Pain Prevalence: Europe and U.S.
 A Comparative Look at Pain Prevalence: Europe and U.S. Zachary Zimmer (Mount Saint Vincent University, Canada) Anna Zajacova (Western University, Canada) ADDAPT working group workshop, Pain, Pain Treatment,
ALBERTA CANCER REGISTRY
 Cancer Care ALBERTA CANCER REGISTRY 2009 Annual Report of Cancer Statistics December 2012 ISSN: 1705-0251 Contents About The Alberta Cancer Registry... 2 Introduction... 3 Highlights... 3 Data... 3...
Active and Green: Healthy Communities Are Sustainable Communities
 Active and Green: Healthy Communities Are Sustainable Communities James Sallis, PhD San Diego State University www.drjamessallis.sdsu.edu For LISC Webinar May 4, 2011 Goals of talk Physical inactivity
2017 Nebraska Profile
 2017 Nebraska Profile State, 9 NEW Regions, 93 Counties, plus 31 Cities Three Volumes Demographic Change in the State Economic Influences at Work Housing Statistics and Trends Summary of Findings Discuss
Fishing and Hunting Recruitment and Retention in the U.S. from 1990 to 2005
 U.S. Fish & Wildlife Service Fishing and Hunting Recruitment and Retention in the U.S. from 1990 to 2005 Addendum to the 2001 National Survey of Fishing, Hunting, and Wildlife-Associated Recreation Report
Validity of a Household Gun Question in
 Validity of a Household Gun Question in ANN P. RAFFERTY, PhD JOHN C. THRUSH, MPH PATRICIA K. SMITH, MS HARRY B. McGEE, MPH At the time of the study, all the authors were with the Michigan Department of
GOV ER N ME NT OF BE RMUDA Cabinet Office Department of Statistics BERMUDA DIGEST OF STATISTICS
 GOV ER N ME NT OF BE RMUDA Cabinet Office Department of Statistics 015 BERMUDA DIGEST OF STATISTICS BERMUDA DIGEST OF STATISTICS 2015 No. 38 (figures up to and including 2014 when available) Cedar Park
Pedestrian and Cyclist Safety in Toronto: From Evidence to Practice
 CARSP Conference 2017 Pedestrian and Cyclist Safety in Toronto: From Evidence to Practice Kate Bassil Acting Director Healthy Public Policy Toronto Public Health June 20, 2017 1 Top Causes of Death in
Alberta Cancer Registry
 C A N C E R C A R E Alberta Cancer Registry 2007 Annual Report of Cancer Statistics ISSN: 1705-0251 June 2010 1 Alberta Cancer Registry 2007 Annual Report of Cancer Statistics Contents About The Alberta
The North Shore Transportation Improvement Strategy and Western Richmond Terrace 1 : The Forgotten Corridor
 Elm Park Civic Association Island Voice Do Me A Faber The North Shore Transportation Improvement Strategy and Western Richmond Terrace 1 : The Forgotten Corridor Introduction Richmond Terrace is the northernmost
THE KNOWLEDGE NETWORKS-ASSOCIATED PRESS POLL SPORTS POLL (BASEBALL) CONDUCTED BY KNOWLEDGE NETWORKS July 6, 2009
 CONDUCTED BY KNOWLEDGE NETWORKS July 6, 2009") 1350 Willow Rd, Suite 102 Menlo Park, CA 94025 www.knowledgenetworks.com Interview dates: June 26 July 5, 2009 Interviews: 655 adults interested or very interested in MLB Sampling margin of error for a
1350 Willow Rd, Suite 102 Menlo Park, CA 94025 www.knowledgenetworks.com Interview dates: June 26 July 5, 2009 Interviews: 655 adults interested or very interested in MLB Sampling margin of error for a
More than half the world lives on less than $2 a day
 More than half the world lives on less than $2 a day PRB s 2005 World Population Data Sheet reveals persisting global inequalities in health and well-being Presentation by Bill Butz, Carl Haub, Linda Jacobsen,
Prostate cancer prevalence (40+), for the State of Hawaii, for the Year(s)
, for the State of Hawaii, for the Year(s)") Prostate cancer prevalence (40+), for the State of Hawaii, for the Year(s) - 2011 Prostate cancer prevalence (40+), by State, County, Island, Community, Adult Age Group, DOH Race-Ethnicity, Education Level,
Prostate cancer prevalence (40+), for the State of Hawaii, for the Year(s) - 2011 Prostate cancer prevalence (40+), by State, County, Island, Community, Adult Age Group, DOH Race-Ethnicity, Education Level,
Oakmont: Who are we?
 Oakmont: Who are we? A Snapshot of our community from the April 2010 US Census Contents Age and Gender... 1 Marital Status... 2 Home Ownership and Tenure... 3 Past Demographic Characteristics... 5 Income
THE EPIDEMIOLOGY OF TRAUMATIC BRAIN INJURIES IN NEW YORK STATE
 THE EPIDEMIOLOGY OF TRAUMATIC BRAIN INJURIES IN NEW YORK STATE Michael Bauer, Sarah Sperry, Kainan Sun, Susan Hardman New York State Department of Health, Bureau of Injury Prevention What is Traumatic
The Epidemic of Child Drowning in Developing Countries and Interventions Being Trialed Julie Gilchrist, M.D.
 The Epidemic of Child Drowning in Developing Countries and Interventions Being Trialed Julie Gilchrist, M.D. Dr. Julie Gilchrist is a Pediatrician and Medical Epidemiologist with the National Center for
Health Beyond Healthcare The Chronic Disease Impacts of Neighborhood Design. Erik J. Aulestia, AICP Principal, Torti Gallas + Partners
 Health Beyond Healthcare The Chronic Disease Impacts of Neighborhood Design Erik J. Aulestia, AICP Principal, Torti Gallas + Partners Prior to 20th Century How should a city look and function? Architects
National Association of REALTORS National Smart Growth Frequencies
 September 520, 2017 3,000 Weighted Online Respondents National Association of REALTORS National Smart Growth Frequencies Q.2 The first question is about the quality of life in your community. How satisfied
Bill C-19: An Act to amend the Criminal Code and the Firearms Act
 Bill C-19: An Act to amend the Criminal Code and the Firearms Act Presentation to the Senate Committee on Legal and Constitutional Affairs By Julie McAuley Director, Canadian Centre for Justice Statistics
Reality Math Dot Sulock, University of North Carolina at Asheville
 Reality Math Dot Sulock, University of North Carolina at Asheville Firearm Deaths 1. Making an Excel Pie Graph Firearm Deaths in US 2000 2011 suicides 16,586 19,766 homicides 10,801 11,101 unintentional
The Quality of Life of the People in Norway
 1 Example Report The Quality of Life of the People in Norway The Management Institute for Quality-of-Life Studies December 2018 2 Introduction This report provides a detailed picture of the quality of
Introduction to ICD-10-CM. Improving the Financial Health of the Practices we Serve.
 Improving the Financial Health of the Practices we Serve. What is ICD-10???? ICD-10 replaces the ICD-9 code sets and includes updated NEW medical terminology and updated classification of diseases. The
Status Report on the Yellowstone Bison Population, August 2016 Chris Geremia 1, Rick Wallen, and P.J. White August 17, 2016
 Summary: Status Report on the Yellowstone Bison Population, August 2016 Chris Geremia 1, Rick Wallen, and P.J. White August 17, 2016 The bison population is estimated near 5,500 (range = 5,200-5,800),
MANITOBA'S ABORIGINAL COMMUNITY: A 2001 TO 2026 POPULATION & DEMOGRAPHIC PROFILE
 MANITOBA'S ABORIGINAL COMMUNITY: A 2001 TO 2026 POPULATION & DEMOGRAPHIC PROFILE MBS 2005-4 JULY 2005 TABLE OF CONTENTS I. Executive Summary 3 II. Introduction.. 9 PAGE III. IV. Projected Aboriginal Identity
Target population involvement in urban ciclovias: a preliminary evaluation of St. Louis Open Streets
 Washington University in St. Louis Washington University Open Scholarship Brown School Faculty Publications Brown School 2012 Target population involvement in urban ciclovias: a preliminary evaluation
Health Impact Analysis for Integrated Regional Land Use and Transportation Plan
 Health Impact Analysis for Integrated Regional Land Use and Transportation Plan Hsi-Hwa Hu, Guoxiong Huang, Frank Wen, Simon Choi (Southern California Association of Governments) Margaret Shih (Los Angeles
T he General Social Survey, a biannual survey of the US
 15 ORIGINAL ARTICLE The US gun stock: results from the 2004 national firearms survey L Hepburn, M Miller, D Azrael, D Hemenway... See end of article for authors affiliations... Correspondence to: Dr D
BIG DEAL. It s kind of a. Wills that Won t. Why this new data is so important. Russell James. The demographics of charitable estate planning 9/8/2015
 Wills that Won t The demographics of charitable estate planning Russell James Professor Texas Tech University It s kind of a BIG DEAL Why this new data is so important 1 Small one-time snapshots in life
What s Health Got to Do With It? Health and Land Use Planning
 What s Health Got to Do With It? Health and Land Use Planning CANDACE RUTT, PH.D. EXECUTIVE DIRECTOR APRIL 13 TH, 2016 Planning and Public Health Planning + Public Health Healthy Communities Healthier
Long-term consequence of injury on self-rated health
 Long-term consequence of injury on self-rated health Bjarne Laursen SAFETY2010, London September 23, 2010 Bjarne Laursen, Hanne Møller, Anne Mette Hornbek Toft National Institute of Public Health Background
Encouraging generosity:
 Encouraging generosity: The demographics of charitable estate planning Russell James, J.D., Ph.D., CFP Professor Texas Tech University It s kind of a BIG DEAL Why this new data is so important Small one-time
Occupational Mortality In Washington State, (DHHS Publication) By Samuel Milham READ ONLINE
 By Samuel Milham READ ONLINE") Occupational Mortality In Washington State, 1950-1979 (DHHS Publication) By Samuel Milham READ ONLINE If searching for the ebook Occupational mortality in Washington State, 1950-1979 (DHHS publication)
Occupational Mortality In Washington State, 1950-1979 (DHHS Publication) By Samuel Milham READ ONLINE If searching for the ebook Occupational mortality in Washington State, 1950-1979 (DHHS publication)
Poisoned to Death. Christopher J. Ruhm. University of Virginia and NBER
 Poisoned to Death Christopher J. Ruhm University of Virginia and NBER # of Deaths 10000 20000 30000 40000 50000 Fig 1A: Poisoning and Motor Vehicle Deaths Poisoning Drug Poisoning Vehicle 1983 1986 1989
American River College Student Equity Disproportionate Impact Analyses Fall 2015
 Disproportionate Impact Analyses Fall 2015 This document introduces the set of data ARC s Research Office compiled in Fall 2015. The data reported here were sourced from the California Community College
Michigan Population Trends: The School Age Population
 Michigan Population Trends: The School Age Population Eric Guthrie Michigan s State Demographer January 16, 2018 State Demographer Michigan s liaison with the U.S. Census Bureau for most programs including
Latest Trends in Child Pedestrian Safety. A Five Year Review
 Latest Trends in Child Pedestrian Safety A ive Year Review October 2007 The Problem Between 1995 and 2004, the total number of children ages 14 and under killed as pedestrians decreased by 40 percent 1.
Key Ward Information - Cowes South and Northwood (part of the Cowes cluster of wards)
") Key Ward Information - Cowes South and Northwood - 2017 (part of the Cowes cluster of wards) This report has been designed to support provide data and information about Cowes South and Northwood and compare
Key Ward Information - Cowes South and Northwood - 2017 (part of the Cowes cluster of wards) This report has been designed to support provide data and information about Cowes South and Northwood and compare
SECTION 1. The current state of global road safety
 SECTION 1 The current state of global road safety The number of road traffic deaths each year has not increased but remains unacceptably high at 1.24 million per year. Many countries have successfully
Lookout Valley/Lookout Mountain
 Neighborhoods Lookout Valley/Lookout Mountain State Hwy 27 Palisades W Us Hwy 27 State Hwy 8 5 1 2 Miles State Hwy 58 State Hwy 134 Us Hwy 41 I 24 Wauhatchie I 24 Us Hwy 11 State Hwy 318 State Hwy 148
Elements for a public summary
 VI.2 VI.2.1 Elements for a public summary Overview of disease epidemiology Prostate gland enlargement is a common condition as men get older. Also called benign prostatic hyperplasia (BPH) and prostatic
Agenda. US-1 Corridor Study and HIA Update. Pathway Diagram / Primary Indicators. Research Questions. Linking Multimodal Improvements to Indicators
 Icebreaker Agenda US-1 Corridor Study and HIA Update Pathway Diagram / Primary Indicators Research Questions Linking Multimodal Improvements to Indicators Vulnerable Populations US-1 Corridor Study Vision
Wildlife Ad Awareness & Attitudes Survey 2015
 Wildlife Ad Awareness & Attitudes Survey 2015 Contents Executive Summary 3 Key Findings: 2015 Survey 8 Comparison between 2014 and 2015 Findings 27 Methodology Appendix 41 2 Executive Summary and Key Observations
The Wilson and Jungner principles of screening and genetic testing
 Leeds Institute of Health Sciences The Wilson and Jungner principles of screening and genetic testing Professor Darren Shickle Academic Unit of Public Health European Forum for Evidenced-based Prevention
A SURVEY OF 1997 COLORADO ANGLERS AND THEIR WILLINGNESS TO PAY INCREASED LICENSE FEES
 Executive Summary of research titled A SURVEY OF 1997 COLORADO ANGLERS AND THEIR WILLINGNESS TO PAY INCREASED LICENSE FEES Conducted by USDA Forest Service Rocky Mountain Research Station Fort Collins,
Blueprint for Active Living Communities: Innovative Solutions. James Sallis University of California, San Diego For IOM PA Workshop.
 Blueprint for Active Living Communities: Innovative Solutions James Sallis University of California, San Diego For IOM PA Workshop. April 15, 2015 Outline of Talk Do built environments matter? Progress
Water Safety New Zealand Drowning Prevention Report
 Water Safety New Zealand Drowning Prevention Report 2017 2017 Overview Drowning is the respiratory impairment of lungs due to submersion/immersion in liquid.* It can be fatal (mortality), or non-fatal
Wenlin Liu, Senior Economist. Stateof Wyoming. Economic Analysis Division State of Wyoming 1
 WYOMING DEMOGRAPHIC AND ECONOMIC TREND LCCC LIFE Program April 7, 2012 Cheyenne, Wyoming Wenlin Liu, Senior Economist Economic Analysis Division Stateof Wyoming Economic Analysis Division State of Wyoming
Colorado Economic Update
 Colorado Economic Update Steamboat Economic Summit Place cover image here Brian Lewandowski Associate Director, Business Research Division October 21, 2016 Recession 8 Months Recession 18 Months Real GDP
BSA New Zealand All District Health Board Coverage Report
 BSA New Zealand All District Health Board Coverage Report For the period ending 31 March 2018 Citation: Ministry of Health. April 2018. BSA New Zealand District Health Board Coverage Report: period ending
UNITED NATIONS MALAWI DELIVERING TOGETHER FOR MALAWI
 UNITED NATIONS MALAWI DELIVERING TOGETHER FOR MALAWI Resident Entities (Agencies, Funds and Programmes) Foreword... 2 Introduction... 4 United Nations in Malawi... 5 United Nations Development Assistance
Nebraska s Population and Economic Trends
 Nebraska s Population and Economic Trends Jerry Deichert, David Drozd UNO Center for Public Affairs Research Twenty-first Annual Nebraska State Data Center Summer Conference August 17, 2010 CPACS Collaborating
CARJACKING. in New Jersey
 CARJACKING in New Jersey 2 01 6 TWENTY-FOURTH ANNUAL CARJACKING OFFENSE REPORT 2016 Honorable Gurbir S. Grewal Attorney General State of New Jersey Patrick J. Callahan Colonel New Jersey State Police Major