Pre and Post Dredging Coral Health Monitoring
|
|
|
- Hilda Parks
- 5 years ago
- Views:
Transcription


1 Pre and Post Dredging Coral Health 11/08/16 Level 31, 12 Creek St Brisbane QLD 4000 Australia EN-REP
2 Disclaimer This report has been prepared on behalf of and for the exclusive use of RTA Weipa, and is subject to and issued in accordance with the agreement between RTA Weipa and Advisian. Advisian accepts no liability or responsibility whatsoever for it in respect of any use of or reliance upon this report by any third party. Copying this report without the permission of RTA Weipa and Advisian is not permitted. Project No: EN-REP-0003 Pre and Post Dredging Coral Health : Rev Description Author Review 0 For Client Use Advisian Approval Date 11/08/16 S Neale J Kennedy J Kennedy
3 Table of Contents 1 Introduction Coral Heath Methods Site Selection Image Capture and Analysis Data Analysis Data QAQC Image Analysis Results Coral Health Power analysis of pre dredging data Statistical analysis Conclusion References Appendix A: Survey and Site Benthic Group Data statistical summary Appendix B: Survey and Site Hard Coral Growth Form data statistical summary Appendix C: Examples of the typical benthic community at each site Appendix D: Survey and Site Benthic Group data statistical summary Figures Figure 2-1 Coral monitoring sites and towed video transects... 4 Figure 2-2 Screen shot of the AIMS Reefmon data entry screen showing five fixed points superimposed onto a captured still from site R Figure 3-1 Percentage cover of the broad benthic groups at each site for each survey... 9 Figure 3-2 Percentage cover of the broad benthic groups for reference and concern sites (pooled) during each survey... 10
4 Figure 3-3 Examples of bleached hard and soft corals from Reference Site 2 (R2). Top left Porites spp. Top Right small bleached and non-bleached soft coral colonies. Bottom left -bleached Turbinaria spp. Corals, Bottom Right bleached Turbinaria spp. Adjacent to non-bleached Turbinaria spp Figure 3-4 Percentage cover of bleached hard and soft corals at each site for each survey Figure 3-5 Hard and soft coral bleaching percentage cover for each survey when data is pooled at the concern and reference level Tables Table 2-1 Start and end GPS points (WGS 84 UTM Zone 54) of the towed video transects at each monitoring site... 3 Table 2-2 Percentage cover results between observers for each broad benthic group for each survey... 7 Table 3-1 Hard coral cover at concern and reference sites (pooled) during each survey Table 3-2 Hard and soft coral bleaching data for reference and concern sites (pooled) during each survey Table 3-3 Summary results of the statistical analysis of changes in hard coral cover over time... 17
5 1 Introduction The Amrun Project (formerly South of Embley) involves the construction and operation of a bauxite mine and associated processing and port facilities to be located near Boyd Point on the western side of Cape York Peninsula. The Amrun Project is being developed and operated by Rio Tinto Weipa Pty Ltd, a wholly-owned subsidiary of Rio Tinto Aluminium Limited. A detailed description of the project is provided in the Queensland EIS (RTA 2011), The Queensland SEIS (RTA 2012), and the Commonwealth EIS (RTA 2013). The Amrun Project requires the construction and operation of a new Port facility located between Boyd Point and Pera Head. The marine works will include the construction of a jetty, wharf and ship loaders, which required capital dredging of berth pocket and approach and departure channel. Dredging was completed between 26 March and 09 April The campaign consisted of removal and disposal of approximately 202,416m 3 of material. Telemetered water quality monitoring completed during the campaign recorded no dredging related impacts. The coral health monitoring program is designed to provide a quantitative measure of coral health (percent bleaching and/or mortality) which can be assessed against management triggers as outlined in the Coral Health Management Process. This process is detailed in Section 2.2 and Figure 13 of the South of Embley Project - Dredge Management Plan (DMP) Port (Initial Capital Dredging) RTA (November, 2015). This document outlines the results of the pre-dredging baseline towed video camera surveys and the two post-dredging towed video camera surveys (1 month post - May 2016 and 2 month post - June 2016) of monitoring sites I1, I2, I3, I4, R1 and R2. 2 Coral Heath Methods Coral monitoring surveys were completed as follows: Baseline survey was completed on 24 th and 25 th of February 2016 (Survey 1) 1 month post dredge surveys was completed on 19 May 2016 (Survey 2) 2 month post dredge survey was completed on 18 June 2016 (Survey 3) All surveys were undertaken using a towed Delta Vision Industrial Colour Underwater Video Camera and Pro Package mounted facing down on a specialist frame. The video image was viewed live on screen and recorded directly onto a hard drive. It is important to note the one month post coral surveys were originally scheduled for 9 May 2016, however surveys were delayed due to poor weather. 1
6 2.1 Site Selection As per the requirements set out in the approved DMP (RTA, November 2015), six coral monitoring locations were surveyed - I1, I2, I3, I4, R1 and R2. As per DMP, at each site areas of highest coral cover were targeted for towed video transect survey as close as possible to the water quality monitoring sites. During the pre-dredging survey, several test towed video transects were undertaken by the team using the towed video to determine an appropriate area of seafloor to commence surveys at each of the six locations. The depauperate patchy nature of the coral community at each site meant that once an area of relatively high coral cover at least 150m long and on a similar depth contour was found, this area was targeted for transect survey. The most appropriate way to survey this patchy community was to run the transects in a line along a similar depth contour aligned with the prevailing current and wind. Having determined the area with relatively high coral cover, four transects 30m long and approximately 10m apart were run along a contour between 3-6m deep depending on the particular monitoring location depth characteristics. Transects were recorded using a towed video system with camera oriented to face the seabed. These same sites were surveyed during the 1 month and 2 month post dredging surveys. The sites and indicative locations of transects are provided in Figure 2-1. The start and end points of the sites and each transect were recorded to GPS along with the track taken by the vessel (Table 2-1).
7 Table 2-1 Start and end GPS points (WGS 84 UTM Zone 54) of the towed video transects at each monitoring site Site Transect Depth (m) Start End Easting Northing Easting Northing I I I I R R

8 Figure 2-1 Coral monitoring sites and towed video transects 4
9 2.2 Image Capture and Analysis At each monitoring location, the video was reviewed at the end of the fourth transect by the technical lead to ensure the image quality was acceptable. If the images were not acceptable the process was repeated along the same transect path Data Analysis The method of analysis was based on two Standard Operational Procedures used by the Australian Institute of Marine Science (AIMS). Australian Institute of Marine Science Standard Operational Procedure Number 2 - Surveys of Benthic Reef Communities Using Underwater Video (AIMS 2004) 1 Australian Institute of Marine Science Standard Operational Procedure Number 10 - Surveys of Benthic Reef Communities Using Underwater Digital Photography and Counts of Juvenile Corals (AIMS 2008) 1 The AIMS method was considered best practise and is the basis of analysis used by the AIMS Long Term Program since The method used is summarised below. For each transect, 40 captured images were analysed using the publicly available Reef program (Reefmon) 2 developed by AIMS. This program superimposes five fixed points on each captured image and the benthic category under each point entered into the AIMS Reefmon program. This equates to 200 points sampled along each 30m transect. The program allows for each point to be zoomed into allowing for better categorisation of the benthic category under the point. A screen shot of the Reefmon data input program is provided in Figure 2-2. The fixed points superimposed on each screen are numbered in the flowing order; top left=1, top right=2, centre=3, bottom left=4, bottom right=5. All the data is then stored in an Oracle database and linked to an Access database. Percentage cover data for all benthic organisms at all levels of resolution (broad group, growth form, family, genus and species) can then be calculated from this data
 independently; the results are presented in Table 2-2.")
10 Figure 2-2 Screen shot of the AIMS Reefmon data entry screen showing five fixed points superimposed onto a captured still from site R Data QAQC For each survey trip, forty images were chosen across all sites which represent of range of benthic groups encountered during the analysis. These images were analysed by both experienced analysts (Steve Neale and Cathie Page) independently; the results are presented in Table 2-2. The percentage cover estimates for the hard coral cover differed by only 0.5% between observers for the pre dredge and 2 month post dredging QAQC images bolded in Table 2-2. This 0.5% difference represents a difference between observers for this group of approximately 2.3% for a hard coral cover of 21.5% (pre dredging) and 2.2% for a hard coral cover of 22.5% (2 month post dredging). The largest differences between observers were in characterising the four broad categories, turf algae, macroalgae, sponge and sand. Reviewing the results indicated that the majority of the differences between observers were due to two issues; the point falling on a border of two different benthic groups (for example on the border between sand and turf algae on hard substrate or on the border between sponge and turf algae) and the interpretation between macroalge (fleshy structure) and turf algae (filamentous structure and encrusting like).
11 Table 2-2 Percentage cover results between observers for each broad benthic group for each survey Benthic Group pre dredging Survey 1 1 month post dredging Survey 2 2 month post dredging Survey 3 CP SN Difference CP SN Difference CP SN Difference Indeterminate Hard Coral Macro Algae Other Sand Sponge Soft Coral Turf Algae SN = Stephen Neale, CP=Cathie Page 3 Image Analysis Results The results of the image analysis for the three surveys are represented as a series of box plots or tabulated statistical summaries broken into three different categories: 1. Site specific percentage covers of the broad benthic categories for each survey which includes Hard Coral, Soft Coral, Macroalgae, Sponges, Turf Algae, Sand, Other (e.g. Zooanthids, Ascidians and anemones), and Indeterminate are presented in Appendix A and Figure Percentage covers of hard coral cover for reference and concern sites (pooled) are presented in Table 3-1and Figure Percentage covers of each hard coral growth form for all reference and concern sites for all surveys are provided in Appendix B
12 Photographic examples of the typical benthic community encountered at each site are provided in Appendix C Box plot description: The line within the box represents the mean percentage cover, the extent of box represents plus or minus the Standard Error (SE) and the whiskers represent plus or minus 2 standard deviations from the mean. The percentage cover values presented in the following sections are presented ±SE. During survey 1, the mean hard coral percentage cover was highest at Site R2 (23.6±4.5%) and lowest at site I1 (4.4±1.0%; Appendix A and Figure 3-1). During survey 2, the mean hard coral percentage cover was highest at Site R2 (23.0±1.8%) and lowest at site I1 (2.8±1.6%). During survey 3, the mean hard coral percentage cover was highest at Site R2 (24.5±1.4%) and lowest at site I1 (2.8±1.0%). During all surveys the seafloor at all sites was dominated by sand, turf algae or macroalgae or combinations of these three groups. The mean hard coral percentage cover at concern sites (pooled) was consistent across all surveys ranging from 9.3±1.4% during survey 2 to 10.7±2.2% during survey 3 (Table 3-1 and Figure 3-2). The mean hard coral percentage cover at reference sites (pooled) was approximately twice the cover observed at the concern sites and also consistent across all surveys ranging from 18.1±2.2% during survey 2 to 20.3±1.8% during survey 3. The growth forms of the hard coral community differed at each site but were primarily dominated by encrusting, foliose and massive growth forms, which is typical of inshore reefs. Branching Acropora colonies were occasionally found at sites I3 and R2 (Appendix B).
13 Figure 3-1 Percentage cover of the broad benthic groups at each site for each survey 9
14 Table 3-1 Hard coral cover at concern and reference sites (pooled) during each survey Survey Description n Mean Min Max Std.Dev. Standard Error 1 Concern Reference Concern Reference Concern Reference Figure 3-2 Percentage cover of the broad benthic groups for reference and concern sites (pooled) during each survey
15 3.1.1 Coral Health Hard and soft coral bleaching was observed during all surveys and at all sites (Appendix D and Figure 3-4), peaking during survey 2. The percentage cover of hard and soft coral bleaching during each survey when data from all reference and concern sites are pooled is provided in Table 3-2 and Figure 3-5. Refer to previous section for box plot description. During survey 1, the highest mean hard coral bleaching of 2.0±0.9% and soft coral bleaching of 2.8±0.5% was recorded at reference site R2 where the highest coral cover was also observed. The remaining sites recorded between 0% and 0.8% mean hard and soft coral bleaching. Examples of the hard and soft coral bleaching observed at reference site R2 are provided in Figure 3-3. Hard and soft coral bleaching was generally higher at all sites during survey 2. The highest mean hard coral bleaching of 14.3±1.2% was recorded at reference site R2 which represented over 50% of all coral observed. The mean soft coral bleaching of 4.3±1.1% was recorded at concern site I2. During survey 3, hard and soft coral bleaching returned to the levels recorded during survey 1, the highest mean hard coral and soft coral bleaching of 2.4±0.2% and 1.0±1.5%, respectively was recorded at Reference Site R2. At all remaining sites the mean percentage hard and soft coral bleaching was below 2%. When the site data is pooled into concern and reference sites, the highest mean hard coral bleaching of 10.6±1.5% and 3.9±0.8% occurred at reference and concern sites, respectively, during survey 2. During this survey the percentage cover of bleached corals was consistent across both reference and concern sites representing approximately half of all hard corals recorded. During all surveys no unusual amounts of sediment on coral, coral disease or obvious coral mucous was observed.


16 Figure 3-3 Examples of bleached hard and soft corals from Reference Site 2 (R2). Top left Porites spp. Top Right small bleached and non-bleached soft coral colonies. Bottom left -bleached Turbinaria spp. Corals, Bottom Right bleached Turbinaria spp. Adjacent to non-bleached Turbinaria spp.
17 Figure 3-4 Percentage cover of bleached hard and soft corals at each site for each survey
18 Table 3-2 Hard and soft coral bleaching data for reference and concern sites (pooled) during each survey Benthic Group Survey Site n Mean Min Max Std.Dev. Standard Error Hard Coral 1 Concern Soft Coral 1 Concern Hard Coral 1 Reference Soft Coral 1 Reference Hard Coral 2 Concern Soft Coral 2 Concern Hard Coral 2 Reference Soft Coral 2 Reference Hard Coral 3 Concern Soft Coral 3 Concern Hard Coral 3 Reference Soft Coral 3 Reference
19 Figure 3-5 Hard and soft coral bleaching percentage cover for each survey when data is pooled at the concern and reference level
20 3.1.2 Power analysis of pre dredging data The results of the power analysis on the pre dredging data are detailed in the Baseline Coral Health Report ( EN-REP-0002). The aim of the power analysis was to confirm that statistical power is sufficient to detect a 10% change in coral cover between sites and between the baseline and subsequent sampling trips. The results showed that a 10% change in coral cover would be considered to be a large effect size. The power to detect an effect this size with the sampling design is 1.00, which is the highest possible probability of detecting an effect if one is actually present Statistical analysis An Analysis of Variance (ANOVA) using a linear mixed effect model in Minitab 17 was performed on the percentage cover data from all surveys for the benthic group - Hard Coral. The analysis examined the significance of three factors: Survey number Site Transect (nested within Site) Prior to the analysis the hard coral percentage cover data was transformed. The result of the analysis is provided in Table 3-3. Significant interactions (p<0.05) are bolded in this table. There was a significant difference in hard coral cover between sites (P=0.000) but no significant difference was found for the interaction between Site and Survey number for hard coral cover (p>0.05). This suggests that there has been no statistically detectable change in hard coral cover across sites over time. In addition the linear model used had reasonably high adjusted r-squared values (>40%) which provides confidence that the model captures a substantial proportion of local environmental variability.
21 Table 3-3 Summary results of the statistical analysis of changes in hard coral cover over time Factor Degrees of freedom Adjusted Sum of Squares Adjusted Mean Square F-Value P-Value Survey Reef Transect (Reef) Survey x Reef Error Total
22 4 Conclusion Hard coral cover on four 30m long towed video transects at each of four concern sites and two reference sites was measured prior to dredging (February 2016), approximately one month post dredging (May 2016) and approximately two months after dredging (June 2016). Analysis of the results found no statistical difference (or change) in the hard coral cover at each site across the three surveys. Coral bleaching was evident during all surveys and peaked during the May 2016 survey; predominately at the reference sites where hard coral cover was the highest. The dominant hard corals found at each site were form the genera Turbinaria spp and Porites spp and from the Faviidae family; all are typically found in turbid inshore environments. The growth forms of the hard coral community differed at each site but were primarily dominated by encrusting, foliose and massive growth forms, also typical of growth forms found at inshore reefs Visual signs of stress such as excessive mucous were not observed on coral colonies at any site during any survey. Small amounts of sediment were observed on Turbinaria spp. corals (refer to Figure 3-3 lower right image) which is typical for species with a cup (or foliose) shaped growth form. No amounts of sediment on coral colonies with other growth forms (encrusting, massive or branching) was observed on the video transects at any site during any survey. The dredging operations did not appear to cause any loss of hard coral cover at sites of concern nor cause any sedimentation related stress. The temporal (February 2016 to June 2016) and spatial (all sites of concern and reference sites) scale of the coral bleaching recorded make it highly unlikely that the bleaching was in any way caused or exacerbated by the dredge related activities. The bleaching appears to be related to the wider sustained elevations of sea temperatures observed across northern tropical waters between February and April 2016 (BOM 2016); which was responsible for wide scale coral bleaching observed in the Northern GBR.
23 5 References AIMS (2004). Australian Institute of Marine Science Standard Operational Procedure Number 2 - Surveys of Benthic Reef Communities Using Underwater Video. AIMS (2008). Australian Institute of Marine Science Standard Operational Procedure Number 10 - Surveys of Benthic Reef Communities Using Underwater Digital Photography and Counts of Juvenile Corals. BOM (2016). Bureau of Metrology ENSO Wrap-Up archive Current State of the Pacific and Indian Ocean sea surface temperatures (weekly and monthly), available online at:
24 Appendix A: Survey and Site Benthic Group Data statistical summary Benthic Group Survey Site n Mean Min Max Std. Dev Standard Error Hard Coral 1 I Soft Coral 1 I Macroalgae 1 I Sponge 1 I Turf algae 1 I Sand 1 I Other 1 I Indeterminate 1 I Hard Coral 1 I Soft Coral 1 I Macroalgae 1 I Sponge 1 I Turf algae 1 I Sand 1 I Other 1 I Indeterminate 1 I Hard Coral 1 I
25 Benthic Group Survey Site n Mean Min Max Std. Dev Standard Error Soft Coral 1 I Macroalgae 1 I Sponge 1 I Turf algae 1 I Sand 1 I Other 1 I Indeterminate 1 I Hard Coral 1 I Soft Coral 1 I Macroalgae 1 I Sponge 1 I Turf algae 1 I Sand 1 I Other 1 I Indeterminate 1 I Hard Coral 1 R Soft Coral 1 R Macroalgae 1 R Sponge 1 R Turf algae 1 R
26 Benthic Group Survey Site n Mean Min Max Std. Dev Standard Error Sand 1 R Other 1 R Indeterminate 1 R Hard Coral 1 R Soft Coral 1 R Macroalgae 1 R Sponge 1 R Turf algae 1 R Sand 1 R Other 1 R Indeterminate 1 R Hard Coral 2 I Soft Coral 2 I Macroalgae 2 I Sponge 2 I Turf algae 2 I Sand 2 I Other 2 I Indeterminate 2 I Hard Coral 2 I
27 Benthic Group Survey Site n Mean Min Max Std. Dev Standard Error Soft Coral 2 I Macroalgae 2 I Sponge 2 I Turf algae 2 I Sand 2 I Other 2 I Indeterminate 2 I Hard Coral 2 I Soft Coral 2 I Macroalgae 2 I Sponge 2 I Turf algae 2 I Sand 2 I Other 2 I Indeterminate 2 I Hard Coral 2 I Soft Coral 2 I Macroalgae 2 I Sponge 2 I Turf algae 2 I
28 Benthic Group Survey Site n Mean Min Max Std. Dev Standard Error Sand 2 I Other 2 I Indeterminate 2 I Hard Coral 2 R Soft Coral 2 R Macroalgae 2 R Sponge 2 R Turf algae 2 R Sand 2 R Other 2 R Indeterminate 2 R Hard Coral 2 R Soft Coral 2 R Macroalgae 2 R Sponge 2 R Turf algae 2 R Sand 2 R Other 2 R Indeterminate 2 R Hard Coral 3 I
29 Benthic Group Survey Site n Mean Min Max Std. Dev Standard Error Soft Coral 3 I Macroalgae 3 I Sponge 3 I Turf algae 3 I Sand 3 I Other 3 I Indeterminate 3 I Hard Coral 3 I Soft Coral 3 I Macroalgae 3 I Sponge 3 I Turf algae 3 I Sand 3 I Other 3 I Indeterminate 3 I Hard Coral 3 I Soft Coral 3 I Macroalgae 3 I Sponge 3 I Turf algae 3 I
30 Benthic Group Survey Site n Mean Min Max Std. Dev Standard Error Sand 3 I Other 3 I Indeterminate 3 I Hard Coral 3 I Soft Coral 3 I Macroalgae 3 I Sponge 3 I Turf algae 3 I Sand 3 I Other 3 I Indeterminate 3 I Hard Coral 3 R Soft Coral 3 R Macroalgae 3 R Sponge 3 R Turf algae 3 R Sand 3 R Other 3 R Indeterminate 3 R Hard Coral 3 R
31 Benthic Group Survey Site n Mean Min Max Std. Dev Standard Error Soft Coral 3 R Macroalgae 3 R Sponge 3 R Turf algae 3 R Sand 3 R Other 3 R Indeterminate 3 R
32 Appendix B: Survey and Site Hard Coral Growth Form data statistical summary Benthic Group Survey Site n Mean Min Max Std. Dev Standard Branching Acropora 1 I Branching non-acropora 1 I Encrusting non-acropora 1 I Foliose non-acropora 1 I Massive non-acropora 1 I Submassive non-acropora 1 I Tabulate Acropora 1 I Branching Acropora 1 I Branching non-acropora 1 I Encrusting non-acropora 1 I Foliose non-acropora 1 I Massive non-acropora 1 I Submassive non-acropora 1 I Tabulate Acropora 1 I Branching Acropora 1 I Branching non-acropora 1 I Encrusting non-acropora 1 I Foliose non-acropora 1 I
33 Benthic Group Survey Site n Mean Min Max Std. Dev Standard Massive non-acropora 1 I Submassive non-acropora 1 I Tabulate Acropora 1 I Branching Acropora 1 I Branching non-acropora 1 I Encrusting non-acropora 1 I Foliose non-acropora 1 I Massive non-acropora 1 I Submassive non-acropora 1 I Tabulate Acropora 1 I Branching Acropora 1 R Branching non-acropora 1 R Encrusting non-acropora 1 R Foliose non-acropora 1 R Massive non-acropora 1 R Submassive non-acropora 1 R Tabulate Acropora 1 R Branching Acropora 1 R Branching non-acropora 1 R Encrusting non-acropora 1 R
34 Benthic Group Survey Site n Mean Min Max Std. Dev Standard Foliose non-acropora 1 R Massive non-acropora 1 R Submassive non-acropora 1 R Tabulate Acropora 1 R Branching Acropora 2 I Branching non-acropora 2 I Encrusting non-acropora 2 I Foliose non-acropora 2 I Massive non-acropora 2 I Submassive non-acropora 2 I Tabulate Acropora 2 I Branching Acropora 2 I Branching non-acropora 2 I Encrusting non-acropora 2 I Foliose non-acropora 2 I Massive non-acropora 2 I Submassive non-acropora 2 I Tabulate Acropora 2 I Branching Acropora 2 I Branching non-acropora 2 I
35 Benthic Group Survey Site n Mean Min Max Std. Dev Standard Encrusting non-acropora 2 I Foliose non-acropora 2 I Massive non-acropora 2 I Submassive non-acropora 2 I Tabulate Acropora 2 I Branching Acropora 2 I Branching non-acropora 2 I Encrusting non-acropora 2 I Foliose non-acropora 2 I Massive non-acropora 2 I Submassive non-acropora 2 I Tabulate Acropora 2 I Branching Acropora 2 R Branching non-acropora 2 R Encrusting non-acropora 2 R Foliose non-acropora 2 R Massive non-acropora 2 R Submassive non-acropora 2 R Tabulate Acropora 2 R Branching Acropora 2 R
36 Benthic Group Survey Site n Mean Min Max Std. Dev Standard Branching non-acropora 2 R Encrusting non-acropora 2 R Foliose non-acropora 2 R Massive non-acropora 2 R Submassive non-acropora 2 R Tabulate Acropora 2 R Branching Acropora 3 I Branching non-acropora 3 I Encrusting non-acropora 3 I Foliose non-acropora 3 I Massive non-acropora 3 I Submassive non-acropora 3 I Tabulate Acropora 3 I Branching Acropora 3 I Branching non-acropora 3 I Encrusting non-acropora 3 I Foliose non-acropora 3 I Massive non-acropora 3 I Submassive non-acropora 3 I Tabulate Acropora 3 I
37 Benthic Group Survey Site n Mean Min Max Std. Dev Standard Branching Acropora 3 I Branching non-acropora 3 I Encrusting non-acropora 3 I Foliose non-acropora 3 I Massive non-acropora 3 I Submassive non-acropora 3 I Tabulate Acropora 3 I Branching Acropora 3 I Branching non-acropora 3 I Encrusting non-acropora 3 I Foliose non-acropora 3 I Massive non-acropora 3 I Submassive non-acropora 3 I Tabulate Acropora 3 I Branching Acropora 3 R Branching non-acropora 3 R Encrusting non-acropora 3 R Foliose non-acropora 3 R Massive non-acropora 3 R Submassive non-acropora 3 R
38 Benthic Group Survey Site n Mean Min Max Std. Dev Standard Tabulate Acropora 3 R Branching Acropora 3 R Branching non-acropora 3 R Encrusting non-acropora 3 R Foliose non-acropora 3 R Massive non-acropora 3 R Submassive non-acropora 3 R Tabulate Acropora 3 R


39 Appendix C: Examples of the typical benthic community at each site Typical benthic community found at Concern Site I1 large patches of sand with occasional hard corals and macroalgae Typical benthic community found at Concern Site I2 large boulders covered in turf algae, sponges and macroalgae with occasional hard corals Typical benthic community found at Concern Site I3 undulating hard substrate covered in turf algae, sponge, hard corals and macroalgae, occasional patches of sand in the channels between hard substrate.


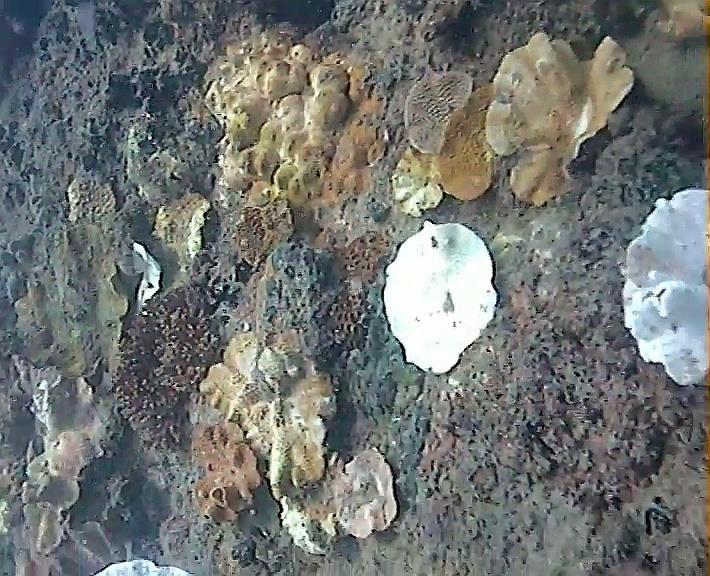
40 Typical benthic community found at Concern Site I4 low relief undulating hard substrate covered in turf algae, sponge, hard corals and macroalgae, occasional patches of sand in the channels between hard substrate. Typical benthic community found at Concern Site R1 large patches of sand with occasional hard corals and macroalgae growing on small patches of low relief hard substrate Typical benthic community found at Concern Site R2 low relief undulating hard substrate covered in turf algae, sponge, hard corals and macroalgae, occasional patches of sand in the channels between hard substrate. Some areas of high hard coral cover.
41 Appendix D: Survey and Site bleached coral data statistical summary Benthic Group Survey Site n Mean Min Max Std.Dev. Standard Error Hard Coral 1 I Soft Coral 1 I Hard Coral 1 I Soft Coral 1 I Hard Coral 1 I Soft Coral 1 I Hard Coral 1 I Soft Coral 1 I Hard Coral 1 R Soft Coral 1 R Hard Coral 1 R Soft Coral 1 R Hard Coral 2 I Soft Coral 2 I Hard Coral 2 I Soft Coral 2 I
42 Benthic Group Survey Site n Mean Min Max Std.Dev. Standard Error Hard Coral 2 I Soft Coral 2 I Hard Coral 2 I Soft Coral 2 I Hard Coral 2 R Soft Coral 2 R Hard Coral 2 R Soft Coral 2 R Hard Coral 3 I Soft Coral 3 I Hard Coral 3 I Soft Coral 3 I Hard Coral 3 I Soft Coral 3 I Hard Coral 3 I Soft Coral 3 I Hard Coral 3 R Soft Coral 3 R Hard Coral 3 R
43 Benthic Group Survey Site n Mean Min Max Std.Dev. Standard Error Soft Coral 3 R
Reef Check Australia 2009 Great Barrier Reef Survey Season Report
 Reef Check Australia 2009 Great Barrier Reef Survey Season Report Supported by the Australian Government s Marine and Tropical Sciences Research Facility Project 1.1.2 Condition and trend of the Great
Reef Check Australia. Magnetic Island Season Report 2016
 Reef Check Australia Season Report 16 Reef Check Foundation Ltd. (Australia) www.reefcheckaustralia.org PO Box 134 George St Brisbane QLD 43 This report should be cited as: M. Welch, J. Salmond and J.
STATUS OF REEFS AROUND MAGNETIC ISLAND: REEF CHECK AUSTRALIA
 STATUS OF REEFS AROUND MAGNETIC ISLAND: 2003-2006 REEF CHECK AUSTRALIA Zoë Andrews Loren Hartley Jos Hill April 2006 1 INTRODUCTION The purpose of this project was to engage Townsville community members
Mass coral mortality under local amplification of 2 C ocean warming
 Mass coral mortality under local amplification of C ocean warming Thomas M. DeCarlo, Anne L. Cohen, George T.F. Wong, Kristen A. Davis, Pat Lohmann, Keryea Soong correspondence to: tdecarlo@uwa.edu.au
Results of a Suspended Solids Survey at the Whites Point Quarry, Little River, Digby County, Nova Scotia
 Results of a Suspended Solids Survey at the Whites Point Quarry, Little River, Digby County, Nova Scotia Prepared for Global Quarry Products P.O. Box 2113 Digby, Nova Scotia B0V 1A0 By Michael Brylinsky
Appendix 5 Draft Dredge Management Plan River Facilities
 Appendix 5 Draft Dredge Management Plan River Facilities Draft Dredge Management Plan River Facilities for South of Embley Project Contents 1. INTRODUCTION A5-04 1.1 Commonwealth and State Approvals A5-04
STATUS OF REEFS AROUND MAGNETIC ISLAND:
 STATUS OF REEFS AROUND MAGNETIC ISLAND: 2003-2007 REEF CHECK AUSTRALIA Zoë Andrews Loren Hartley Jos Hill Revised by Steven Prutzman Tara Swansborough Jos HIll February 2008 TABLE OF CONTENTS STATUS OF
Recovery of Coral Populations at Helen Reef Atoll after a Major Bleaching Event
 Recovery of Coral Populations at Helen Reef Atoll after a Major Bleaching Event Yimnang Golbuu 1, Jay Andrew 1, Geory Mereb 1, Robert van Woesik 2 1 Palau International Coral Reef Center 2 Florida Institute
Nearshore Habitat Mapping in Puget Sound Using Side Scan Sonar and Underwater Video
 Nearshore Habitat Mapping in Puget Sound Using Side Scan Sonar and Underwater Video Dana Woodruff, Paul Farley, Amy Borde, John Southard, Ron Thom Battelle Marine Sciences Laboratory Jim Norris Marine
Technical and Financial Proposal
 Technical and Financial Proposal Marine Survey of Montego Bay Marine Park Assessment of Reef Health for Management Recommendations Dayne Buddo Ph.D. Marine Ecologist April 24, 2014. Marine Survey Montego
Monitoring the length structure of commercial landings of albacore tuna during the fishing year
 SCTB15 Working Paper ALB-5 Monitoring the length structure of commercial landings of albacore tuna during the 2001 2002 fishing year Linda Griggs National Institute of Water and Atmospheric Research Ltd.
COASTAL RESOURCE ASSESSMENTS AT QUONSET-DAVISVILLE, RHODE ISLAND: LOBSTERS AND MARINE HABITAT
 COASTAL RESOURCE ASSESSMENTS AT QUONSET-DAVISVILLE, RHODE ISLAND: LOBSTERS AND MARINE HABITAT Tom Shinskey, Jeff Reidenauer, Bernward Hay, The Louis Berger Group, Inc. Jeffrey Grybowski, Office of the
PORTS AUSTRALIA. PRINCIPLES FOR GATHERING AND PROCESSING HYDROGRAPHIC INFORMATION IN AUSTRALIAN PORTS (Version 1.5 November 2012)
") PORTS AUSTRALIA PRINCIPLES FOR GATHERING AND PROCESSING HYDROGRAPHIC INFORMATION IN AUSTRALIAN PORTS (Version 1.5 November 2012) PREFACE These Principles have been prepared by the Hydrographic Surveyors
PORTS AUSTRALIA PRINCIPLES FOR GATHERING AND PROCESSING HYDROGRAPHIC INFORMATION IN AUSTRALIAN PORTS (Version 1.5 November 2012) PREFACE These Principles have been prepared by the Hydrographic Surveyors
Comparison of the Dampier Port Fringing Reef Benthic Community with Nearby Reef Areas
 Comparison of the Dampier Port Fringing Reef Benthic Community with Nearby Reef Areas 3112-1121 22-Dec-9 PCA case scores.6.5 Port site Siderast.4 Axis 2.2 Fungiids Turbinaria.1 Euphylliid Acropora Agariciids
An Camus, Lochboisdale, South Uist
 An Camus, Lochboisdale, South Uist BASELINE VIDEO SURVE Y REPORT 2016 Contents 1.0 Video Survey Analysis... 3 2.0 Appendix 1. Species identified and stills extracted from raw video footage... 5 1.0 Video
Citizen Science Based Survey GBR Far North Dive Trip 2016 April 18-26
 Citizen Science Based Survey GBR Far North Dive Trip 2016 April 18-26 Chris Roelfsema Karen Johnson Douglas Stetner Trevor Baerenger Peran Brady May 2016 GBR Far North Citizen Science Trip 5 May 2016 1
Boulder Island Coral Survey. Project Manaia. Phase one - Final Report
 Boulder Island Coral Survey Project Manaia Phase one - Final Report Thor Jensen & Annika Dose January 2018 Content 1. Coral genera and their abundance in the bays of Boulder Island...3 2. Reef maps...5
Available from Deakin Research Online:
 This is the published version: Hirst, Alastair J., Heislers, Simon, Parry, Gregory D., Werner, Guy F., White, Camille A. and Spooner, Daniel, Port Phillip Bay annual trawl sub program : progress report
Reef Check Australia. Great Sandy Marine Park Reef Health Survey Report 2017
 Reef Check Australia Great Sandy Marine Park Reef Health Survey Report 2017 Reef Check Foundation Ltd M. Welch, J. Salmond. J. Passenger and J. Loder www.reefcheckaustralia.org March 2018 We acknowledge
NEED FOR SUPPLEMENTAL BATHYMETRIC SURVEY DATA COLLECTION
 305 West Grand Avenue, Suite 300 Montvale, New Jersey 07645 Phone 201.930.9890 Fax 201.930.9805 www.anchorqea.com M EMORANDUM To: Caroline Kwan and Nica Klaber U.S. Environmental Protection Agency Region
COMPARISON OF CONTEMPORANEOUS WAVE MEASUREMENTS WITH A SAAB WAVERADAR REX AND A DATAWELL DIRECTIONAL WAVERIDER BUOY
 COMPARISON OF CONTEMPORANEOUS WAVE MEASUREMENTS WITH A SAAB WAVERADAR REX AND A DATAWELL DIRECTIONAL WAVERIDER BUOY Scott Noreika, Mark Beardsley, Lulu Lodder, Sarah Brown and David Duncalf rpsmetocean.com
SEAGRASS MAPPING FOR THE PENRHYN ESTUARY HABITAT ENHANCEMENT PLAN
 SEAGRASS MAPPING FOR THE PENRHYN ESTUARY HABITAT ENHANCEMENT PLAN PREPARED FOR SYDNEY PORTS CORPORATION By D. E. Roberts, S. R. Murray, G. R., Sainty August 2008 TABLE OF CONTENTS INTRODUCTION...3 METHODS...3
QI06081 ISSN
 QI06081 ISSN 0727-6273 First Published 2006 The State of Queensland, Department of Primary Industries and Fisheries, 2006. Copyright protects this publication. The State of Queensland has no objection
SEASFIRE Introduction explore discover create
 SEASFiRE MX2 March 2018 2 SEASFIRE Introduction SEASFiRE organizes citizen science, marine education, and adventure programs which enable you to explore nature, discover the world around you, and create
Two types of physical and biological standards are used to judge the performance of the Wheeler North Reef 1) Absolute standards are measured against
 Absolute standards are measured against") 1 Two types of physical and biological standards are used to judge the performance of the Wheeler North Reef 1) Absolute standards are measured against fixed value at Wheeler North Reef only 2) Relative
1 Two types of physical and biological standards are used to judge the performance of the Wheeler North Reef 1) Absolute standards are measured against fixed value at Wheeler North Reef only 2) Relative
Great Barrier Reef: Bleaching 'kills 35% of area's coral' 8 hours ago From the section Australia
 Great Barrier Reef: Bleaching 'kills 35% of area's coral' 8 hours ago From the section Australia Image copyright AFP Image caption The recovery of coral cover is expected to take a decade or longer, scientists
Annual Measurement of Solar UVB at a Reef Site Using a Polyphenylene Oxide Dosimeter
 Annual Measurement of Solar UVB at a Reef Site Using a Polyphenylene Oxide Dosimeter Alfio Parisi, Nathan Downs, Peter Schouten parisi@usq.edu.au University of Southern Queensland, Toowoomba, Australia
High seas: conservation and management measures to prevent significant adverse impacts on vulnerable marine ecosystems
 High seas: conservation and management measures to prevent significant adverse impacts on vulnerable marine ecosystems ABSTRACT Australia has consented to implement the interim measures adopted in 2007
Protocol 1. Site Conditions Data Sheet
 Protocol 1. Site Conditions Data Sheet Field monitoring Initial Observations Name of site or water body: Coordinates: Date of monitoring: Time of monitoring: Name of monitor(s): (names of all group members)
The Maritime Law Association of Australia and New Zealand
 The Maritime Law Association of Australia and New Zealand Protecting the Environment and Promoting Safe Navigation: Australia s System of Pilotage in the Torres Strait Adam McCarthy Assistant Secretary
Loughborough University Travel Planning
 Document Ti tle Client Name Loughborough University Travel Planning Loughborough University Travel Plan Executive Summary 2015-2020 23 December 2015 Loughborough University Travel Planning Project no:
Great Barrier Reef Season Summary Report 2014 Reef Check Foundation Ltd Annie Bauer Edited by Jennifer Loder
 Reef Check Australia Great Barrier Reef Season Summary Report 214 Reef Check Foundation Ltd Annie Bauer Edited by Jennifer Loder www.reefcheckaustralia.org Reef Check Australia This project is supported
Repeat Monitoring of Seagrass Beds for Project Next Generation Autumn 2016
 Repeat Monitoring of Seagrass Beds for Project Next Generation Autumn 2016 Prepared by April 2016 Project Next Generation: Repeat Seagrass Monitoring: Autumn 2016 1 Repeat Monitoring of Seagrass Beds for
Reef Watch Guidelines
 Reef Watch Guidelines What is Reef Watch? Reef watch is a simple one-dive-one-survey method to record the health of coral reefs. The method is easily learnt and it is even easier to participate in the
Vol. 10, Issue Sunday, December 25, 2005 HAWAII'S CORAL REEFS
 Vol. 10, Issue 359 - Sunday, December 25, 2005 HAWAII'S CORAL REEFS Oh, no! A zit! GRETA AEBY, UNIVERSITY OF HAWAII INSTITUTE FOR MARINE BIOLOGY A growth anomaly (tumor) on rice coral. Coral disease is
Tropical Pacific Ocean remains on track for El Niño in 2014
 1 of 10 3/06/2014 3:33 PM ENSO Wrap-Up Current state of the Pacific and Indian Ocean Tropical Pacific Ocean remains on track for El Niño in 2014 Issued on Tuesday 3 June 2014 Product Code IDCKGEWWOO The
/ Advice May 2011
 1.5.1.3/1.5.4.1 Advice May 2011 ECOREGION SUBJECT General advice Update of cold-water coral and sponge maps and the information underpinning such maps on Vulnerable Marine Habitats (including Hatton and
Summary of Research within Lamlash Bay No-Take Zone - Science report for COAST July
 Summary of Research within Lamlash Bay No-Take Zone - Science report for COAST July 2013 - *Picture of a spider crab (Macropodia spp) inside a plumose anemone. Taken within Lamlash Bay No-Take Zone by
Peninsular Florida Landscape Conservation Cooperative. Priority Resources Marine/Estuarine
 Peninsular Florida Landscape Conservation Cooperative Priority Resources Marine/Estuarine Draft Priority Resources Sub Resources Salt Marsh Mangrove Coral Seagrass Selected Classification systems Cooperative
Assessing the effectiveness of surrogates for conserving biodiversity in the Port Stephens-Great Lakes Marine Park
 Assessing the effectiveness of surrogates for conserving biodiversity in the Port Stephens-Great Lakes Marine Park Vanessa Owen B Env Sc, B Sc (Hons) School of the Environment University of Technology
ACT NOW for the future of our reefs
 Do It Yourself Kit WWW.CORALWATCH.ORG ACT NOW for the future of our reefs Rising water temperatures are a major contributor to mass coral bleaching events. Get involved in CoralWatch to monitor and protect
ATLANTIC STATES MARINE FISHERIES COMMISSION. Winter Flounder Abundance and Biomass Indices from State Fishery-Independent Surveys
 ATLANTIC STATES MARINE FISHERIES COMMISSION Winter Flounder Abundance and Biomass Indices from State Fishery-Independent Surveys Technical Committee Report to the Winter Flounder Management Board February
Amrun Project Feral Animal Monitoring Annual Report August 2018
 Amrun Project Feral Animal Monitoring Annual Report August 2018 A report prepared in accordance with requirements of the Amrun Project EPBC Act Approval 2010/5642, Terrestrial Management Plan, Construction
Understanding shelf-break habitat for sustainable management of fisheries with spatial overlap
 Understanding shelf-break habitat for sustainable management of fisheries with spatial overlap Alan Williams Caleb Gardner Franziska Althaus Bruce Barker David Mills Final Report to the Fisheries Research
Assessing the Accuracy of High Spatial Resolution Effort Data
 Assessing the Accuracy of High Spatial Resolution Effort Data Southwest Fisheries Science Center, Ecology Division Comparing VMS and Logbook Data in the California Groundfish Trawl Fishery Alice Thomas-Smyth,
Oceanic Society Reef Research Team: Nicole Crane, Avigdor Abelson, Peter Nelson, Giacomo Bernardi, Michelle Paddack, Kate Crosman
 The coral reef of Tamil (Yap, FSM): Preliminary ecological assessment of reef state and fish assemblages, and potential of conservation for sustainable use Report compiled by vigdor belson, Peter Nelson
Bonaire National Marine Park Hurricane Matthew Reef Damage Assessment
 Bonaire National Marine Park Hurricane Matthew Reef Damage Assessment Hurricane Matthew passed north of Bonaire on September 23 rd, 2016. After it passed Aruba, it decelerated, and then it slowly began
Comparison of Coral Diversity Across Three Reef Habitats
 Biodiversity of Borneo Project 2: Coral Reefs Coral Diversity Study Comparison of Coral Diversity Across Three Reef Habitats Marcel Alfasisurya.S.A, Ross McFarland, Charlie Ryland, Olivia Tandon, Kore
A FINAL REPORT BY PARTRAC LIMITED: MAY 2006
 A FINAL REPORT BY PARTRAC LIMITED: MAY 26 Measurement of Suspended Sediment Concentration & Tidal Current During Dredging Operations and Post-Dredge at the Offshore Disposal Area, Poole, Dorset QUALITY
Eelgrass Survey Reporting Form 2222 Channel Road Newport Beach, CA Eelgrass (Zostera marina) Survey
 Survey") Eelgrass Survey Reporting Form 2222 Channel Road Newport Beach, CA 92660 Eelgrass (Zostera marina) Survey Survey Date: July 19th, 2013 Report Date: July 26 th, 2013 Prepared by: Coastal Resources Management,
Eelgrass Survey Reporting Form 2222 Channel Road Newport Beach, CA 92660 Eelgrass (Zostera marina) Survey Survey Date: July 19th, 2013 Report Date: July 26 th, 2013 Prepared by: Coastal Resources Management,
Cambridge International Examinations Cambridge International Advanced Subsidiary and Advanced Level
 Cambridge International Examinations Cambridge International Advanced Subsidiary and Advanced Level *8637380180* BIOLOGY 9700/53 Paper 5 Planning, Analysis and Evaluation May/June 2018 1 hour 15 minutes
STUDY PERFORMANCE REPORT
 STUDY PERFORMANCE REPORT State: Michigan Project No.: F-80-R-4 Study No.: 702 Title: Effects of sediment traps on Michigan river channels Period Covered: October 1, 2002 to September 30, 2003 Study Objectives:
Marine Renewables Industry Association. Marine Renewables Industry: Requirements for Oceanographic Measurements, Data Processing and Modelling
 Marine Renewables Industry Association Marine Renewables Industry: Requirements for Oceanographic Measurements, Data Processing and Modelling October 2009 Table of Contents 1. Introduction... 1 2. Measurements
CMM Conservation and Management Measure for the Management of Bottom Fishing in the SPRFMO Convention Area
 CMM 03-2018 1 Conservation and Management Measure for the Management of Bottom Fishing in the SPRFMO Convention Area The Commission of the South Pacific Regional Fisheries Management Organisation; RECOGNISING
FOR INFORMATION ONLY. Gold Coast Seaway Channel Scour and Rock Wall Stability Investigation. R.B doc December 2011
 A part of BMT in Energy and Environment Gold Coast Seaway Channel Scour and Rock Wall Stability Investigation R.B18625.001.00.doc December 2011 Gold Coast Seaway Channel Scour and Rock Wall Stability Investigation
Pre Feasibility Study Report Citiwater Cleveland Bay Purification Plant
 SOLAR POWER SPECIALISTS.Pure Power ACN 074 127 718 ABN 85 074 127 718 POWER MAGIC PTY LTD 245 INGHAM RD GARBUTT QLD 4814 Phone: 1800 068 977 Fax: 07 4725 2479 Email: FNQSOLAR@bigpond.com Pre Feasibility
Spatial Methods for Road Course Measurement
 Page 1 of 10 CurtinSearch Curtin Site Index Contact Details Links LASCAN Spatial Sciences WA Centre for Geodesy COURSE MEASUREMENT This page is a summary of results of some of the research we have recently
Marine Conservation and Research Expedition Training, Examination and Certification Summary
 Marine Conservation and Research Expedition Training, Examination and Certification Summary Introduction This document summarizes the current training schedule and materials being used at the two Marine
Falmouth and St.Austell pspa bird bycatch analysis report year
 Natural England Commissioned Report NECR231 Falmouth and St.Austell pspa bird bycatch analysis report year 1-2014 First published 20 April 2017 www.gov.uk/natural-england Foreword Natural England commission
New information regarding the impact of fisheries on other components of the ecosystem
 ICES Advice North Atlantic Ecoregion Published 20 June 2017 DOI: 10.17895/ices.pub.3059 New information regarding the impact of fisheries on other components of the ecosystem Advice summary ICES has received
Comparison of recruitment tile materials for monitoring coralline algae responses to a changing climate
 The following supplement accompanies the article Comparison of recruitment tile materials for monitoring coralline algae responses to a changing climate Emma V. Kennedy*, Alexandra Ordoñez, Bonnie E. Lewis,
ENSO Wrap-Up. Current state of the Pacific and Indian Ocean
 18-11-2014 ENSO Wrap-Up Current state of the Pacific and Indian Ocean Tropical Pacific Ocean moves closer to El Niño The Pacific Ocean has shown some renewed signs of El Niño development in recent weeks.
Reef Check Australia Moreton Bay Oil Spill Monitoring Report Prepared for: SEQ Catchments Ltd
 2009 Reef Check Australia Moreton Bay Oil Spill Monitoring Report Prepared for: SEQ Catchments Ltd Ian Banks Reef Check Foundation Ltd Geoffrey M. Cook, statistical analysis Jody Kreuger, editor 2 Jennifer
Infrared Thermography Inspection Guidelines. Date Issued:
 Infrared Thermography Inspection Guidelines Date Issued: 2002 01 29 Created By: Approved By: L. Henderson G. Durnford Table Of Contents Table Of Contents...i POLICY STATEMENT...1 APPLICABLE INTERNATIONAL
OBSERVING CORALS and ALGAE:
 5 OBSERVING CORALS and ALGAE: MANTA TOW, SNORKEL SURVEY, and POINT-INTERCEPT TRANSECT A. Manta Tow Definition A manta tow survey is the observation of an underwater area of good visibility by a snorkeler
Keywords: marine habitat recovery, derelict fishing gear
 Marine habitat recovery after derelict fishing net removal. Jeff June*, Kyle Antonelis, Natural Resources Consultants, Inc. Seattle, WA. *Corresponding author: jjune@nrccorp.com Keywords: marine habitat
A Combined Recruitment Index for Demersal Juvenile Cod in NAFO Divisions 3K and 3L
 NAFO Sci. Coun. Studies, 29: 23 29 A Combined Recruitment Index for Demersal Juvenile Cod in NAFO Divisions 3K and 3L David C. Schneider Ocean Sciences Centre, Memorial University St. John's, Newfoundland,
INTRACOASTAL WATERWAY DEEPENING BROWARD COUNTY, FLORIDA HARD CORAL RELOCATION SUMMARY REPORT
 INTRACOASTAL WATERWAY DEEPENING BROWARD COUNTY, FLORIDA 17th Street Bridge to 4,000 Feet North of the Las Olas Blvd. Bridge HARD CORAL RELOCATION SUMMARY REPORT Prepared for: Prepared by: 204 N. Dixie
Tourism Management in Surin Marine National Park, Thailand
 Tourism Management in Surin Marine National Park, Thailand Suchai Worachananant 1, 2, R.W.(Bill) Carter 1, Marc Hockings 1, Pasinee Reopanichkul 2, Thon Thamrongnawasawat 2 ABSTRACT This paper analyses
EXPEDITION ADVENTURE PART 2: HIGHER RESOLUTION RANGE SEISMIC IMAGING TO LOCATE A SUNKEN PIRATE SHIP OFF ILE ST MARIE.
 EXPEDITION ADVENTURE PART 2: HIGHER RESOLUTION RANGE SEISMIC IMAGING TO LOCATE A SUNKEN PIRATE SHIP OFF ILE ST MARIE. Jakob B.U. Haldorsen, and Douglas E. Miller, Schlumberger-Doll Research, Ridgefield,
Eelgrass and Macroalgae Presence/Absence Preliminary Surveys BHP Proposed Grays Harbor Potash Export Facility A Task 400
 Memorandum 40600-HS-MEM-55036 Revision 0 Date: 26 July 2018 Subject: Eelgrass and Macroalgae Presence/Absence Preliminary Surveys BHP Proposed Grays Harbor Potash Export Facility A17.0202.00 Task 400 INTRODUCTION
COMPARISON OF CONTEMPORANEOUS WAVE MEASUREMENTS WITH A SAAB WAVERADAR REX AND A DATAWELL DIRECTIONAL WAVERIDER BUOY
 31 Bishop Street, Jolimont Western Australia 6014 T +61 8 9387 7955 F +61 8 9387 6686 E info@rpsmetocean.com W rpsmetocean.com & rpsgroup.com.au COMPARISON OF CONTEMPORANEOUS WAVE MEASUREMENTS WITH A SAAB
Puyallup Tribe of Indians Shellfish Department
 Puyallup Tribe of Indians Shellfish Department Dungeness crab trap catch efficiency related to escape ring location and size George Stearns* 1, Robert Conrad 2, David Winfrey 1, Nancy Shippentower-Games
Available from Deakin Research Online:
 This is the published version: Hirst, Alistair, Heislers, Simon, Ball, David, Blake, Sean and Coots, Allister 2011, Baywide seagrass monitoring program : milestone report no. 11 (Oct. Nov. 2010) Department
John Brewer Reef Sunferries-Townsville
 John Brewer Reef Sunferries-Townsville Latitude: 18 57.364S Longitude: 146 57.375E Date: 31-1-4, 1-2-4 and 24.3.4 Florent Cade 24 SITE DESCRIPTION John Brewer Reef is a mid shelf reef situated approximately
Data Collection and Processing: Elwha Estuary Survey, February 2013
 Data Collection and Processing: Elwha Estuary Survey, February 2013 Ian Miller, WA Sea Grant Olympic Peninsula Field Office, 1502 E. Lauridsen Blvd #82, Port Angeles, WA 98362 immiller@u.washington.edu
Data Set 7: Bioerosion by Parrotfish Background volume of bites The question:
 Data Set 7: Bioerosion by Parrotfish Background Bioerosion of coral reefs results from animals taking bites out of the calcium-carbonate skeleton of the reef. Parrotfishes are major bioerosion agents,
Ecological Processes and Coral Reef Recovery in the Florida Keys
 Final 2 October 26 Ecological Processes and Coral Reef Recovery in the Florida Keys Struan R. Smith (Bermuda Biological Station for Research, Inc., St. George s GE, Bermuda) Richard B. Aronson and Thaddeus
Time Will Tell: Long-term Observations of the Response of Rocky-Habitat Fishes to Marine Reserves in Puget Sound
 Time Will Tell: Long-term Observations of the Response of Rocky-Habitat Fishes to Marine Reserves in Puget Sound Wayne A. Palsson, Robert E. Pacunski, and Tony R. Parra Washington Department of Fish and
Data Report : Russian River Basin Steelhead and Coho Salmon Monitoring Program Pilot Study
 Data Report 1999-1: Russian River Basin Steelhead and Coho Salmon Monitoring Program Pilot Study Sonoma County Water Agency 215 West College Avenue Santa Rosa, California 951 Prepared by David Cook Senior
MICROPHONE WIND SPEED LIMITS DURING WIND FARM NOISE MEASUREMENTS
 MICROPHONE WIND SPEED LIMITS DURING WIND FARM NOISE MEASUREMENTS Abstract Jon Cooper 1 and Tom Evans 2 1 Resonate Acoustics, Level 1/23 Peel St, Adelaide SA 5000, Australia Email: jon.cooper@resonateacoustics.com
FISHING ACTIVITY: SEABED TRAWLING
 FISHING ACTIVITY: SEABED TRAWLING Environmental Snapshot March 2010 Key points In 2008, 68 large (>28 m) fishing vessels conducted 38,648 seabed trawls covering 85,222 km 2. Since 2005, the number of trawls
4 Reef Watch Guidelines
 11 4 Reef Watch Guidelines Reef watch is a simple one-dive-one-survey method to record the health of a coral reef. You can easily learn the method and take part in the programme. On your dive or snorkel
Overview of Florida s Cooperative East Coast Red Snapper Tagging Program, SEDAR41-DW10. Submitted: 1 August 2014
 Overview of Florida s Cooperative East Coast Red Snapper Tagging Program, 2011-2013 Russell B. Brodie, Justin J. Solomon, Richard Paperno, Theodore S. Switzer, Cameron B. Guenther, and Beverly Sauls SEDAR41-DW10
Legendre et al Appendices and Supplements, p. 1
 Legendre et al. 2010 Appendices and Supplements, p. 1 Appendices and Supplement to: Legendre, P., M. De Cáceres, and D. Borcard. 2010. Community surveys through space and time: testing the space-time interaction
2016 ANNUAL FISH TRAWL SURVEY REPORT
 216 ANNUAL FISH TRAWL SURVEY REPORT The University of Rhode Island Graduate School of Oceanography The Graduate School of Oceanography (GSO) Fish trawl survey began weekly sampling two stations in Narragansett
Appendix 9-A. Environmental Management Plan Outline - Non-Avian Migratory Species
 Appendix 9-A Environmental Management Plan Outline - Non-Avian Migratory Species Environmental Management Plan Outline ESTUARINE CROCODILE (Crocodylus porosus) Environmental Management Plan Outline Preferred
Determining coral reef impacts associated with boat anchoring and user activity
 Determining coral reef impacts associated with boat anchoring and user activity Protect Our Reefs Grant Interim Report October 1, 2008 March 31, 2009 Donald C. Behringer 1, Thomas K. Frazer 1, Robert A.
Field Protocol for Monitoring Coral Reef Fisheries Resources in Belize
 Field Protocol for Monitoring Coral Reef Fisheries Resources in Belize Charles A. Acosta, PhD Wildlife Conservation Society Glover s Reef Marine Research Station P.O. Box 272 Dangriga, Belize and Department
Biogeographic Assessment of Florida Keys National Marine Sanctuary
 Biogeographic Assessment of Florida Keys National Marine Sanctuary NOAA National Centers for Coastal Ocean Science NOAA Florida Keys National Marine Sanctuary Florida Fish and Wildlife Commission Photos
Determining Coral Reef Impacts Associated with Boat Anchoring and User Activity in Southeast Florida
 Determining Coral Reef Impacts Associated with Boat Anchoring and User Activity in Southeast Florida Southeast Florida Coral Reef Initiative Fishing, Diving, and Other Uses Local Action Strategy Project
BASELINE SURVEY, VISUAL - SITE SPECIFIC
 BASELINE SURVEY, VISUAL - SITE SPECIFIC Introduction As stated in SEPA s policy and in the Fish Farm Manual (1998), scientific data are required by SEPA in order to assess the existing condition on the
QGC Pty Ltd. Terrestrial Ecology, LNG Facility Site Clearance Contract CNT. Date of Issue: Reference No.: 8 th September 2010 B1302QGC Rep1 Rev0
 QGC Pty Ltd Terrestrial Ecology, LNG Facility Site Clearance Contract 109662CNT Date of Issue: Reference No.: 8 th September 2010 B1302QGC Rep1 Rev0 www.egc.com.au Certified with NCSI International ABN
The progression and impacts of bleaching were highly variable between species and locations:
 Executive Summary Coral Reef CPR, in partnership with Anantara Resorts and Aquafanatics and Elements Dive Centres implemented Phase III of the Holistic Approach to Reef Protection (HARP) Program between
EL NIÑO AND ITS IMPACT ON CORAL REEF ECOSYSTEM IN THE EASTERN INDIAN OCEAN
 CHAPTER C H A P T E R 0334 EL NIÑO AND ITS IMPACT ON CORAL REEF ECOSYSTEM IN THE EASTERN INDIAN OCEAN Lix J. K. 1, Sajeev R. 1, Grinson George 2, Santosh K. M. 1 and Phiros Shah 2 1 Cochin University of
Wade Reynolds 1 Frank Young 1,2 Peter Gibbings 1,2. University of Southern Queensland Toowoomba 4350 AUSTRALIA
 A Comparison of Methods for Mapping Golf Greens Wade Reynolds 1 Frank Young 1,2 Peter Gibbings 1,2 1 Faculty of Engineering and Surveying 2 Australian Centre for Sustainable Catchments University of Southern
Centre for Marine Science and Technology
 Centre for Marine Science and Technology Prediction of underwater noise associated with the operation of a drilling rig in the Great Australian Bight Prepared for: BP Developments Australia Pty Ltd Prepared
FINAL REPORT TO QUEENSLAND FISHERIES MANAGEMENT AUTHORITY
 SURVEY OF HOLOTHURIA SCABRA (SANDFISH) ON WARRIOR REEF, TORRES STRAIT FINAL REPORT TO QUEENSLAND FISHERIES MANAGEMENT AUTHORITY Timothy Skewes Charis Burridge Burke Hill PO Box 120 Cleveland, Q 4163 Ph
Robin J. Beaman. School of Earth and Environmental Sciences, James Cook University, Cairns, Qld 4870, Australia.
 Robin J. Beaman School of Earth and Environmental Sciences, James Cook University, Cairns, Qld 4870, Australia. Email: robin.beaman@jcu.edu.au Seminar to SSSI Qld Hydrography Coping with Nature, Brisbane,
A PHYSICAL AND BIOLOGICAL SURVEY OF THE MID-REACH MITIGATION REEF SET NUMBER 1
 A PHYSICAL AND BIOLOGICAL SURVEY OF THE MID-REACH MITIGATION REEF SET NUMBER 1 John M. Hearin, Ph.D., P.E. 1 ; Geoff Swain, Ph.D. 2 ; Robert Weaver, Ph.D., P.E. 2 ; Kelli Z. Hunsucker, Ph.D. 2 ; Caglar